3.2. Atomic Force Microscope (AFM) Measurements
The film thicknesses were measured using an AFM; the results are listed in
Table 1. The film thicknesses of the P(VDF-TrFE) were 420, 470, 300, 357, 355, and 317 nm for the samples with Au only, PEDOT-PEG lauryl, SAM4, SAM10, SAM12, and SAM18, respectively.
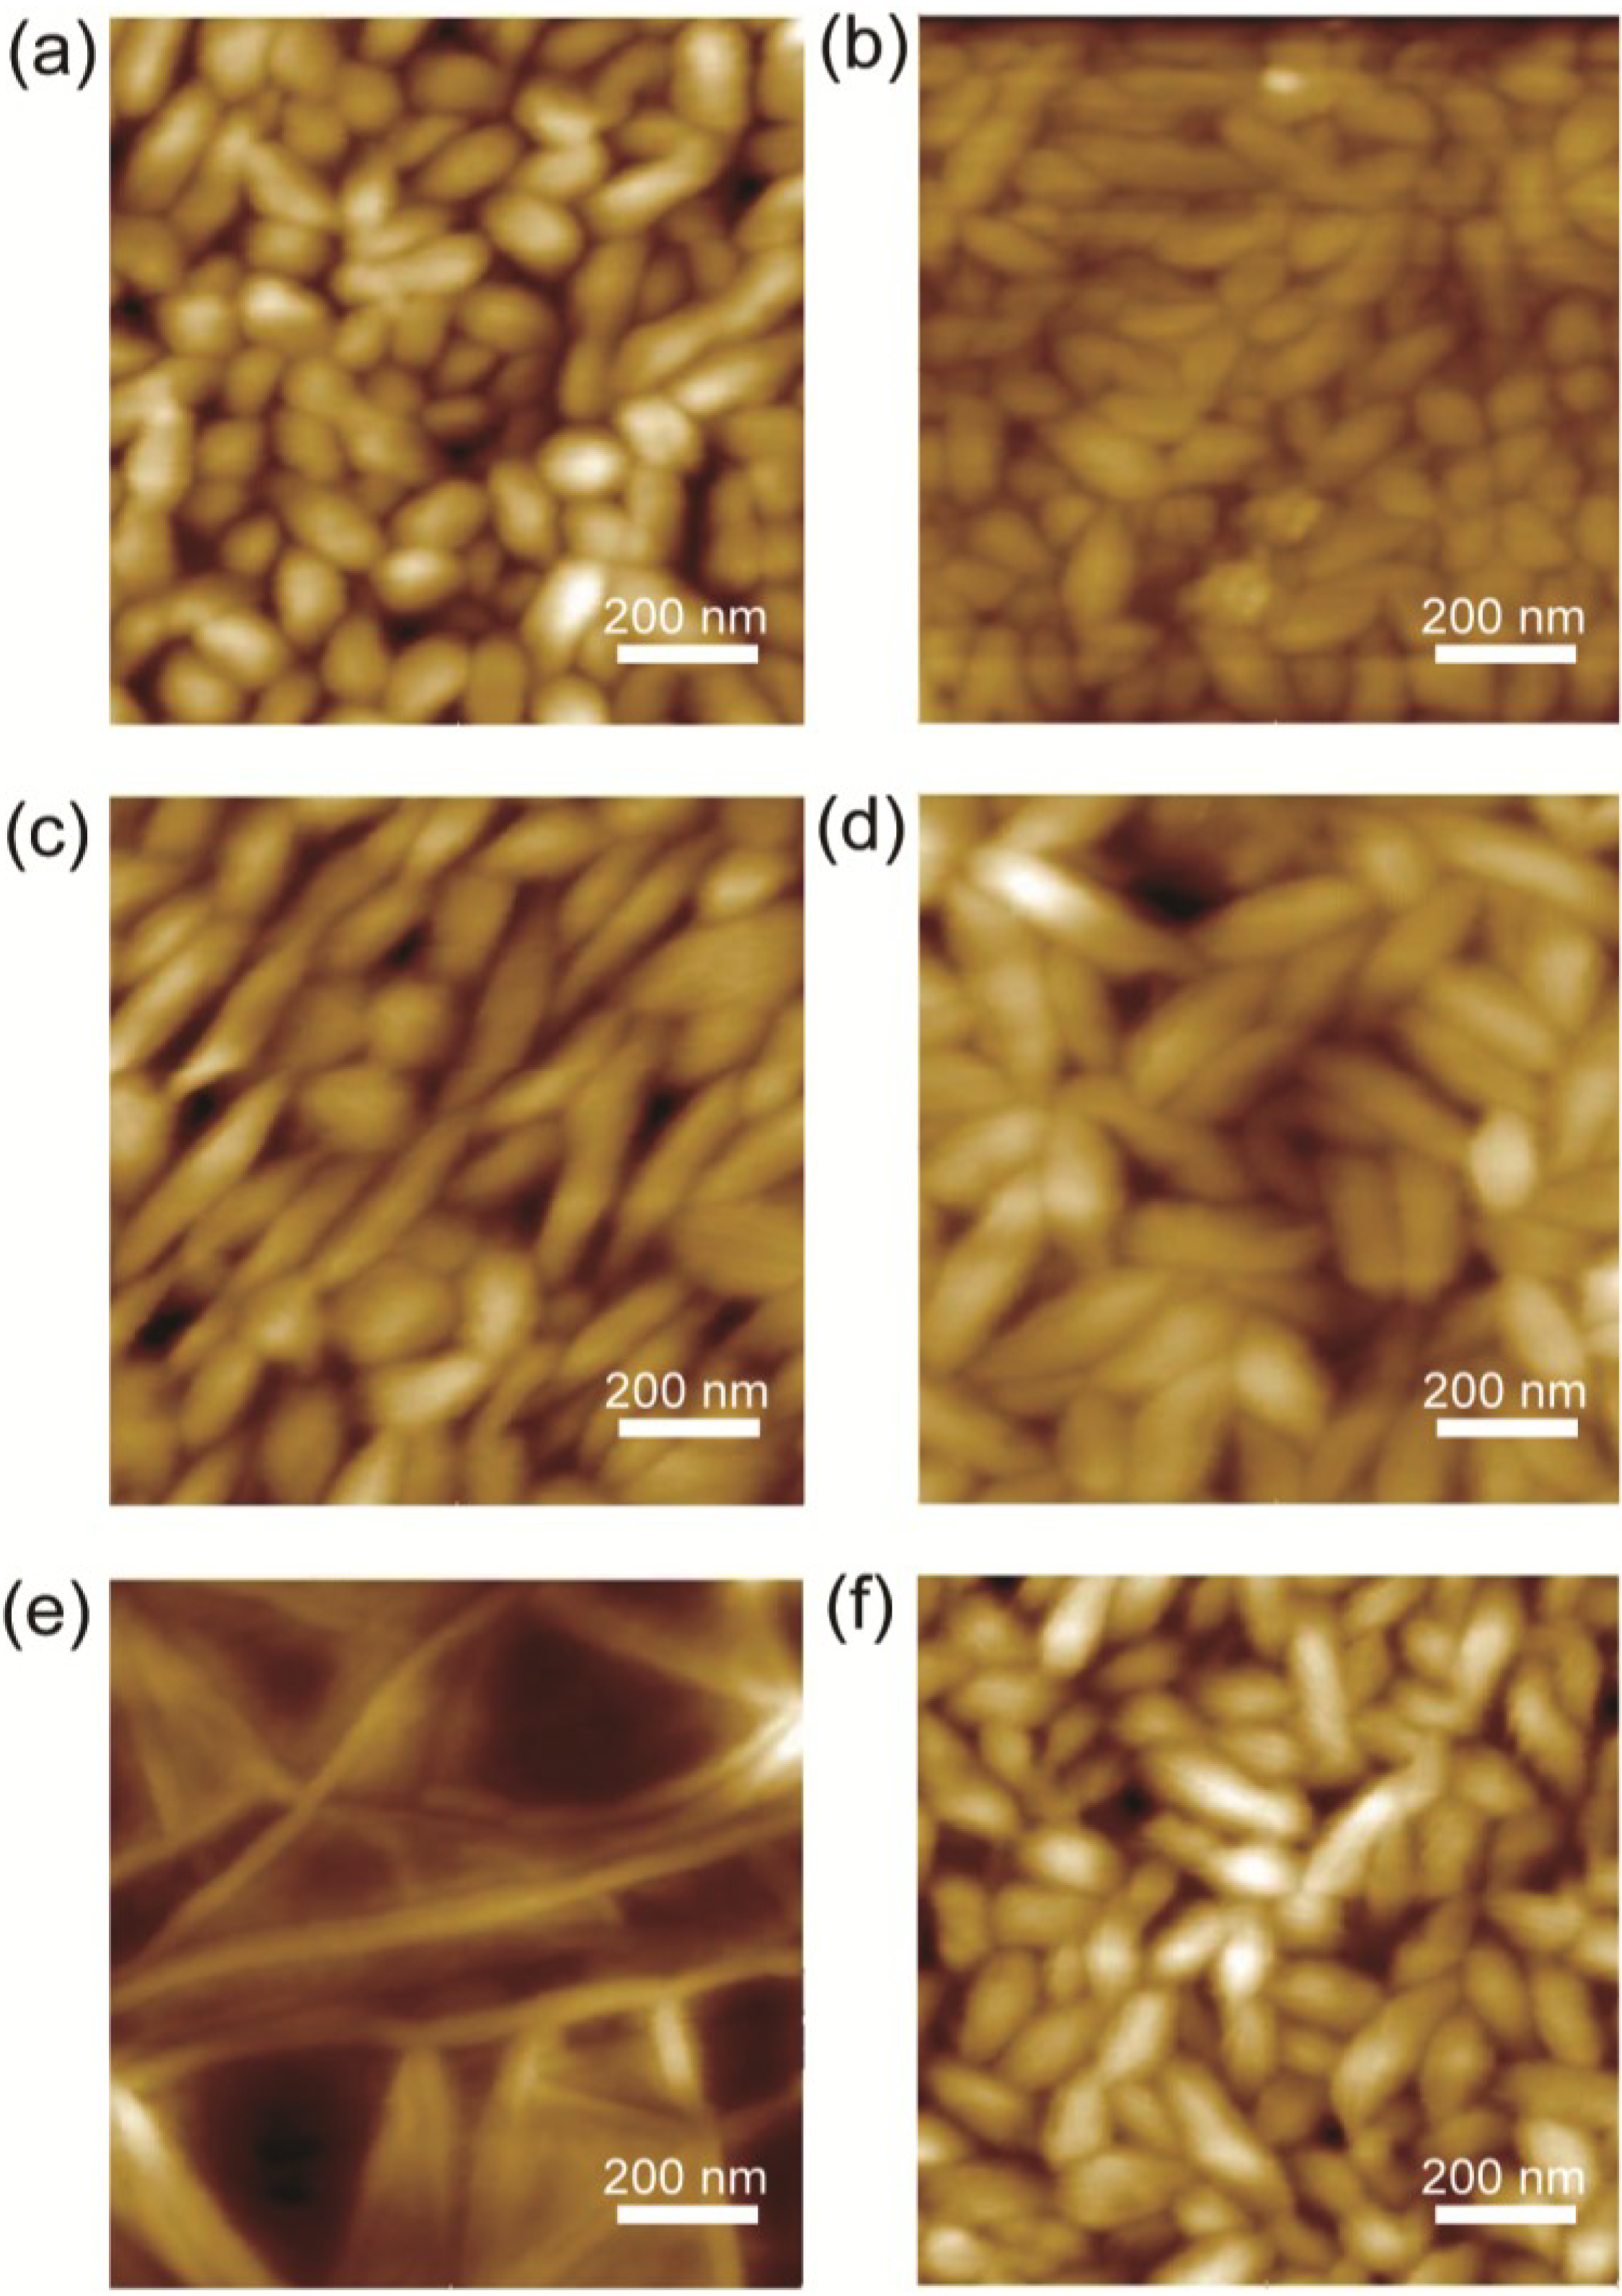
Figure 1 shows the AFM topography for the respective samples. The samples, with the exception of SAM12, exhibit grain-like crystallites that are uniformly developed; the SAM12 sample exhibits needle-like crystallites. The authors of previous studies [
5,
6] have also reported grain-like crystallites in ferroelectric P(VDF-TrFE) thin films.
Figure 1.
AFM images (1 μm × 1 μm) of the surface morphology of P(VDF-TrFE) on (a) a bare Au electrode and on Au electrodes coated with (b) PEDOT-PEG lauryl; (c) SAM4; (d) SAM10; (e) SAM12 and (f) SAM18.
Figure 1.
AFM images (1 μm × 1 μm) of the surface morphology of P(VDF-TrFE) on (a) a bare Au electrode and on Au electrodes coated with (b) PEDOT-PEG lauryl; (c) SAM4; (d) SAM10; (e) SAM12 and (f) SAM18.
The surface roughnesses were evaluated because the roughness sometimes directly affects the uniformity of the applied electric field inside the sample. A flat, uniform surface is ideal. The
RRMS values of the samples are summarized in
Table 1. In the case of the SAM4 sample, a low
RRMS that was almost the same as that of the unmodified Au electrode was measured. An increase in the number of methylene groups in the SAM led to a rougher surface; the electrode coated with PEDOT-PEG exhibited the roughest surface.
Table 1.
Contact angles, thicknesses and roughnesses (RRMS) for each sample.
Table 1.
Contact angles, thicknesses and roughnesses (RRMS) for each sample.
| Sample | Contact angle (°) | Thickness (nm) | RRMS (nm) |
|---|
| Au | 76.8 | 420 | 1.45 |
| PEDOT-PEG lauryl | - | 370 | 13.0 |
| SAM4 | 96.5 | 300 | 1.47 |
| SAM10 | 113.2 | 357 | 2.98 |
| SAM12 | 111.6 | 355 | 2.63 |
| SAM18 | 106 | 317 | 6.31 |
3.3. Ferroelectric Switching
Similar to the method discussed in our previous report [
5], we evaluated the switching characteristics of the organic ferroelectrics by switching the current applied to the tiny Au electrode using a sinusoidal voltage and an AFM probe. The frequency of the applied voltage ranged from 10 to 100 kHz.
where
P is the polarization, ε is the dielectric constant, ε
0 is the permeability in vacuum,
E is the electric field, and ρ is the resistivity. This equation is simplistic because the higher-order term for polarization and the nonlinear term for resistivity are not included. Therefore, this equation cannot be used to explain these phenomena, including the higher-order terms. However, in the present case, these higher-order terms are negligibly small, so an analysis using Equation (1) is adequate.
The switching current, J(t), is the summation of the polarization current term, the capacitance term, and the resistance term. After subtracting the capacitance and resistivity terms from the total current J(t), we evaluated the polarization. The hysteresis curve of the polarization was obtained via the integration of dP/dt with time. The switching characteristics were evaluated on the basis of the coercive field (Ec) and the remanent polarization (Pr).
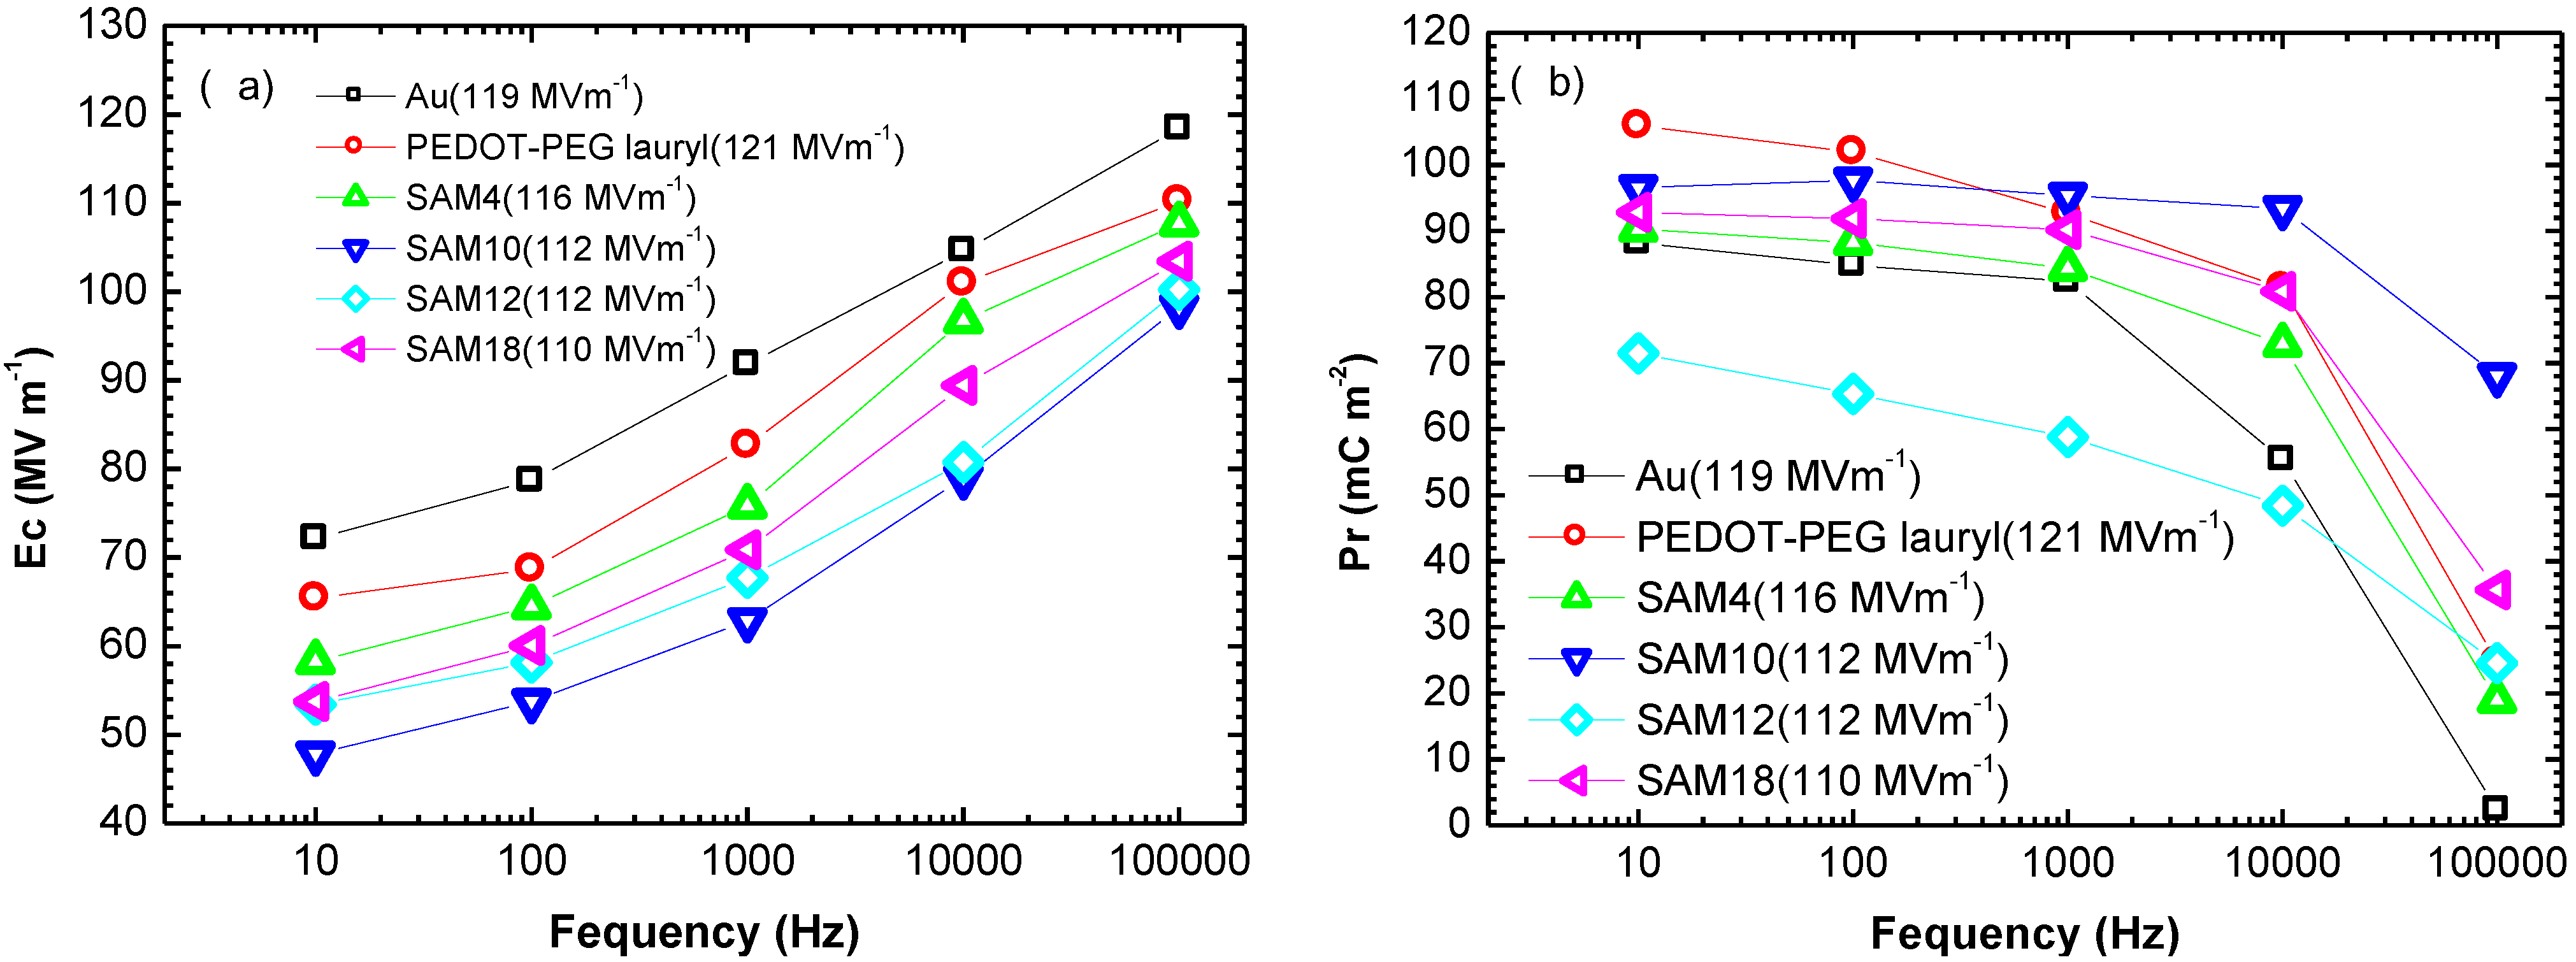
The Ec and Pr values for each sample are plotted as functions of the switching frequency in
Figure 2. All Ec and Pr values were measured in a saturated electric field of 110–120 MV·m
−1. The results in
Figure 2 show that the Ec and Pr values were significantly affected by the interlayer between the gold electrode and by the P(VDF-TrFE) thin film. The interlayer between the gold electrode and the P(VDF-TrFE) thin film changed the switching characteristics. Notably, the SAM10 sample exhibited a lower Ec of 48 MV·m
−1, whereas the Au sample exhibited a higher Ec of 72 MV·m
−1 during cycling at 10 Hz. During cycling at 100 kHz, the Ec values were not affected by the interlayer, but the Pr value was significantly affected by the interlayer of PEDOT-PEG lauryl and by the SAMs. This effect was especially pronounced in the case of the SAM10 sample, which exhibited a Pr value of 68 mC·m
−2 at 100 kHz, whereas the Au sample without a SAM or a PEDOT-PEG lauryl layer exhibited a very small Pr value of 2.4 mC·m
−2.
The SAM12 sample exhibited relatively low Pr values in the switching frequency range of 10 Hz–10 kHz. A comparison of the surface morphologies in
Figure 1 reveals that the SAM12 sample exhibits an obviously different morphology of needle-like crystallites, whereas the other samples exhibit grain-like crystallites. These morphological differences may be related to the lower Pr values of the SAM12 sample. Furthermore, the SAM10 samples exhibited larger grain-like crystallites, which may be related to the larger Pr values at higher switching frequencies. In a previous study by Park
et al., a SAM interlayer between the Au electrode and P(VDF-TrFE) led to a structural change related to the Pr performance [
7].
Figure 2.
Plots of (a) Ec and (b) Pr as functions of the frequency of the alternating electric field for each sample.
Figure 2.
Plots of (a) Ec and (b) Pr as functions of the frequency of the alternating electric field for each sample.
As discussed in our previous report [
5], the switching speed is an important characteristic for evaluating memory devices. We used the same procedure reported in our previous report [
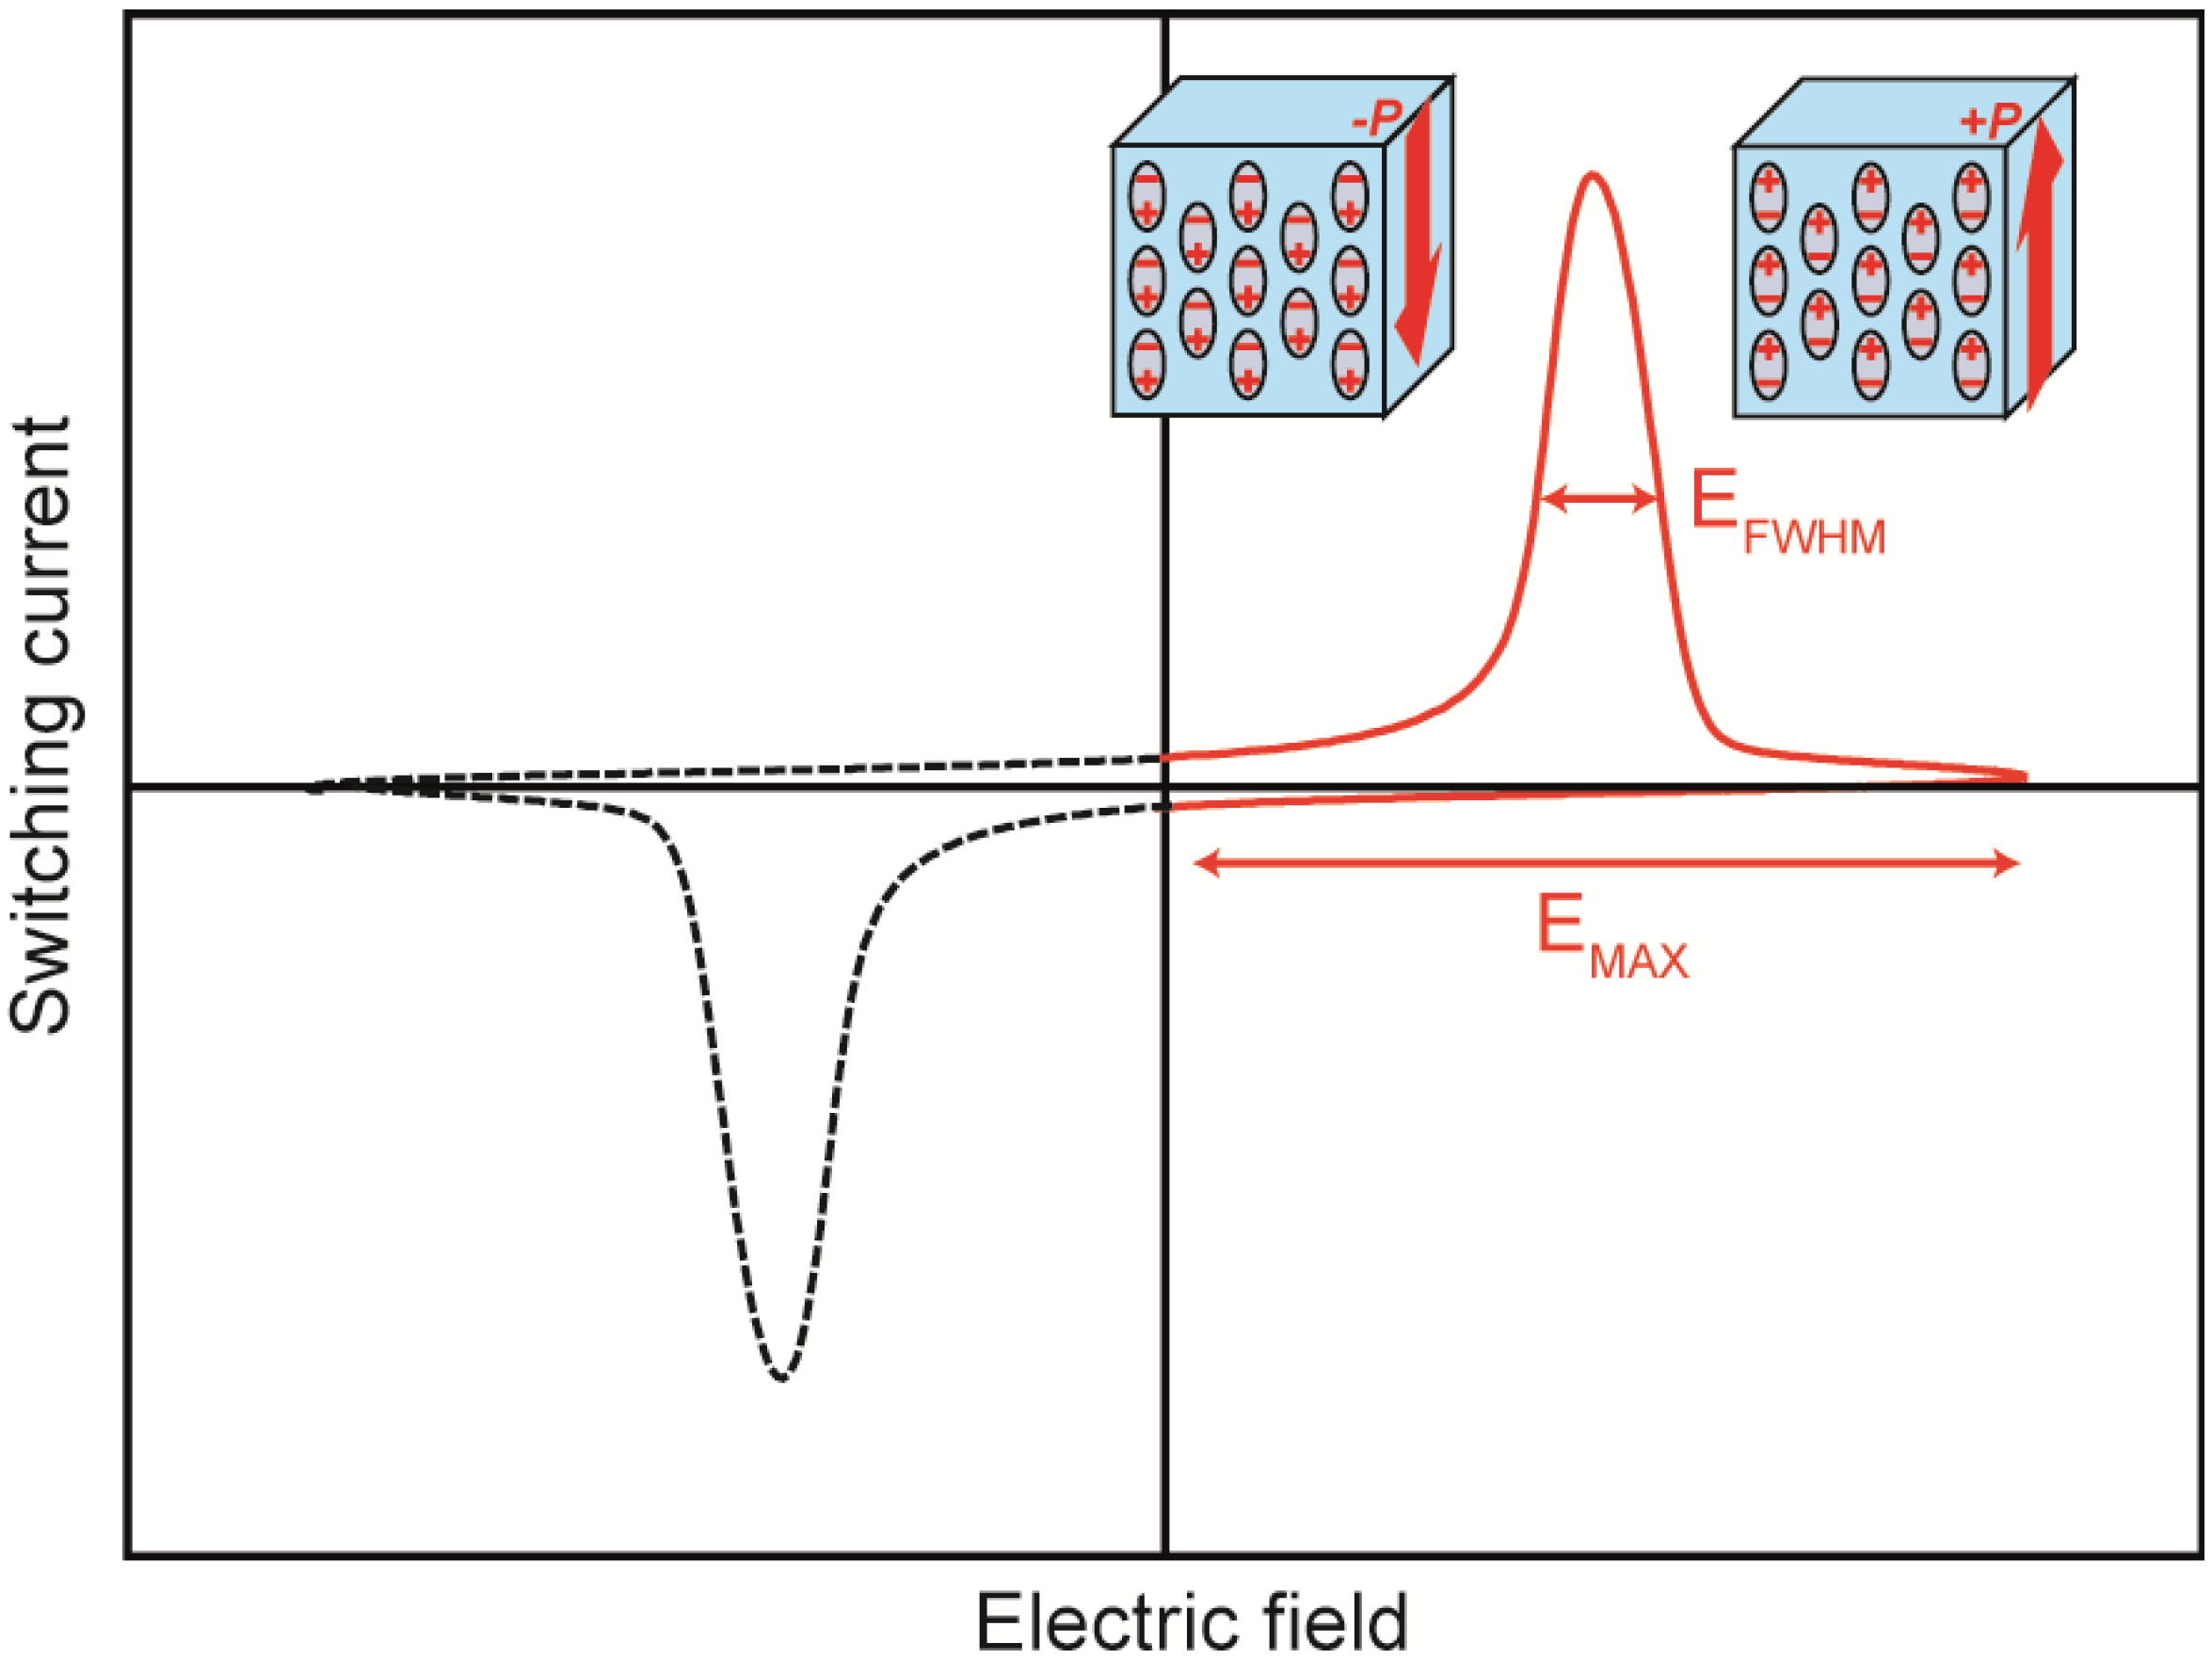
5] to evaluate the switching characteristics of the samples. We evaluated the switching speed using the full-width at half-maximum (FWHM) of the switching current in current (
J(
t))
vs. applied electric field (
E) plots. All switching speeds were measured in saturated electric fields of 110–120 MV·m
−1. The switching speed was evaluated from the inverse of the switching time. The switching time (
ts) was evaluated from Equation (2):
where
EFWHM is the full-width at half-maximum of the switching current,
EMAX is the maximum amplitude of the switching field, and
t is the time required for one switching cycle.
Figure 3 shows a schematic of the
J(
t)-
E plots used to evaluate the switching time.
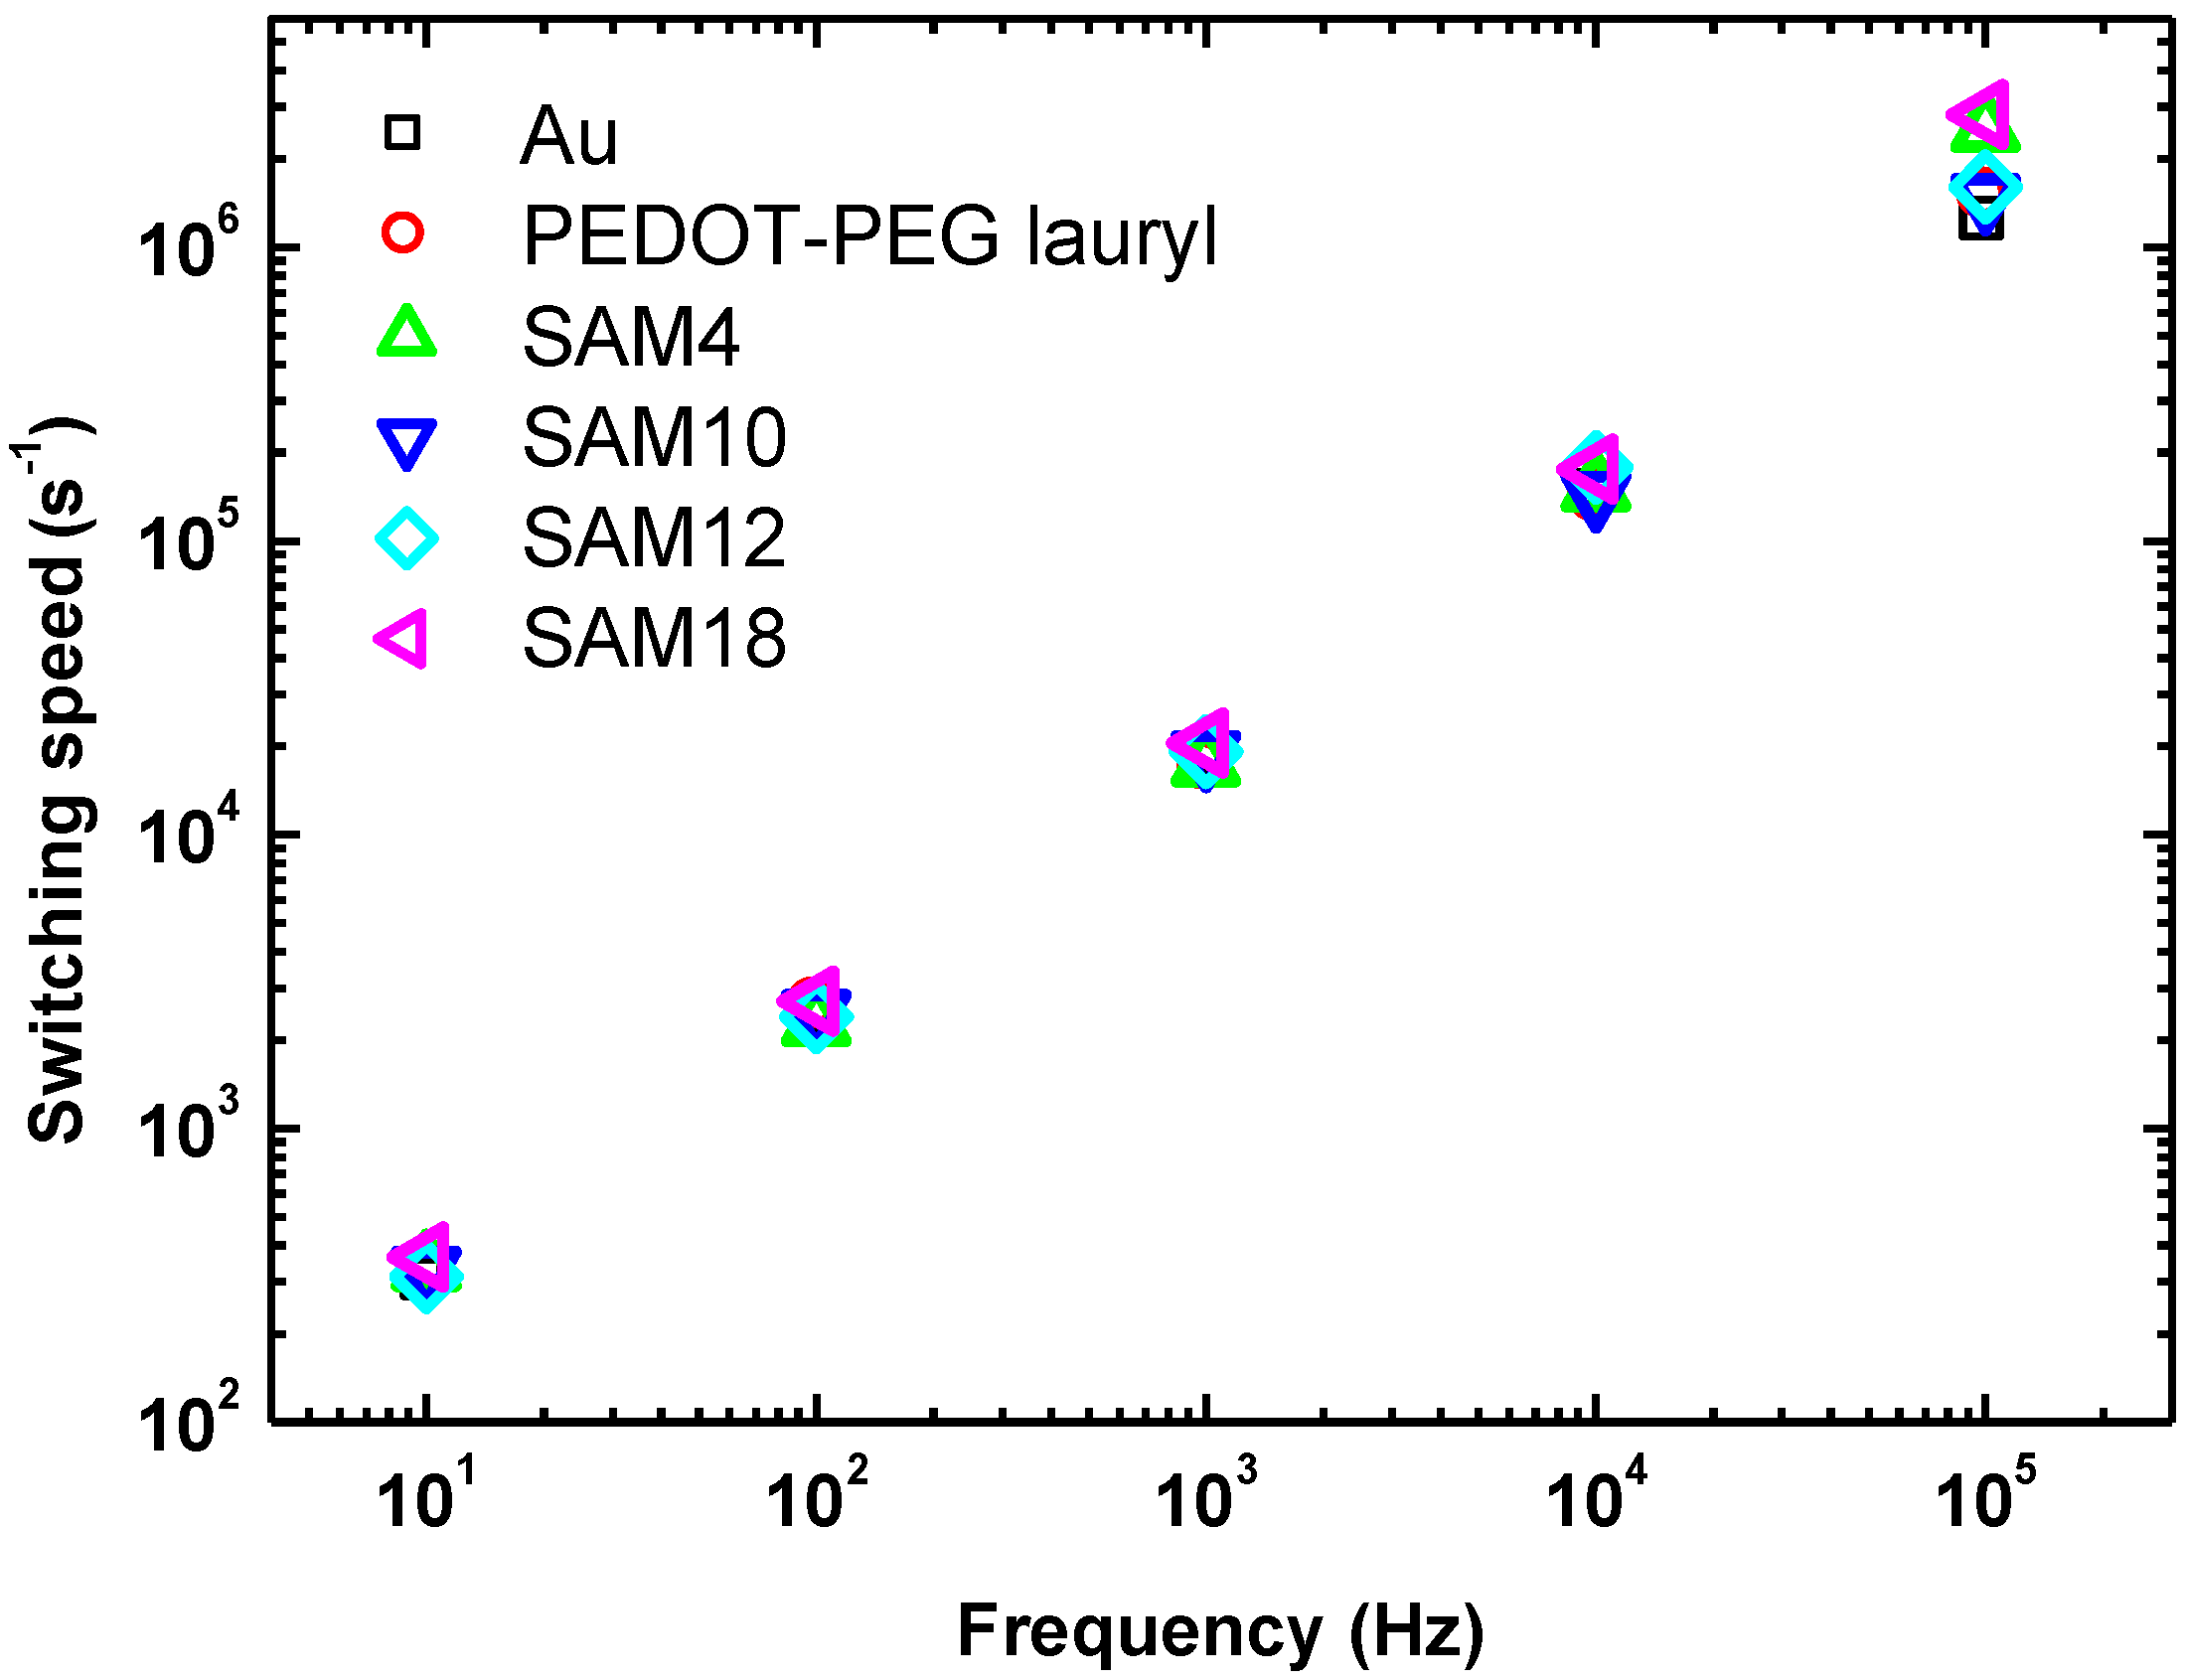
The switching speed is plotted as a function of the cycling frequency for each sample in
Figure 4. At lower frequencies, the difference among the Au, PEDOT-PEG, and SAM samples was small; however, at higher frequencies (greater than 10 kHz), significant differences were measured. At 100 kHz, switching speeds of 2.5 × 10
6 s
−1 for SAM4 and 2.8 × 10
6 s
−1 for SAM18 were measured; these switching speeds are twice as fast as those of the other samples, which had values of 1.2–1.5 × 10
6 s
−1. These switching speeds were measured under applied fields of 110 and 120 MV·m
−1, which were approximately 2.5 times weaker than the previously applied field of 278 MV·m
−1 [
5]. The coercive field usually determines the switching speed. A SAM interlayer leads to a decrease in the coercive field, irrespective of the unchanged switching speed, in the frequency range of 10–10
4 Hz. The results of leakage-current measurements are discussed in the next paragraph.
Figure 3.
Schematic of the J(t)-E plots used to evaluate the switching time.
Figure 3.
Schematic of the J(t)-E plots used to evaluate the switching time.
Figure 4.
Plot of switching speed as a function of frequency for each sample.
Figure 4.
Plot of switching speed as a function of frequency for each sample.
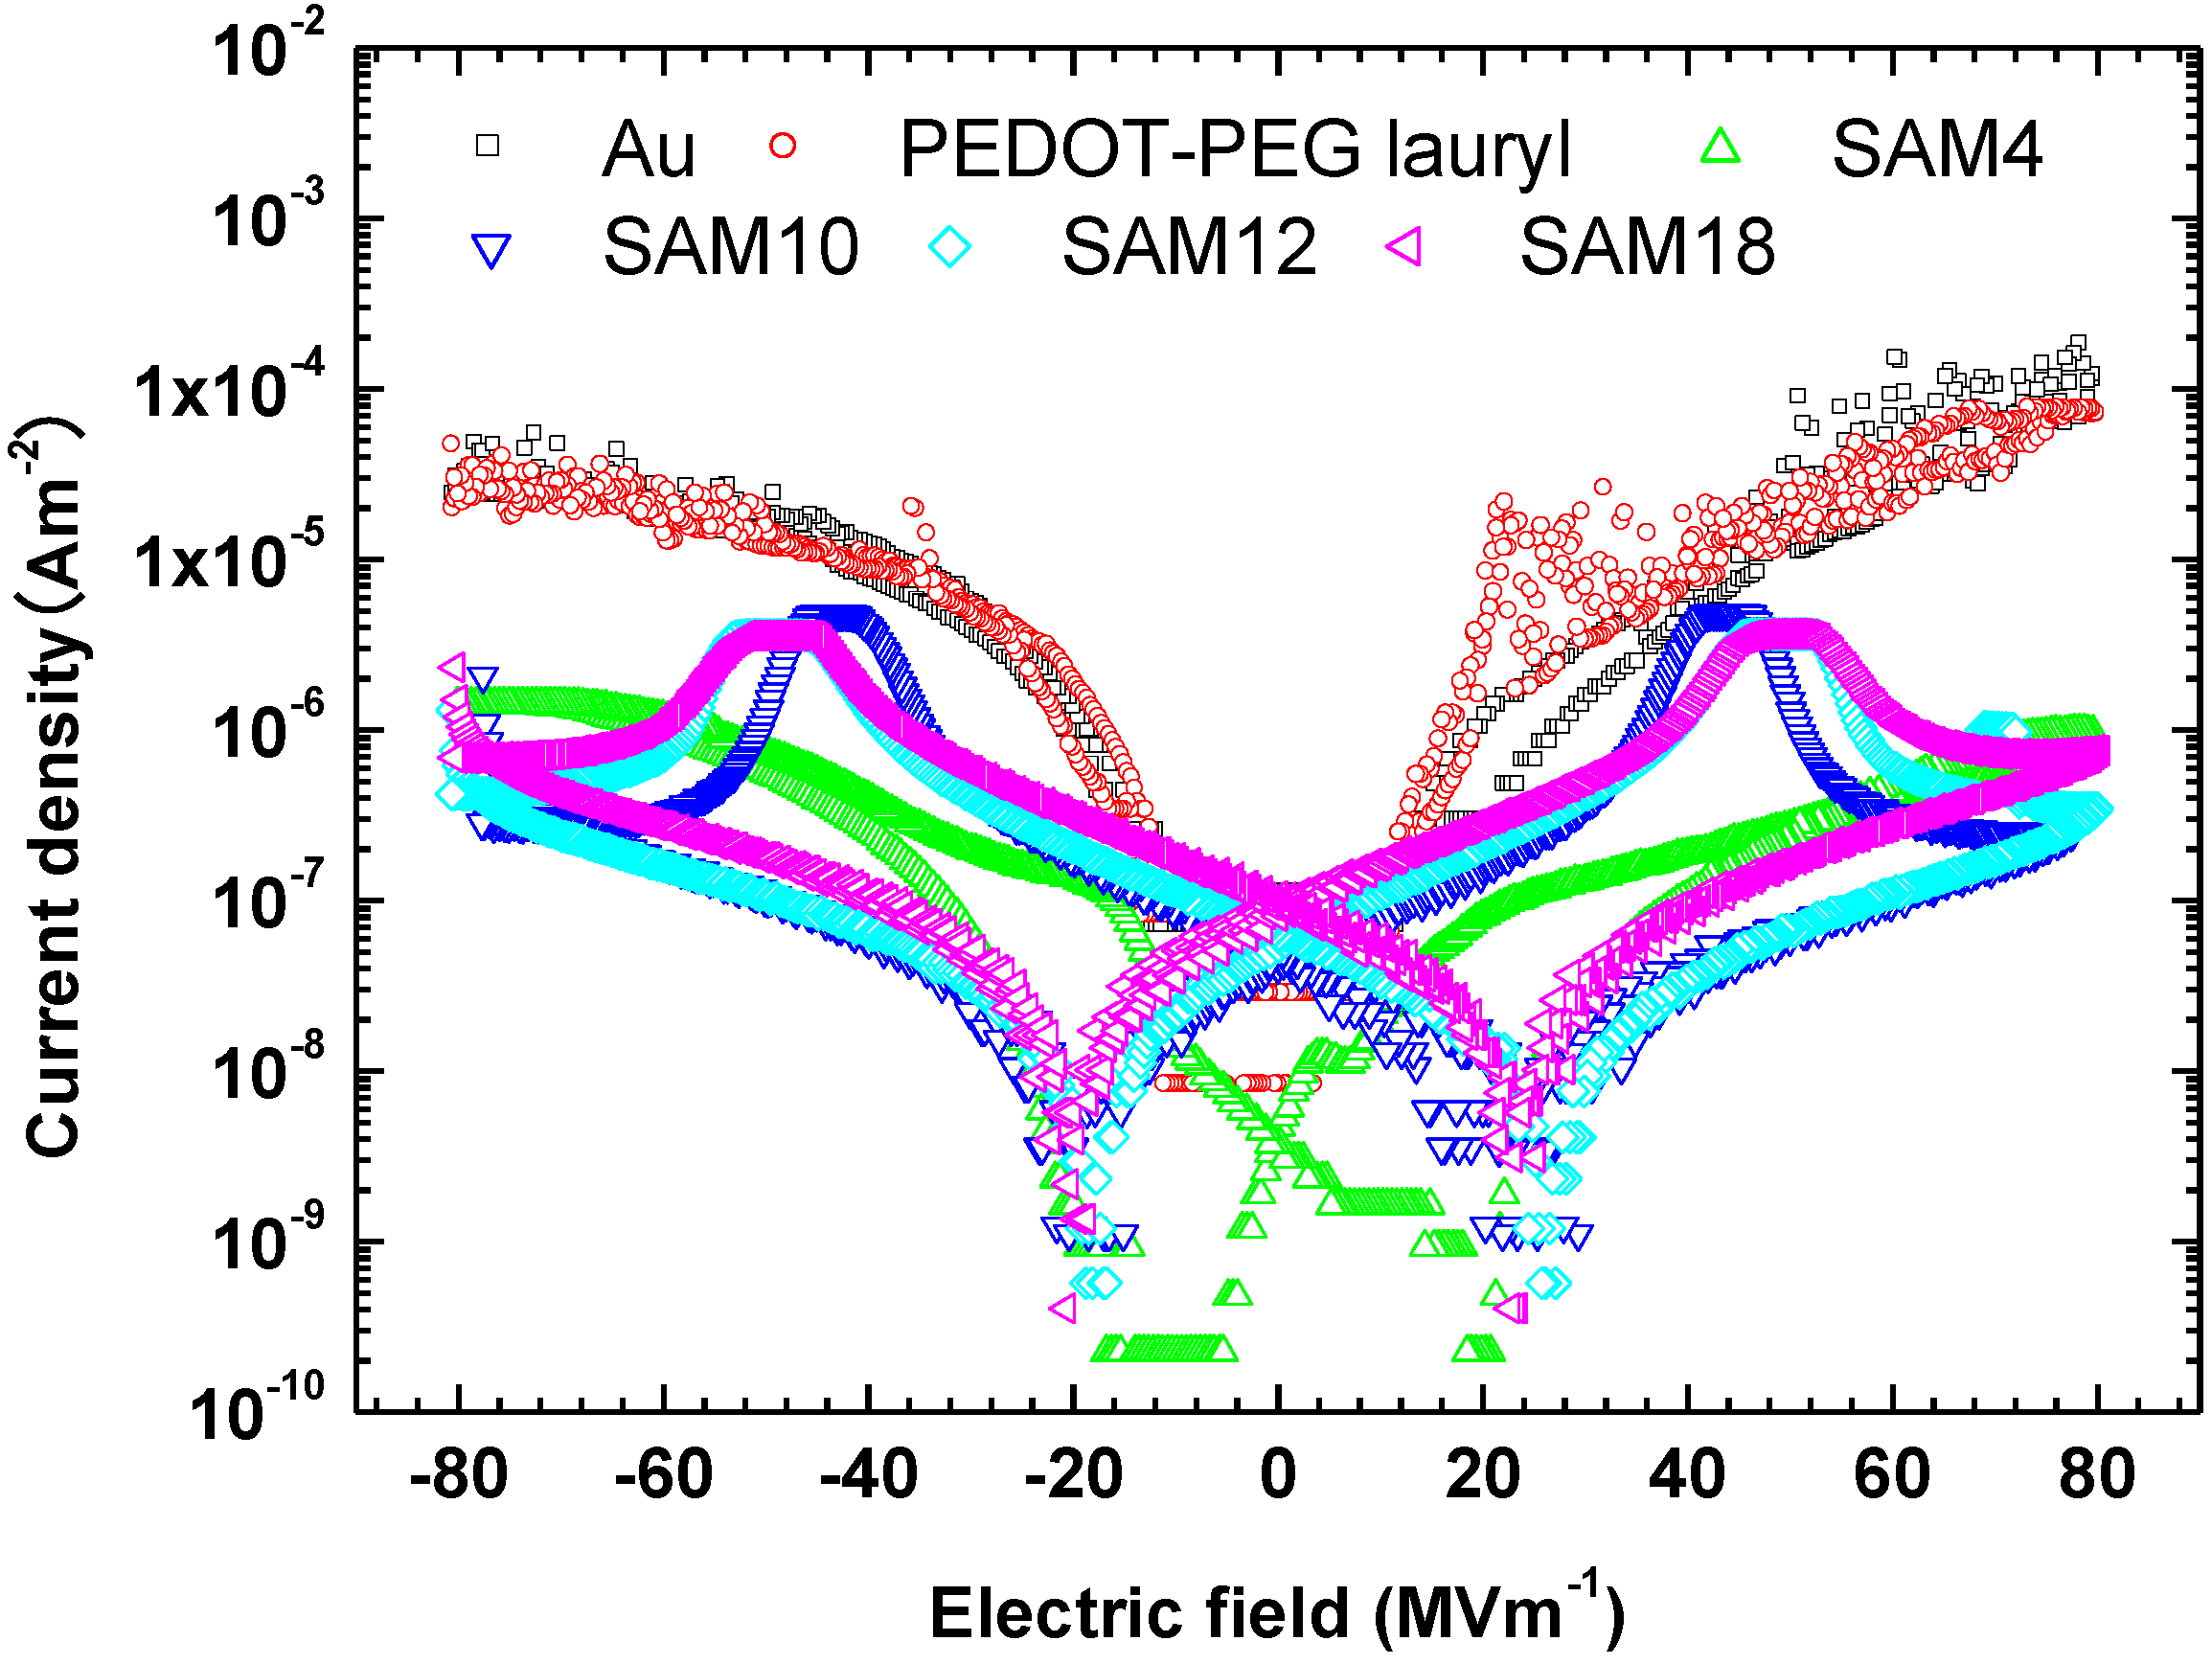
Interlayers between gold electrodes and P(VDF-TrFE), such as the organic conductor PEDOT-PEG lauryl and self-assembled monolayers, significantly change the ferroelectric switching characteristics of P(VDF-TrFE). The question arises as to why the interlayers change those of P(VDF-TrFE). The leakage currents measured for all samples are shown in
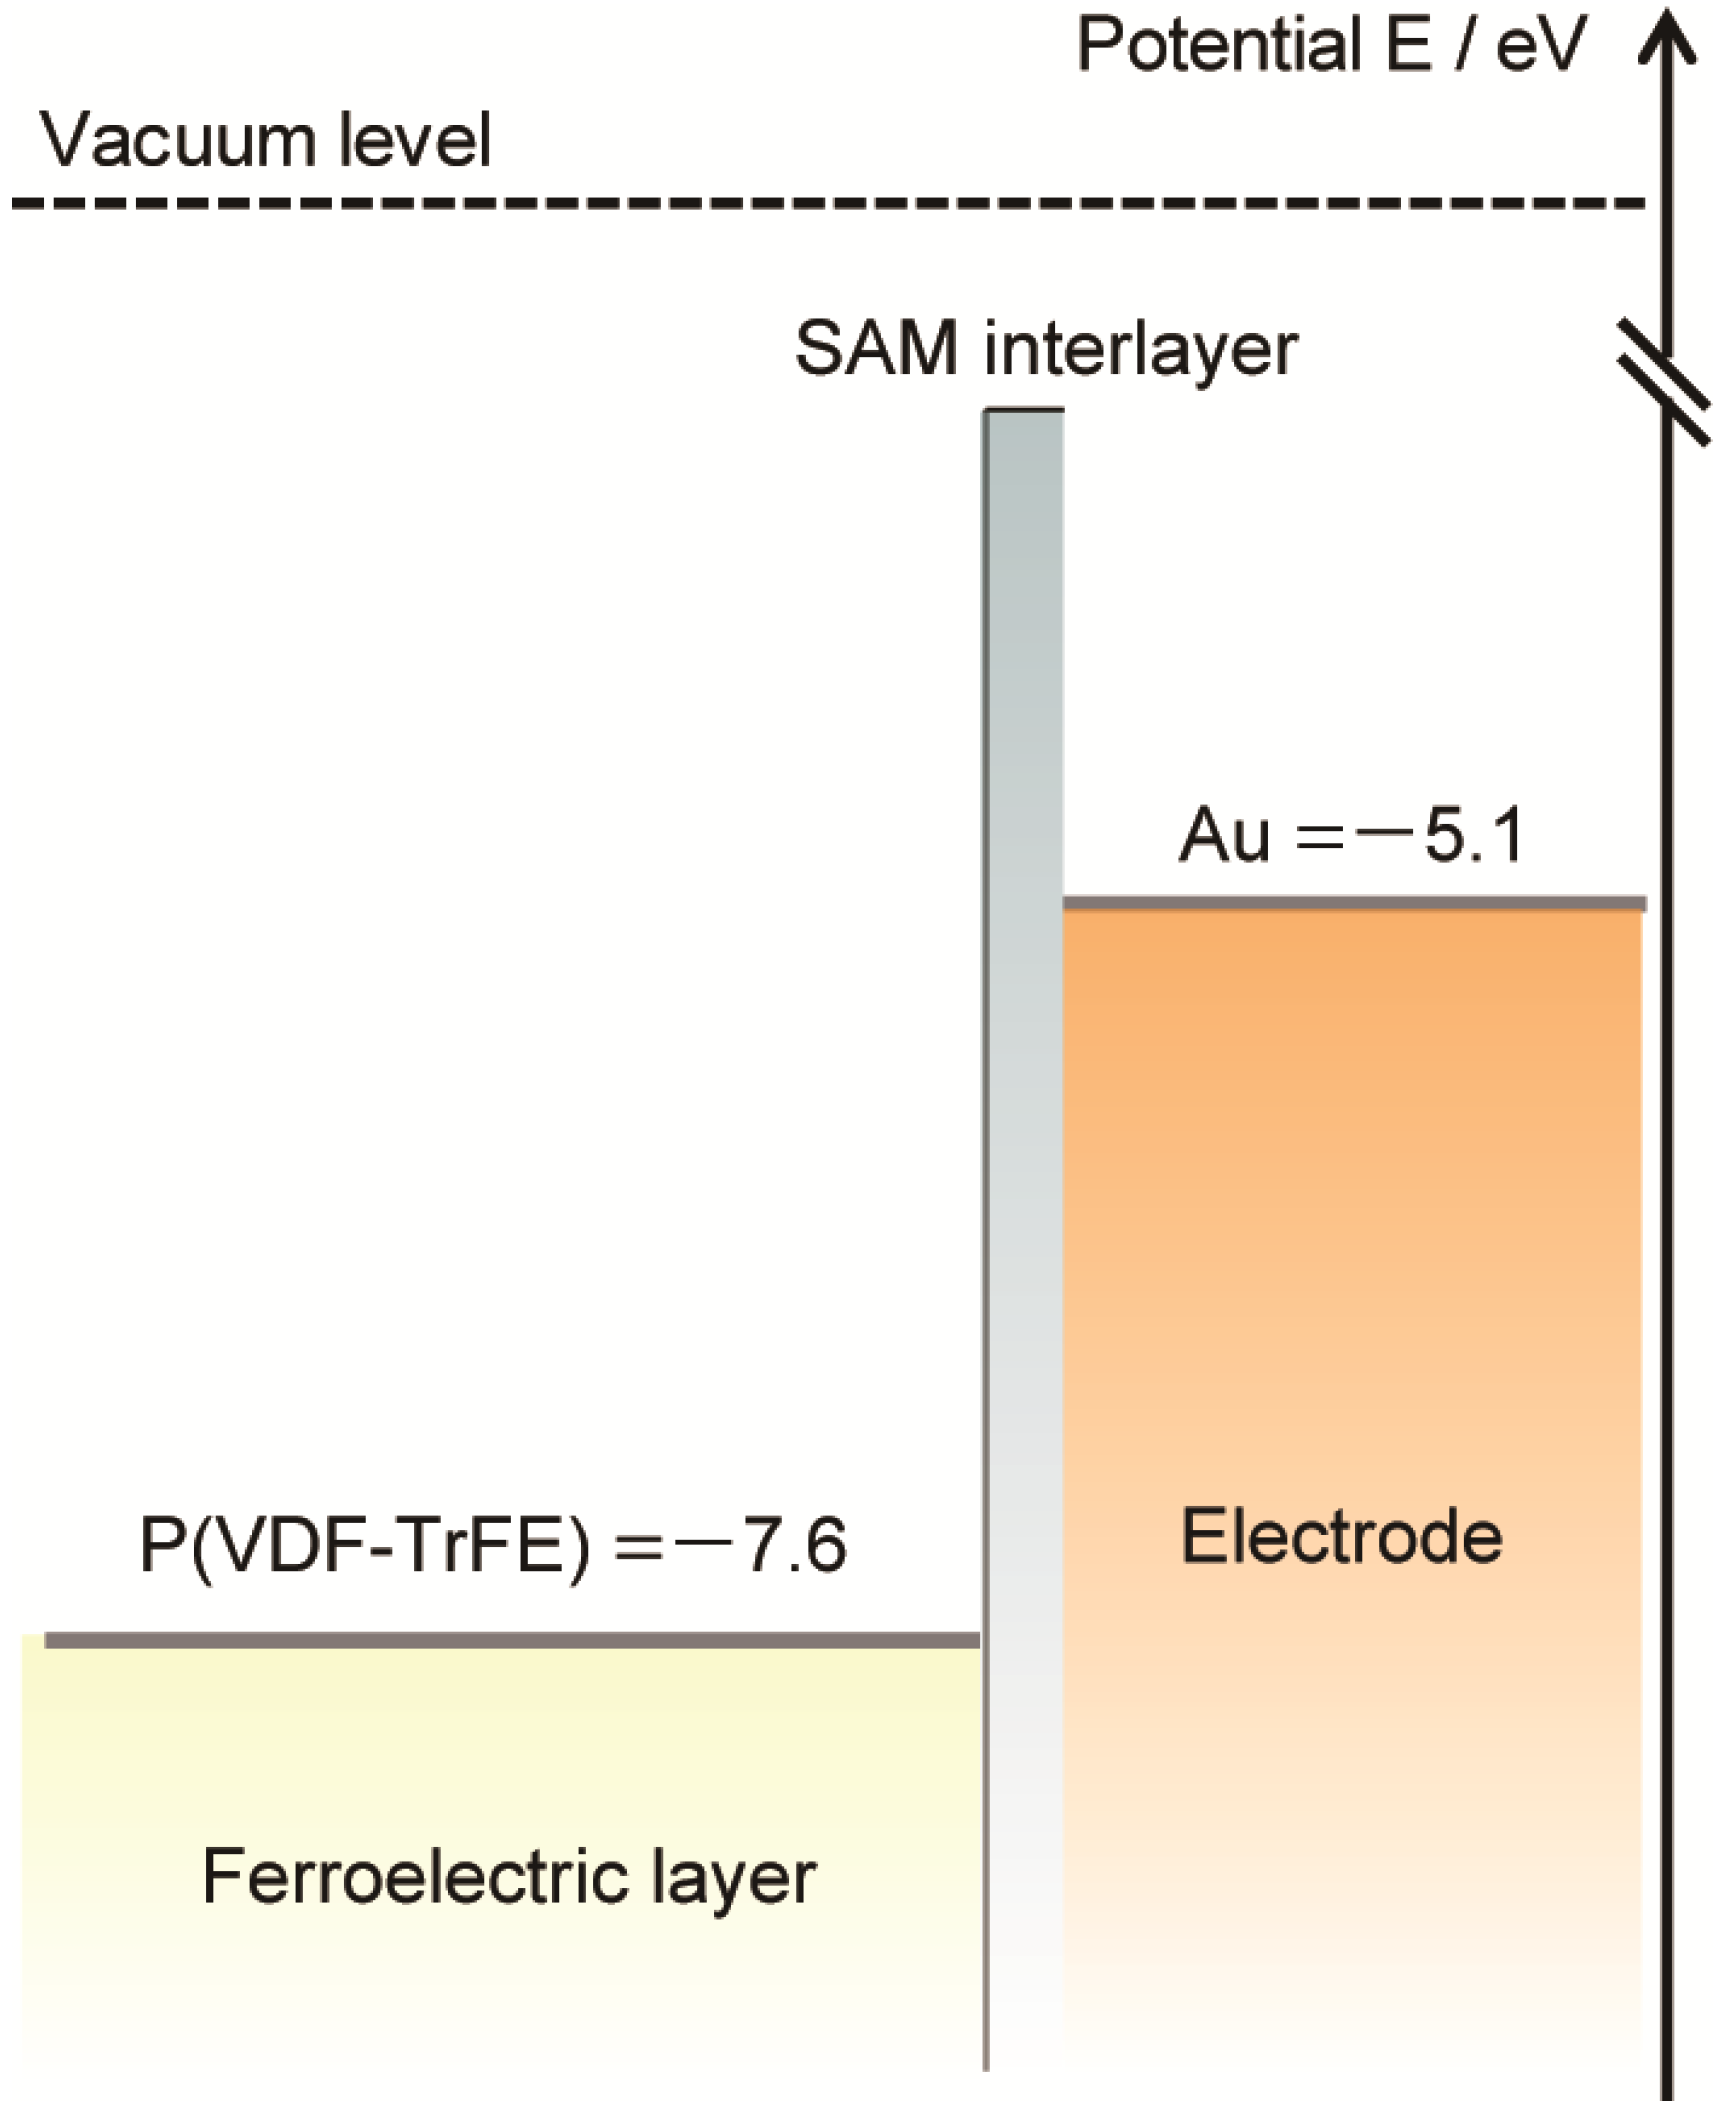
Figure 5. The leakage current for the sample with the PEDOT-PEG lauryl interlayer is almost the same as that for the sample with an unmodified gold electrode, whereas the leakage currents for the samples with SAM layers are two orders of magnitude lower than those for the unmodified gold electrode and the electrode with a PEDOT-PEG lauryl interlayer. The large decrease in the leakage current is attributed to the creation of an effective energy barrier for charge carriers via the insertion of a SAM interlayer between the Au electrode and the organic P(VDF-TrFE) film. Boer
et al. reported that SAMs of hexadecanethiol decreased the work functions of silver and gold electrodes by 0.6 eV and 0.1 eV, respectively, resulting in a potential barrier for hole injection into MEH-PPV organic electronic devices [
8]. Kinashi
et al. decreased the large dark current of a photorefractive polymer composite using a SAM-ITO electrode [
9].
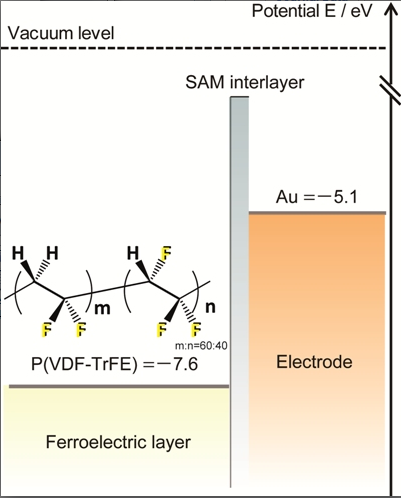
Figure 6 illustrates the energy-level diagrams of the present P(VDF-TrFE) organic ferroelectric, the Au electrode, and the SAM-Au electrode.
Figure 5.
J–E plots showing the leakage currents measured from −80 to 80 MV·m−1 for each sample.
Figure 5.
J–E plots showing the leakage currents measured from −80 to 80 MV·m−1 for each sample.
Figure 6.
Energy-level diagram of the Au electrode, SAM-Au, and P(VDF-TrFE).
Figure 6.
Energy-level diagram of the Au electrode, SAM-Au, and P(VDF-TrFE).
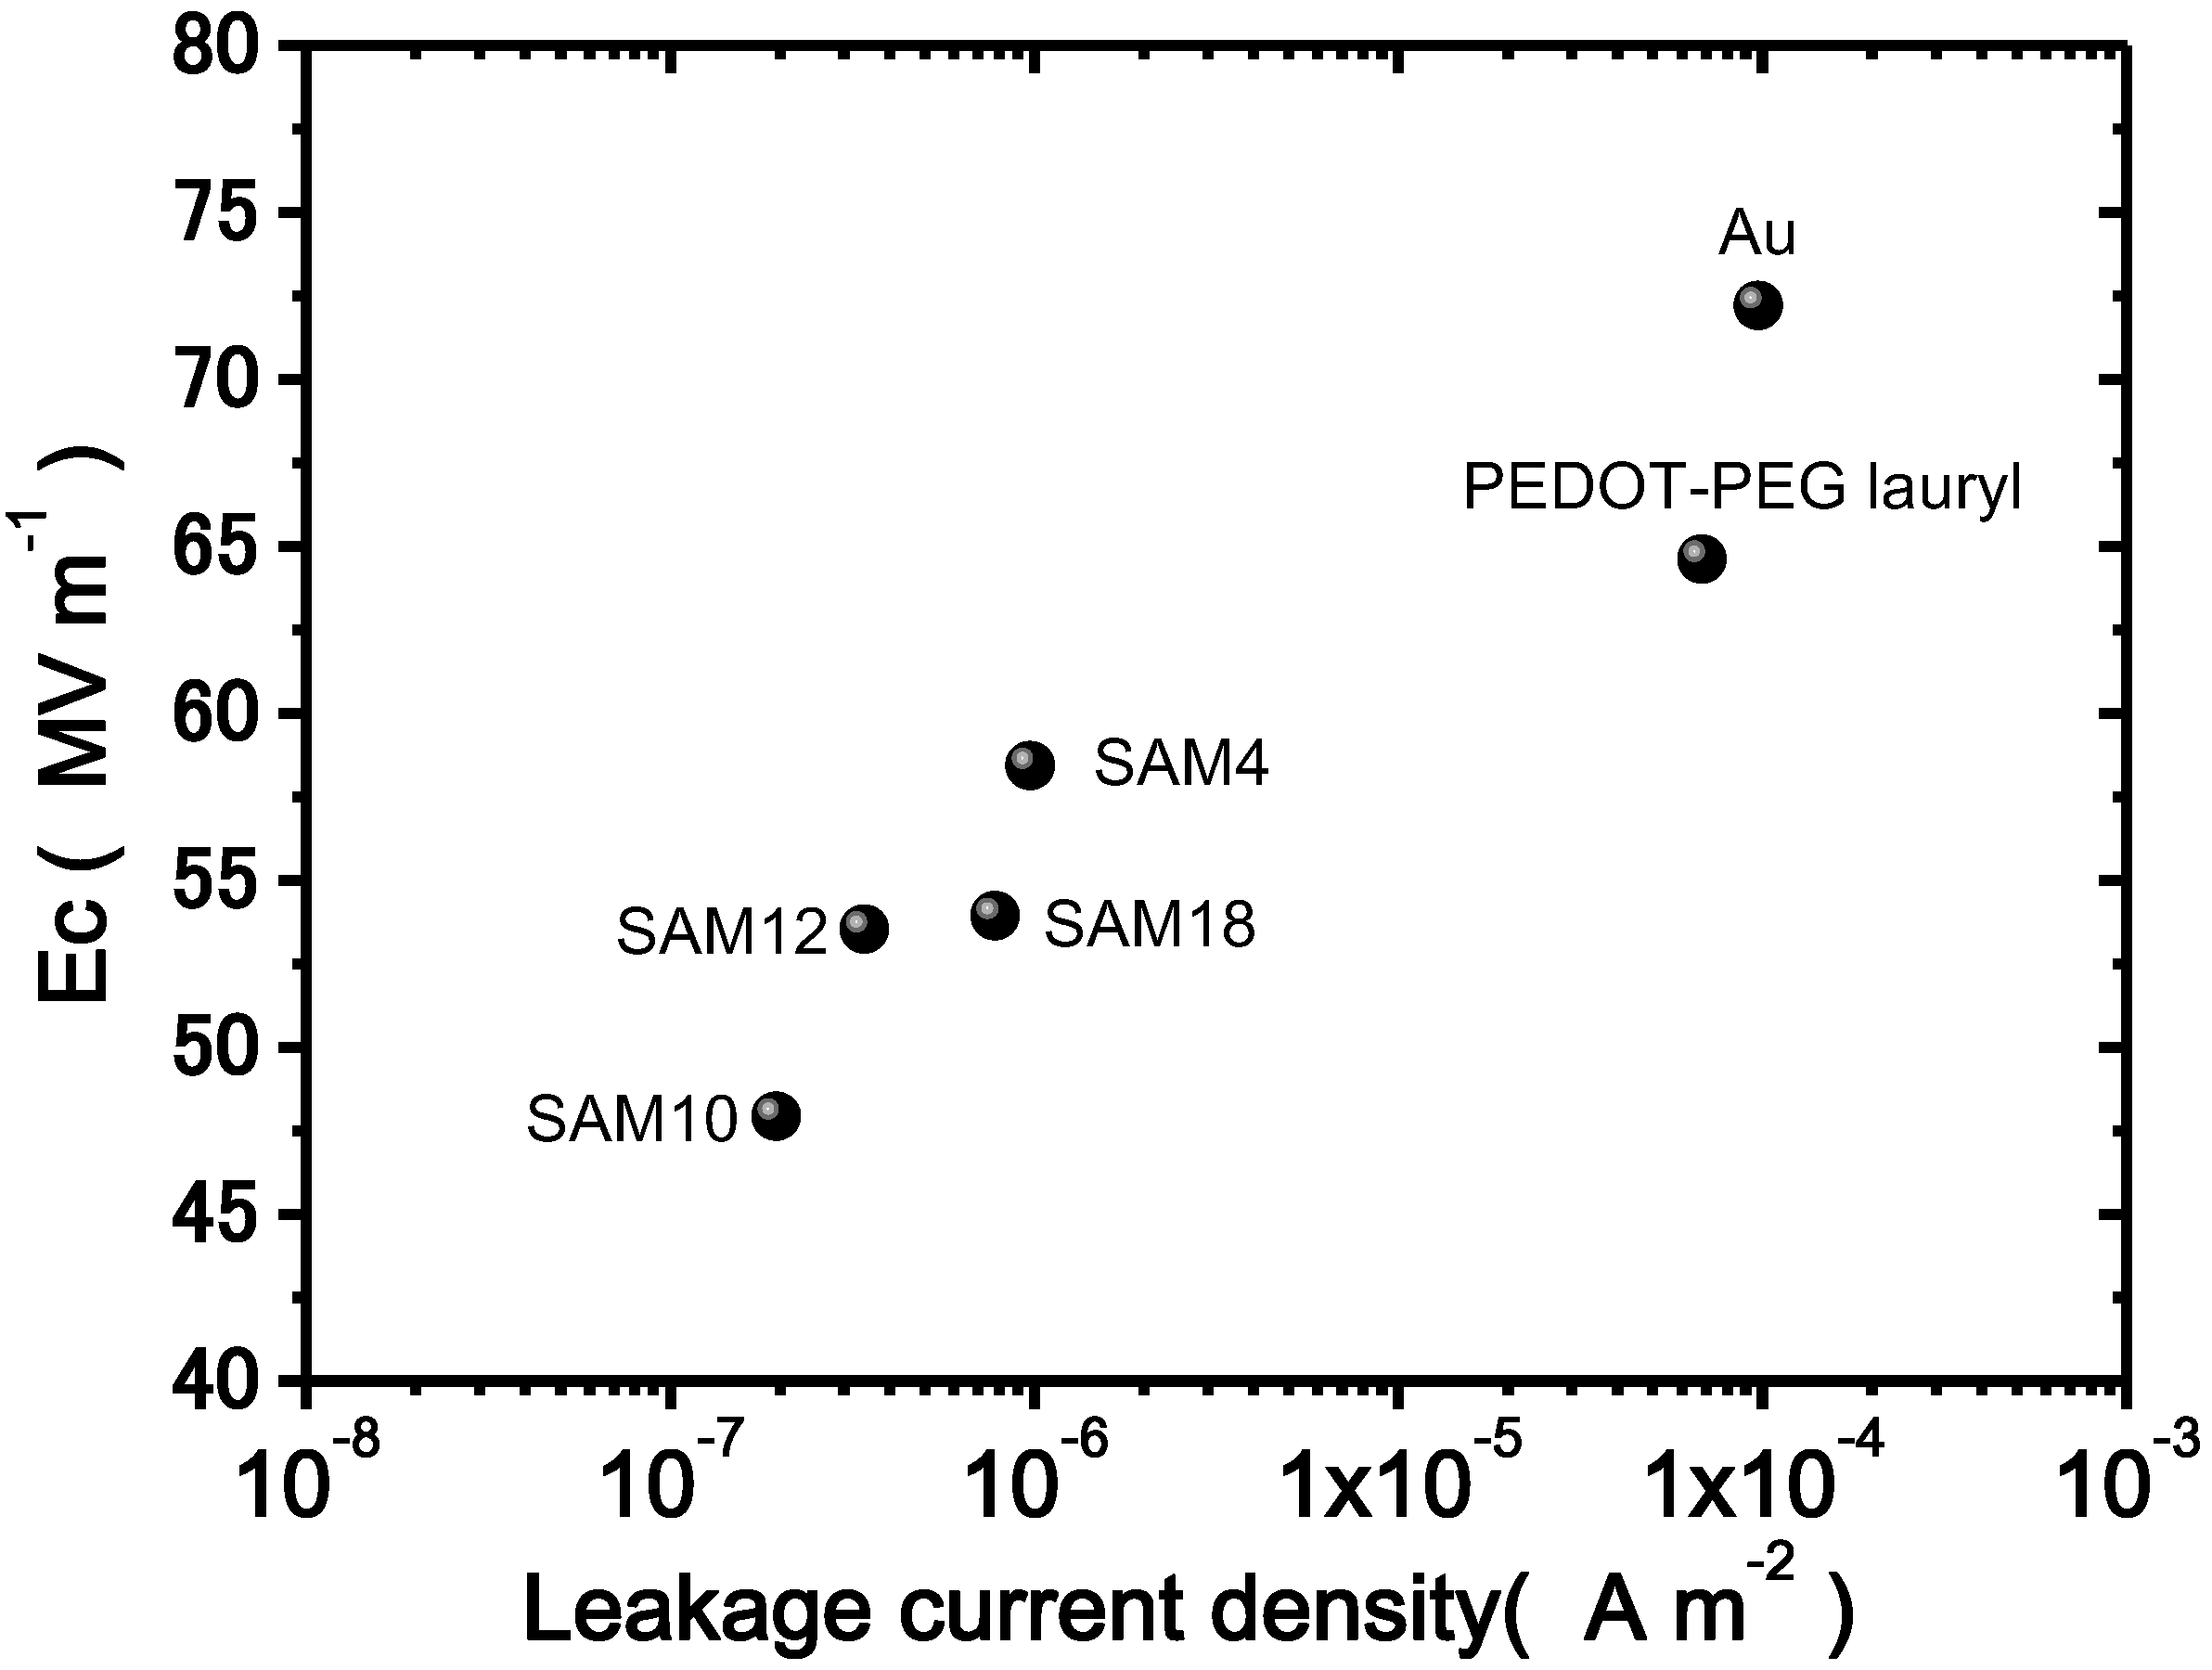
Figure 7 shows a plot of the Ec as a function of the leakage current density under an electric field of 80 MV·m
−1 and a cycling frequency of 10 Hz. As the leakage current density decreases, Ec decreases. For other cycling frequencies, similar relationships were observed. Thus, the leakage current is related to the Ec value. The results clearly demonstrate that the SAM interlayers depress the leakage current density and the Ec values. One possible explanation for the lower coercive field due to insertion of a SAM interlayer is the depression of the effective electric field loss. The SAM interlayers, as previously discussed, greatly decrease the leakage current density. Specifically, the decreased leakage current density leads to the preservation of the effective electric field at the interface between the electrode and the bulk, whereas a larger leakage current does not. Thus, a lower coercive field is measured because of the preserved effective electric field in the samples with SAM interlayers.
Figure 7.
Plots of the leakage current density vs. Ec measured under an applied field of 80 MV·m−1 and at a cycling frequency of 10 Hz.
Figure 7.
Plots of the leakage current density vs. Ec measured under an applied field of 80 MV·m−1 and at a cycling frequency of 10 Hz.


