The Design and Analysis of a Novel Split-H-Shaped Metamaterial for Multi-Band Microwave Applications

Abstract
:1. Introduction
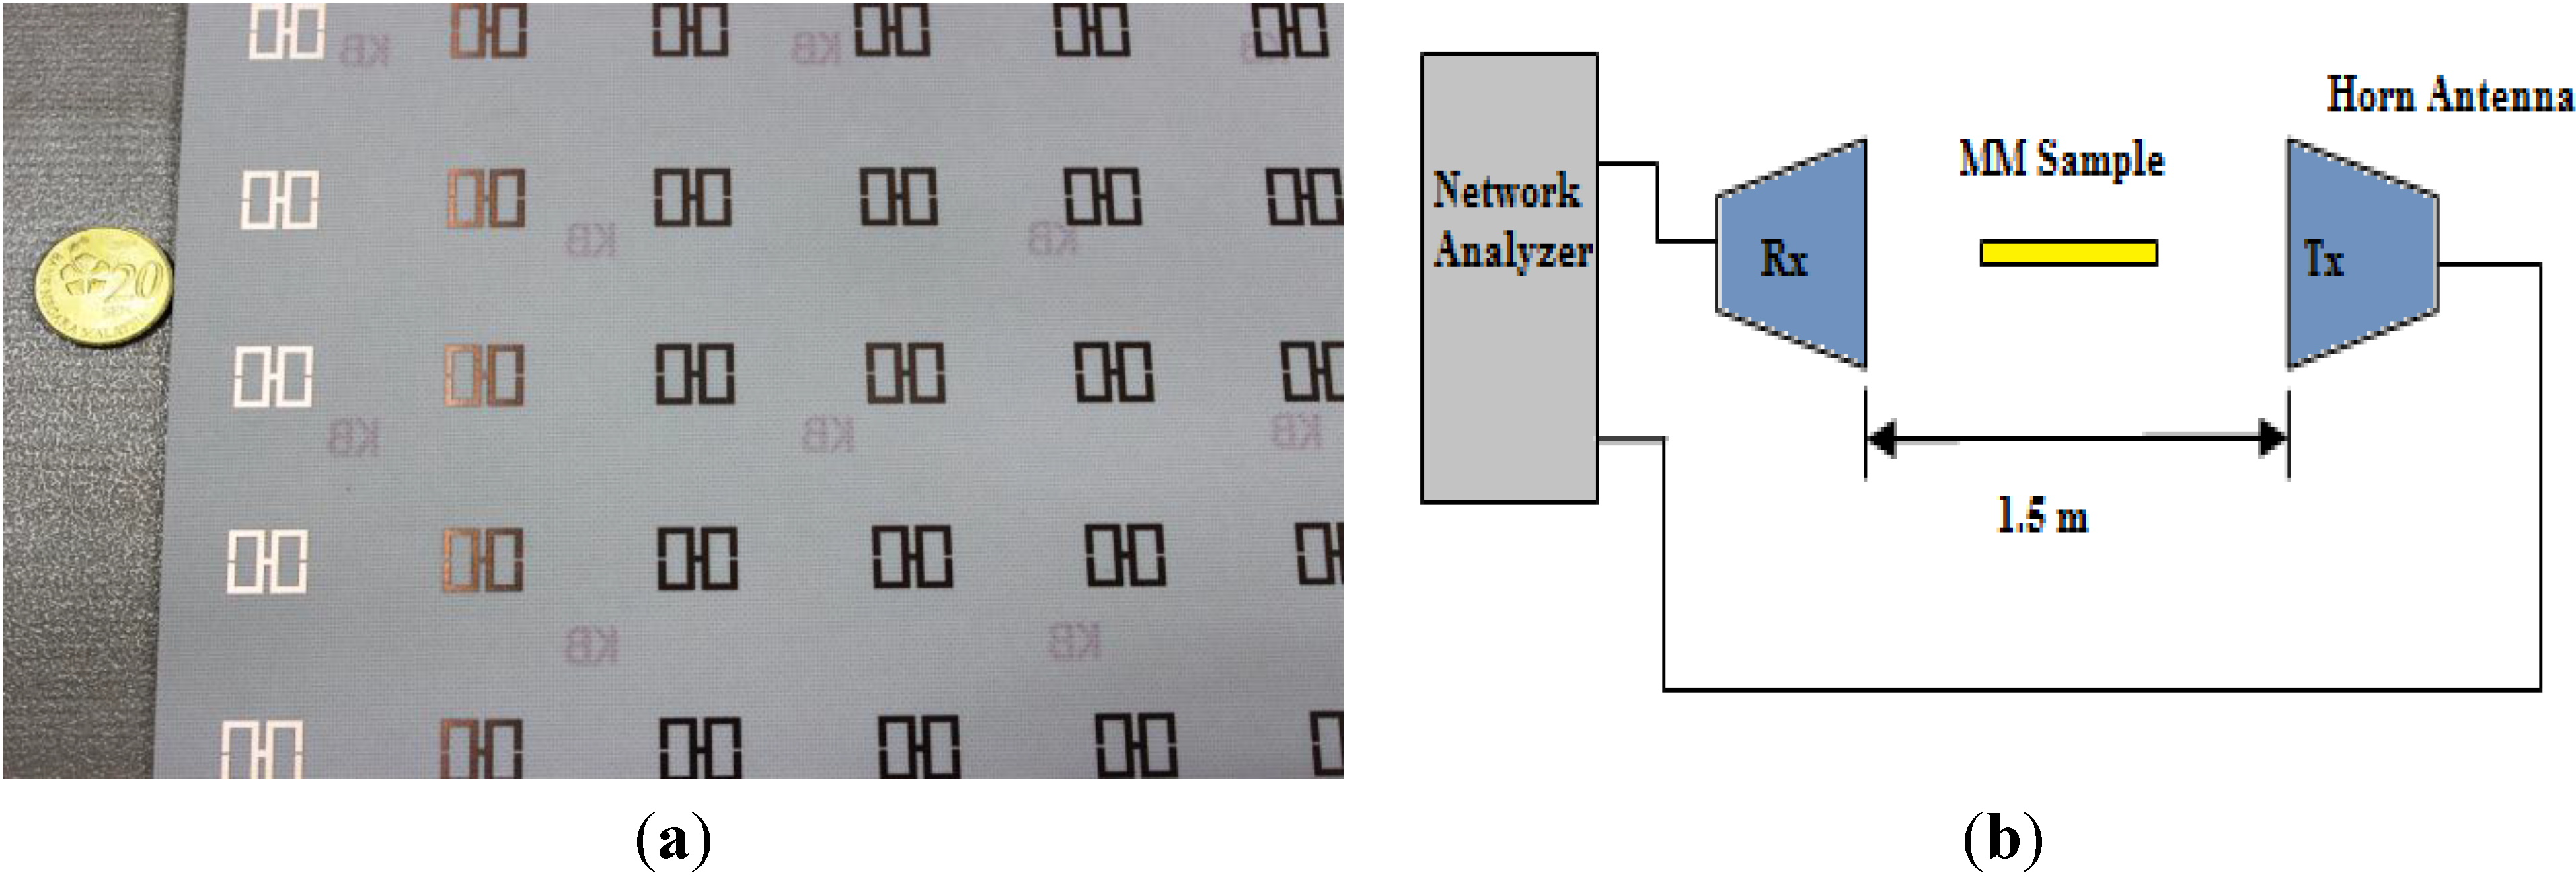
2. Materials and Methods

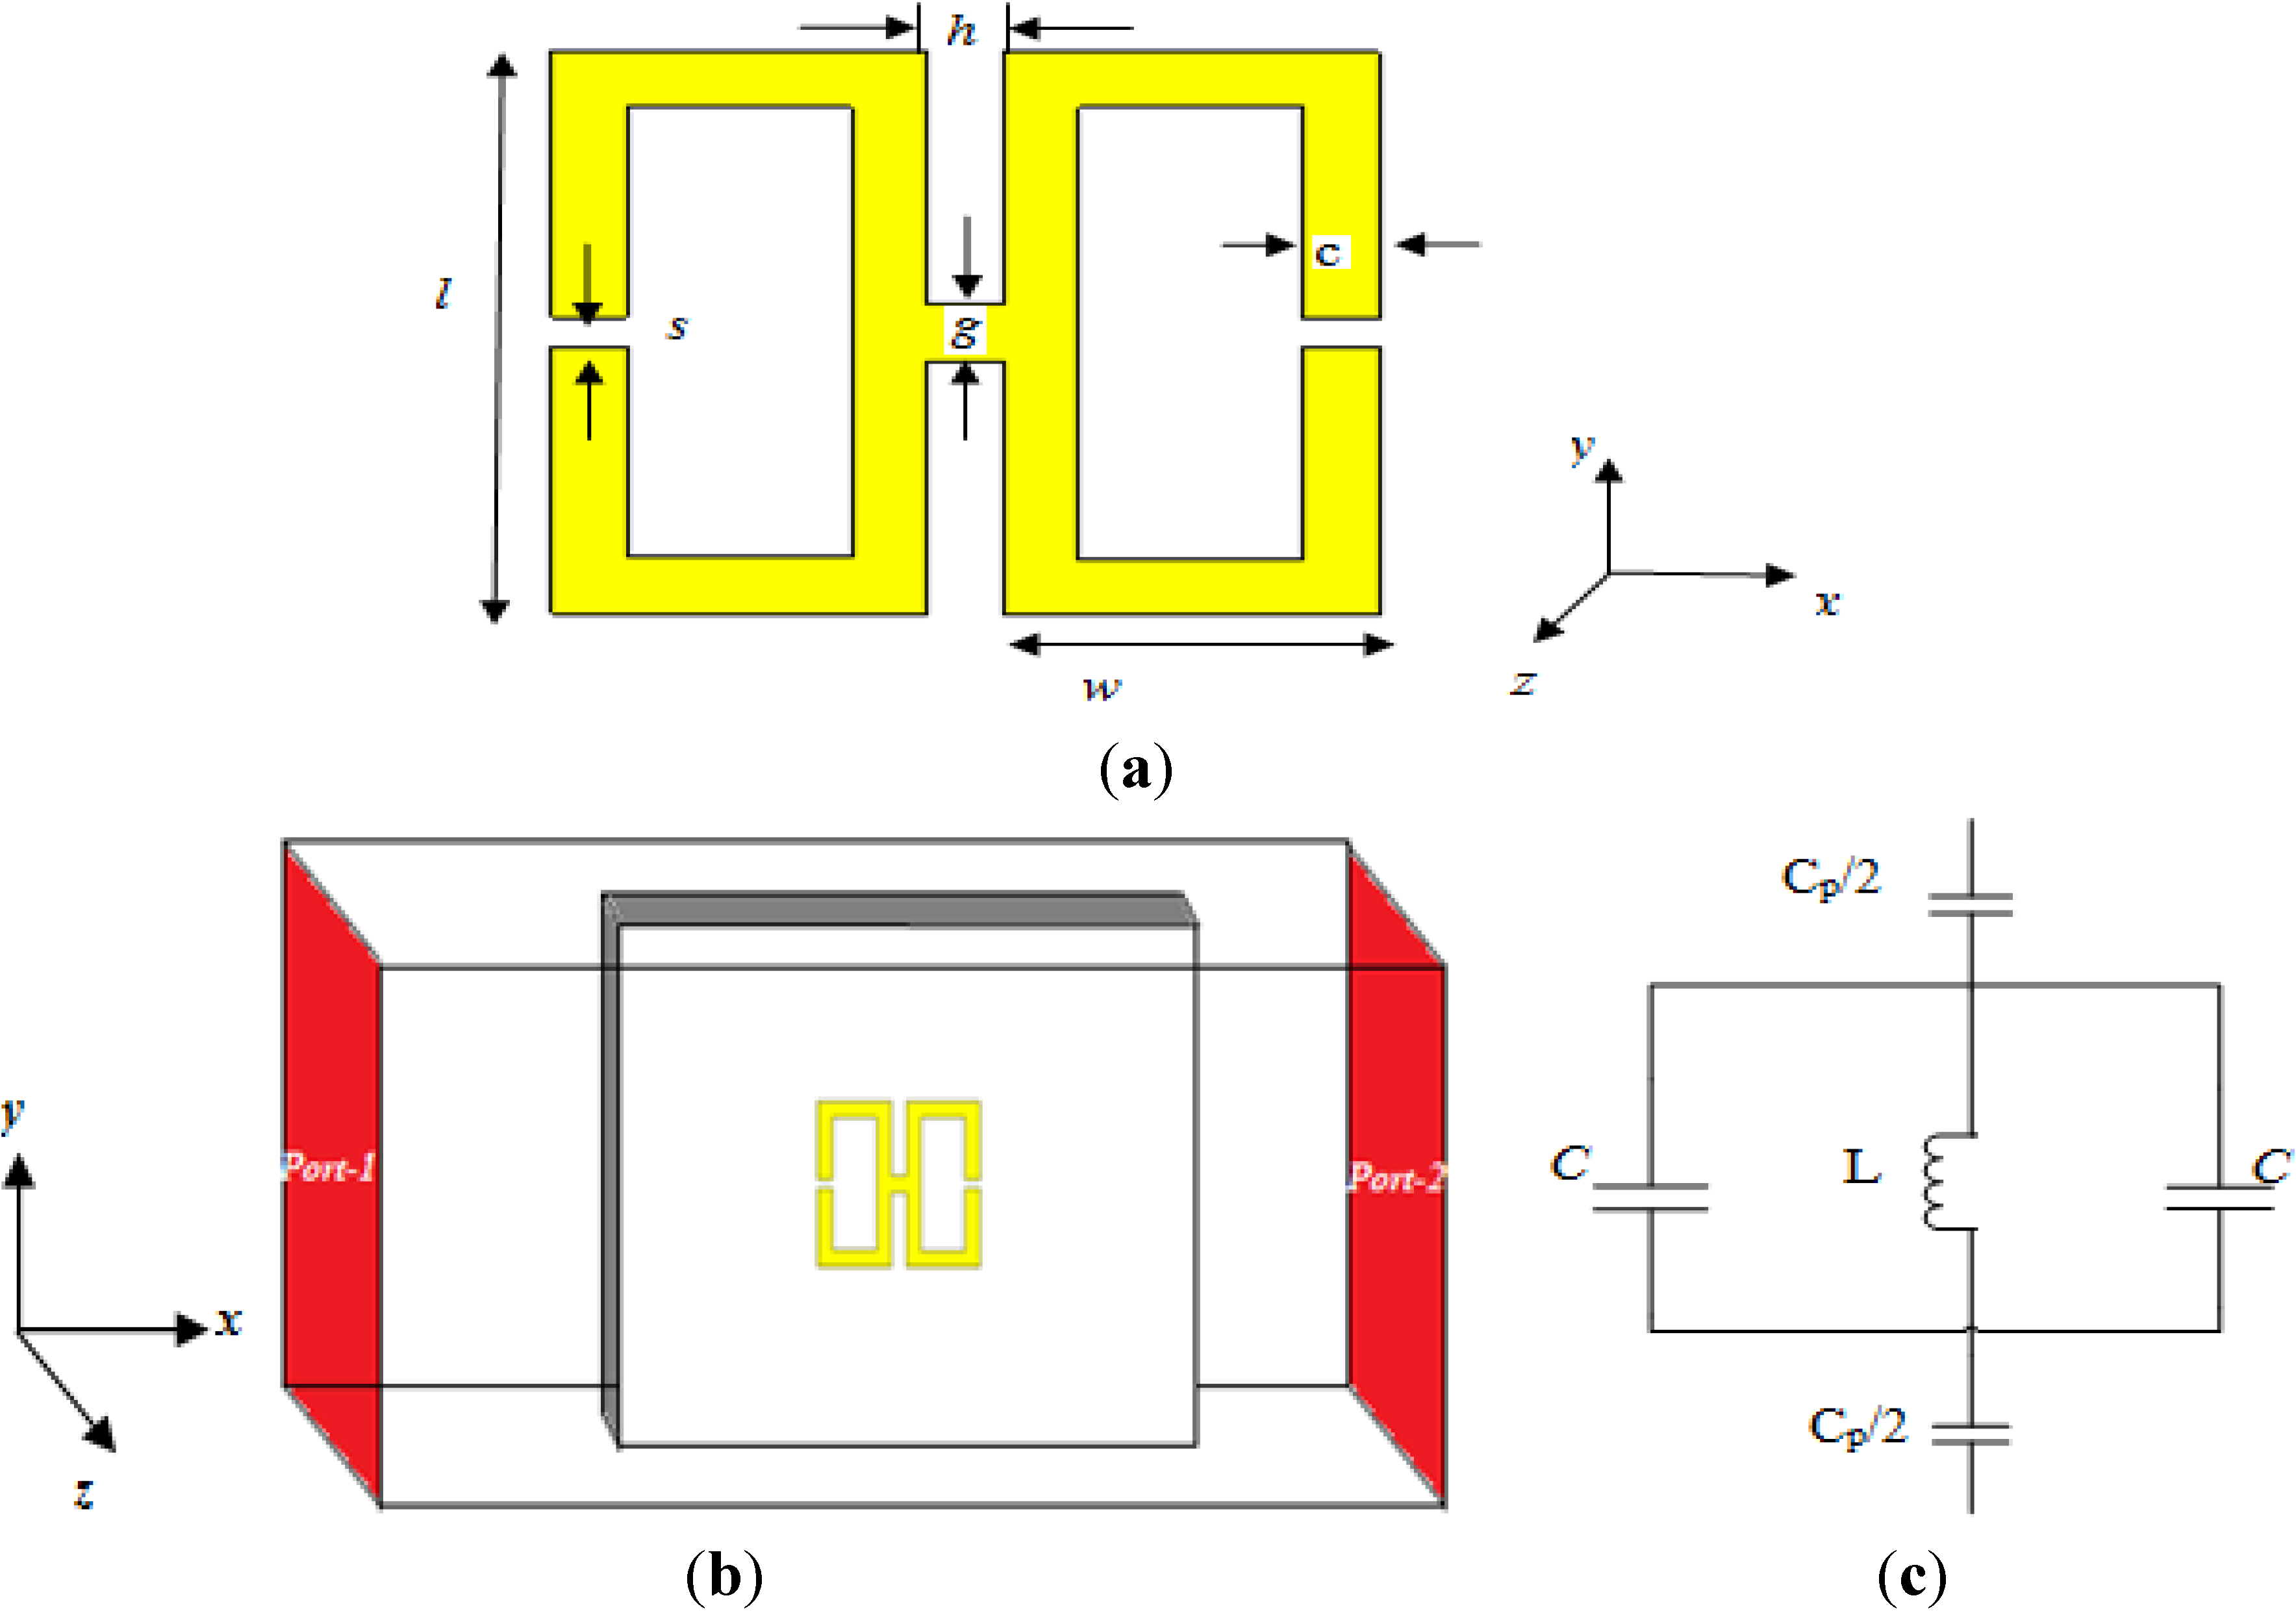
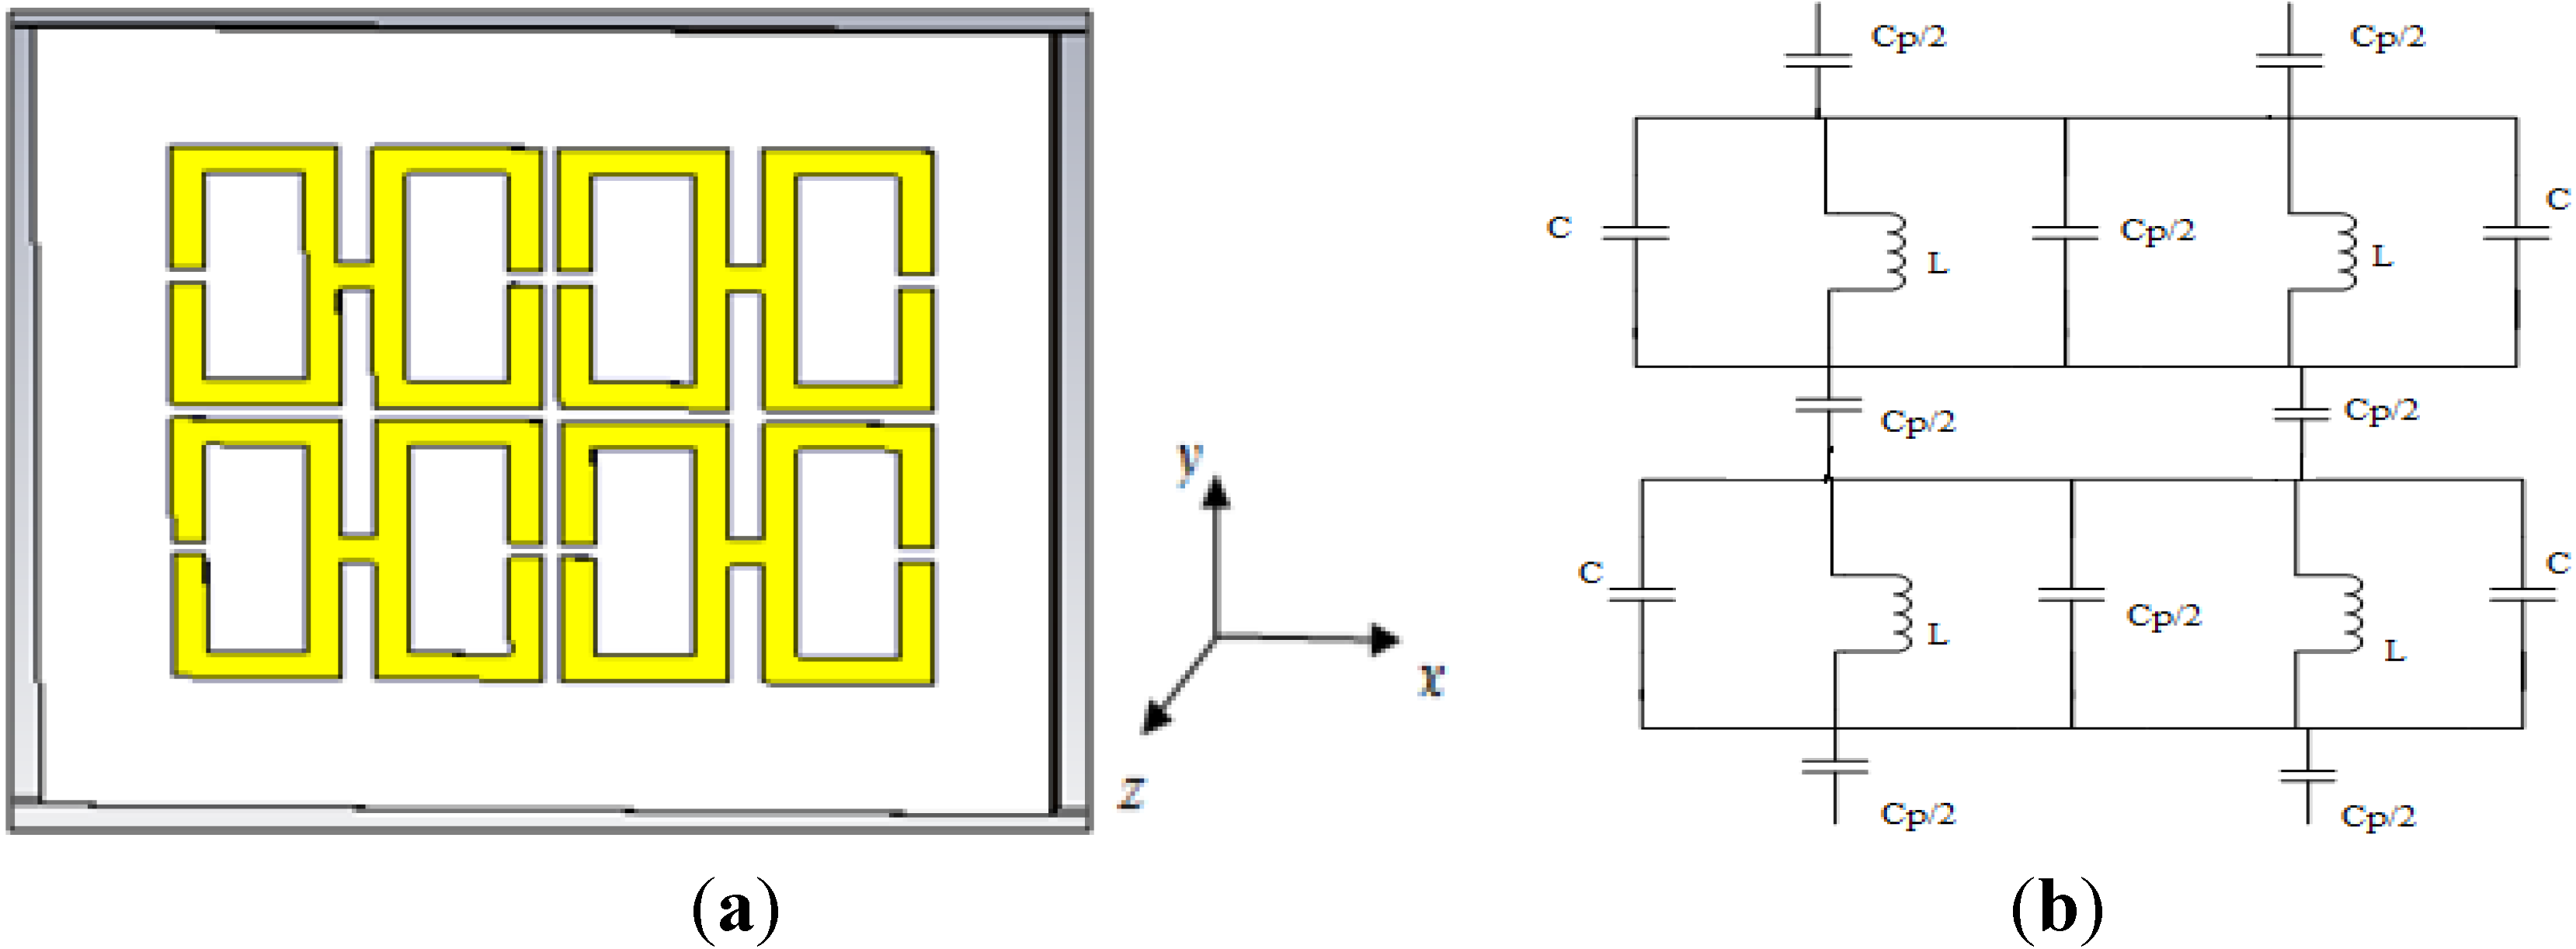
| The unit cell parameters | Value (mm) |
|---|---|
| c | 1 |
| g | 1 |
| h | 1 |
| l | 10 |
| s | 0.5 |
| w | 5 |

3. Equivalent Circuit Model


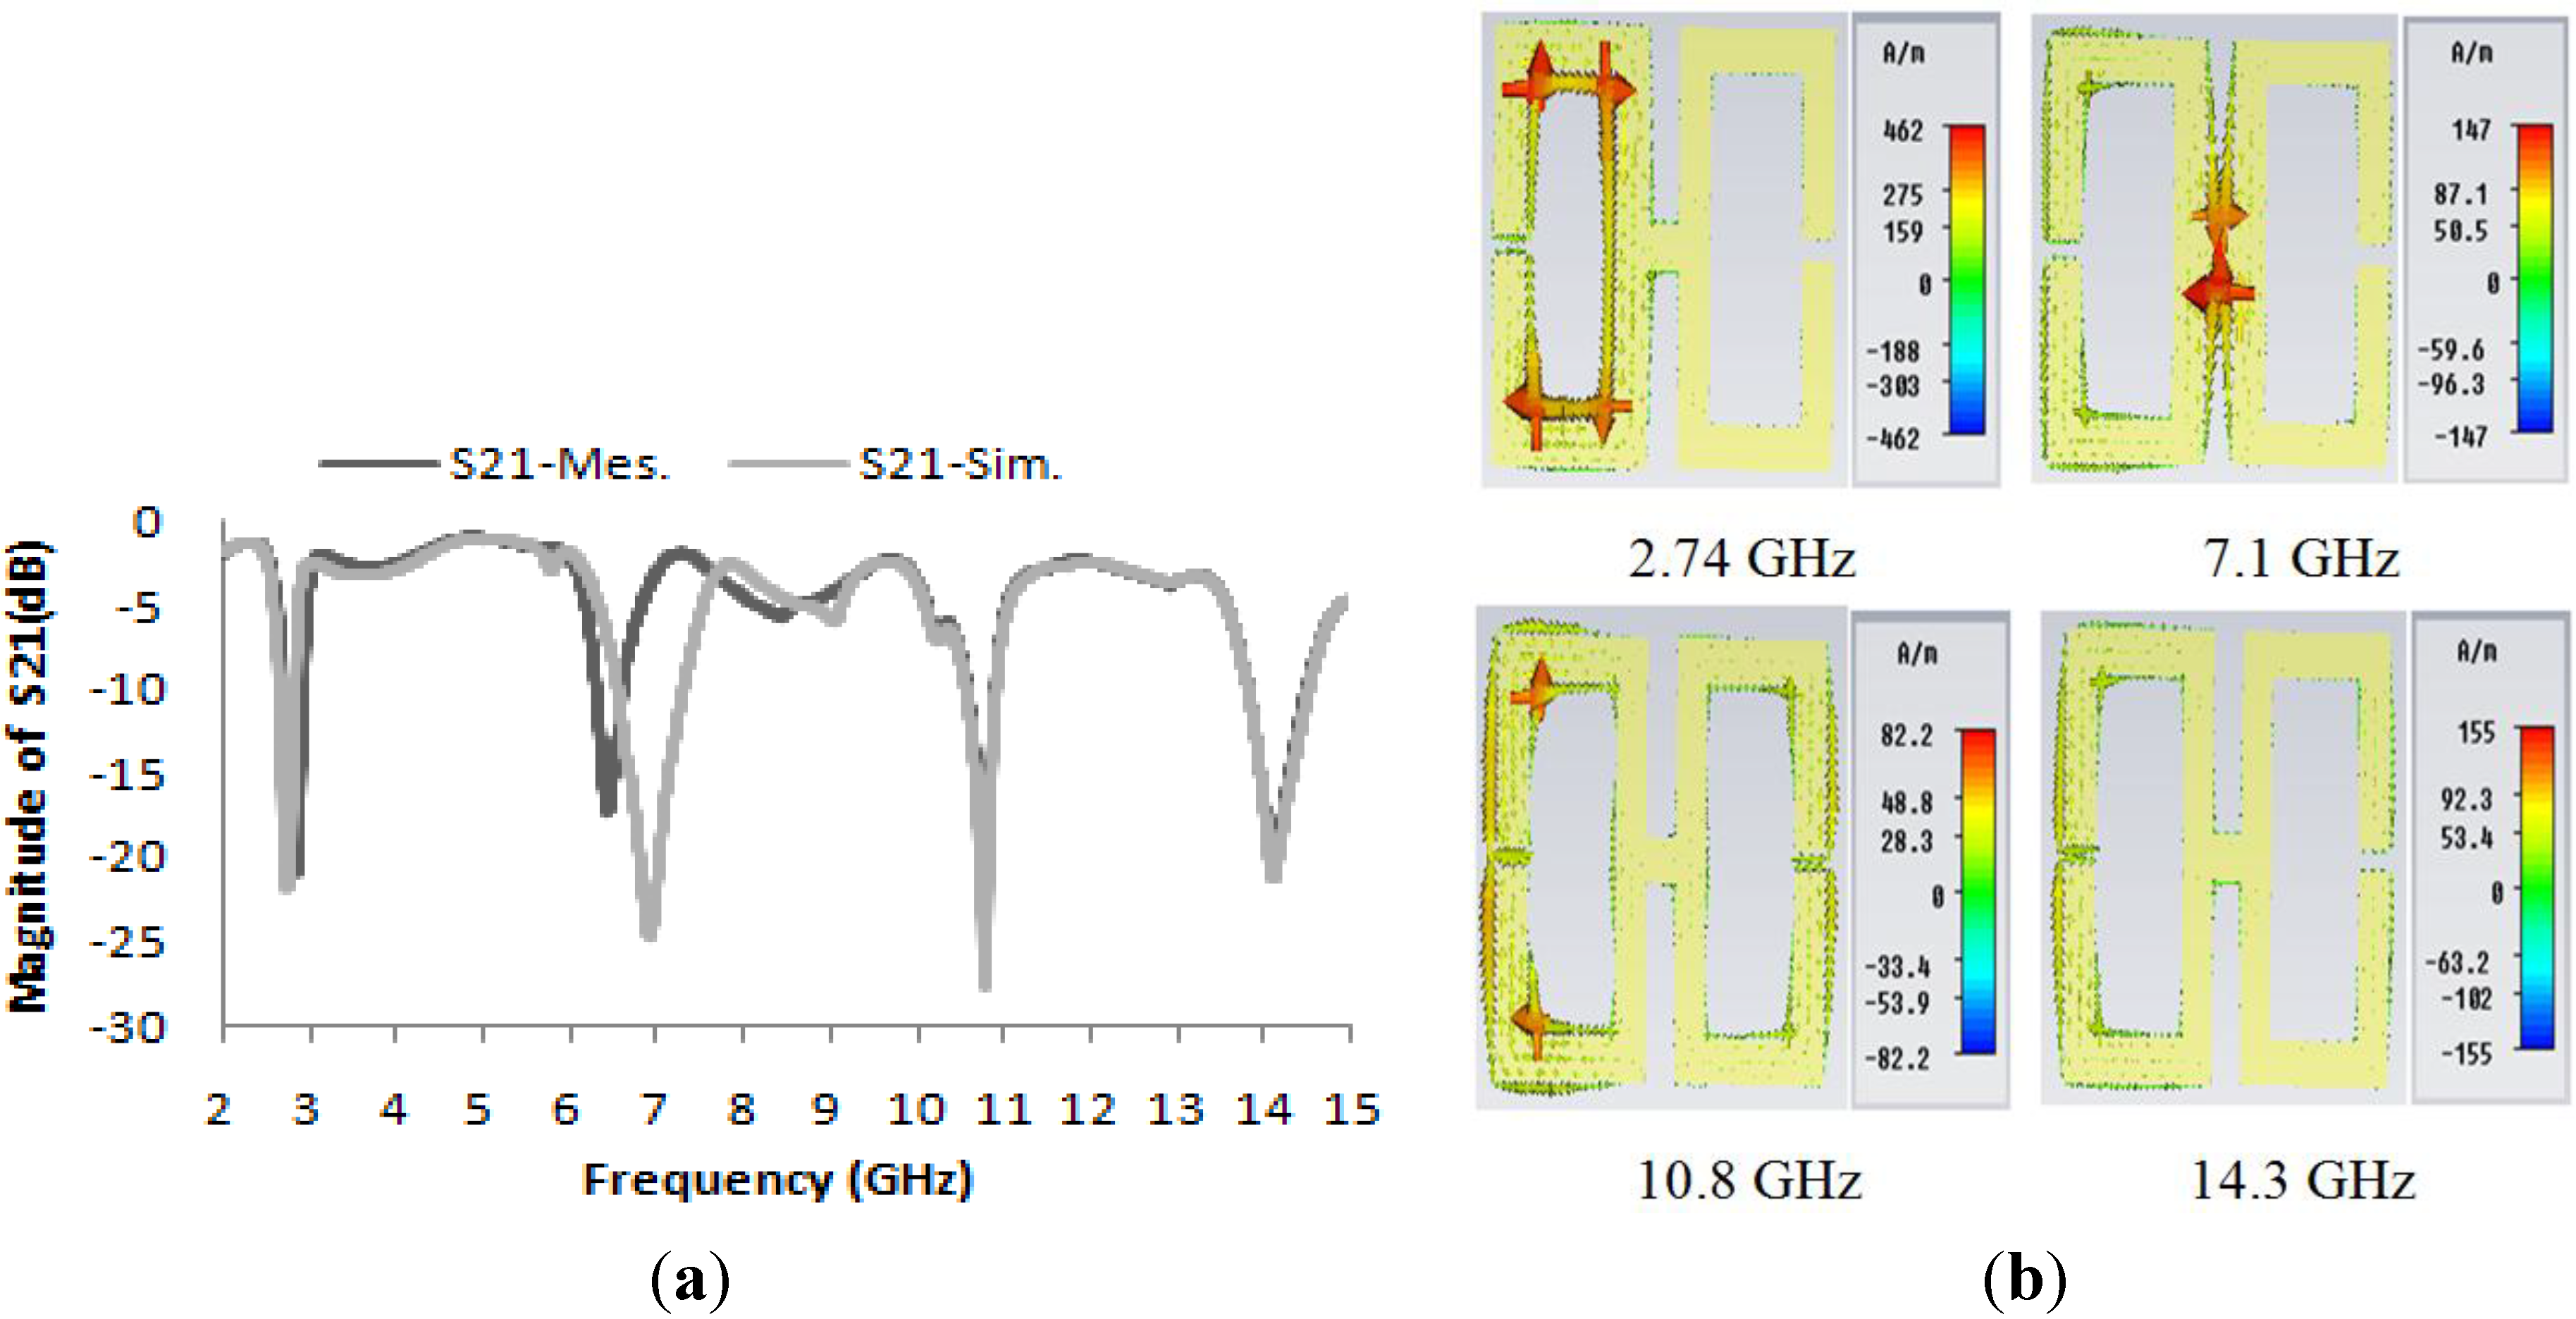
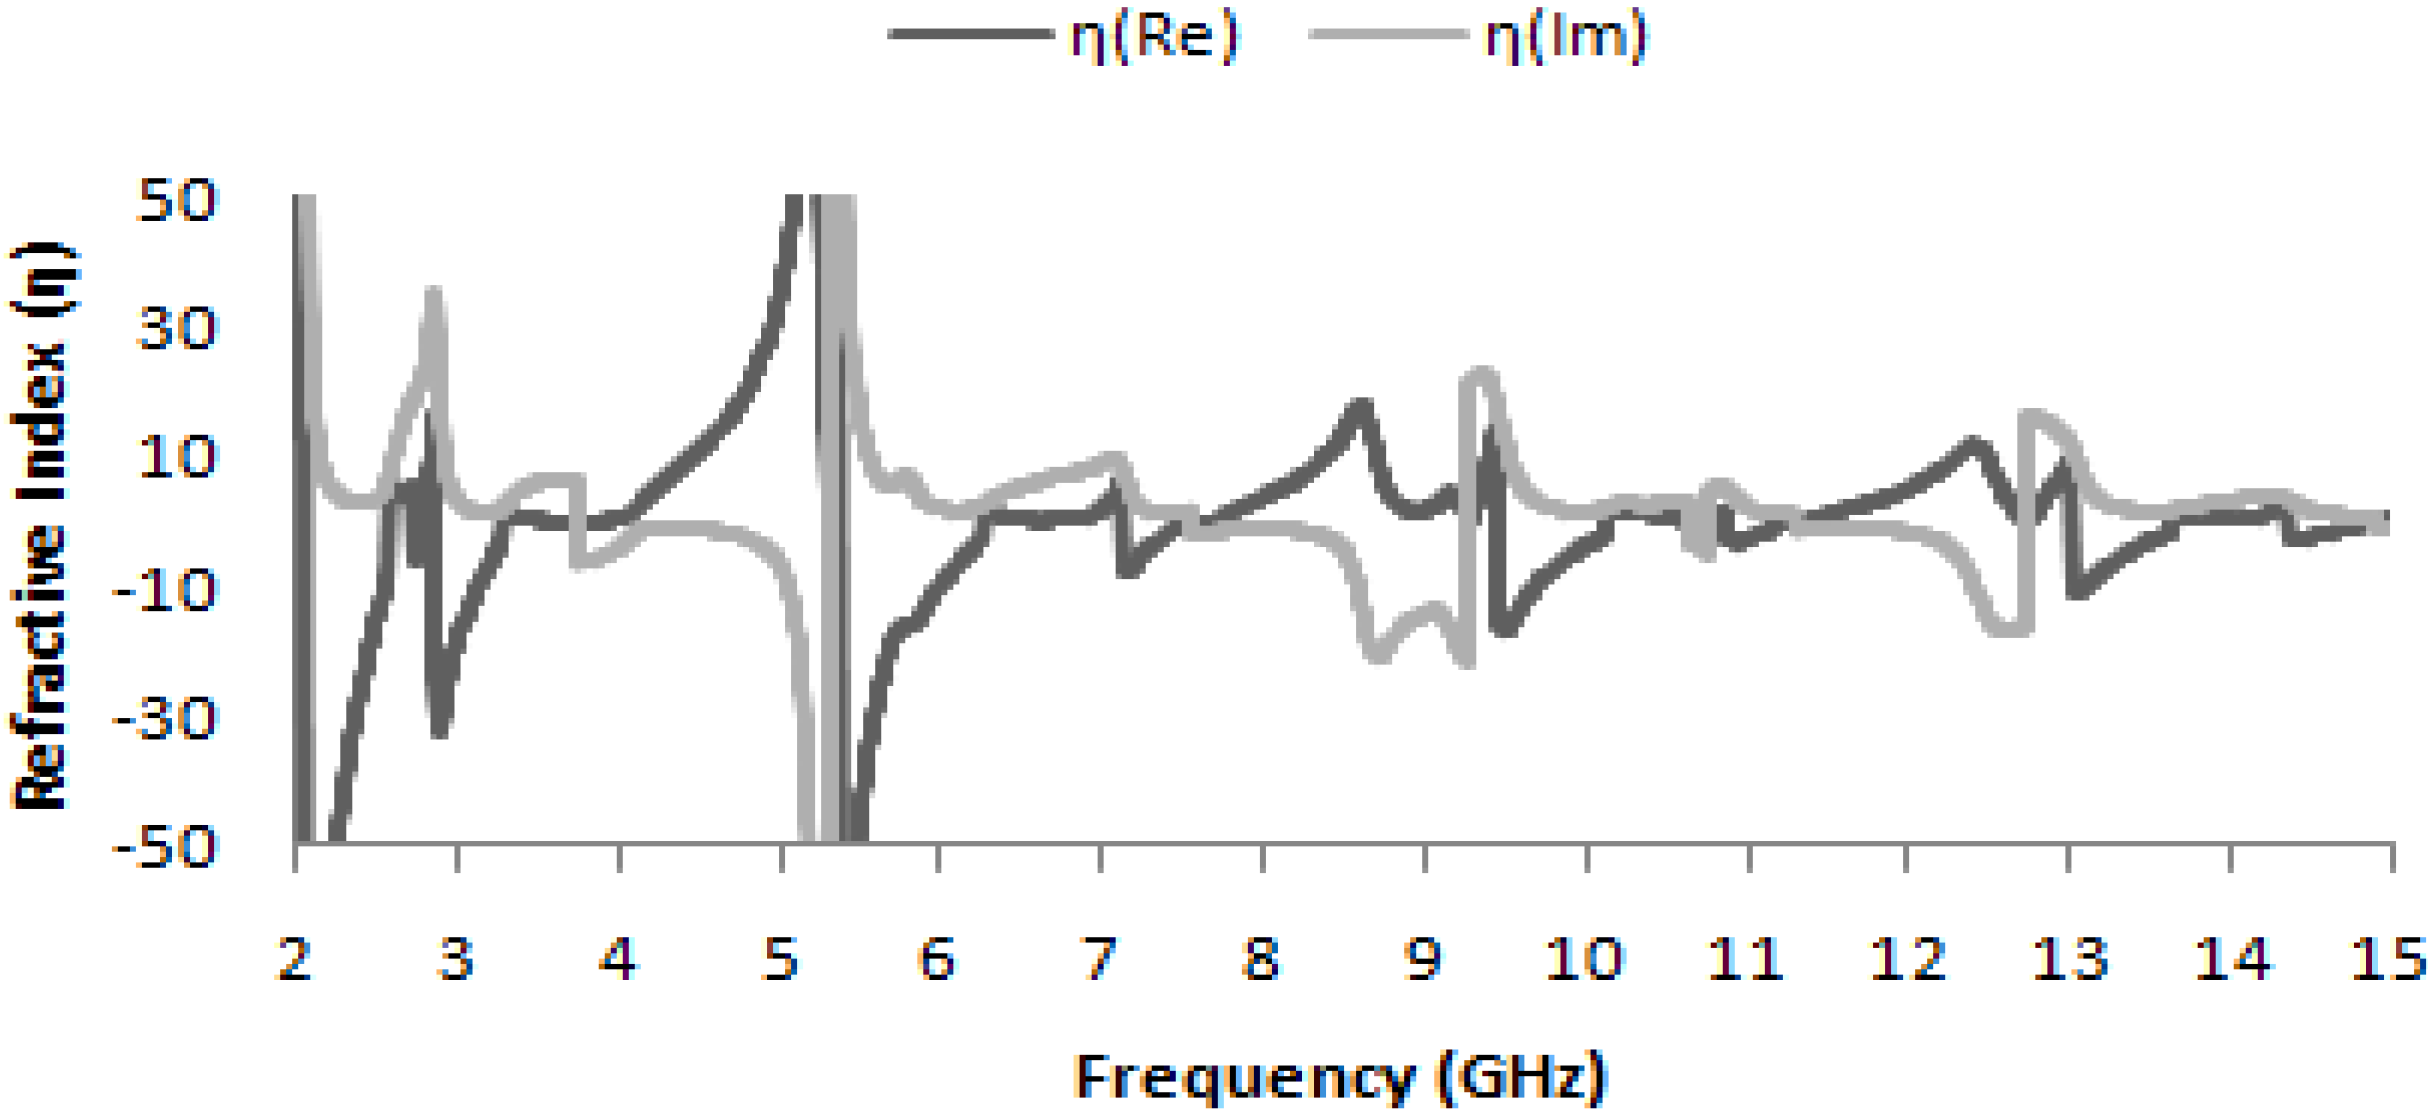
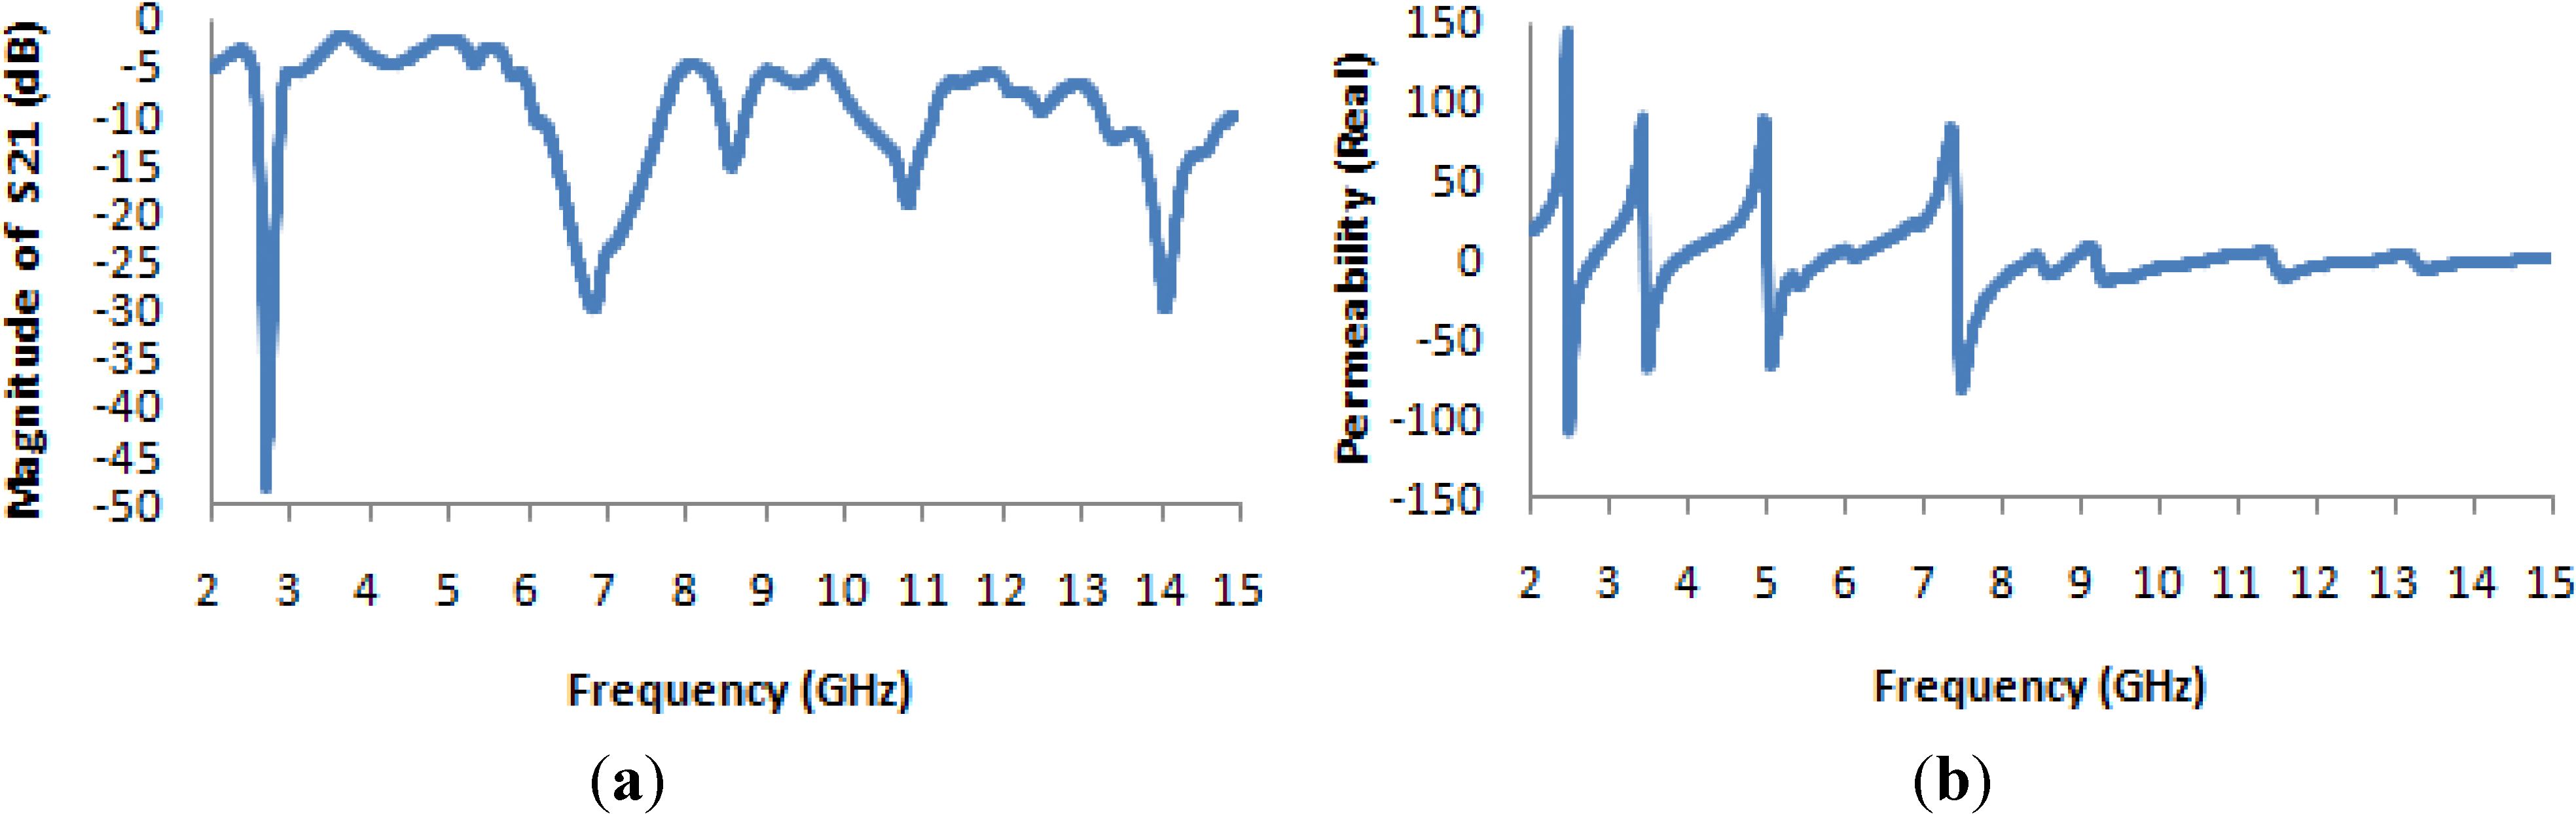
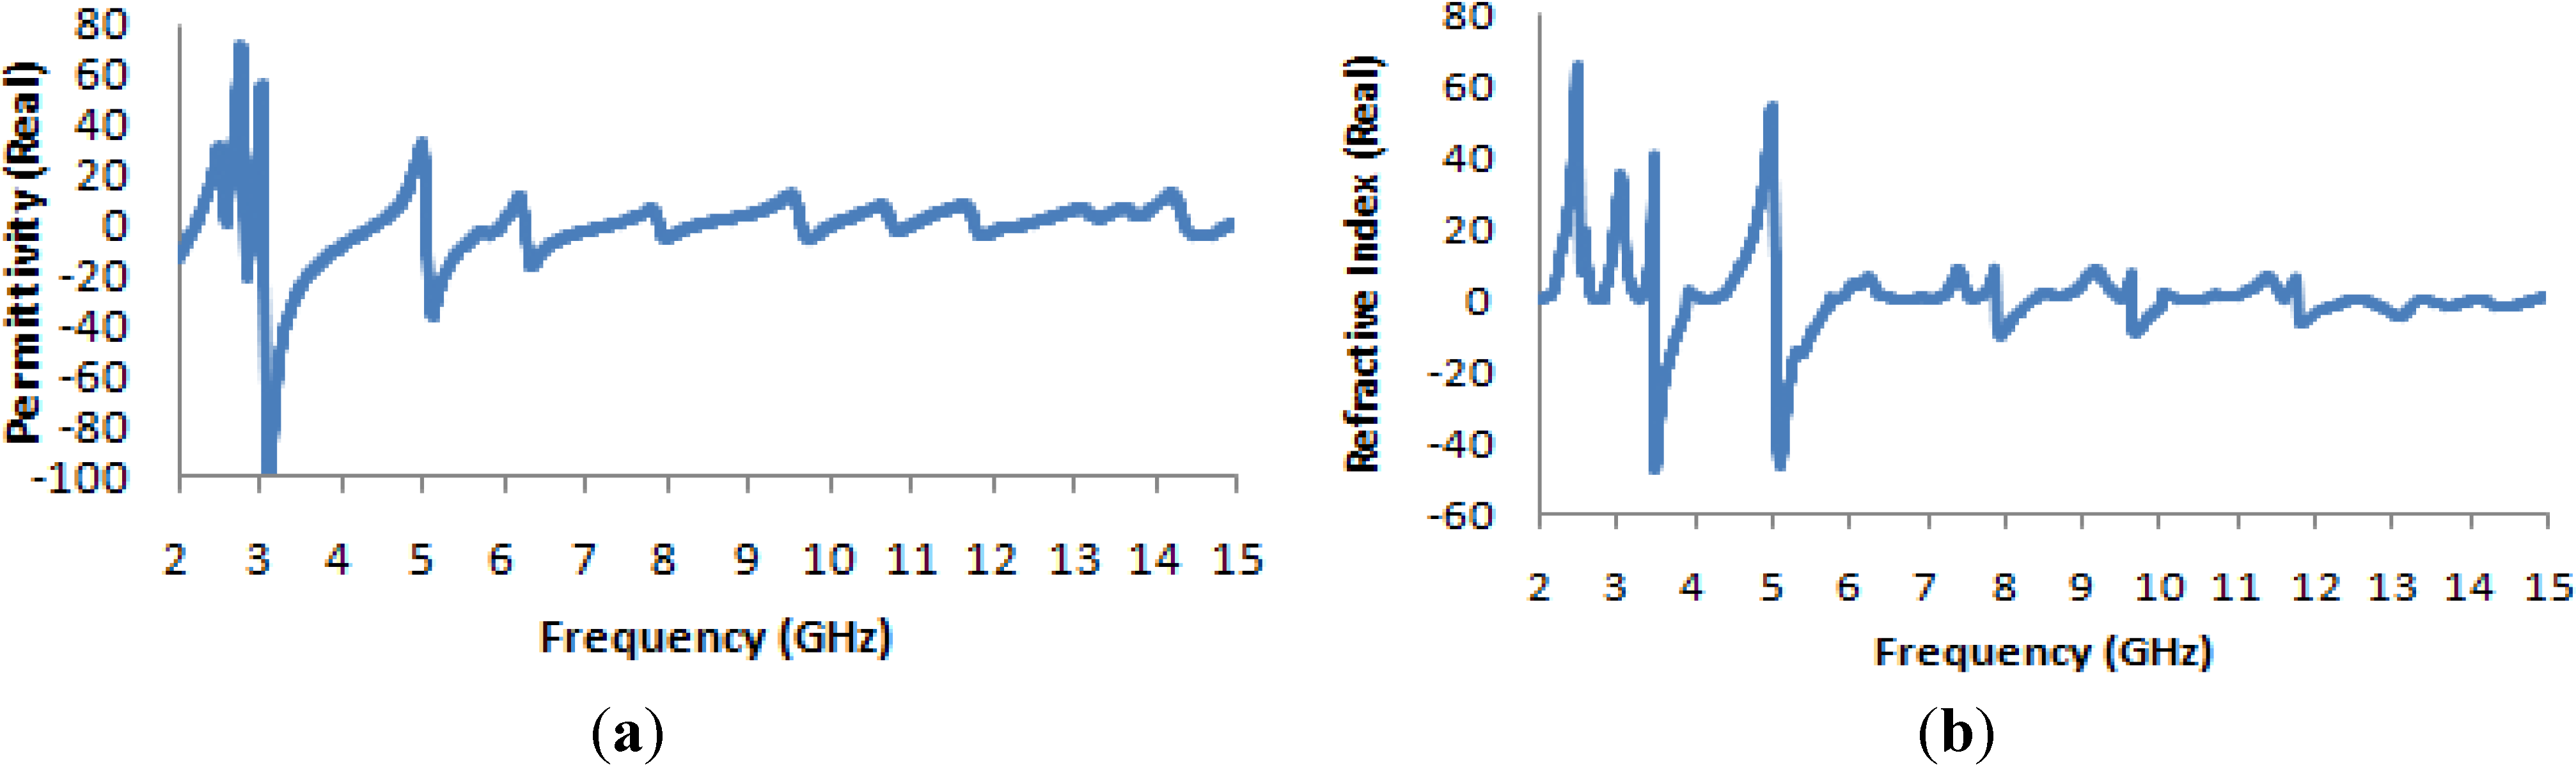
4. Results and Discussion

| Frequencies (GHz) | Value of ε | Value of μ | Value of η |
|---|---|---|---|
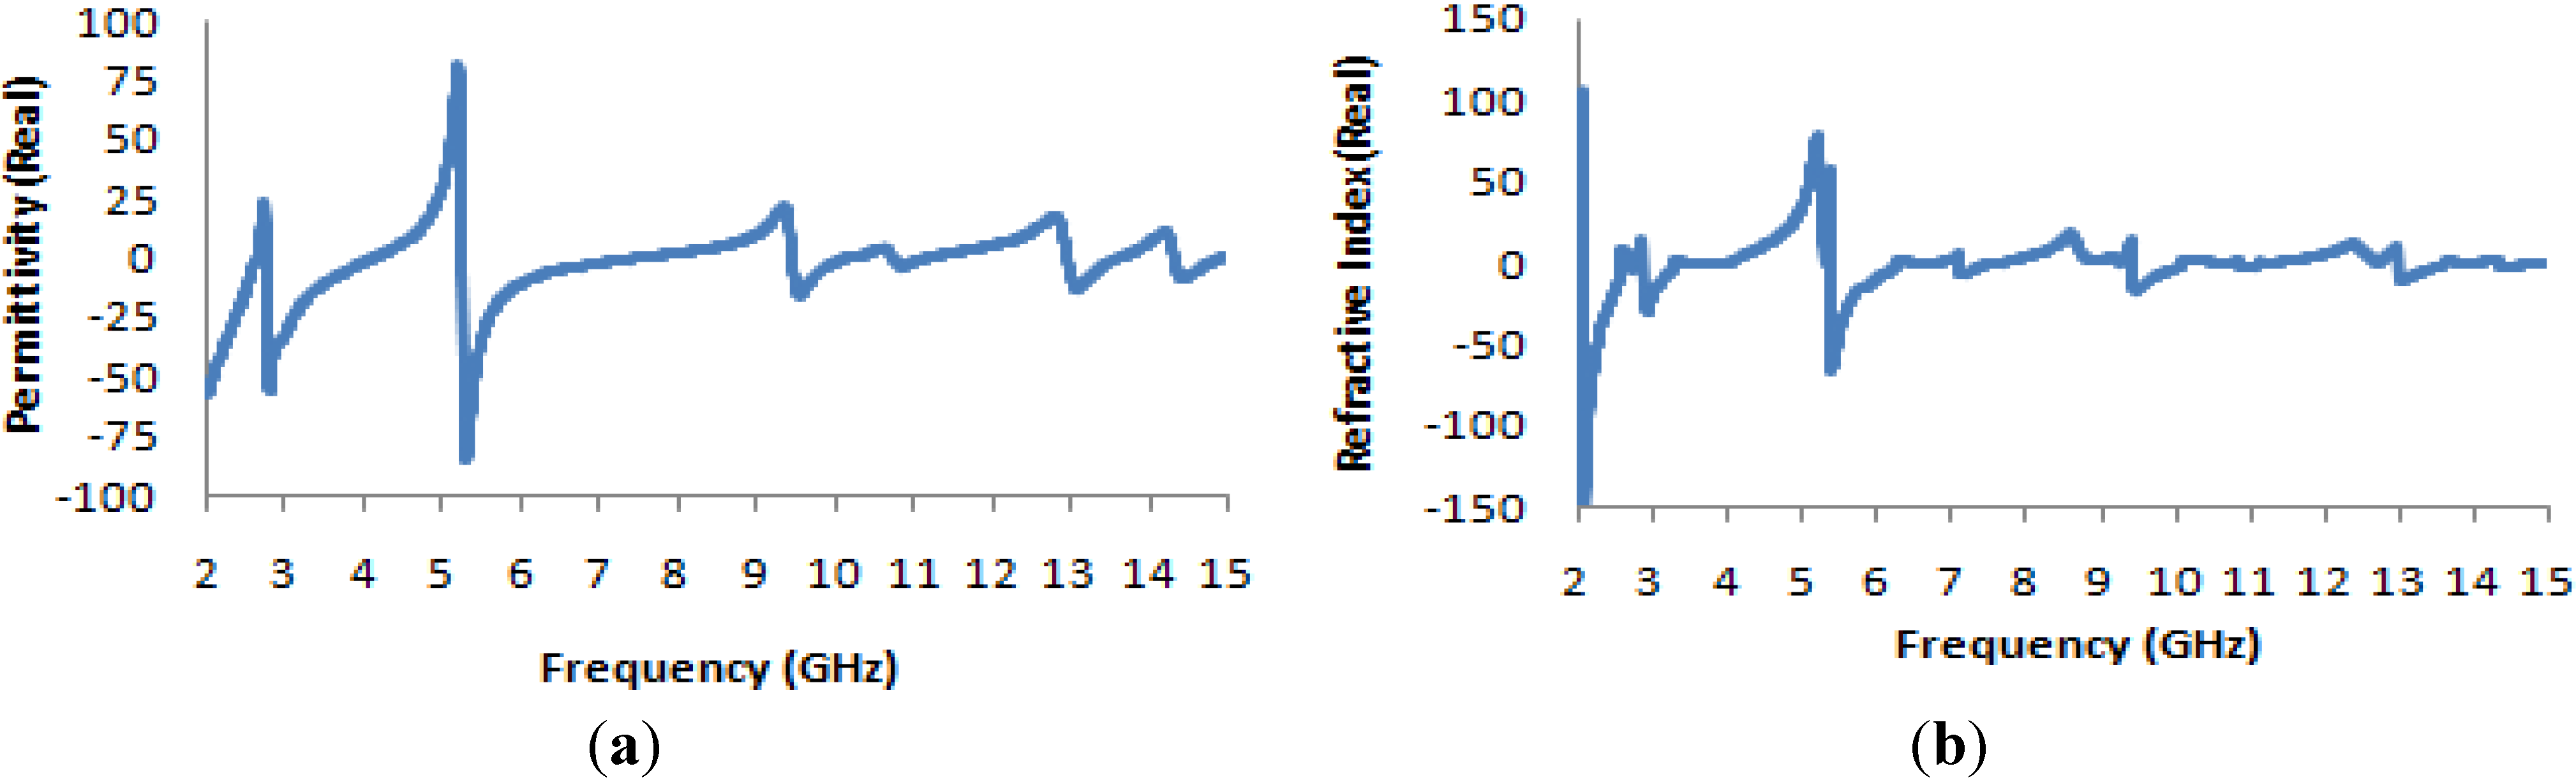
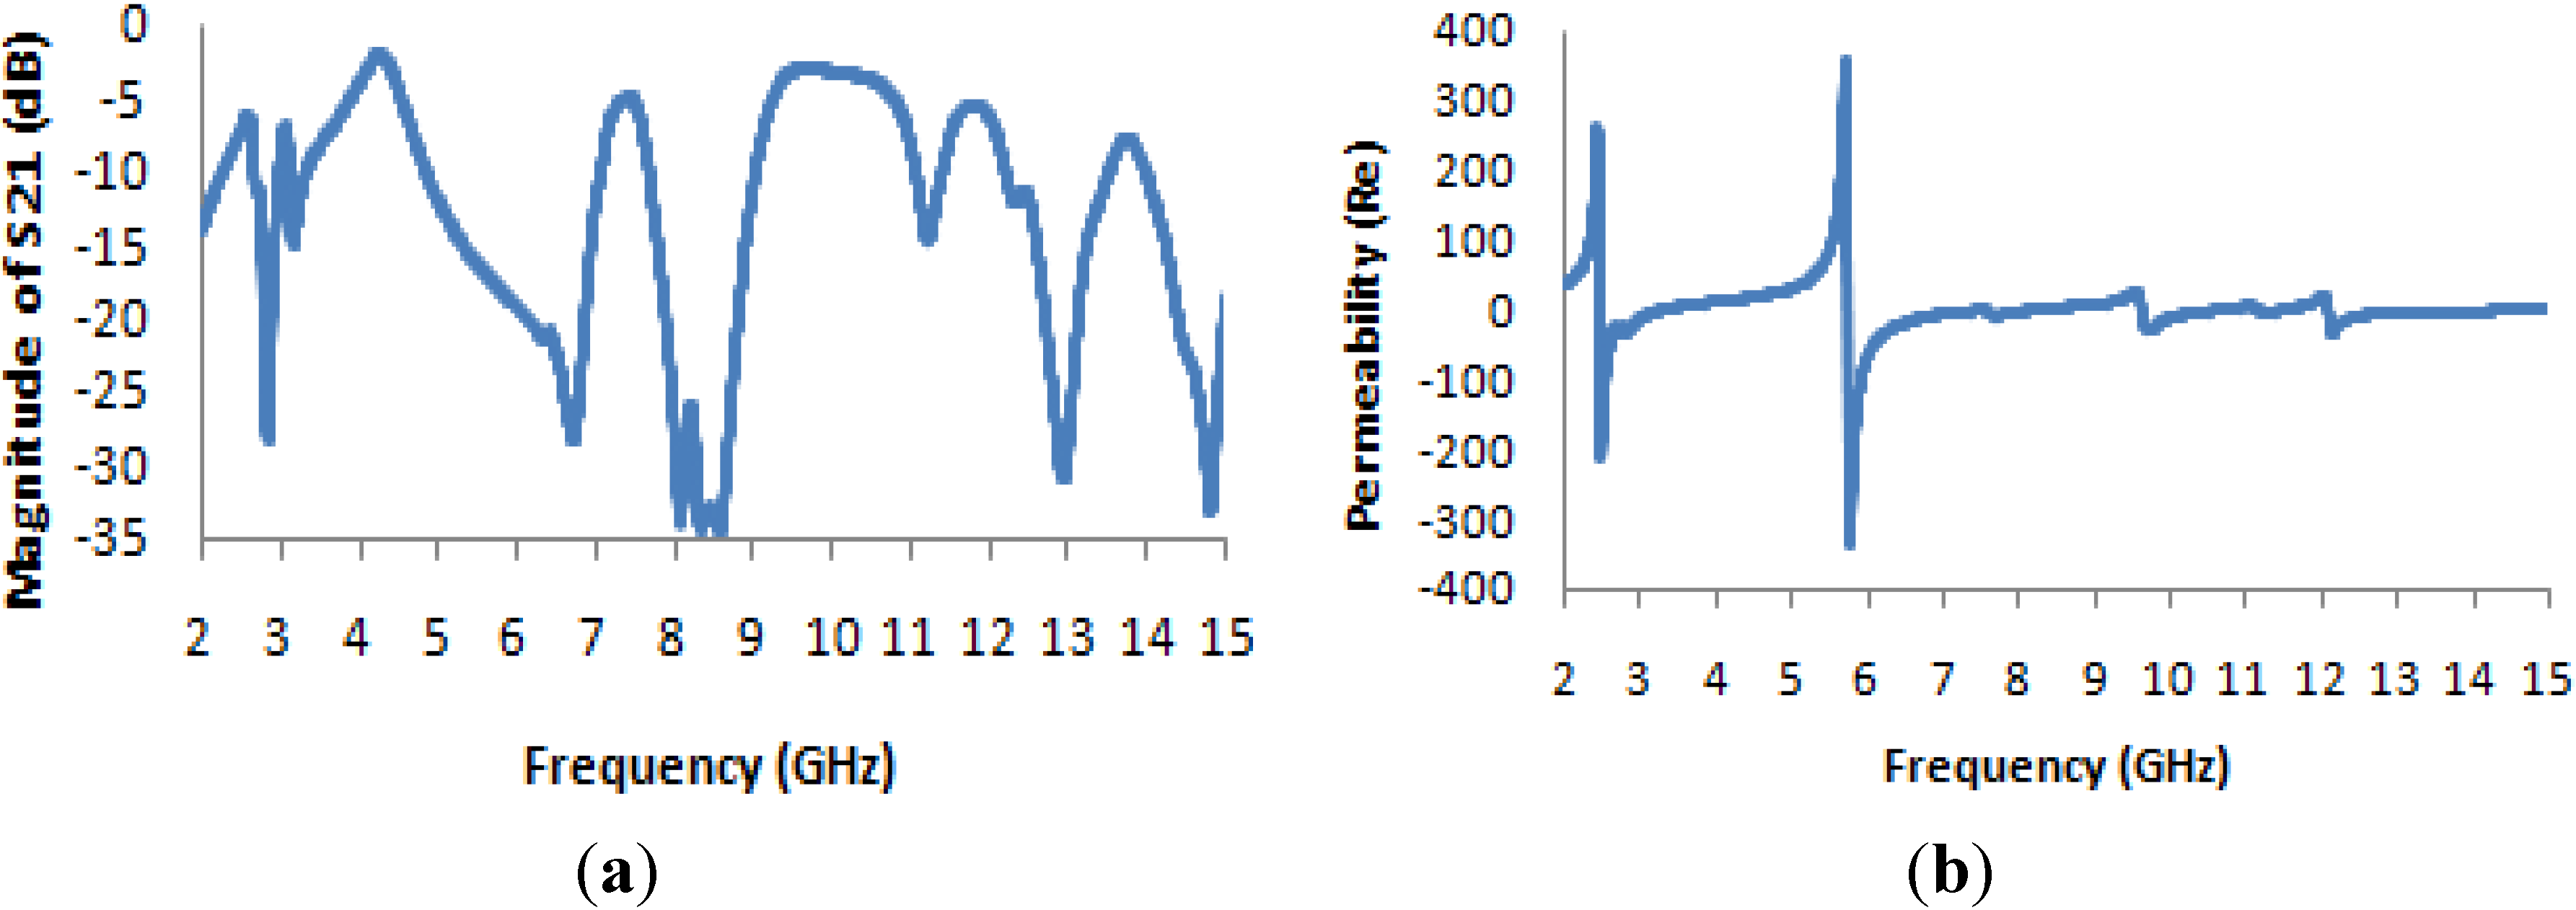
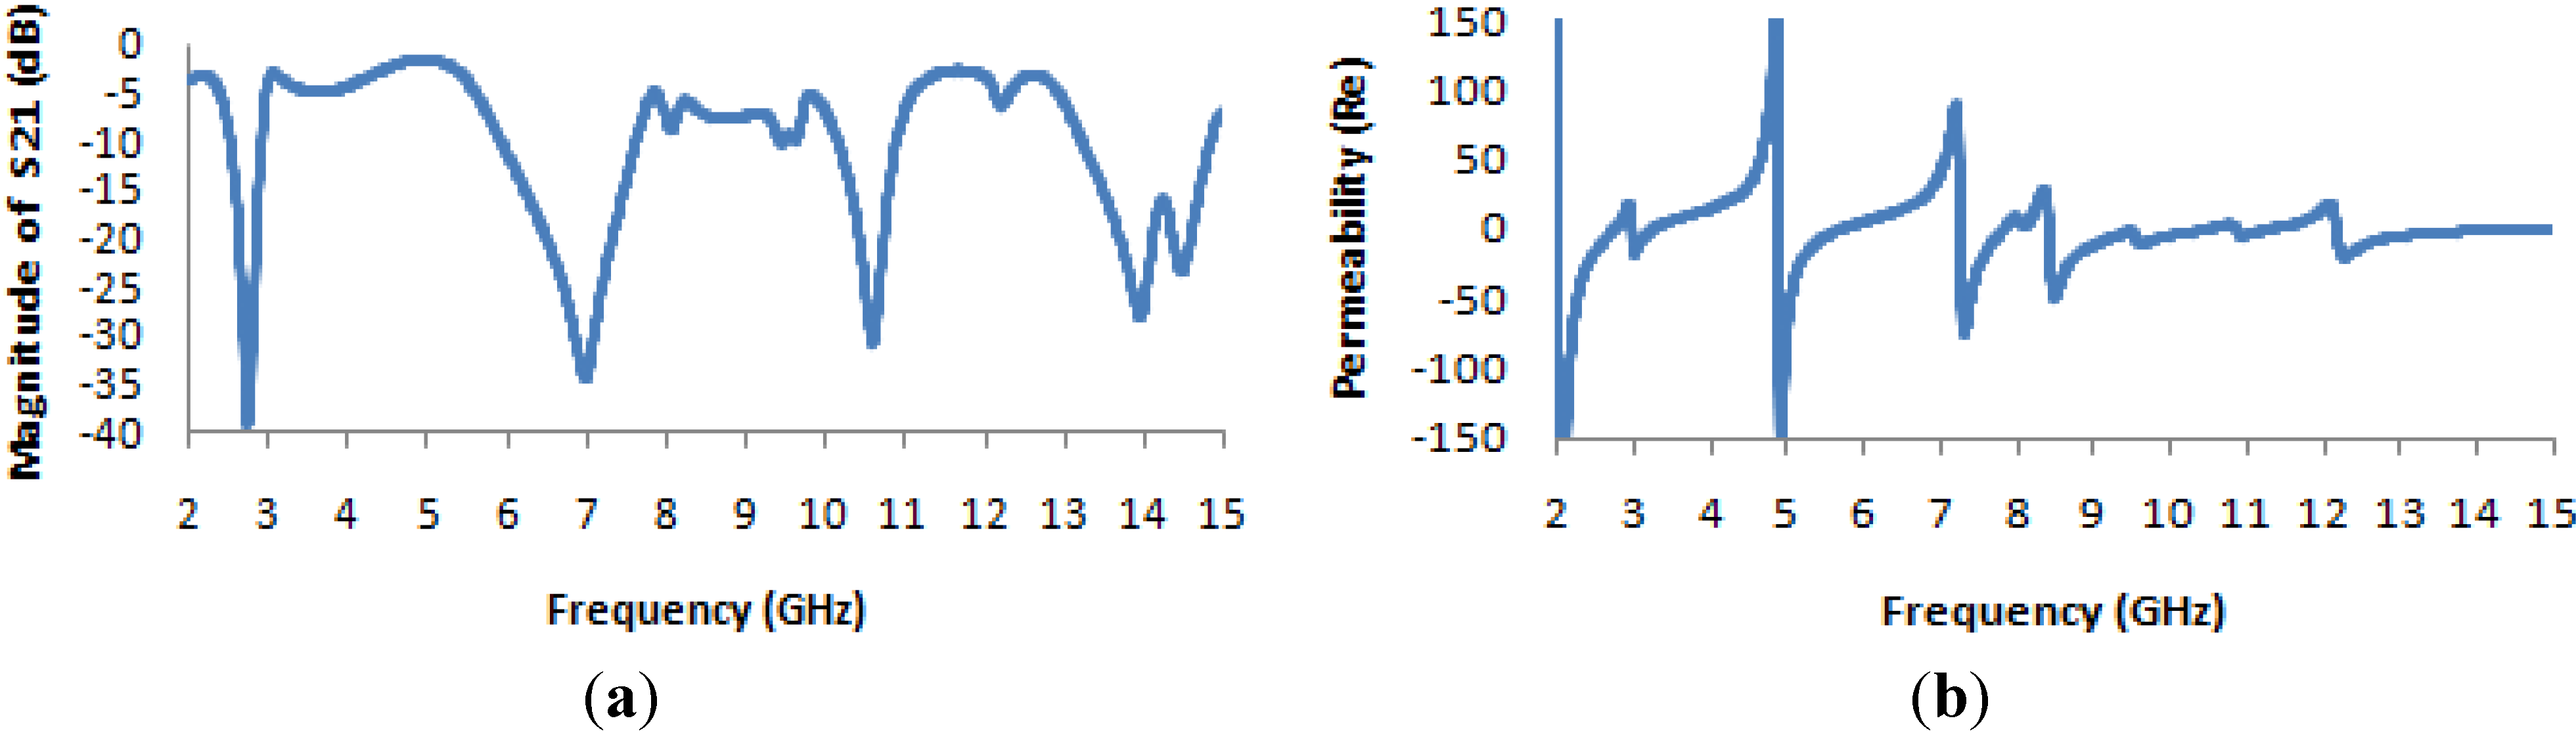
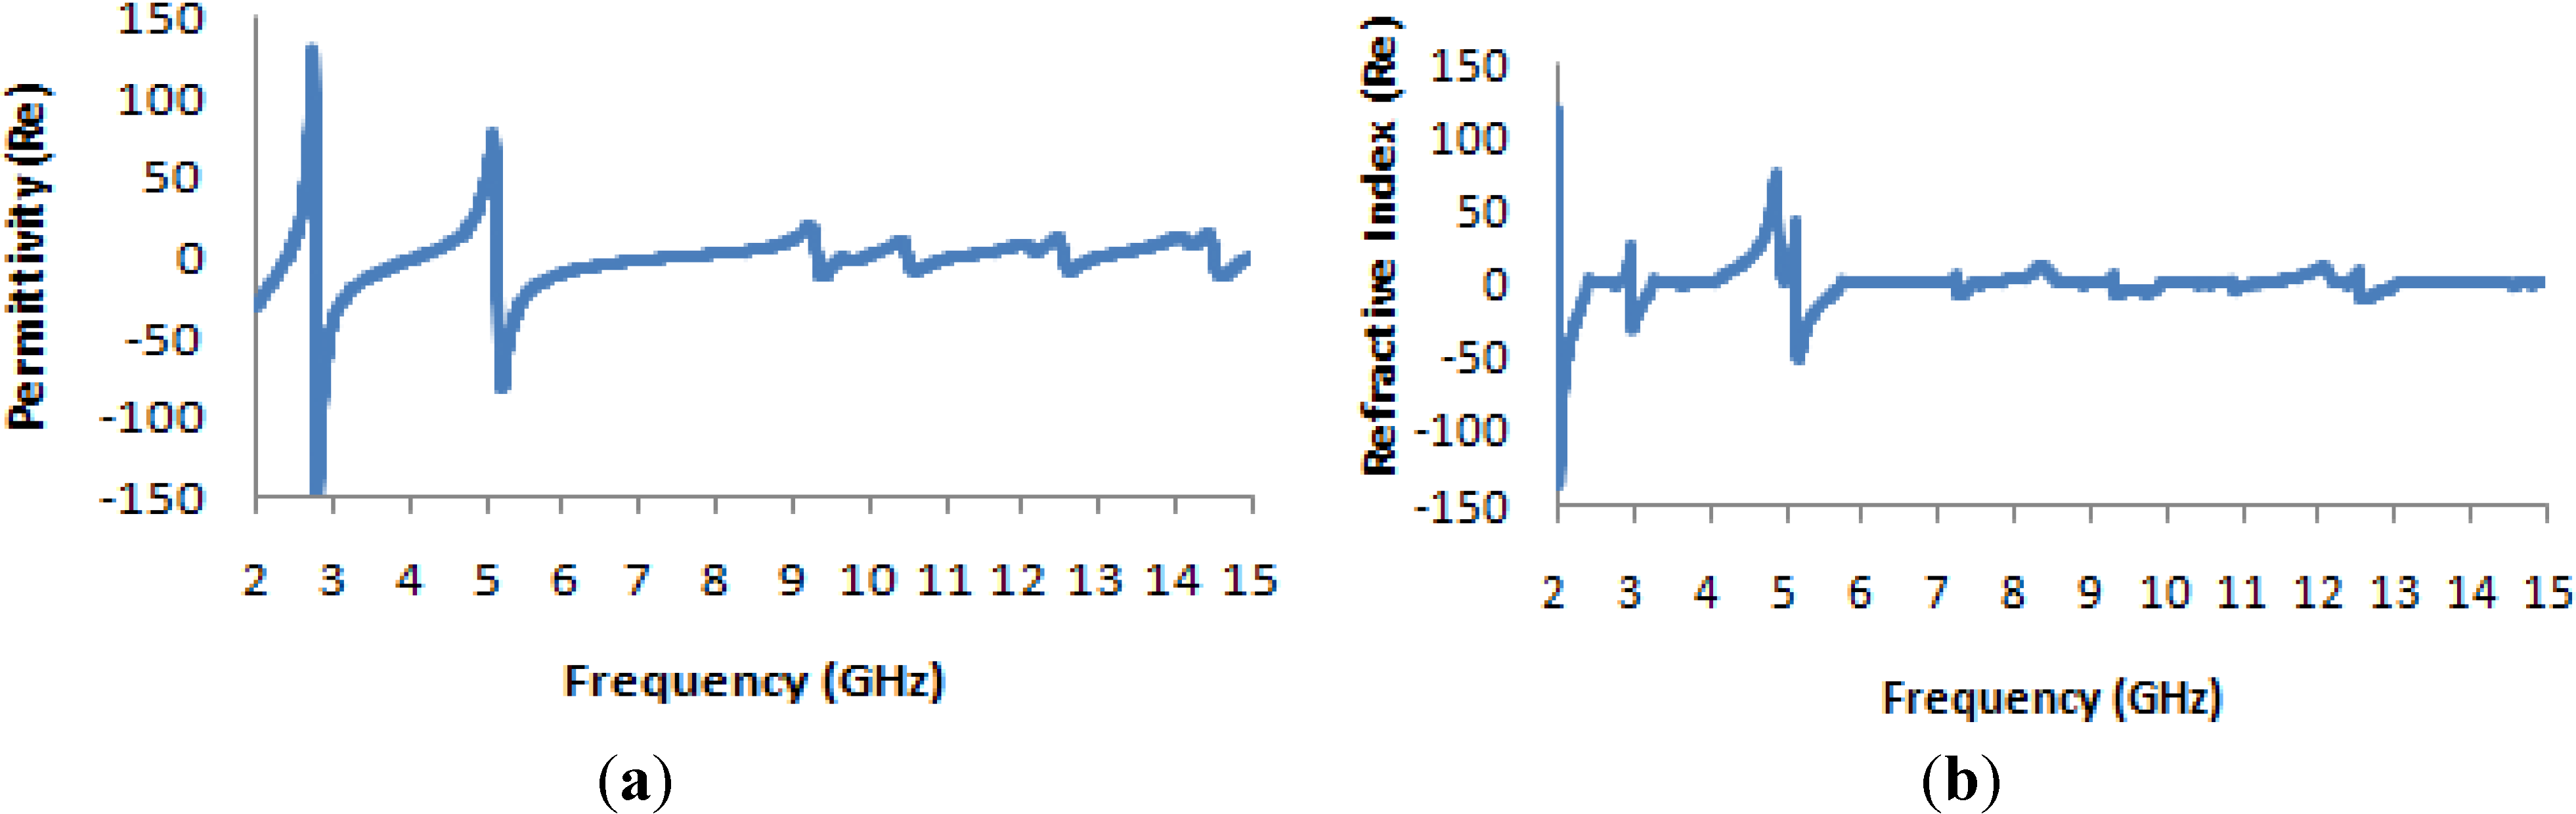
| 2.74 | −35.6 | −0.87 | −5.7 |
| 7.122 | −1.4 | −3.2 | −7 |
| 10.855 | −3.3 | −0.35 | −1.9 |
| 14.337 | −1.9 | −0.84 | −2.64 |

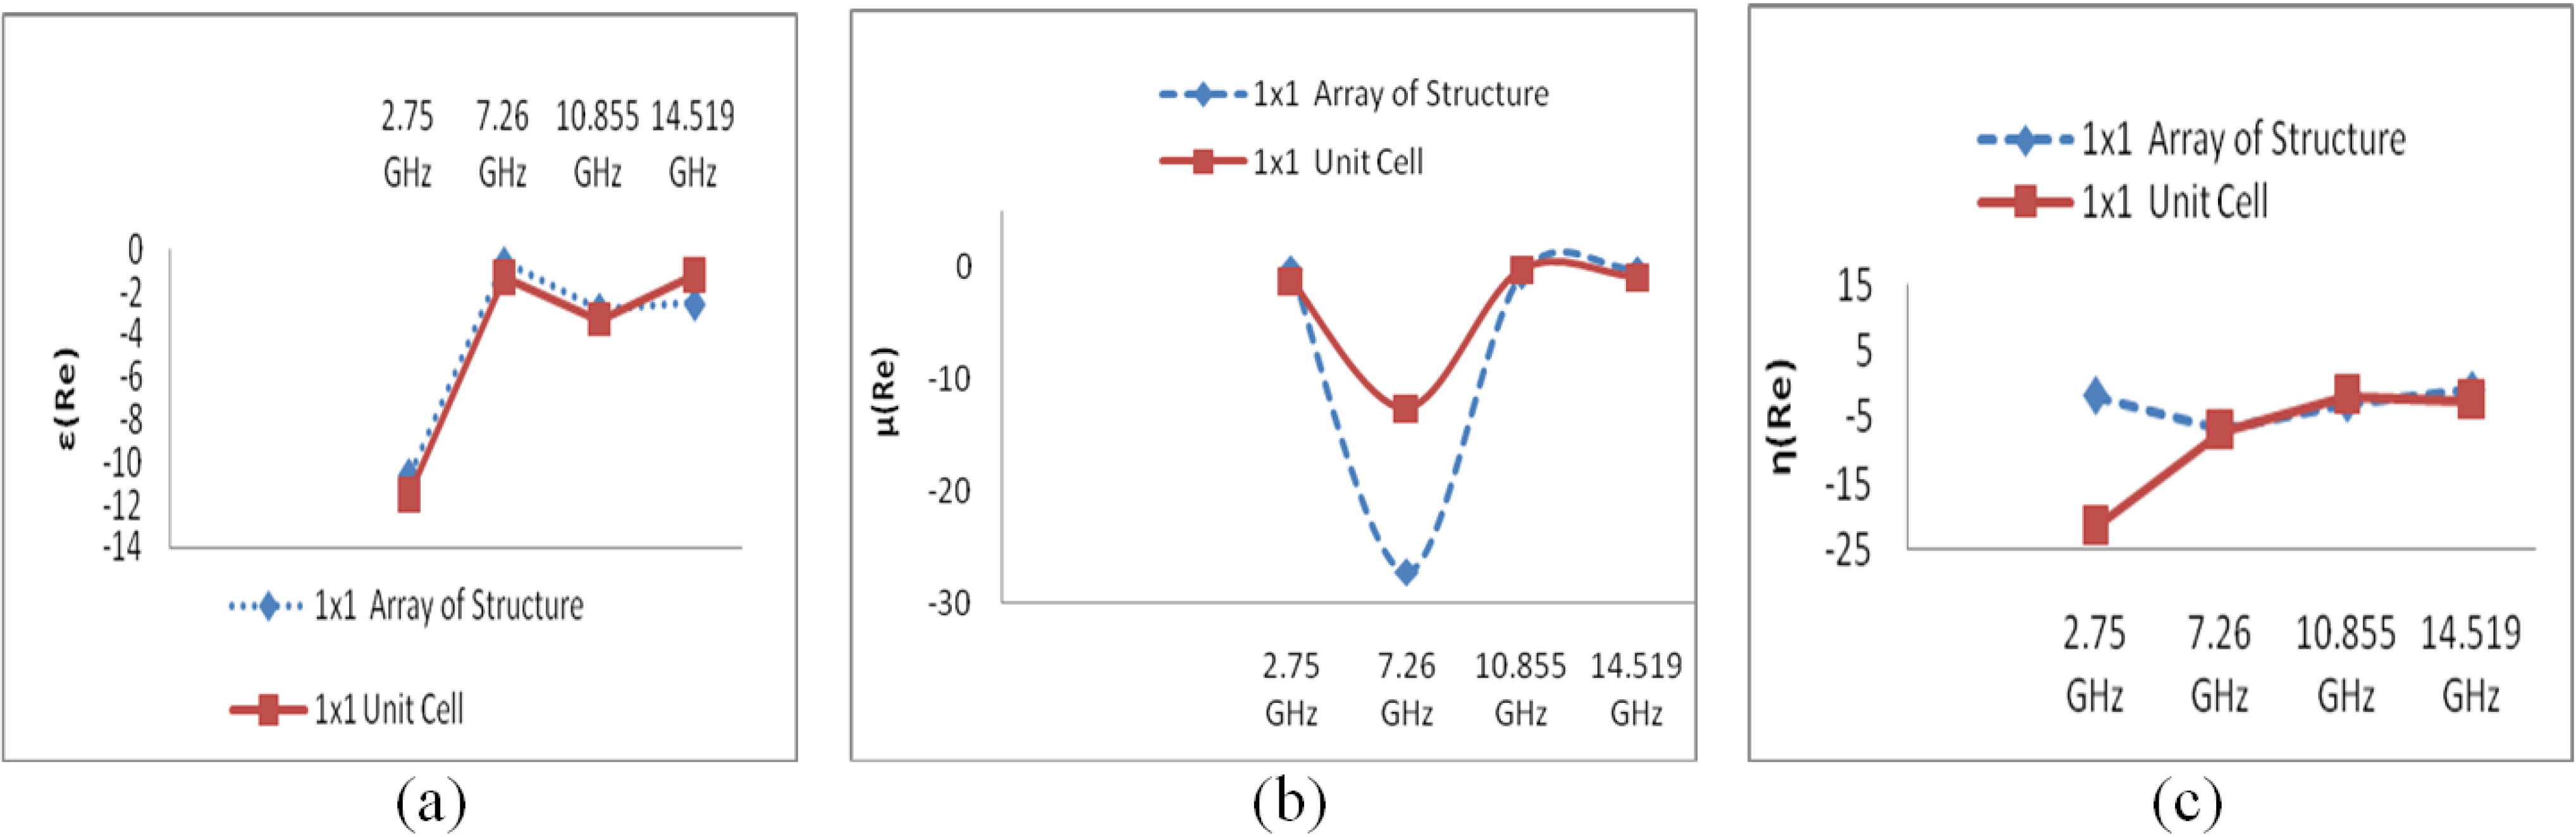
4.1. Design and Analysis of a 1 × 1 Array of the Unit Structure

| Frequencies (GHz) | Value of ε | Value of μ | Value of η |
|---|---|---|---|
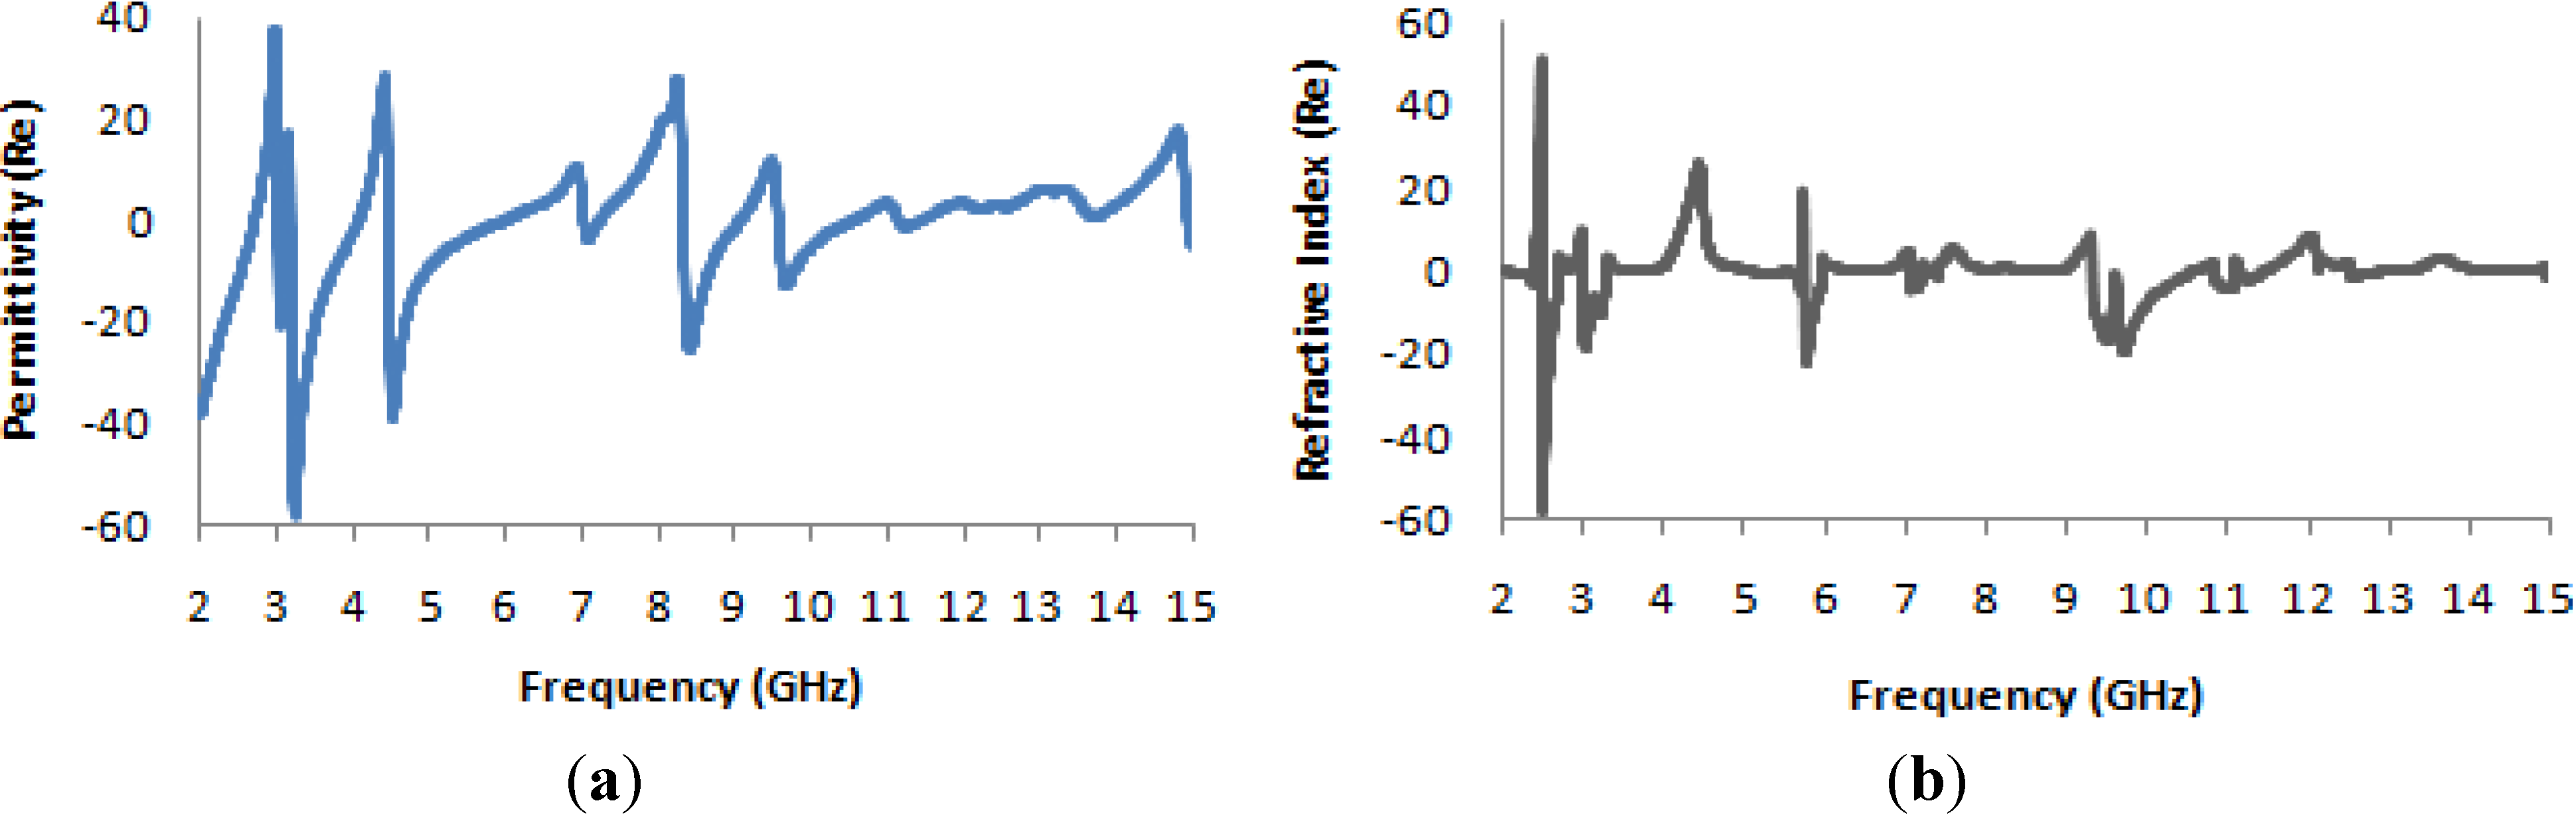
| 2.75 | −10.64 | −0.21 | −1.8 |
| 7.26 | −0.60 | −27.2 | −6.73 |
| 10.855 | −2.80 | −0.67 | −2.88 |
| 14.519 | −2.55 | −0.14 | −0.88 |
4.2. Design and Analysis of a 1 × 1 Unit Cell

| Frequencies (GHz) | Value of ε | Value of μ | Value of η |
|---|---|---|---|
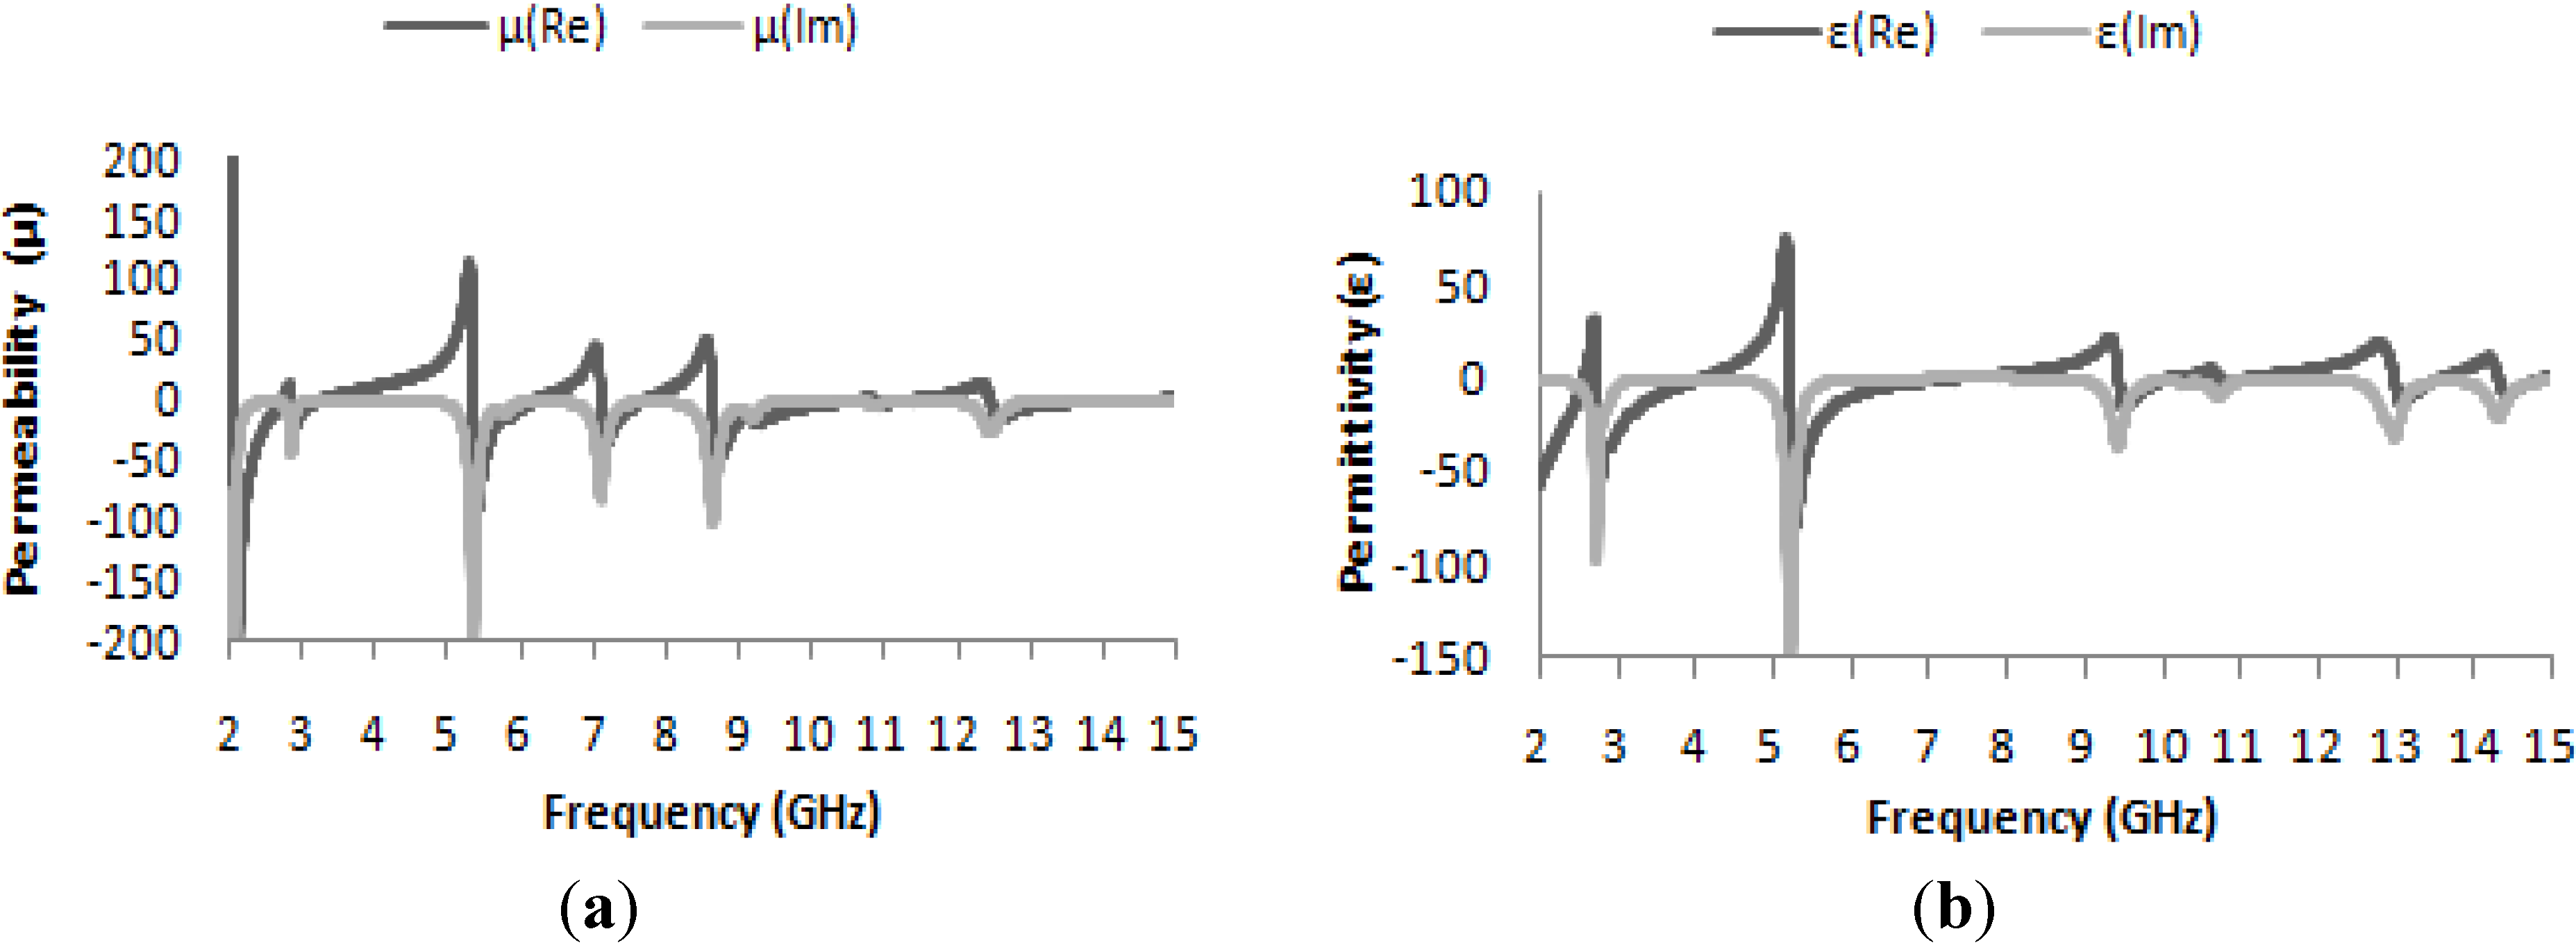
| 2.74 | −11.51 | −1.19 | −21.64 |
| 7.135 | −1.32 | −12.60 | −7.17 |
| 10.855 | −3.27 | −0.19 | −1.78 |
| 14.337 | −1.17 | −0.85 | −2.58 |
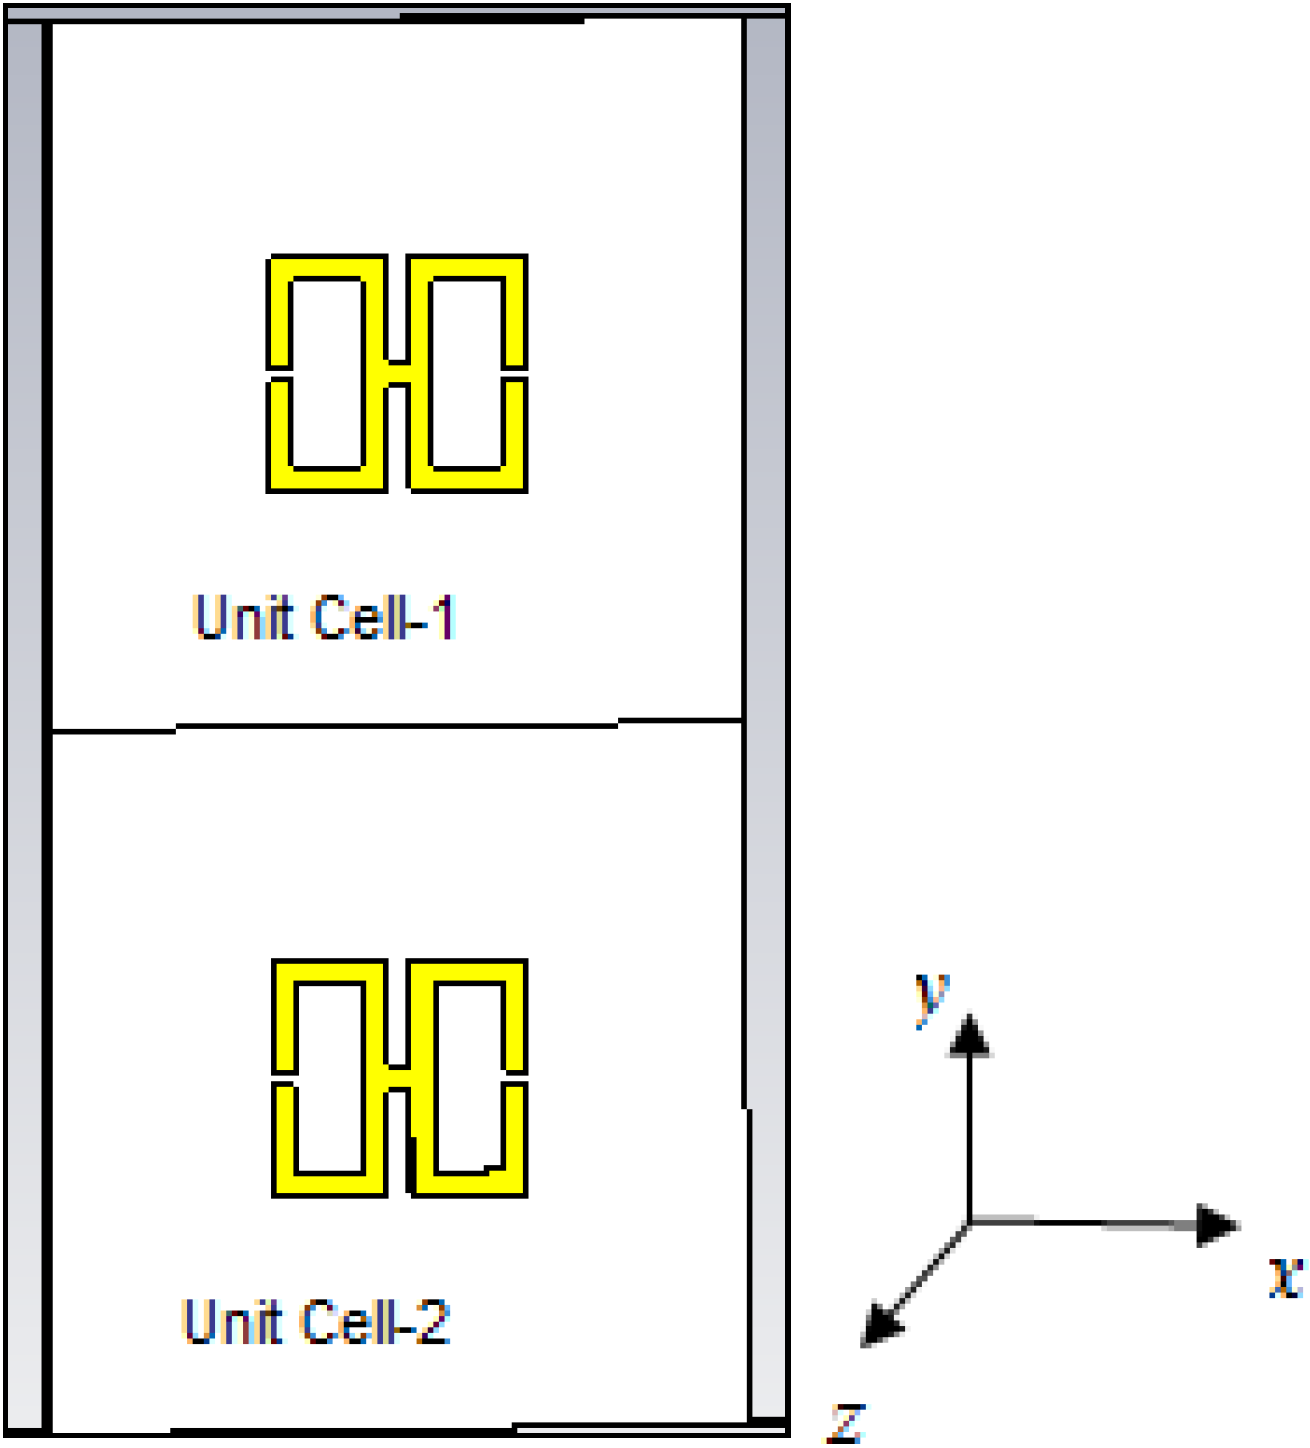
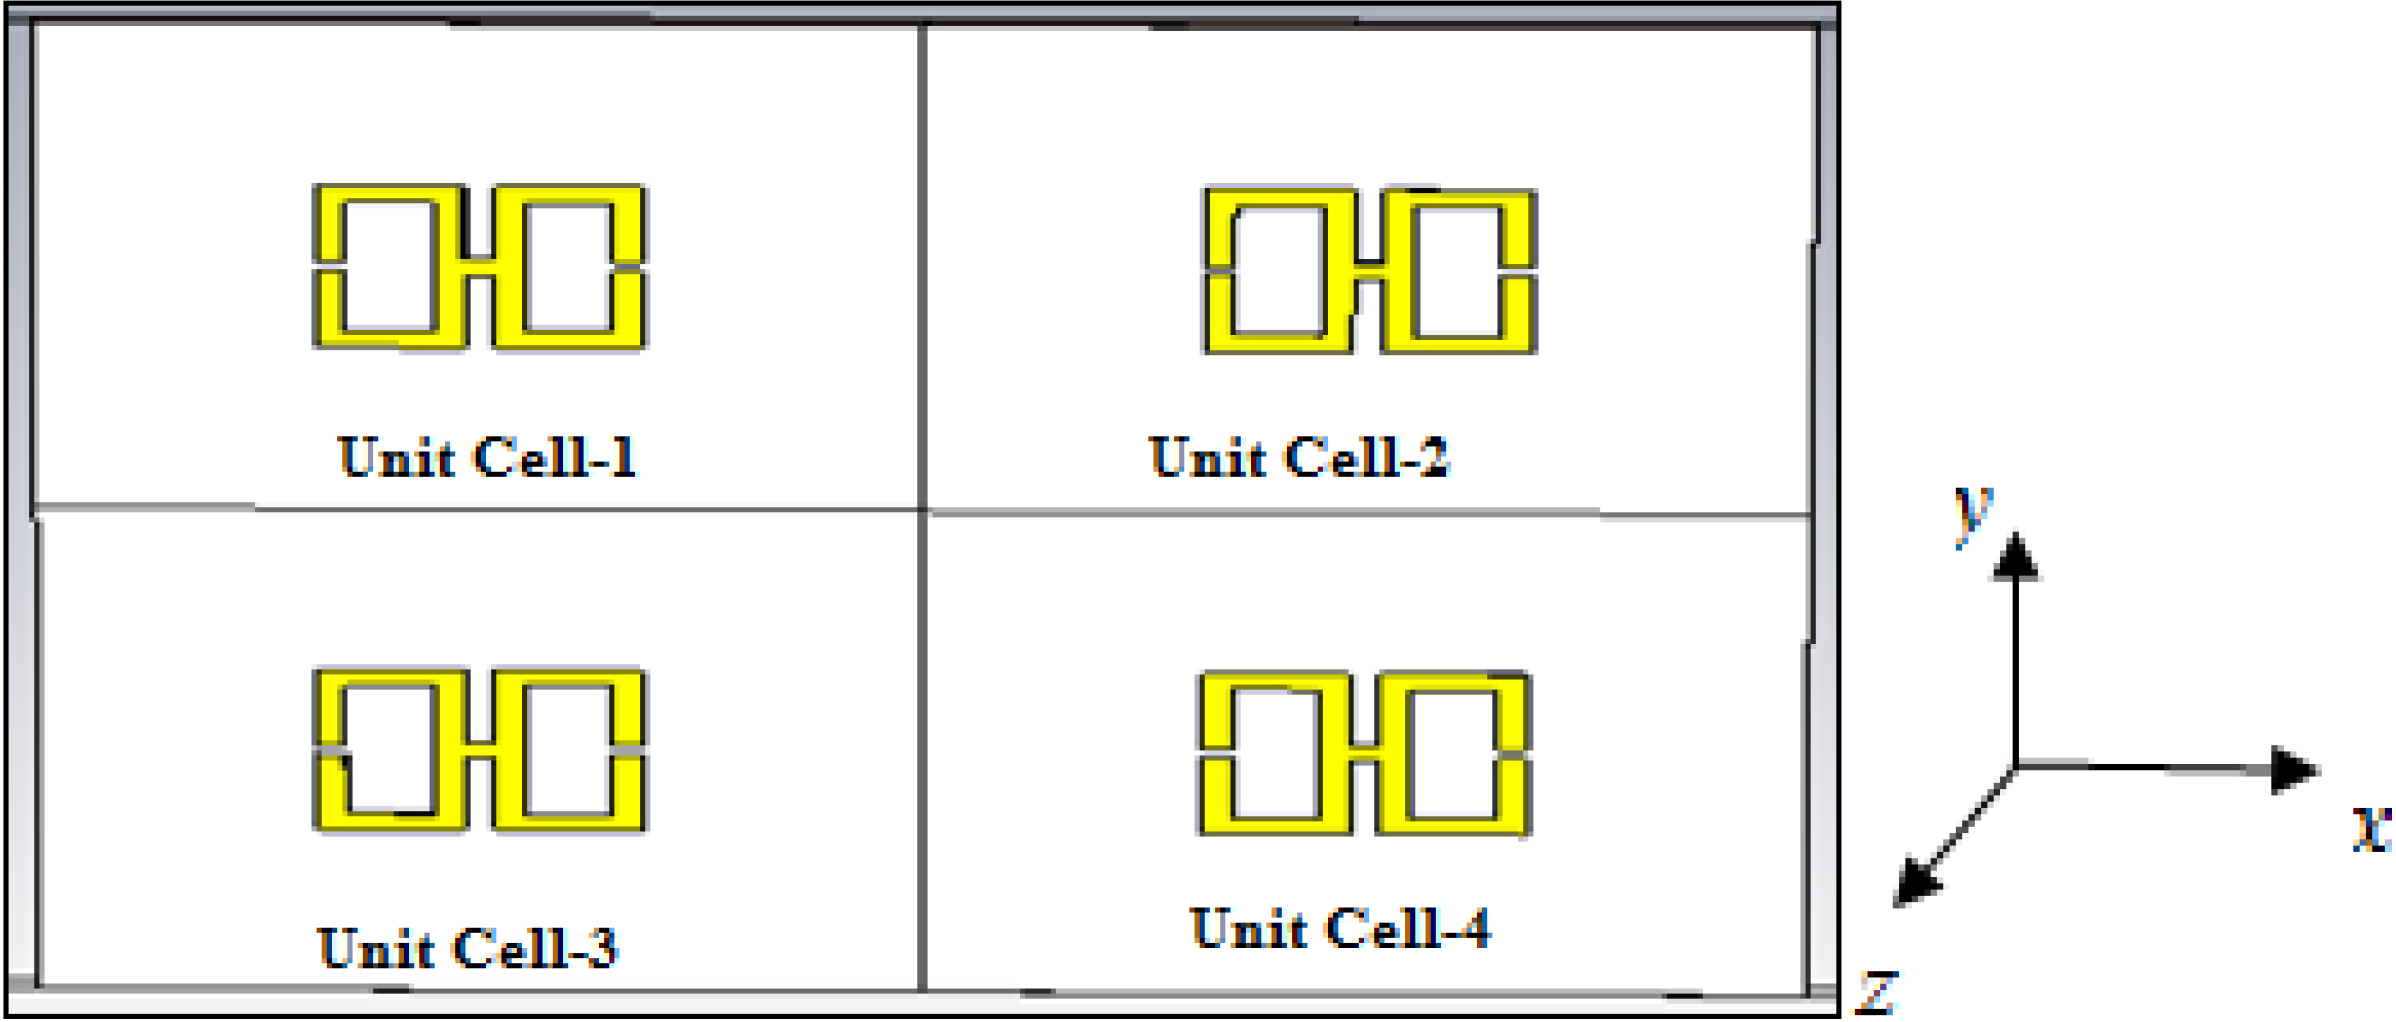
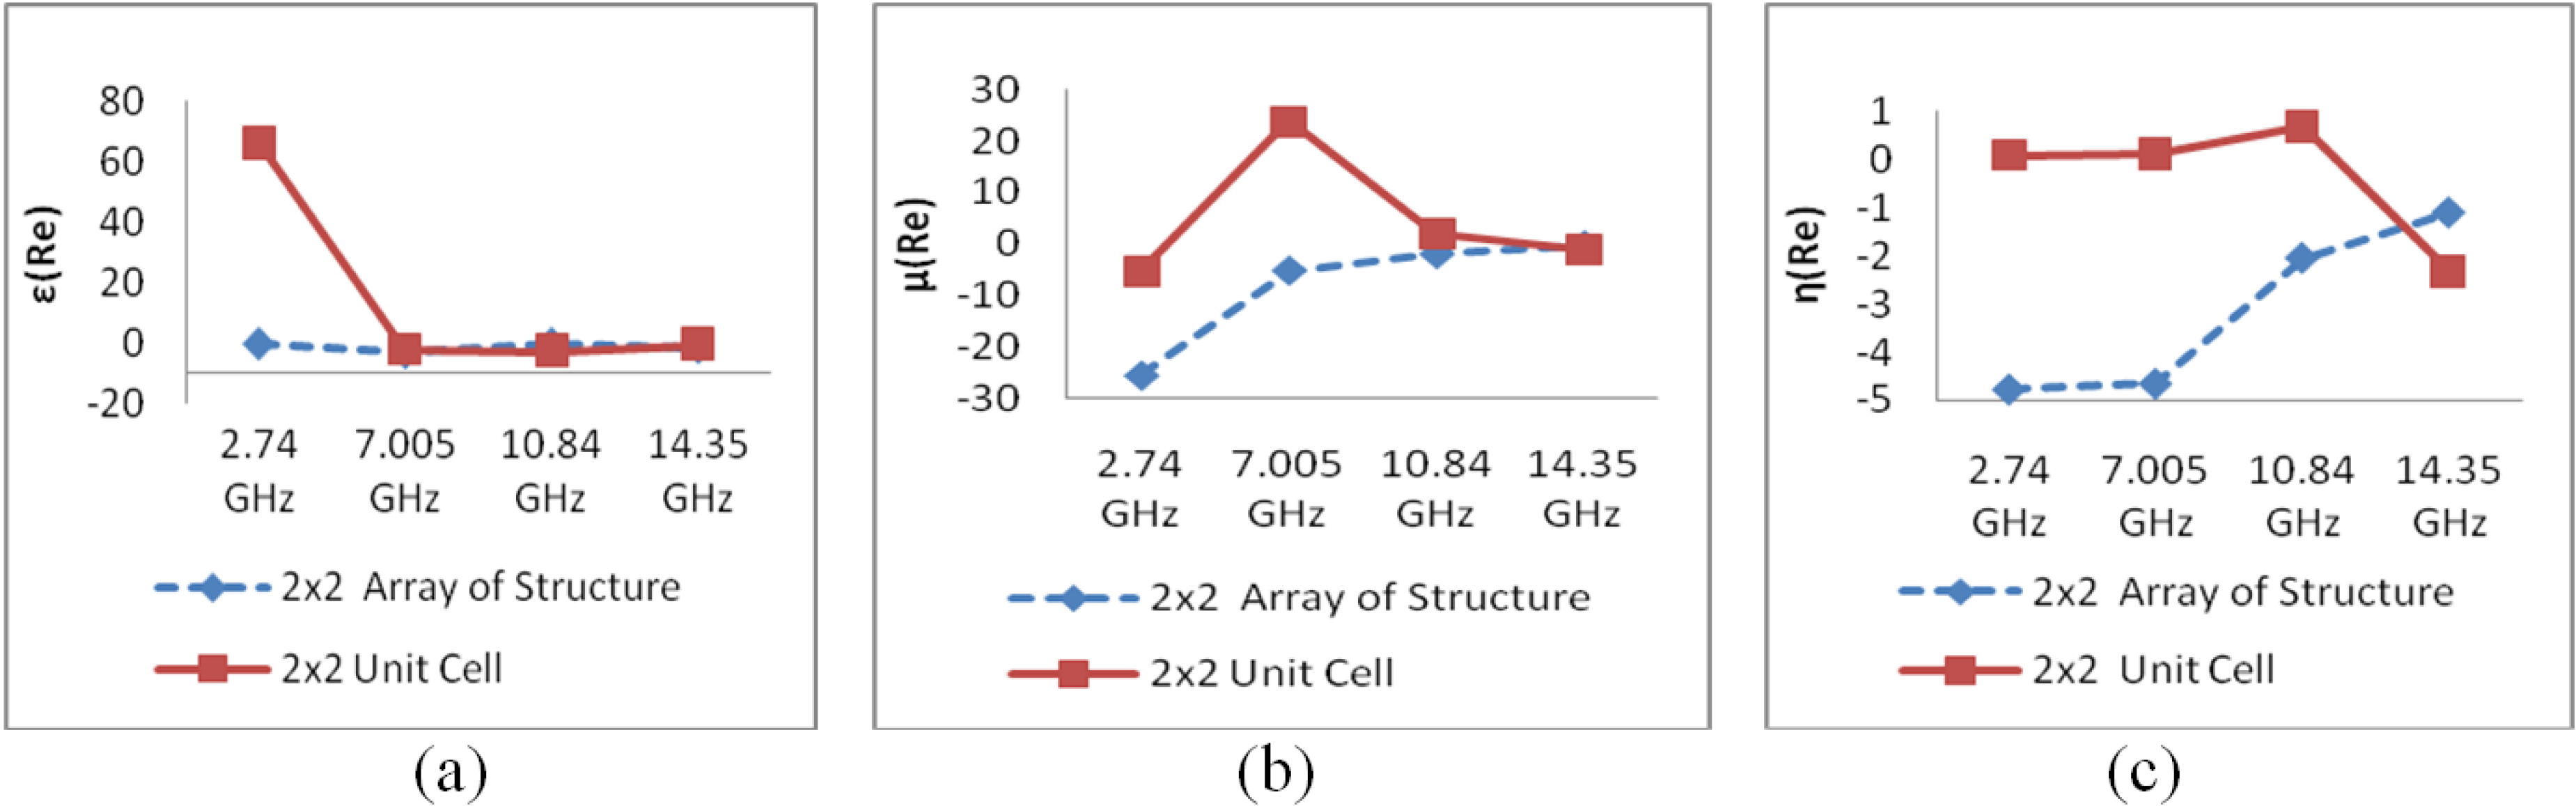
4.3. Design and Analysis of a 2 × 2 Array of the Unit Structure


| Frequencies (GHz) | Value of ε | Value of μ | Value of η |
|---|---|---|---|
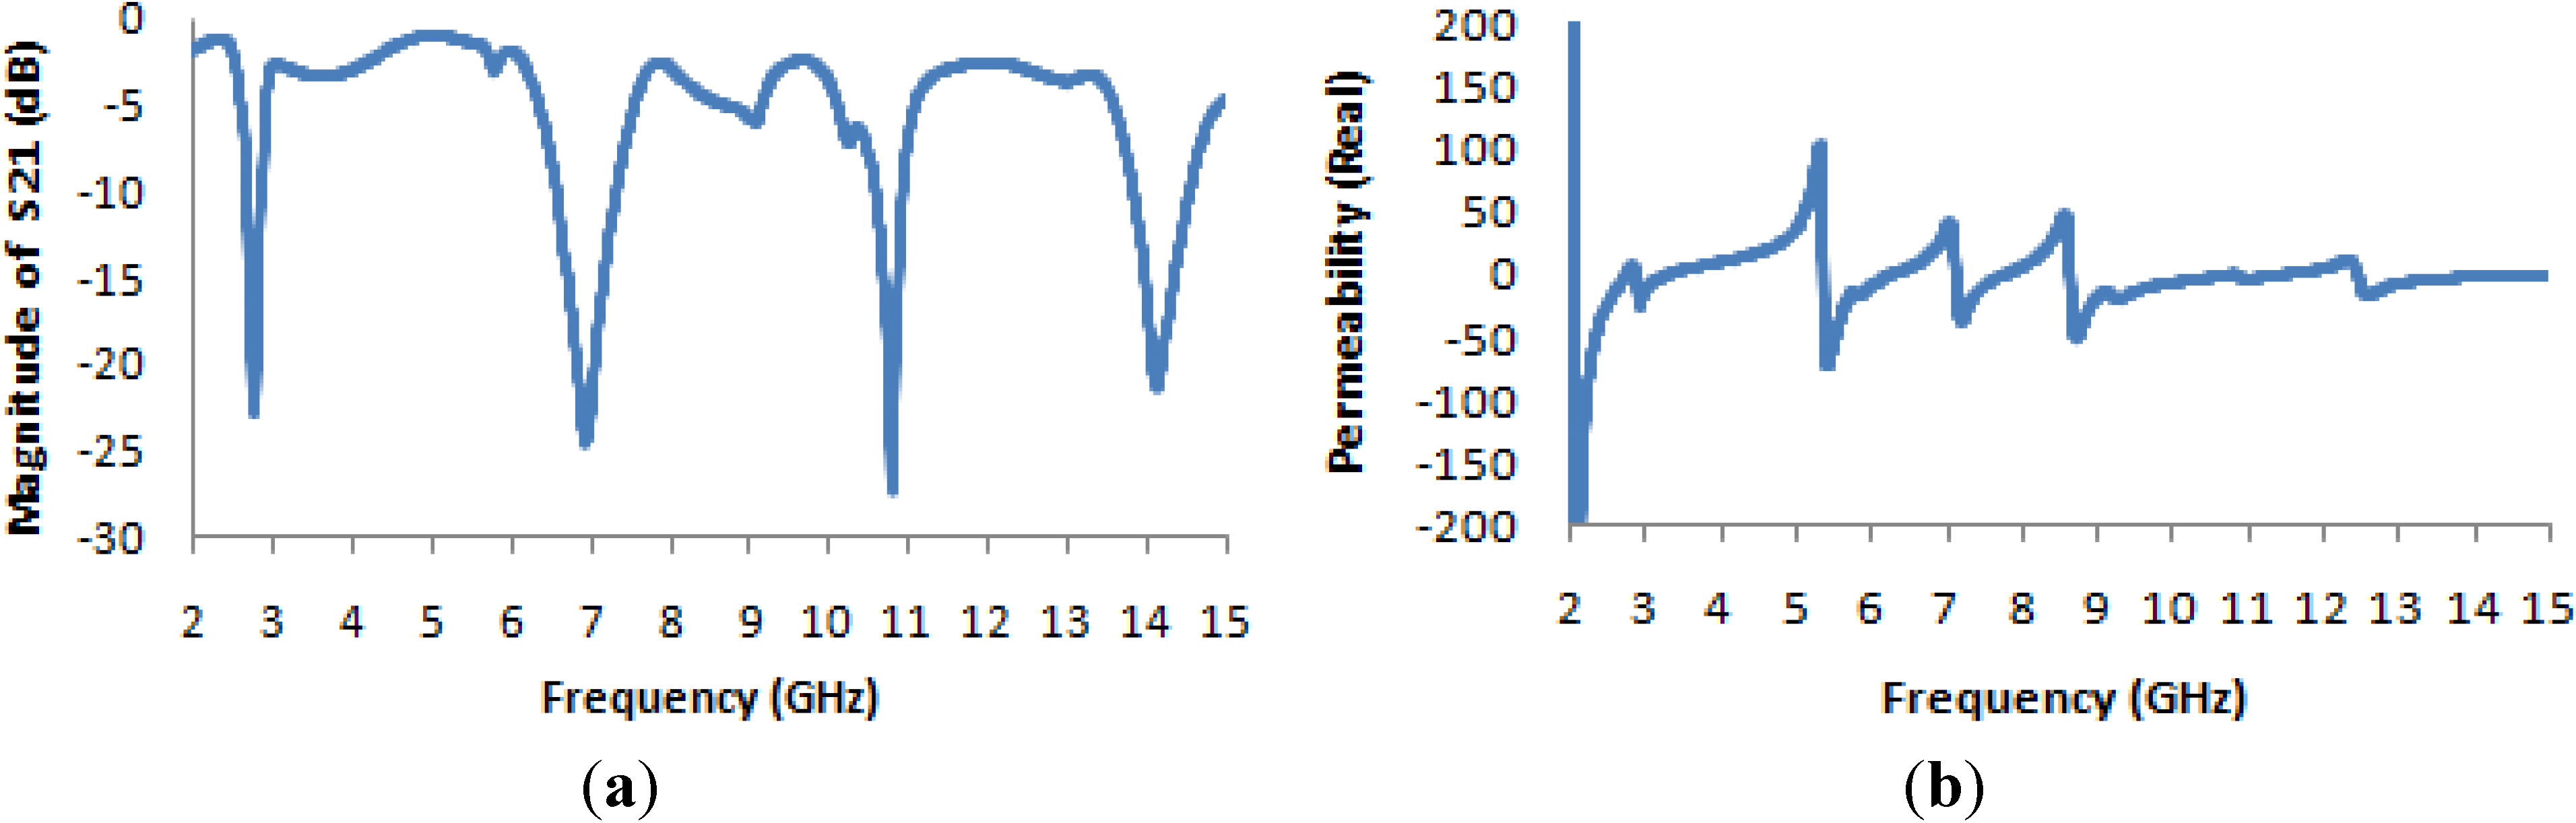
| 2.70 | −0.23 | −25.47 | −4.76 |
| 7.057 | −3.074 | −5.16 | −4.64 |
| 10.5 | −1.12 | −3.65 | −2.04 |
| 14.95 | −1.37 | −0.28 | −1.10 |
4.4. Design and Analysis of a 2 × 2 the Unit Cell
| Frequencies (GHz) | Value of ε | Value of μ | Value of η |
|---|---|---|---|
| 2.74 | 66.52 | −5.42 | 0.100 |
| 7.005 | −2.165 | 23.85 | 0.13 |
| 10.84 | −2.64 | 2.08 | 0.70 |
| 14.35 | −0.46 | −1.12 | −2.34 |
5. Comparative Analyses of the Configurations and Optimization Decisions
6. Conclusions
Author Contributions
Conflicts of Interest
References
- Veselago, V.G. The electrodynamics of substances with simultaneously negative values of ε and μ. Sov. Phys. Uspekhi 1968, 10, 509–514. [Google Scholar] [CrossRef]
- Smith, D.R.; Padilla, W.J.; Vier, D.C.; Nemat-Nasser, S.C.; Schultz, S. Composite medium with simultaneously negative permeability and permittivity. Phys. Rev. Lett. 2000, 84, 4184–4187. [Google Scholar] [CrossRef]
- Faruque, M.R.I.; Islam, M.T.; Misran, N. Design analysis of new metamaterial for EM absorption reduction. Prog. Electromagn. Res. 2012, 124, 119–135. [Google Scholar] [CrossRef]
- Faruque, M.R.I.; Islam, M.T.; Misran, N. Electromagnetic (EM) absorption reduction in a muscle cube with metamaterial attachment. Med. Eng. Phys. 2011, 33, 646–652. [Google Scholar] [CrossRef]
- Faruque, M.R.I.; Islam, M.T.; Misran, N. Evaluation of EM absorption in human head with metamaterial attachment. Appl. Comput. Electromagn. Soc. J. 2010, 25, 1097–1107. [Google Scholar]
- Islam, M.T.; Faruque, M.R.I.; Misran, N. Study of specific absorption rate (SAR) in the human head by metamaterial attachment. IEICE Electron. Express 2010, 7, 240–246. [Google Scholar] [CrossRef]
- Li, L.; Li, Y.; Yeo, T.S.; Mosig, J.R.; Martin, O.J.F. A broadband and high-gain metamaterial microstrip antenna. Appl. Phys. Lett. 2010, 96, 164101:1–164101:3. [Google Scholar]
- Wu, B.-I.; Wang, W.; Pacheco, J.; Chen, X.; Grzegorczyk, T.; Kong, J.A. A study of using metamaterials as antenna substrate to enhance gain. Prog. Electromagn. Res. 2005, 51, 295–328. [Google Scholar] [CrossRef]
- Yang, Y.; Singh, R.; Zhang, W. Anomalous terahertz transmission in bow-tie plasmonic antenna apertures. Opt. Lett. 2011, 36, 2901–2903. [Google Scholar] [CrossRef]
- Schurig, D.; Mock, J.J.; Justice, B.J.; Cummer, S.A.; Pendry, J.B.; Starr, A.F.; Smith, D.R. Metamaterial Electromagnetic Cloak at Microwave Frequencies. Science 2006, 314, 977–980. [Google Scholar] [CrossRef]
- Landy, N.; Smith, D.R. A full-parameter unidirectional metamaterial cloak for microwaves. Nat. Mater. 2013, 12, 25–28. [Google Scholar] [CrossRef]
- Cong, L.; Cao, W.; Zhang, X.; Tian, Z.; Gu, J.; Singh, R.; Han, J.; Zhang, W. A perfect metamaterial polarization rotator. Appl. Phys. Lett. 2013, 103, 171107:1–171107:4. [Google Scholar]
- Al-Naib, I.; Jansen, C.; Singh, R.; Walther, M.; Koch, M. Novel THz metamaterial designs: From near- and far-field coupling to high-q resonances. IEEE Trans. Terahertz Sci. Technol. 2013, 3, 772–782. [Google Scholar] [CrossRef]
- Singh, R.; Al-Naib, I.; Cao, W.; Rockstuhl, C.; Koch, M.; Zhang, W. The fano resonance in symmetry broken terahertz metamaterials. IEEE Trans. Terahertz Sci. Technol. 2013, 3, 1–7. [Google Scholar] [CrossRef]
- Chowdhury, D.R.; Azad, A.K.; Zhang, W.; Singh, R. Near field coupling in passive and active terahertz metamaterial devices. IEEE Trans. Terahertz Sci. Technol. 2013, 3, 783–789. [Google Scholar] [CrossRef]
- Chowdhury, D.R.; Singh, R.; Reiten, M.; Zhou, J.; Taylor, A.J.; O’Hara, J.F. Tailored resonator coupling for modifying the terahertz metamaterial response. Opt. Express 2011, 19, 10679–10685. [Google Scholar] [CrossRef]
- Chowdhury, D.R.; Singh, R.; O’Hara, J.F.; Chen, H.T.; Taylor, A.J.; Azad, A.K. Dynamically reconfigurable terahertz metamaterial through photo-doped semiconductor. Appl. Phys. Lett. 2011, 99, 231101:1–231101:3. [Google Scholar]
- Cao, W.; Singh, R.; Zhang, C.; Han, J.; Tonouchi, M.; Zhang, W. Plasmon-induced transparency in metamaterials: Active near field coupling between bright superconducting and dark metallic mode resonators. Appl. Phys. Lett. 2011, 103, 101106:1–101106:5. [Google Scholar]
- Gu, J.; Singh, R.; Azad, A.K.; Han, J.; Taylor, A.J.; O’Hara, J.F.; Zhang, W. An active hybrid plasmonic metamaterial. Opt. Mater. Express 2012, 2, 31–37. [Google Scholar] [CrossRef]
- Menzel, C.; Singh, R.; Rockstuhl, C.; Zhang, W.; Lederer, F. Effective properties of terahertz double split-ring resonators at oblique incidence. J. Opt. Soc. Am. B 2009, 26, B143–B147. [Google Scholar] [CrossRef]
- Ullah, M.H.; Islam, M.T.; Faruque, M.R.I. A Near-Zero Refractive Index Meta-Surface Structure for Antenna Performance Improvement. Materials 2013, 6, 5058–5068. [Google Scholar] [CrossRef]
- Islam, M.T.; Ullah, M.H.; Singh, M.J.; Faruque, M.R.I. A new metasurface superstrate structure for antenna performance enhancement. Materials 2013, 6, 3226–3240. [Google Scholar] [CrossRef]
- Shen, X.; Cui, T.J.; Zhao, J.; Ma, H.F.; Jiang, W.X.; Li, H. Polarization-independent wide-angle triple-band metamaterial absorber. Opt. Express 2011, 19, 9401–9407. [Google Scholar]
- Benosman, H.; Hacene, N.B. Design and simulation of double “S” shaped metamaterial. Int. J. Comput. Sci. Issues 2012, 9, 534–537. [Google Scholar]
- Chen, H.; Ran, L.; Huangfu, J.; Zhang, X. Left-handed materials composed of only S-shaped resonators. Phys. Rev. E 2004, 70, 940–942. [Google Scholar]
- Mallik, A.; Kundu, A.S.; Goni, M.O. Design of a novel two-rectangular U-shaped double negative metamaterial. In Proceedings of the International Conference on Informatics, Electronics & Vision (ICIEV), Dhaka, Bangladesh, 17–18 May 2013.
- Ekmekci, E.; Sayan, G.T. Investigation of effective permittivity and permeability for a novel V-shaped metamaterial using S-parameters. In Proceedings of the 5th International Conference on Electrical and Electronics Engineering, Bursa, Turkey, 5–9 December 2007.
- Dhouibi, A.; Burokur, S.N.; Lustrac, A.; Priou, A. Study and analysis of an electric Z-shaped meta-atom. Adv. Electromagn. 2012, 1, 64–70. [Google Scholar]
- IEEE Standard Letter Designations for Radar Frequency Bands, IEEE Standard. 521-2002. Available online: https://standards.ieee.org/findstds/standard/521–2002.html (accessed on 22 March 2014).
- Pendry, J.B.; Holden, A.J.; Robbins, D.J.; Stewart, W.J. Magnetism from conductors and enhanced non-linear phenomena. IEEE Trans. Microw. Theory Tech. 1999, 47, 2075–2084. [Google Scholar] [CrossRef]
- Grover, F.W. Inductance Calculation; Dover Publication, Inc.: New York, NY, USA, 1946. [Google Scholar]
- Clayton, R.P. Inductance: Loop and Partial; Wiley-IEEE Press: Hoboken, NJ, USA, 2009. [Google Scholar]
- Luukkonen, O.; Maslovski, S.I.; Tretyakov, S.A. A Stepwise Nicolson–Ross–Weir-Based Material Parameter Extraction Method. IEEE Antennas Wirel. Propag. Lett. 2011, 10, 3588–3596. [Google Scholar]
- Schilling, J. The quest for zero refractive index. Nat. Photonics 2011, 5, 449–451. [Google Scholar] [CrossRef]
- Enoch, S.; Tayeb, G.; Sabouroux, P.; Guerin, N.; Vincent, P. A Metamaterial for Directive Emission. Phys. Rev. Lett. 2002, 89. [Google Scholar] [CrossRef]
- Alù, A.; Silveirinha, M.G.; Salandrino, A.; Engheta, N. Epsilon-Near-Zero (ENZ) Metamaterials and Electromagnetic Sources: Tailoring the Radiation Phase Pattern. Phys. Rev. B 2007, 75. [Google Scholar] [CrossRef]
© 2014 by the authors; licensee MDPI, Basel, Switzerland. This article is an open access article distributed under the terms and conditions of the Creative Commons Attribution license (http://creativecommons.org/licenses/by/3.0/).
Share and Cite
Islam, S.S.; Faruque, M.R.I.; Islam, M.T. The Design and Analysis of a Novel Split-H-Shaped Metamaterial for Multi-Band Microwave Applications. Materials 2014, 7, 4994-5011. https://doi.org/10.3390/ma7074994
Islam SS, Faruque MRI, Islam MT. The Design and Analysis of a Novel Split-H-Shaped Metamaterial for Multi-Band Microwave Applications. Materials. 2014; 7(7):4994-5011. https://doi.org/10.3390/ma7074994
Chicago/Turabian StyleIslam, Sikder Sunbeam, Mohammad Rashed Iqbal Faruque, and Mohammad Tariqul Islam. 2014. "The Design and Analysis of a Novel Split-H-Shaped Metamaterial for Multi-Band Microwave Applications" Materials 7, no. 7: 4994-5011. https://doi.org/10.3390/ma7074994