Article

Processing and Mechanical Properties of Macro Polyamide Fiber Reinforced Concrete

1
Research and Business Development Center, Kolon Global Corp, Pogok-eup, Cheoin-gu, Yongin-si, Gyeonggi-do 449-815, Korea
2
Department of Civil Engineering, Chungnam National University, 99, Daehak-ro, Yuseong-gu, Daejeon 305-764, Korea
3
Department of Urban Construction Engineering, Incheon National University, 119, Academy-ro, Yeonsu-gu, Incheon 406-772, Korea
4
Expressway and Transportation Research Institute, Korea Expressway Corp. 208-96, Dongbu-daero 922 beon-gil, Dongtan-myeon, Hwaseong-si, Gyeonggi-do 445-810, Korea
*
Author to whom correspondence should be addressed.
These authors contributed equally to this work.
Materials 2014, 7(12), 7634-7652; https://doi.org/10.3390/ma7127634
Submission received: 28 August 2014 / Revised: 20 October 2014 / Accepted: 17 November 2014 / Published: 26 November 2014

Abstract

:
This study developed a macro-sized polyamide (PA) fiber for concrete reinforcement and investigated the influence of the PA fiber on flexural responses in accordance with ASTM standards. PA fibers are advantageous compared to steel fibers that are corrosive and gravitated. The macro-sized PA fiber significantly improved concrete ductility and toughness. Unlike steel fibers, the PA fibers produced two peak bending strengths. The first-peaks occurred near 0.005 mm of deflection and decreased up to 0.5 mm of deflection. Then the bending strength increased up to second-peaks until the deflections reached between 1.0 and 1.5 mm. The averaged flexural responses revealed that PA fiber content did not significantly influence flexural responses before L/600, but had significant influence thereafter. Toughness performance levels were also determined, and the results indicated more than Level II at L/600 and Level IV at others.

1. Introduction

Randomly distributed short fiber reinforcements are used to improve the brittle characteristics of concrete. The reinforcements, including steel fibers [1,2,3,4,5], carbon fibers and polymer fibers [6,7,8,9,10], are used to control the initiation and propagation of cracks [11,12,13,14,15]. The fibers hold together the cracks and reduce potential problems such as water permeating causing steel corrosion and deterioration. The resulting fiber reinforced concrete (FRC) exhibits superior performance compared to plain concrete due to its high tensile strength and ductile tensile behavior. Application of FRCs is increasing recently in areas requiring extreme mechanical and environmental loadings.
Steel fiber reinforced concrete has both high tensile strength and bending strength and controls cracks. However, gravitation and corrosion of the steel fiber may occur, and rebounding during tunnel shotcrete application due to low adhesion characteristics causes lower than expected strength and higher costs [16]. Organic fiber usually has lower elastic modulus and tensile strength compared to steel fiber and is easily tangled, causing low workability. Thus, for practical use in reinforced concrete, organic fiber requires improved mechanical characteristics and workability.
This study developed polyamide fibers with optimized features for reinforcing concrete, to improve the mechanical properties and workability of organic fiber reinforced concrete. Typically, concrete is comprised of multiple phases, including micron-scale phases for the C-S-H gel, millimeter-scale for sands, and centimeter-scale for aggregates, and this multiphase composition results in complex-cracking behavior [17,18]. However, since cracks usually occur along the aggregates, it is consequently necessary for reinforcing fiber to perform in the macro-scale. Thus, this study developed and investigated macro-sized, or bundled, polyamide (PA) fiber, tested and optimized the PA fiber bundles, and investigated the properties of PA fiber reinforced concrete (PAFRC).
The polyamide fiber bundles were made of approximately 384 micro-size polyamide fibers (diameter = 19.5 μm), and the bundled format improved adhesion to cement paste. Polyamide fiber has improved mechanical properties compared to polypropylene (PP) fiber, and lower weight and density and no corrosion compared to steel fiber. Polypropylene fiber also gets popularity due to concrete performance improvement under crack opening and slippage [4]. These improved mechanical properties for compression, tension, flexure, impact blows and plastic shrinkage cracking [5] and adhesion characteristics lead to improved workability and less rebounding when spouting shotcrete.
The objective of this study is to provide the PA fiber processing technique and to report the physical and mechanical properties of PAFRC in terms of compressive and flexural responses in accordance with ASTM C1609/C 1609M-05 and C1018-97 [19,20].

2. Materials and Methods

2.1. Macro PA Fiber Development and Processing

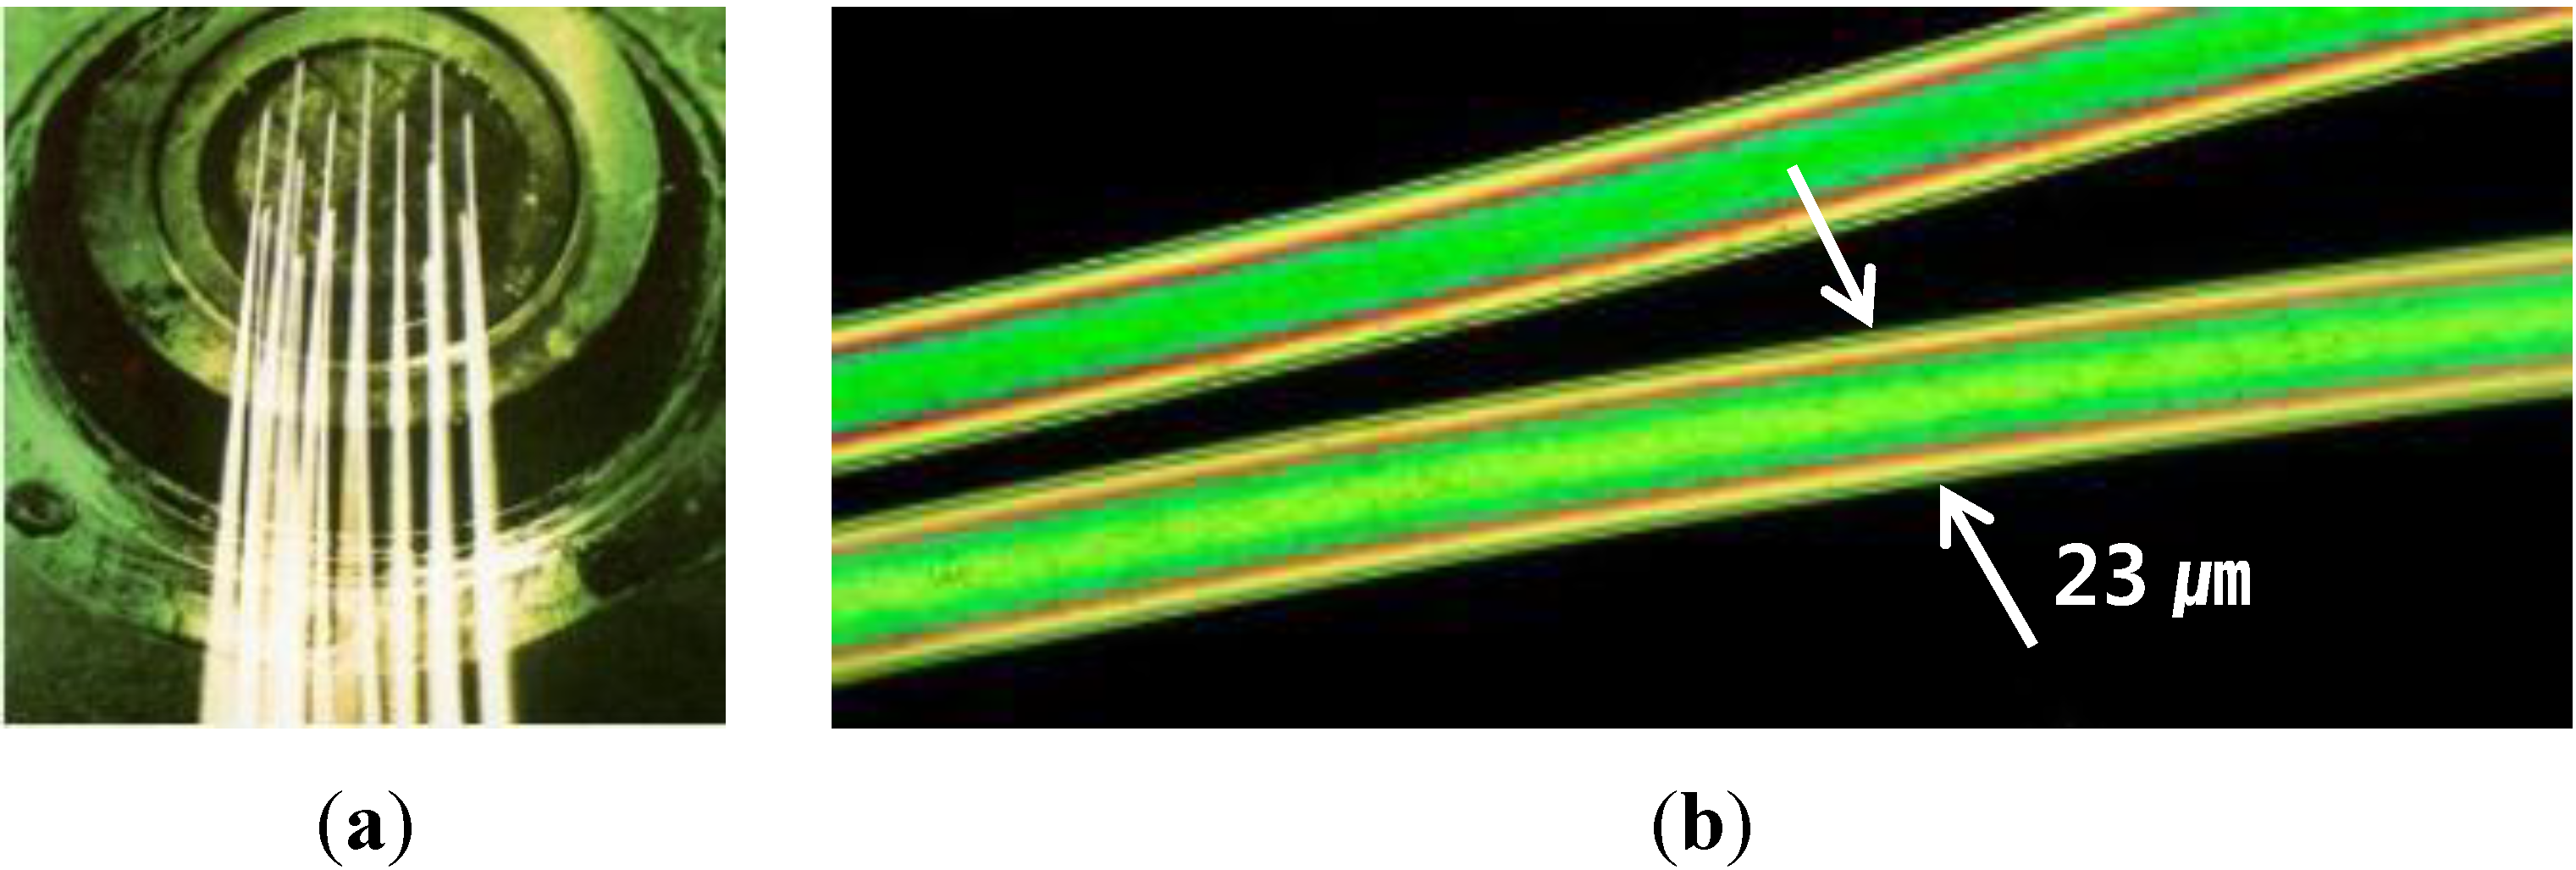
Polyamide (PA) fiber is one of the synthetic fibers commonly used in textiles. A micro-size polyamide fiber is presented in 
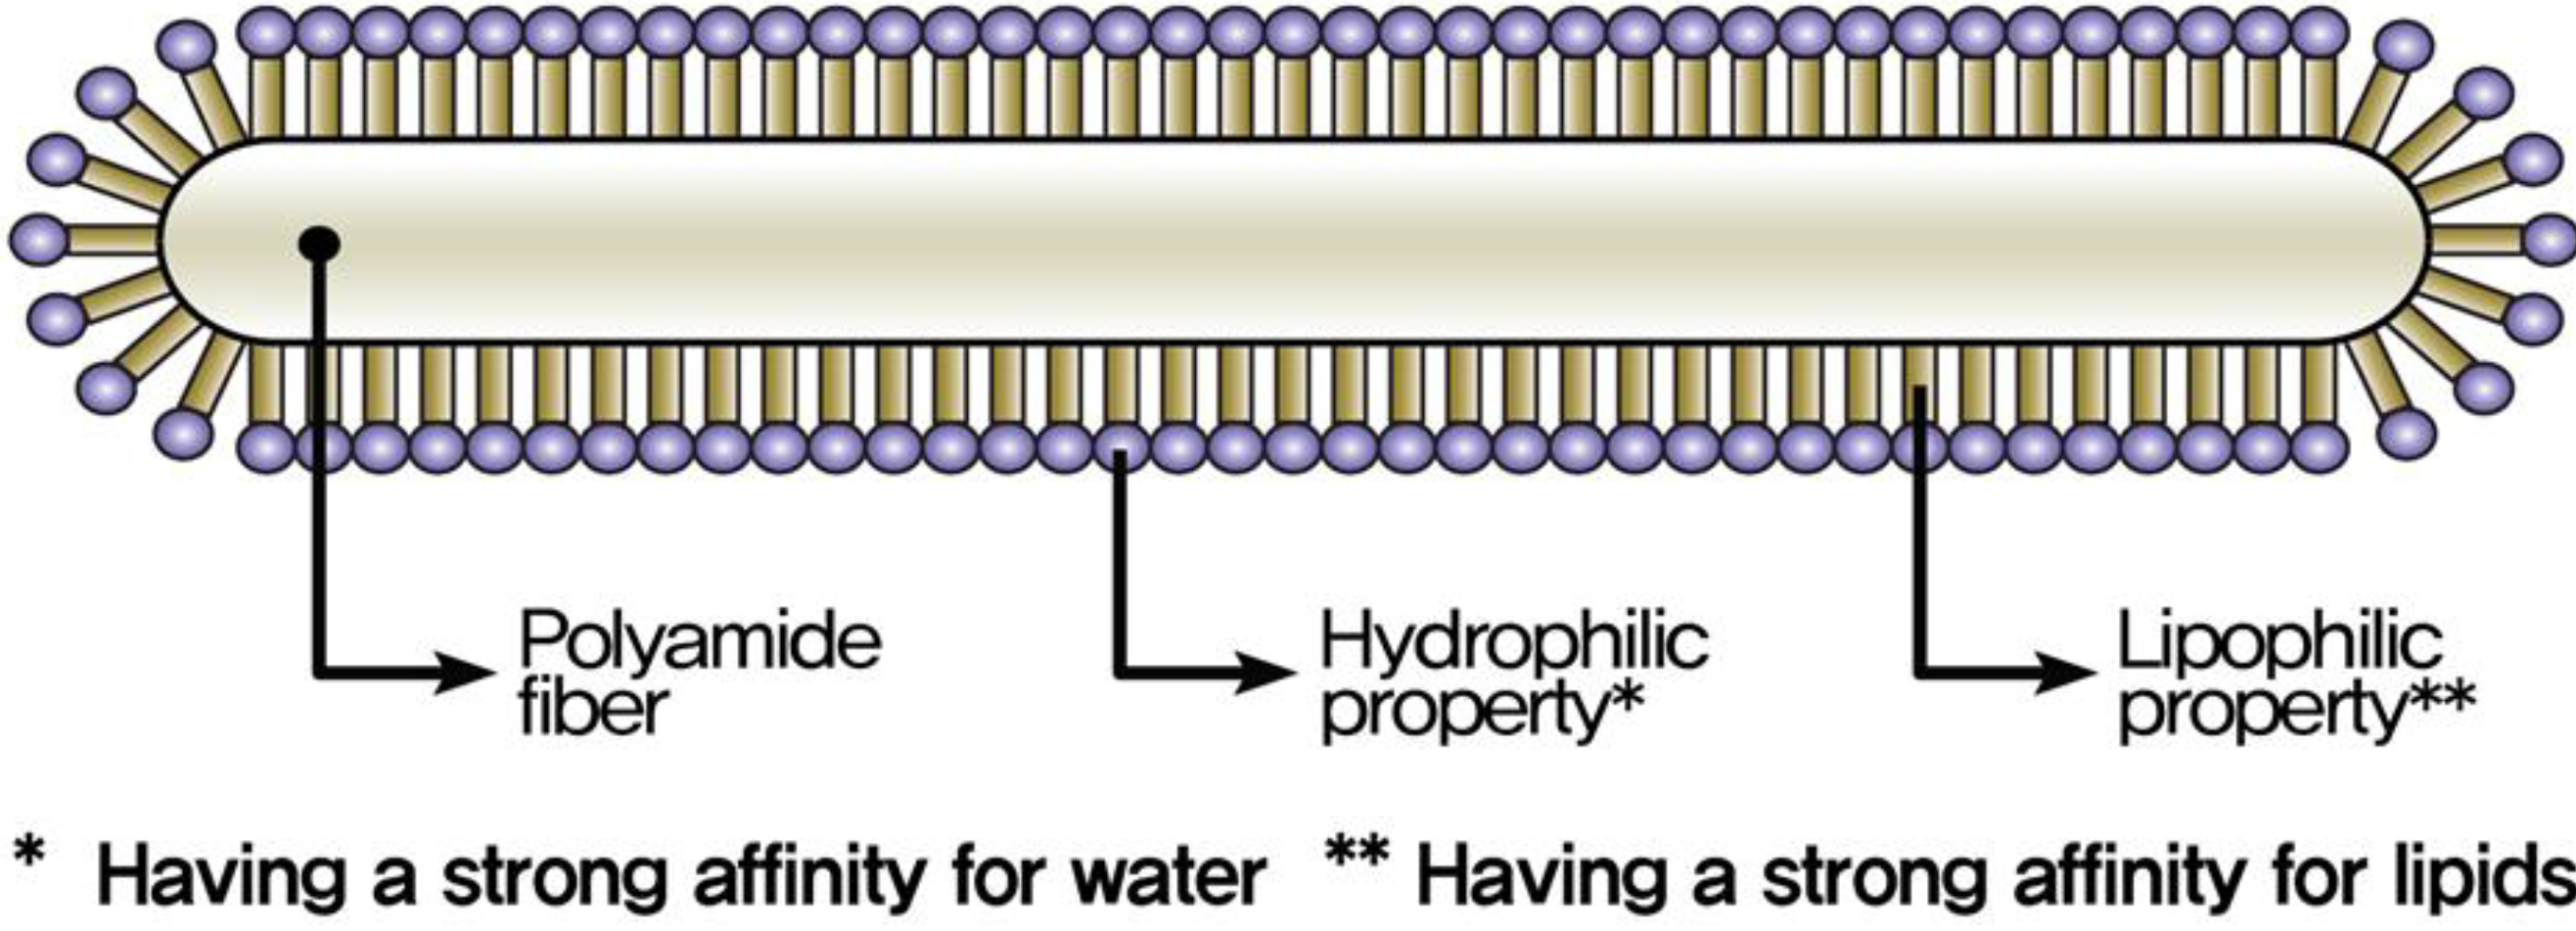
Figure 1. Polyamide fibers are produced through a shaped nozzle, and the thickness of the fiber is constant throughout its length. A dispersant is used during the production of PA filaments to prevent the fibers tangling, as shown in Figure 2. The dispersant is composed of hydrophilic and lipophilic groups made of 40% to 50% polyalcohol ester lubricant, 30% to 40% nonionic surfactant solution and 10% to 30% anti-static agent. In concrete, the hydrophilic group, having a negative charge, causes repulsion between fibers, prevents the fibers tangling, and improves fiber dispersion. The hydrophilic group induces hydrogen bonding and leads to improved adhesion between the fibers and cement paste. Also, the dispersant coating during the filament production decreases fiber elongation and increases fiber strength.
Figure 1. Picture of micro polyamide fibers. (a) Single polyamide fiber production; (b) magnification of single polyamide fiber.
Materials 07 07634 g001
Figure 2. PA fiber (Diameter: 23 μm) with dispersant coating.
Materials 07 07634 g002
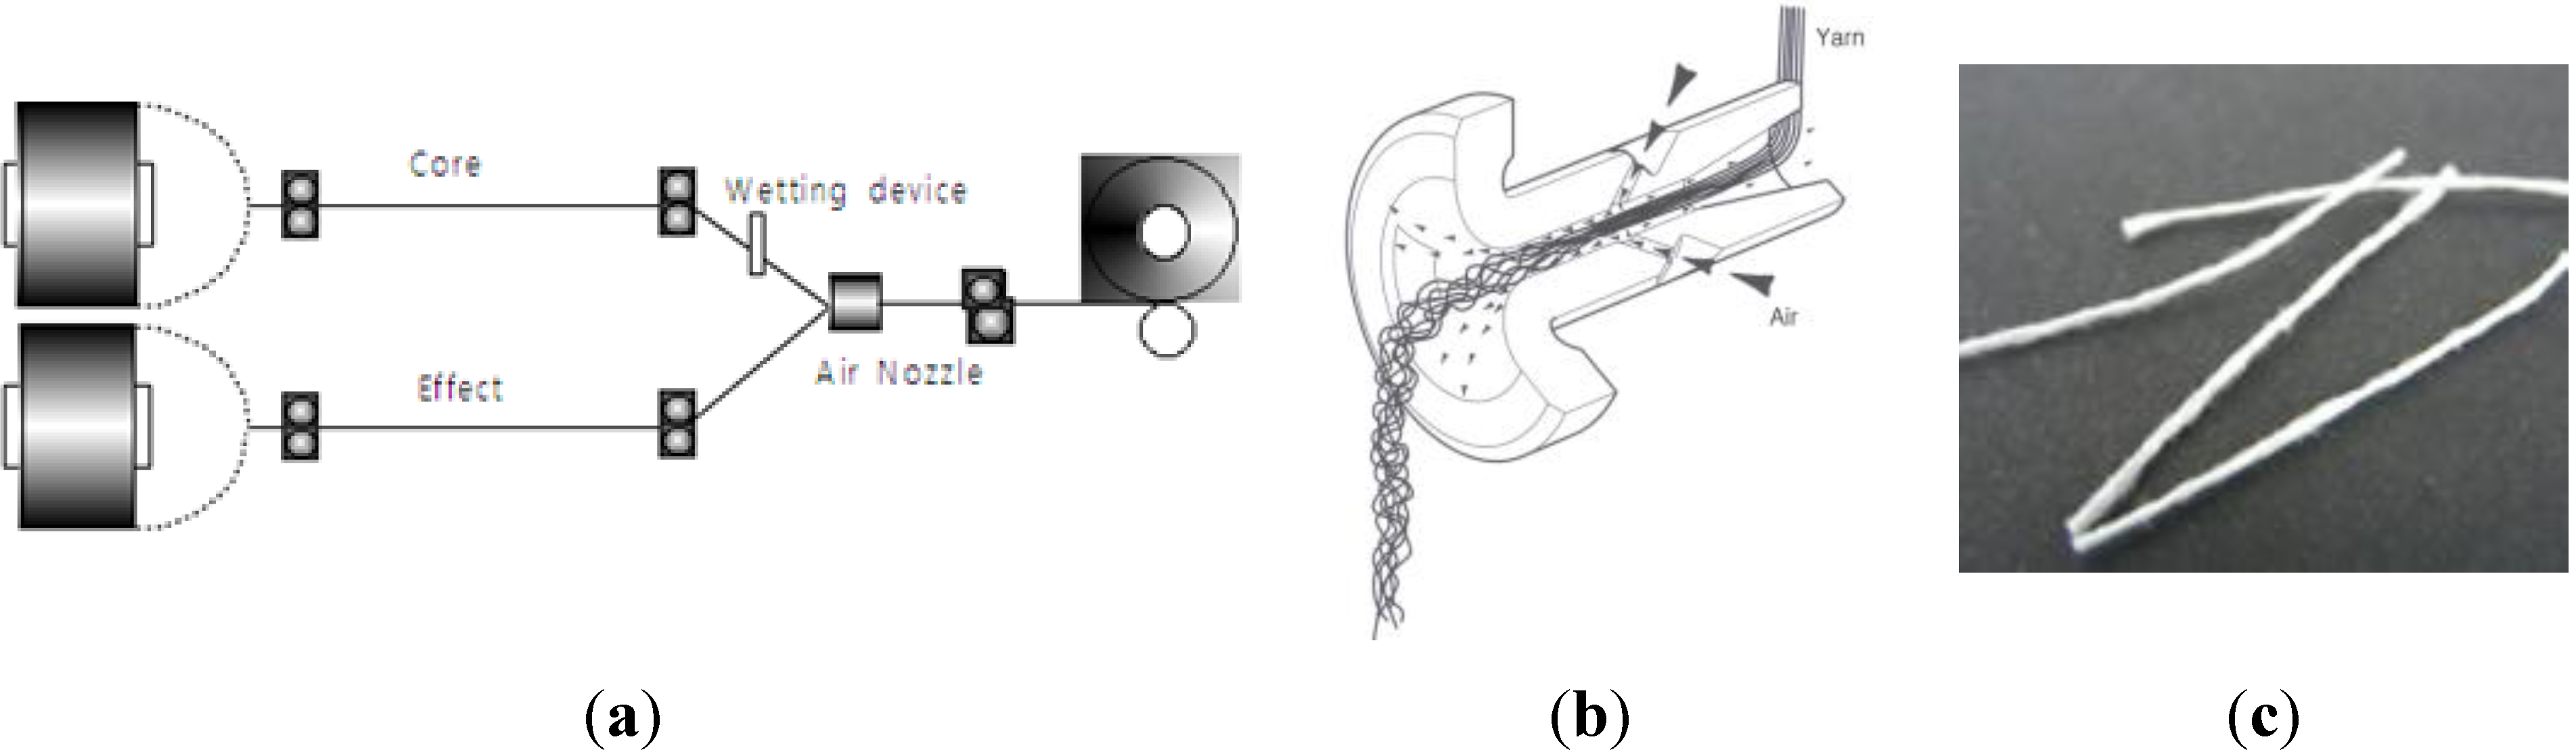
This study used a fiber fabrication method of air-textured yarn to develop bundled PA fibers in a macro size. In the production process two-polyamide filaments, one for the core yarn and one for the effect yarn (see Figure 3a), are injected into the nozzle with oblique high-pressure air-flow (see 
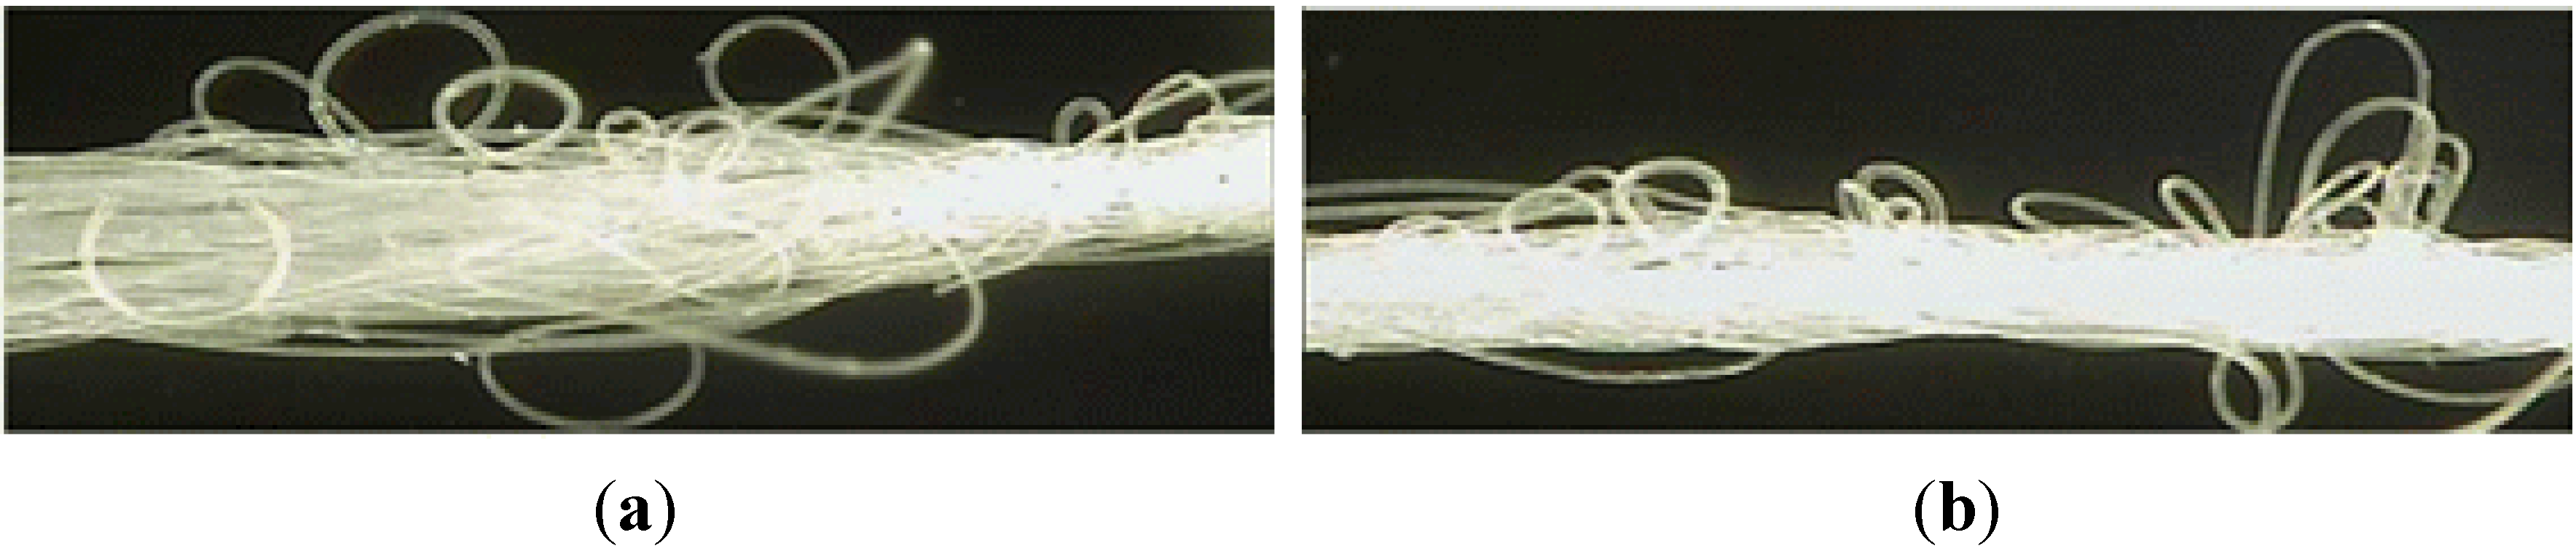
Figure 3b). The injection speed of the effect yarn is slower than the core yarn and a number of loops are subsequently formed due to the difference in injection air-flow speed. After passing the air nozzle, the effect yarn length is longer than the core yarn, and the fiber is then stabilized with a proper temperature treatment, preventing separation of the yarn. Polyamide fiber produced by the air textured yarn method is shown in Figure 4. The loops and bulking of the textured yarn allows cement paste to pass through the yarn, and produces an increased surface area for contact between the cement paste and yarns, resulting in better adhesion. It is expected that this improved adhesion property will produce higher flexural responses compared to polypropylene (PP) fibers, which are mono-filaments.
Figure 3. Production process of bundled PA fiber using air textured yarn. (a) Air texturing process; (b) air nozzle; (c) PA fiber (30 mm × 0.47 mm).
Materials 07 07634 g003
Figure 4. PA fiber processed by air textured yarn (Optical microscope ×8). (a) PA fiber before temperature treatment; (b) PA fiber after temperature treatment.
Materials 07 07634 g004
The bundled PA fibers developed by this study have a larger fiber size and greater number of filaments compared to PP fibers and other organic fibers. To determine the number of PA filaments needed to fit the desired mechanical properties, this study tested and optimized the number of PA filaments at 1,800 Denier and 384 filaments of PA fiber. The mechanical properties of the PA fiber are tabulated in Table 1 and compared to polypropylene (PP) fibers. For PP fibers, BarChip Macro produced by Elasto Plastic Concrete [21], which is a synthetic fiber frequently used in Europe [18], was selected.
Table 1. Material properties of PA and PP fibers.
Fiber TypeDensity (g/cm3)Length (mm)Diameter (mm)Elastic Modulus (GPa)Tensile Strength (MPa)
PA1.14300.47Min. 3650
*PP0.9–0.9242**Rec.8.2550
* PP: BarChip Macro fiber; ** Rec.: rectangular section of 1.0 mm × 0.5 mm.

2.2. Experimental Program for Pull-Out Test

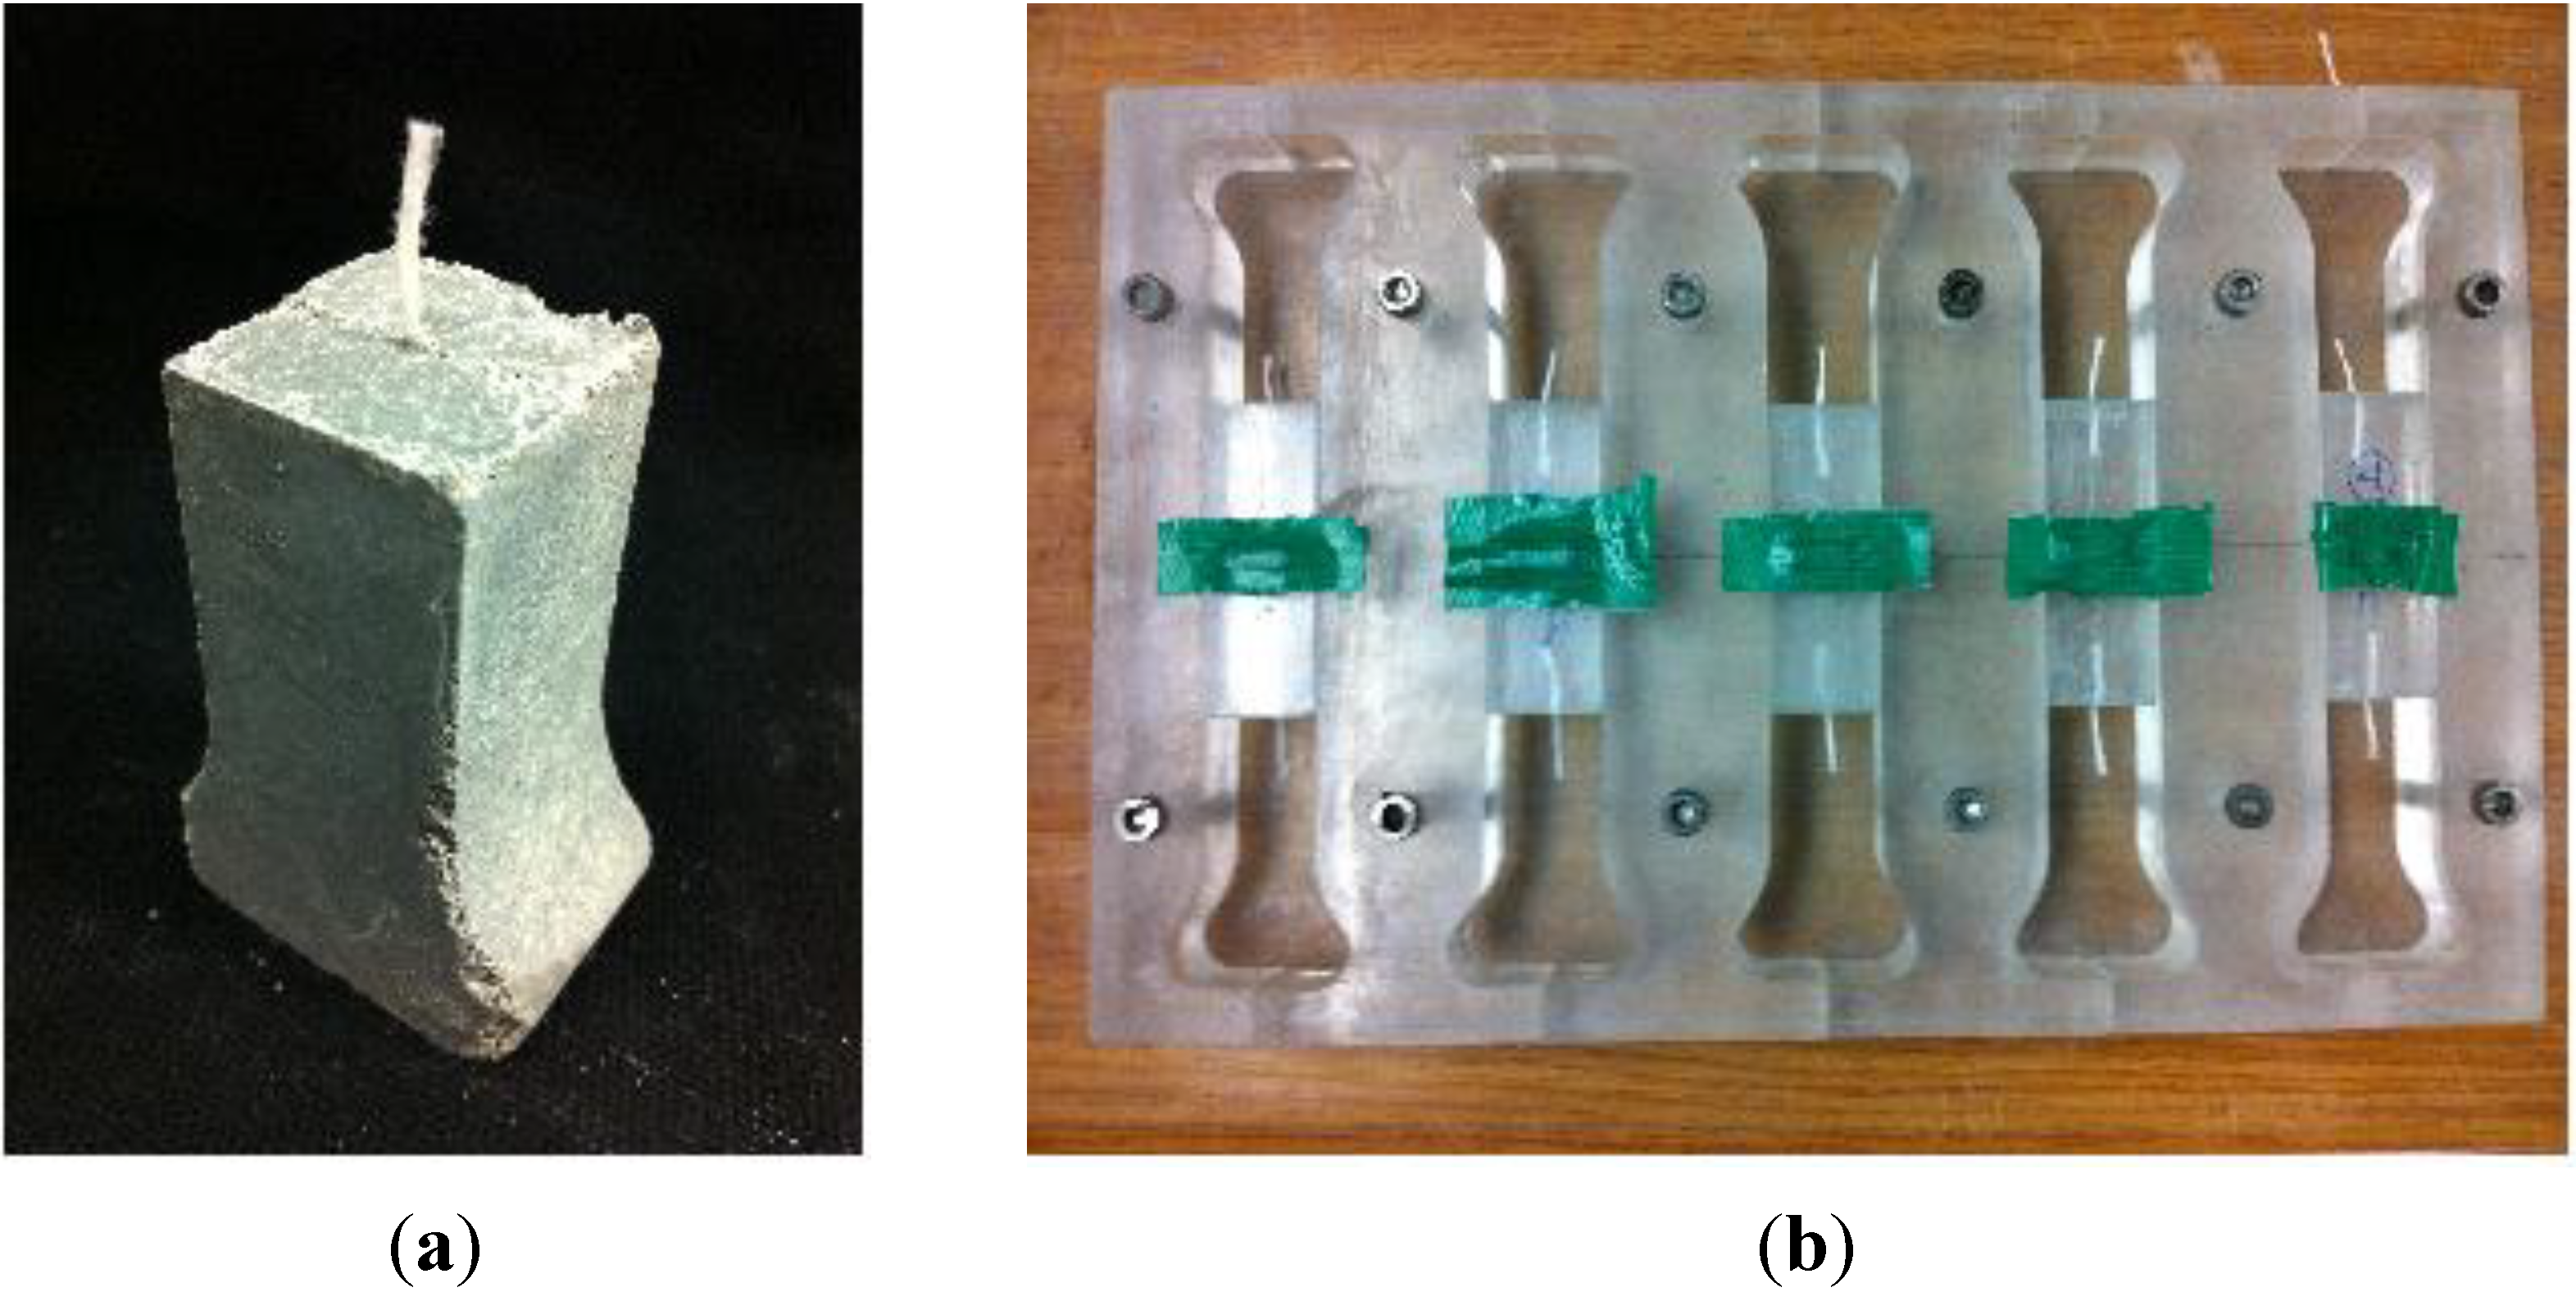
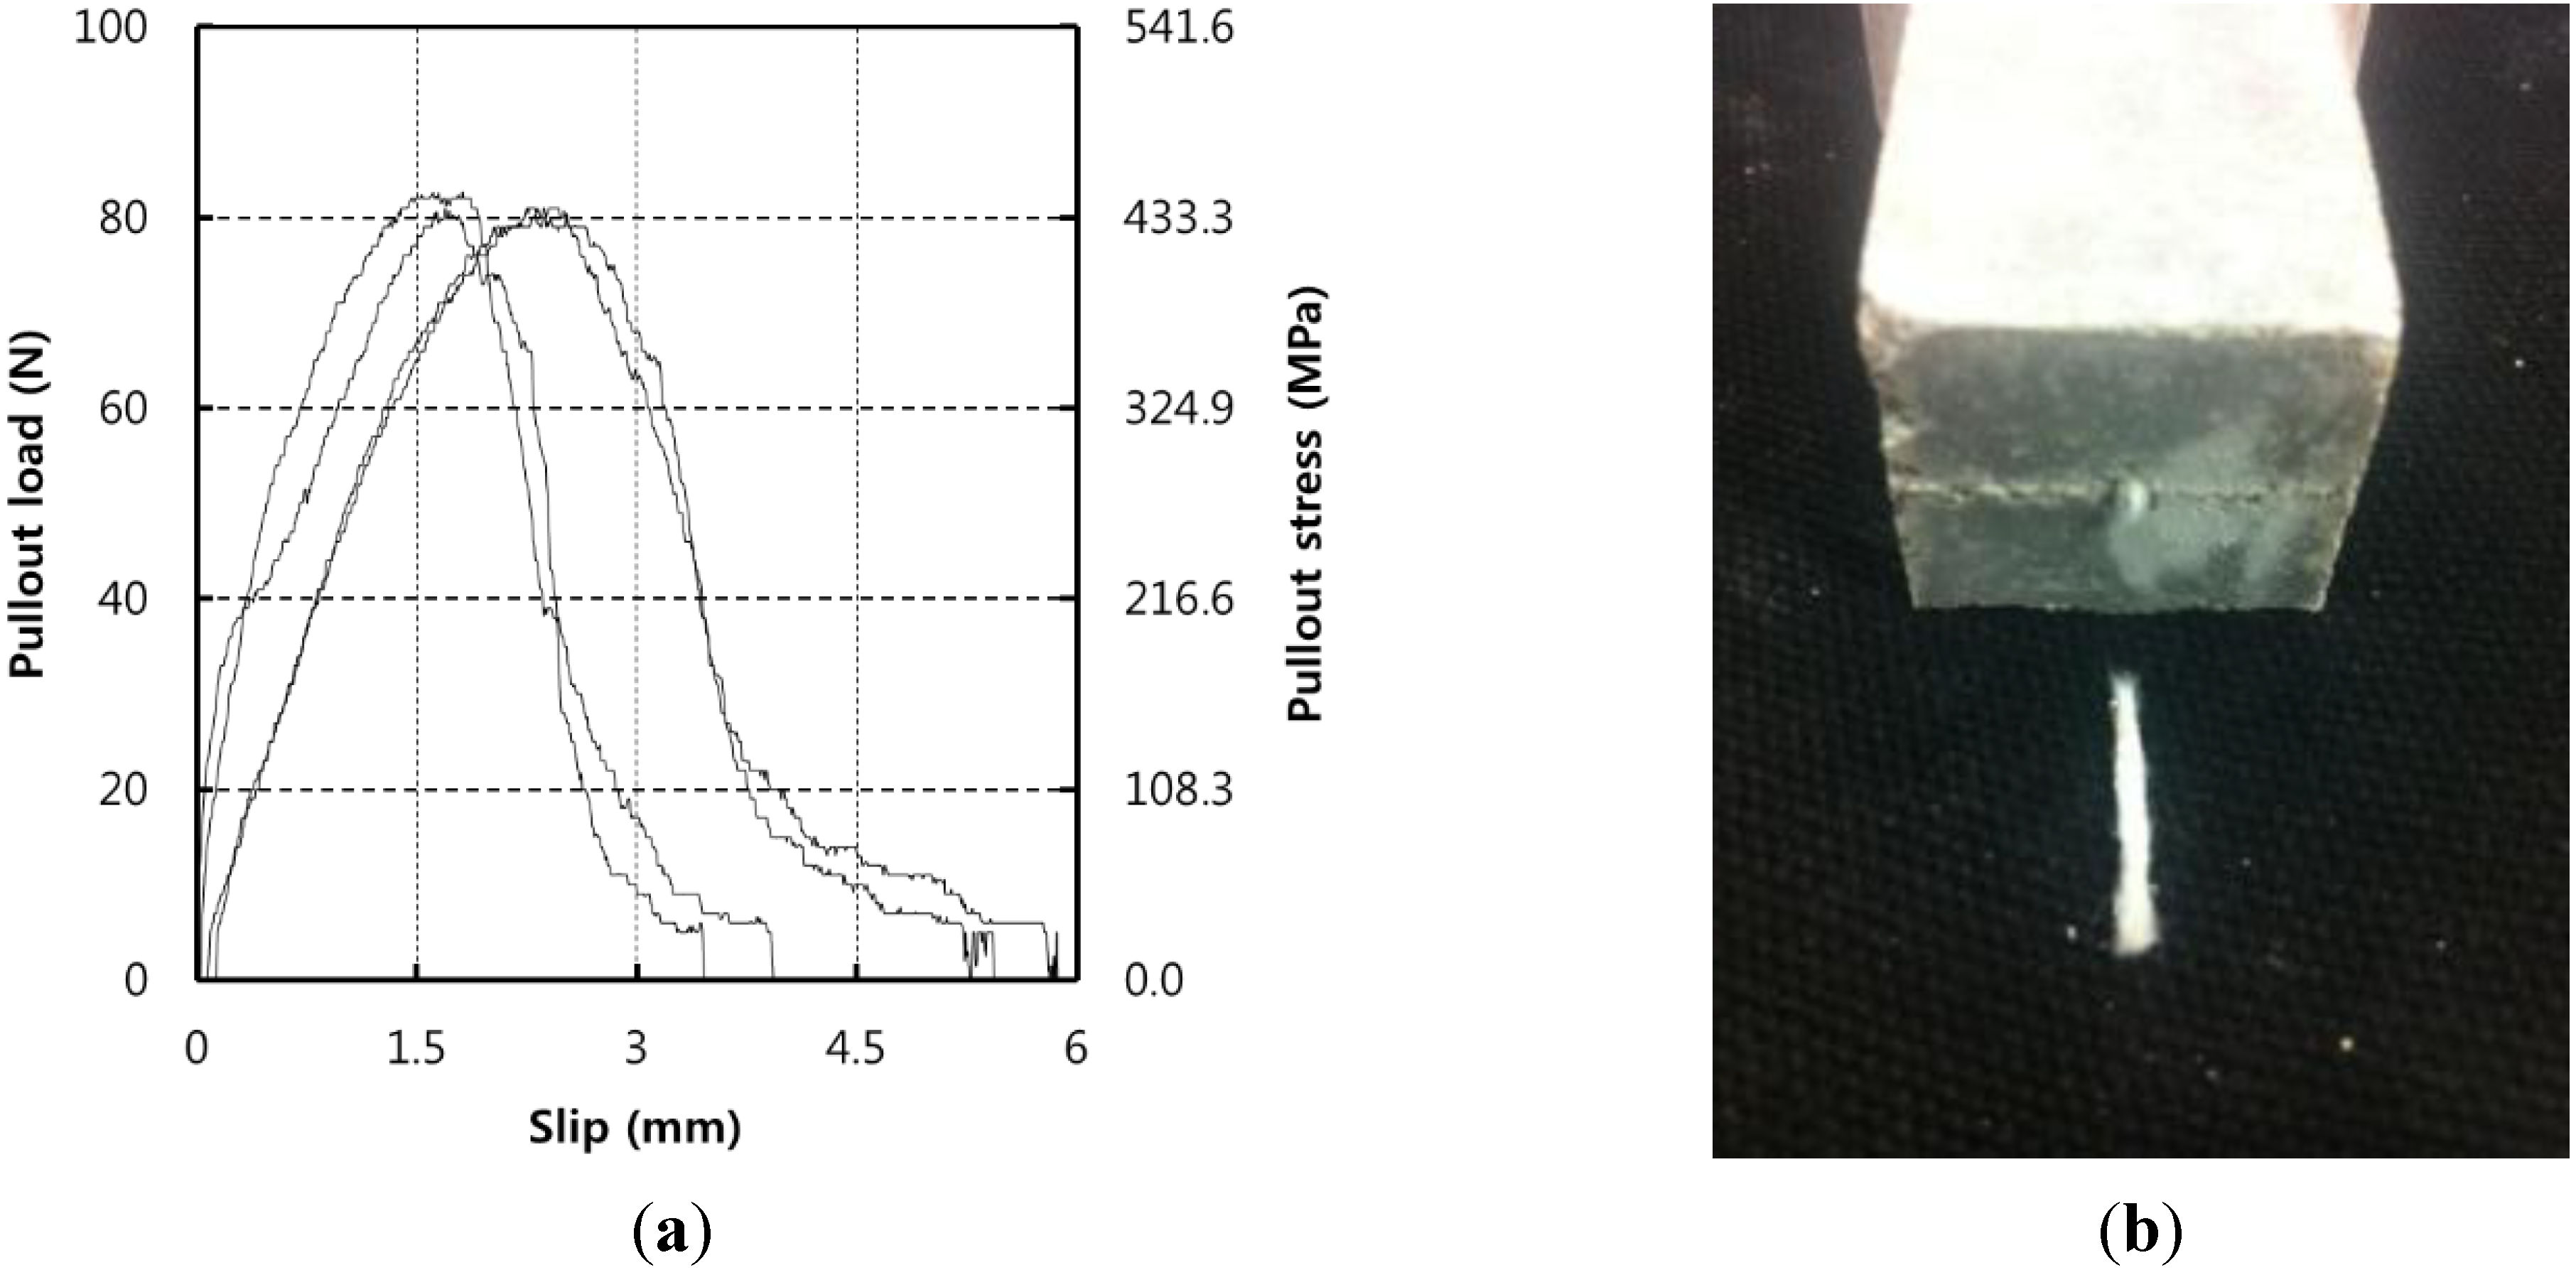
A pull-out test of a macro-size PA fiber was conducted to determine the fiber-to-matrix bond behavior, as shown in Figure 5. The bundled PA fibers have a larger specific surface area, which accommodates attachment to cement, compared to PP fibers and other fiber reinforcements. The PA fibers used in the test had Ф0.47 mm and the length of the fiber embedded in the matrix (25 × 25 mm) was 15 mm (half of the total PA fiber length). A total of four specimens were prepared for the test. Similar to the method used in previous research [22], the pull-out load was directly measured from the load cell in the cross head, and the displacement or slip of the PA fiber was measured using a linear variable differential transformer (LVDT).
Figure 5. Pictures of pull-out test specimen and mold. (a) Pull-out test specimen; (b) pull-out test mold.
Materials 07 07634 g005
The weight ratios of cement matrix used in the pull-out test were 0.628, 1.0, 0.25, 2.3, 0.00089 and 0.0079 for water, ordinary portland cement (OPC), fly ash, sand, air-entraining agents (AEA) and water-reducing admixture (WRA). The compressive strength of the specimen on the 28th day was 58.09 MPa. In the cement matrix, only fine aggregates with AEA were used with OPC. An appropriate amount of WRA was used to meet the target slump of 120 ± 25 mm, which is standard for tunnel shotcrete. The mixture was mixed with PA fibers and placed in a mold for three days. After demolding, the specimens were cured at room temperature. All specimens were tested on the 28th day.

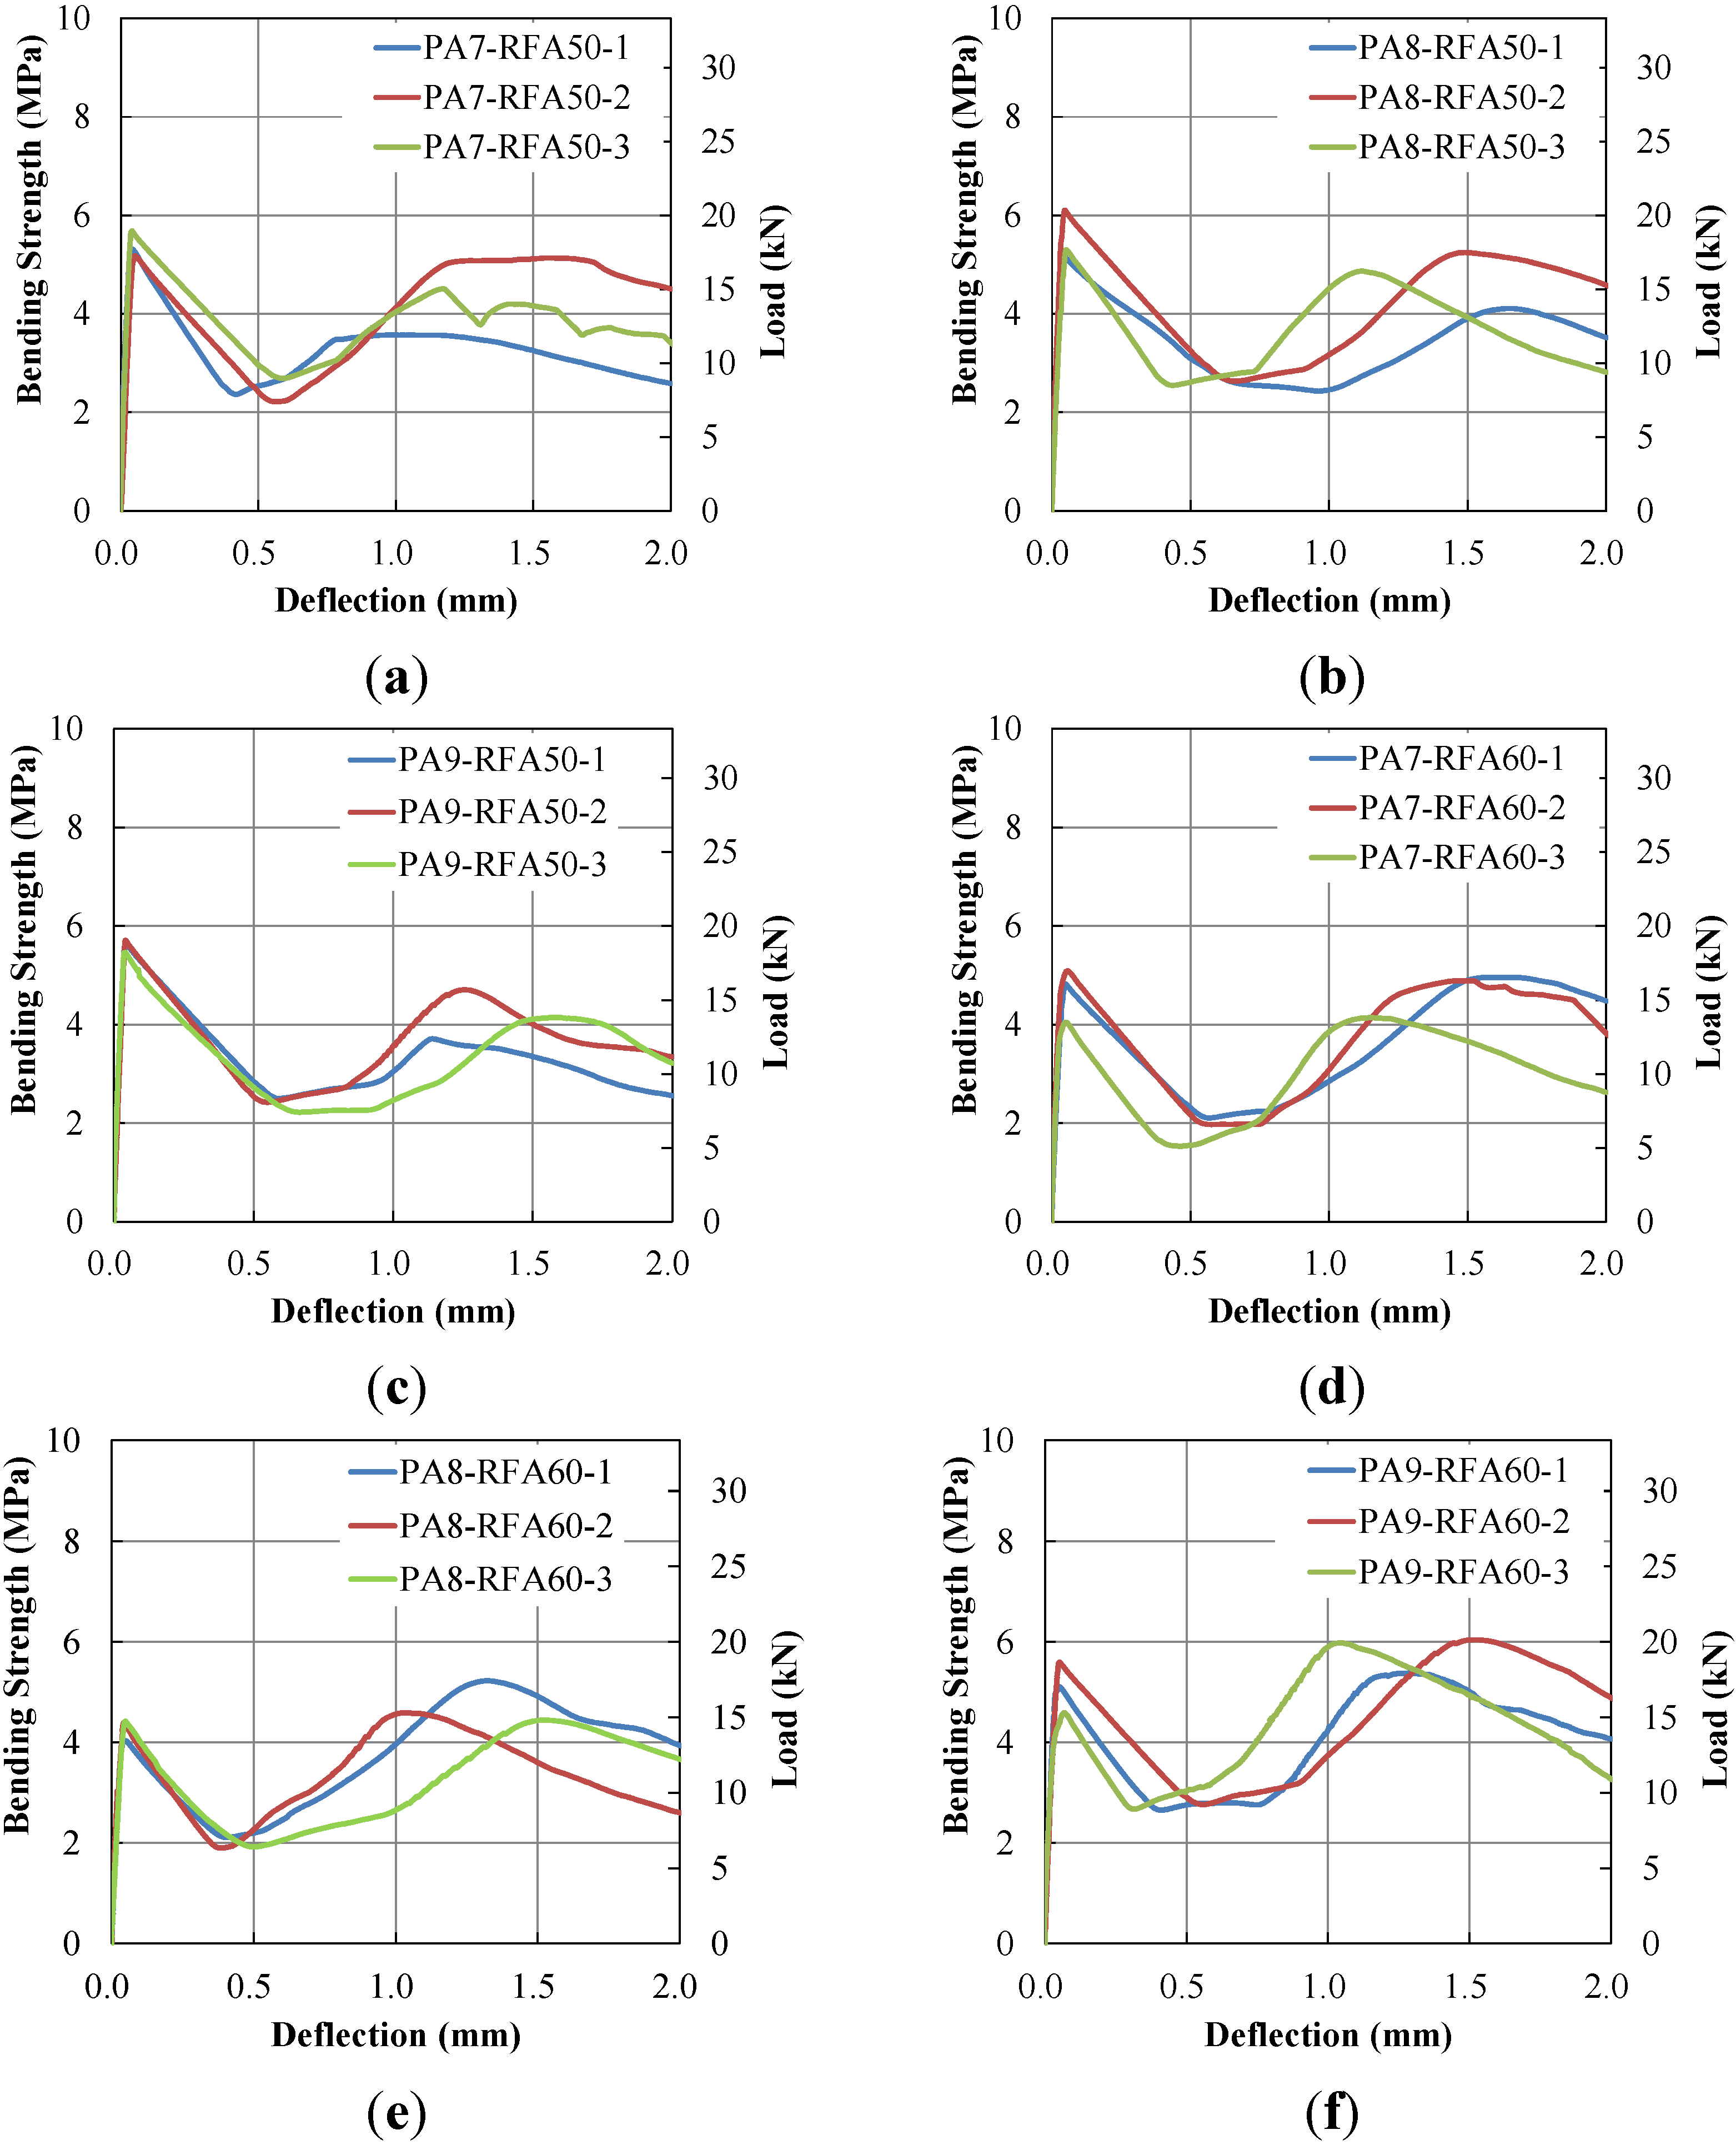
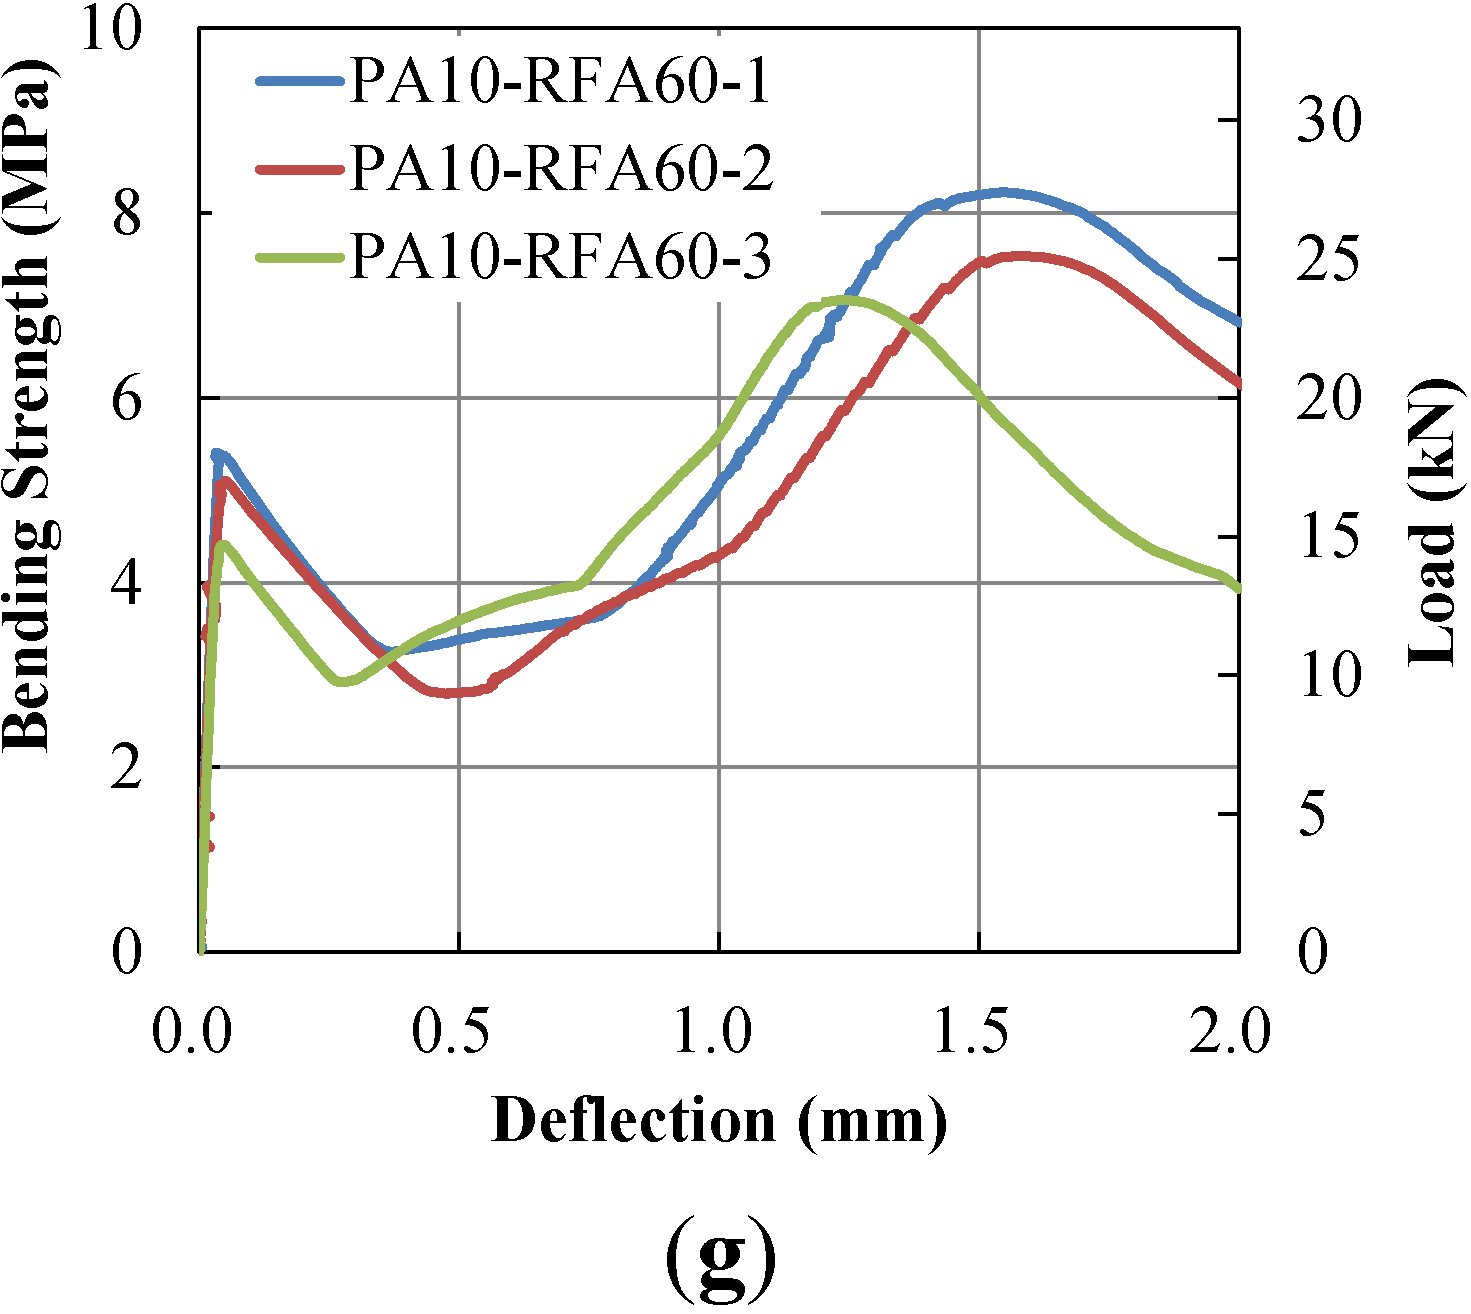
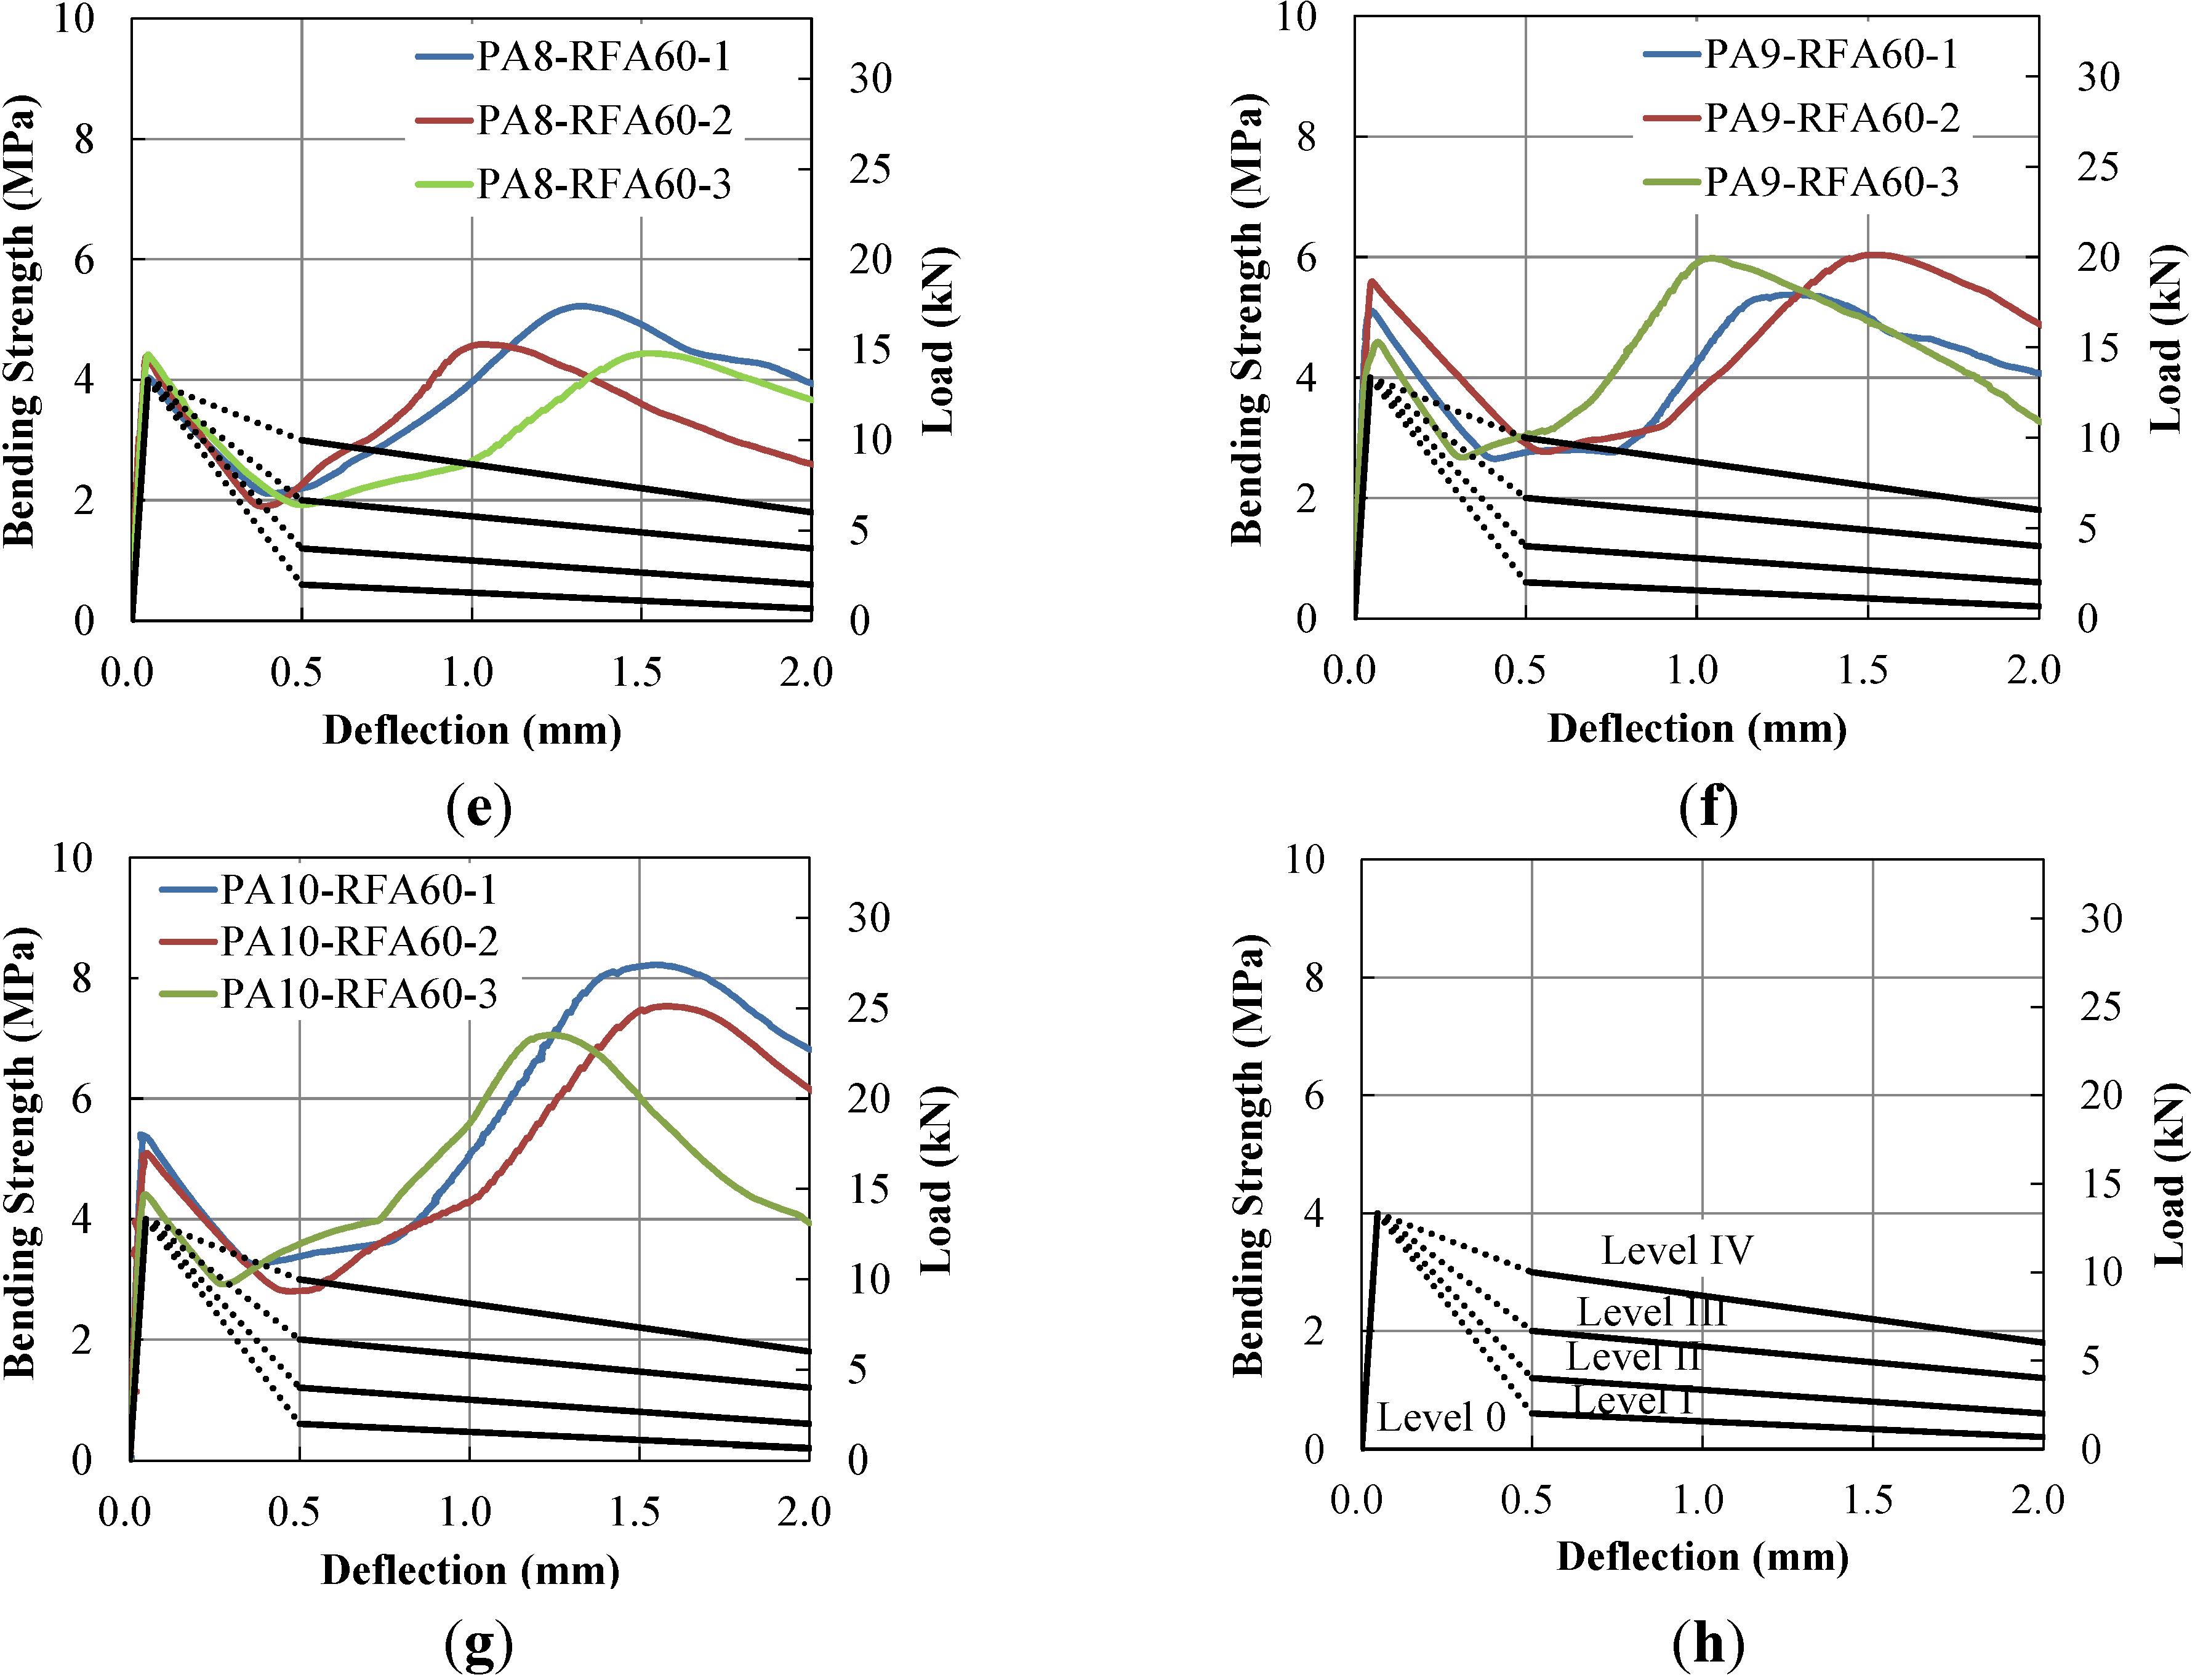
2.3. Experimental Program for Flexural Bending Test

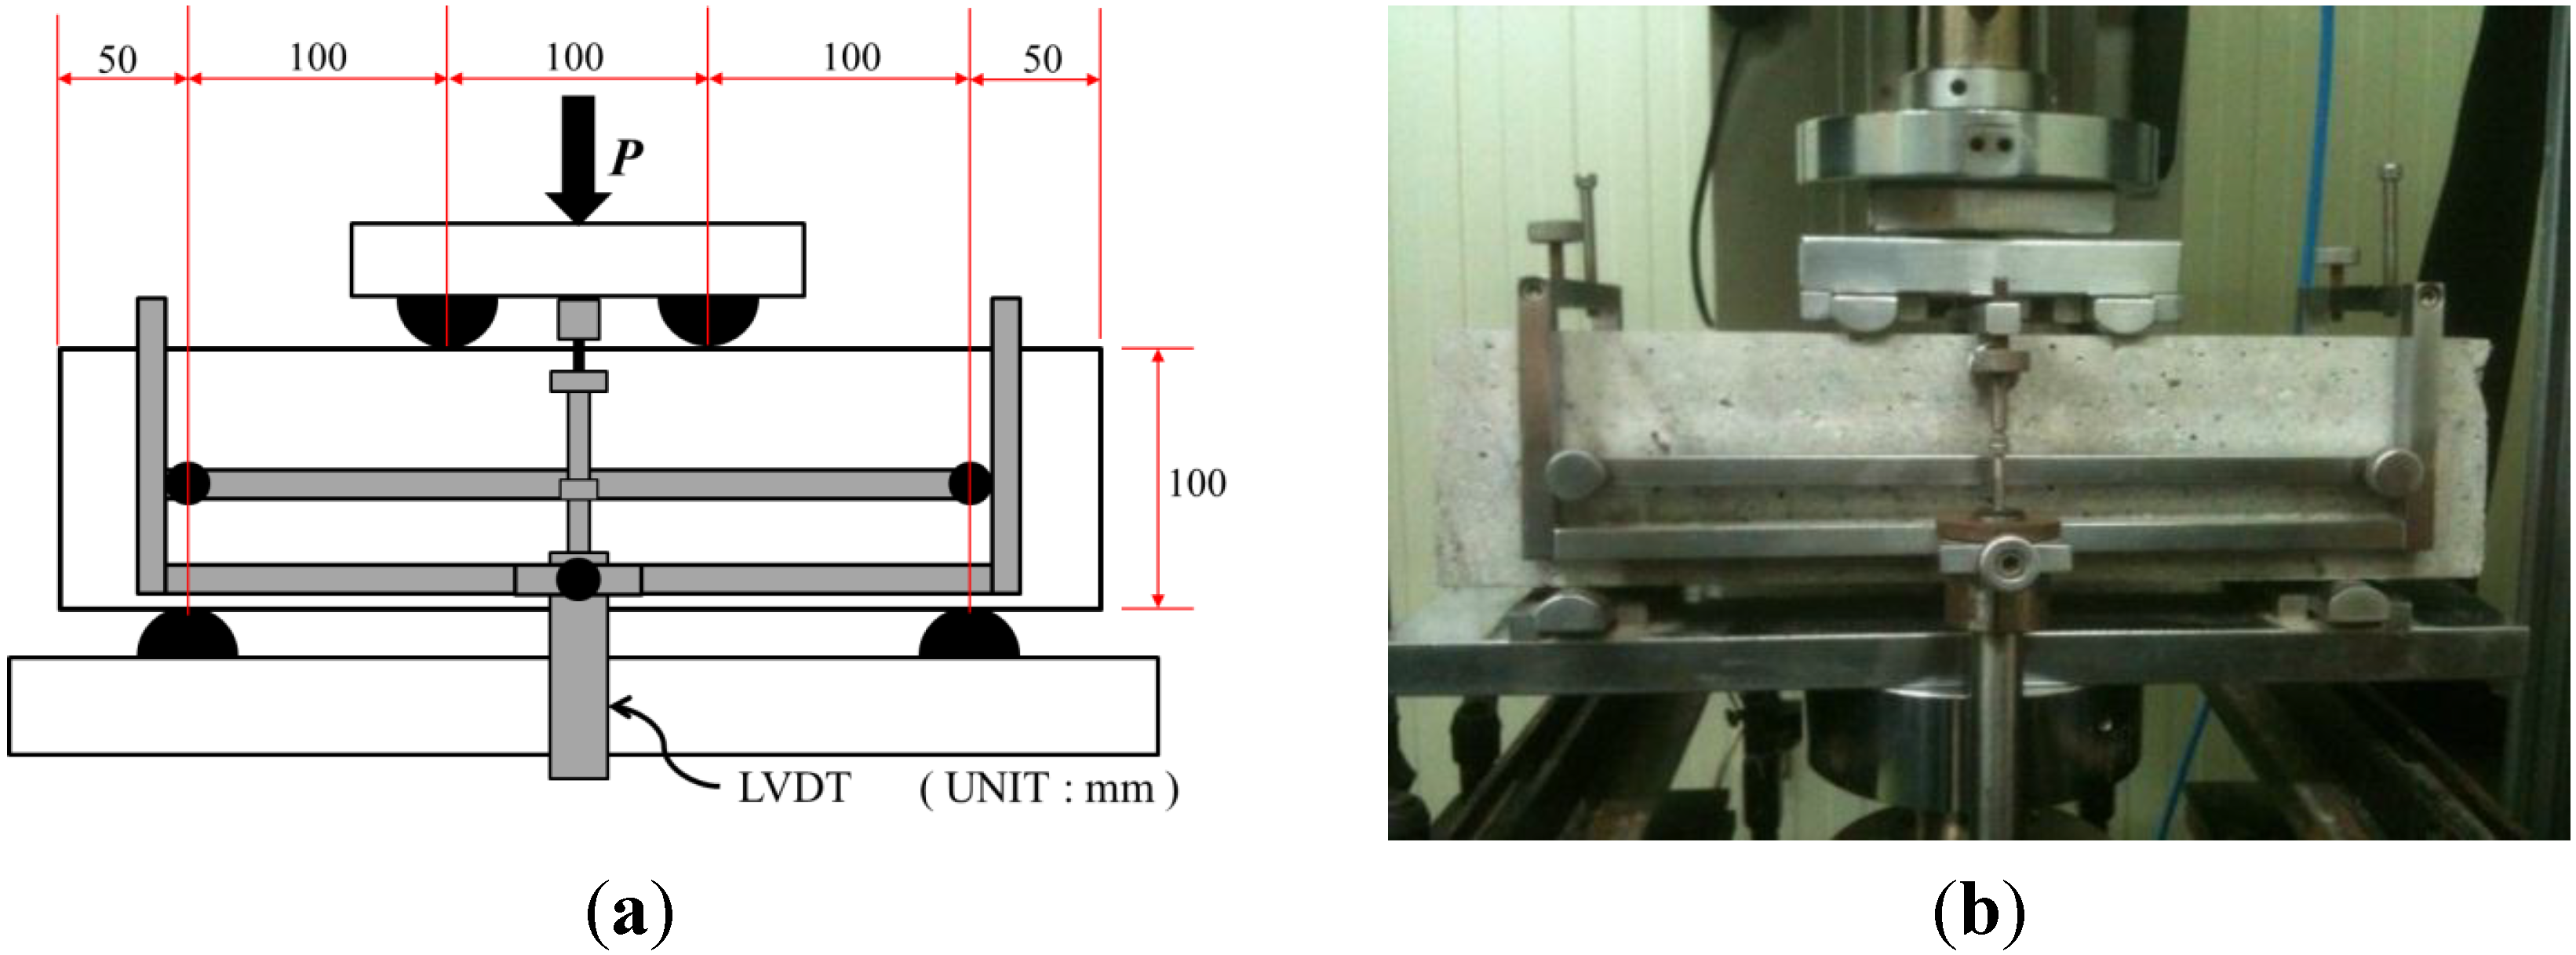
The schematic and picture of the flexural test set-up are presented in Figure 6. An INSTRON 5582 testing machine (DatapointLabs, Ithaca, NY, USA) was used in a laboratory for this flexural test. The rate of deflection was controlled to 0.1 mm/min after L/900 (=0.333 mm) with the sampling rate of 16 Hz (≥2.5 Hz). The boundary conditions follow ASTM Testing Method C78 [23], which allows supporting rollers rotating on their axes. The beam specimen size of 100 × 100 × 400 mm with a span length (L) of 300 mm was determined in accordance with ASTM C1609/C 1609M-05 [20]. The specimen was built with dimensions of 150 × 150 × 550 mm and then cut into the size 100 × 100 × 400 mm (L = 300 mm) to prevent the fiber aligning parallel to the direction of the beam length, and to place the fiber randomly. A steel frame was attached at the neutral axis of the beam specimen to measure the net deflection of the beam using two LVDTs at both sides. (Only one LVDT is shown in Figure 6 and the other one is located at the other side of the beam.) Applied load (P) was measured directly from the load cell in the crosshead.
Figure 6. Bending specimen geometry and test set-up. (a) Specimen geometry; (b) Test set-up picture.
Materials 07 07634 g006
The specimens were prepared in a laboratory. The concrete mix design used in this study is summarized in Table 2. The maximum gravel size (Gmax) was controlled to be 10 mm, the ratio of sand to aggregate (S/a) was fixed at 60% for all specimens. Ordinary Portland cement (OPC) was 480 to 482 kg/m3. An appropriate amount of water-reducing admixture (AD) was used to meet the target slump of 120 ± 25 mm, which was determined for tunnel shotcrete usage. The mixture was then mixed with PA fibers and placed in a mold for three days. After demolding, the specimens were cured at room temperature to represent PAFRC used in tunnel shotcrete. All specimens were tested on the 28th day. The 28-day compressive strength of the PAFRC was measured based on Ф100 × 200 mm cylindrical specimens. The slump and compressive strength of the specimens are presented in Table 3.
Table 2. Concrete mix proportions.
SpecimenGmax (mm)W/C (%)S/a (%)Unit Weight (kg/m3)WRA (C%)
WOPCSCSGFiber
PA7-RFA50 *1043.1602074804804846407.00.7
PA8-RFA50 *1043.1602074804804846408.00.8
PA9-RFA50 *1043.1602074804804846409.00.9
PA7-RFA60 *1043.8602114823815766357.00.8
PA8-RFA60 *1043.8602114823815766358.00.9
PA9-RFA60 *1043.8602114823815766359.01.0
PA10-RFA60 *1043.86021148238157663510.01.1
* RFA xx: ratio of recycled fine aggregate to fine aggregate.
Table 3. PAFRC slump and compressive strength.
SpecimenSlump (mm)28-day Compressive strength (MPa)
SP-1SP-2SP-3Avg.
PA7-RFA5012051.049.850.550.4
PA8-RFA5011551.550.251.851.0
PA9-RFA5012052.851.553.152.5
PA7-RFA6011547.549.649.548.9
PA8-RFA6011050.451.148.049.8
PA9-RFA6012049.748.951.450.0
PA10-RFA6011049.152.047.549.5

3. Experimental Results

3.1. Pull-Out Test Results

Pull-out test results are presented in Figure 7. The PA fiber strength increased almost linearly as the displacement increased before peak loading. After peak loading, the PA fiber that was exposed outside the cement matrix started to untangle, and elongated. At this point, the micro PA fiber began to fracture. Contrary to other organic reinforcing fibers and steel fibers, the macro-size PA fiber broke without separating from the cement matrix. Steel fiber pull-out tests in other research [22] reported that the steel fiber was pulled out from the matrix at increasing loads. However, the macro PA fiber was not pulled out and instead fractured at increasing loads. Thus, the pull-out stress was computed to be for fiber fractured:
σ min = 4 P max π d f 2
where, σmin is the minimum fiber-to-matrix bonding strength, which is greater than or equal to the PA fiber tensile strength; Pmax is the maximum pull-out load; and df is the diameter of the PA fiber.
Generally, when the fiber is pulled out, such as the steel fiber during the pull-out test, the pull-out stress is computed as:
τ max = P max π d f L embed
where, τmax is the maximum fiber-to-matrix bonding strength based on the surface shear around the fiber; Lembed is the fiber embedment length in the matrix when debonding starts to initiate.
Figure 7. Pull-out test results. (a) Load-slip curve; (b) Fiber fracture.
Materials 07 07634 g007
As shown in Figure 7, this PA pull-out phenomenon originates with the improved bonding strength of PA fiber attachment to the cement matrix. Because the macro PA fiber is made of 384 micro PA filaments and the specific surface area is significantly increased, the bonding strength between the macro PA fiber and cement matrix is greatly increased. Although the PA fiber was failed within the fibers, the fiber-to-matrix bonding strength was expected to be larger than or equal to the PA fiber tensile strength. Thus, Figure 7a was derived using Equation (1).

3.2. Flexural Bending Test Results

The flexural responses of PAFRCs with varying fiber volumes of 7, 8, 9 and 10 kg/m3 were tested in accordance with ASTM C1609/C 1609M-05 [20]. As in Figure 8, this study identified two peak loads: a (1) first-peak load (P1) on the load-deflection, caused by the initiation of cracks in the specimen, and (2) second-peak load (P2) on the load-deflection when the PA fibers reached their ultimate strength. Corresponding strengths and deflections were denoted as f1 and δ1 for P1 and f2 and δ2 for P2, respectively. Residual loads ( P 600 D and P 150 D ) and strength ( f 600 D and P 150 D ) at a net deflection of L/600 and L/150 were measured for a beam with a depth of D. Toughness ( T 150 D ) and equivalent flexural strength ratio ( R T , 150 D ) at a net deflection of L/150 were also identified as follows:
f 1   or   2 = P 1   or   2 L b d 2
R T , 150 D = 150 T 150 D f 1 b d 2 × 100 ( % )
Based on the deflection (δ1) at the first-peak load, three additional points were investigated at 3δ1, 5.5δ1 and 10.5δ1 as per ASTM C1018 [19]. Current ASTM standard C1609 specifies δ1, δp (deflection at the peak load regardless of the first-peak or second-peak), L/600 and L/150. However, PAFRC occasionally exhibits a second peak that is larger than the first peak depending on the PA fiber volume content. This study intended to clearly identify whether pre- or post-cracking strength was larger. Also, PAFRC yields after cracking before the PA fiber reaches its ultimate strength, similar to hyper-elastic materials. Thus, additional points at 3δ1, 5.5δ1 and 10.5δ1 were used.
Figure 8. Typical load-deflection response of FRC.
Materials 07 07634 g008

3.2.1. Bending and Equivalent Bending Strength

Flexural bending tests of three specimens for each fiber volume content were conducted, as shown in Table 4. The bending strength (fr) and equivalent bending strength (fe) of each specimen was calculated based on the load-deflection curves in the following section (Figure 9), using the following equations:
f r = P L b d 2
f e = A b L δ 150 b d 2
where, P = peak load at δ1; L = span length (=300 mm); b and h = beam cross-section width and depth at the fracture surface, respectively; Ab = area under the load-deflection curves up to δ150 (N·mm) and δ150 = deflection of L/150 (=2.0 mm). The equivalent bending strength (fe) is derived from the equivalent flexural strength ratio, R T , 150 D , in Equation (4), which is equal to (fr/fe) × 100%.
Figure 9. Load-deflection curves. (a) PA-7-RFA50; (b) PA-8-RFA50; (c) PA-9-RFA50; (d) PA-7-RFA60; (e) PA-8-RFA60; (f) PA-9-RFA60; (g) PA-10-RFA60.
Materials 07 07634 g009aMaterials 07 07634 g009b
For both RFA50 and RFA60, it is clearly observed that PA fiber improved the beam flexural strength, as in Table 4. Both bending strength and equivalent bending strength increased as fiber content increased from 7 to 10 kg/m3. However, the equivalent bending strength of PA9-FRA50 was smaller than PA7-RFA50 and PA8-RFA50. This phenomenon often occurs in other FRCs when the volume content of the reinforcing fiber is larger than a certain limit. Bending strengths of the RFA60 series were more significantly improved as PA fiber content was increased, compared to the RFA50 series. The RFA50 series produced larger bending strengths for PA7 and PA8, but the RFA60 series produced larger bending strengths for PA9 and PA10. To confirm that an excessive amount of PA fiber may drop the bending strength, similar to the RFA50 series, the PA10-RFA60 specimen was tested, but the bending strength continuously and significantly increased.
Table 4. Bending and equivalent bending strength.
SpecimenBending strength (MPa)Equivalent bending strength (MPa)
SP1SP2SP3AverageSP1SP2SP3Average
PA7-RFA505.315.185.695.393.284.113.863.75
PA8-RFA505.216.115.305.543.424.203.683.77
PA9-RFA505.595.715.465.593.323.683.343.45
PA7-RFA604.825.094.054.653.633.723.013.45
PA8-RFA604.044.394.424.283.773.363.243.46
PA9-RFA605.115.604.595.104.074.474.314.29
PA10-RFA604.515.104.414.975.605.094.785.16

3.2.2. Load-Deflection Relationship of PAFRC

Load-deflection curves of three specimens were generated, as presented in Figure 9. Overall load-deflection curves were similar to polypropylene FRC [24,25,26,27,28,29] and synthetic FRC [30,31,32]. The load-deflection curves linearly increased up to the first-peak. After the first-peak, the loads were dropped approximately 50%. Then the curves exhibited convex shapes increasing and decreasing after the second-peak.
The PA fibers did not notably change the first-peak, but the post-cracking behaviors of all specimens were significantly improved. All specimens produced two peak bending strengths. The first-peaks apparently occurred near 0.005 mm of deflection and decreased up to 0.5 mm of deflection, which was approximately the lowest bending strength after the first-peaks. The load-deflection curves increased up to second-peaks until the deflections reached between 1.0 and 1.5 mm after the lowest peaks. The curves moderately decreased after the second-peaks, compared to the lines after the first-peaks.
The first-peak loads were 17975, 18468 and 18624 N for the RFA50 series and 15514, 14280, 16993 and 16572 N for the RFA60 series, respectively. The results show that the first-peak loads tended to increase as PA fiber content increased. However, the first-peak loads for PA8-RFA60 and PA10-RFA60 were smaller than for PA7-RFA60 and PA9-RFA60, respectively, because the first-peak loads are related to the concrete strength. Also, it should be noted that the first-peaks of the RFA50 series were larger than those of the RFA60 series, which was contrary to the bending strength, although the second-peaks of the RFA60 series were larger than those of the RFA50 series.
Initial PA fiber elongation was observed after the first-peak load. Since PA fiber tends to exhibit hyper-elasticity, a deflection occurs up to the inflection point and thereafter the load-deflection curve rapidly increases. In Figure 9, all PAFRC specimens exhibit the kinked (inflection) points after the first-peak near the L/600 and PA fiber elongation.
The second-peaks of the RFA50 series specimens were similar to the first-peaks. However, as discussed in Section 4.1, the second-peaks of the RFA60 series specimens exceeded the first-peaks. The ratios of the first to second-peak loads were 81.7, 85.6 and 74.5% for the RFA50 series and 100.2, 116.5, 113.8 and 153.0% for the RFA60 series. Detailed discussion regarding the flexural responses is provided in the following section.

4. Analysis

4.1. Flexural Responses of PAFRC

The flexural responses of PAFRC at δ1, δ2, 3δ1, 5.5δ1, 10.5δ1, L/600 and L/150 were investigated for loads, bending strength and toughness. The results are tabulated in Table 5 in the order of increasing deflections. The flexural responses in terms of bending strength, deflection and toughness are presented in Table 5 and Figure 10. Bending strength decreased from f1 to f600, and then increased up to f2 for all specimens. These bending strength fluctuations correspond to the load-deflection curves in Figure 9.
PA fiber content significantly influenced the second-peaks, as seen in Figure 10a,c. This results implies that the first-peaks are mainly dependent on the concrete strength. However, the deflections at the first-peaks were insignificantly influenced by PA fiber content as in Figure 10b,d. Toughness after the second-peak was significantly influenced by PA fiber content as seen in Figure 10e,f,g), while toughness before the second-peak was not. The PA fiber produces two peaks, as in Figure 9. Up to L/600 (=0.5 mm), which is an approximate lowest point, deflections are smaller than the second-peak and PA fiber bending strength is not exerted. However, PA fiber significantly improves the bending strength beyond L/600. Also, the toughness results of both the RFA 50 and 60 series at L/150 (=2.0 mm) lay between the maximum and minimum toughness ( T 150 100 ) suggested by ASTM C1609/C1609M-10 [20].
Figure 10. Average flexural responses of PAFRC. (a) Strength for first- and second-peak; (b) deflection for first- and second- peak; (c) strength for L/600 and L/150; (d) deflection for 3δ1, 5.5δ1 and 10.5δ1; (e) toughness for first- and second-peak; (f) toughness for 3δ1, 5.5δ1 and 10.5δ1; (g) PA-10-RFA60.
Materials 07 07634 g010
Table 5. Average value of flexural responses of PAFRC.
LocationResponsePA-7-RFA50PA-8-RFA50PA-9-RFA50PA-7-RFA60PA-8-RFA60PA-9-RFA60PA-10-RFA60
First-peakP (N)17975184681862415514142801699316572
δ (mm)0.0450.0450.0420.0520.0440.0570.042
f (MPa)5.395.545.594.654.285.104.97
T (Joule)0.5200.5080.4810.5800.3960.6590.415
1P (N)15678164031653813204120871409614653
δ (mm)0.1340.1350.1250.1560.1320.1700.126
f (MPa)4.704.924.963.963.634.234.40
T (Joule)2.1102.1352.0192.0391.5672.4081.751
5.5δ1P (N)1333614095143971025794981140212351
δ (mm)0.2460.2480.2300.2860.2410.3110.231
f (MPa)4.004.234.323.082.853.423.71
T (Joule)3.5943.7803.6083.6342.7854.1383.081
10.5δ1P (N)86811053010213640566861026310781
δ (mm)0.4690.4730.4390.5460.4610.5940.441
f (MPa)2.703.163.061.922.013.083.23
T (Joule)6.0376.5306.1355.6664.4204.5185.395
L/600 (=0.50 mm) P 600 100 (N)87999972893366477094965810863
f 600 100 (MPa)2.642.992.681.992.132.903.26
T600(Joule)6.3696.7826.7765.3934.6996.8336.089
Second-peakP2 (N)14685158071395415540158431933325357
δ2 (mm)1.2611.4191.3211.4291.2981.2841.456
f2 (MPa)4.414.744.194.664.755.807.61
T2 (Joule)15.59617.00314.90215.22513.56816.69522.616
L/150 (=2.00 mm) P 150 100 (N)11589121071012912059113201355418755
f 150 100 (MPa)3.483.633.043.623.404.075.63
T150 (Joule)24.98125.11422.98223.01923.04628.56934.401
R T , 150 100 (%)69.667.961.774.28184.5104.0

4.2. Toughness Performance Levels

The toughness performance levels (TPL) by Chen (1995) [32] were used to specify the PAFRC toughness information. As discussed in the last paragraph of Section 4.1, the PAFRC toughness lay between the maximum and minimum of ASTM C1609/C1609M-10 [20]. However, this information is not enough to explain the toughness characteristics of PAFRC and therefore, a detailed description is required to verify compliance with construction specifications, or quality control, of in-service PAFRC. In tunneling practice, the TPL by Chen [33] (1995) is commonly used for steel fiber reinforced shotcrete.
The TPL is based on nominal residual flexural strengths based on the load-deflection curves at δ1, L/600 and L/150. The TPL defines five different toughness levels and corresponding residual loads, as in Table 6. Equivalent flexural toughness parameters to TPL levels can be found in Chen (1995). The residual loads here were computed based on the 100 × 100 × 300 mm specimen size. A design flexural strength of 4.0 MPa, which is equivalent to a design flexural load of 13,333 N, was adopted in this study as it is a common practice in tunnel shotcrete. It should be noted that the TPL does not consider the unstable region in the load-deflection curves, i.e. from the first-crack (δ1) to L/600 (=0.5 mm). Load-deflection curves of each specimen were investigated to determine the TPL levels presented in Figure 11.
Figure 11. Toughness performance level. (a) PA-7-RFA50; (b) PA-8-RFA50; (c) PA-9-RFA50; (d) PA-7-RFA60; (e) PA-8-RFA60; (f) PA-9-RFA60; (g) PA-10-RFA60; (h) TPL Levels.
Materials 07 07634 g011aMaterials 07 07634 g011b
Table 6. Toughness performance level criteria.
TPL LevelResidual loads (% of Design flexural strength)
at δ1 (=0.047 mm)at L/600 (=0.5 mm)at L/150 (=2.0 mm)
0No fiber reinforced
I13333 (100%)2000 (15%)667 (5%)
II13333 (100%)4000 (30%)2000 (15%)
III13333 (100%)6667 (50%)4000 (30%)
IV13333 (100%)10000 (15%)6000 (45%)
The determined TPL levels are presented in Table 7. This study investigated at three points and took the lowest level among all specimens for each specimen type. It is clearly shown in Table 7 that all specimens of the RFA50 series satisfied Level III. However, for the RFA60 series, specimens with lower PA fiber content exhibited Level II, and those with higher PA fiber contents exhibited Level III. Therefore, the RFA60 series requires greater PA fiber content compared to the RFA50 series. Moreover, all the performance levels satisfied Level IV at δ1 and L/150 (=2.0 mm) although lower performance levels were found at L/600 (=0.5 mm). As seen in Figure 11, the load-deflection curves rapidly decreased after the first-peaks, but the loads increased as the deflection increased to satisfy Level IV. This finding implies that the TPL analysis by Chen (1995) is not enough to explain the full toughness characteristics of PAFRC that has a sudden drop after the first-peak in the load-deflection curve.
Table 7. Toughness performance levels.
Specimenat δ1at L/600 (=0.5 mm)at L/150 (=2.0 mm)TPL Level
SP1SP2SP3Lvl.SP1SP2SP3Lvl.SP1SP2SP3Lvl.
PA7-RFA50IVIVIVIVIIIIIIIIIIIIIVIVIVIVIII
PA8-RFA50IVIVIVIVIVIVIIIIIIIVIVIVIVIII
PA9-RFA50IVIVIVIVIIIIIIIIIIIIIVIVIVIVIII
PA7-RFA60IVIVIVIVIIIIIIIIIIIVIVIVIVII
PA8-RFA60IVIVIVIVIIIIIIIIIIIVIVIVIVII
PA9-RFA60IVIVIVIVIIIIIIIVIIIIVIVIVIVIII
PA10-RFA60IVIVIVIVIVIIIIVIIIIVIVIVIVIII

5. Conclusions

This study described the development and processing of a macro-sized PA fiber to be used in concrete reinforcement, and then investigated the influence of the PA fiber on flexural responses in accordance with ASTM standards C1018-97 and C1609/C 1609M-05. The conclusions derived from this study are as follows:
  • The compressive strength and the first-peak were not notably influenced by the PA fiber contents because PA fiber contents considered in this study did not deteriorate the compressive strength and PA fibers were intended to resist tensile stresses. However, the PA fiber significantly improved flexural responses and toughness after the deflection of L/600 as the PA fiber content was increased. Before L/600 deflection, PA fiber tensile strength was so low that allowed the first crack of concrete specimens, but after L/600 deflection, PA fibers started to exert high tensile strength and increased ductility and toughness of concrete.
  • The PA fibers produced two peak bending strengths. The first-peaks apparently occurred near 0.005 mm of deflection and decreased up to 0.5 mm (L/600) of deflection, which was the approximately lowest bending strength after the first peak. Then the bending strength increased up to second peak until the deflections reached between 1.0 and 1.5 mm after the lowest peaks. The load-deflection curve decreased moderately after the second-peak compared to the decreasing slope after the first-peak.
  • Toughness performance level (TPL) results exhibited Level III for all specimens in the RFA50 series based on the design flexural strength of 4.0 MPa. However, for the RFA60 series, specimens with less than 8 kg of PA fiber content were determined to be Level II, and specimens with 9 and 10 kg of PA fiber content were determined to be Level III. Therefore, the RFA60 series requires greater PA fiber content compared to the RFA50 series. However, due to the PA fiber characteristic, load-deflection curves exhibited that PAFRC satisfy Level IV at δ1 and L/150 (=2.0 mm) except at L/600 (=0.5 mm). Therefore, the TPL analysis is not enough to explain the full toughness characteristics of PAFRC that has a drop after the first-peak in the load-deflection curve.

Acknowledgments

This research was supported by a grant from a Construction Technology Research Project (Development of impact/blast resistant HPFRCC and evaluation technique thereof (13SCIPS02)) funded by the Ministry on Land, Infrastructure, and Transport, and by Basic Science Research Program through the National Research Foundation of Korea (NRF) funded by the Ministry of Education, Science and Technology (NRF-2012R1A1A1044378).

Author Contributions

Joong Kyu Jeon planned and performed experimental tests and WooSeok Kim analyzed the experimental data. Chan Ki Jeon and Jin Cheol Kim reviewed and guided this study and provided valuable comments.

Conflicts of Interest

The authors declare no conflict of interest.

References

  1. Kim, D.J.; Kang, S.H.; Ahn, T. Mechanical Characterization of high-performance steel-fiber reinforced cement composites with self-healing effect. Materials 2014, 7, 508–526. [Google Scholar] [CrossRef]
  2. Kim, D.J.; Park, S.H.; Ryu, G.S.; Koh, K.T. Comparative flexural behavior of hybrid ultra high performance fiber reinforced concrete with different macro fibers. Constr. Build. Mater. 2011, 25, 4144–4155. [Google Scholar] [CrossRef]
  3. Mindess, S.; Chen, L.; Morgan, D.R. Determination of the first-crack strength and flexural toughness of steel fiber-reinforced concrete. Adv. Cem. Based. Mater. 1994, 1, 201–208. [Google Scholar] [CrossRef]
  4. Soroushian, P.; Elyamany, H.; Tlili, A.; Ostowari, K. Mixed-mode fracture properties of concrete reinforced with low volume fractions of steel and polypropylene fibers. Cem. Concr. Compos. 1998, 20, 67–78. [Google Scholar] [CrossRef]
  5. Song, P.S.; Hwang, S.; Sheu, B.C. Strength properties of nylon- and polypropylene-fiber-reinforced concretes. Cem. Concr. Res. 2005, 35, 1546–1550. [Google Scholar] [CrossRef]
  6. Alberti, M.G.; Enfedaque, A.; Gavez, J.C. On the mechanical properties and fracture behavior of polyolefin fiber-reinforced self-compacting concrete. Constr. Build. Mater. 2014, 55, 274–288. [Google Scholar] [CrossRef]
  7. Yap, S.P.; Alengaram, U.J.; Jumaat, M.Z. Enhancement of mechanical properties in polypropylene- and nylon-fiibre reinforced oil palm shell concrete. Mater. Des. 2013, 49, 1034–1041. [Google Scholar] [CrossRef]
  8. Zhu, J.; Zhu, M.; Han, N.; Liu, W.; Xing, F. Electrical and mechanical performance of carbon fiber-reinforced polymer used as the impressed current anode material. Materials 2014, 7, 5438–5453. [Google Scholar] [CrossRef]
  9. Nishiwaki, T.; Kwon, S.; Homma, D.; Yamada, M.; Mihashi, H. Self-healing capability of fiber-reinforced cementitious composites for recovery of watertightness and mechanical properties. Materials 2014, 7, 2141–2154. [Google Scholar] [CrossRef]
  10. Kant, M.; Penumadu, D. Dynamic mechanical characterization for nonlinear behavior of single carbon fibers. Composites 2014, 66, 201–208. [Google Scholar] [CrossRef]
  11. Bentur, A.; Mindess, S. Fiber Reinforced Cementitious Composites; Elsevier: London, UK, 1990. [Google Scholar]
  12. Soroushian, P.; Khan, A.; Hsu, J.W. Mechanical properties of concrete materials reinforced with polypropylene or polyethylene fibers. ACI Mater. J. 1992, 89, 535–540. [Google Scholar]
  13. Mobasher, B.; Shah, S.P. Interaction between fibers and the matrix in glass fiber reinforced concrete. In Thin-Section Fiber Reinforced Concrete and Ferrocement (Sp 124); American Concrete Institute: Detroit, MI, USA, 1991; pp. 137–156. [Google Scholar]
  14. Mobasher, B.; Ouyang, C.; Shah, S.P. Modeling of fiber toughness in cementitious materials using an R-curve approach. Int. J. Fract. 1991, 50, 199–219. [Google Scholar] [CrossRef]
  15. Hannant, D.J. Fiber Cements and Fiber Concrete; Wiley: Chichester, UK, 1987. [Google Scholar]
  16. Caggiano, A.; Cremona, M.; Faella, C.; Lima, C.; Martinelli, E. Fracture behavior of concrete beams reinforced with mixed long/short steel fibers. Constr. Build. Mater. 2012, 37, 832–840. [Google Scholar] [CrossRef]
  17. Yao, W.; Li, J.; Wu, K. Mechanical properties of hybrid fiber-reinforced concrete at low fiber volume fraction. Cem. Concr. Res. 2003, 33, 27–30. [Google Scholar] [CrossRef]
  18. Yoon, J.H.; Jeon, J.K.; Kim, Y.K.; Chung, J.M. A fasibility study on polyamide fiber reinforced shotcrete for rock support in a tunnel. In Proceedings of the World Tunnel Congress 2013, Geneva, Switzerland, 31 May–7 June 2013; pp. 1–8.
  19. Structural Test Method for Flexural Toughness and First Crack Strength of Fiber Reinforced Concrete (Using Beam with Third Point Loading); ASTM C1018-97; ASTM International: West Conshohocken, PA, USA, 1998.
  20. Structural Test Method for Flexural Performance of Fiber Reinforced Concrete (Using Beam with Third Point Loading); ASTM C1609/C1609M-05; ASTM International: West Conshohocken, PA, USA, 2006.
  21. Elasto Plastic Concrete. http://www.elastoplastic.com (accessed on 8 January 2014).
  22. Kim, J.J.; Kim, D.J.; Kang, S.T.; Lee, J.H. Influence of sand to coarse aggregate ratio on the interfacial bond strength of steel fibers in concrete for nuclear power plant. Nucl. Eng. Des. 2012, 252, 1–10. [Google Scholar] [CrossRef]
  23. Standard Test Method for Flexural Strength of Concrete (Using Simple Beam with Third-Point Loading); ASTM C78/C78M; ASTM International: West Conshohocken, PA, USA, 2010.
  24. Wang, J.-Y.; Chia, K.-S.; Liew, J.-Y.R.; Zhang, M.-H. Flexural performance of fiber-reinforced ultra lightweight cement composites with low fiber content. Cem. Concr. Compos. 2013, 43, 39–47. [Google Scholar] [CrossRef]
  25. Felekoglu, B.; Tosun, K.; Baradan, B. A comparative study on the flexural perforamance of plasma treated polypropylene fiber reinforced cementitious composites. J. Mater. Process. Technol. 2009, 209, 5133–5144. [Google Scholar] [CrossRef]
  26. Behfarnia, K.; Beharavan, A. Application of high performance polypropylene fibers in concrete lining of water tunnels. Mater. Des. 2014, 55, 274–279. [Google Scholar] [CrossRef]
  27. Cengiz, O.; Turanli, L. Comparative evaluation of steel mesh, steel fibre and high-performance polypropylene fibre reinforced shotcrete in panel test. Cem. Concr. Res. 2004, 34, 1357–1364. [Google Scholar] [CrossRef]
  28. Kim, D.J.; Naaman, A.E.; El-Tawil, S. Comparative flexural behavior of four fiber reinforced cementitious composites. Cem. Concr. Compos. 2008, 30, 917–928. [Google Scholar] [CrossRef]
  29. Hsie, M.; Tu, C.; Song, P.S. Mechanical properties of polyprolylene hybrid fiber-reinforced conrete. Mater. Sci. Eng. A 2007, 494, 153–157. [Google Scholar] [CrossRef]
  30. Kobayashi, K.; Cho, R. Flexural behaviour of polyethylene fibre reinforced concrete. Int. J. Cem. Compos. Lightweight Concr. 1981, 3, 19–25. [Google Scholar] [CrossRef]
  31. Kobayashi, K.; Cho, R. Flexural characteristics of steel fibre and polyethylene fibre hybrid-reinforced concrete. Composites 1982, 13, 164–168. [Google Scholar] [CrossRef]
  32. Soutsos, M.N.; Le, T.T.; Lampropoulos, A.P. Flexural performance of fibre reinforced concrete made with steel and synthetic fibres. Constr. Build. Mater. 2012, 36, 704–710. [Google Scholar] [CrossRef]
  33. Chen, L. Flexural Toughness of Fibre Reinforced Concrete. Ph.D. Thesis, University of British Columbia, Vancouver, BC, Canada, September 1995. [Google Scholar]

