Mechanism for Tuning the Hydrophobicity of Microfibrillated Cellulose Films by Controlled Thermal Release of Encapsulated Wax

Abstract
:
1. Introduction
2. Results and Discussion
2.1. Thermal Analysis of Modified MFC Fibers
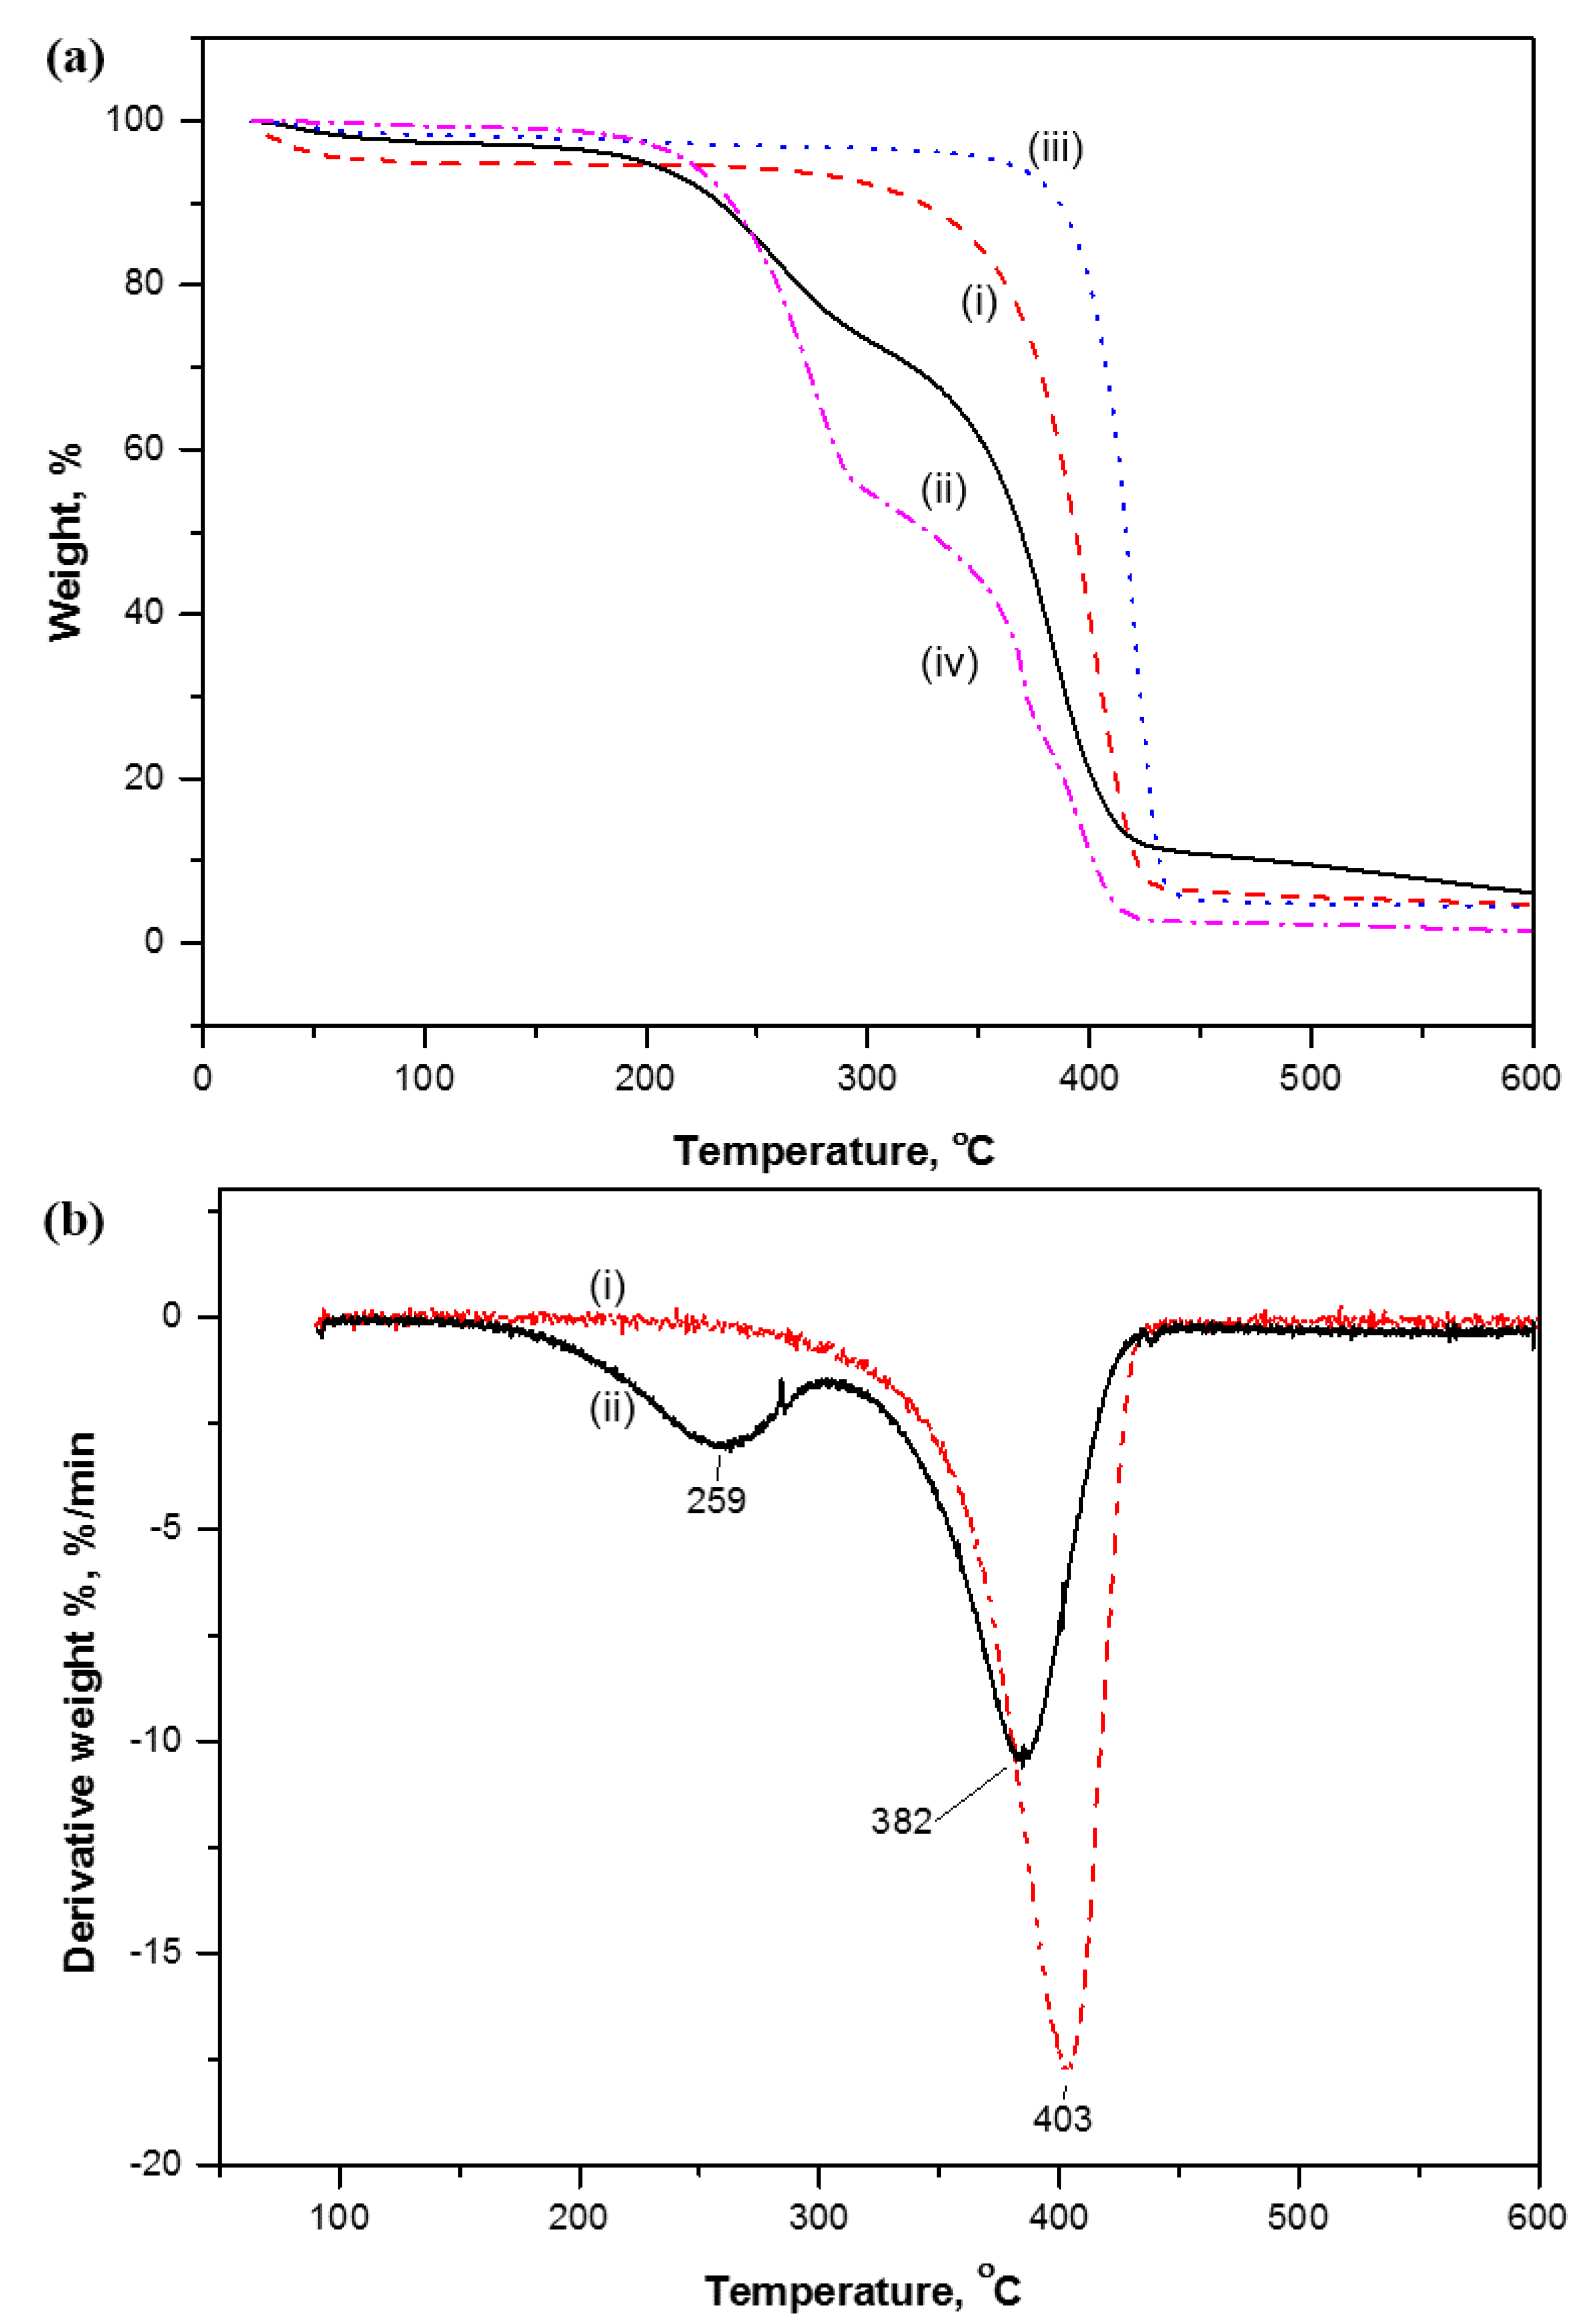
2.1.1. Thermogravimetric Analysis

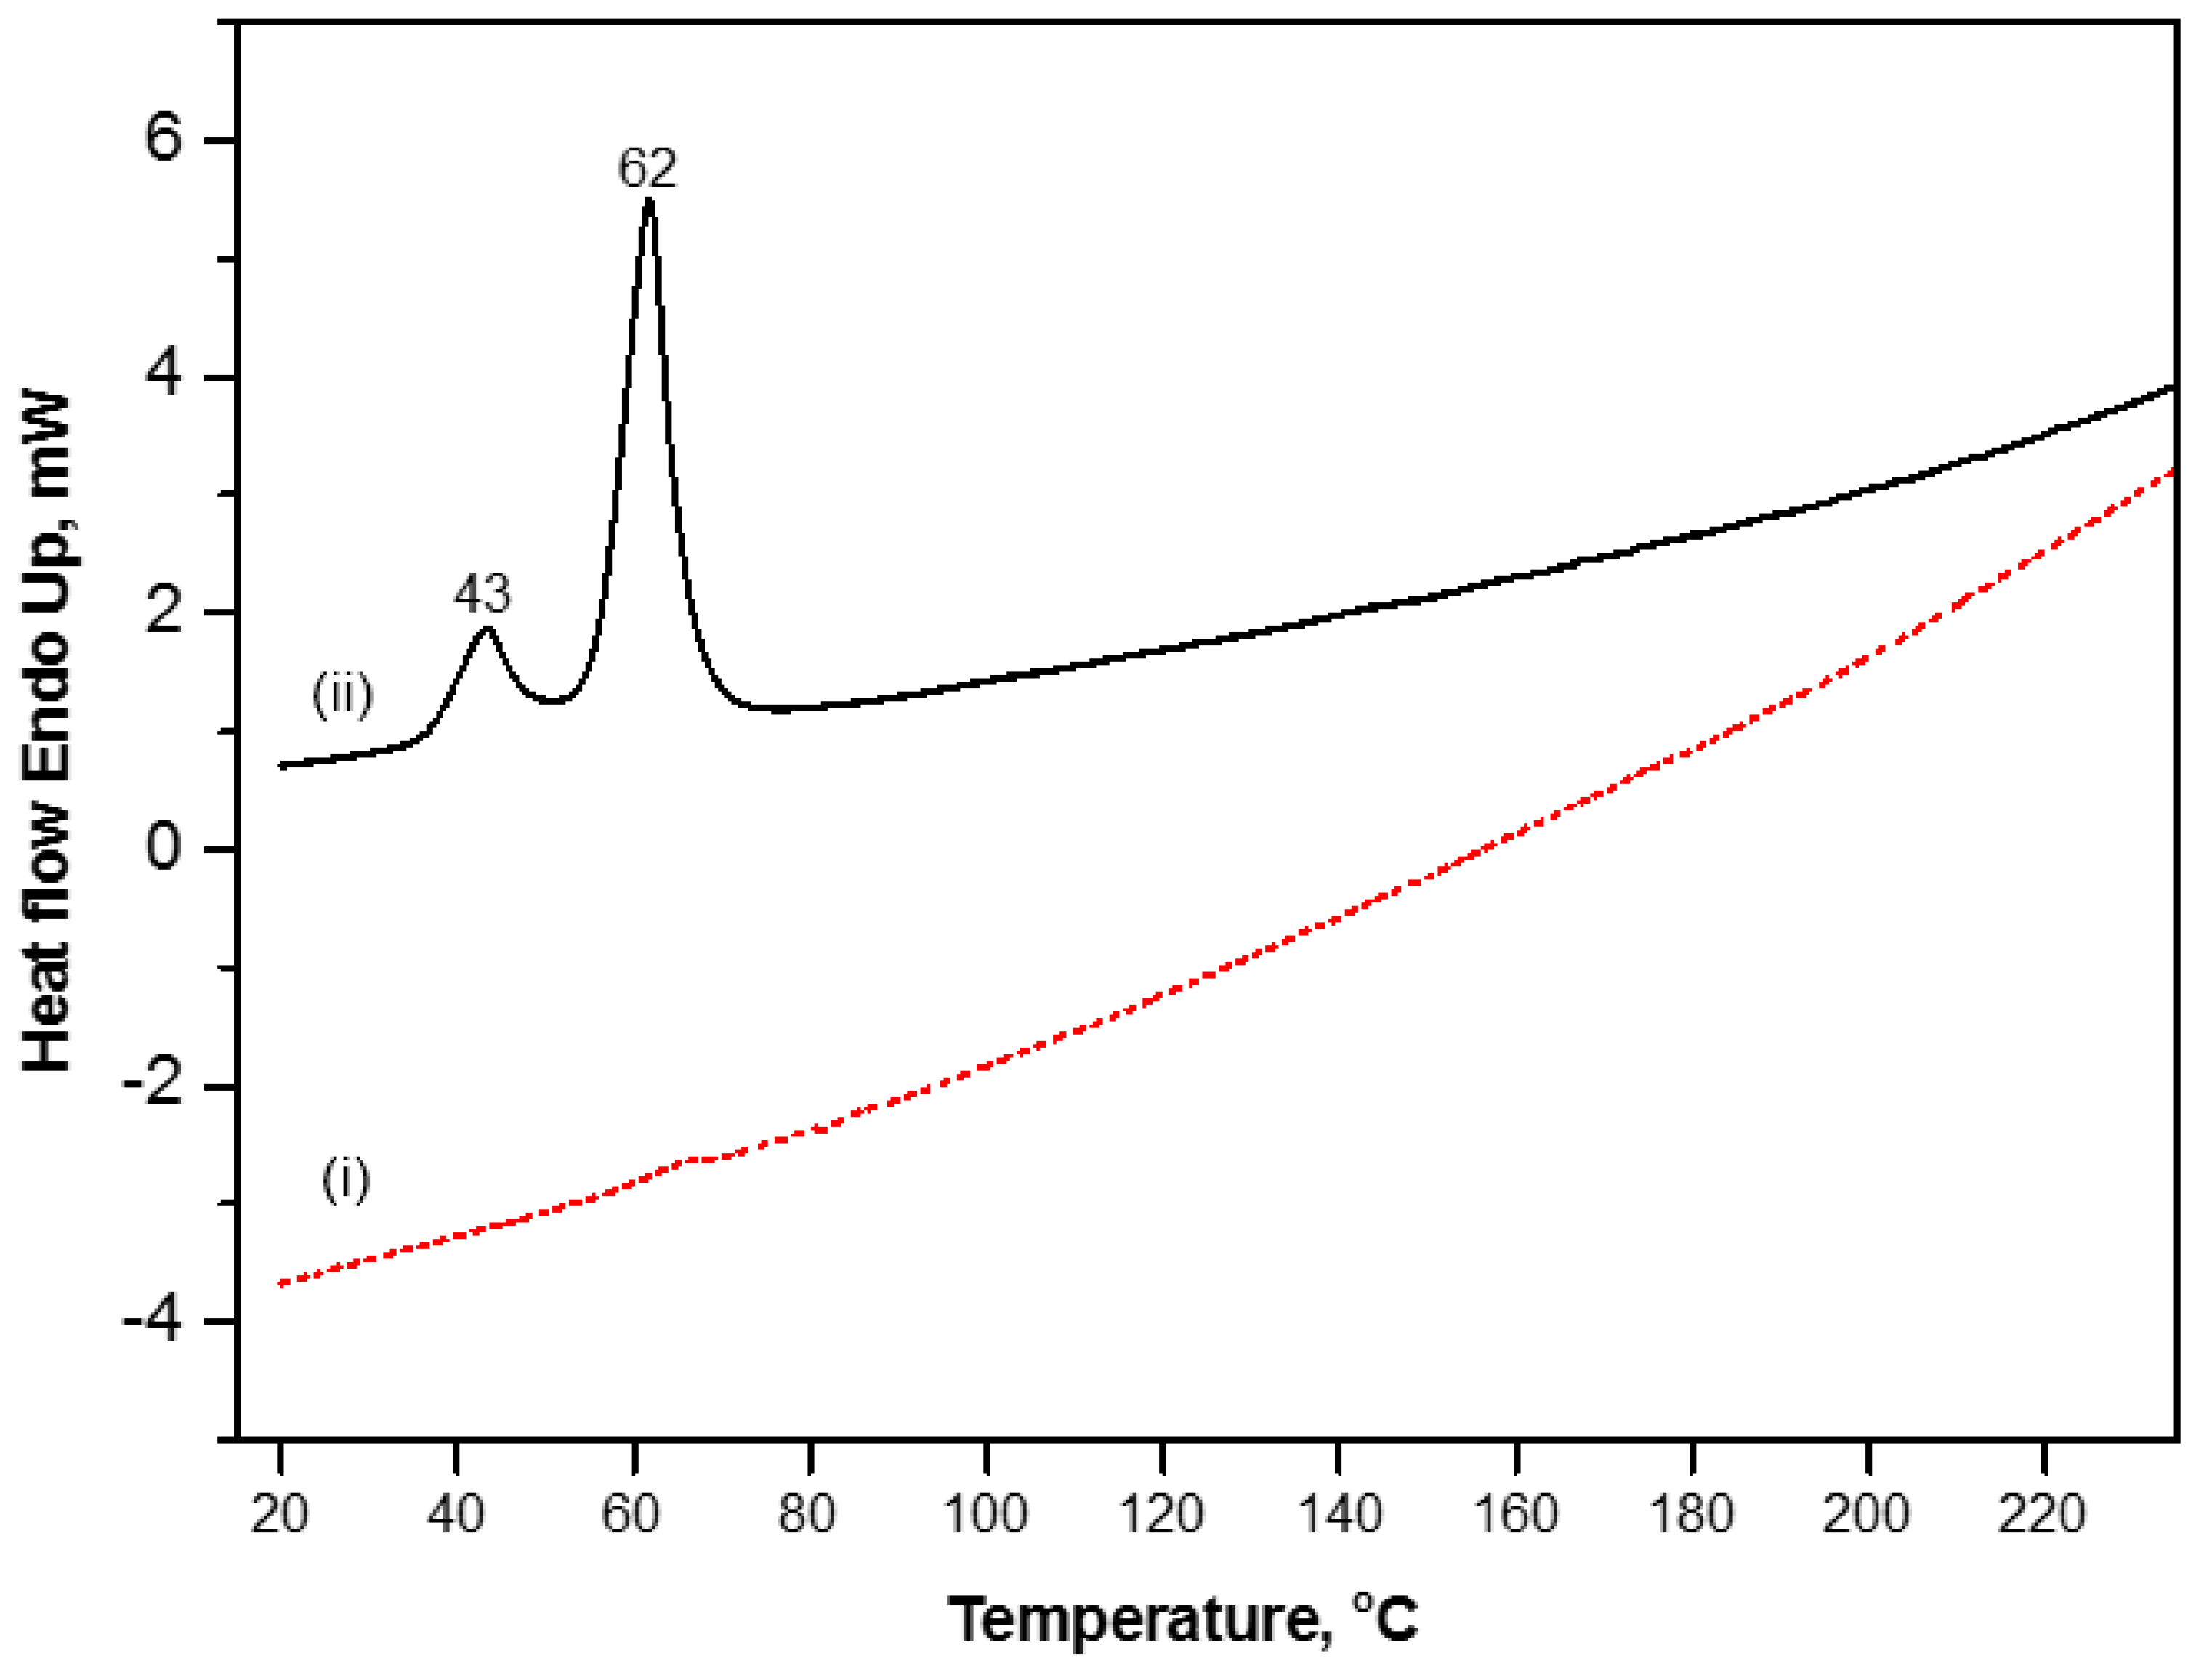
2.1.2. Differential Scanning Calorimetry

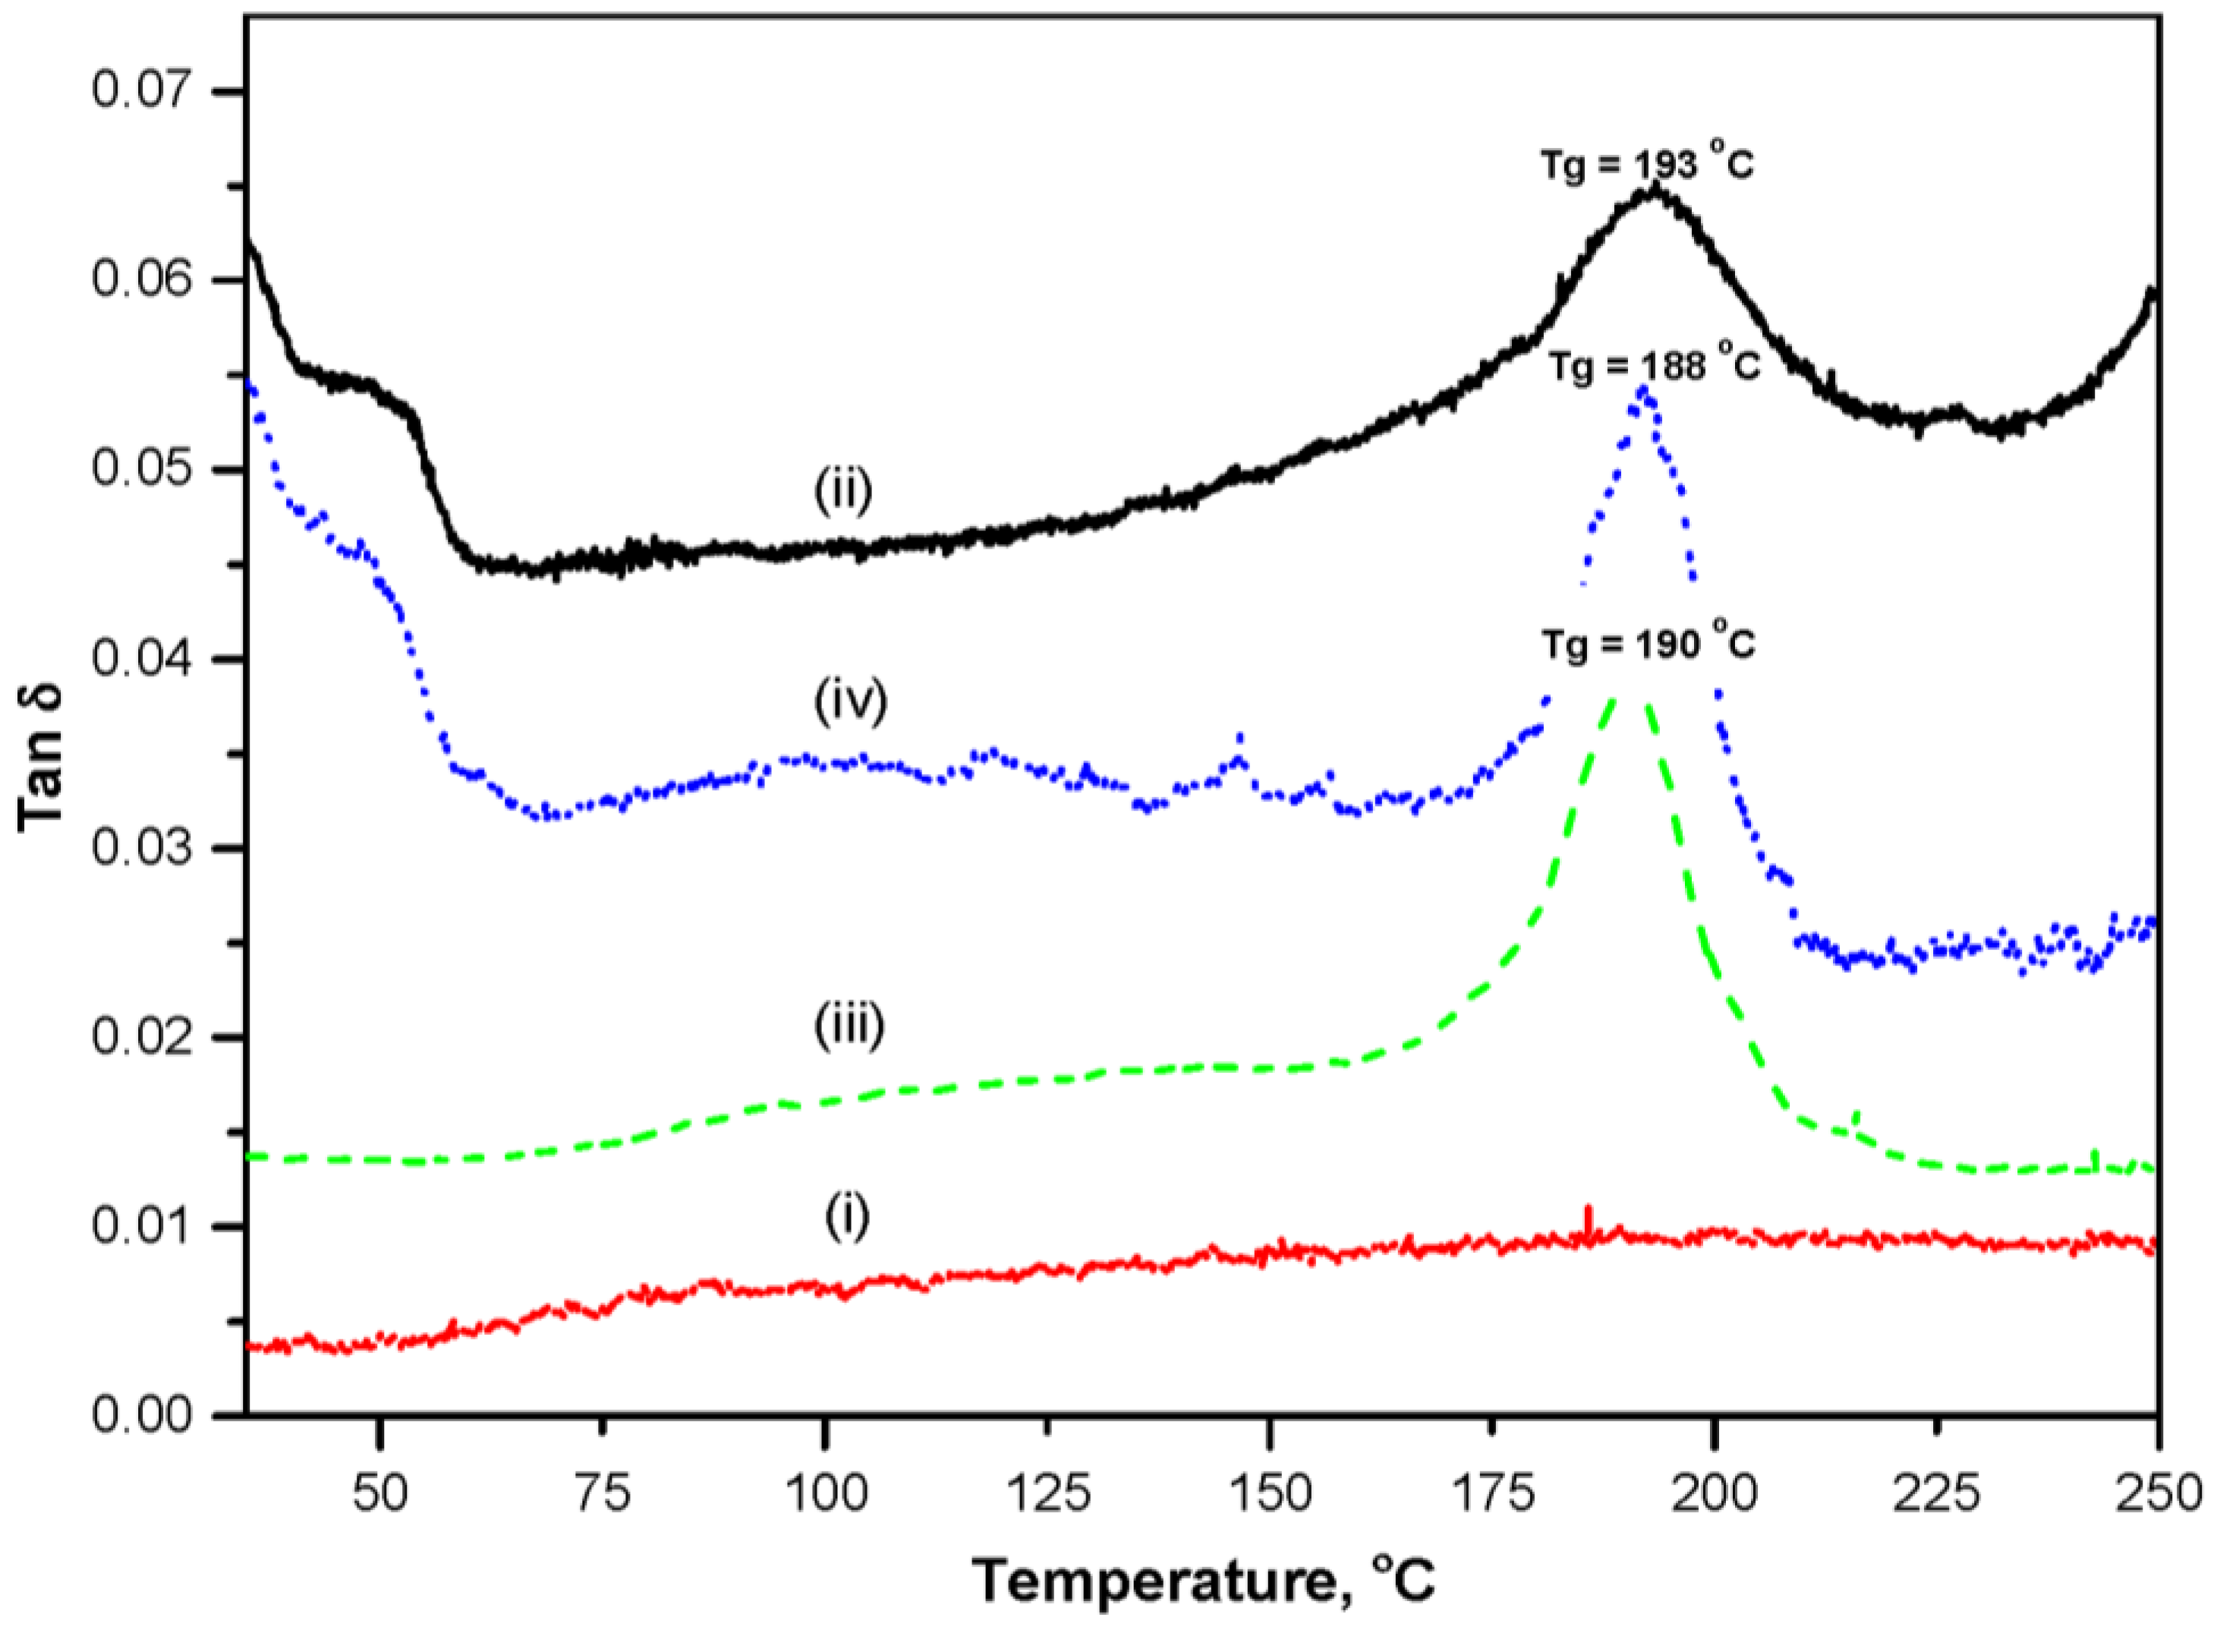
2.1.3. Dynamic Mechanical Analysis
2.2. Morphological Analysis
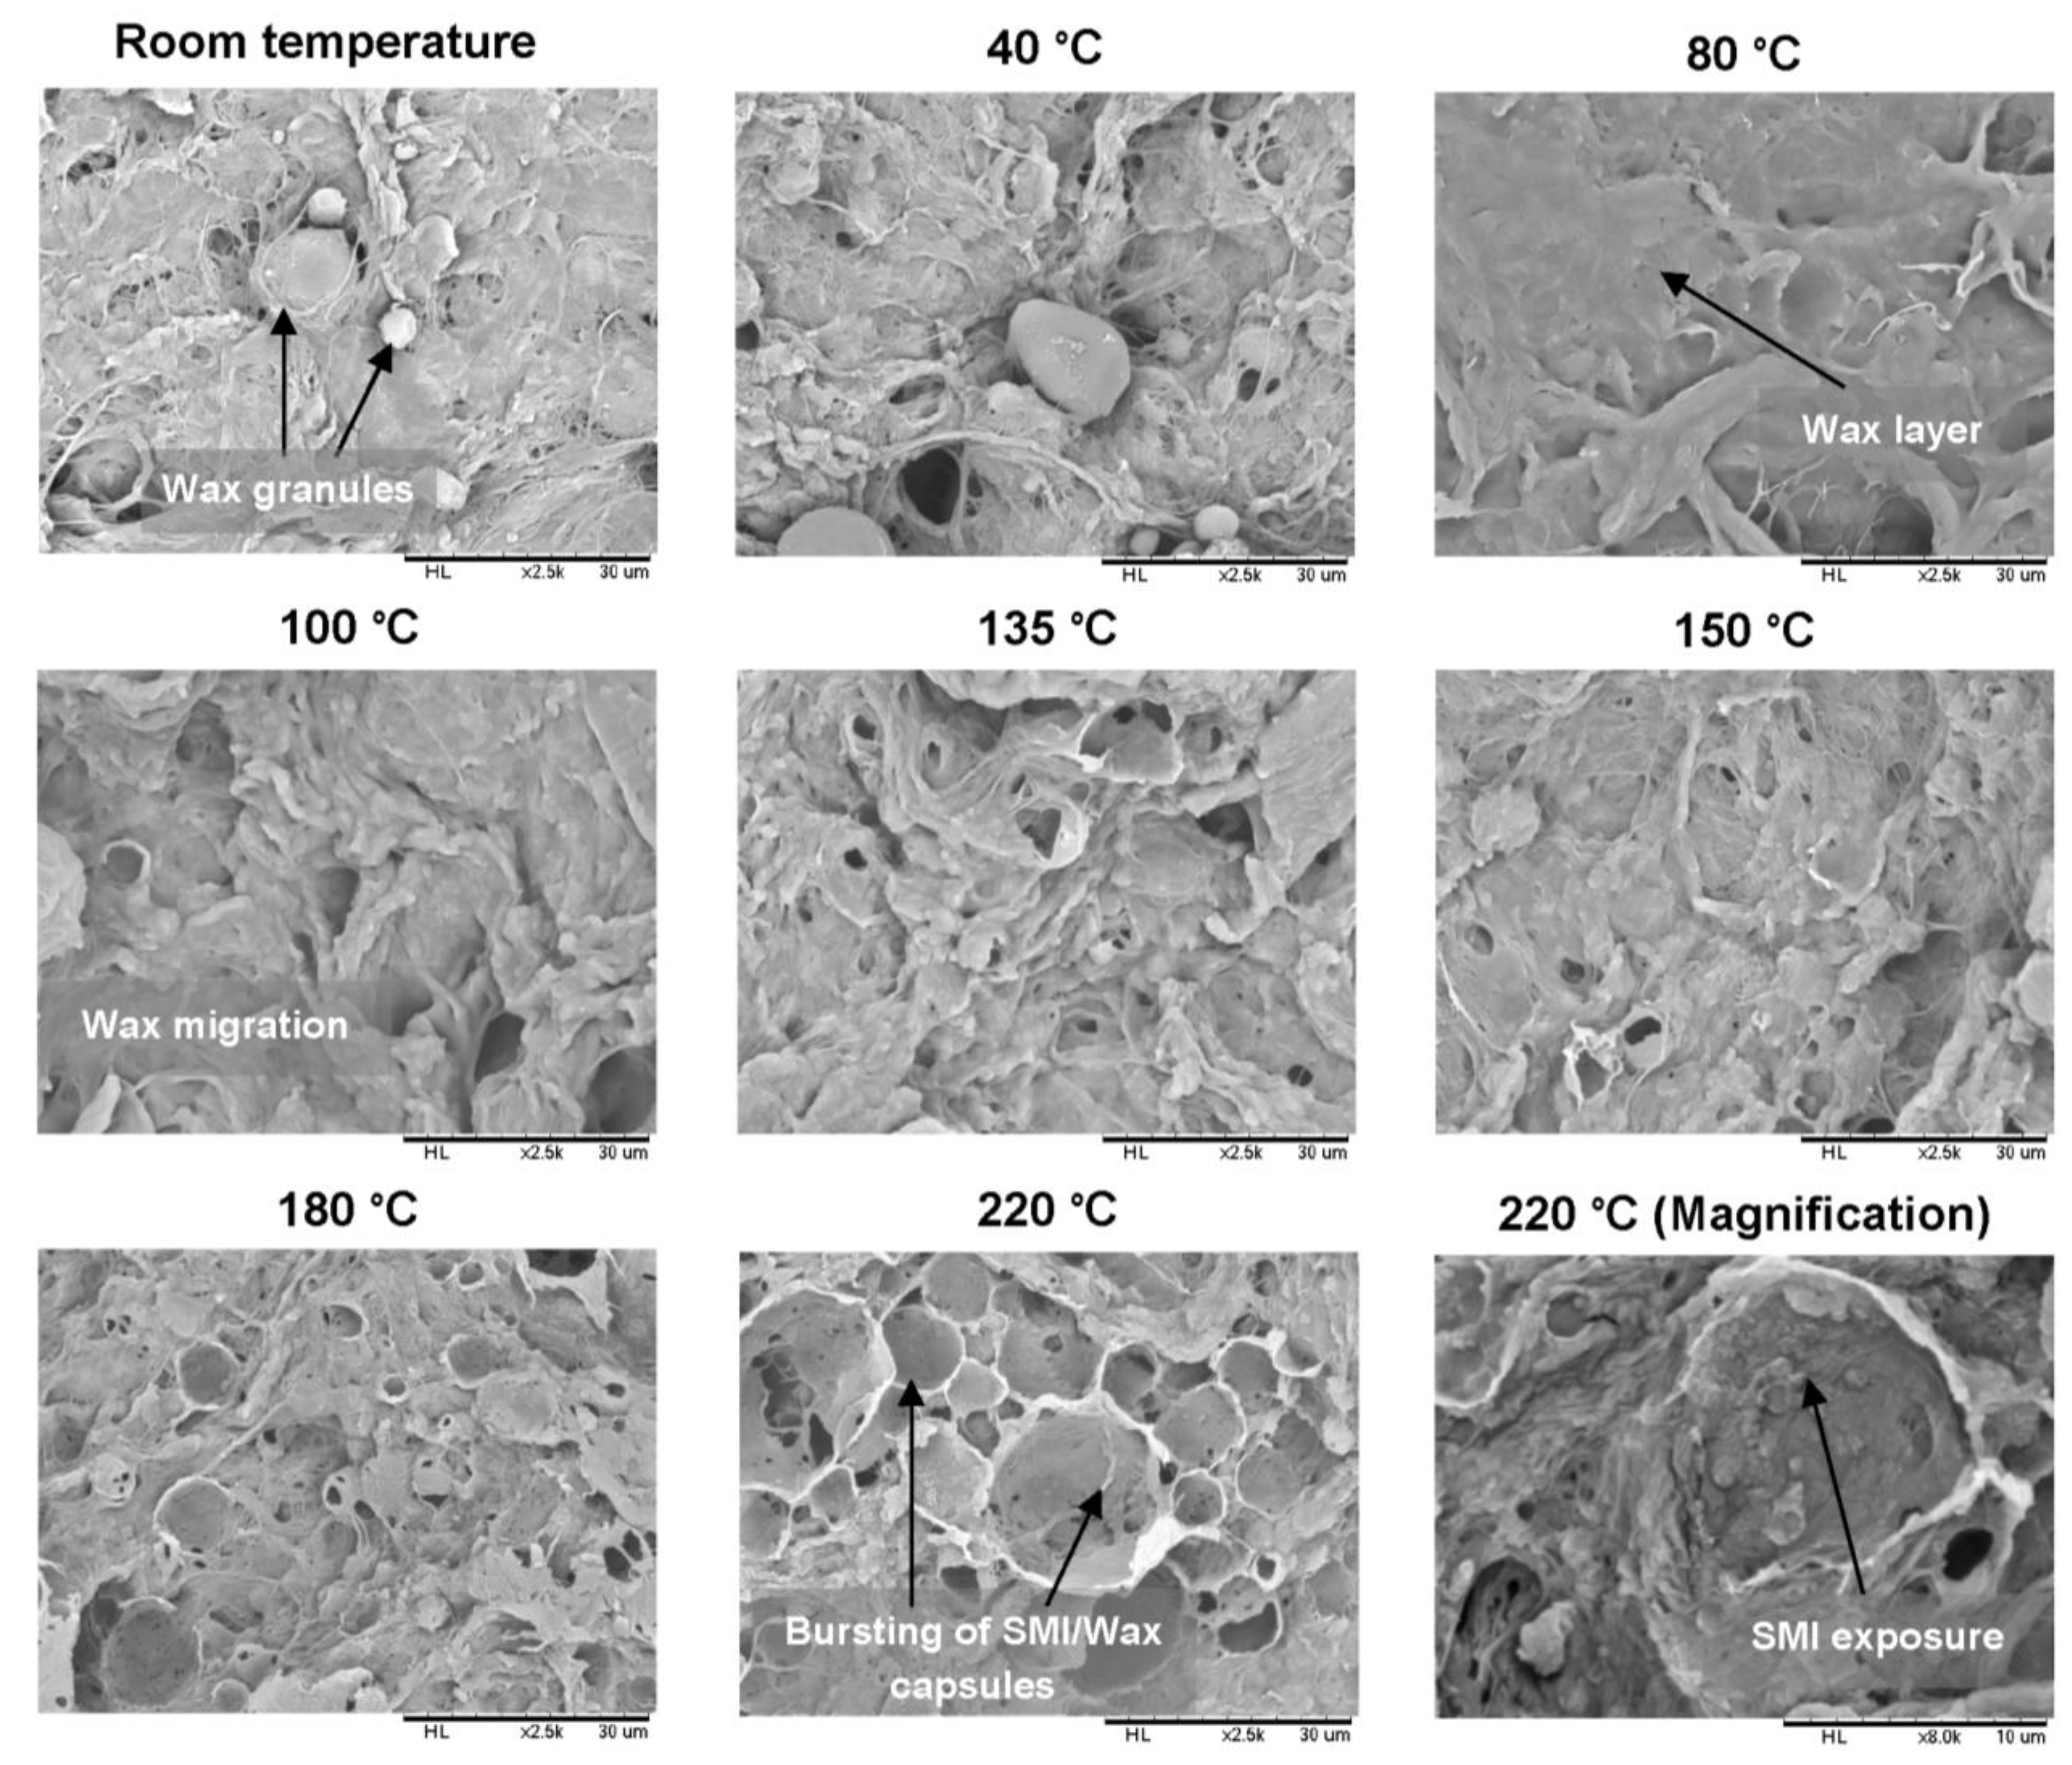
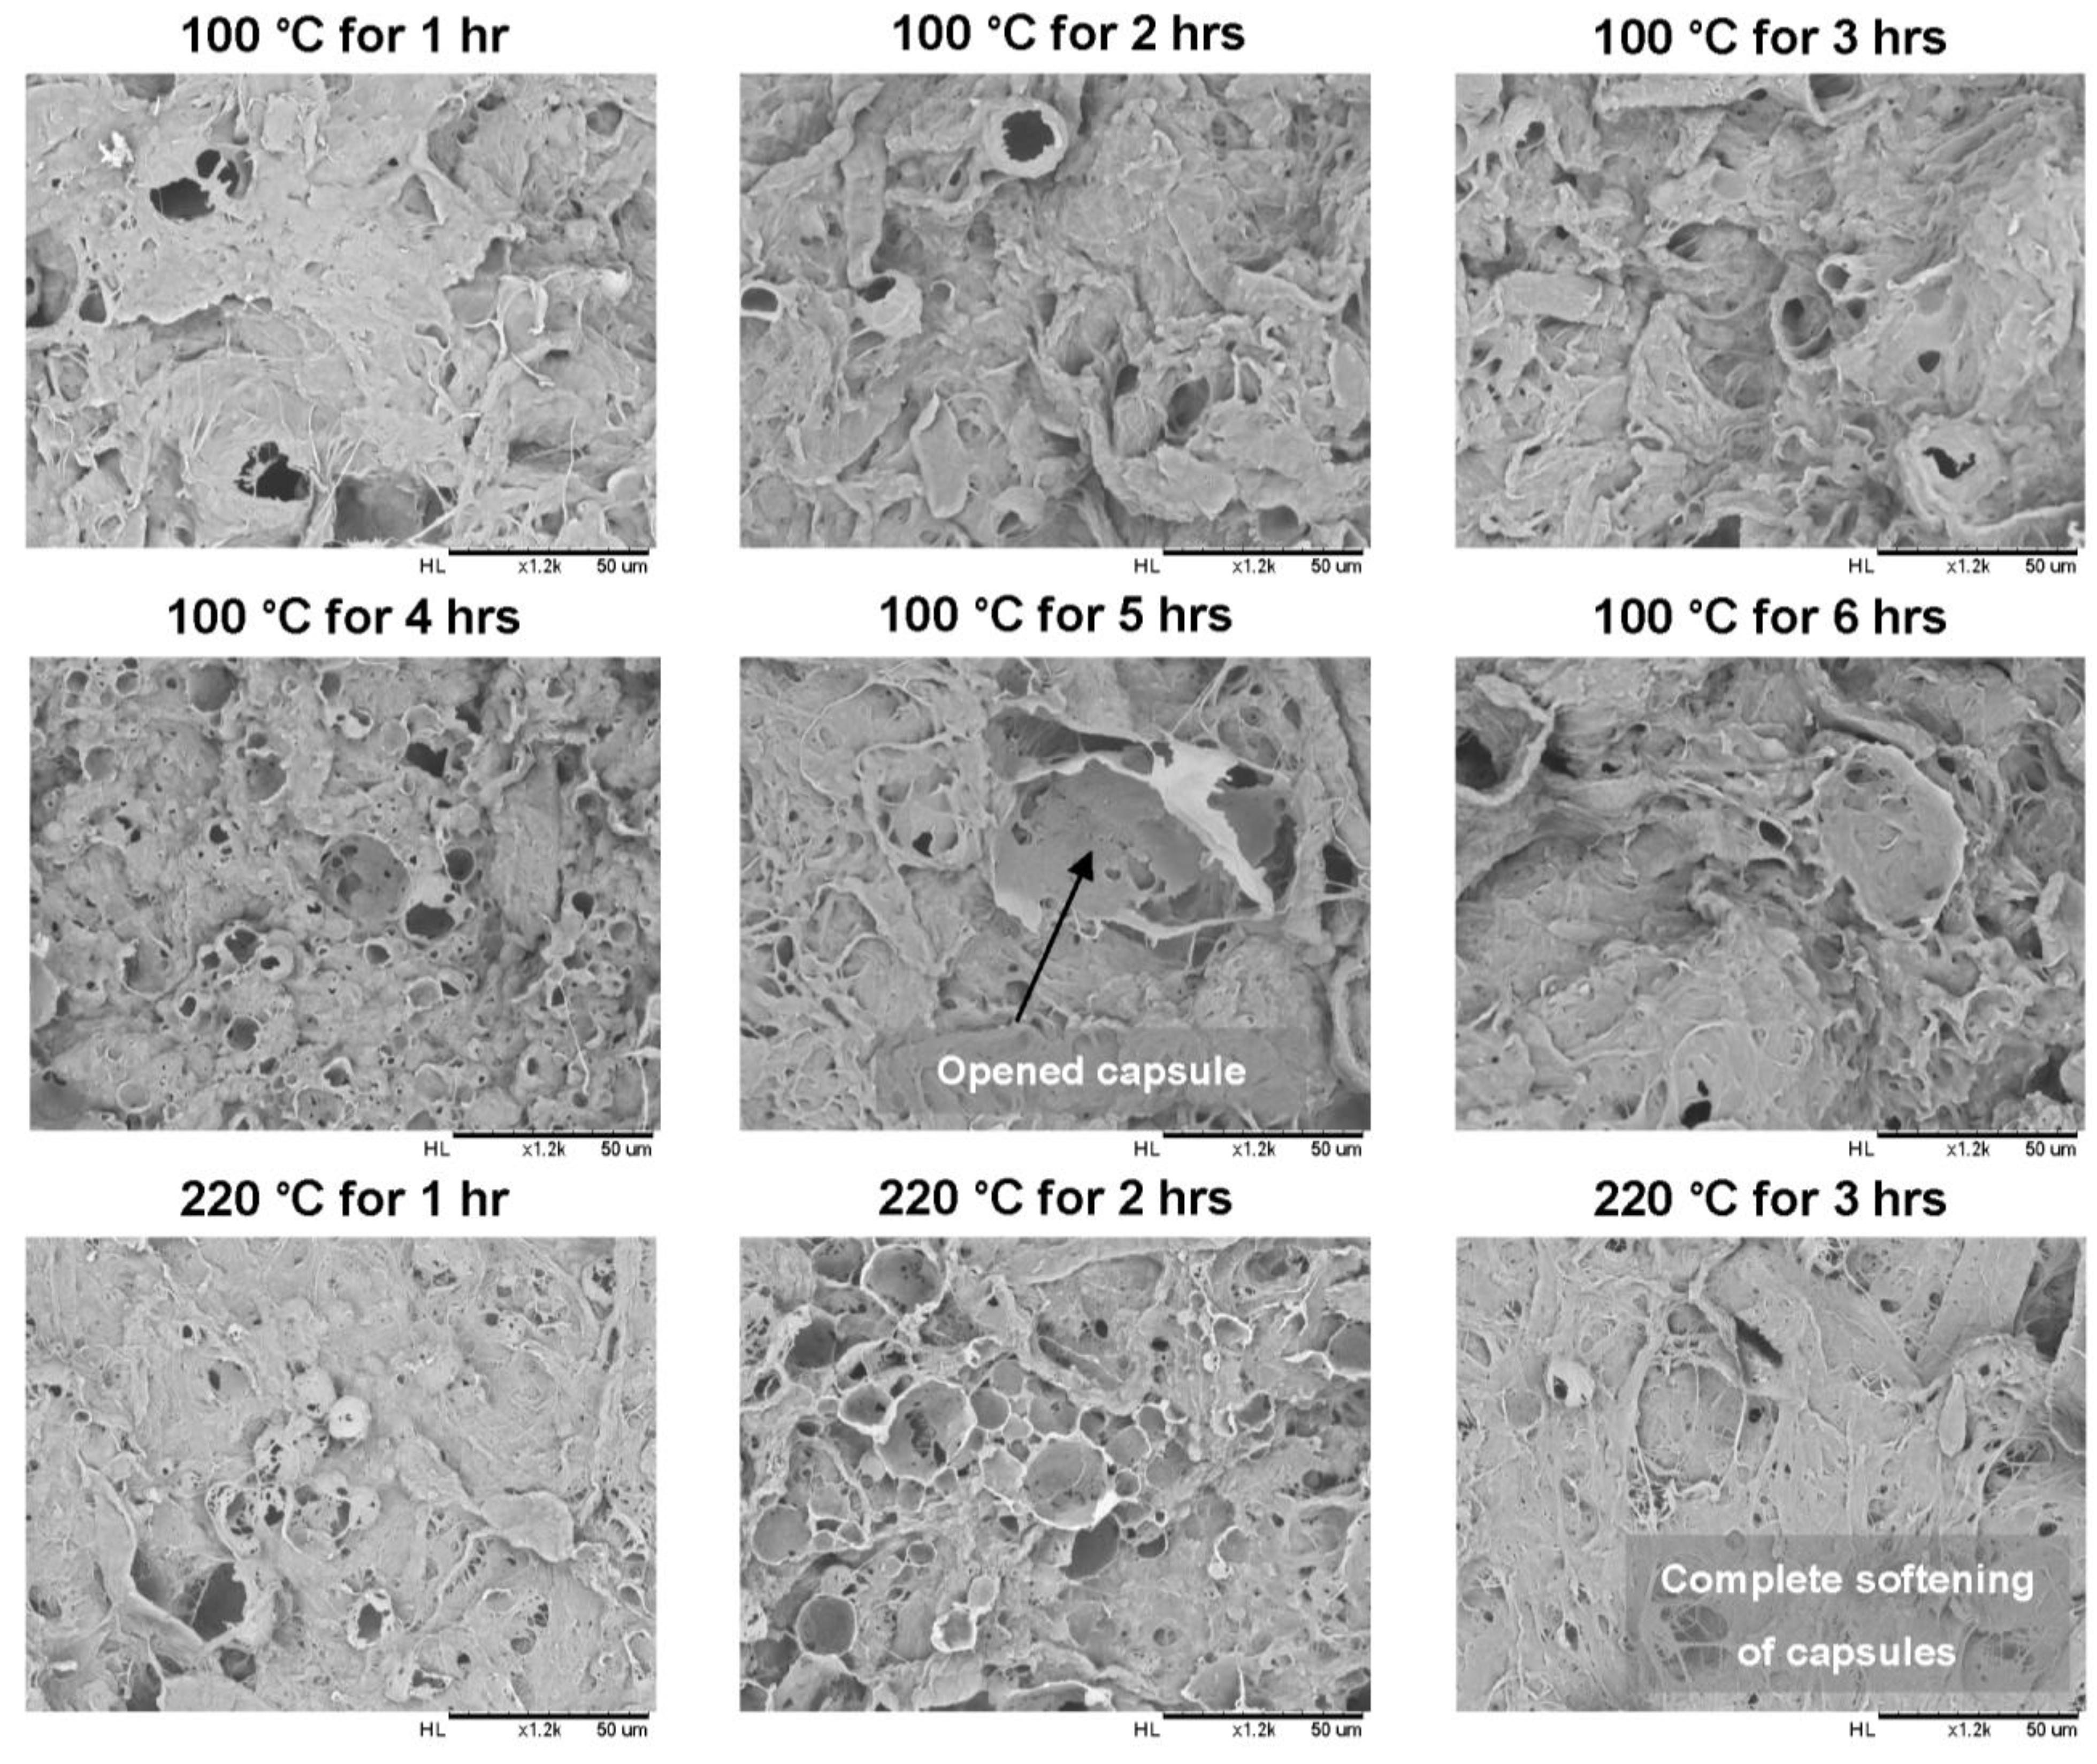
2.2.1. Scanning Electron Microscopy


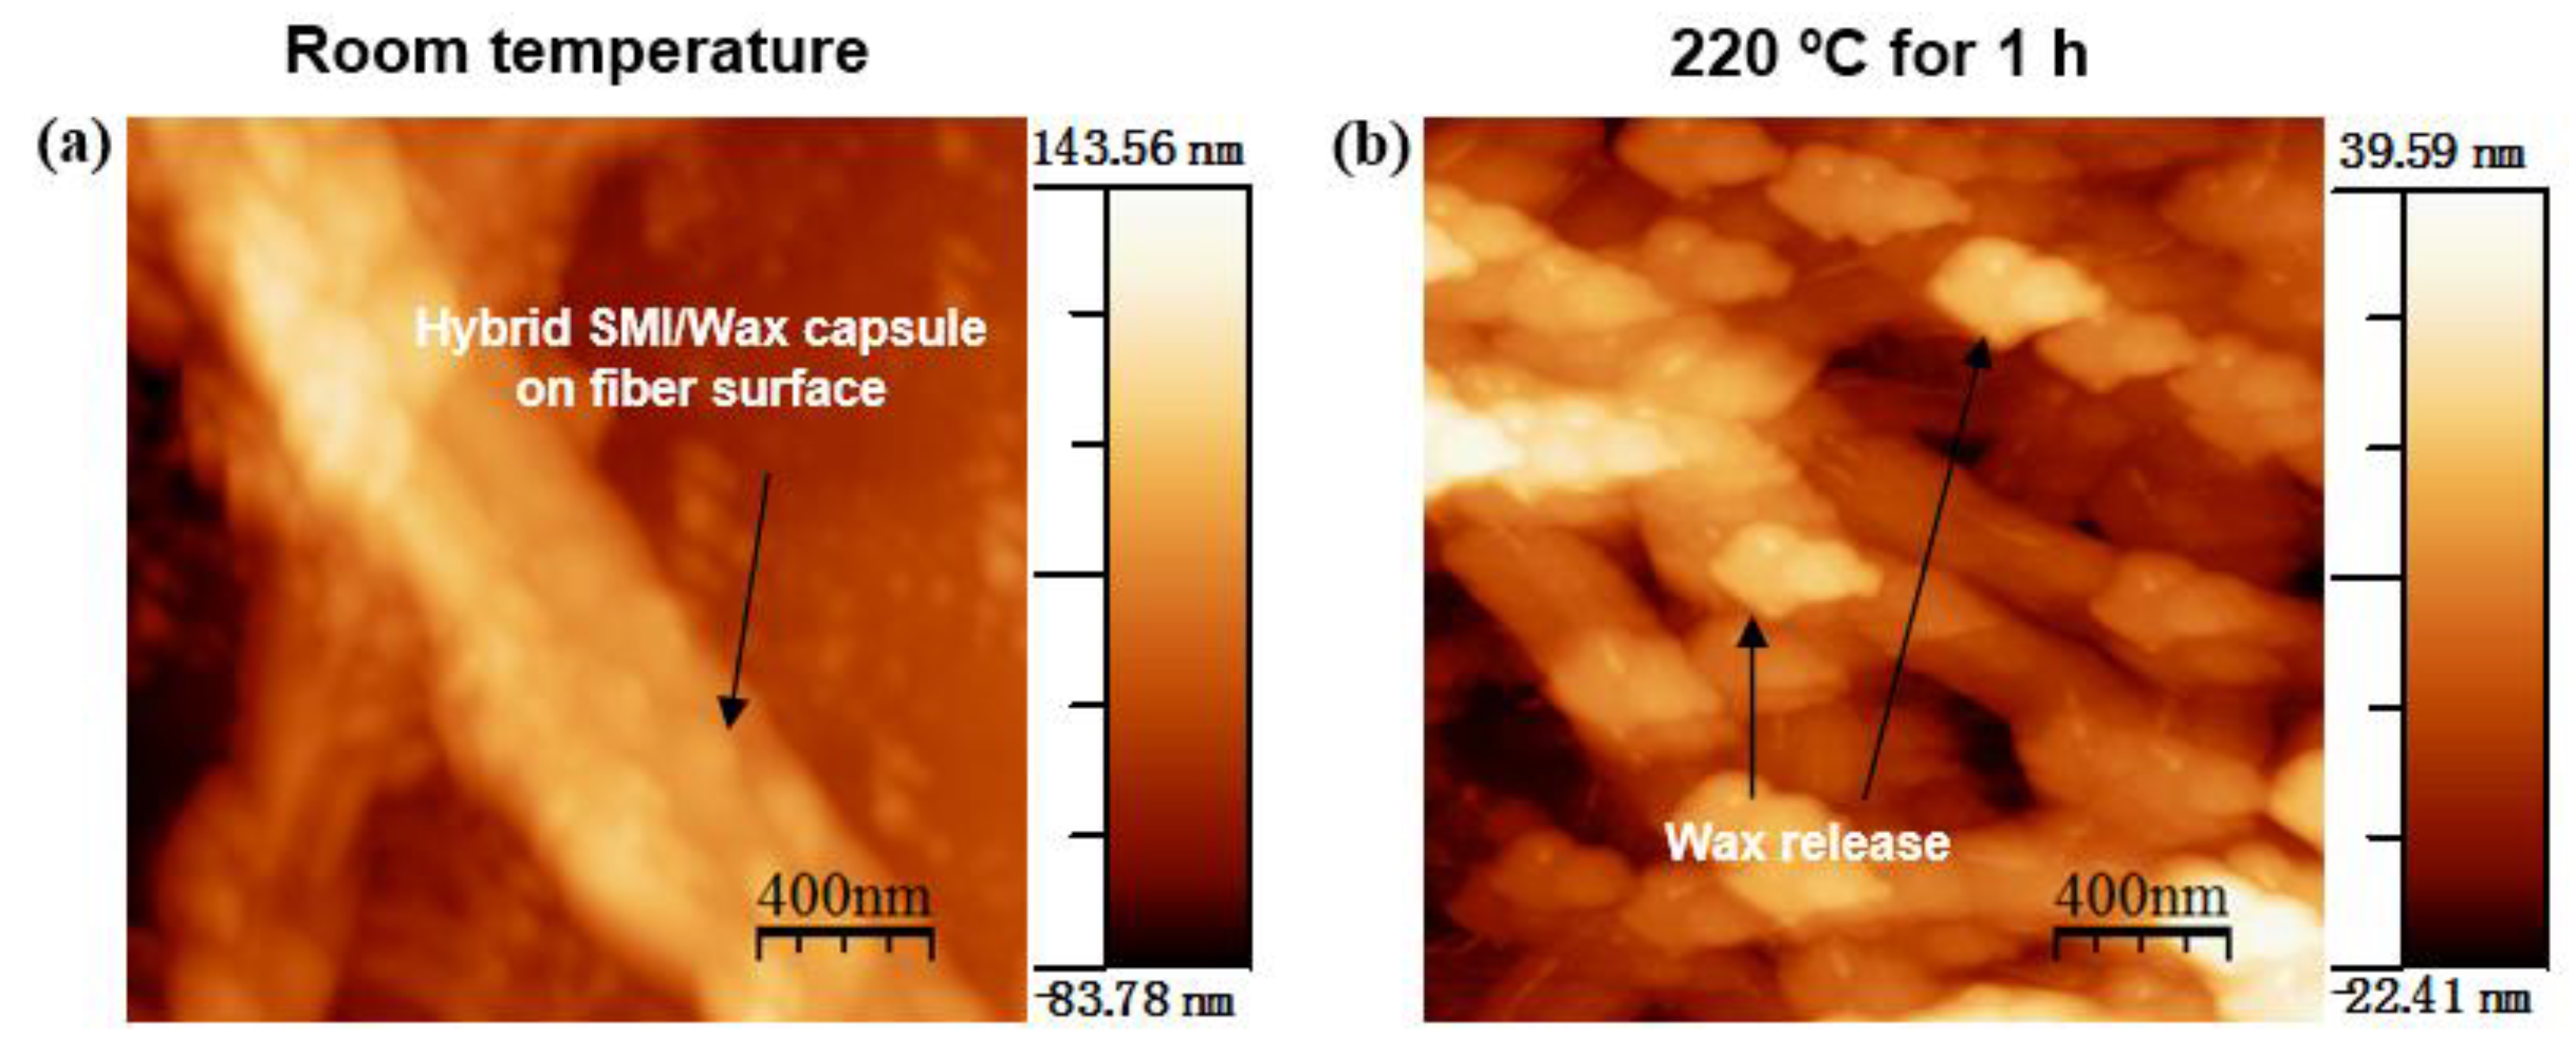
2.2.2. Atomic Force Microscopy
2.3. Chemical Analysis
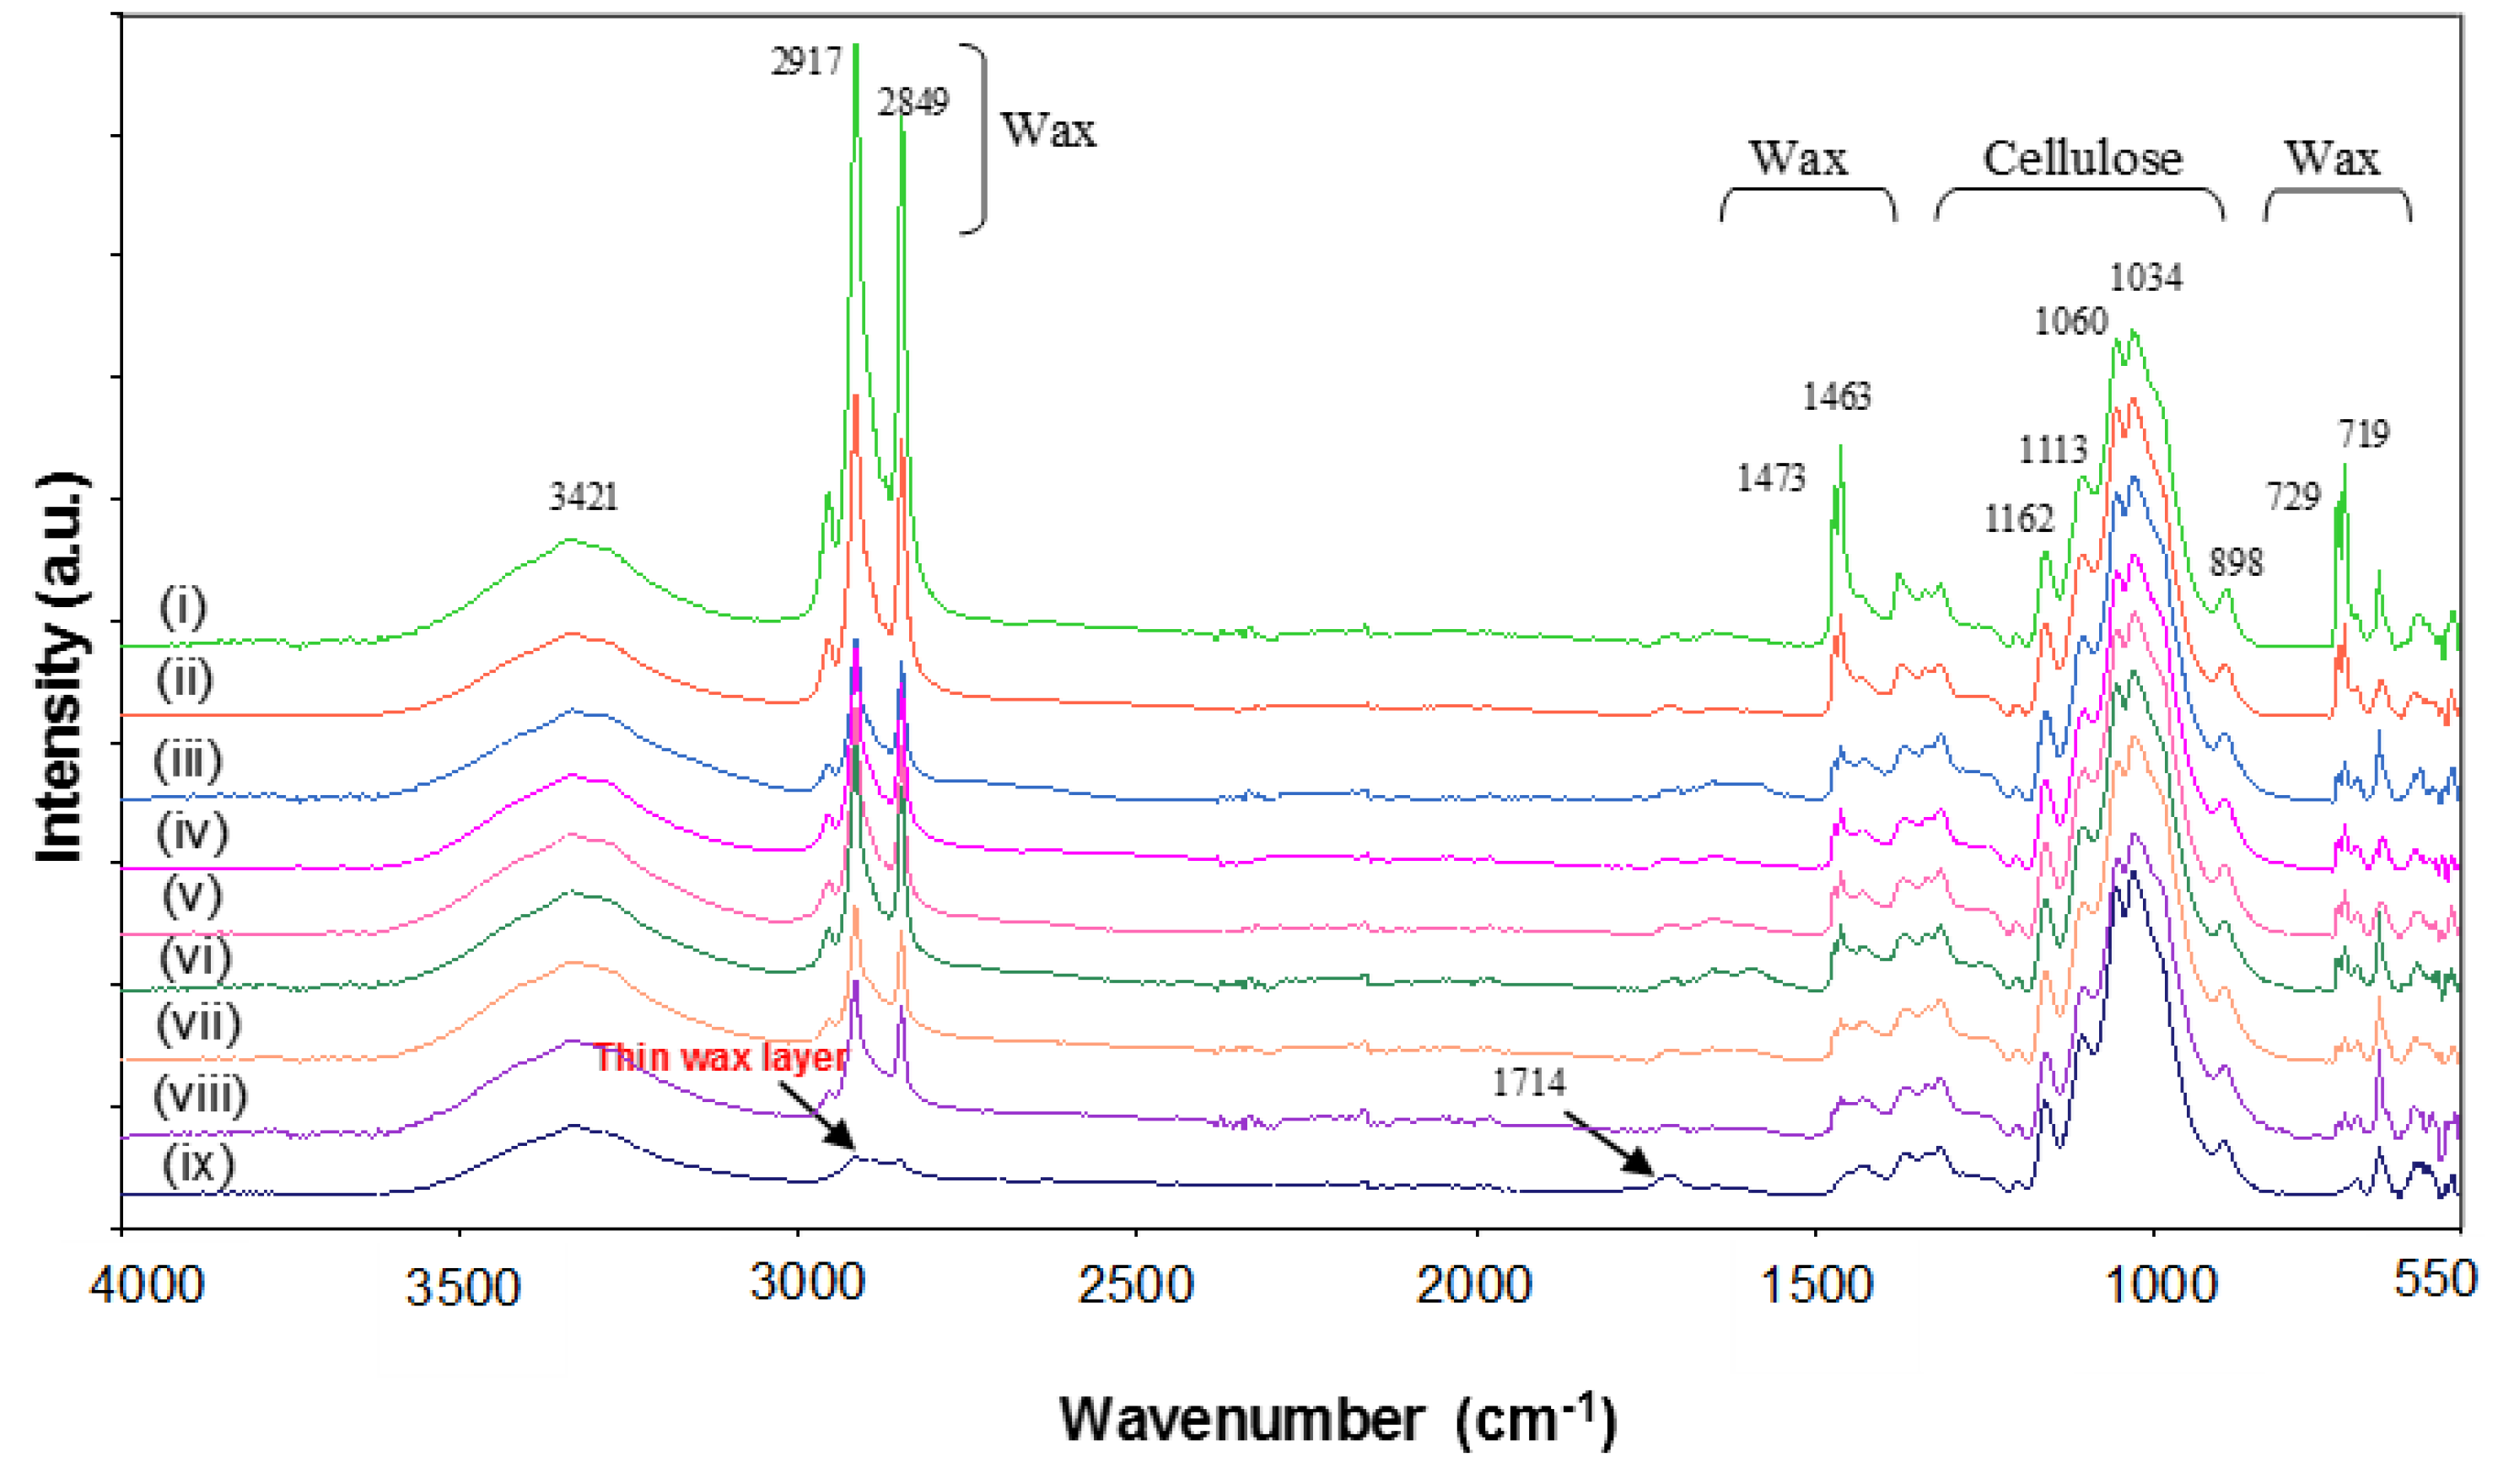
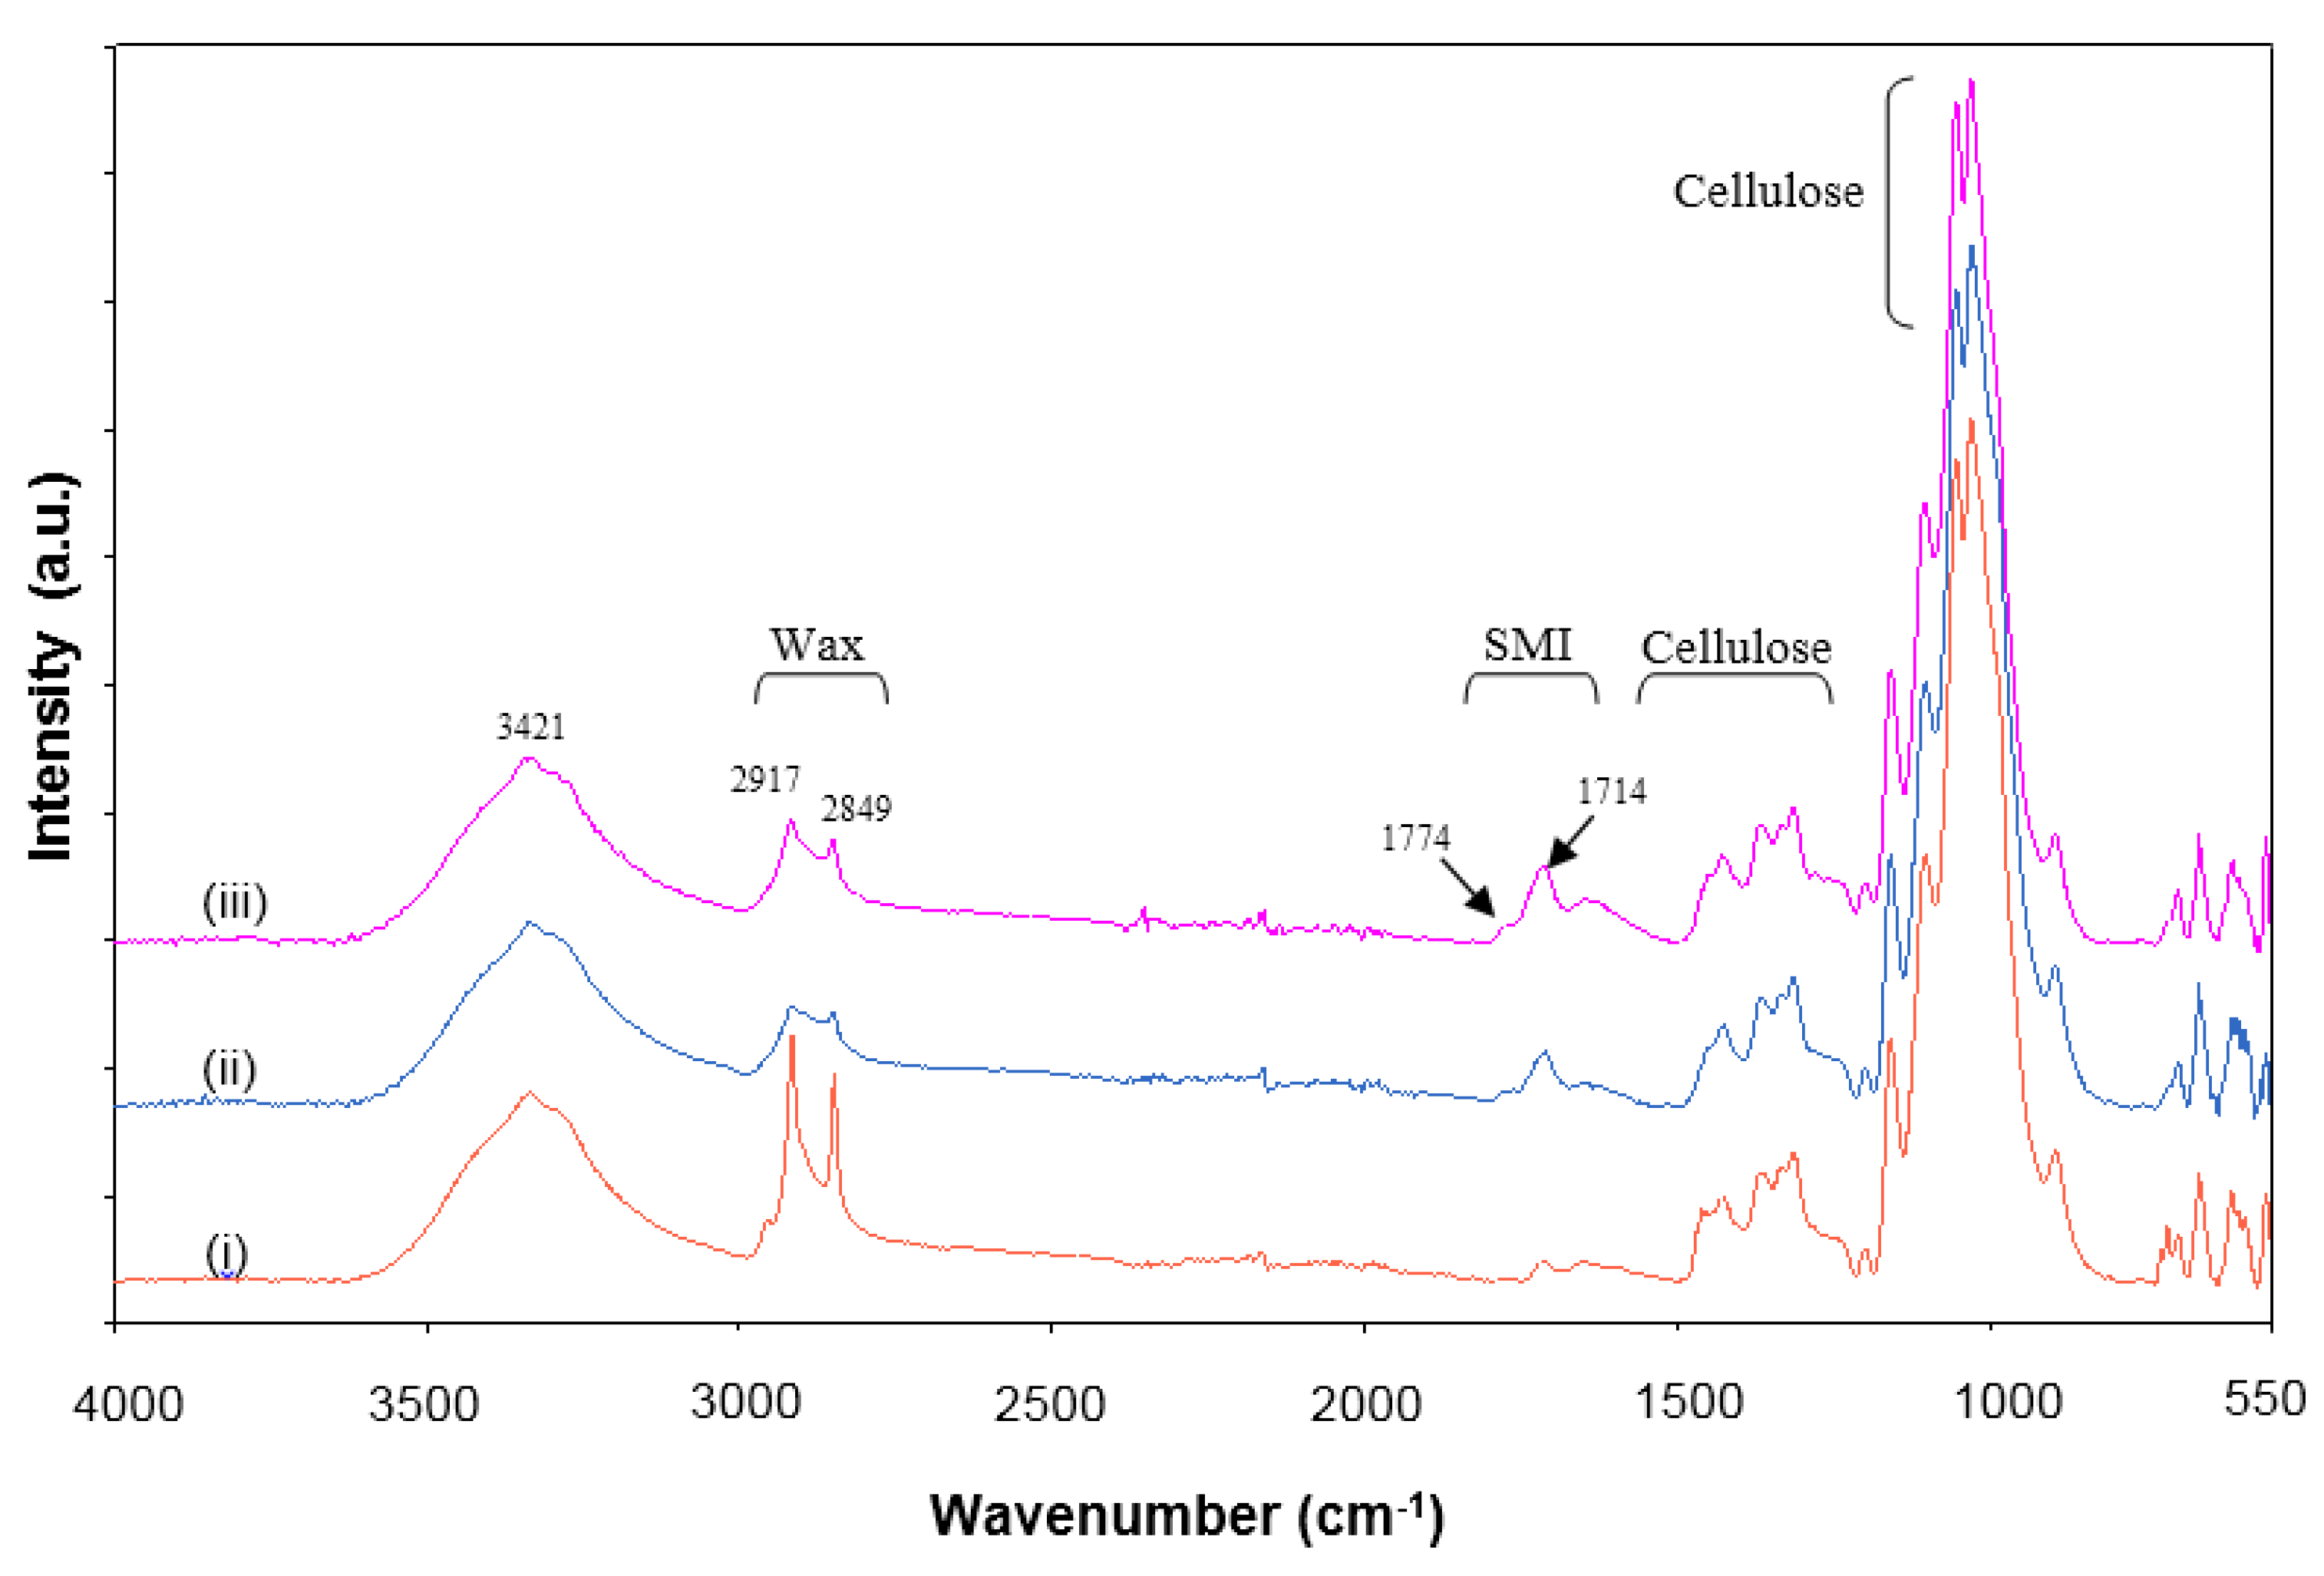
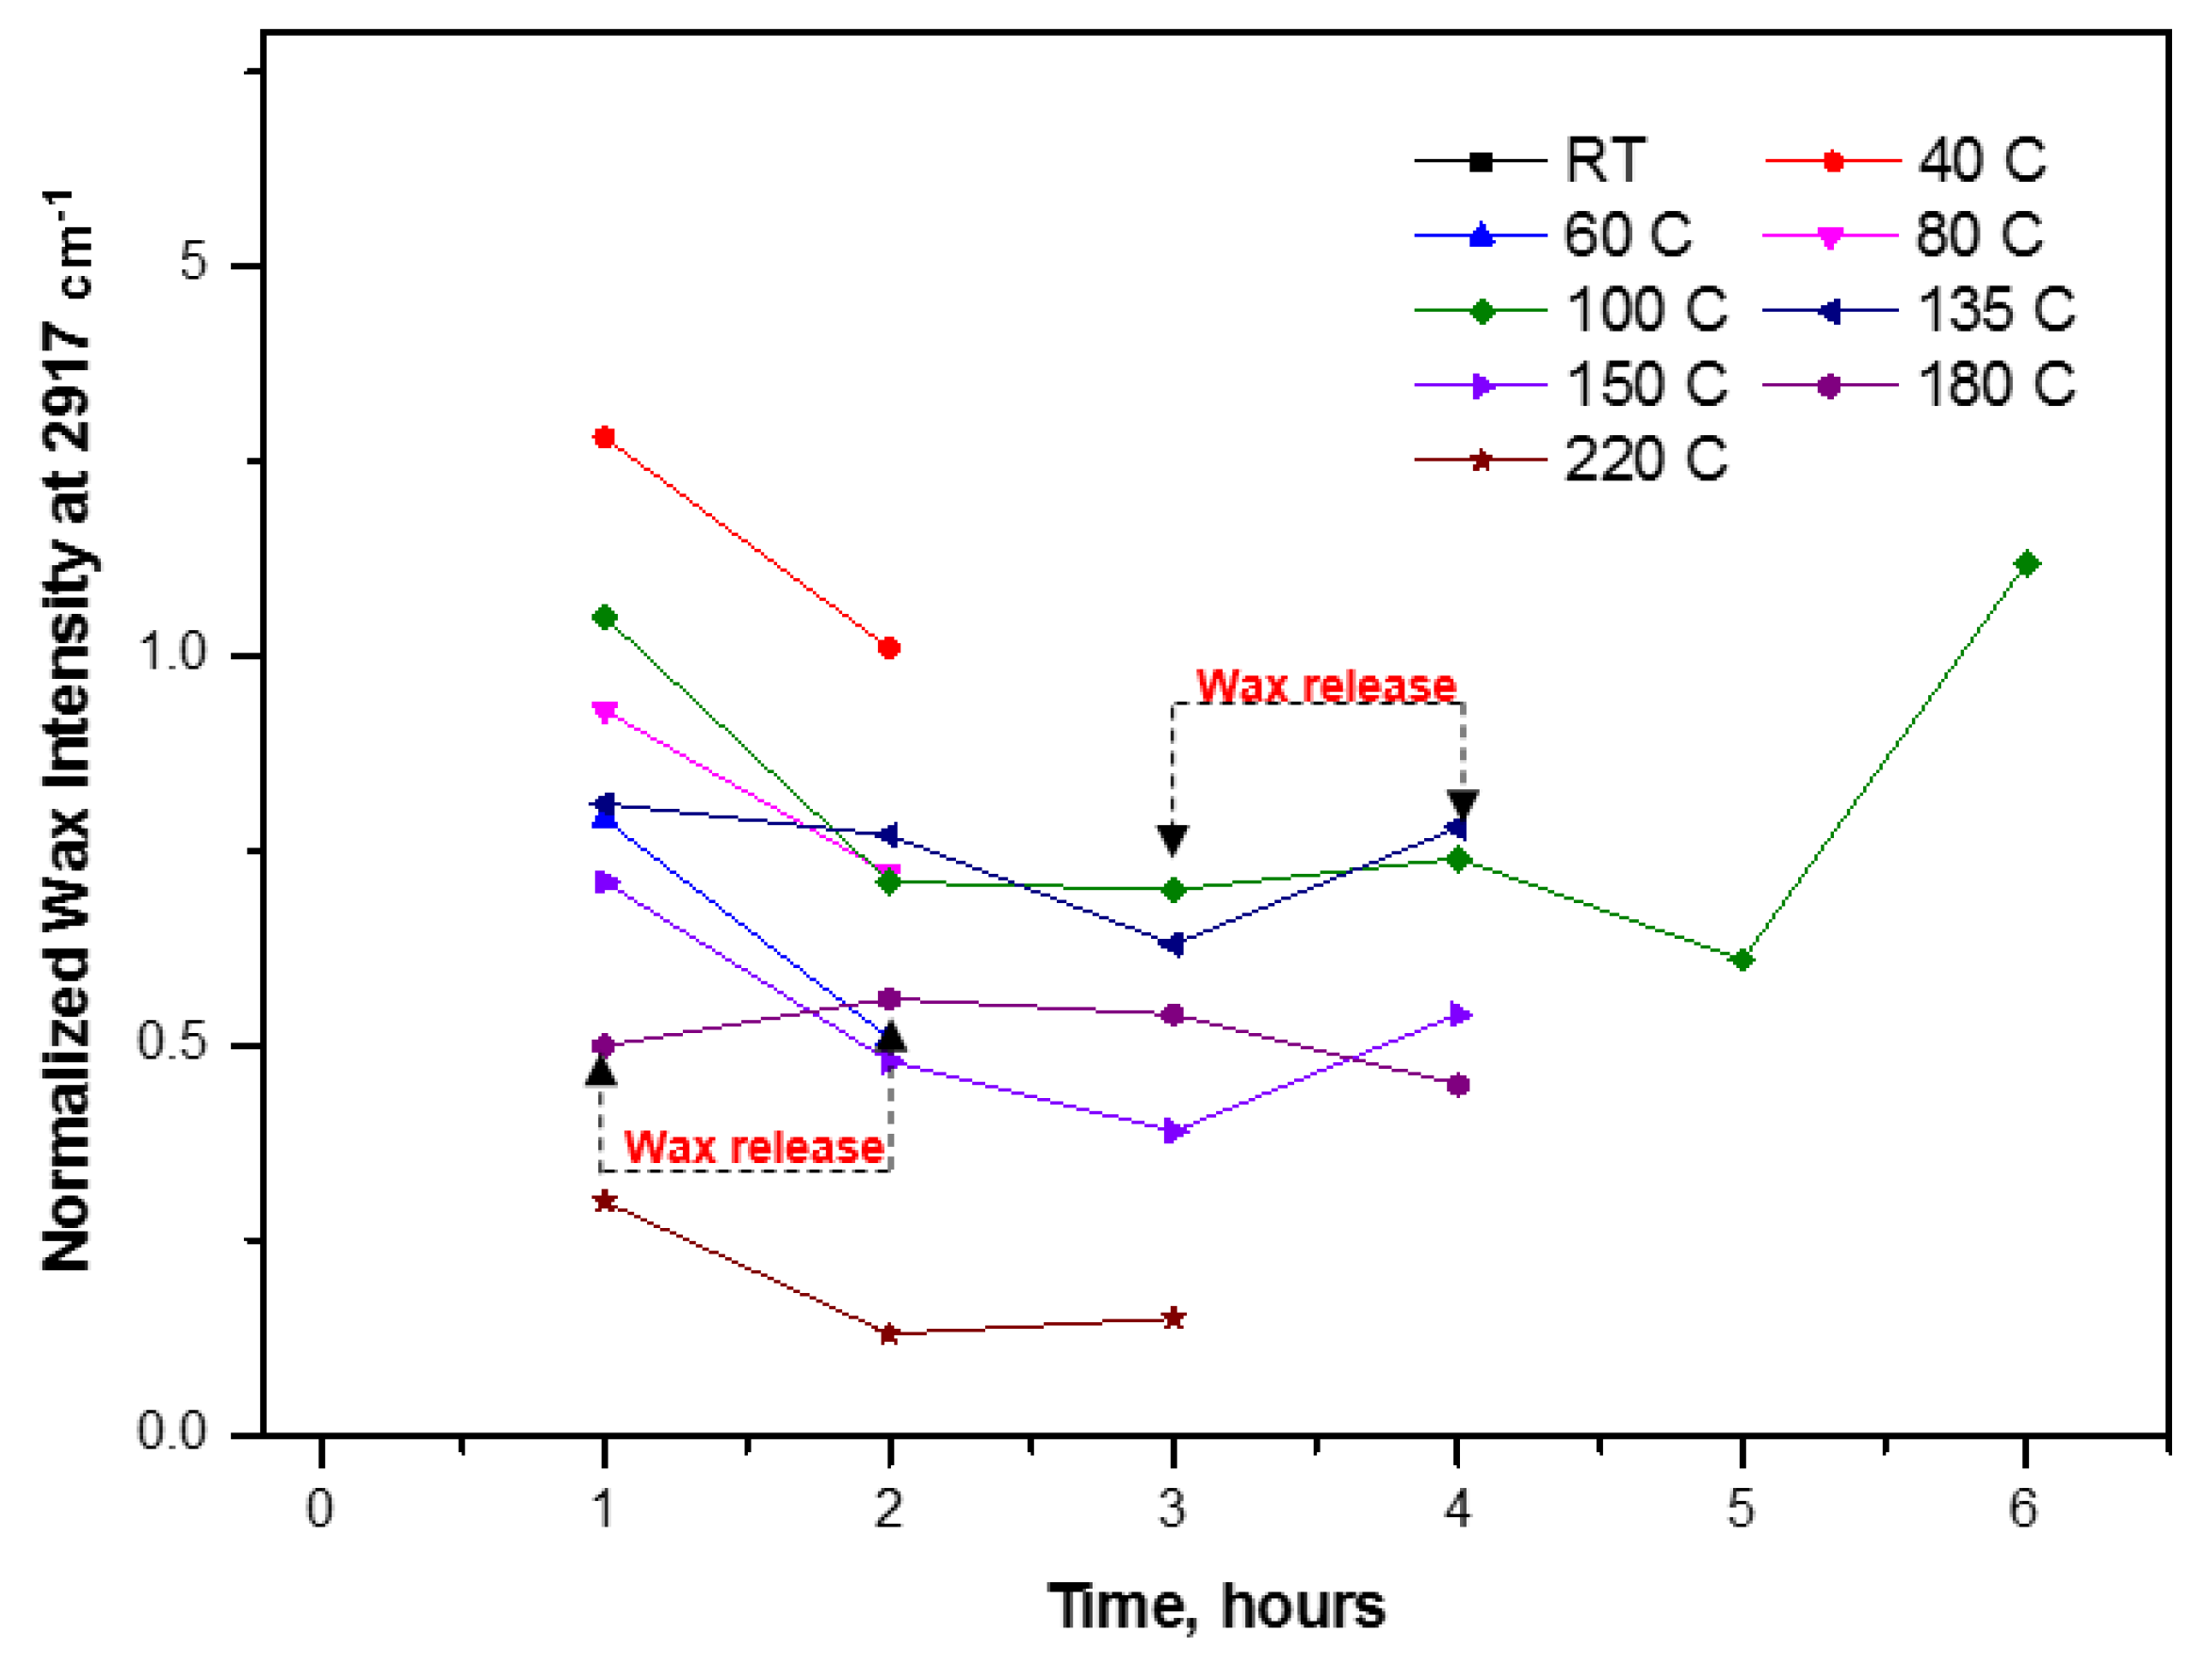
2.3.1. Infrared Spectroscopy


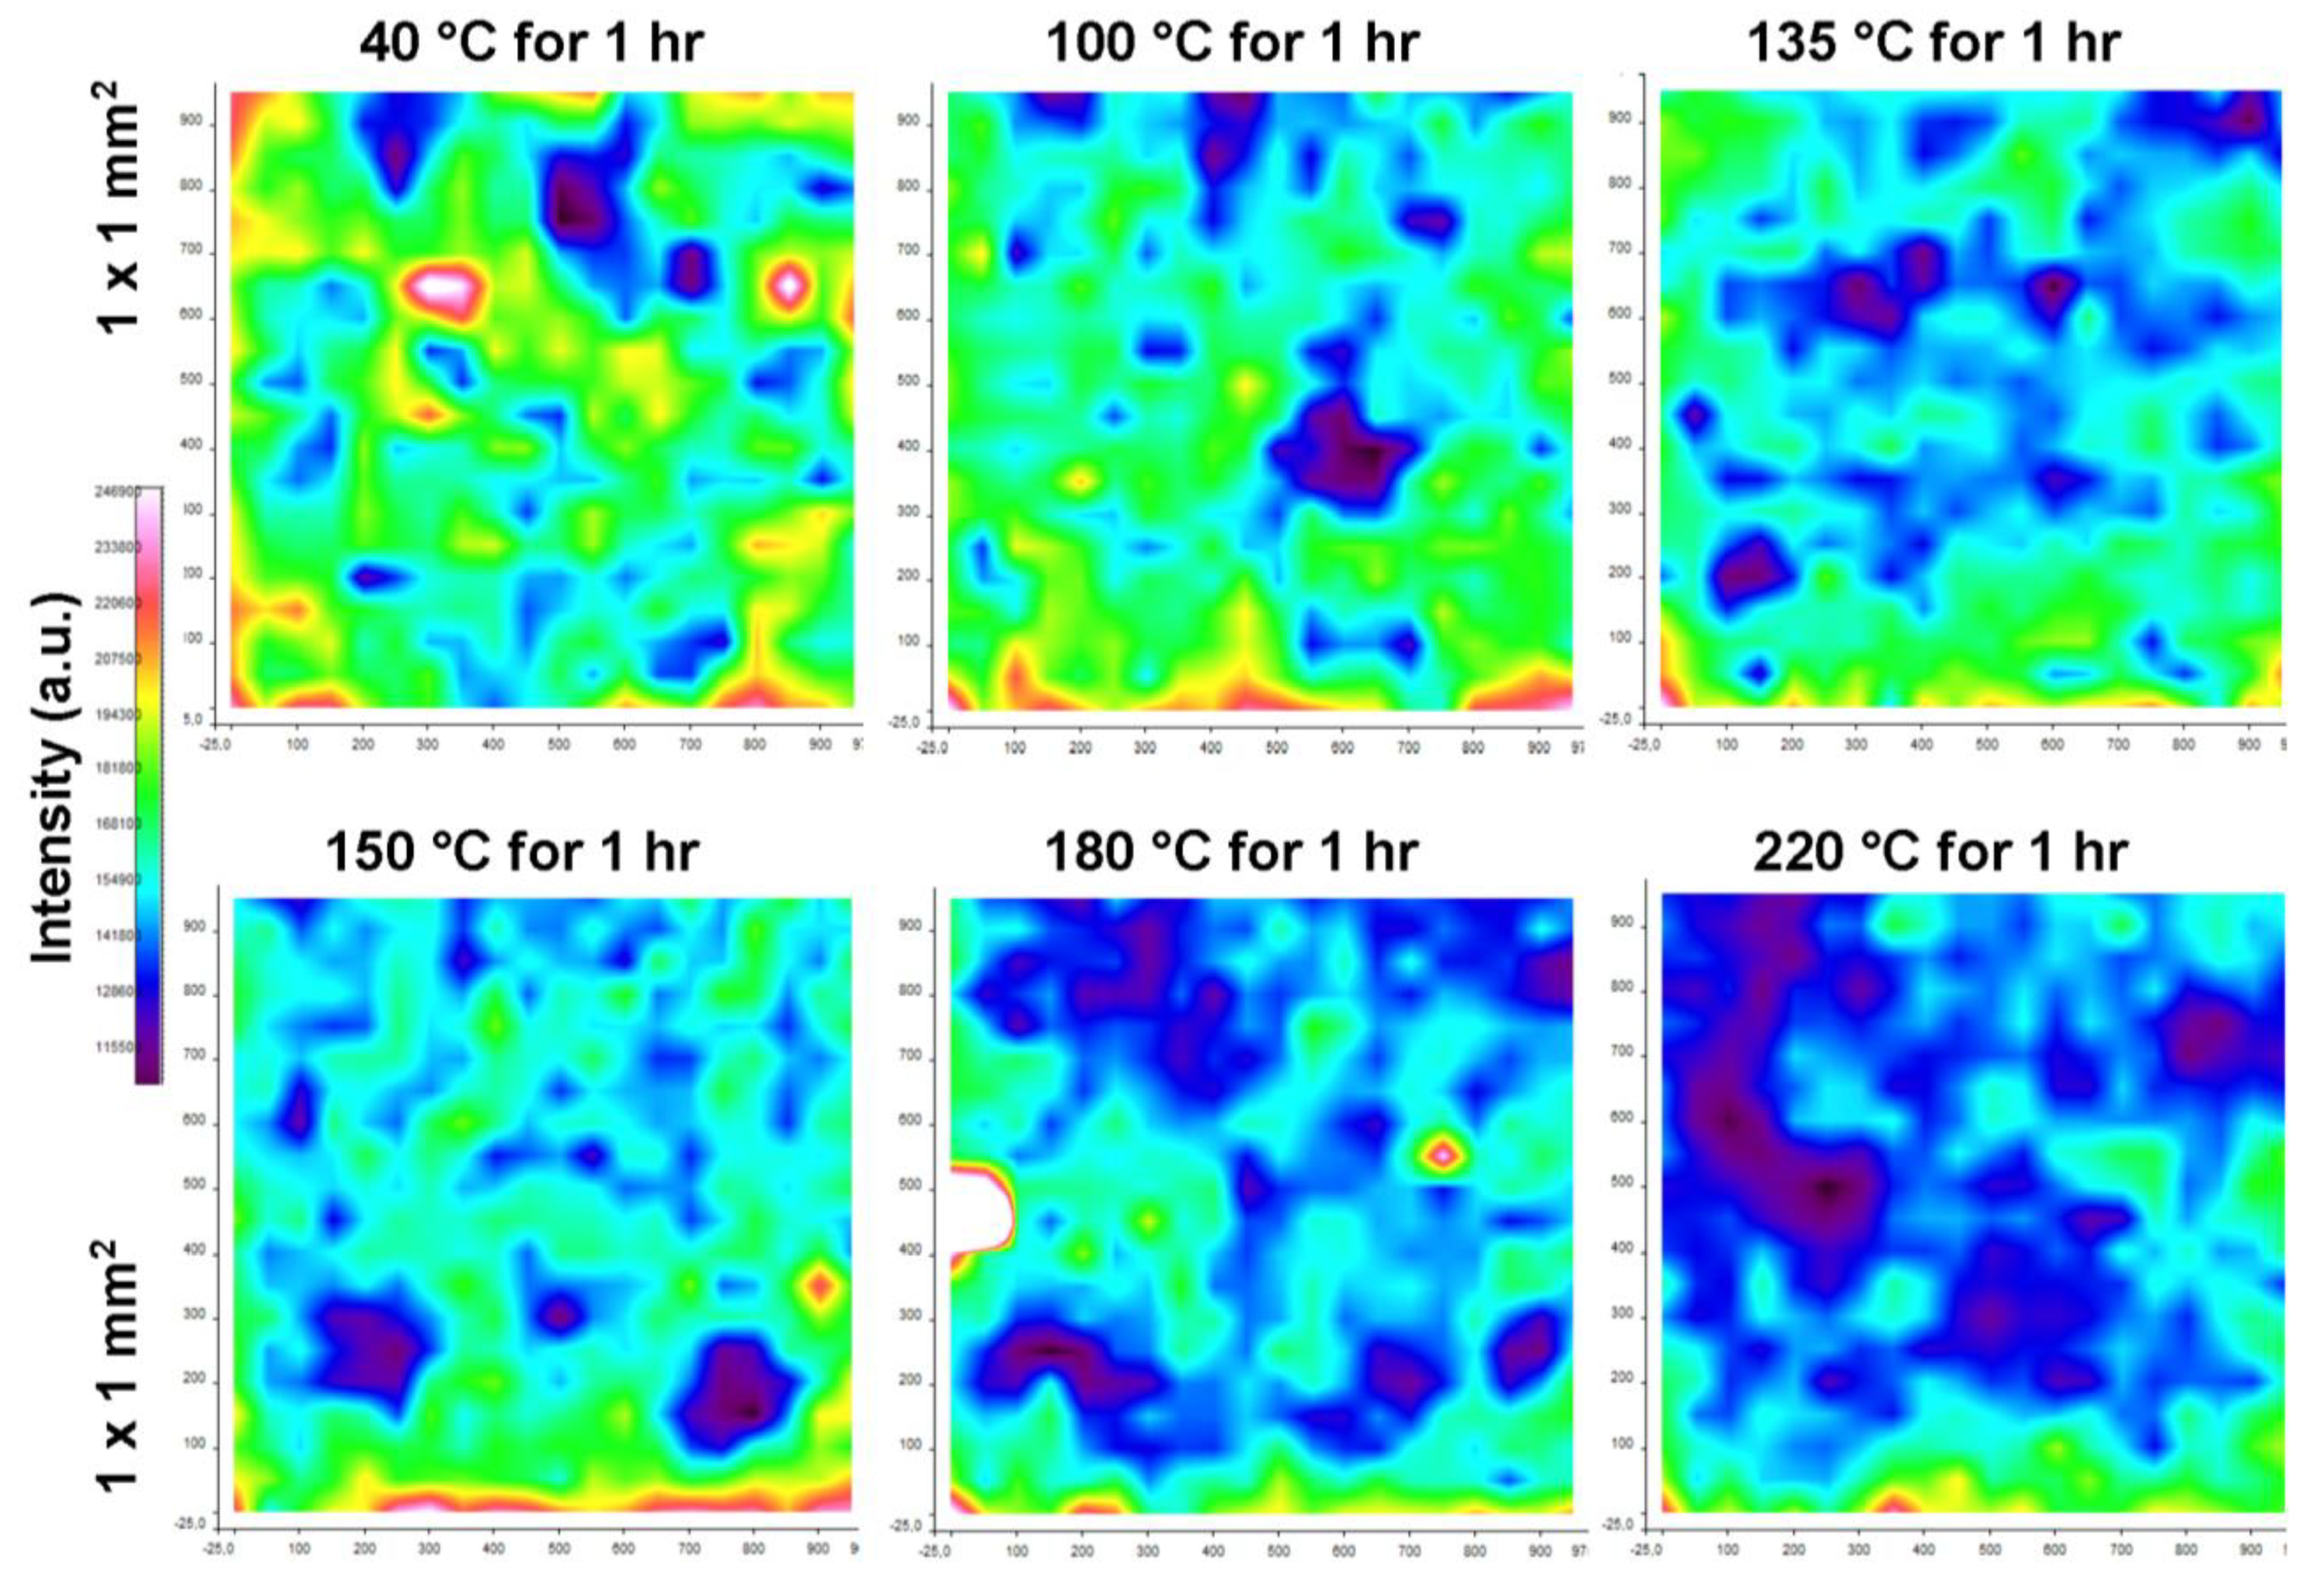
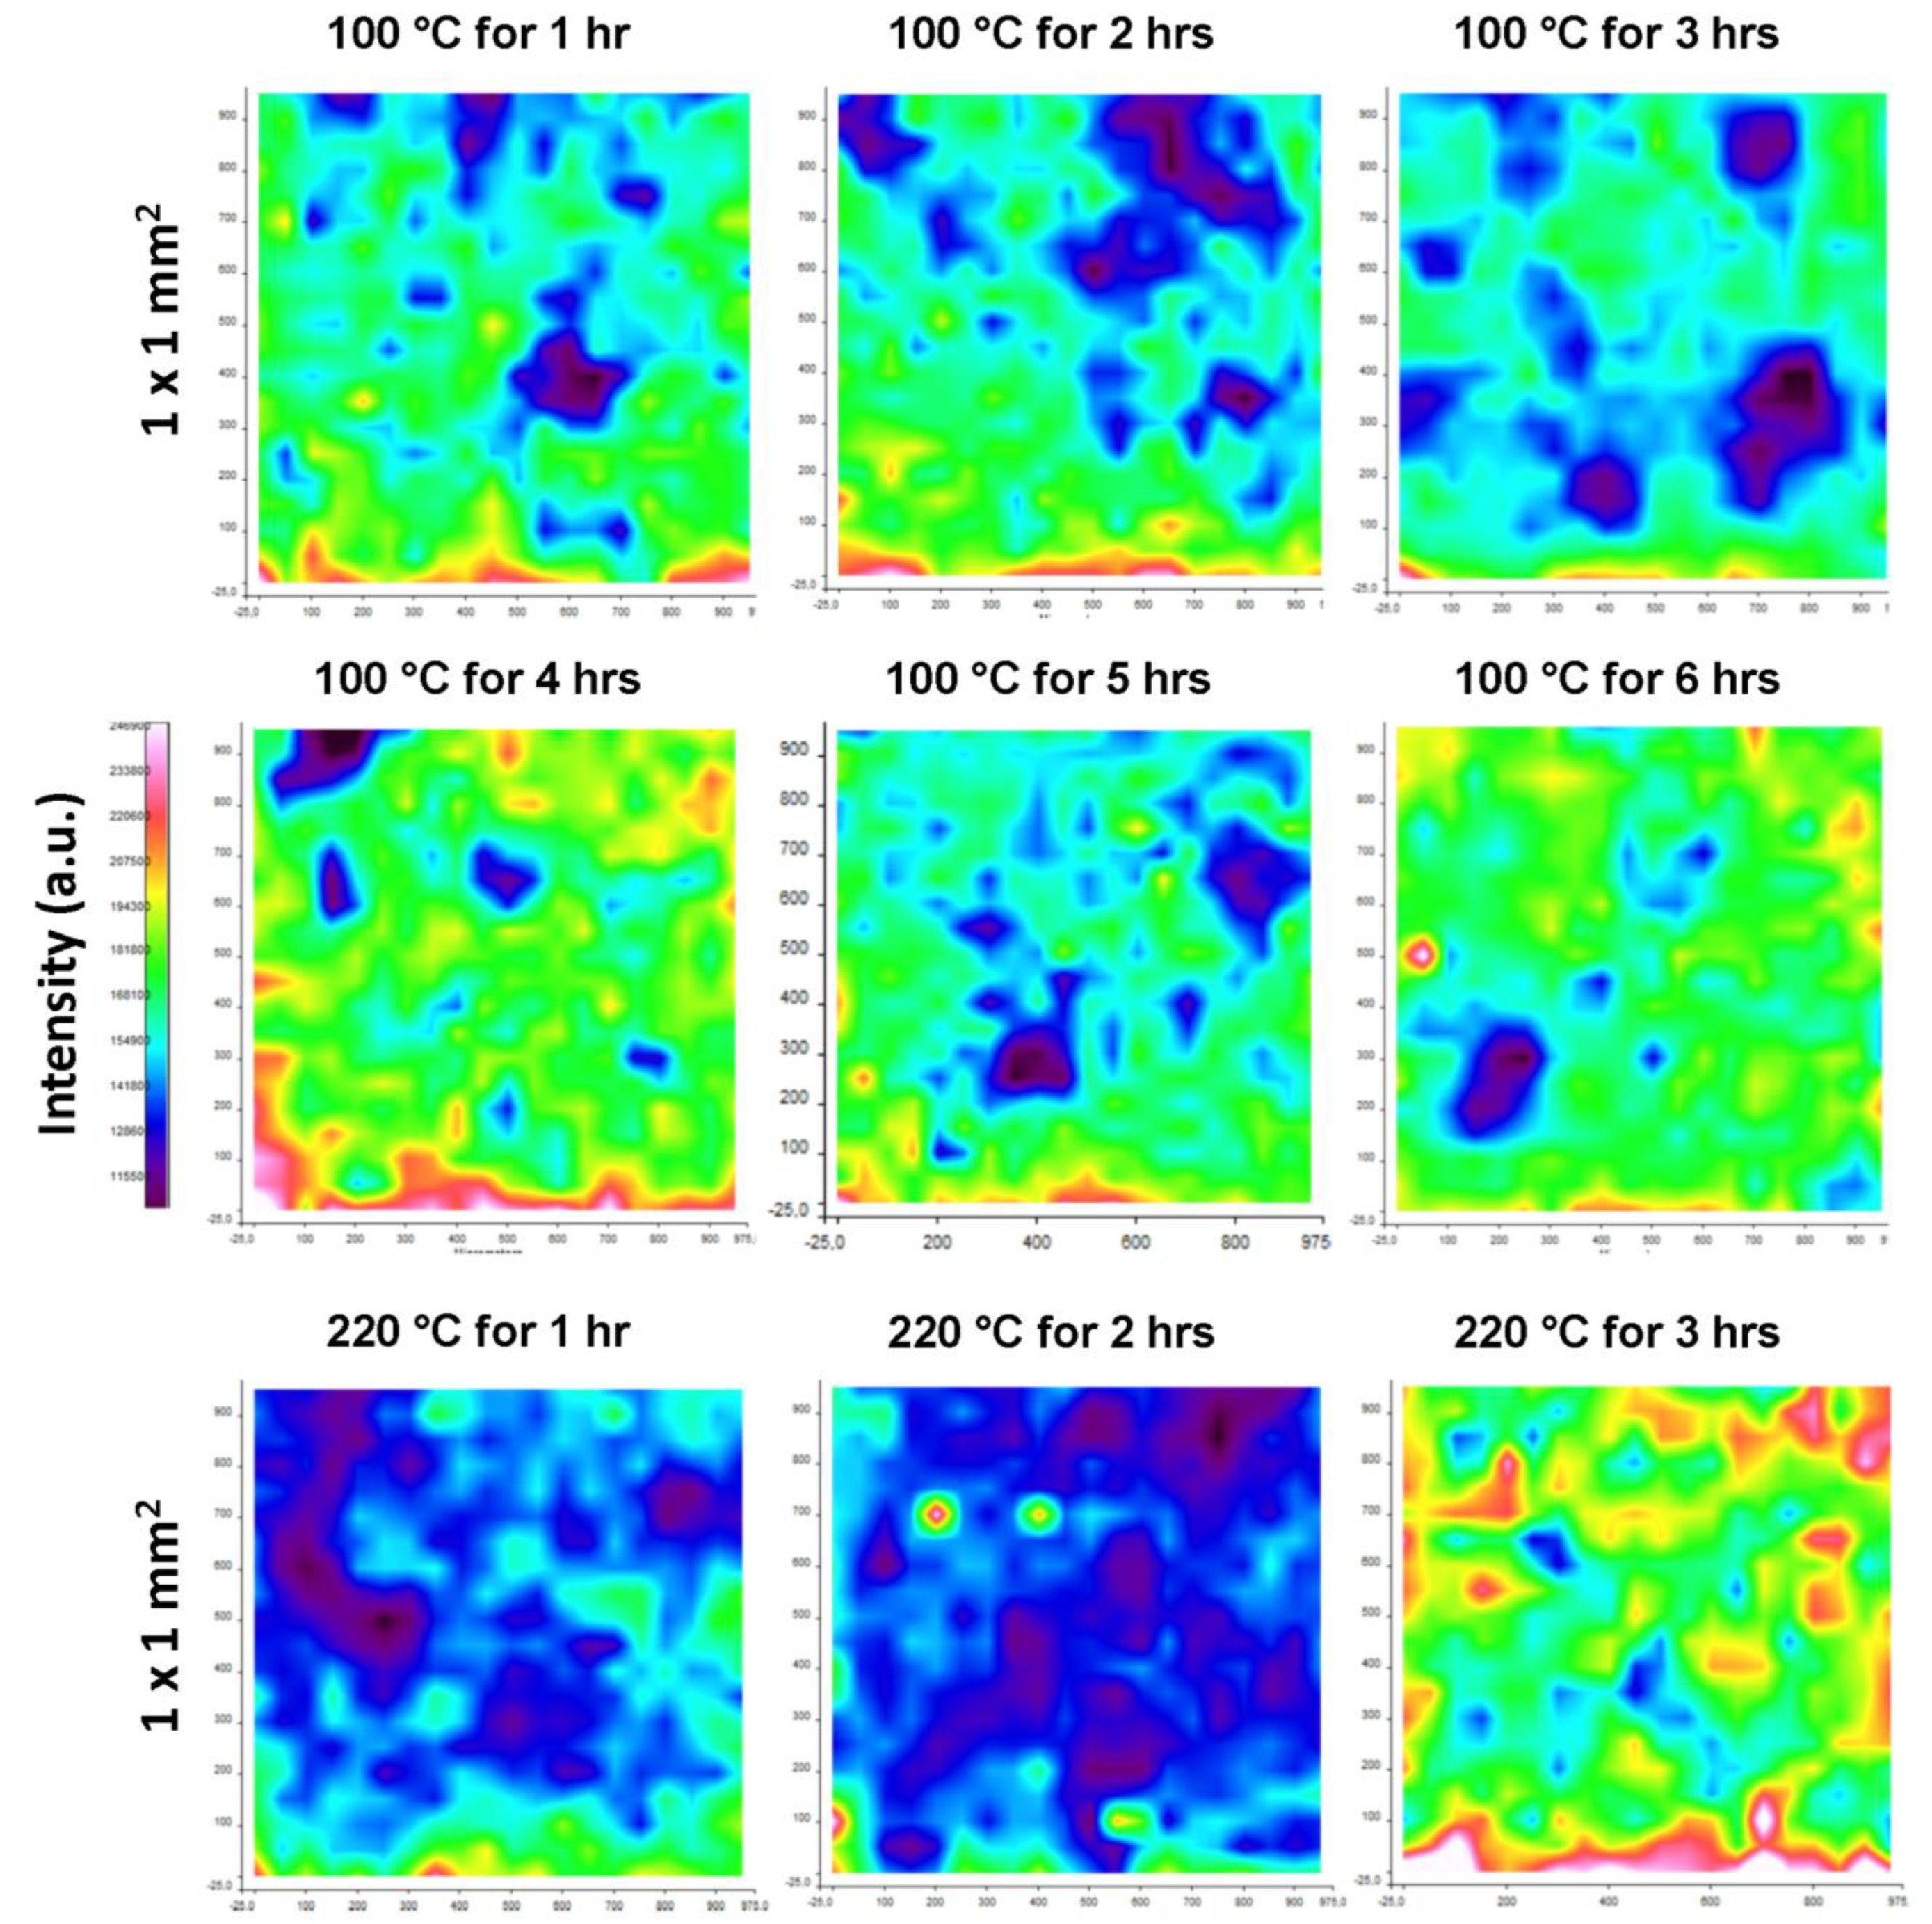
2.3.2. Raman Chemical Mapping


2.4. Physical Analysis

| Time | Curing Temperature (°C) | ||||||||
|---|---|---|---|---|---|---|---|---|---|
| RT | 40 | 60 | 80 | 100 | 135 | 150 | 180 | 220 | |
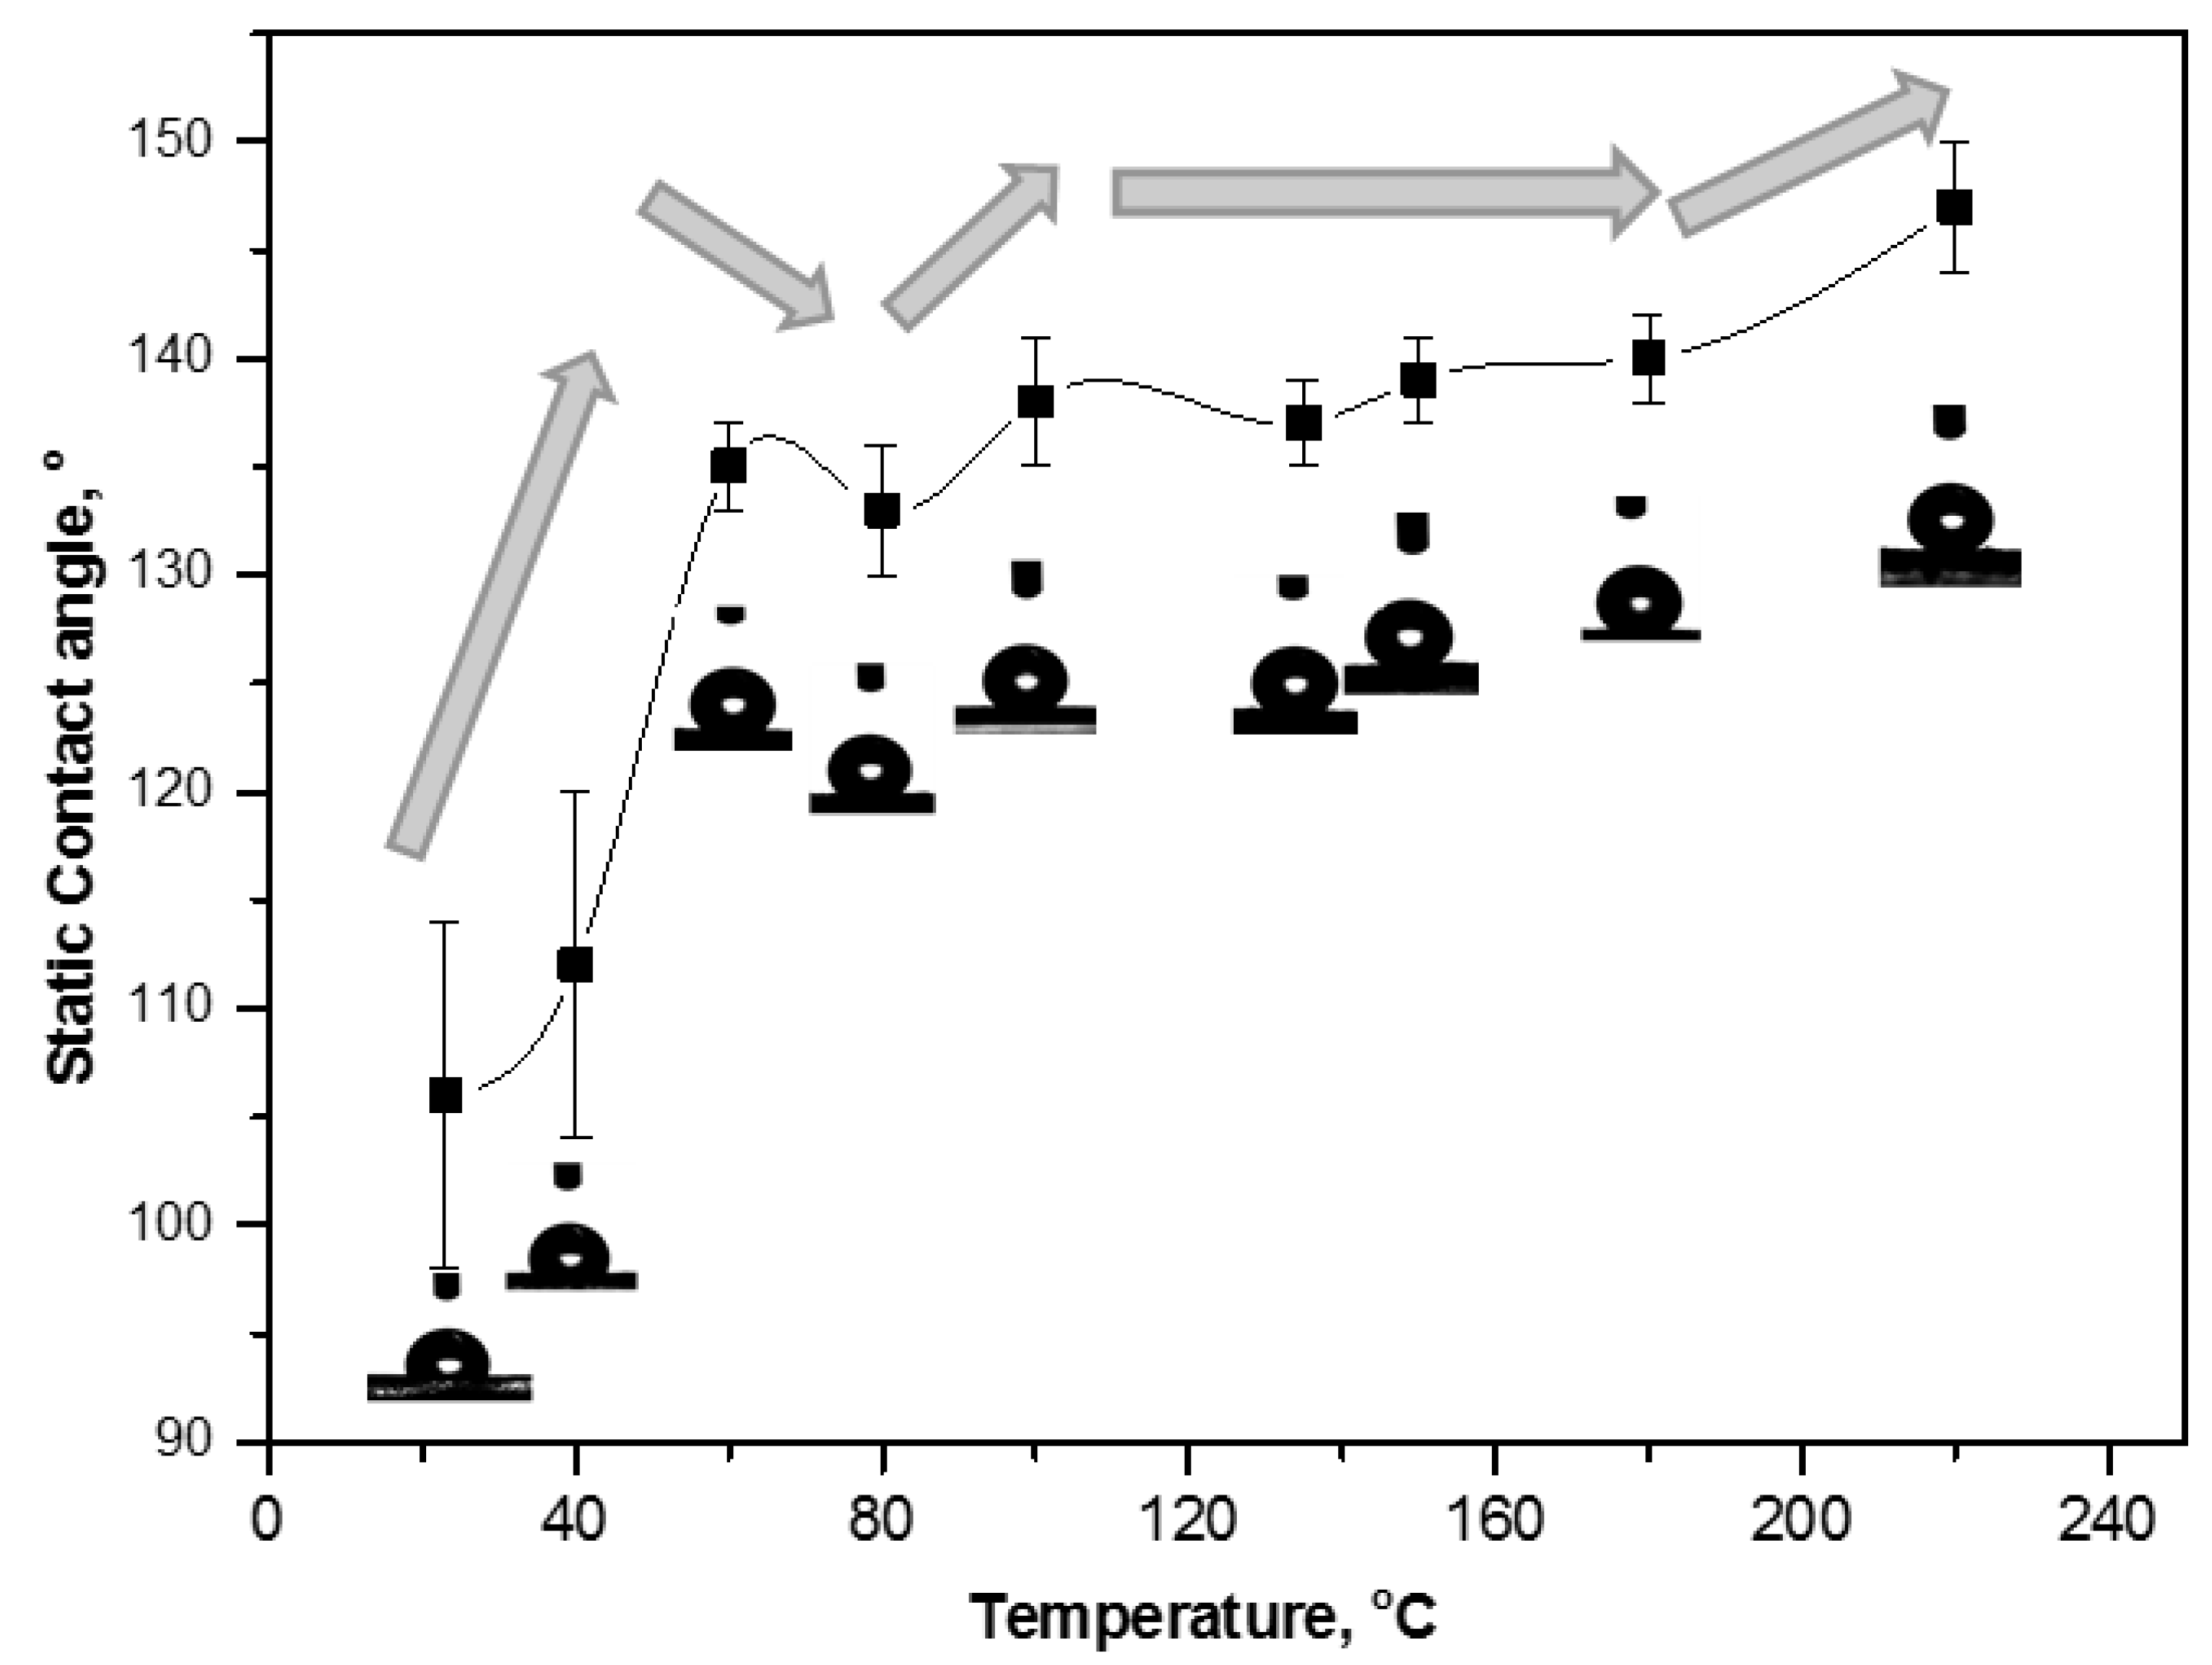
| 0 | 106 ± 8 | - | - | - | - | - | - | - | - |
| 1 | - | 110 ± 6 | 133 ± 2 | 130 ± 1 | 138 ± 1 | 137 ± 1 | 137 ± 2 | 139 ± 1 | 144 ± 2 |
| 2 | - | 112 ± 8 | 135 ± 2 | 133 ± 3 | 138 ± 3 | 137 ± 2 | 139 ± 2 | 140 ± 2 | 147 ± 3 |
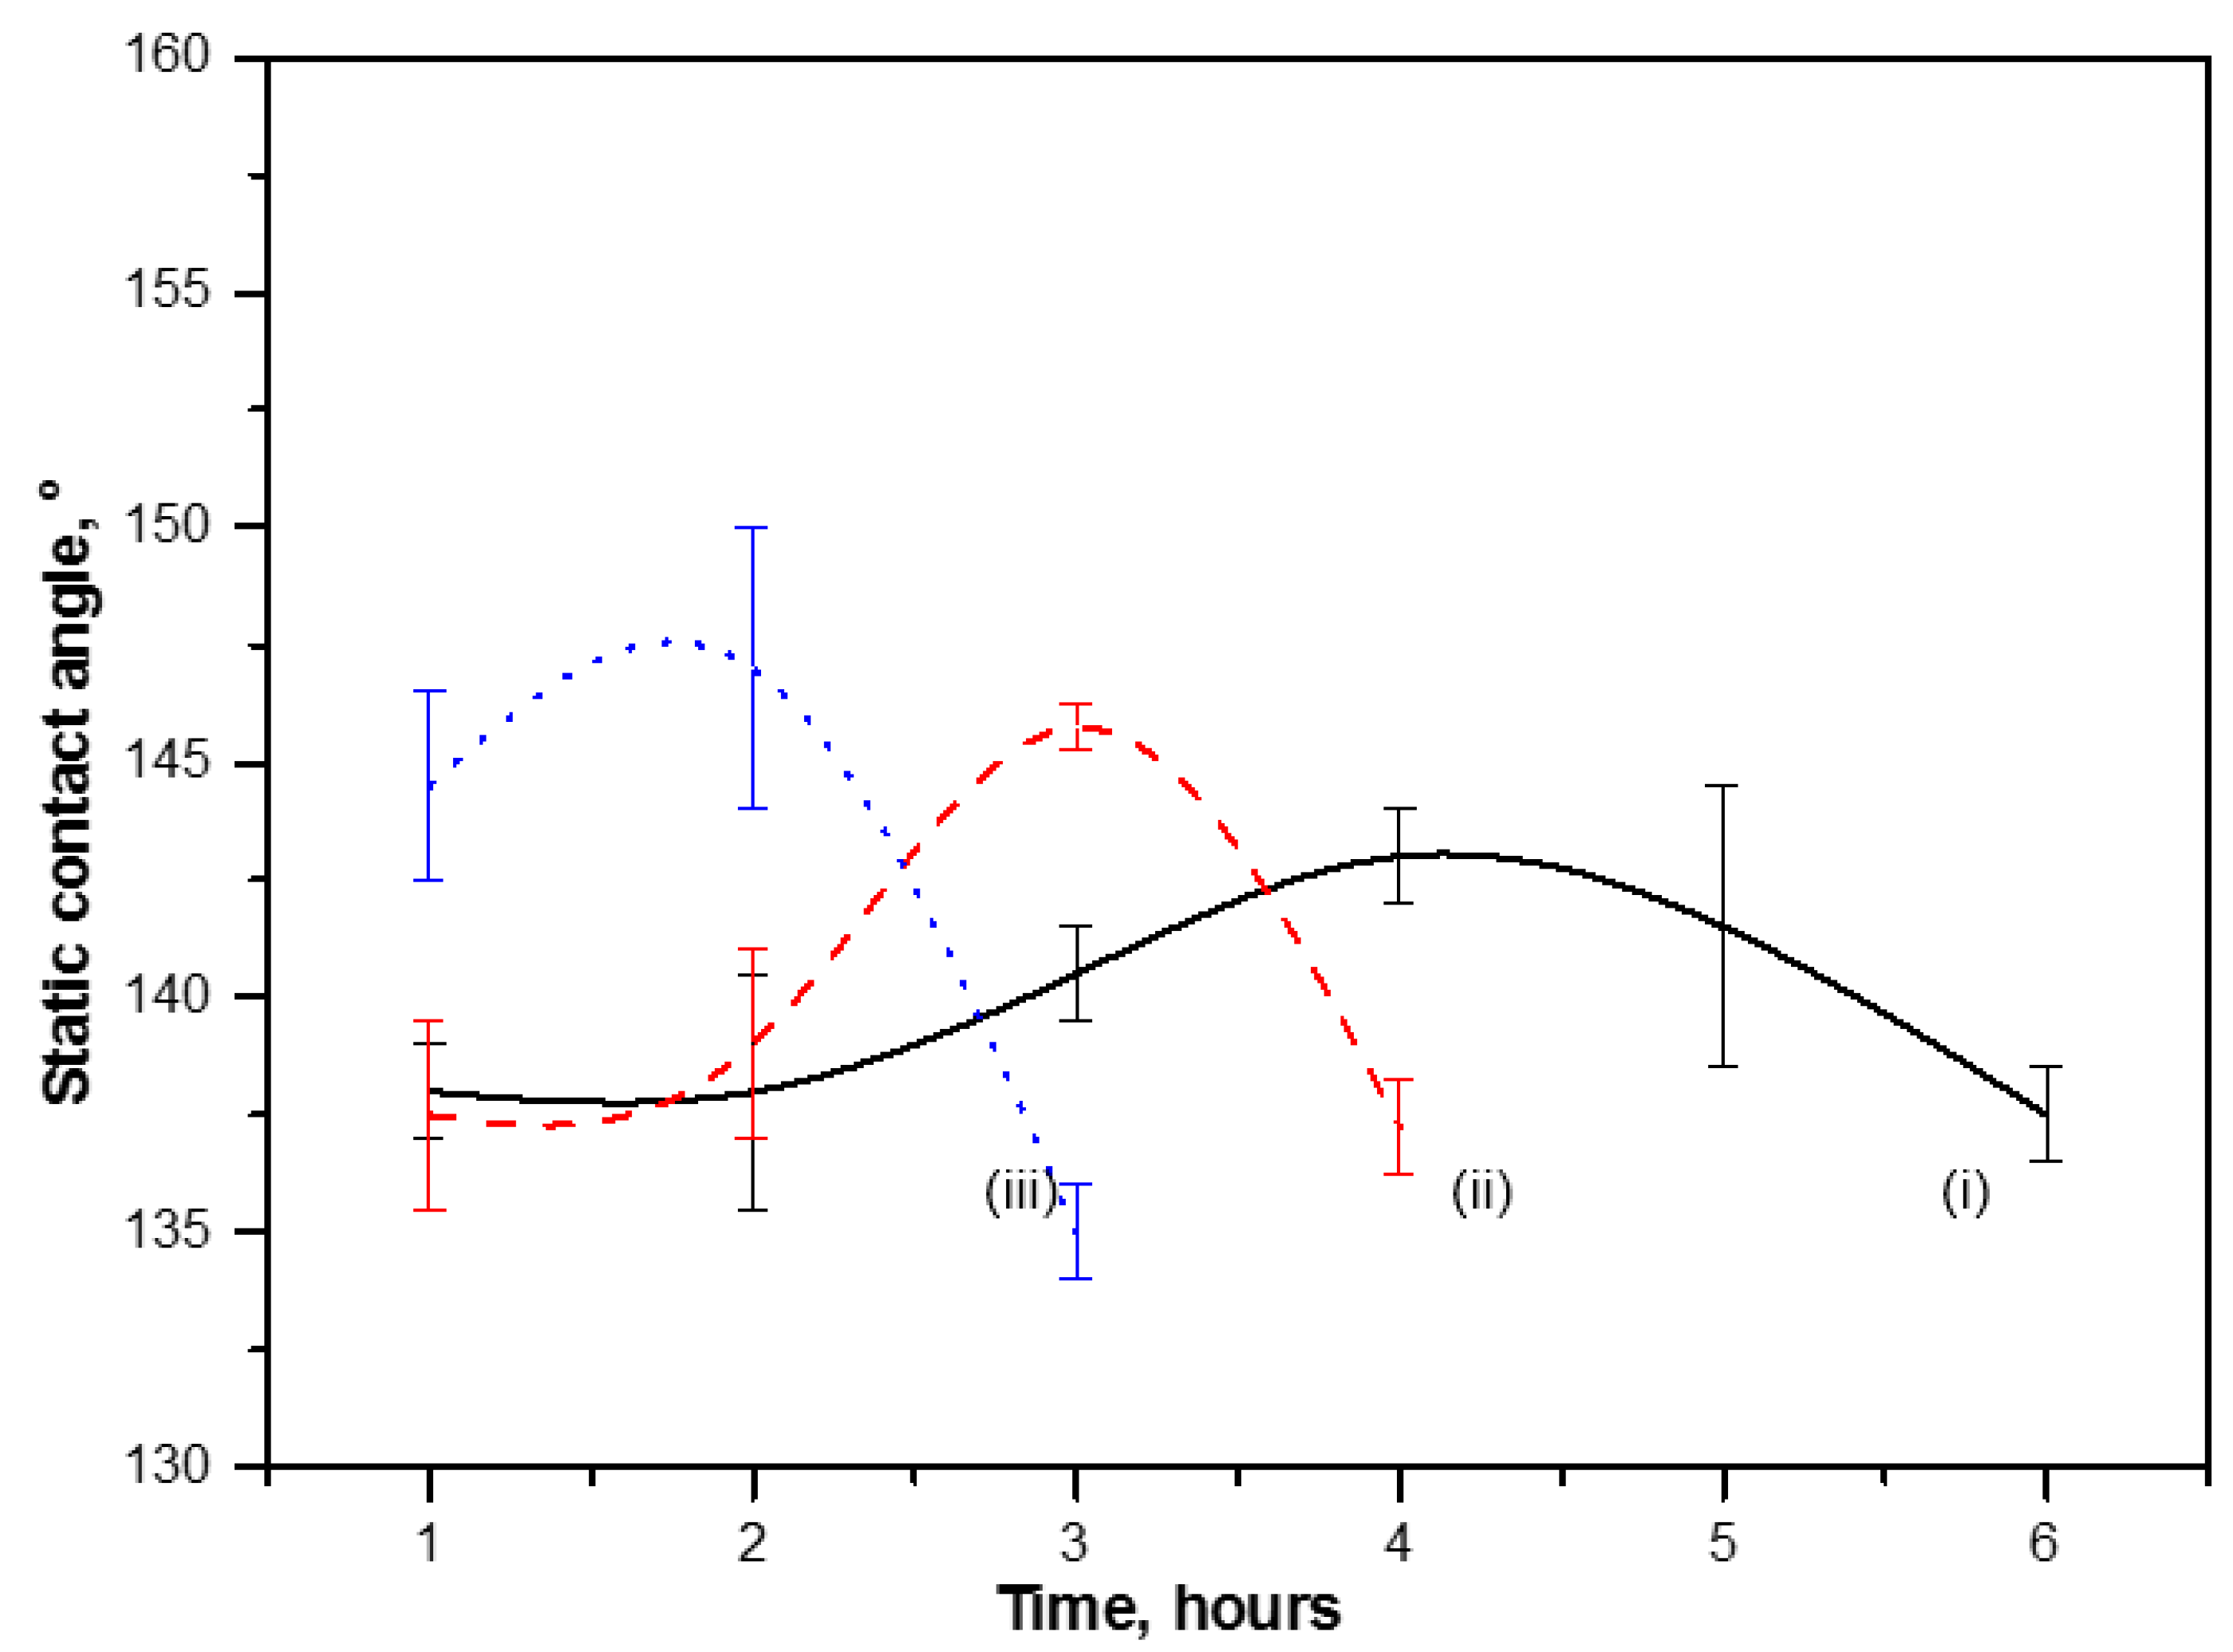
| 3 | - | - | - | - | 140 ± 1 | 137 ± 1 | 145 ± 1 | 141 ± 1 | 135 ± 1 |
| 4 | - | - | - | - | 143 ± 1 | 136 ± 1 | 137 ± 1 | 142 ± 1 | - |
| 5 | - | - | - | - | 141 ± 3 | - | - | - | - |
| 6 | - | - | - | - | 137 ± 1 | - | - | - | - |
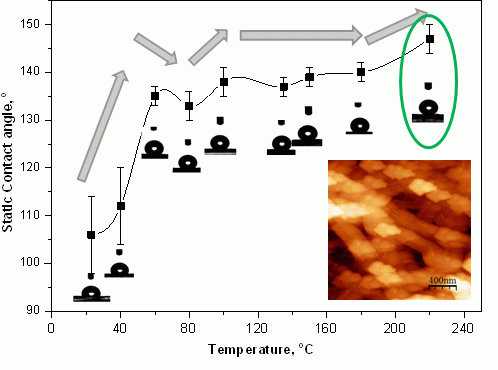
2.4.1. Contact Angle Evolution with Temperature

2.4.2. Contact Angle Evolution with Time

3. Experimental Section
3.1. Materials
3.2. MFC Films Formation and Thermal Curing
3.3. Characterization
4. Conclusions
Supplementary Materials
Acknowledgments
Author Contributions
Conflicts of Interest
References
- Siró, I.; Plackett, D. Microfibrillated cellulose and new nanocomposite materials: A review. Cellulose 2010, 17, 459–494. [Google Scholar]
- Lavoine, N.; Desloges, I.; Dufresne, A.; Bras, J. Microfibrillated cellulose—Its barrier properties and applications in cellulosic materials: A review. Carbohydr. Polym. 2012, 90, 735–764. [Google Scholar] [PubMed]
- Lavoine, N.; Desloges, I.; Bras, J. Microfibrillated cellulose coatings as new release systems for active packaging. Carbohydr. Polym. 2014, 103, 528–537. [Google Scholar] [PubMed]
- Aulin, C.; Gällstedt, M.; Lindström, T. Oxygen and oil barrier properties of microfibrillated cellulose films and coatings. Cellulose 2010, 17, 559–574. [Google Scholar] [CrossRef]
- Samyn, P. Wetting and hydrophobic modification of cellulose surfaces for paper applications. J. Mater. Sci. 2013, 48, 6455–6498. [Google Scholar] [CrossRef]
- Lönnberg, H.; Fogelström, L.; Berglund, L.; Malmström, E.; Hult, A. Surface grafting of microfibrillated cellulose with poly(ε-caprolactone)—Synthesis and characterization. Eur. Polym. J. 2008, 44, 2991–2997. [Google Scholar]
- Araki, J.; Wada, M.; Kuga, S. Steric stabilization of a cellulose microcrystal suspension by poly(ethylene glycol) grafting. Langmuir 2001, 17, 21–27. [Google Scholar]
- Ngo, Y.H.; Li, D.; Simon, G.P.; Garnier, G. Paper surfaces functionalized by nanoparticles. Adv. Colloid Interface Sci. 2011, 163, 23–38. [Google Scholar] [PubMed]
- Ma, M.; Hill, R.M. Superhydrophobic surfaces. Curr. Opin. Colloid Interface Sci. 2006, 11, 193–202. [Google Scholar]
- Stanssens, D.; van den Abbeele, H.; Vonck, L.; Schoukens, G.; Deconinck, M.; Samyn, P. Creating water-repellent and super-hydrophobic cellulose substrates by deposition of organic nanoparticles. Mater. Lett. 2011, 65, 1781–1784. [Google Scholar] [CrossRef]
- Carlsson, L.; Fall, A.; Chaduc, I.; Wågberg, L.; Charleux, B.; Malmström, E.; D’Agosto, F.; Lansalot, M.; Carlmark, A. Modification of cellulose model surfaces by cationic polymer latexes prepared by RAFT-mediated surfactant-free emulsion polymerization. Polym. Chem. 2014, 5, 6076–6086. [Google Scholar] [CrossRef]
- Ichiura, H.; Takayama, M.; Nishida, N.; Otani, Y. Interfacial polymerization preparation of functional paper coated with polyamide film containing volatile essential oil. J. Appl. Polym. Sci. 2012, 124, 242–247. [Google Scholar]
- Cusola, O.; Tabary, N.; Belgacem, M.N.; Bras, J. Cyclodextrin functionalization of several cellulosic substrates for prolonged release of antibacterial agents. J. Appl. Polym. Sci. 2013, 129, 604–613. [Google Scholar] [CrossRef]
- Ichiura, H.; Yamamoto, K.-I.; Ohtani, Y. Low temperature-dependence of N,N-dimethyl-3-methylbenzamide (DEET) release from a functional paper containing paraffin—DEET composites prepared using interfacial polymerization. Chem. Eng. J. 2014, 245, 17–23. [Google Scholar] [CrossRef]
- Ichiura, H.; Morikawa, M.; Fujiwara, K. Preparation of microcapsules that produce color in response to humidity for use in intelligent functional paper. J. Mater. Sci. 2005, 40, 1987–1991. [Google Scholar] [CrossRef]
- Matsubara, H.; Takada, M.; Koyama, S.; Hashimoto, K.; Fujishima, A. Photoactive TiO2 Containing Paper: Preparation and Its Photocatalytic Activity under Weak UV Light Illumination. Chem. Lett. 1995, 9, 767–768. [Google Scholar]
- Popil, R.E. High stiffness surface coating optimization through starch encapsulation of platy kaolin. BioResources 2010, 5, 2738–2750. [Google Scholar]
- Shen, J.; Song, Z.; Qian, X.; Liu, W. Modification of papermaking grade fillers: A brief review. BioResources 2009, 4, 1190–1209. [Google Scholar]
- Samyn, P.; Schoukens, G.; Stanssens, D.; Vonck, L.; Abbeele, H. Incorporating different vegetable oils into an aqueous dispersion of hybrid organic nanoparticles. J. Nanoparticle Res. 2012, 14, 1075–1098. [Google Scholar] [CrossRef]
- Samyn, P.; Schoukens, G.; Vonck, L.; Stanssens, D.; van den Abbeele, H. How thermal curing of an organic paper coating changes topography, chemistry, and wettability. Langmuir 2011, 27, 8509–8521. [Google Scholar] [PubMed]
- Geissler, A.; Chen, L.; Zhang, K.; Bonaccurso, E.; Biesalski, M. Superhydrophobic surfaces fabricated from nano- and microstructured cellulose stearoyl esters. Chem. Commun. 2013, 49, 4962–4964. [Google Scholar]
- Gustafsson, E.; Larsson, P.A.; Wågberg, L. Treatment of cellulose fibres with polyelectrolytes and wax colloids to create tailored highly hydrophobic fibrous networks. Colloids Surf. A 2012, 414, 415–421. [Google Scholar] [CrossRef]
- Rastogi, V.K.; Samyn, P. Novel production method for in-situ hydrophobization of a microfibrillated cellulose network. Mater. Lett. 2014, 120, 196–199. [Google Scholar]
- Mikhailow, G.P.; Artukhov, A.I.; Shevelv, V.A. Study on molecular motion of cellulose and its derivatives by dielectric and NMR methods. Vysokomol. Soeg. 1969, 11, 553–563. (In Russion) [Google Scholar]
- Samyn, P.; van Nieuwkerke, D.; Schoukens, G.; Stanssens, D.; Vonck, L.; van den Abbeele, H. Hybrid palm-oil/styrene maleimide nanoparticles synthesized in aqueous dispersion under different conditions. J. Microencapsul. 2014. submitted. [Google Scholar]
- Olsson, A.-M.; Salmén, L. The association of water to cellulose and hemicellulose in paper examined by FTIR spectroscopy. Carbohydr. Res. 2004, 339, 813–818. [Google Scholar] [PubMed]
- Merk, S.; Blume, A.; Riederer, M. Phase behaviour and crystallinity of plant cuticular waxes studied by Fourier transform infrared spectroscopy. Planta 1997, 204, 44–53. [Google Scholar] [CrossRef]
- Samyn, P.; Deconinck, M.; Schoukens, G.; Stanssens, D.; Vonck, L.; van den Abbeele, H. Synthesis and characterization of imidized poly(styrene-maleic anhydride) nanoparticles in stable aqueous dispersion. Polym. Adv. Technol. 2012, 23, 311–325. [Google Scholar] [CrossRef]
- Wenzel, R.N. Surface Roughness and Contact Angle. J. Phys. Chem. 1949, 53, 1466–1467. [Google Scholar]
© 2014 by the authors; licensee MDPI, Basel, Switzerland. This article is an open access article distributed under the terms and conditions of the Creative Commons Attribution license (http://creativecommons.org/licenses/by/4.0/).
Share and Cite
Rastogi, V.K.; Stanssens, D.; Samyn, P. Mechanism for Tuning the Hydrophobicity of Microfibrillated Cellulose Films by Controlled Thermal Release of Encapsulated Wax. Materials 2014, 7, 7196-7216. https://doi.org/10.3390/ma7117196
Rastogi VK, Stanssens D, Samyn P. Mechanism for Tuning the Hydrophobicity of Microfibrillated Cellulose Films by Controlled Thermal Release of Encapsulated Wax. Materials. 2014; 7(11):7196-7216. https://doi.org/10.3390/ma7117196
Chicago/Turabian StyleRastogi, Vibhore Kumar, Dirk Stanssens, and Pieter Samyn. 2014. "Mechanism for Tuning the Hydrophobicity of Microfibrillated Cellulose Films by Controlled Thermal Release of Encapsulated Wax" Materials 7, no. 11: 7196-7216. https://doi.org/10.3390/ma7117196