Property Relationship in Organosilanes and Nanotubes Filled Polypropylene Hybrid Composites

Abstract
:1. Introduction
2. Experimental Section
2.1. Materials
2.2. Synthesis of Organosilanes

| Reaction media (12.5 mL) | Distillated water (mL) | Isopropyl alcohol (mL) | TMOPS (mL) |
|---|---|---|---|
| Acetic acid (C2H4O2) | 250 | 20 | 50 |
| Formic acid (C3H4O3) | |||
| Ammonium hydroxide (NH4OH) |
2.3. Nanotubes
2.4. Sample Preparation
| Matrix | Filler | Code name |
|---|---|---|
| PP-SL262MW | – | PP |
| PP-SL262MW | Sol-gel (catalyst: acetic acid) | PP-Acetic |
| PP-SL262MW | Sol-gel (catalyst: formic acid) | PP-Formic |
| PP-SL262MW | Sol-gel (catalyst: ammonium hydroxide) | PP-Base |
| PP-SL262MW | Natural HNT | PP-HNT |
| PP-SL262MW | Functionalized HNT | PP-PolyHNT |
| PP-SL262MW | Untreated CNT | PP-CNT |
| PP-SL262MW | Functionalized CNT | PP-CNTF |
2.5. Thermal Analysis
2.6. Rheological Testing
Frequency Sweeps
2.7. Morphological Characterization
2.7.1. SEM
2.7.2. TEM
2.8. Gas Barrier Testing
2.9. Tensile Testing
2.10. Electrical Properties
3. Results and Discussion
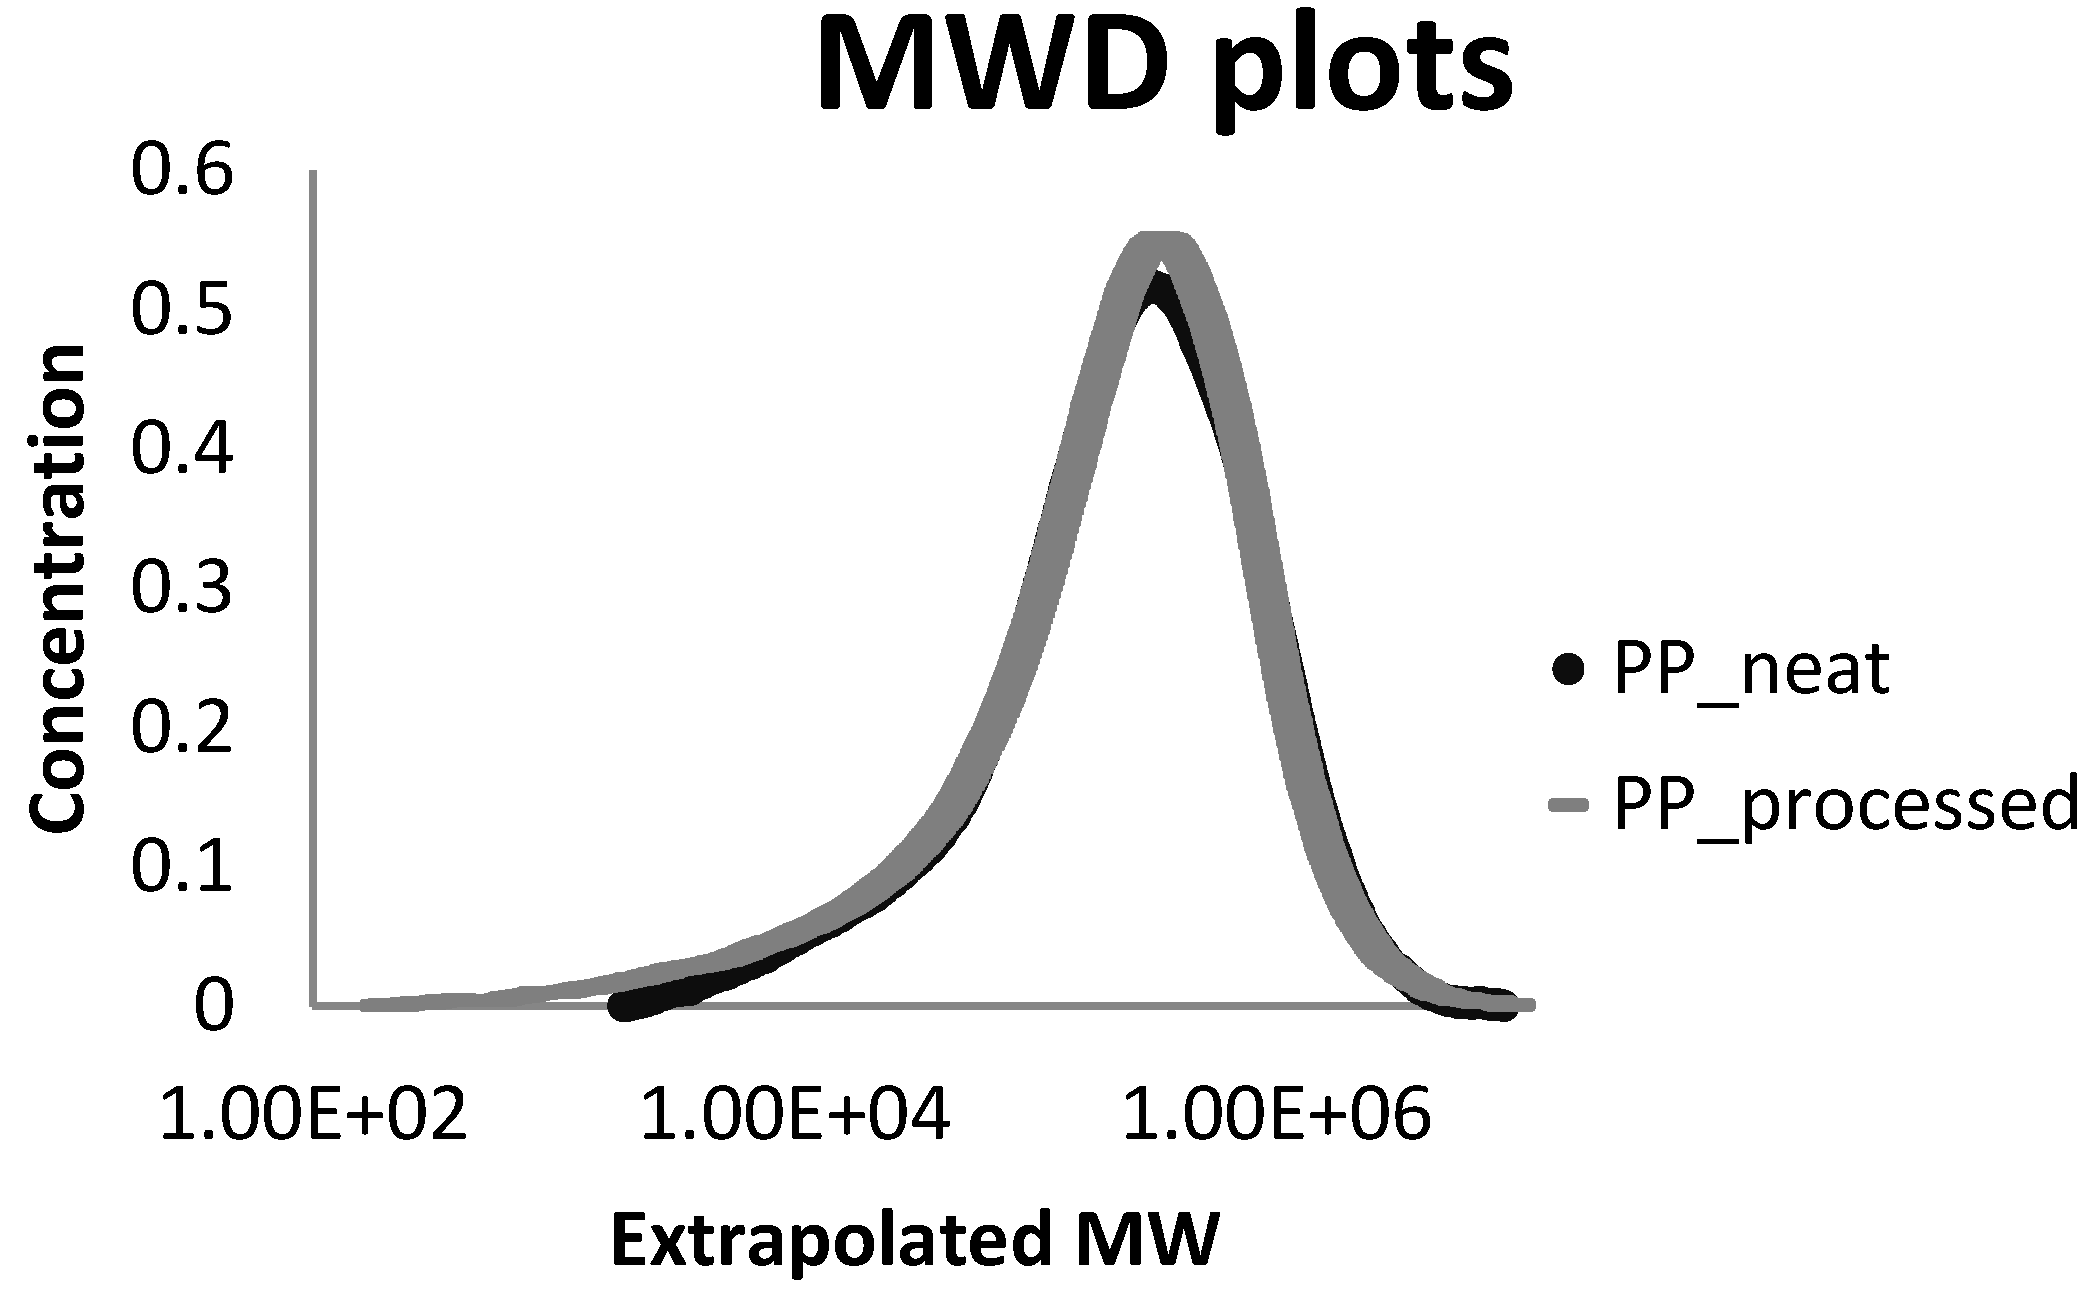
3.1. Molecular Weight Distribution Analysis (MWD)
| Sample | Mn | Mw | Mz | Mz + 1 | PDI |
|---|---|---|---|---|---|
| PP_neat | 85,776 | 449,894 | 1,116,141 | 2,127,264 | 5.25 |
| PP_processed | 75,408 | 460,610 | 1,013,190 | 2,084,280 | 6.11 |
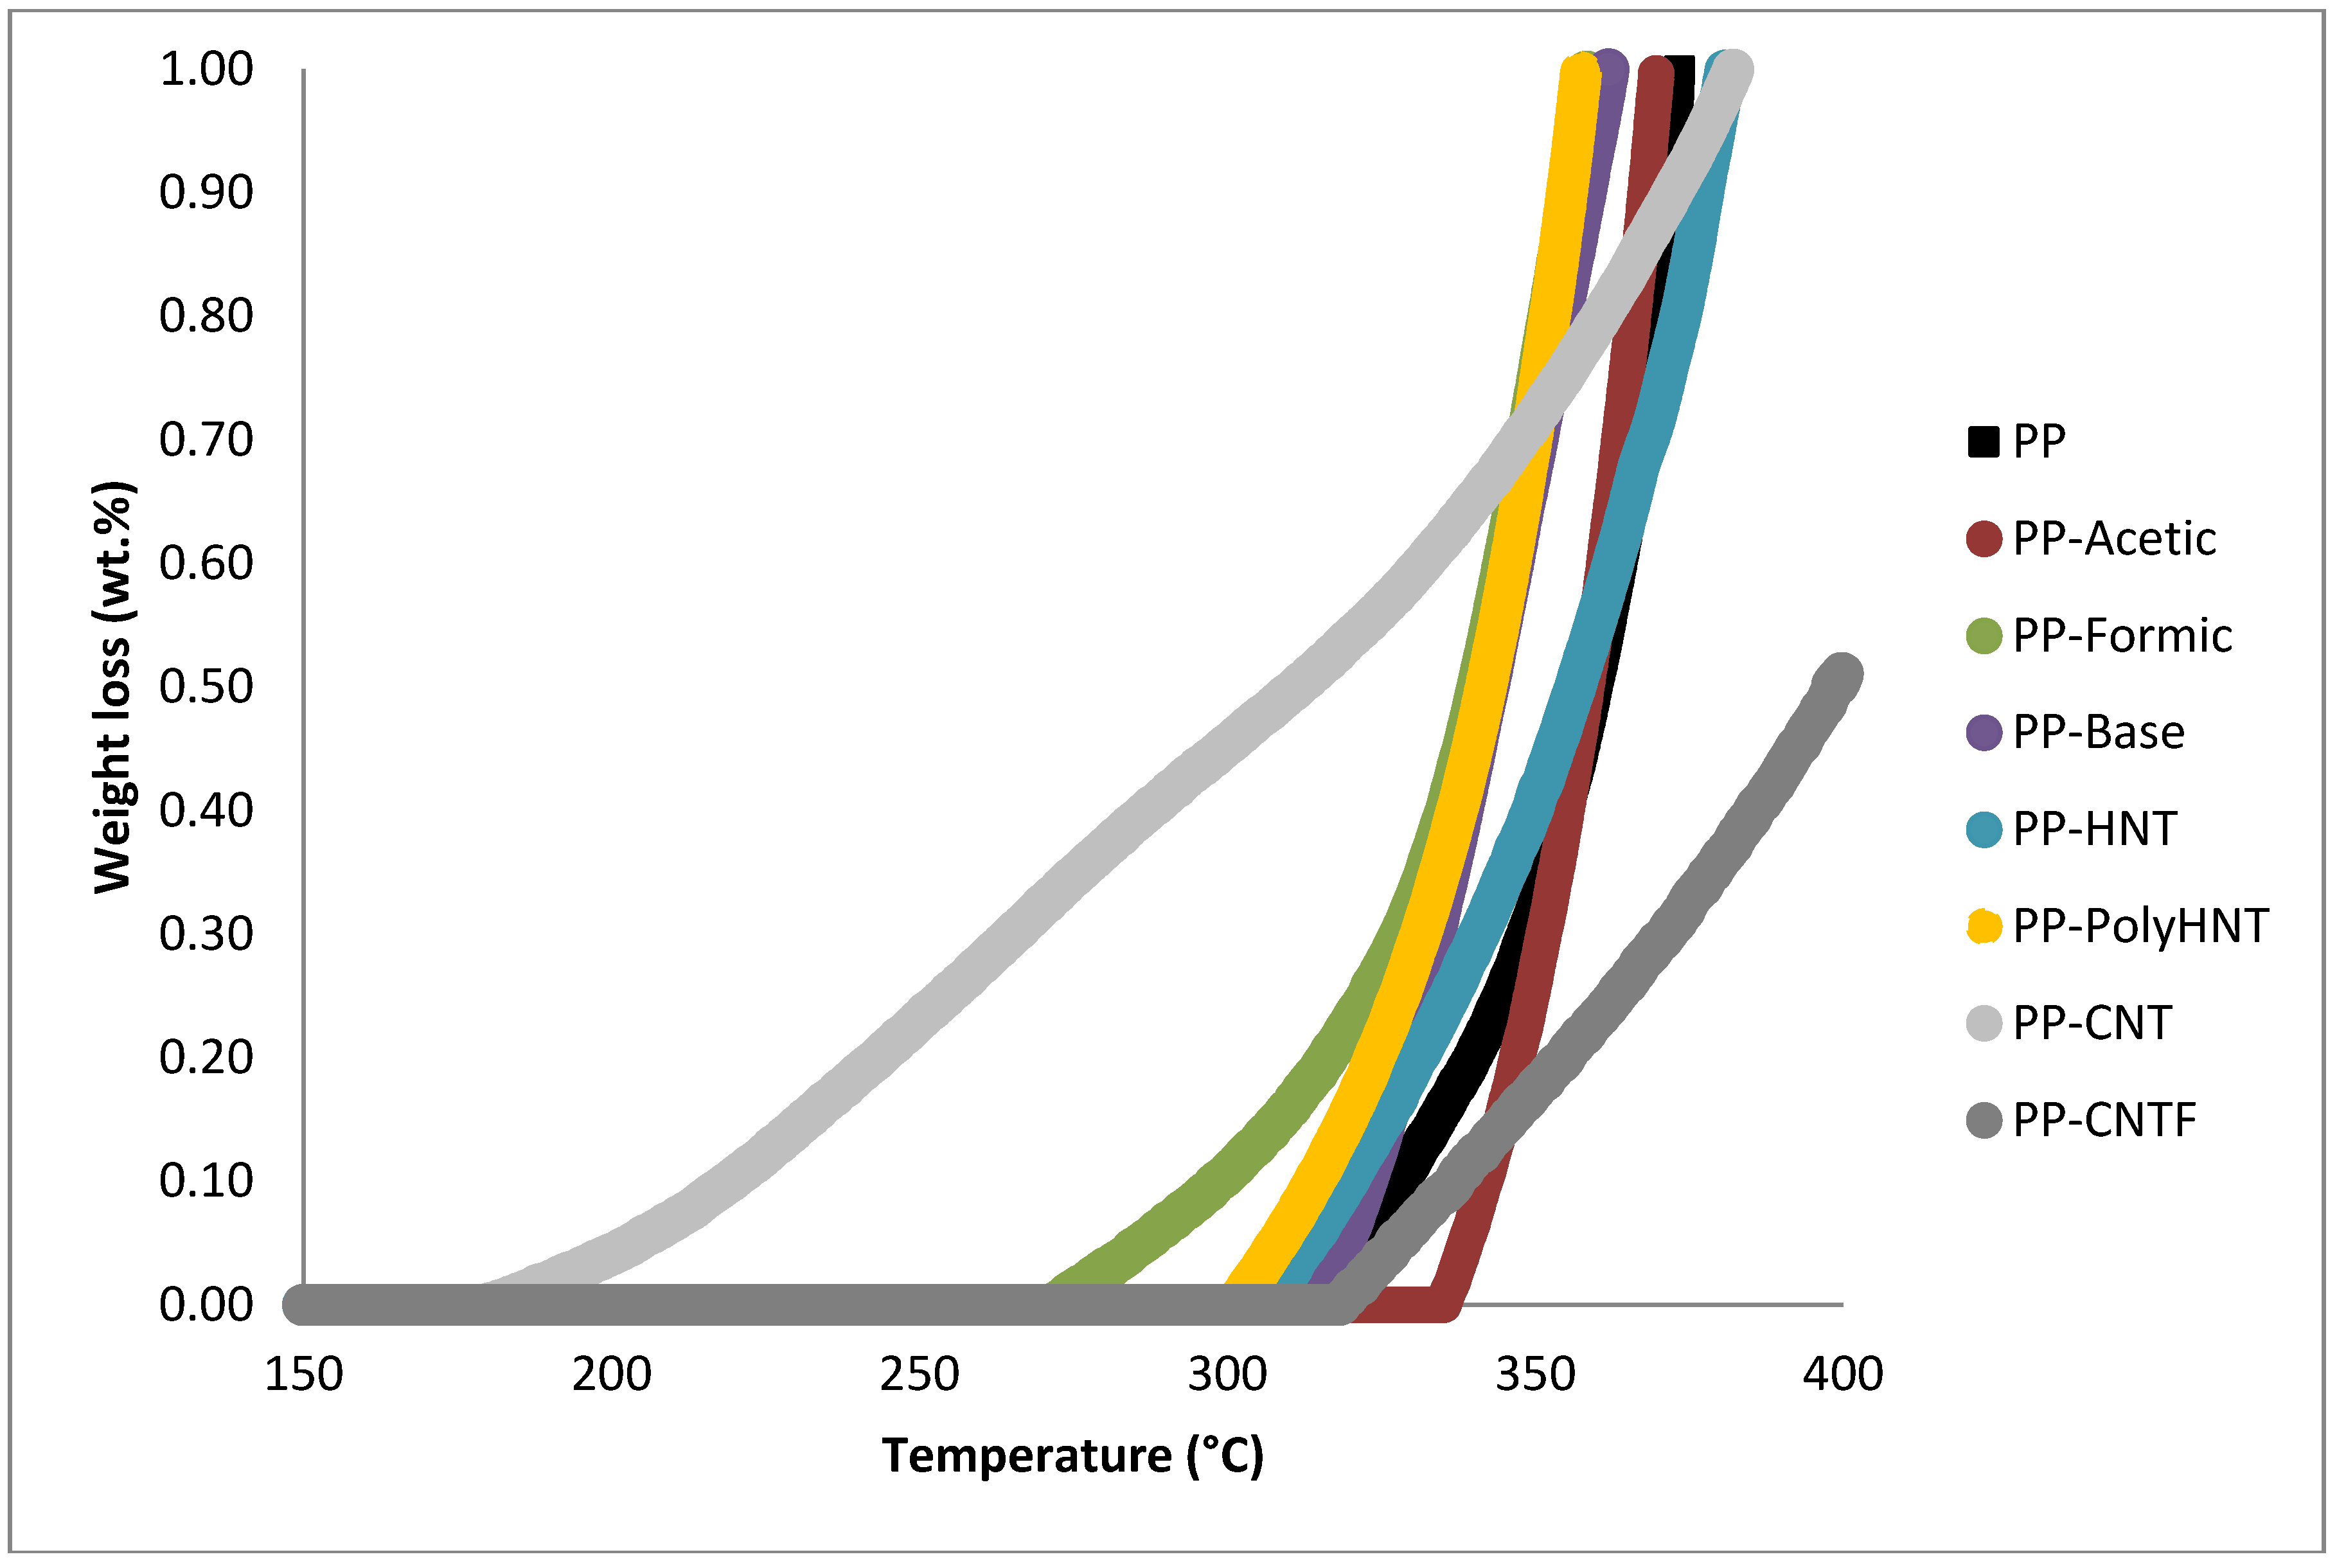
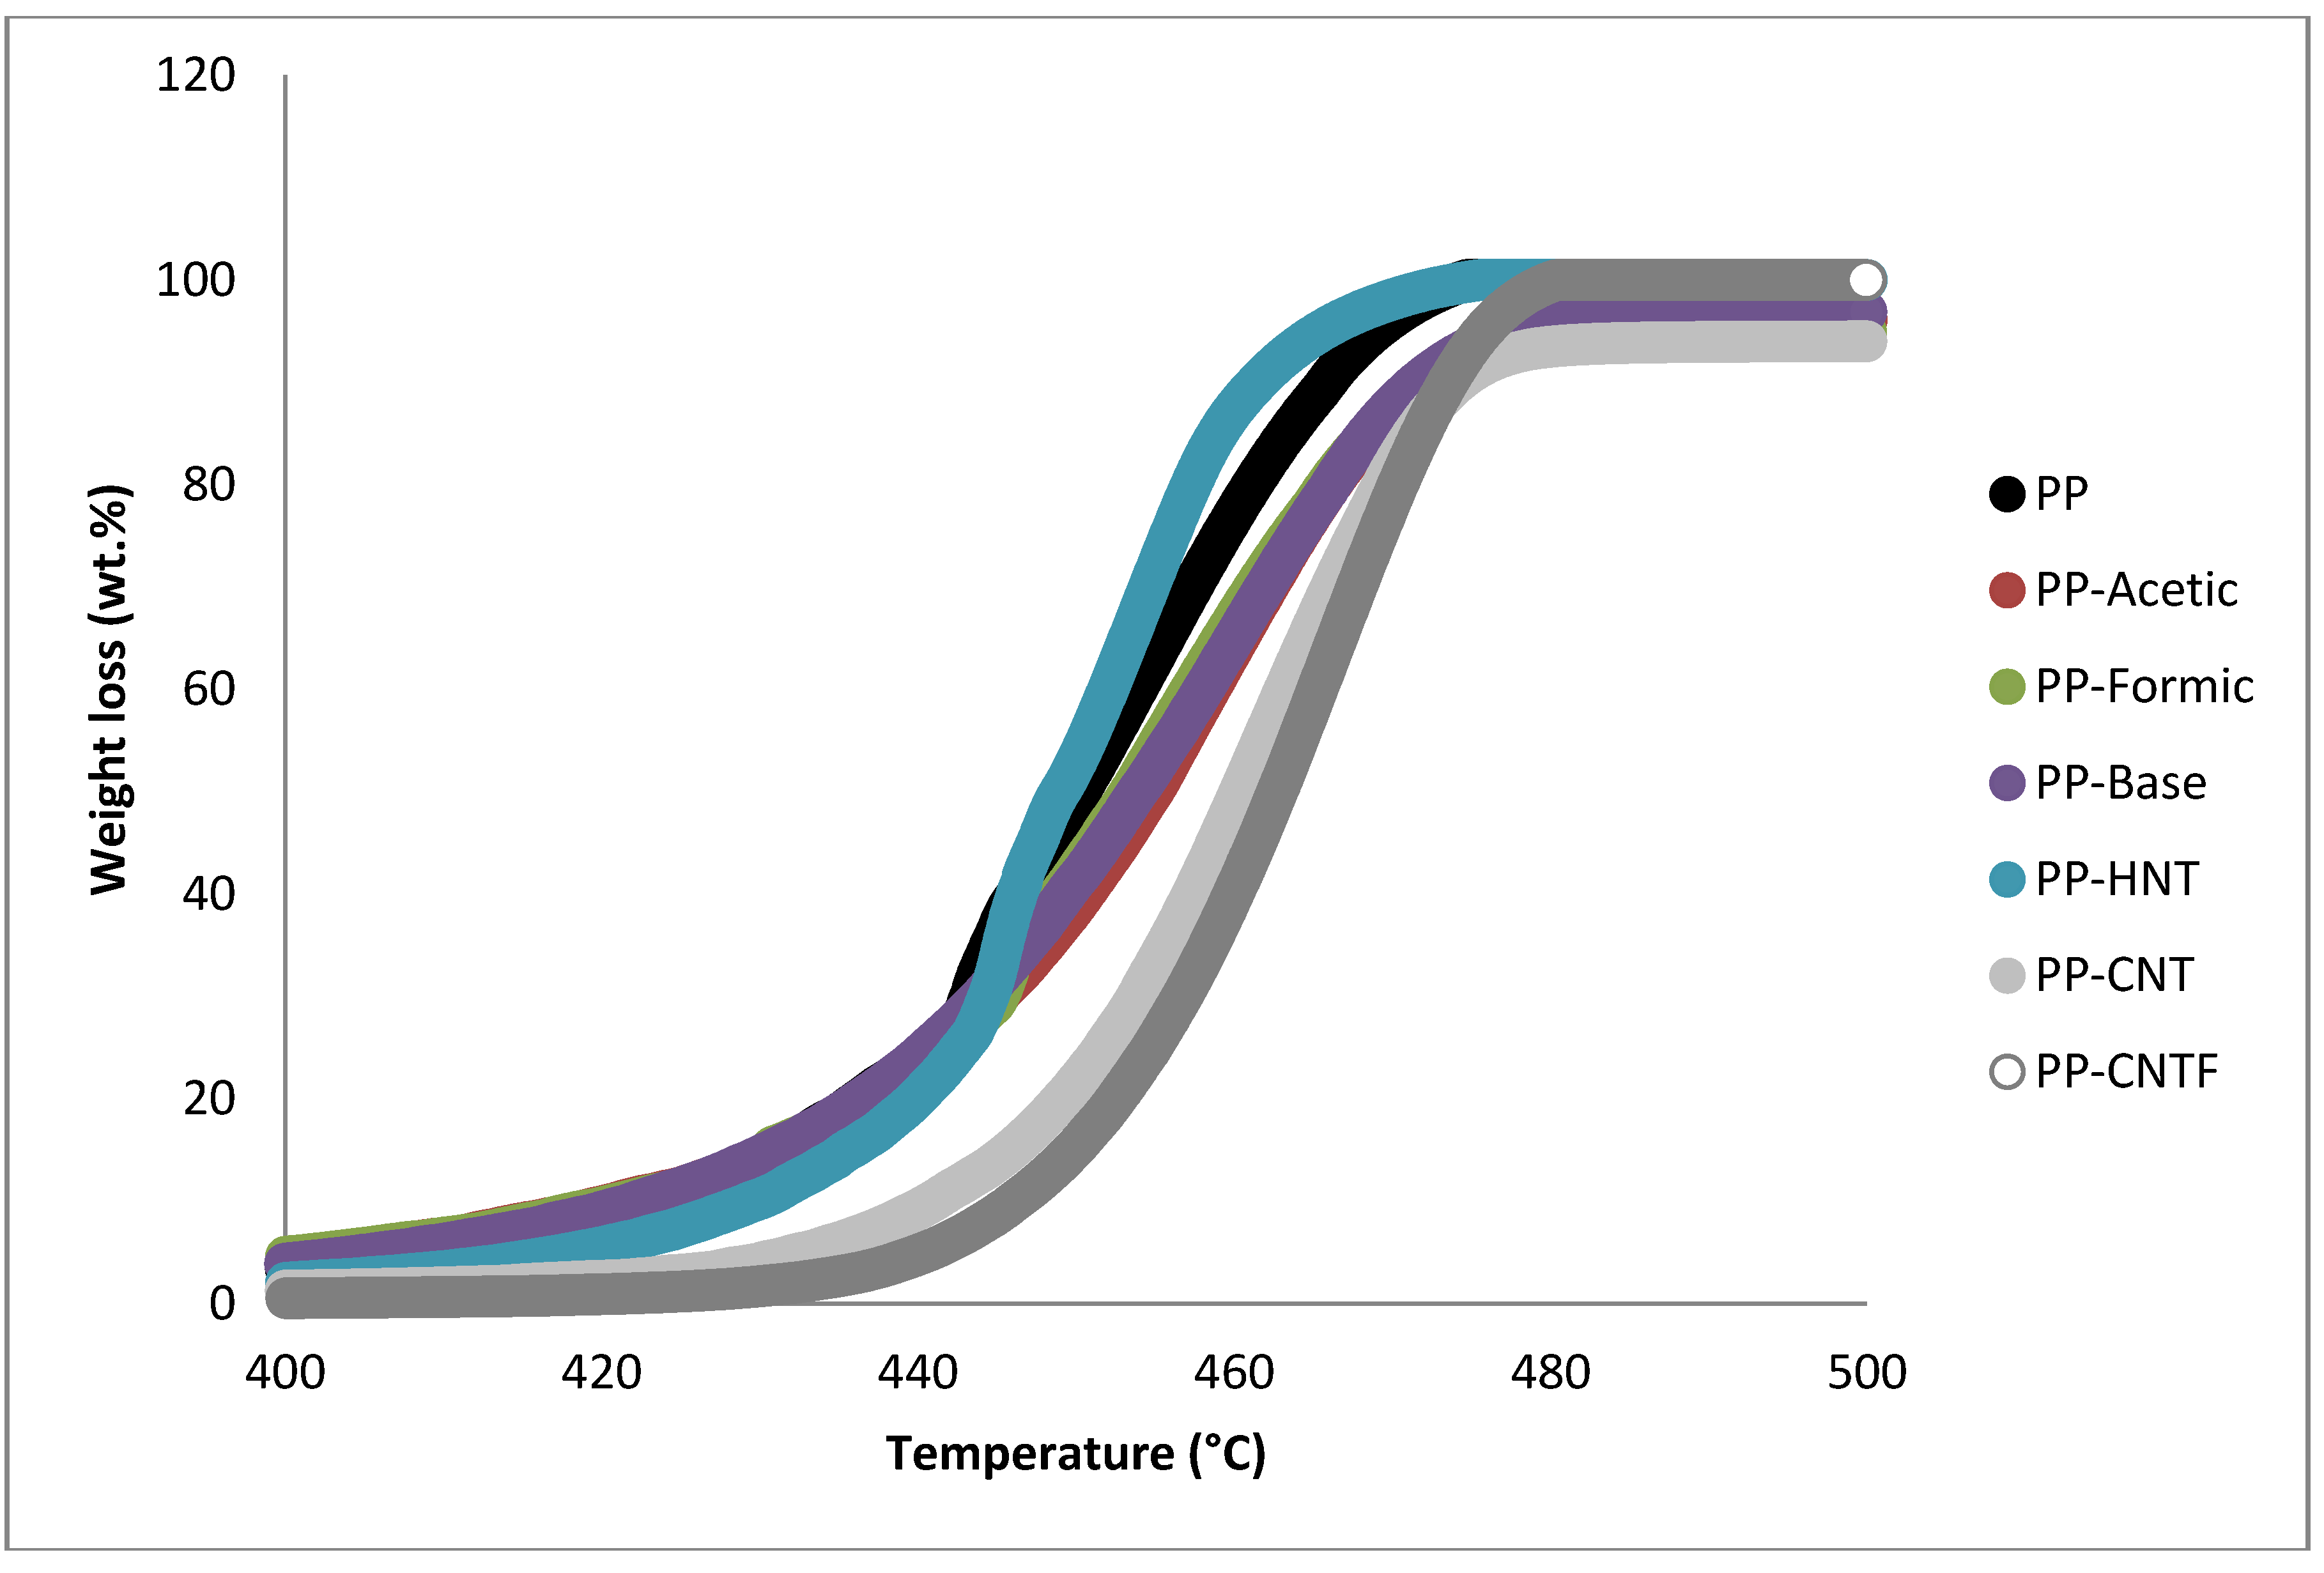
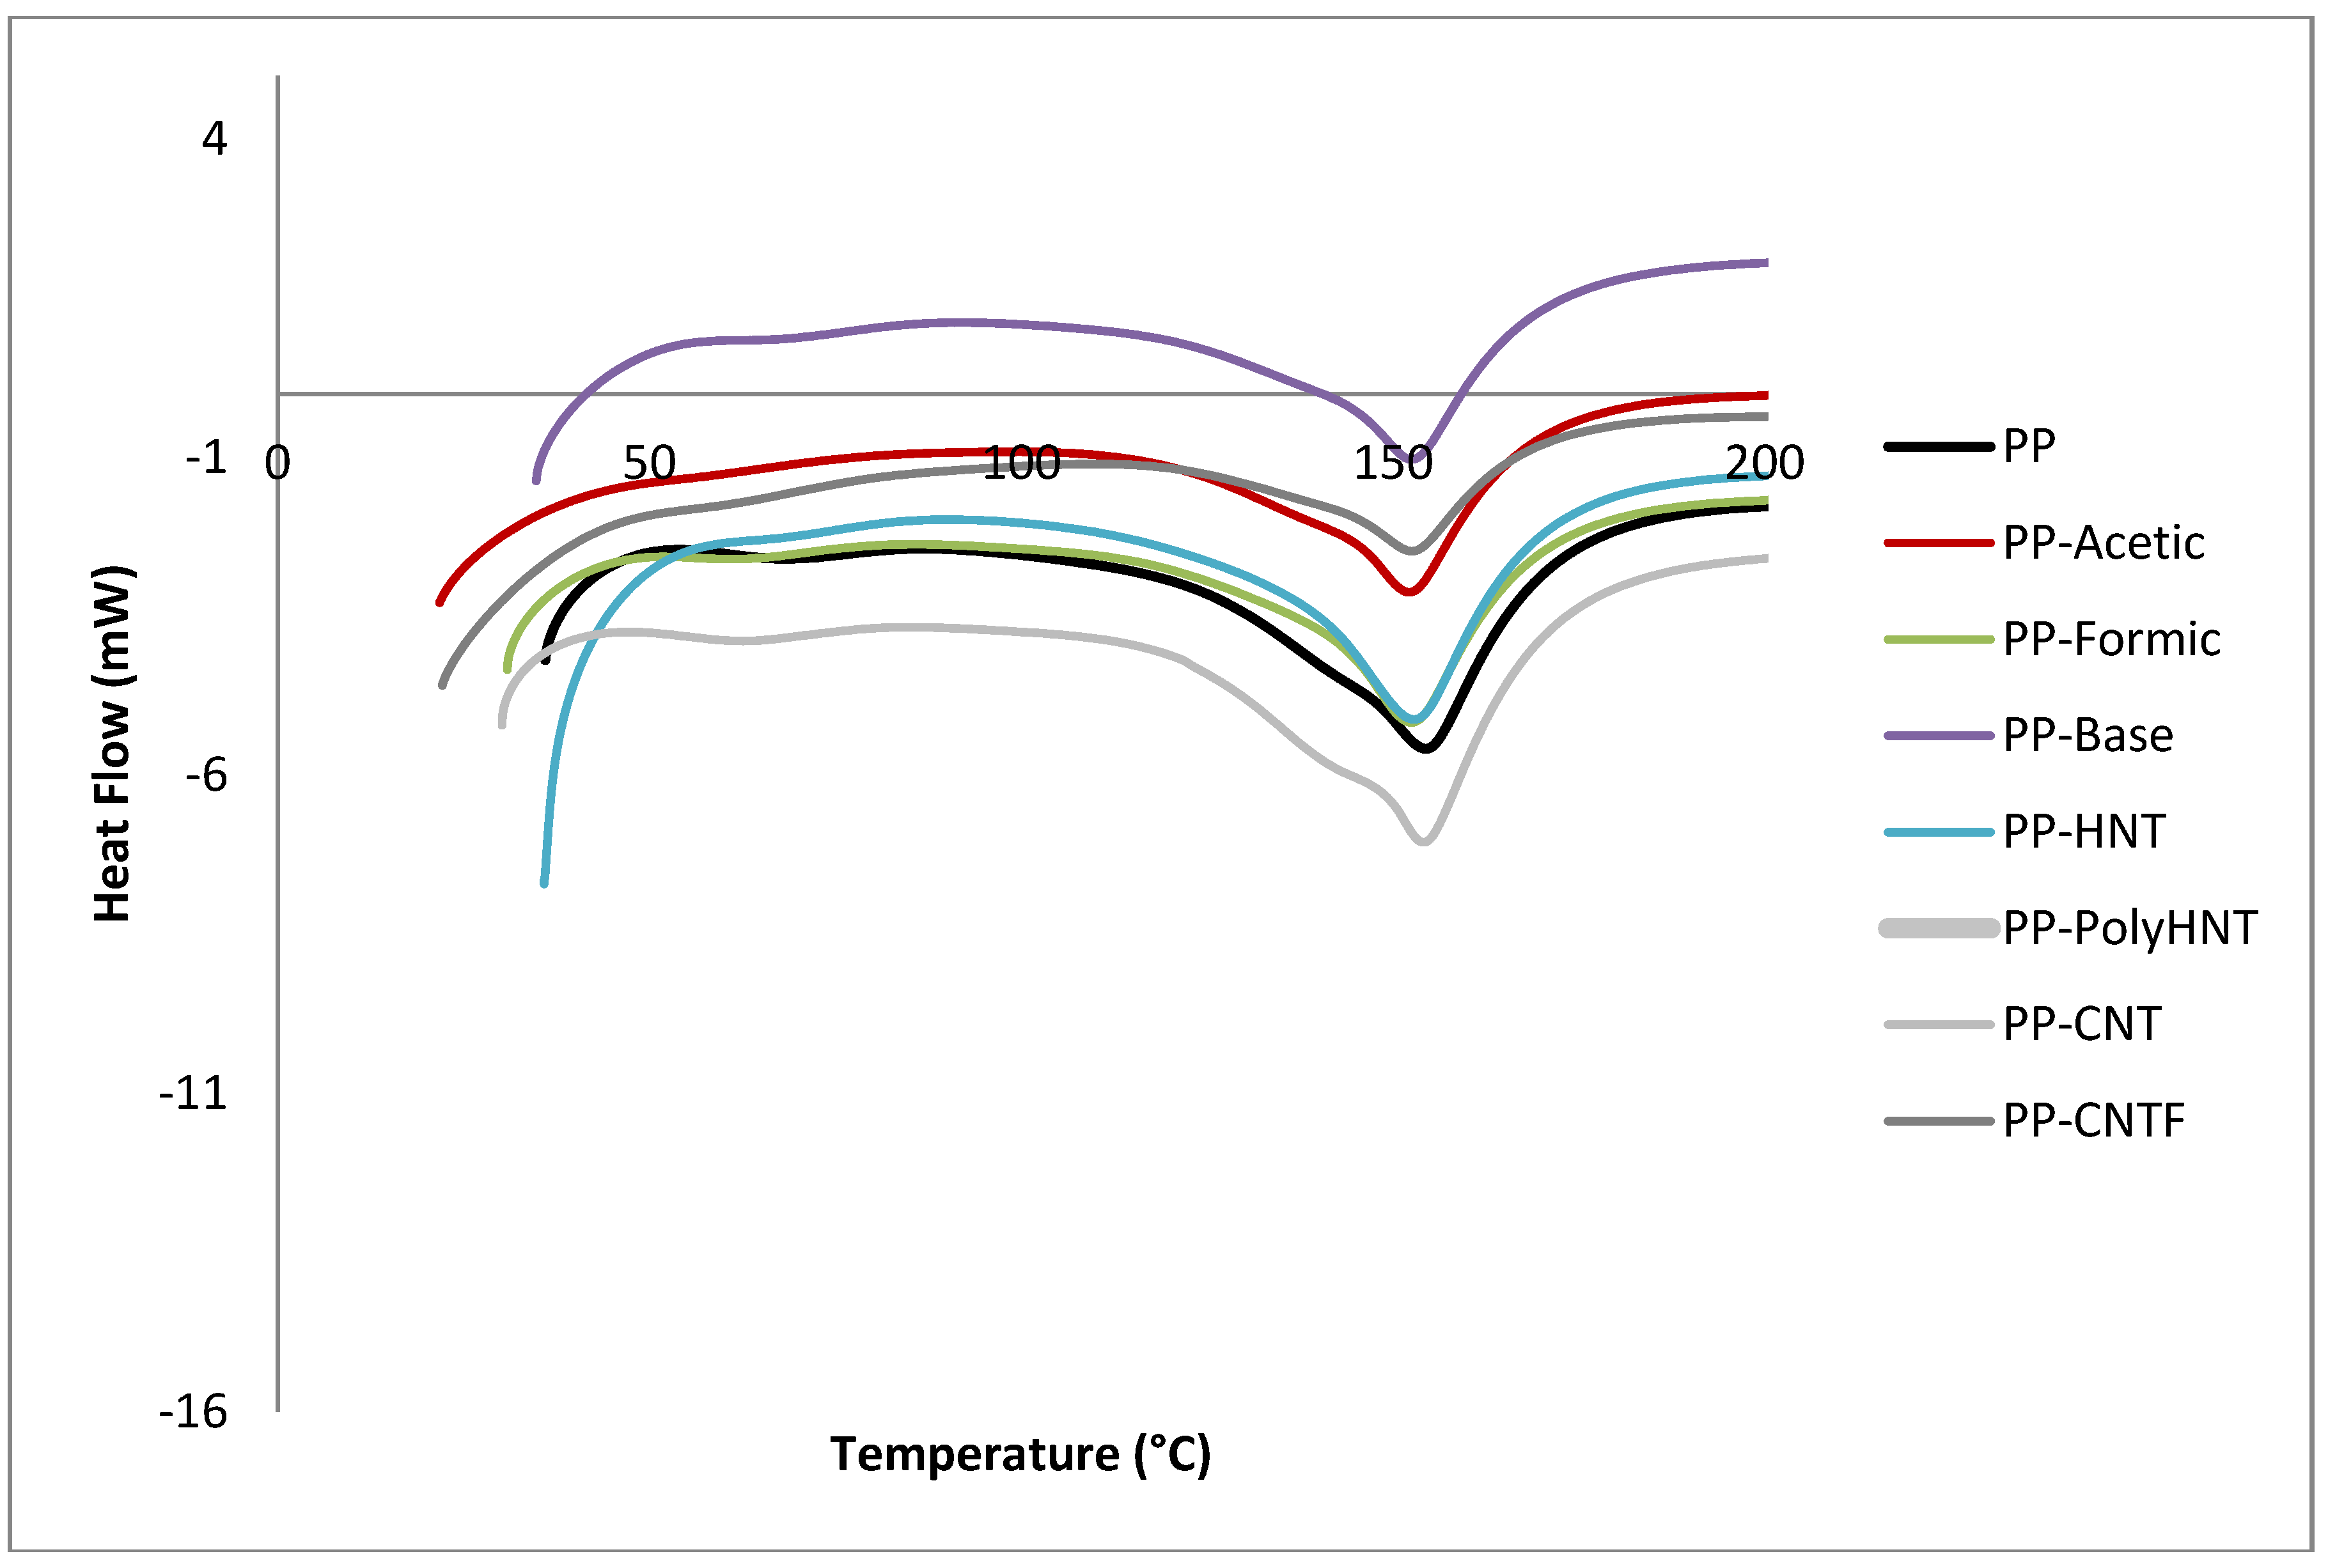
3.2. Thermal Analysis

| Sample | Weight loss % | ||||
|---|---|---|---|---|---|
| 175–325 °C | 400–420 °C | 420–440 °C | 440–460 °C | 460–550 °C | |
| PP | 0.07 | 5.13 | 15.35 | 53.30 | 22.78 |
| PP-Acetic | 0.00 | 5.10 | 13.52 | 41.42 | 32.05 |
| PP-Formic | 0.27 | 4.84 | 13.61 | 43.99 | 28.39 |
| PP-Base | 0.14 | 5.06 | 15.29 | 40.90 | 32.23 |
| PP-HNT | 0.15 | 3.49 | 14.70 | 67.22 | 12.57 |
| PP-PolyHNT | 0.21 | 5.11 | 14.61 | 64.35 | 3.44 |
| PP-CNT | 0.56 | 0.96 | 6.96 | 39.84 | 45.04 |
| PP-CNTF | 0.04 | 0.39 | 3.85 | 35.61 | 59.63 |
| Sample | 1st Peak temperature (°C) | 2nd Peak temperature (°C) |
|---|---|---|
| PP | 154.55 | 455.91 |
| PP-Acetic | 152.17 | 460.4 |
| PP-Formic | 152.49 | 457.96 |
| PP-Base | 152.56 | 461.39 |
| PP-HNT | 152.92 | 455.47 |
| PP-PolyHNT | 146.07 | 454.68 |
| PP-CNT | 154.16 | 464.59 |
| PP-CNTF | 152.52 | 467.86 |
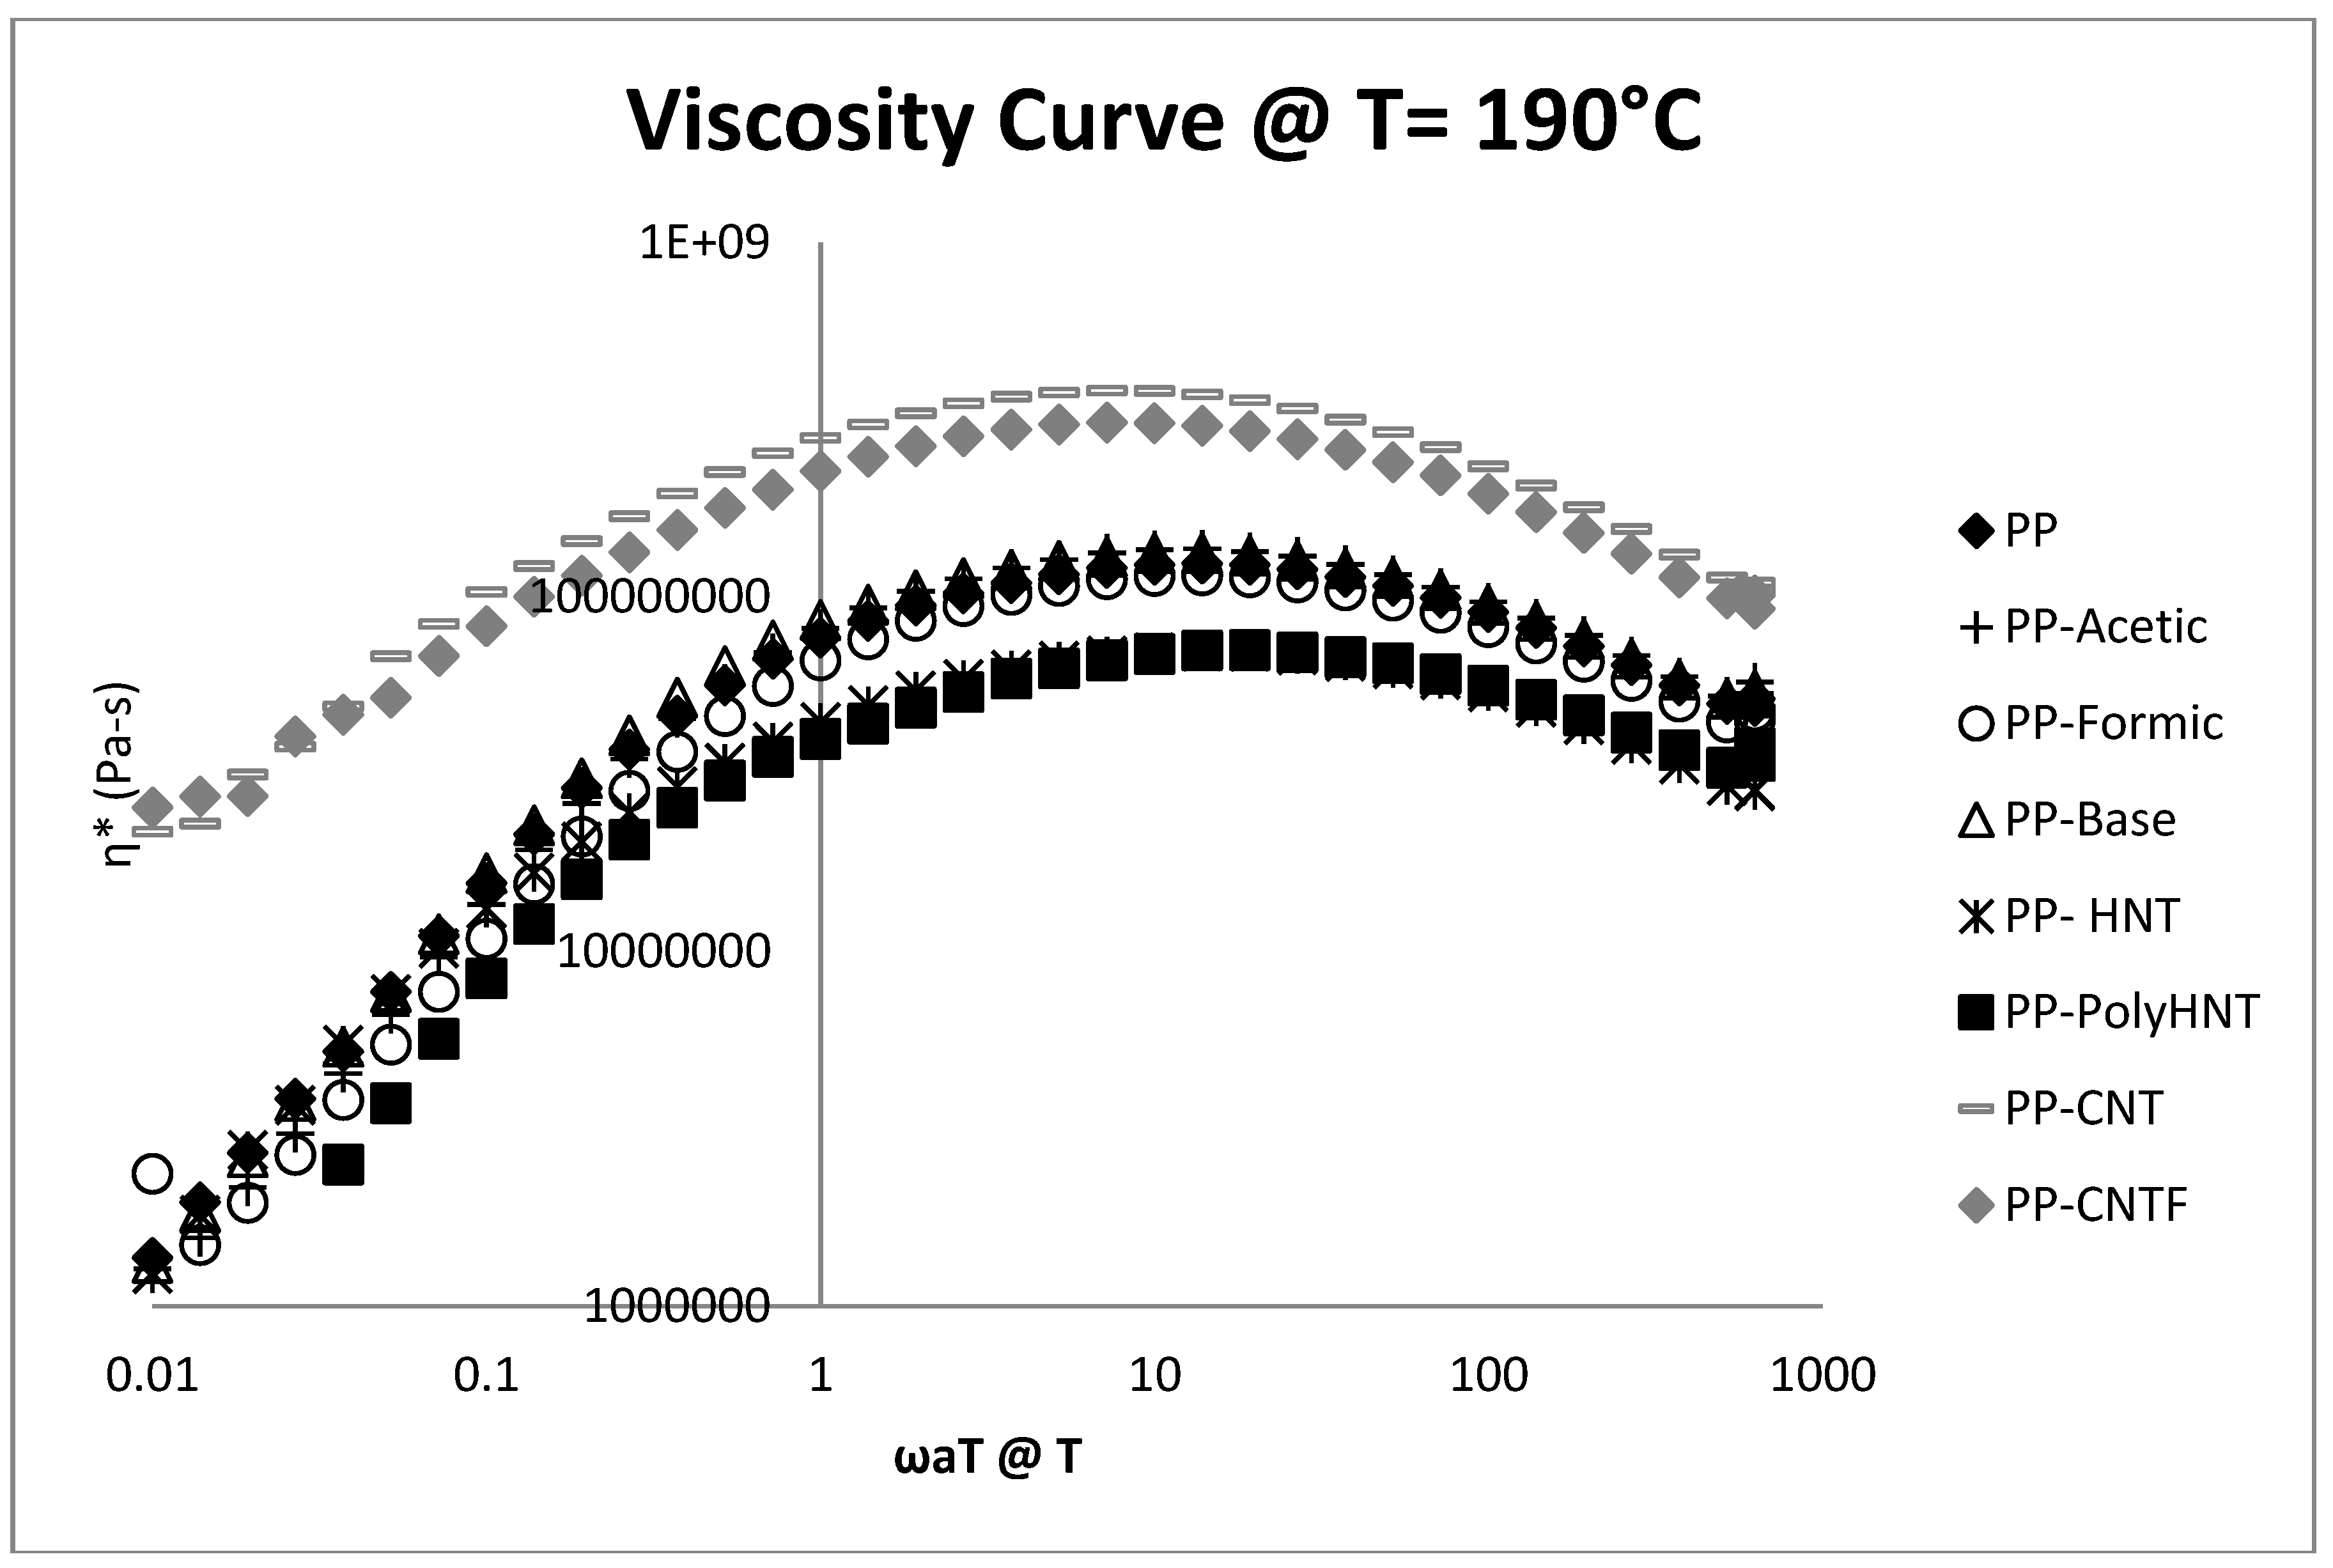
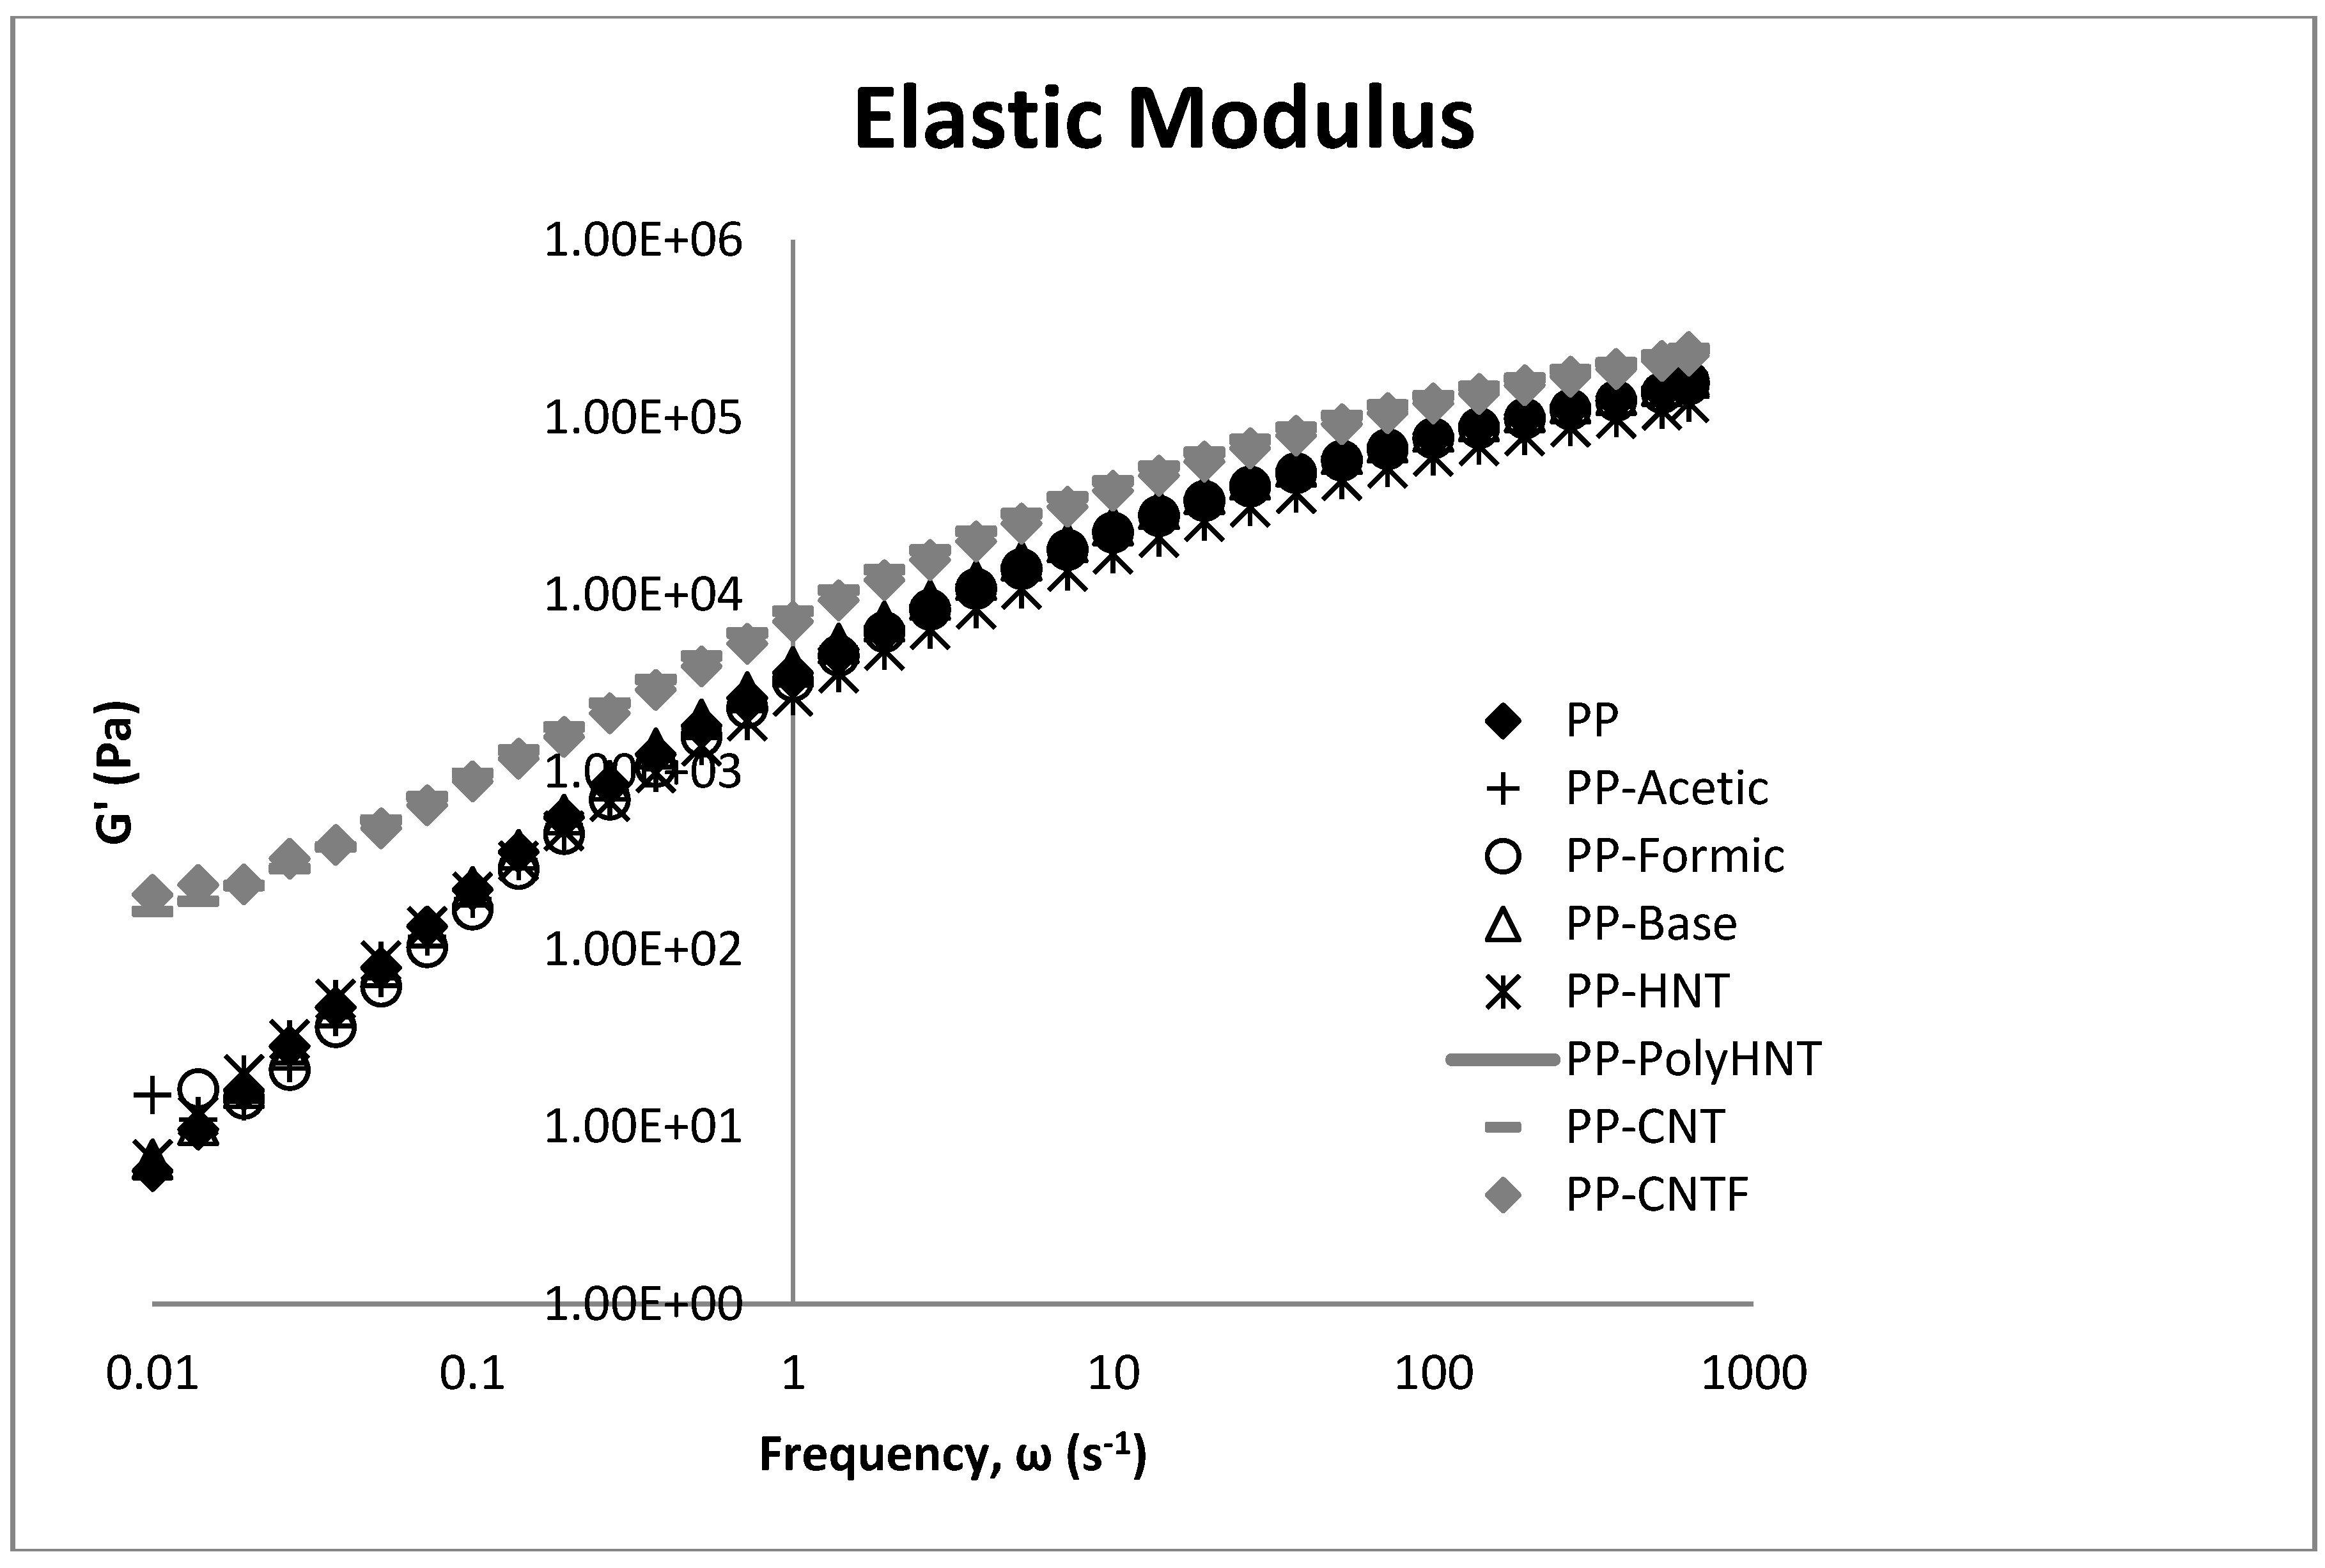
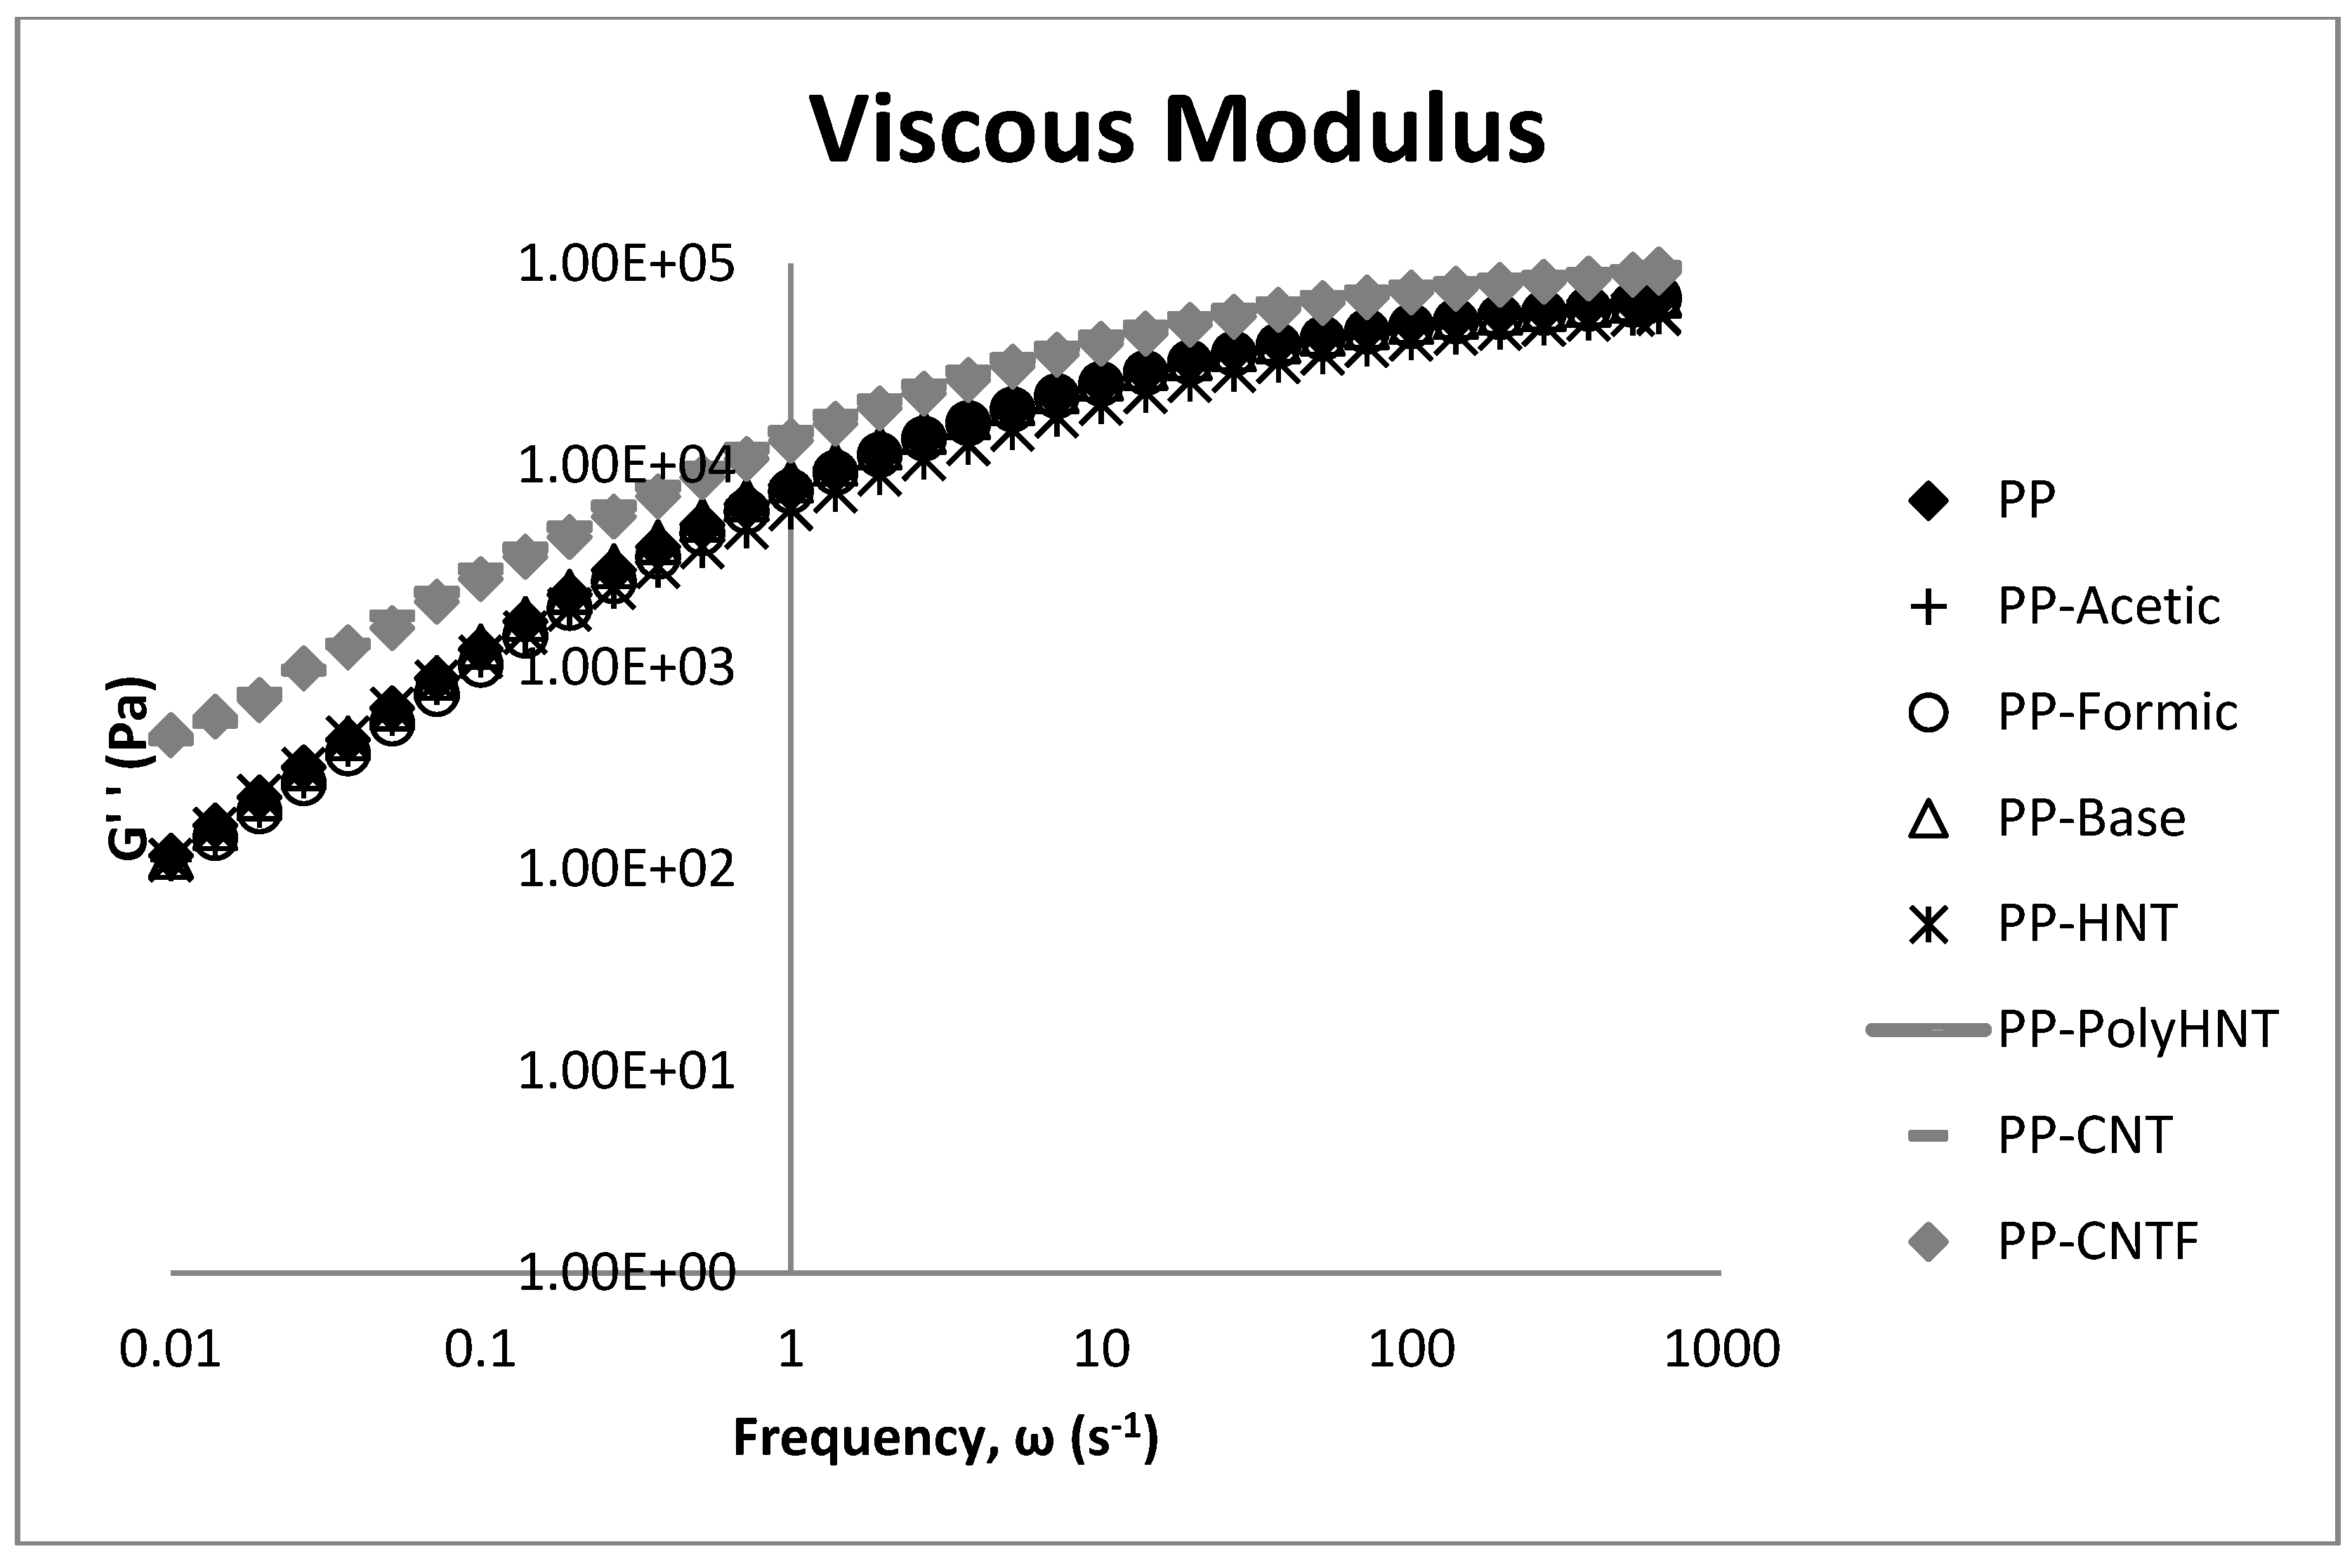
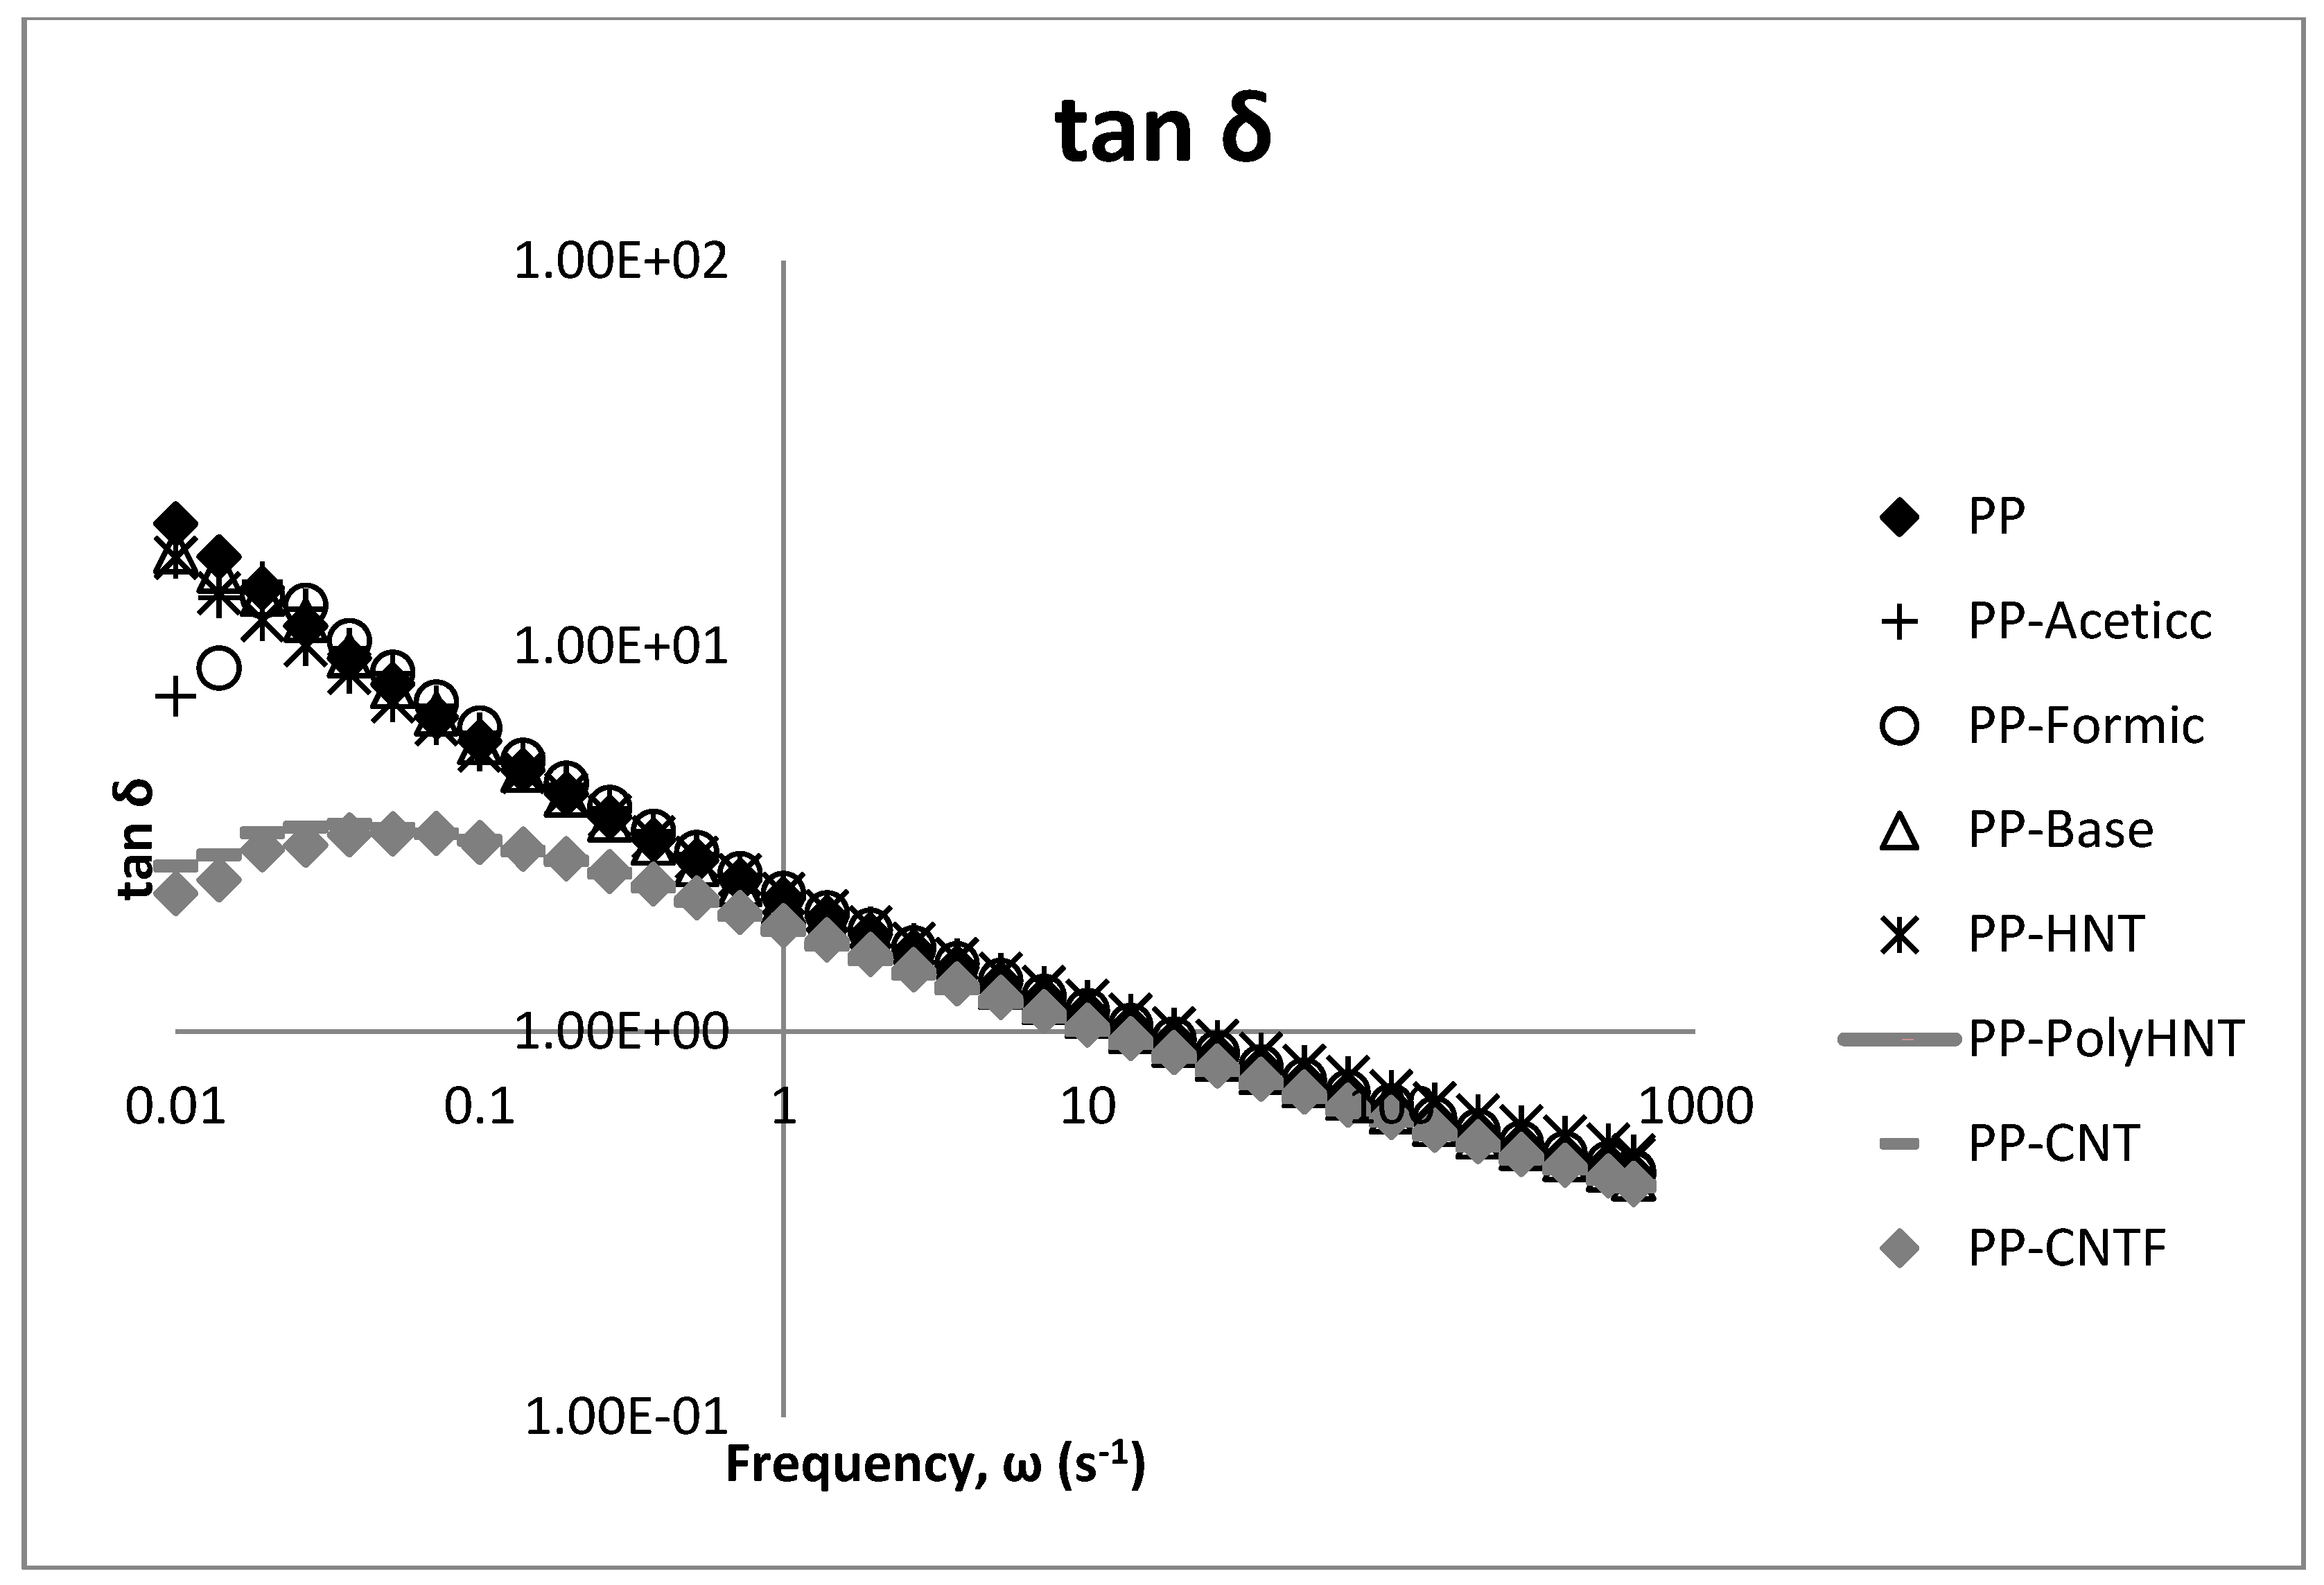
3.3. Rheological Testing
3.4. Morphology
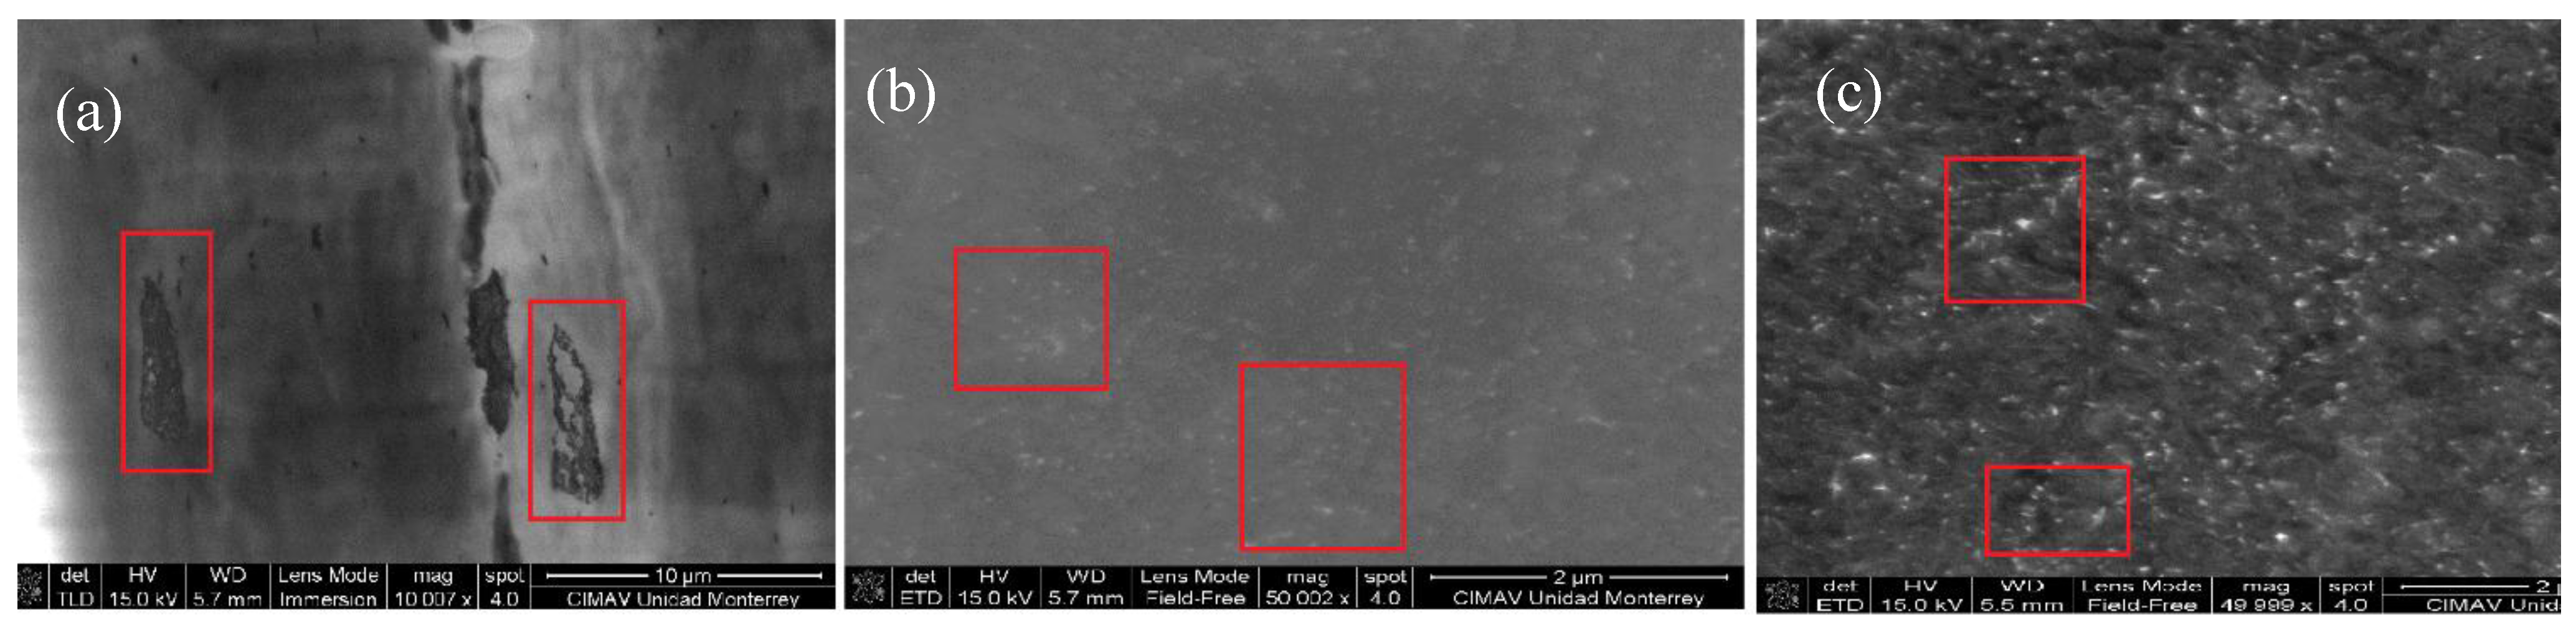
3.4.1. SEM
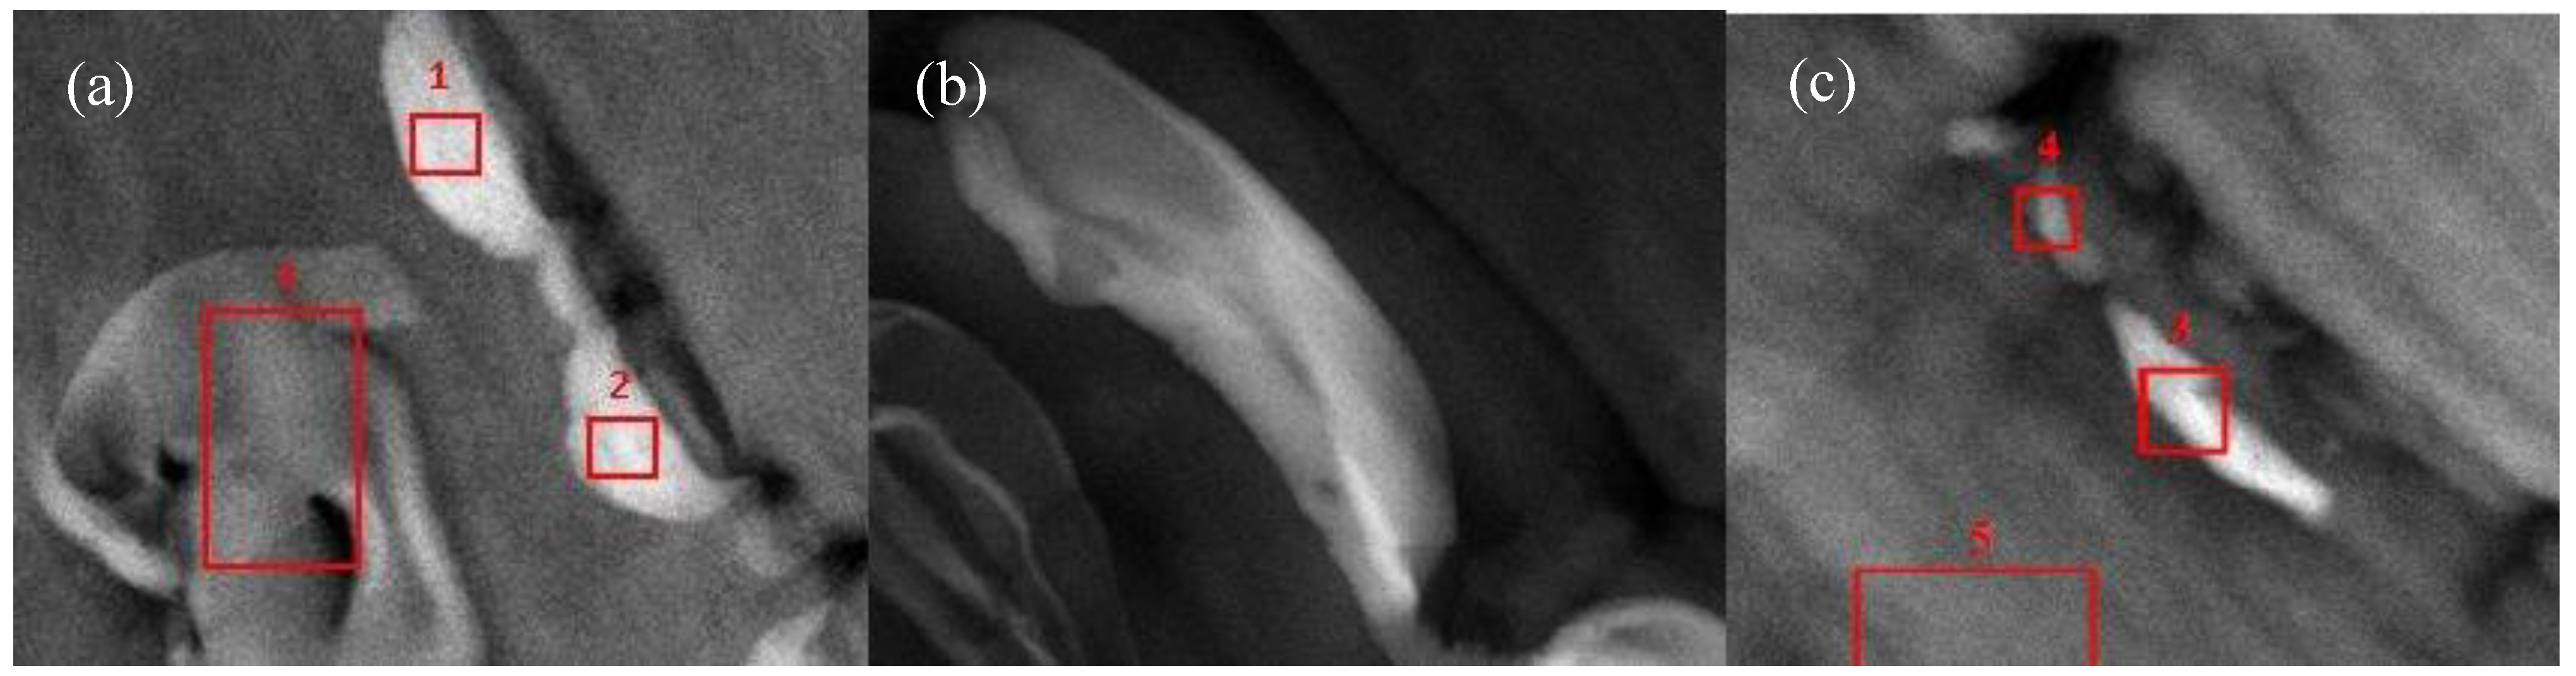
3.4.2. STEM/TEM

3.5. Gas Barrier Properties
| Sample | Cell A | Cell B | Average |
|---|---|---|---|
| PP | 404.61 | 420.50 | 412.56 |
| PP-Formic | 662.59 | 823.96 | 743.28 |
| PP-HNT | 125.79 | 151.90 | 138.85 |
| PP-PolyHNT | 90.26 | 84.94 | 87.60 |
| PP-CNT | 452.16 | 583.76 | 517.96 |
| PP-CNTF | 6312.96 | 13703.50 | 10008.23 |
3.6. Tensile Testing
| Sample | Max stress (MPa) | Max strain (%) | Young modulus (Mpa) |
|---|---|---|---|
| PP | 17.8 ± 1.4 | 8.6 ± 0.8 | 4.1 ± 0.4 |
| PP-HNT | 18.3 ± 0.4 | 6.8 ± 0.2 | 5.0 ± 0.1 |
| PP-PolyHNT | 14.3 ± 1.1 | 14.2 ± 0.55 | 2.5 ± 0.09 |
| PP-Acetic | 21.3 ± 0.9 | 15 ± 0.4 | 4.7 ± 0.2 |
| PP-Formic | 17.2 ± 1.0 | 7.8 ± 0.6 | 5.6 ± 0.3 |
| PP-Base | 17.8 ± 3.8 | 8.2 ± 2.0 | 4.0 ± 0.5 |
| PP-CNT | 19.0 ± 0.4 | 7.8 ± 0.3 | 4.5 ± 0.3 |
| PP-CNTF | 20.8 ± 1.1 | 8.5 ± 0.1 | 5.0 ± 0.1 |
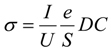
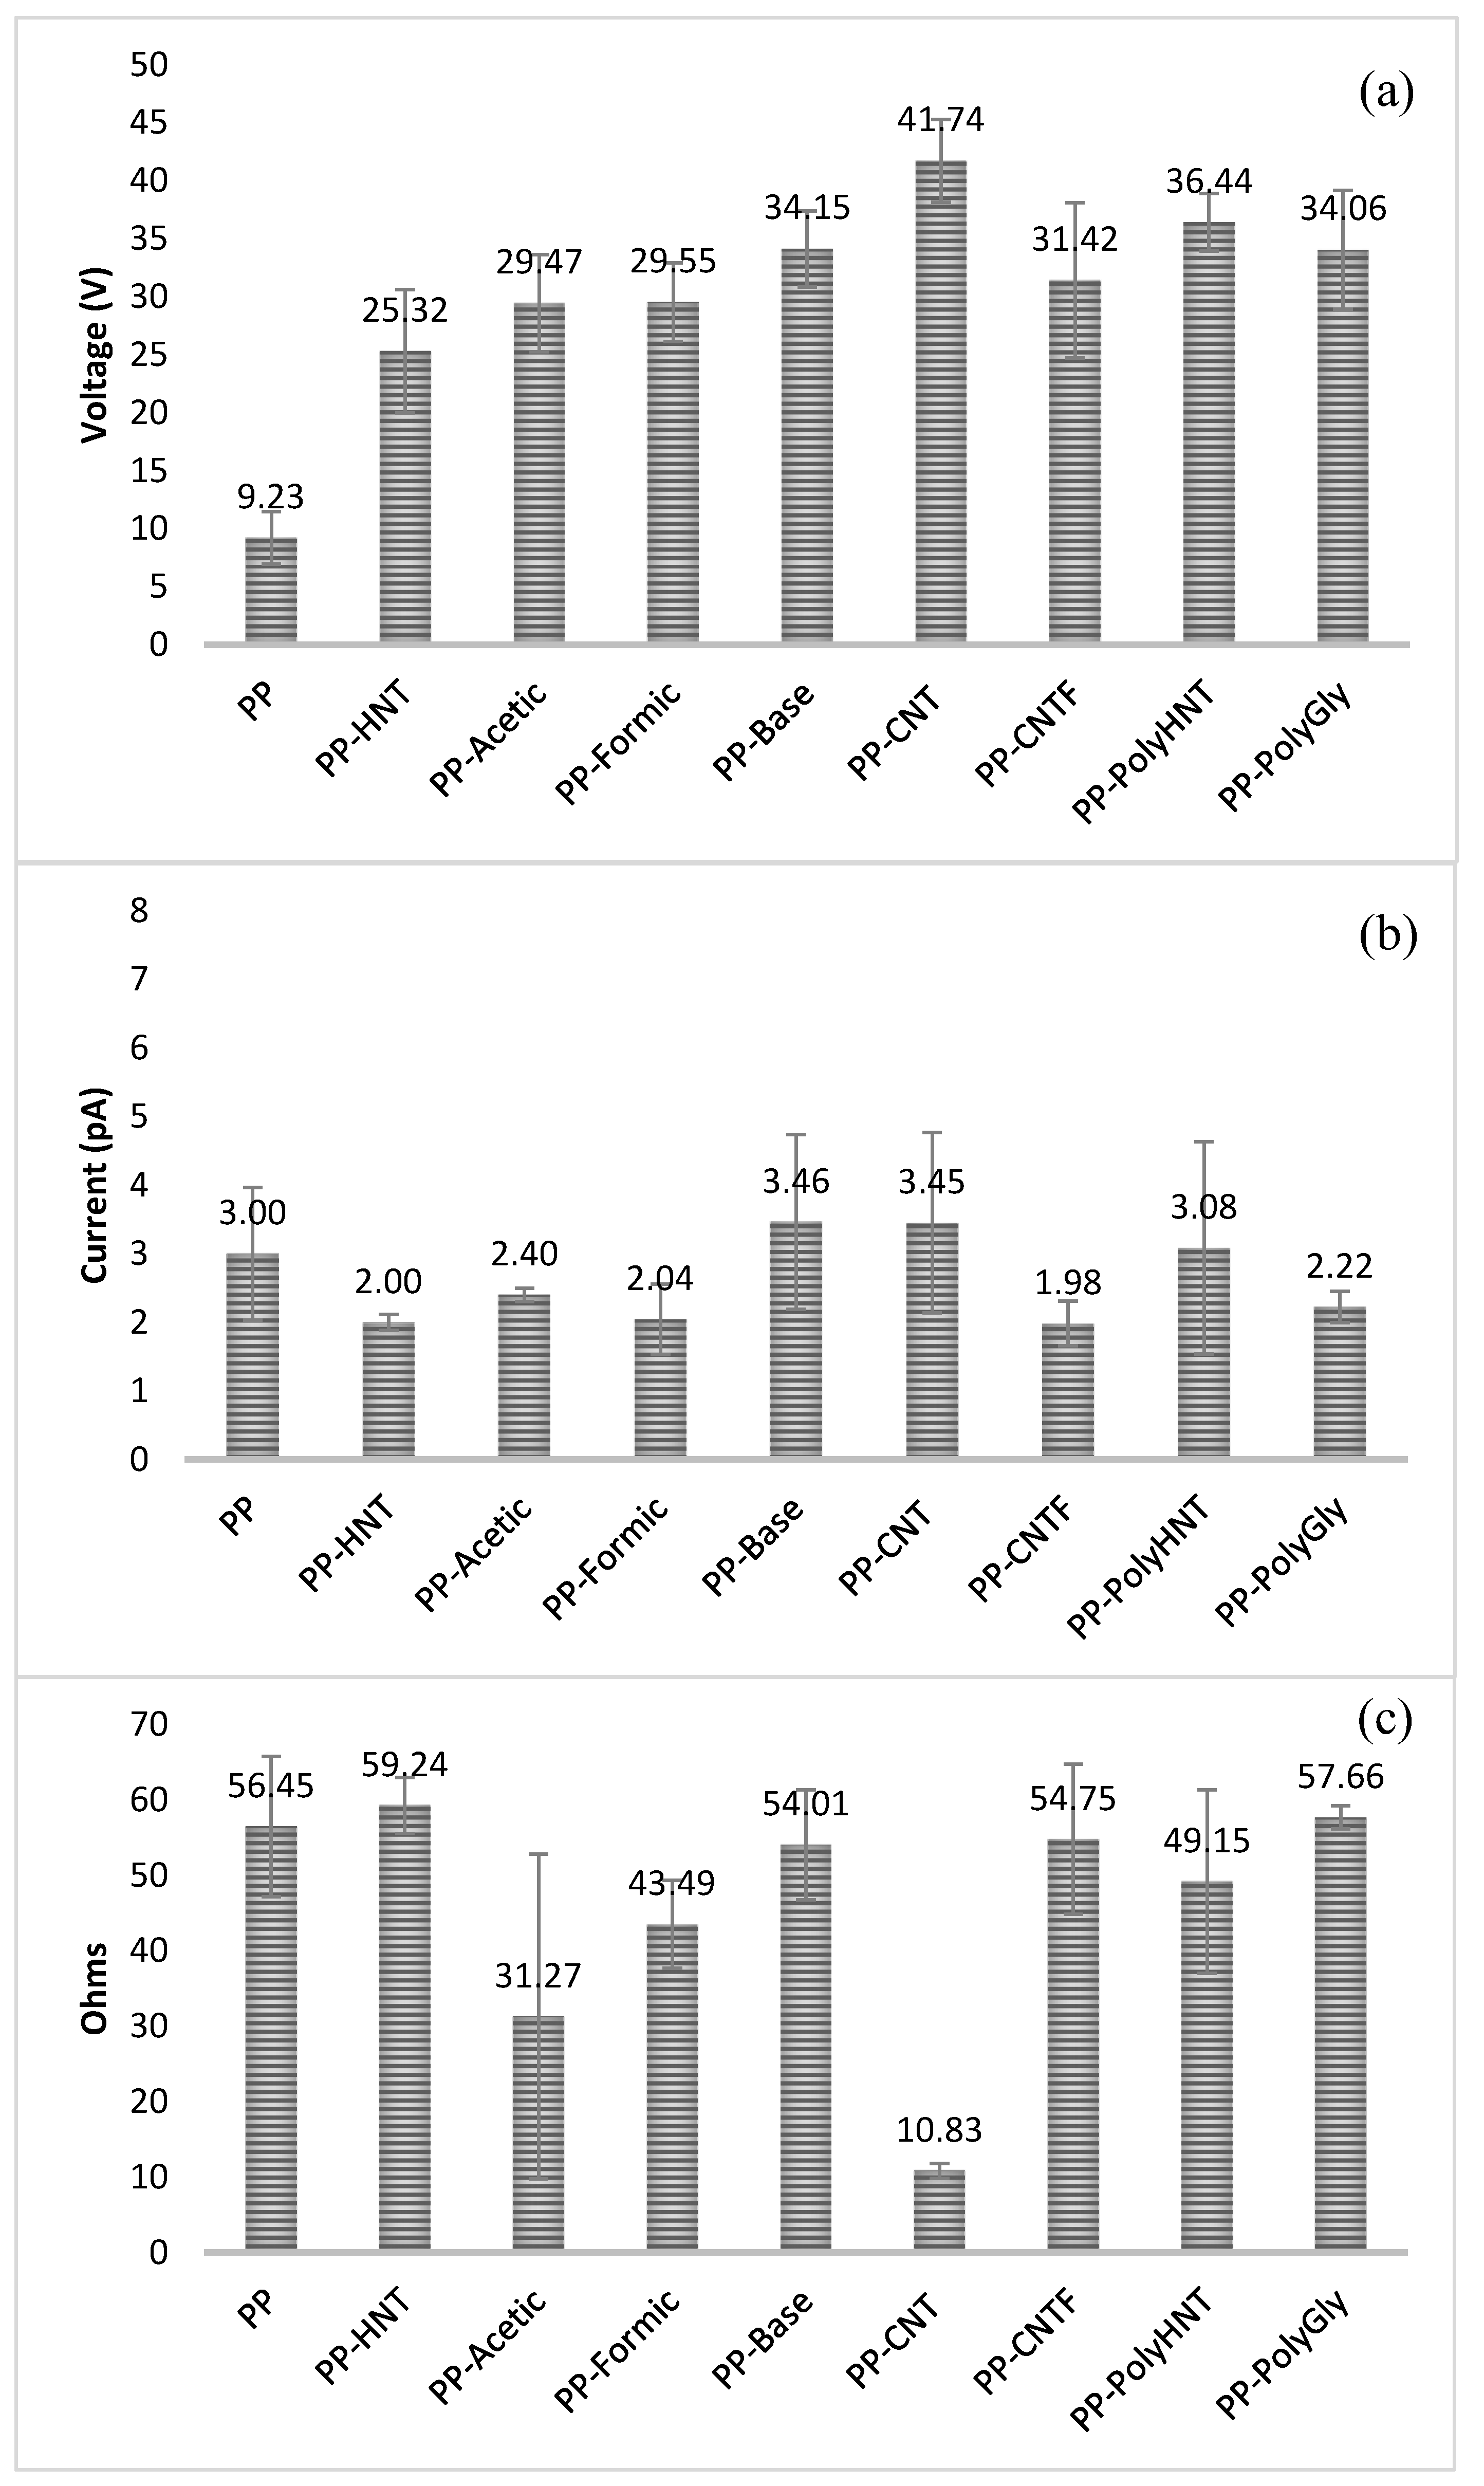
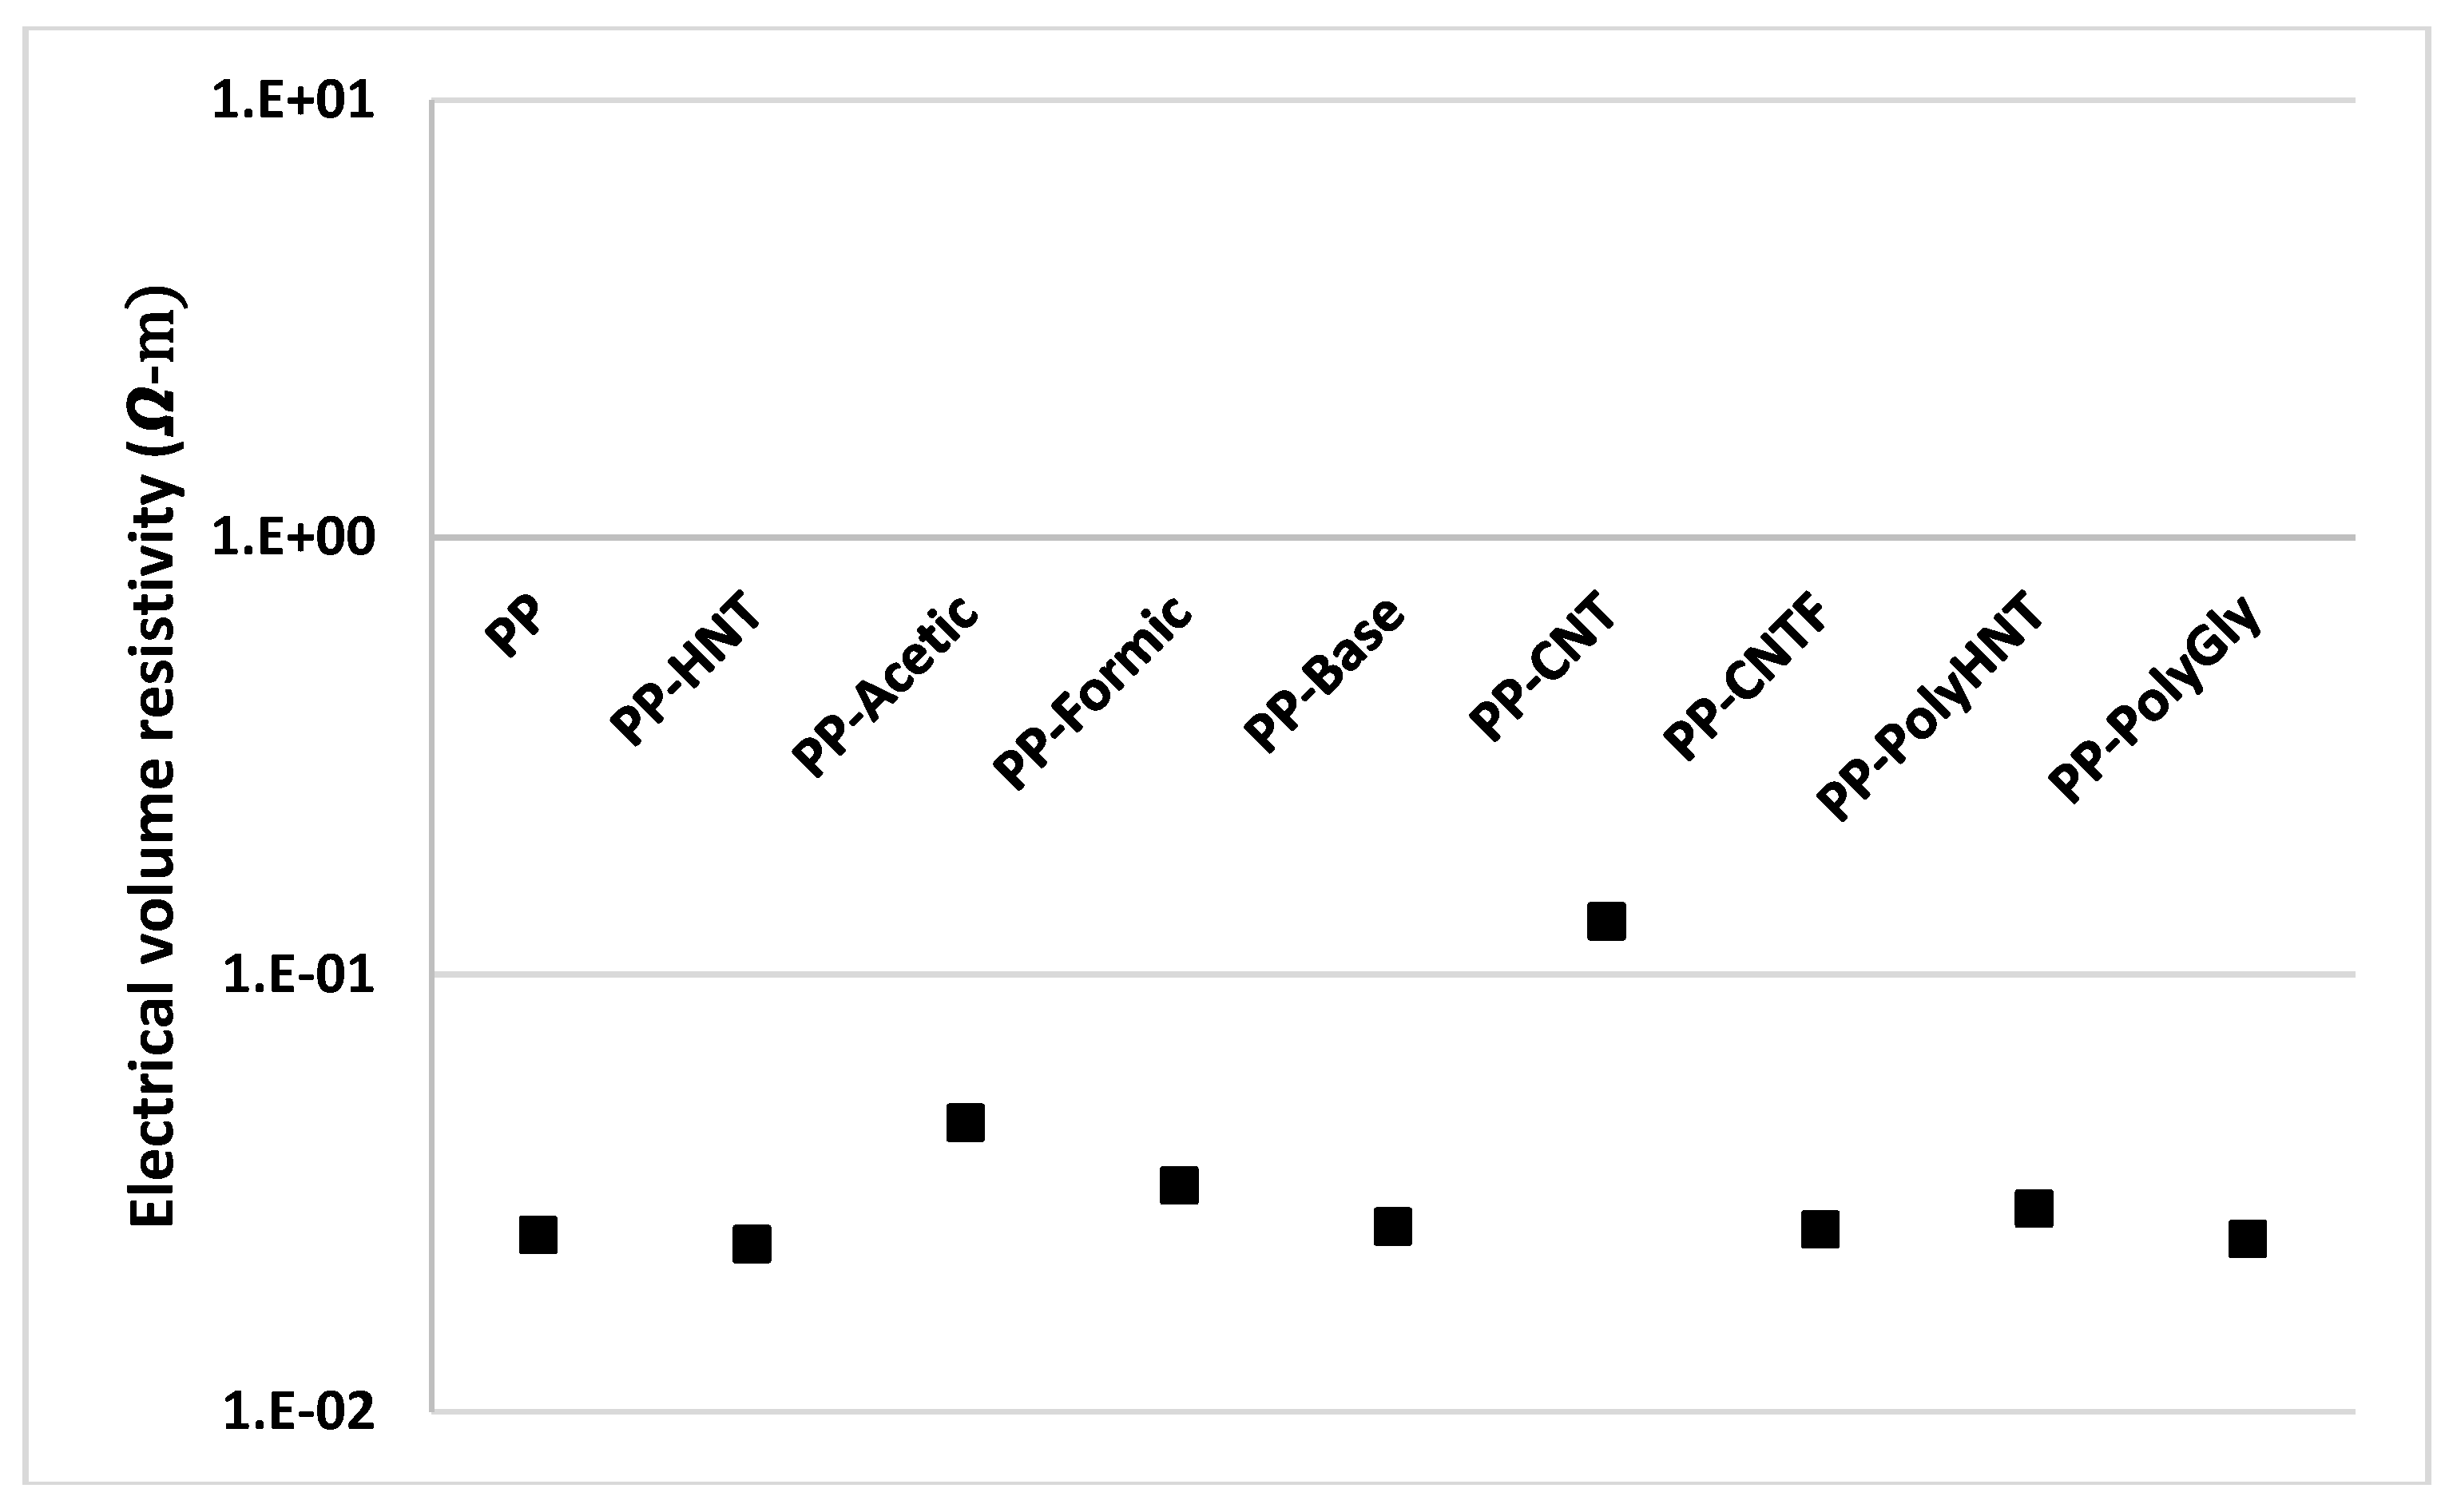
3.7. Electrical Measurements
4. Conclusions
Acknowledgments
Author Contributions
Conflicts of Interest
References
- Turcsanyi, B.; Pukanszky, B.; Tüdõs, F. Composition dependence of tensile yield stress in filled polymers. J. Mater. Sci. Lett. 1988, 7, 160–162. [Google Scholar]
- Liu, J.; Gao, Y.; Cao, D.; Zhang, L.; Guo, Z. Nanoparticle dispersion and aggregation in polymer nanocomposites: insights from molecular dynamics simulation. Langmuir 2011, 27, 7926–33. [Google Scholar] [CrossRef] [PubMed]
- Monsiváis-Barrón, A.J.; Bonilla-Rios, J.; Ramos de Valle, L.F.; Palacios, E. Oxygen permeation properties of HDPE-layered silicate nanocomposites. Polym. Bull. 2013, 70, 939–951. [Google Scholar] [CrossRef]
- Lozano, T.; Lafleur, P.G.; Grmela, M. A chemical model for the dispersion of fillers in a polymeric matrix. Can. J. Chem. Eng. 2002, 80, 1135–1142. [Google Scholar] [CrossRef]
- Kasaliwal, G.R.; Göldel, A.; Pötschke, P.; Heinrich, G. Influences of polymer matrix melt viscosity and molecular weight on MWCNT agglomerate dispersion. Polymer 2011, 52, 1027–1036. [Google Scholar] [CrossRef]
- Savadori, A.; Scapin, M.; Walter, R. Particle filled polyolefins with high stiffness and toughness, as used for load bearing components. Macromol. Symp. 1996, 108, 183–202. [Google Scholar] [CrossRef]
- Li, J.X.; Silverstein, M.; Hiltner, A.; Baer, E. The ductile-to-quasi-brittle transition of particulate-filled thermoplastic polyester. J. Appl. Polym. Sci. 1994, 52, 255–267. [Google Scholar] [CrossRef]
- Ess, J.W.; Hornsby, P.R. Twin-screw extrusion compounding of mineral filled thermoplastics: Dispersive mixing effects. Plast. Rubber Process. Appl. 1987, 8, 147–156. [Google Scholar]
- Wang, Y.; Huang, J.S. Single screw extrusion compounding of particulate filled thermoplastics: State of dispersion and its influence on impact properties. J. Appl. Polym. Sci. 1996, 60, 1779–1791. [Google Scholar] [CrossRef]
- Rong, M.Z.; Zhang, M.Q.; Zheng, Y.X.; Zeng, H.M.; Walter, R.; Friedrich, K. Structure–property relationships of irradiation grafted nano-inorganic particle filled polypropylene composites. Polymer 2001, 42, 167–183. [Google Scholar] [CrossRef]
- Sánchez, A.; Cué Sampedro, R.; Peña-Parás, L.; Palacios-Aguilar, E. Functionalization of carbon nanotubes and polymer compatibility studies. J. Mater. Sci. Res. 2013, 3, p1:1–p1:12. [Google Scholar]
- Bonilla-Rios, J. Effects of Peroxide on Molecular Weight and Rheological Properties of Polypropylene Resins; Texas A&M University: College Station, TX, USA, 1996. [Google Scholar]
- American Society for Testing and Materials. Standard Test Method for Melting and Crystallization Temperatures by Thermal Analysis. In ASTM E794-06(2012); American Society for Testing and Materials: West Conshohocken, PA, USA, 2012. [Google Scholar]
- Sinha Ray, S.; Yamada, K.; Okamoto, M.; Ueda, K. New polylactide-layered silicate nanocomposites. 2. Concurrent improvements of material properties, biodegradability and melt rheology. Polymer 2003, 44, 857–866. [Google Scholar] [CrossRef]
- American Society for Testing and Materials. Standard Test Method for Tensile Properties of Thin Plastic Sheeting. In ASTM D882-12; American Society for Testing and Materials: West Conshohocken, PA, USA, 2012. [Google Scholar]
- Allaoui, A. Mechanical and electrical properties of a MWNT/epoxy composite. Compos. Sci. Technol. 2002, 62, 1993–1998. [Google Scholar] [CrossRef]
- Gilman, J. Flammability and thermal stability studies of polymer layered-silicate (clay) nanocomposites. Appl. Clay Sci. 1999, 15, 31–49. [Google Scholar] [CrossRef]
- Gilman, J.W.; Jackson, C.L.; Morgan, A.B.; Harris, R. Flammability properties of polymer-layered-silicate nanocomposites. Polypropylene and polystyrene nanocomposites. Chem. Mater. 2000, 12, 1866–1873. [Google Scholar] [CrossRef]
- Kashiwagi, T.; Grulke, E.; Hilding, J.; Harris, R.; Awad, W.; Douglas, J. Thermal degradation and flammability properties of poly(propylene)/carbon nanotube composites. Macromolecules 2002, 23, 761–765. [Google Scholar]
- Zhu, J.; Uhl, F.M.; Morgan, A.B.; Wilkie, C.A. Studies on the Mechanism by which the formation of nanocomposites enhances thermal stability. Chem. Mater. 2001, 13, 4649–4654. [Google Scholar] [CrossRef]
- Galia, A.; De Gregorio, R.; Spadaro, G.; Scialdone, O.; Filardo, G. Grafting of maleic anhydride onto isotactic polypropylene in the presence of supercritical carbon dioxide as a solvent and swelling fluid. Macromolecules 2004, 37, 4580–4589. [Google Scholar] [CrossRef]
- Pötschke, P.; Pegel, S.; Claes, M.; Bonduel, D. A novel strategy to incorporate carbon nanotubes into thermoplastic matrices. Macromol. Rapid Commun. 2008, 29, 244–251. [Google Scholar] [CrossRef]
- Manchado, M.A.L.; Valentini, L.; Biagiotti, J.; Kenny, J.M. Thermal and mechanical properties of single-walled carbon nanotubes–polypropylene composites prepared by melt processing. Carbon 2005, 43, 1499–1505. [Google Scholar] [CrossRef]
- Vladimirov, V.; Betchev, C.; Vassiliou, A.; Papageorgiou, G.; Bikiaris, D. Dynamic mechanical and morphological studies of isotactic polypropylene/fumed silica nanocomposites with enhanced gas barrier properties. Compos. Sci. Technol. 2006, 66, 2935–2944. [Google Scholar] [CrossRef]
- Vassiliou, A.; Bikiaris, D.; Pavlidou, E. Optimizing melt-processing conditions for the preparation of ipp/fumed silica nanocomposites: Morphology, mechanical and gas permeability properties. Macromol. React. Eng. 2007, 1, 488–501. [Google Scholar] [CrossRef]
- Bikiaris, D. Microstructure and properties of polypropylene/carbon nanotube nanocomposites. Materials 2010, 3, 2884–2946. [Google Scholar] [CrossRef]
- Lozano, K.; Barrera, E.V. Nanofiber-reinforced thermoplastic composites. I. Thermoanalytical and mechanical analyses. J. Appl. Polym. Sci. 2001, 79, 125–133. [Google Scholar] [CrossRef]
- Sanchez-Fernández, A.; Peña-Parás, L.; Cue-Sampedro, R.; Tamayo, R.; Riojas, P.; Mendoza, A. Synthesization, characterization, and in vitro evaluation of cytotoxicity of biomaterials based on halloysite nanotubes. In Proceedings of the 1st International Electronic Conference Materials, 26 May–10 June 2014; MDPI: Basel, Switzerland, 2014. [Google Scholar]
- Sánchez-Fernández, A.; Leyva-Valdés, A.; Falcón-García, C.; Mena-Arjona, J. In-vivo tests for evaluation of the regenerative properties of a chitosan-based gel. Materials 2014, in press. [Google Scholar]
© 2014 by the authors; licensee MDPI, Basel, Switzerland. This article is an open access article distributed under the terms and conditions of the Creative Commons Attribution license (http://creativecommons.org/licenses/by/4.0/).
Share and Cite
Monsiváis-Barrón, A.J.; Bonilla-Rios, J.; Sánchez-Fernández, A. Property Relationship in Organosilanes and Nanotubes Filled Polypropylene Hybrid Composites. Materials 2014, 7, 7073-7092. https://doi.org/10.3390/ma7107073
Monsiváis-Barrón AJ, Bonilla-Rios J, Sánchez-Fernández A. Property Relationship in Organosilanes and Nanotubes Filled Polypropylene Hybrid Composites. Materials. 2014; 7(10):7073-7092. https://doi.org/10.3390/ma7107073
Chicago/Turabian StyleMonsiváis-Barrón, Alejandra J., Jaime Bonilla-Rios, and Antonio Sánchez-Fernández. 2014. "Property Relationship in Organosilanes and Nanotubes Filled Polypropylene Hybrid Composites" Materials 7, no. 10: 7073-7092. https://doi.org/10.3390/ma7107073