1. Introduction
Solid-state or synthetic nanopores have emerged as next generation bio-sensors for the electrical detection, analysis, and manipulation of single biomolecules such as DNA, RNA, and proteins. These pores are mainly used in the nanopore sequencing method, which has great potential to become a high throughput cost-effective technique for DNA/RNA sequencing. In this technique, the sequence of bases along a DNA strand can be detected by translocating the DNA molecule through a nanopore using an external electric field [
1]. By allowing direct reading of the DNA sequence, this technique is many times faster than presently used methods as there is no need for PCR amplification or fluorescent labeling [
2]. Use of this technique can reduce the costs incurred by genome analysis significantly. Understanding the dynamics of the translocation process is necessary for developing new and improved methods for DNA sequencing. Thus, many researchers are paying considerable attention to explore the mechanism of polymer translocation.
Kasianowicz
et al. [
1] conducted the translocation experiments for the first time. They used the
α-hemolysin (
α-HL) nanopore of diameter 2.6 nm to translocate a single stranded DNA using an externally applied electric field. The translocation velocity,
vt, was found to be around
vt = 0.55 mm/s. Several drawbacks (limited lifespan, lack of robustness, difficulty of adjusting pore size and shape) of using biological (
α-HL) nanopores have driven later many researchers to use synthetic ones. Synthetic nanopores with variable sizes and shapes can be made from silicon oxide (SiO2) or silicon nitrate (Si3N4) membranes using nanofabrication technology, and are very robust compared to their biological counterparts. Li
et al. [
3] used a synthetic nanopore with a diameter of 10 nm made from Si3N4 membrane in their translocation experiments. They studied the translocation process of a double-stranded DNA (dsDNA) and found that
vt is in the order of 10mm/s for dsDNA with lengths of 3 and 10 kilo base pairs (kbp). This value of
vt is about 20 times higher than the one obtained in [
1]. The reason for this was explained by Storm
et al. [
4], who conducted translocation experiments using the SiO
2 nanopore with a diameter of 10 nm by varying the length of dsDNA from 6.6 to 97 kbp. They mentioned that the effective friction between the polymer and pore molecules is very high in the
α-HL pore compared to that in the SiO
2/Si
3N
4 nanopore because the diameter of
α-HL is in the same order of magnitude as that of the dsDNA (2 nm). Due to this effective friction,
vt in the
α-HL pore is very low compared to that in the synthetic nanopore. Storm
et al. also found that there is a non-linear (power-law) relationship between translocation time and contour length of the polymer,
τt ~
with the exponent
α = 1.26, which means that the translocation velocity depends on the polymer length like
vt ~
Lc−0.26.
Many researchers conducted theoretical and numerical studies on the polymer translocation process to match the
α value obtained in [
4]. Muthukumar [
5] used a theoretical study to find the
α value of the translocation process of a biopolymer, which was driven by a chemical potential gradient. He obtained
α = 2 and
α = 1 in the weak and strong driving force regimes, respectively. Vocks
et al. [
6] conducted 3D numerical simulations without considering the hydrodynamic interactions (HI) and obtained
α = 1.37. Here, “without HI” means that the fluid is quiescent, but a frictional force exists between the polymer and the fluid. Forrey
et al. [
7] used 3D Langevin dynamics (LD) technique to simulate the translocation process of dsDNA through synthetic nanopores and obtained
α = 1. Edmonds
et al. [
8] investigated the effect of the chain length, pore geometry (diameter and length), and the applied bias voltage ∆
φ on the scaling exponent of the translocation process by 3D LD technique. They considered an atomistically detailed structure for the nanopore and used the realistic parameters in their study. They conclude that when the pore length is much smaller than the polymer length,
α value depends on both the polymer length and applied bias voltage. However, for the case of long pores they found that the scaling law is
τt ~ ∆
φ−1 for all the voltage values and polymer lengths. Most of the studies discussed so far did not consider the effect of HI,
i.e., the fluid flow effect. There are many mesoscopic methods such as the lattice Boltzmann equation (LBE) [
9,
10], Brownian dynamics [
11], dissipative particle dynamics [
12], and multi-particle collision dynamics [
13] are available to solve the fluid flow in the translocation process. Fyta
et al. [
14,
15] have simulated the polymer translocation process by solving the fluid flow using LBE, and they could match their value of
α = 1.29 with the experimentally observed one
α = 1.26 [
4]. Fyta
et al. [
16,
17,
18] have also conducted several numerical studies to know the effect of various parameters such as pore size [
16,
17], and external electric field (driving force) [
18] on the translocation process. They observed that biopolymers undertake multi-folded configurations when they are passing through wide nanopores [
16,
17]. Alapati
et al. [
19,
20] conducted numerical studies on the translocation process by considering the HI explicitly using LBE. They could match the value
α = 1.24 as well as the results of the translocation time and velocity with the corresponding experimental values [
4]. They also found that the reason for the variation of translocation velocity relative to the polymer length is due to the variation of the fluid drag force acting on the polymer on the
cis side [
20].
Identifying the sequence of the bases of DNA travelling at 10 mm/s (translocation velocity observed in [
3,
4]) requires an electronic sensing system with an extremely high bandwidth [
21]. High-bandwidth signals generally have very high electronic noise, which limits the electrical detection of the bases of a biopolymer using the nanopore sequencing technique. So, slowing down the velocity of molecules passing through the nanopore is an essential step in the detection and analysis of the single molecules. There are many factors affecting the translocation velocity inside the nanopore, including solvent viscosity, the salt concentration, the applied voltage across the nanopore [
21], and the pore size and shape [
22]. Fologea
et al. [
21] studied the effect of fluid temperature, KCl concentration, viscosity, and the electrical bias voltage on the translocation speed of a DNA molecule inside a Si
3N
4 pore. By increasing the fluid viscosity and decreasing the bias voltage and the temperature of the fluid, they could reduce the translocation speed by an order of magnitude compared to the previous studies. Most of the studies to date used short nanopores around 20 nm in length. Liu
et al. [
22] used a very long nanopore (100 nm long) with a conical shape fabricated with the Si
3N
4 membrane and found that the translocation speed can also be reduced by increasing the length of the pore without changing the other parameters. They found that the translocation speed in a nanopore with 100 nm long is five times slower than that in a 20 nm long nanopore.
In this study, we simulate the translocation process of a bio-polymer through nanopores driven by an applied bias voltage. We use LBE to include the effect of HI between the polymer and the fluid. This work is the extension of our earlier work [
19,
20]. The main aim of this study is to know the effect of nanopore length on the polymer’s translocation speed inside the pore and to find the reason for the decrease of the translocation velocity within the elongated nanopore. The remainder of this paper is arranged as follows:
Section 2 gives a brief explanation about the simulation scheme employed in the present study. The numerical results obtained from the simulation of the polymer translocation process through nanopores of different lengths are presented in
Section 3. The concluding remarks of the present study are given in
Section 4.
3. Simulation Results
In this section, we discuss the simulation results obtained for the translocation of dsDNA through a nanopore with the configuration shown in
Figure 1. The translocation process of the polymer is simulated with and without HI by considering different nanopore lengths
Lp = 20, 60, and 100 nm. The translocation time
τt of the polymer chain is defined as the interval between the time when the first bead of the polymer begins to enter the nanopore at
cis side and the time when the last bead of the polymer leaves the nanopore at
trans side.
Figure 4 shows the variation of
τt with polymer length
Lc for various nanopore lengths. Each data point in
Figure 4 is the ensemble average over 30–40 translocation events and each event is simulated with a different initial random configuration to reduce statistical uncertainty. For all pore length cases, we started the simulations with the same initial random configurations. It should be noted that the simulations with HI are computationally very time intensive. For example, simulating a single translocation event of a polymer with
N = 391 beads (11500 bp) through a 100 nm long nanopore requires the computational time of four days on a 2.4 GHz Intel® core 2 processor. So, we simulate 30–40 translocation events to create the ensemble average. Nevertheless, from the error-bars in
Figure 4, we can see that our results (particularly for the case with HI) are statistically reasonable. For the nanopore of
Lp = 20, we sometimes observed folded (hair-pin) type translocation events as reported in the experiments [
4] due to the high electric field intensity |
E| inside the pore compared to that in the longer pores,
Lp = 60 and 100 nm. In taking the ensemble average, we consider only the unfolded translocation events. We also find that the probability for the first bead to enter the pore decreases with the pore length as |
E| decreases with
Lp.
Figure 4.
Variation of the translocation time τt with polymer length, Lc, for different nanopore lengths; Lp = 100 nm (○), Lp = 60 nm (□), and for Lp = 20 nm (∆).
Figure 4.
Variation of the translocation time τt with polymer length, Lc, for different nanopore lengths; Lp = 100 nm (○), Lp = 60 nm (□), and for Lp = 20 nm (∆).
The dashed lines in
Figure 4 represent
τt values when HI effect is neglected. Without HI,
τt is always greater than the one obtained with HI. This is because the fluid drag force
Fdrag acting on the polymer in the case without HI is always larger than the one with HI. The reason for this can be further explained as follows: when HI are neglected, the total friction coefficient of the entire polymer Γ
tot is equal to the sum of the individual bead friction coefficient Γ. On the other hand, when the HI effect is considered, Γ
tot is less than the sum of the Γ’s of all the beads because of the fluid flow effect. From
Figure 4, we can see that
τt increases with the pore length
Lp for the same polymer length
Lc even though the polymer receives almost the same amount of electrophoretic driving force,
Felec, irrespective of the pore length. The total driving force acting on the polymer beads inside the nanopore can be approximated as
Felec =
npqiE, as the electric field is negligible outside the nanopore (see
Figure 3); here,
np is the number of beads inside the pore. For the same applied potential difference value,
Felec is independent of the pore length as
np is proportional to
Lp whereas
E is proportional to 1/
Lp. So, the translocation time should depend upon the applied potential difference across the nanopore rather than on the external electric field value. However, in
Figure 4, the translocation time increases with the pore length even though the applied voltage is kept the same. To discover the reason for the increase of the translocation time (or the decrease of the translocation velocity) with
Lp, one needs to understand the mechanism of the translocation process, which is explained in the following.
Since the electrophoretic driving force
Felec mainly acts on the portion of the polymer that resides inside the pore (as the electric field is negligible outside the pore), the entire polymer blob on the
cis side does not move towards the nanopore at the same time. Instead, only the part of the polymer coil (fold) that is closest to the nanopore feels the effect of
Felec and has a tendency to move towards the pore. So,
Felec tends to stretch the portion of the polymer coil closest to the pore. The straightening of all the folds of the initial random configuration on the
cis side continues successively until the entire translocation process finishes [
27]. Note that at any instant of time, only the beads in the straightened portion of the polymer located close to the pore are in forced motion whereas the remaining beads are almost immobile (as they receive only Brownian motion).
Figure 5 illustrates the straightened configuration of the polymer of length
N = 320 while it is translocating from the
cis side to the
trans side for pore lengths
Lp = 20 nm and
Lp = 100 nm. The configurations are snapped when the 120th bead of the polymer is at the end of the corresponding nanopore. In
Figure 5, we can see that the length of the straightened (stretched) portion
lstretch of the polymer closer to nanopore on the
cis side is greater for
Lp = 100 nm than for
Lp = 20 nm. The translocation velocity of each bead,
vt,i, inside the nanopore mainly depends on
lstretch. The stretched portion of the polymer outside the pore and that inside the pore should show slower motion if
lstretch is larger because the fluid drag force is increased when
lstretch is increased.
Figure 5.
An instantaneous configuration of the polymer of length N = 320 while it is translocating from the cis side to the trans side for pore lengths: (a) Lp = 20 nm and (b) Lp = 100 nm.
Figure 5.
An instantaneous configuration of the polymer of length N = 320 while it is translocating from the cis side to the trans side for pore lengths: (a) Lp = 20 nm and (b) Lp = 100 nm.
We confirmed this by using a theoretical formula,
where
ti is the residence time of bead
i, which is defined as the time spent by each bead inside the nanopore. The equation for
ti is [
20]
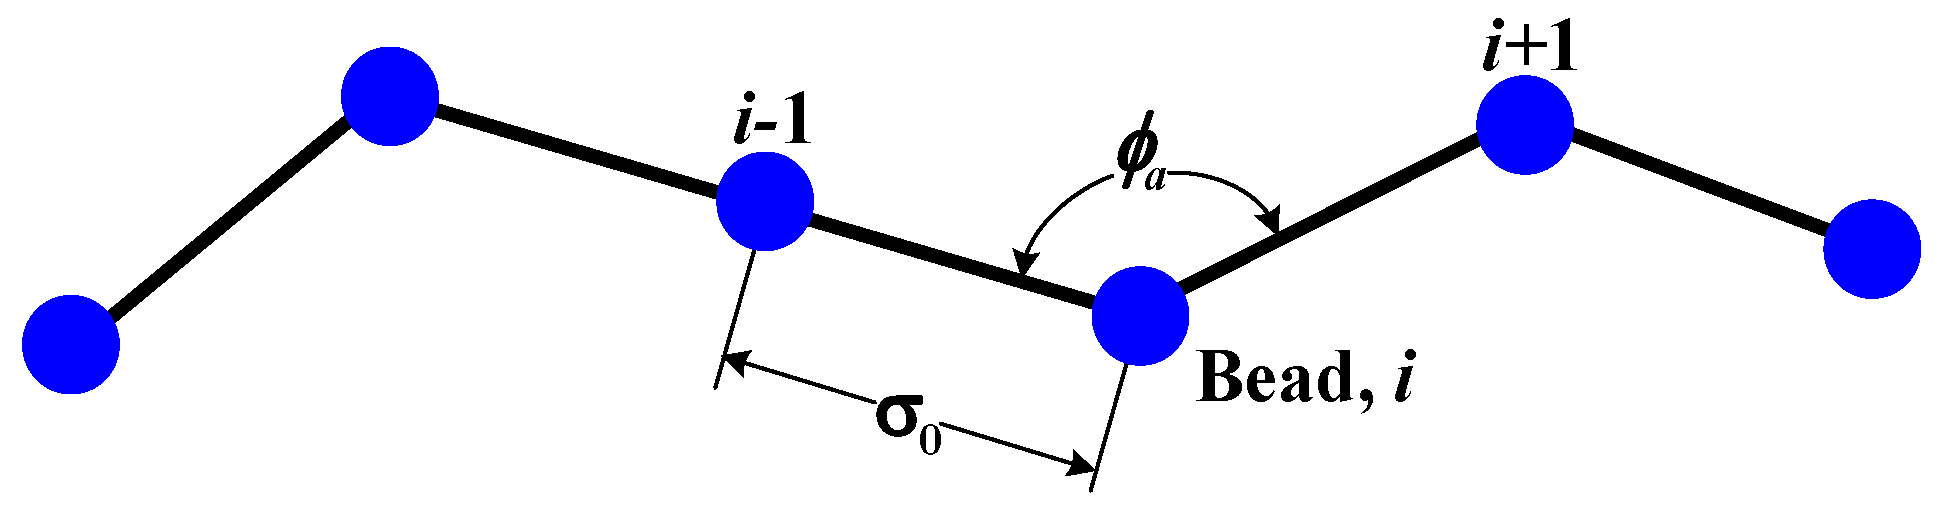
where
θj is the bent angle of a bead
j, and
K and
β are constants. The above equation was derived by considering the geometrical shape of the polymer on the
cis side. For a detailed derivation one can refer to [
20]. The value of
ti in Equation (6) depends on
lstretch; if
lstretch is increased
ti is also increased and vice versa. The value of
β in Equation (6) is obtained from trial-and-error method and we find that for
β = 3.5, the trend of
vt,i distribution calculated from Equation (6) is similar to that obtained from the numerical solution of LD equations. The value of
K is calculated from the curve fitting (least-squares fit) of data given from Equation (6) and the simulated data.
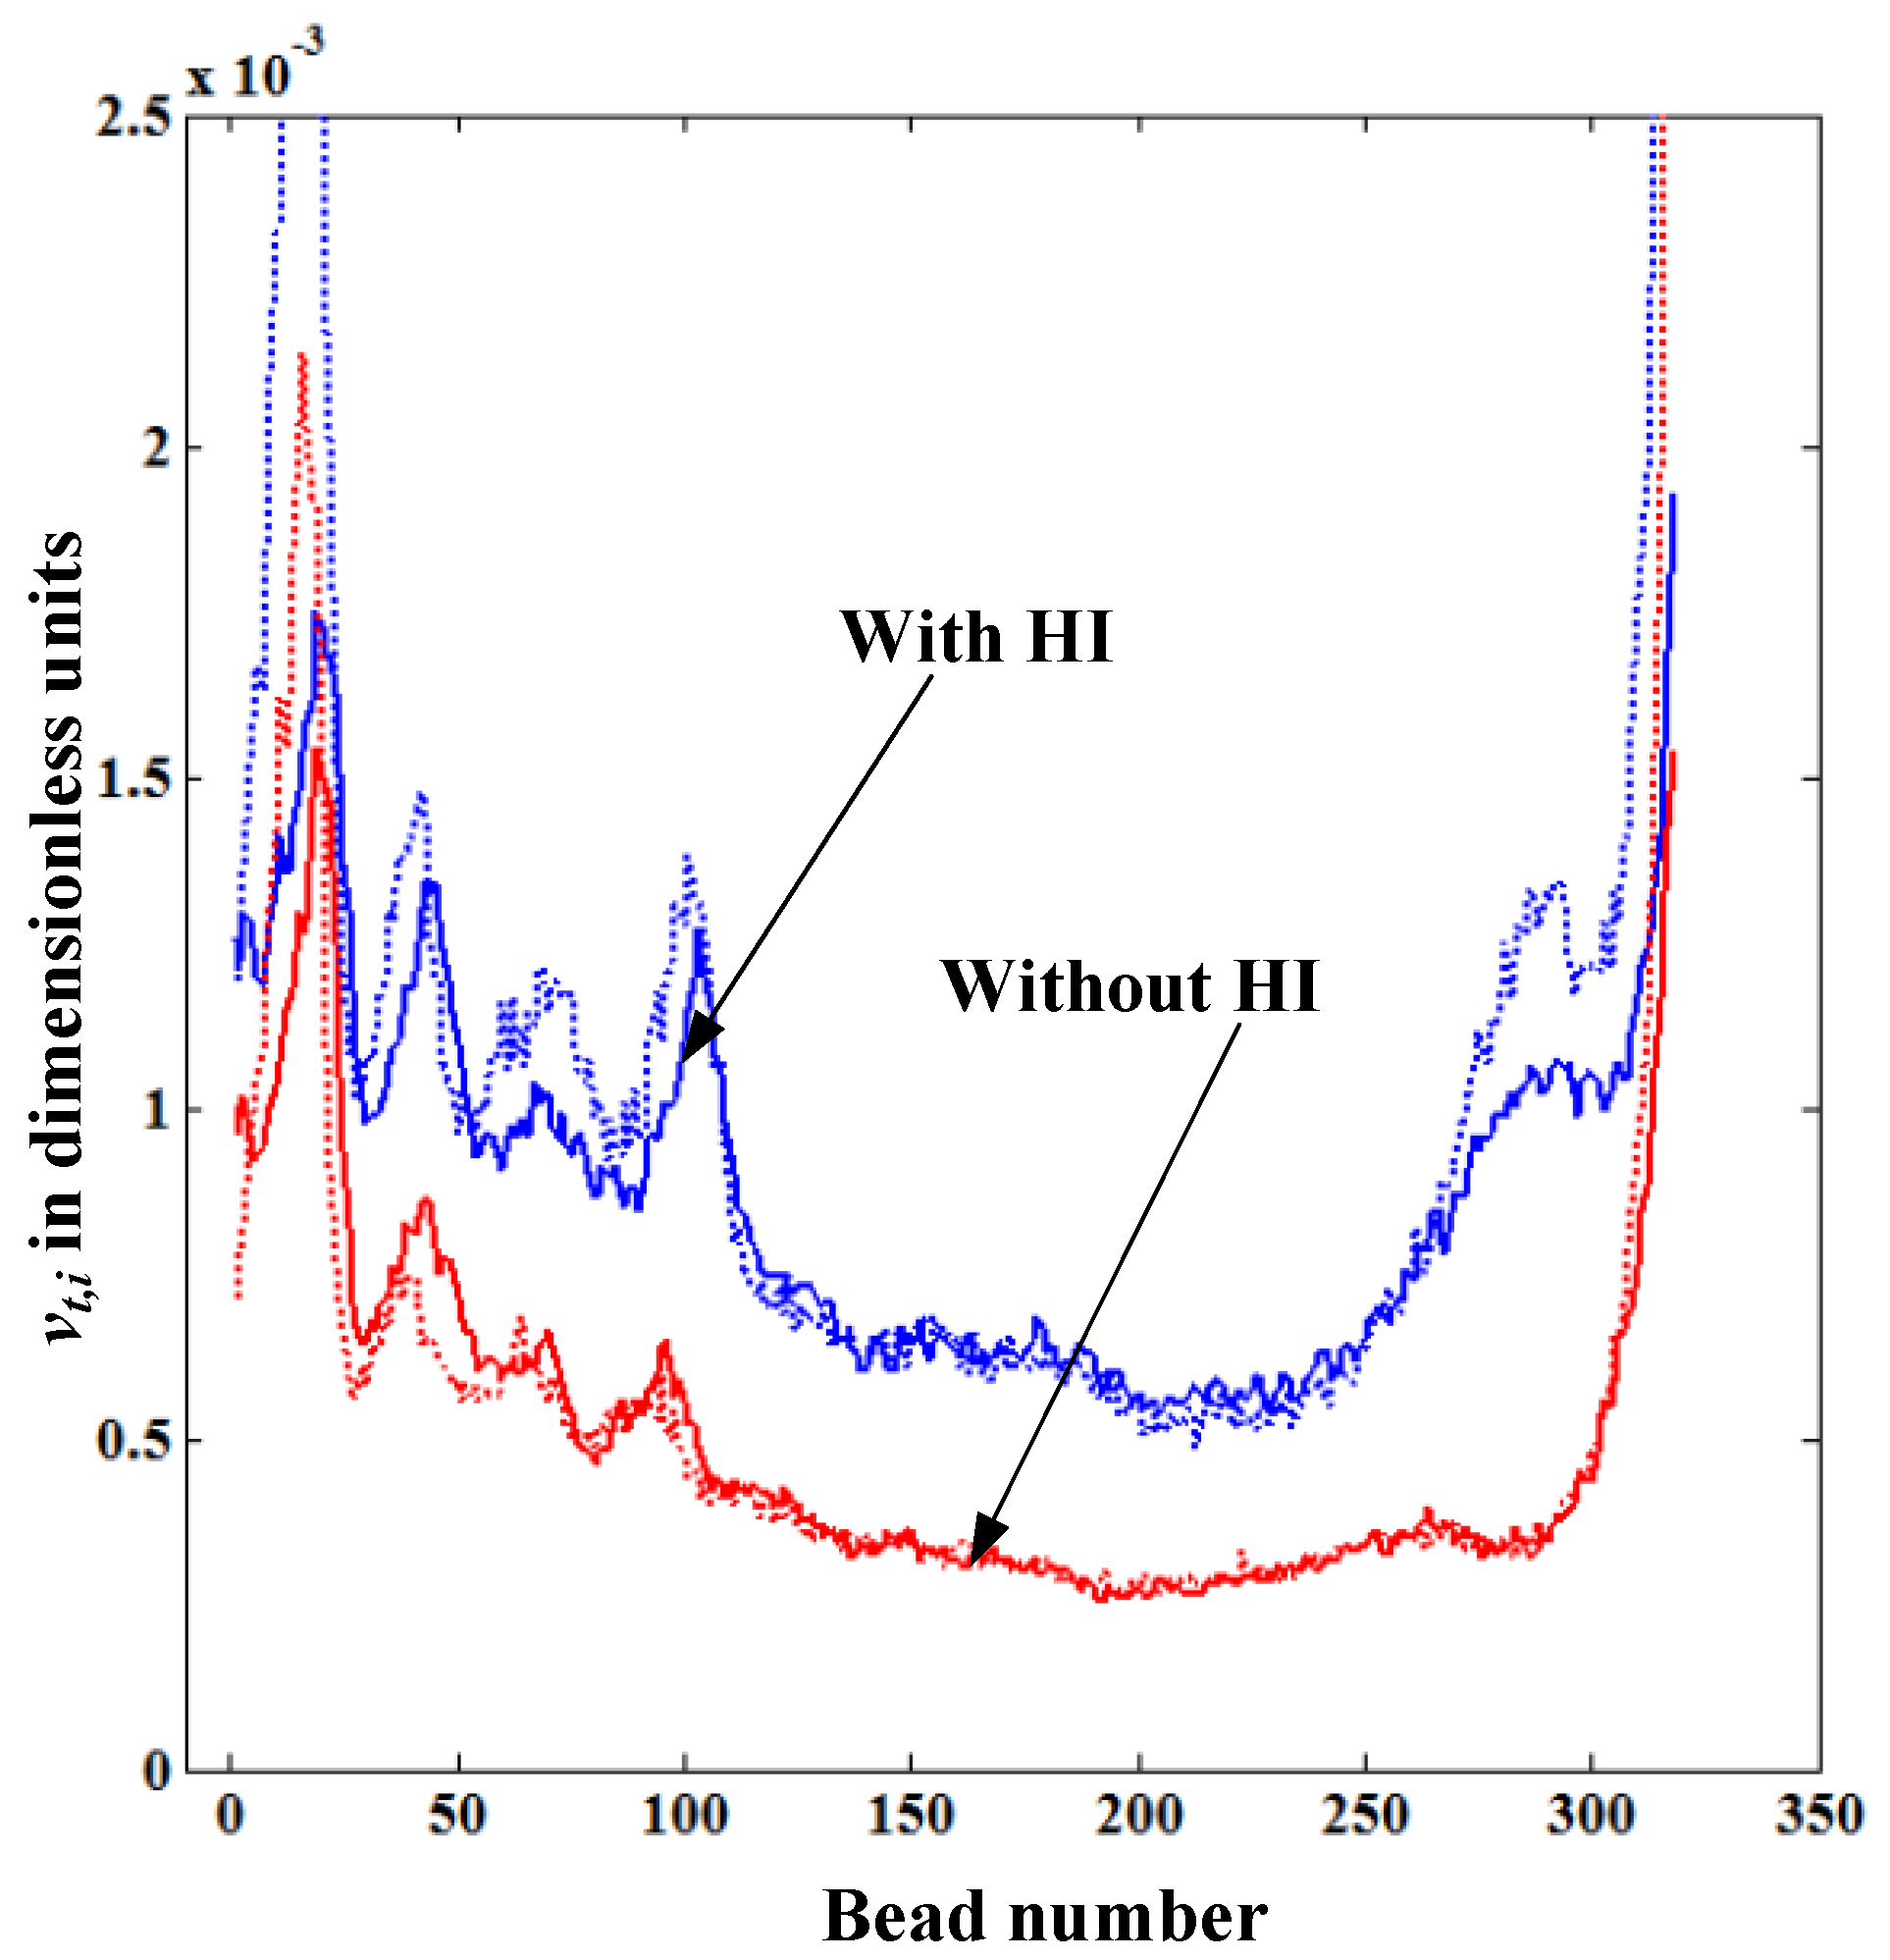
Figure 6 shows the comparison of the translocation velocity distribution of each bead
vt,i given from the solution of LD equations and that obtained from the theoretical formula Equation (5), both with and without HI. In both cases, the simulation begins with the same initial random configuration. The dotted lines in
Figure 6 represent
vt,i calculated from Equation (5), which is in good agreement with the simulation data for both cases with and without HI. This confirms our physical intuition that the translocation velocity of each bead inside the nanopore mainly depends on the
lstretch near the pore. In
Figure 6, the translocation velocity with HI is always higher than that without HI as the fluid resistance (drag force) on the straightened portion of the polymer without HI is always larger than the one with HI. We also observe that the distribution of the translocation velocity show a similar trend for polymers both with and without HI. The reason for this is since the translocation process in our simulations takes place under the forced translocation regime (the regime under
Felec >>
kBT/
σ0), the geometric shape of the polymer on the
cis side remains almost the same as its initial configuration regardless of the level of the drag force. This means that there is not enough time for the polymer blob to relax from its initial shape while it is translocating.
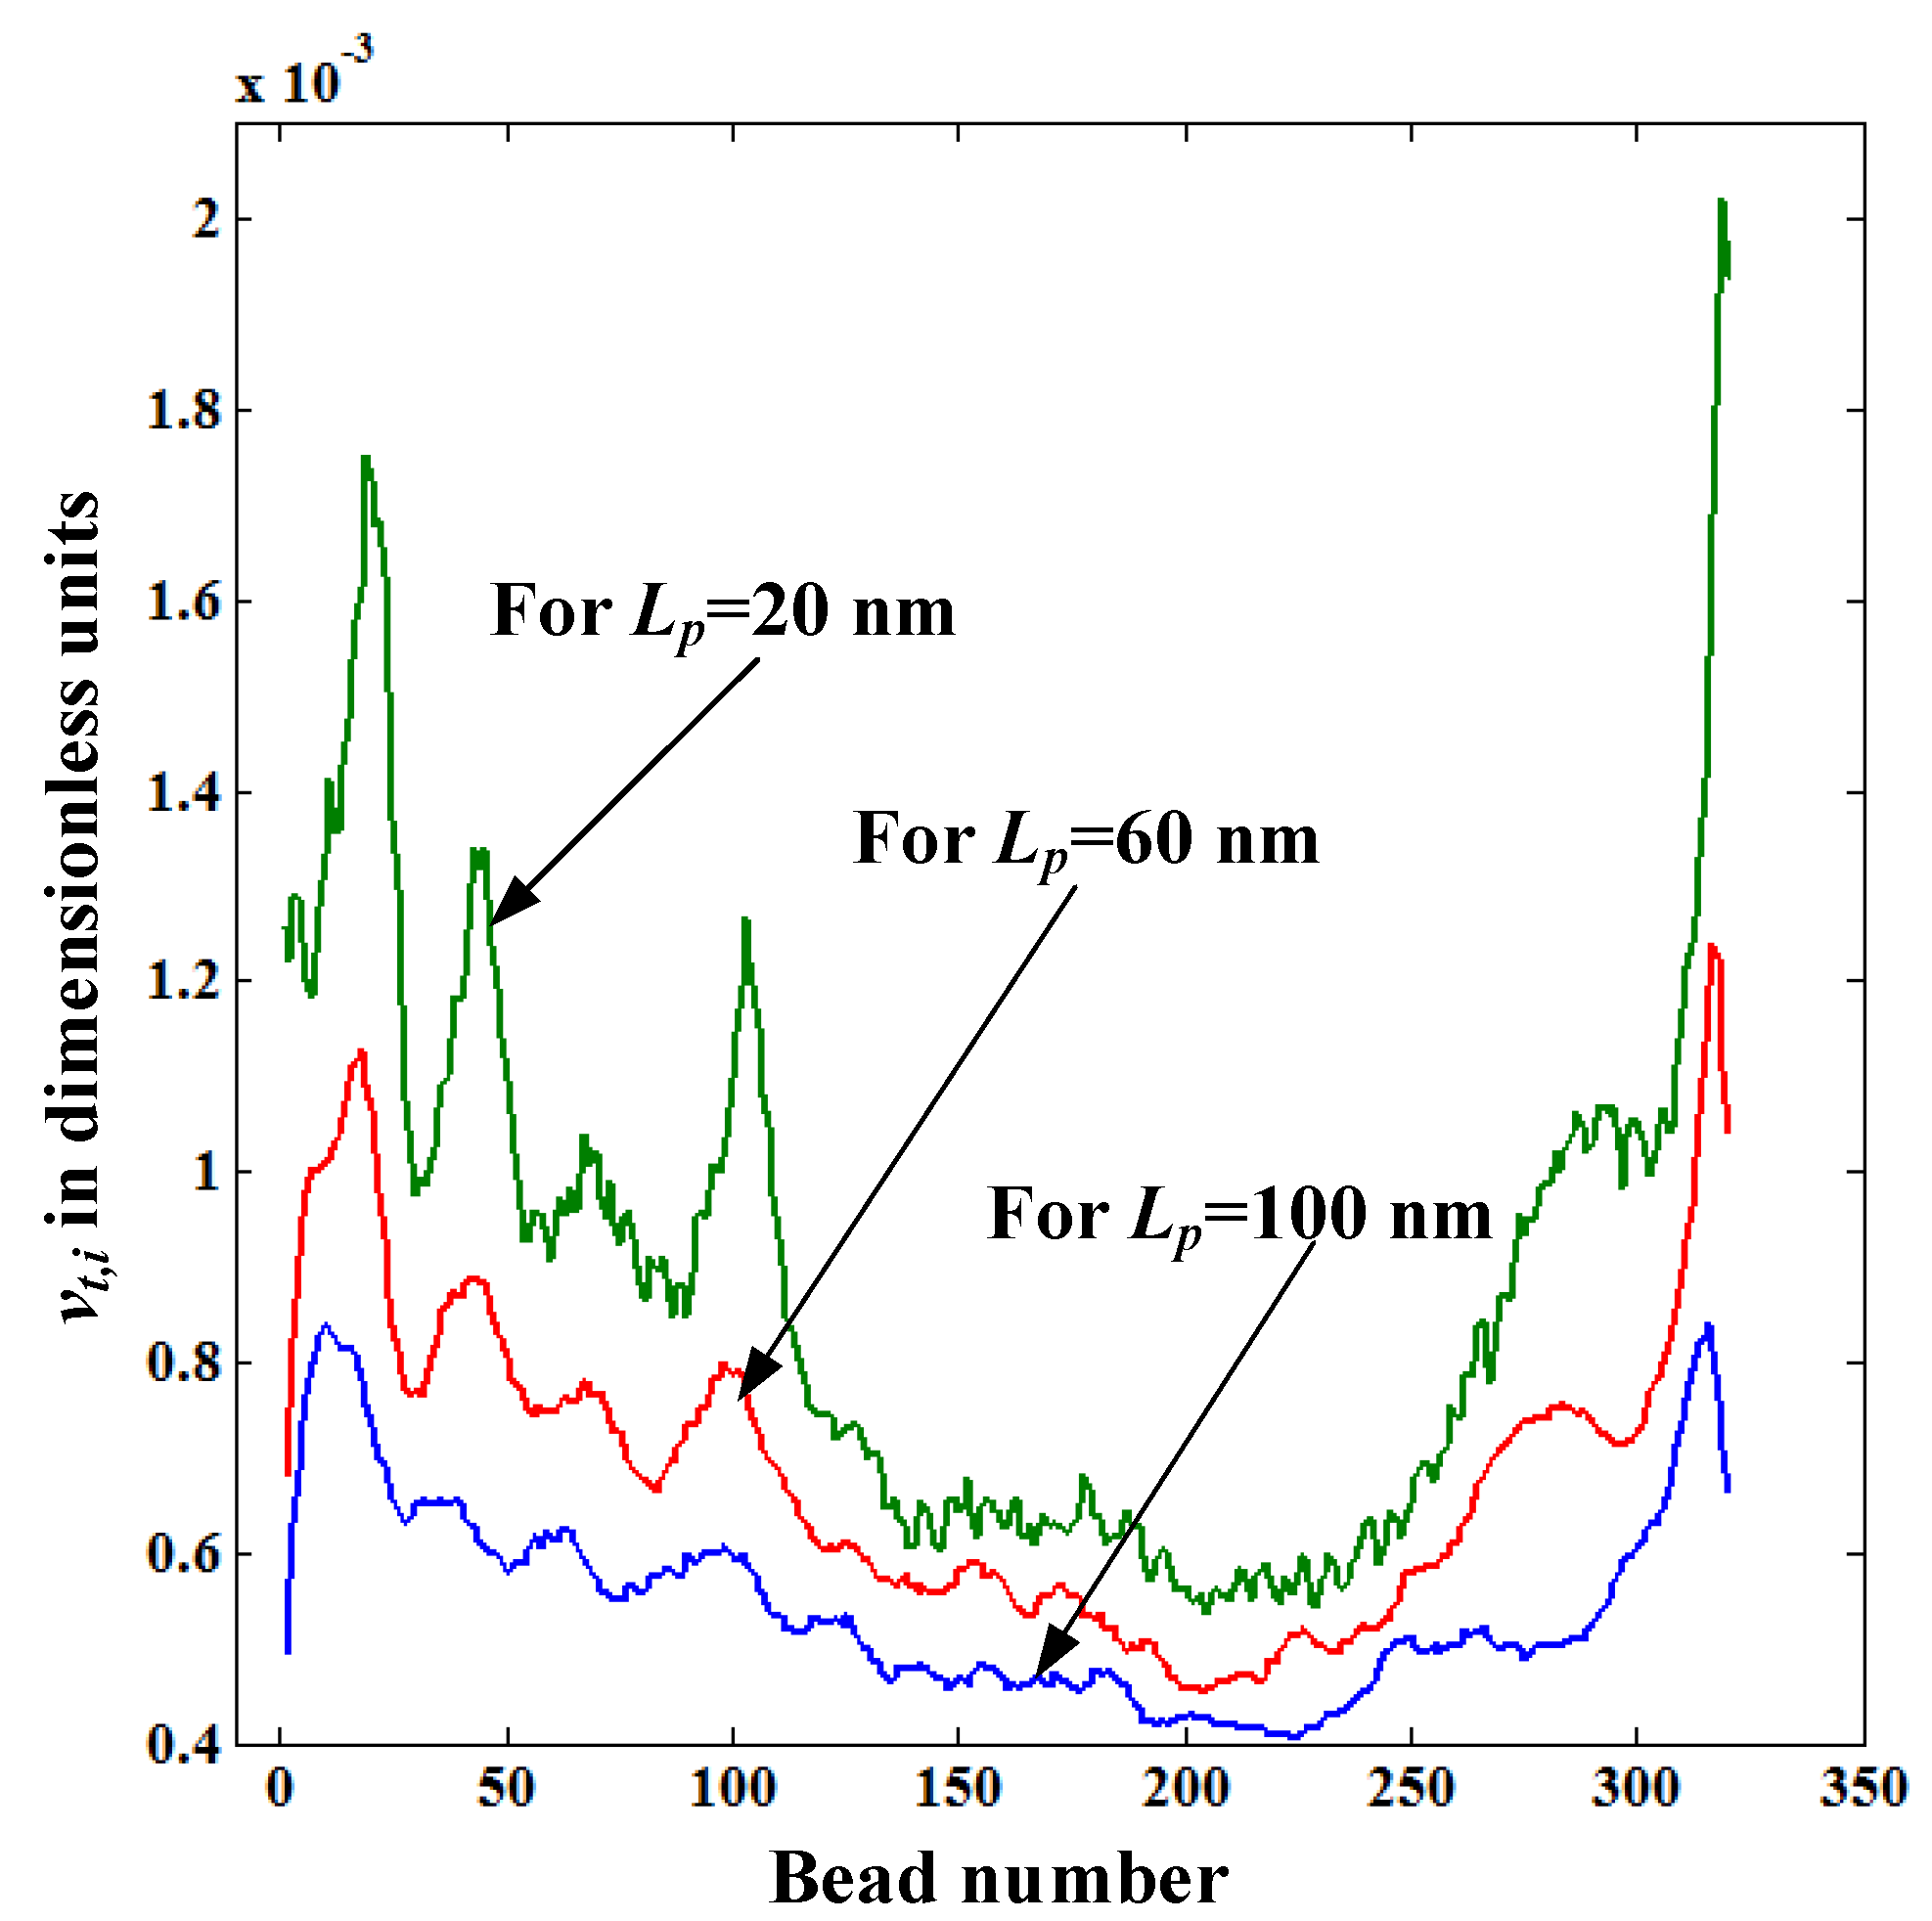
Figure 7 shows the distribution of translocation velocity of each bead
vt,i for pore lengths
Lp = 20, 60, and 100 nm. The value of
vt,i decreases with the pore length even though
Felec is the same for all
Lp values. The reason for this is that the drag force acting on the stretched portion of the polymer increases with the pore length as
lstretch increases with
Lp (see
Figure 5). So, the main reason behind the increase of the translocation time with
Lp revealed in
Figure 4 is due to the increased fluid resistance force caused by the increased length of the straightened portion of the polymer. In
Figure 7,
vt,i values of the first and last few beads of the polymer are very low for
Lp = 60 and 100nm compared to those for
Lp = 20 nm. This is because at the beginning and the end of the translocation process a
Felec is lower for
Lp = 60, and 100 nm than for
Lp = 20 nm as the number of beads inside the pore for
Lp = 60, and 100 nm is reduced.
Figure 6.
Variation of the translocation velocity of each bead vt,i inside the nanopore for the cases with and without HI for the polymer length N = 320. The dotted lines represent the values vt,i calculated from Equation (5).
Figure 6.
Variation of the translocation velocity of each bead vt,i inside the nanopore for the cases with and without HI for the polymer length N = 320. The dotted lines represent the values vt,i calculated from Equation (5).
Figure 7.
Variation of the translocation velocity of each bead vt,i inside the nanopore for pore lengths Lp = 20, 60, and 100 nm.
Figure 7.
Variation of the translocation velocity of each bead vt,i inside the nanopore for pore lengths Lp = 20, 60, and 100 nm.
