Ba-Doped Iron Oxide as a New Material for NO2 Detection


1
Laboratory of Electrochemistry and Physical-chemistry of Materials and Interfaces, UMR 5279, CNRS-Grenoble INP-Université de Savoie-Université Joseph Fourier, BP75, 38402 Saint Martin d'Hères, France
2
Department of Applied Science and Technology, Politecnico di Torino, INSTM Reference Laboratory for Ceramics Engineering, Corso Duca degli Abruzzi 24, 10129 Torino, Italy
*
Author to whom correspondence should be addressed.
Materials 2013, 6(10), 4801-4816; https://doi.org/10.3390/ma6104801
Submission received: 23 September 2013
/
Revised: 5 October 2013
/
Accepted: 16 October 2013
/
Published: 22 October 2013
Abstract
:Various compositions of barium-doped hematite between pure hematite (α-Fe2O3) and pure barium hexaferrite (BaFe12O19) were synthesized by solid state reaction. The XRD analyses confirmed the progressive evolution of the two crystalline phases. Tests as humidity sensors show that the electrical resistance of samples containing high proportions of hexaferrite phase is strongly influenced. Electrochemical impedance spectroscopy (EIS) analyses under air or argon revealed an intrinsic semiconducting behavior for hematite and samples doped with 3 and 4 wt % equivalent BaO. The samples containing higher proportions of barium exhibited an extrinsic semiconducting behavior characterized by a variation of the conductivity with the oxygen partial pressure. This study allowed us to define the percolation threshold of the barium hexaferrite crystalline phase in the hematite matrix. The value was estimated to hematite doped with 5 wt % BaO, i.e., 36 wt % of barium hexaferrite phase. EIS analyses under various NO2 partial pressures confirmed the sensitivity of these materials. The linearity of the response was particularly evident for the 5, 10 and 14 wt % samples.
1. Introduction
Nitrogen oxides (NO and NO2: NOx), released from combustion facilities and automobiles, are a main cause of air pollution. They are responsible for acid rains, photochemical smog and are also potentially eutrophying agents, i.e., can cause an oversupply of nutrient in soils and water bodies. Therefore, they are known to be harmful to the environment, to people, and also to historical monuments and buildings. The current directive 2008/50/EC of the European Union and the future Decision 2011/850/EU (from 1 January 2014) on ambient air quality has set at 40 μg/m3 the annual limit value, and at 200 μg/m3 the hourly limit value, not to be exceeded more than 18 times in a calendar year, for the protection of human health against the effects of gaseous NO2 [1,2]. Therefore, reliable, simple, effective and low-cost methods to monitor them have been highly demanded for atmospheric environmental measurements and controls.
Many of the systems usually employed for the monitoring of air pollutants are based on traditional photometric techniques like chemiluminescence [1], even if, more recently, electroanalysis techniques (amperometric approach), have been proposed and tested [3]. The main drawbacks associated to these techniques are represented by the use of expensive bench scale laboratory equipment including calibrating facilities.
Semiconducting metal oxide (SMO) sensors are one of the most widely studied groups of chemiresistive gas sensors due to their unique advantages such as low cost, small size, measurement simplicity, durability, ease of fabrication, and low detection limits (<ppm levels) [3]. Moreover, most SMO based sensors tend to be long-lived and somewhat resistant to poisoning [3]. The SMO undergoes reduction or oxidation while reacting with the target gas and this process causes an exchange of electrons at a certain characteristic rate, thereby affecting the sensor’s resistance and yielding a certain signal [3].
Concerning the sensing materials for NO2 detection, tungsten oxide based materials have received a great attention in the last two decades. For example, pure and doped with various metal oxides WO3 sensors have been used as potential NOx sensors [3]. WO3-based sensors produced by screen-printing can be highly responsive to NO2 down to 1 ppm, when operated at 250 °C [4]. WO3 thick films fired at 700 °C in Ar/O2 flow have also proved to be operated at 100°C with excellent properties, such as fast response times, saturated stable sensitivity and rapid recovery characteristics to NO2 gas in air [5]. WO3-based nanocrystalline (3.0–9.0 nm size) thick films sensors with TiO2, can be used successfully for detecting and monitoring of NO2 in exhaust gases in parts per million level at 350 °C [6]. Zinc oxide thin and thick films have been also extensively studied for more than two decades. Several methods have been used to fabricate ZnO films and also their physical properties depend greatly on the method and condition of deposition [7]. Screen-printed ZnO, SnO2 and Sb2O3 thick-films sensors sintered at 800, 1000 and 1200 °C showed high sensitivity and excellent selectivity for ppm levels of NO2 gas [8]. Very recently, hybrid ZnO tetrapods + titanyl phthalocyanine exhibited a high sensor response () under 100 ppb of NO2 at room temperature, but with slow response and recovery times (several tens of minutes) [9]. In contrast, monocrystalline SnO2 nanowires were sensitive in the range 18.9–1000 ppm of NO2 at 250 °C with fast response and recovery times of 7 s and 8 s, respectively [10]. Gas sensors based on indium oxide nanowires, In2O3 or InxOyNz films grown by the metal organic CVD technique also showed good selectivity to NO2 with little interference from other gases [11,12]. In addition, Indium Tin Oxide (ITO) thin films were found to exhibit high sensitivity toward NO2 and NO associated to a good selectivity with respect to CO and CH4 [12]. TeO2 thin films proved to be effective in NO2 detection in the range of 1–120 ppm too [13]. The results showed the best sensitivity to NO2 at room temperature, but with a response time of about 6 min for 1 ppm to about 1.2 min for 120 ppm NO2 concentration and longer recovery times.
Carbon nanotubes [14], YSZ [15], SnO2, Nb or In2O3 doped hematite [16,17] have been also proposed for NO2 detection. Alkaline or earthy-alkaline-doped hematite (α-Fe2O3) materials have been investigated recently in the literature, as NOx sensors [18] and 5 wt % BaO addition to hematite seemed to lead to a promising sensing material. Therefore, the aim of this work is to study in more detail barium-doped hematite as an electrochemical sensor for NO2 detection.
2. Experimental Section
α-Fe2O3 powder (Aldrich > 99%, particle size distribution below 2 m) was mixed in ethanol with barium nitrate used as precursor of 3, 4, 5, 10 and 14 wt % equivalent of barium oxide respect to hematite (Fluka > 99%), until stoichiometrical composition of BaFe12O19, in a planetary mill for 1 h. After drying overnight, the mixtures were uniaxially pressed at 370 MPa and calcined at 900 °C for 1 h. These samples were then planetary milled for 6 h in ethanol with polyethylene glycol (PEG 4000, Sigma-Aldrich, Milan, Italy) to increase the densities of the different samples. After drying overnight, the powders were ready to use. The grain size of the produced powders was then determined by means of a laser granulometre (Fritsch analysette 22). The different mixtures of Ba-doped α-Fe2O3 were pressed ad 370 MPa again and sintered at 1300 °C for 1 h.
Geometrical density evolution in function of percentage of added barium oxide was studied and the samples were characterized by X-ray diffraction (PW1710, Philips Eindhoven, The Netherland), in the 5°–70° 2 theta range, after calcination at 900 °C and sintering at 1300 °C. The pellets were also observed by means of a scanning electron microscope (SEM, S2300, Hitachi Tokyo, Japan).
Interdigitated gold electrodes (ESL 520A) were screen-printed onto the surface of the pellets of hematite and doped hematite fired at 1300 °C and the sensors humidity response was studied in the range 0%–100% relative humidity (RH) because it is known in the literature that water molecules can interfere in gas detection, both with respect to adsorption of other species and to surface catalysis [19,20]. In a chamber, compressed air was separated into two fluxes: one was dehydrated over a chromatography alumina bed, while the second one was directed through two water bubblers, generating, respectively, a dry and a humid flow. Two precision microvalves allowed to recombine the two fluxes into one by means of a mixer and to adjust the RH content while keeping constant the testing conditions, in particular a flow rate of 0.05 L/s. The relative humidity was not increased in a continuous mode but was varied by steps every 3 min. The measurements were performed at room temperature. A commercial humidity and temperature probe was used as a reference for temperature and RH values (Delta Ohm HD2101.1), accuracy: ±0.1% in the 0%–100% RH range and −50–250 °C temperature range. Each tested sensor was alimented by an external alternating voltage (V = 3.6 V at the rate of 1 kHz) and then constituted a variable resistance of this electrical circuit. A multimeter (Keithley 2000) was used to measure the tension VDC at the output of the circuit. The sensor resistance was determined by substituting them, in the circuit, by known resistances and then plotting a calibrating curve R = f (VDC) [21,22].
The electrical behavior of the materials was studied by AC impedance spectroscopy (4192A LF Impedance Analyzer, Hewlett Packard, Palo Alto, CA, USA) after painting platinum electrodes (ESL 5545, Electro-Science Laboratories, King of Prussia, PA, USA) onto the two faces of the pellets (1 cm in diameter and 1 mm in thickness). The measurements were performed in a furnace under dry synthetic air (Messer air 80/20) and argon (Messer argon 5.0), between 100 and 700 °C, in the 5 Hz–13 MHz frequency range. Excitation voltage was fixed at 100 mV. The previous samples were also studied under NO2. AC impedance measurements were performed in a mixed flux of helium (Messer 4.6) and nitrogen dioxide (Messer 1000 ppm NO2 1.8 in N2 5.0) under a constant flow rate of 40 mL/min and a 0–500 ppm range NO2 concentration. Excitation voltage was fixed at 100 mV in the 5 Hz–13 MHz frequency range.
Sensor response (SR) was calculated from impedance measurements considering the resistance at 1000 Hz. SR is a function of NO2 concentration and is determined as follows [23] (Equation (1)):
R(Pgas) represents the value of resistance in presence of the gas studied (NO2 in the present case) and R(Pgas→0) the resistance without this gas.
3. Results and Discussion
3.1. Microstructure
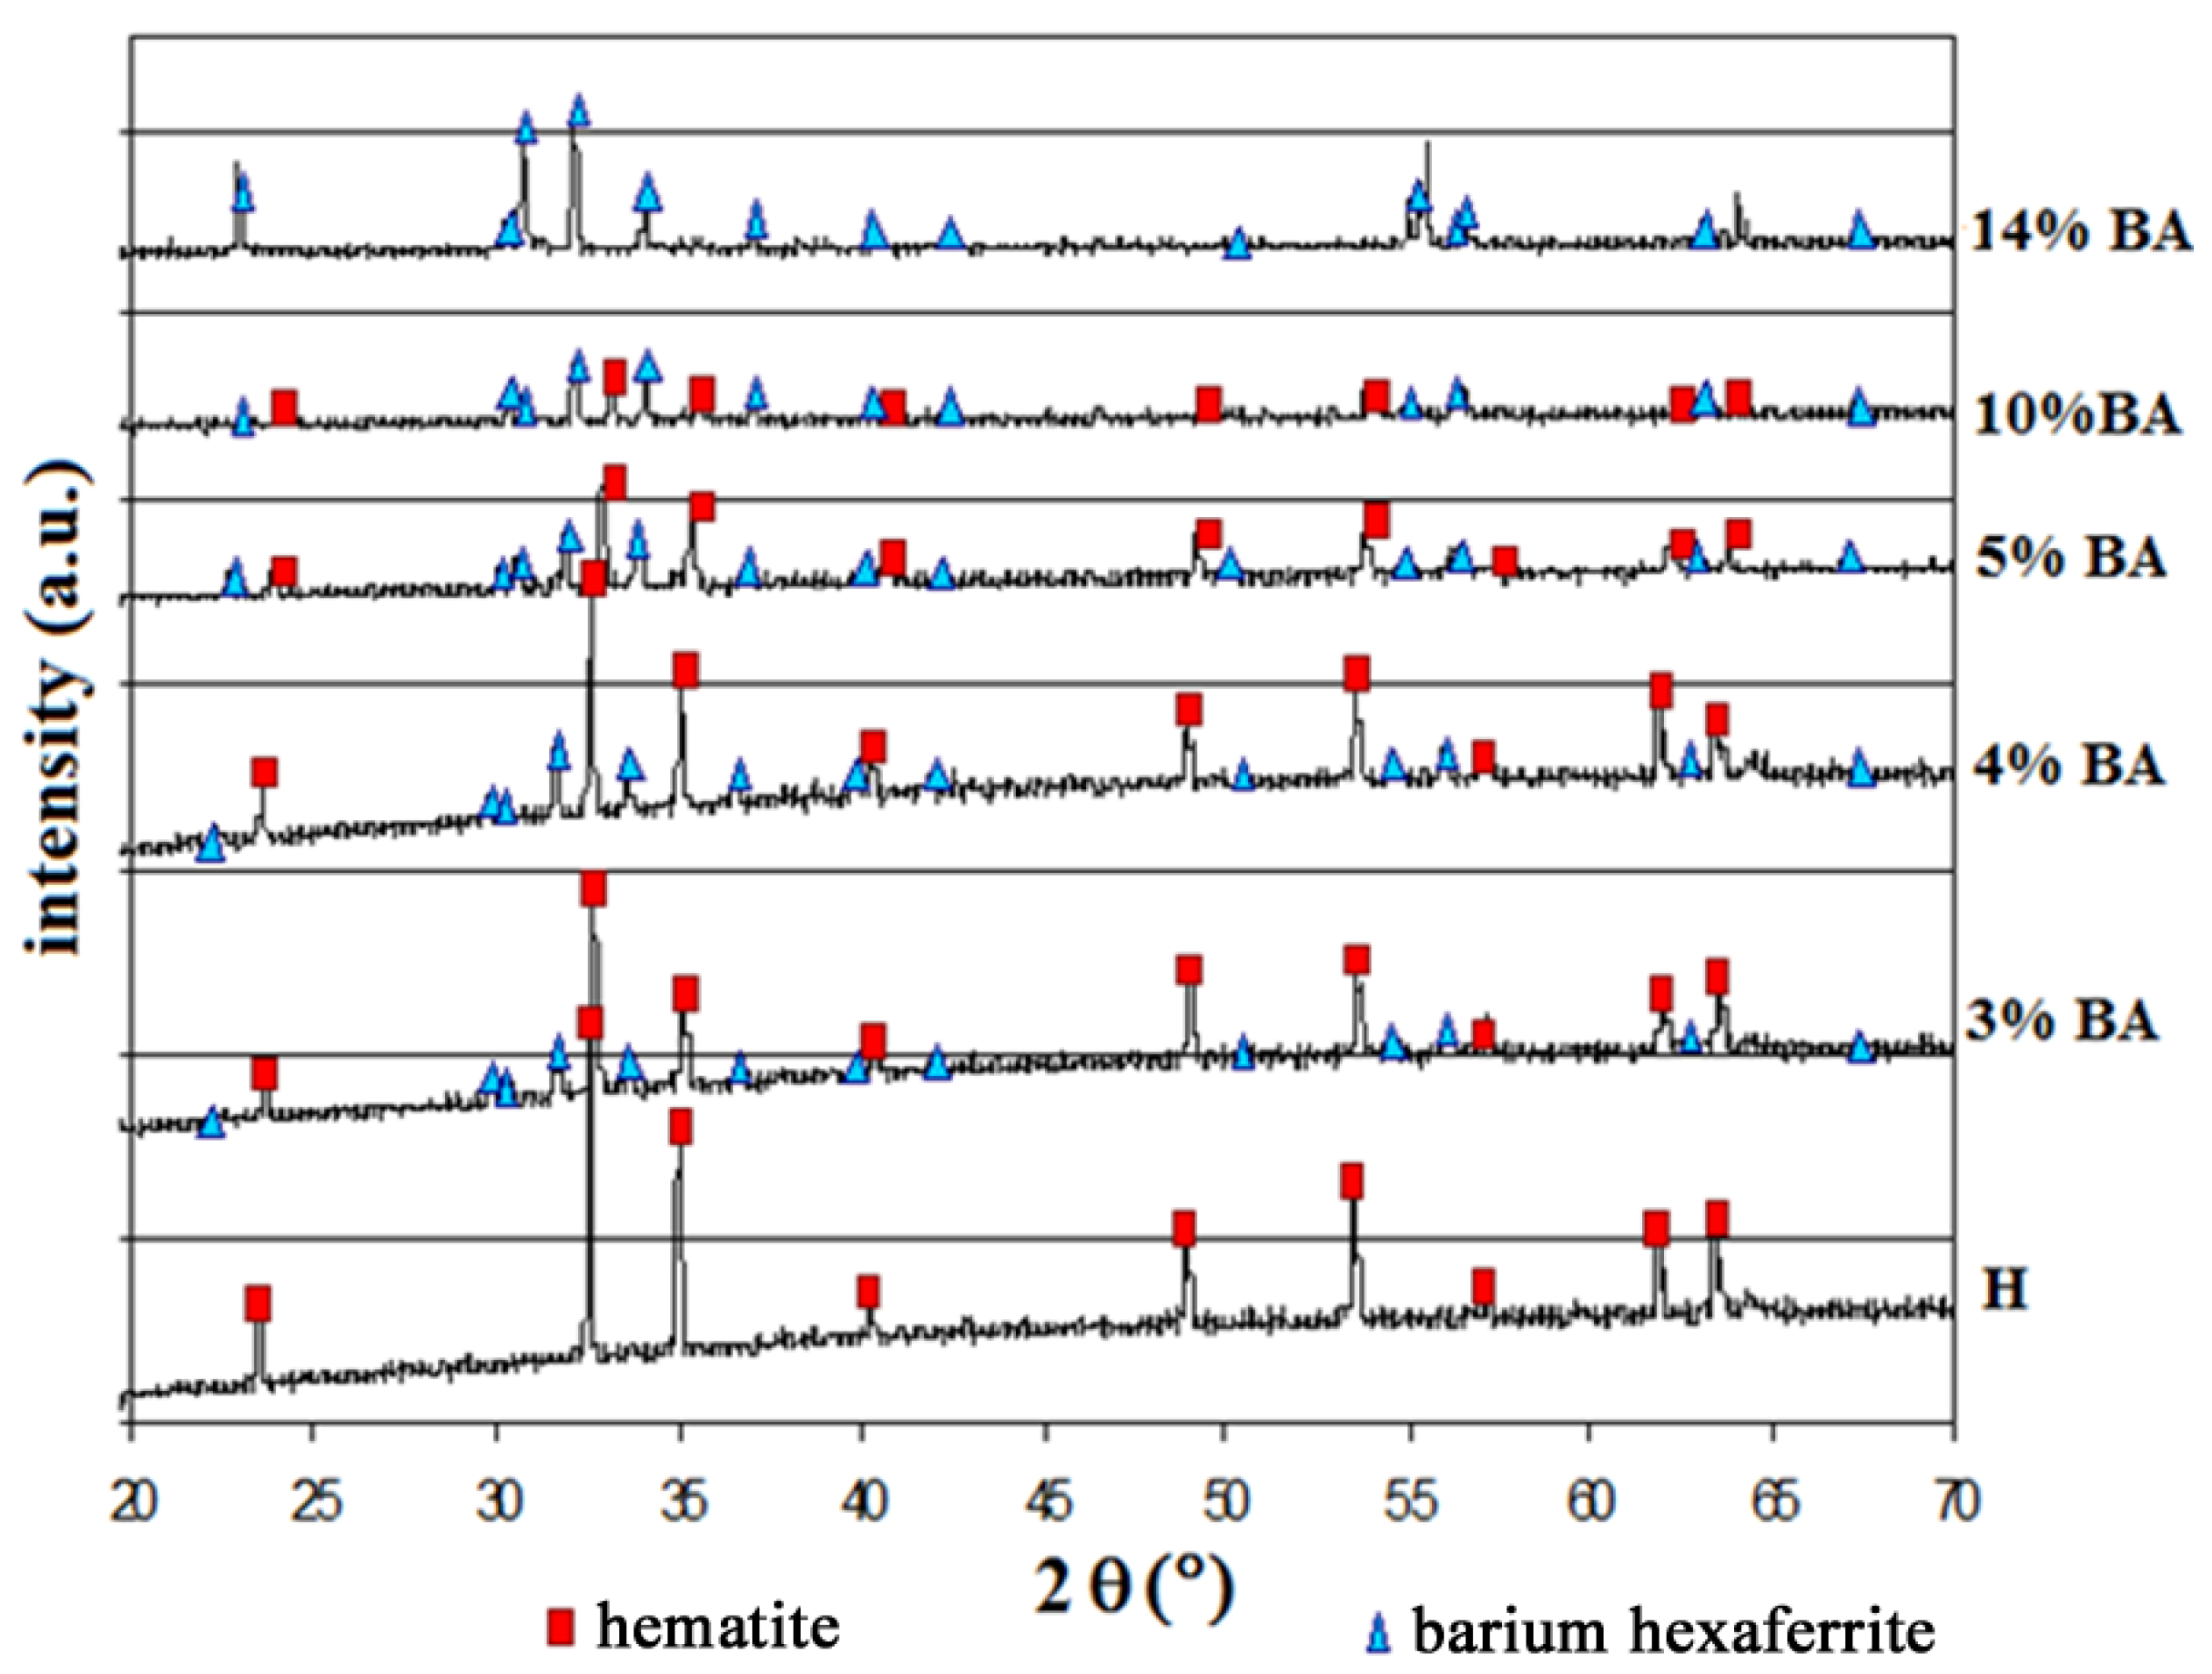
After the first thermal treatment at 900 °C and the 6 h planetary milling, the powders showed a mean diameter of 3.40 μm for 3, 4, 5 and 10 wt % equivalent of Ba-doped hematite samples, and of 9.00 μm for 14 wt % of Ba-doped hematite. These values are comparable to the mean diameter of the starting α-Fe2O3 powder (2 μm). X-ray diffraction patterns of the Ba-doped hematite after the first thermal treatment at 900 °C for 1 h and sintering at 1300 °C, confirmed the presence of two crystalline phases in all the samples: hematite (JCPDS card n.33-0664) and barium hexaferrite, BaFe12O19 (JCPDS card n.39-1433). As expected, we observe (Figure 1) the intensity of the barium hexaferrite peaks increasing with BaO additions from the pure hematite sample (H) to the pure barium hexaferrite sample (14% BA i.e., α-Fe2O3 + 14 wt % BaO).
Table 1 summarizes the six compositions studied in the present work. Theoretical densities were calculated considering that in all the mixtures the barium oxide was completely transformed into barium hexaferrite crystalline phase by reaction with hematite. The densities increase with increasing the sintering temperature (Figure 2a) but also decrease with barium oxide content (Figure 2b).
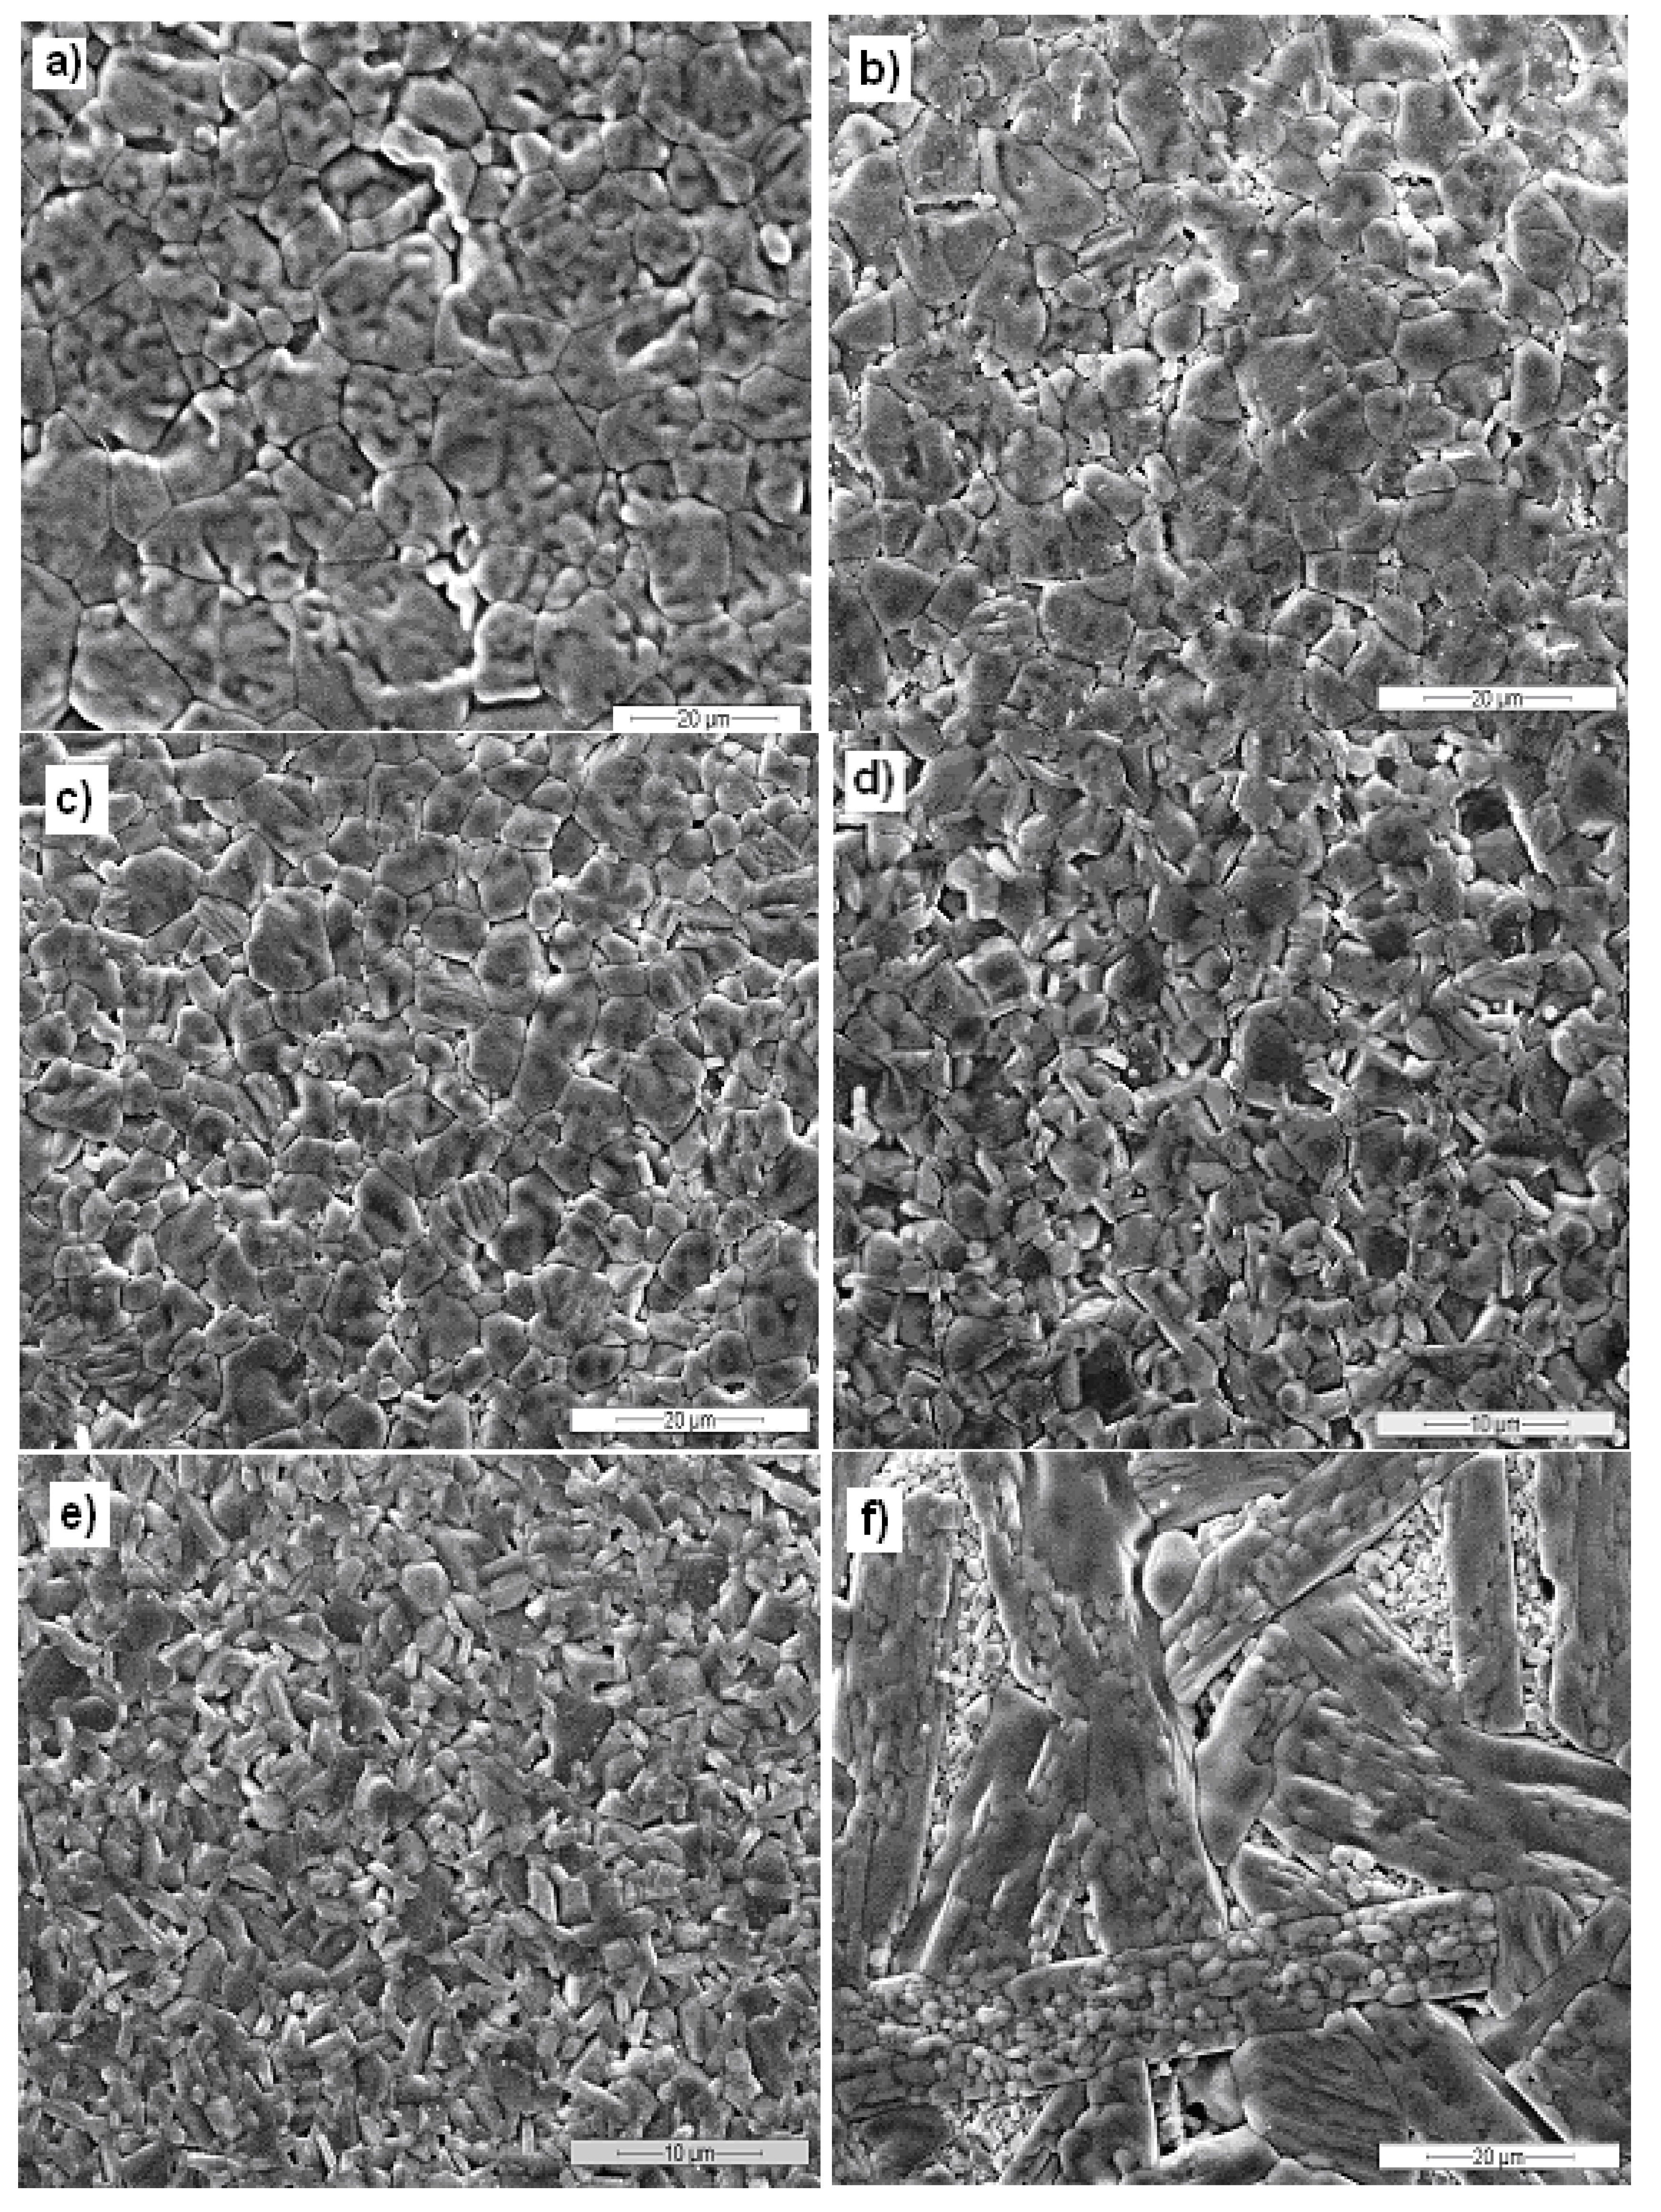
Figure 3 illustrates the microstructures of pure hematite, 3% BA, 4% BA, 5% BA, 10% BA and 14% BA samples: the rather high densities of the materials fired at 1300 °C are confirmed. In the Ba-doped hematite samples, two different microstructures are present: a first one showing hexagonal grains, characteristic of hematite, and a second one characterized by lamellar grains, corresponding to the BaFe12O19 phase.
Figure 1.
XRD spectra of various barium-doped hematite samples.

| Label | Sample | Expected BaFe12O19 (wt %) | Relative density (%) |
|---|---|---|---|
| H | α-Fe2O3 | 0 | 96.9 |
| 3% BA | α-Fe2O3 + 3 wt % BaO fired at 1300 °C | 18.12 | 95.2 |
| 4% BA | α-Fe2O3 + 4 wt % BaO fired at 1300 °C | 21.75 | 94.8 |
| 5% BA | α-Fe2O3 + 5 wt % BaO fired at 1300 °C | 36.24 | 94.8 |
| 10% BA | α-Fe2O3 + 10 wt % BaO fired at 1300 °C | 72.48 | 93.1 |
| 14% BA | α-Fe2O3 + 14 wt % BaO fired at 1300 °C | 100.00 | 92.0 |
The grain sizes are rather different between the various samples (Figure 3): the grain size decrease when increasing barium hexaferrite content until 10% BA.
Figure 2.
Geometrical density evolutions: (a) with temperature for 5% BA; (b) with barium oxide content for samples fired at 1300 °C.
Figure 2.
Geometrical density evolutions: (a) with temperature for 5% BA; (b) with barium oxide content for samples fired at 1300 °C.
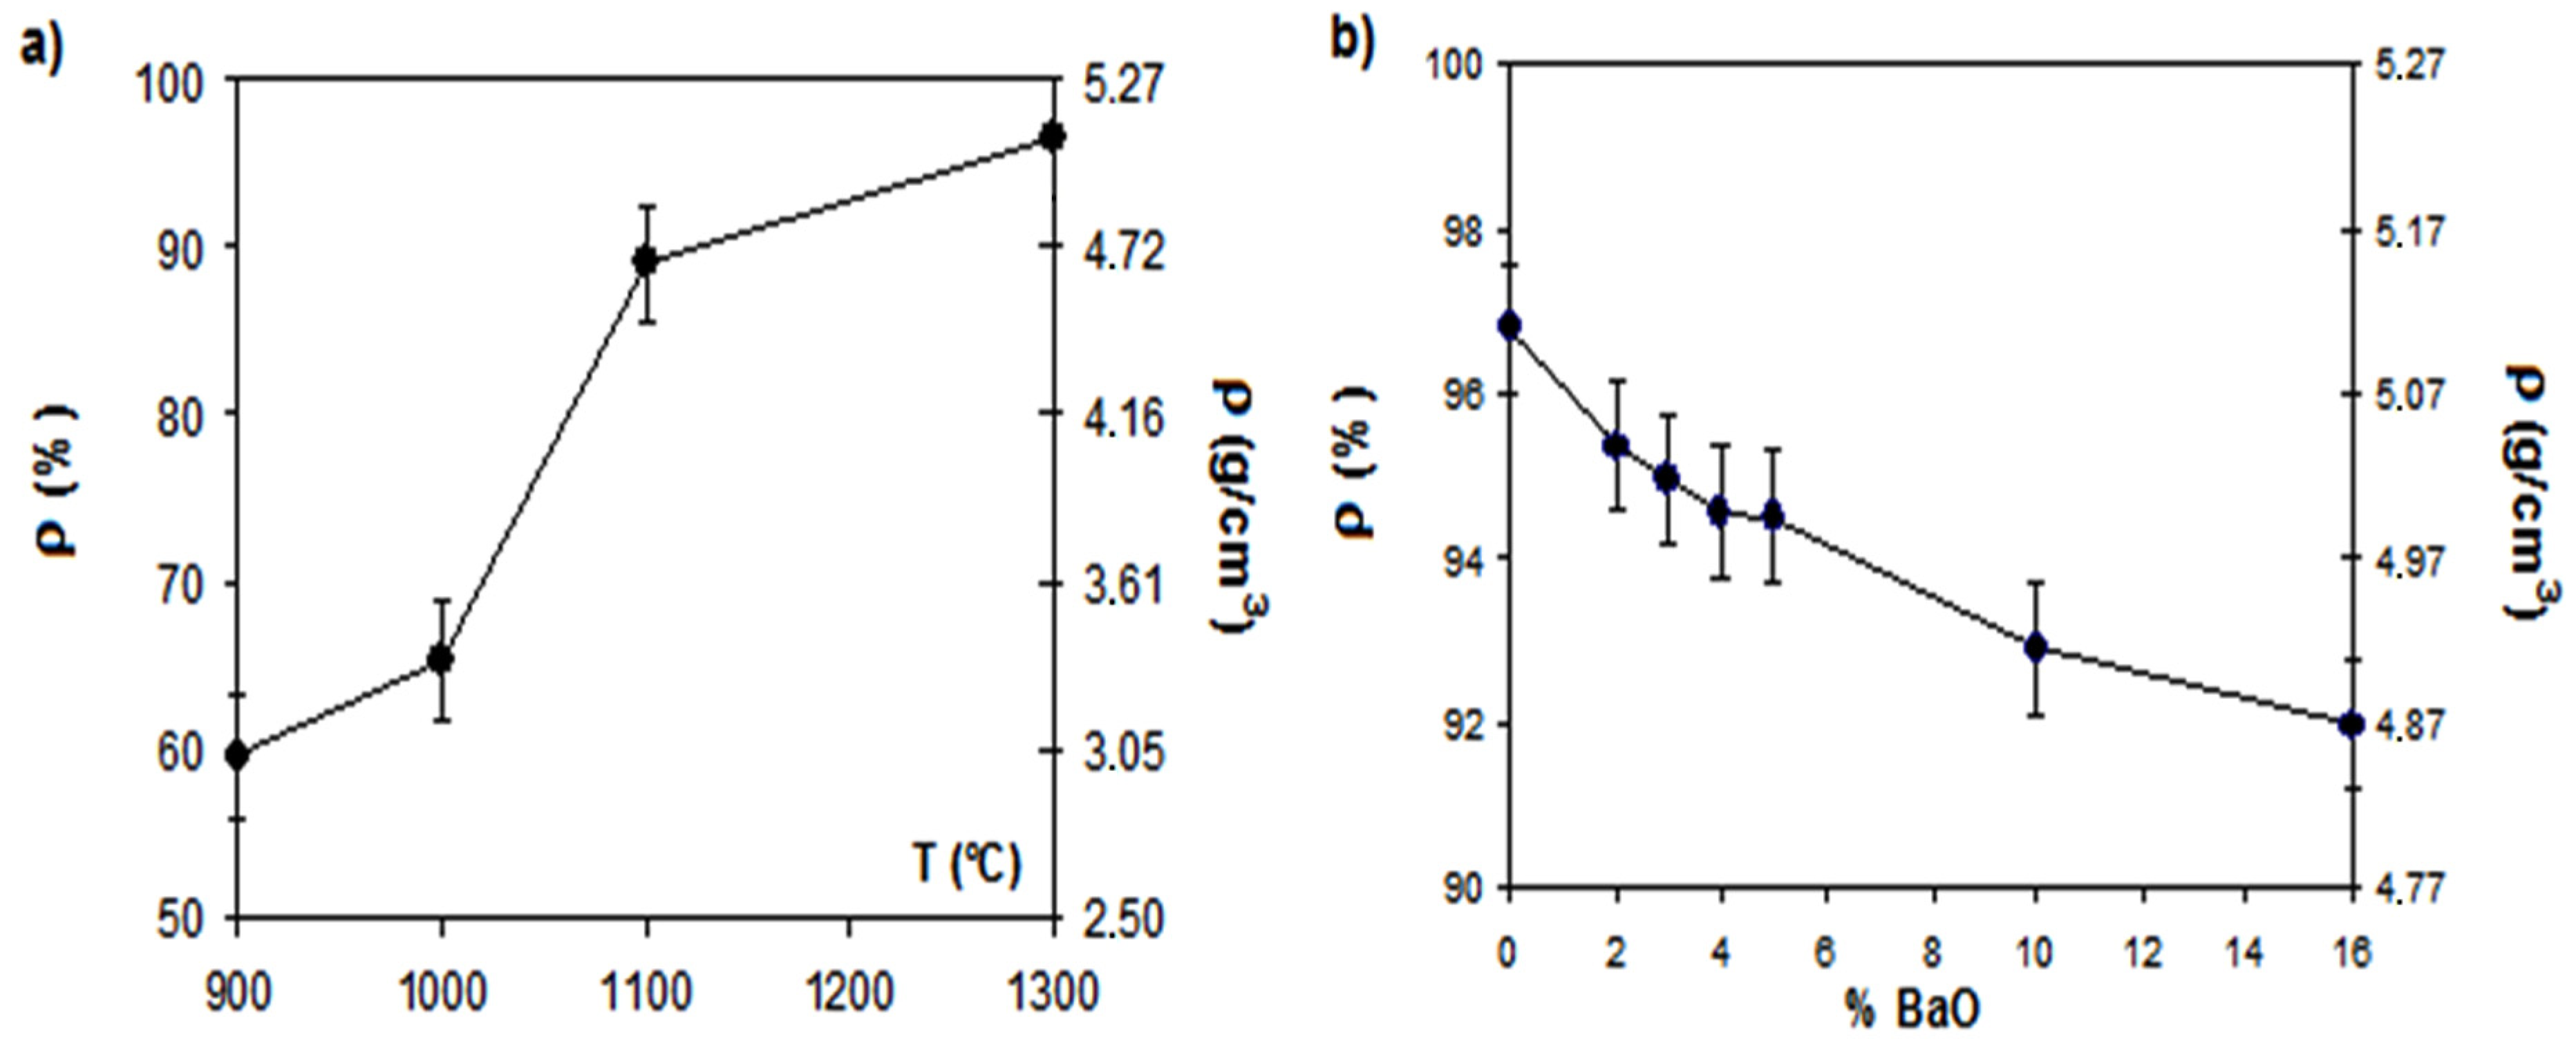
Figure 3.
SEM micrographs of sintered samples: (a) H (1000×); (b) 3% BA (1000×); (c) 4% BA (1000×); (d) 5% BA (2000×); (e) 10% BA (2000×); (f) 14% BA (1000×).
Figure 3.
SEM micrographs of sintered samples: (a) H (1000×); (b) 3% BA (1000×); (c) 4% BA (1000×); (d) 5% BA (2000×); (e) 10% BA (2000×); (f) 14% BA (1000×).

3.2. Humidity Sensitivity
The correlation between humidity sensor response and the material porosity is known in the literature, and it is possible to evaluate the pore radius at which capillary condensation occurs at different temperatures (T) by means of the Kelvin equation [19] (Equation (2)):
where rk is pore radius; M are respectively the water surface tension, density and molecular weight, while P and Ps are the water vapor pressures in the surrounding atmosphere and at saturation, respectively.
Because the porous structure of ceramics with open pores tends to favor water and gases adsorption and condensation, and though, on semiconducting materials these features are less critical [24], the efforts were oriented on the reduction of the sample porosity, as in general, dense ceramics show negligible humidity-sensitivity [25].
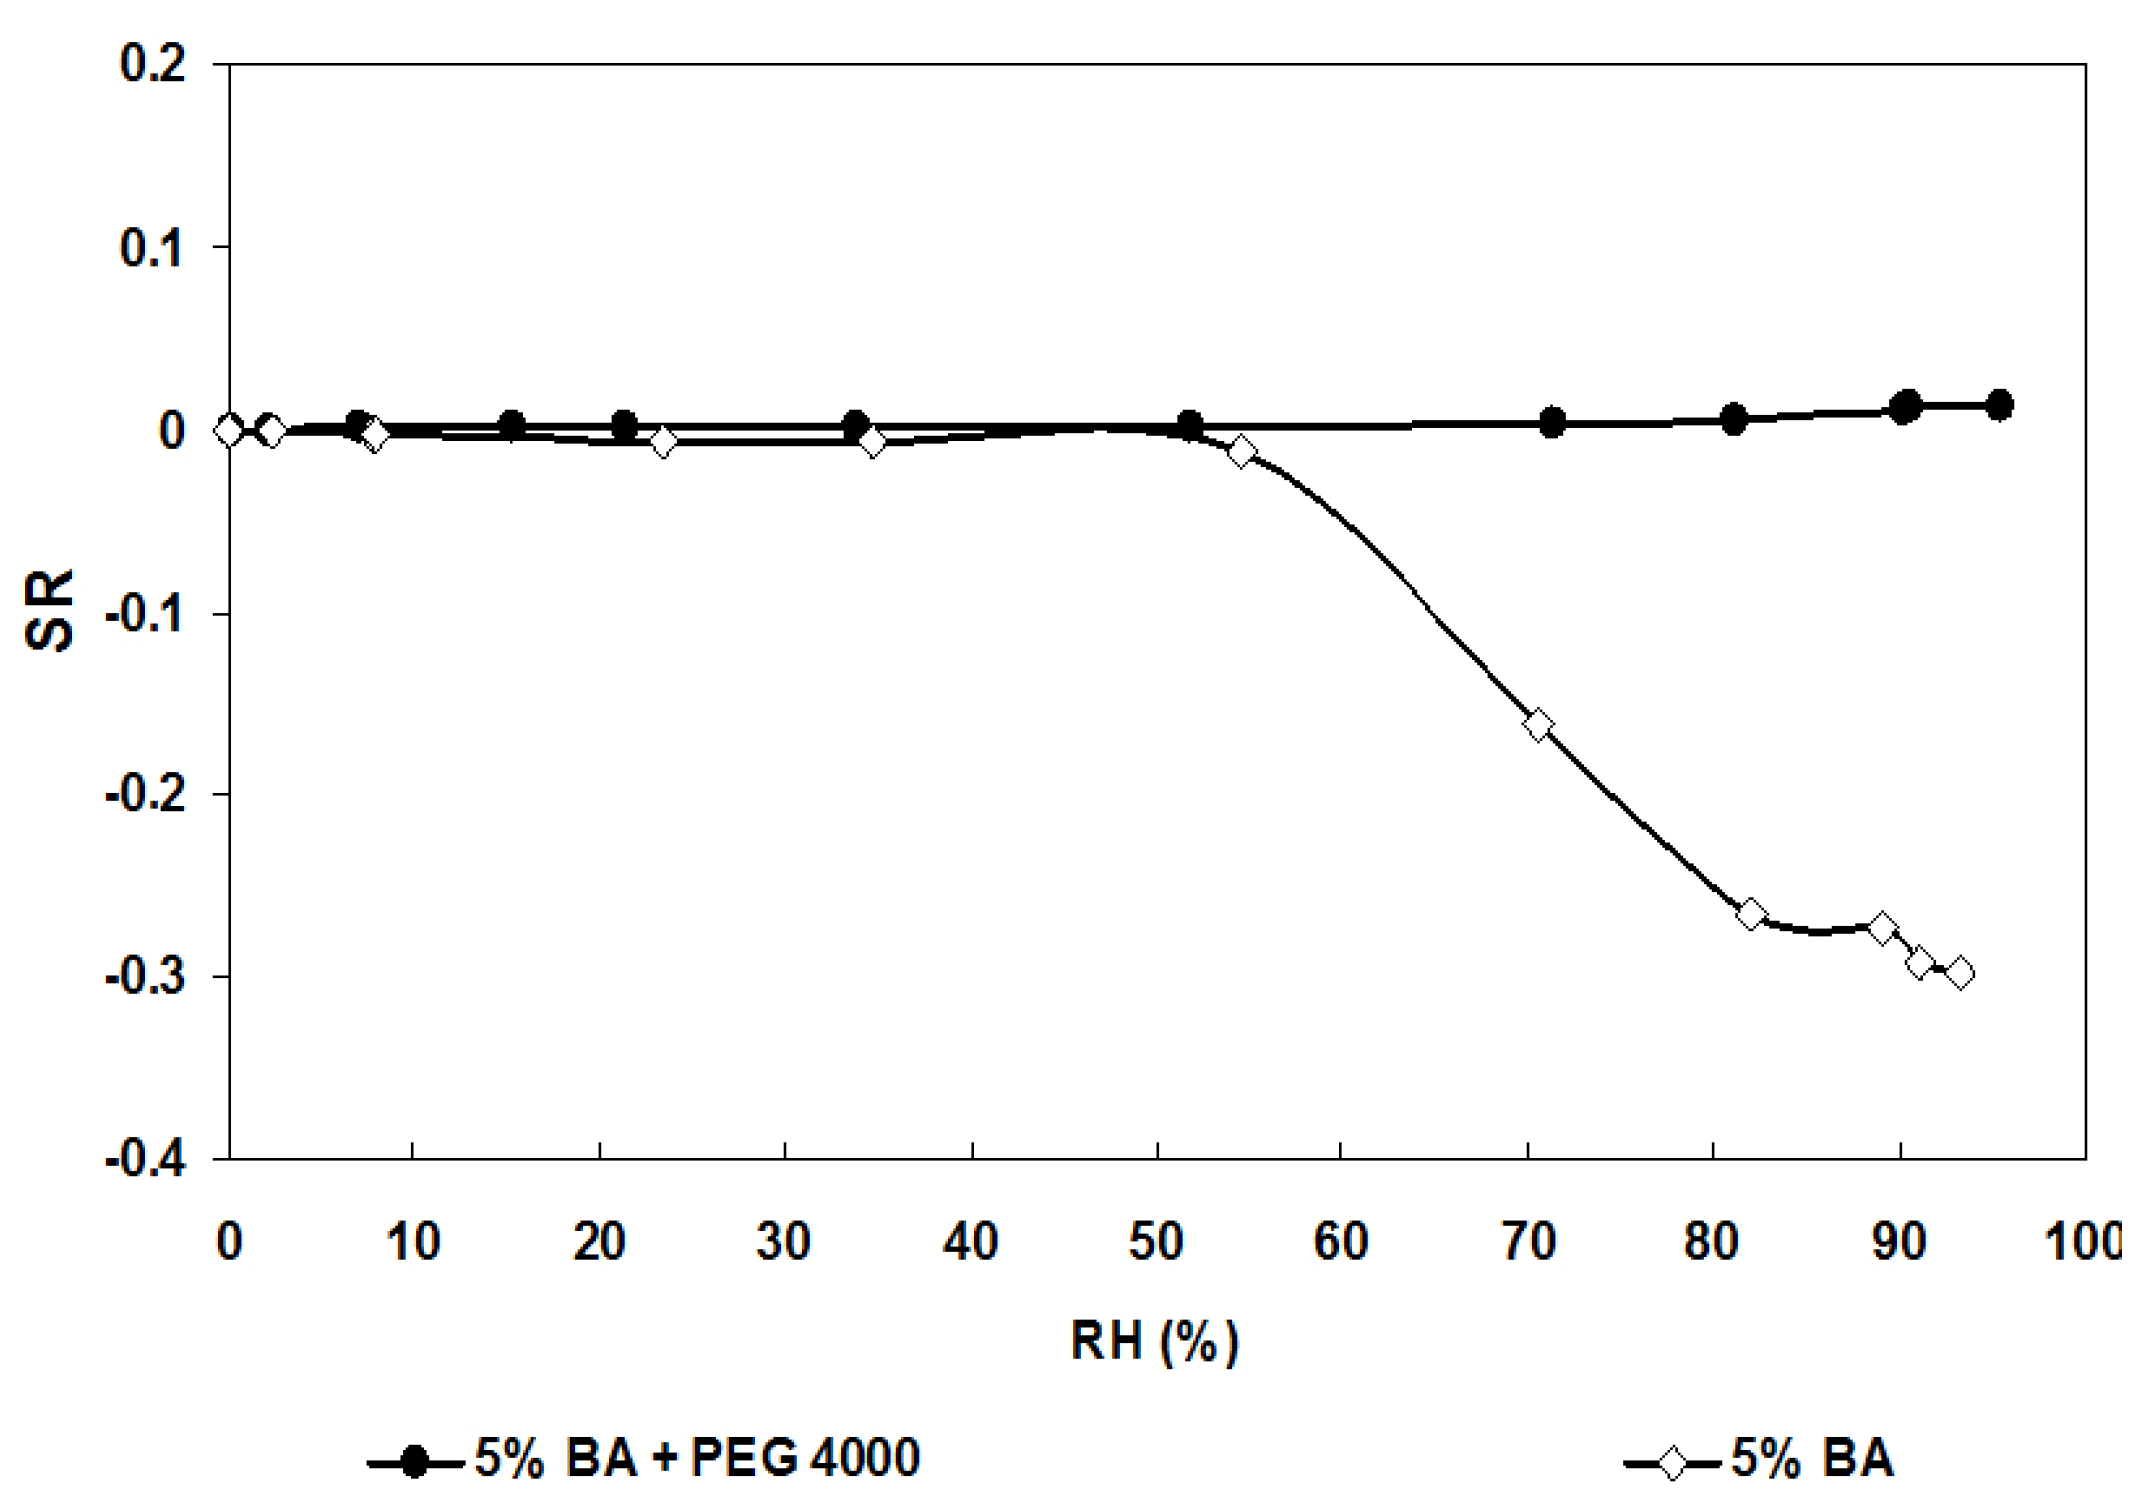
The retained solution was to increase the green density of the pellets by adding polyethylene glycol (PEG 4000) to the doped powder, during the 6 h planetary milling step and prior to uniaxial pressing. The samples were then sintered at 1300 °C and characterized like the previous ones. A significant increase of the density was then observed after PEG addition and sintering on the 5% BA composition (Table 2).
Interdigitated gold electrodes were screen-printed on the surface of the different samples and the sensors humidity responses were studied in the range 0%–100% relative humidity (RH) at 20 °C. Humidity measurements were realized every three minutes.
As an illustration of the influence of density regarding the humidity sensitivity the electrical response of the 5% BA samples with and without PEG 4000 under water vapor (Figure 4) shows that the pellet with PEG (R = 1400 Ω) is quite insensitive to humidity. This result validates our choice to increase the density of the samples if we consider humidity as an interfering gas regarding nitrogen dioxide sensitivity.
| Sample | Geometrical density (g/cm3) | Relative density (%) |
|---|---|---|
| 5% BA | 4.32 ± 0.05 | 83.0 |
| 5% BA + PEG 4000 | 5.08 ± 0.05 | 95.0 |
Figure 4.
Humidity sensors (5% BA) response after 3 min of valve switch in function of RH, at 20 °C, for the samples fired at 1300 °C, with and without PEG 4000 addition.
Figure 4.
Humidity sensors (5% BA) response after 3 min of valve switch in function of RH, at 20 °C, for the samples fired at 1300 °C, with and without PEG 4000 addition.

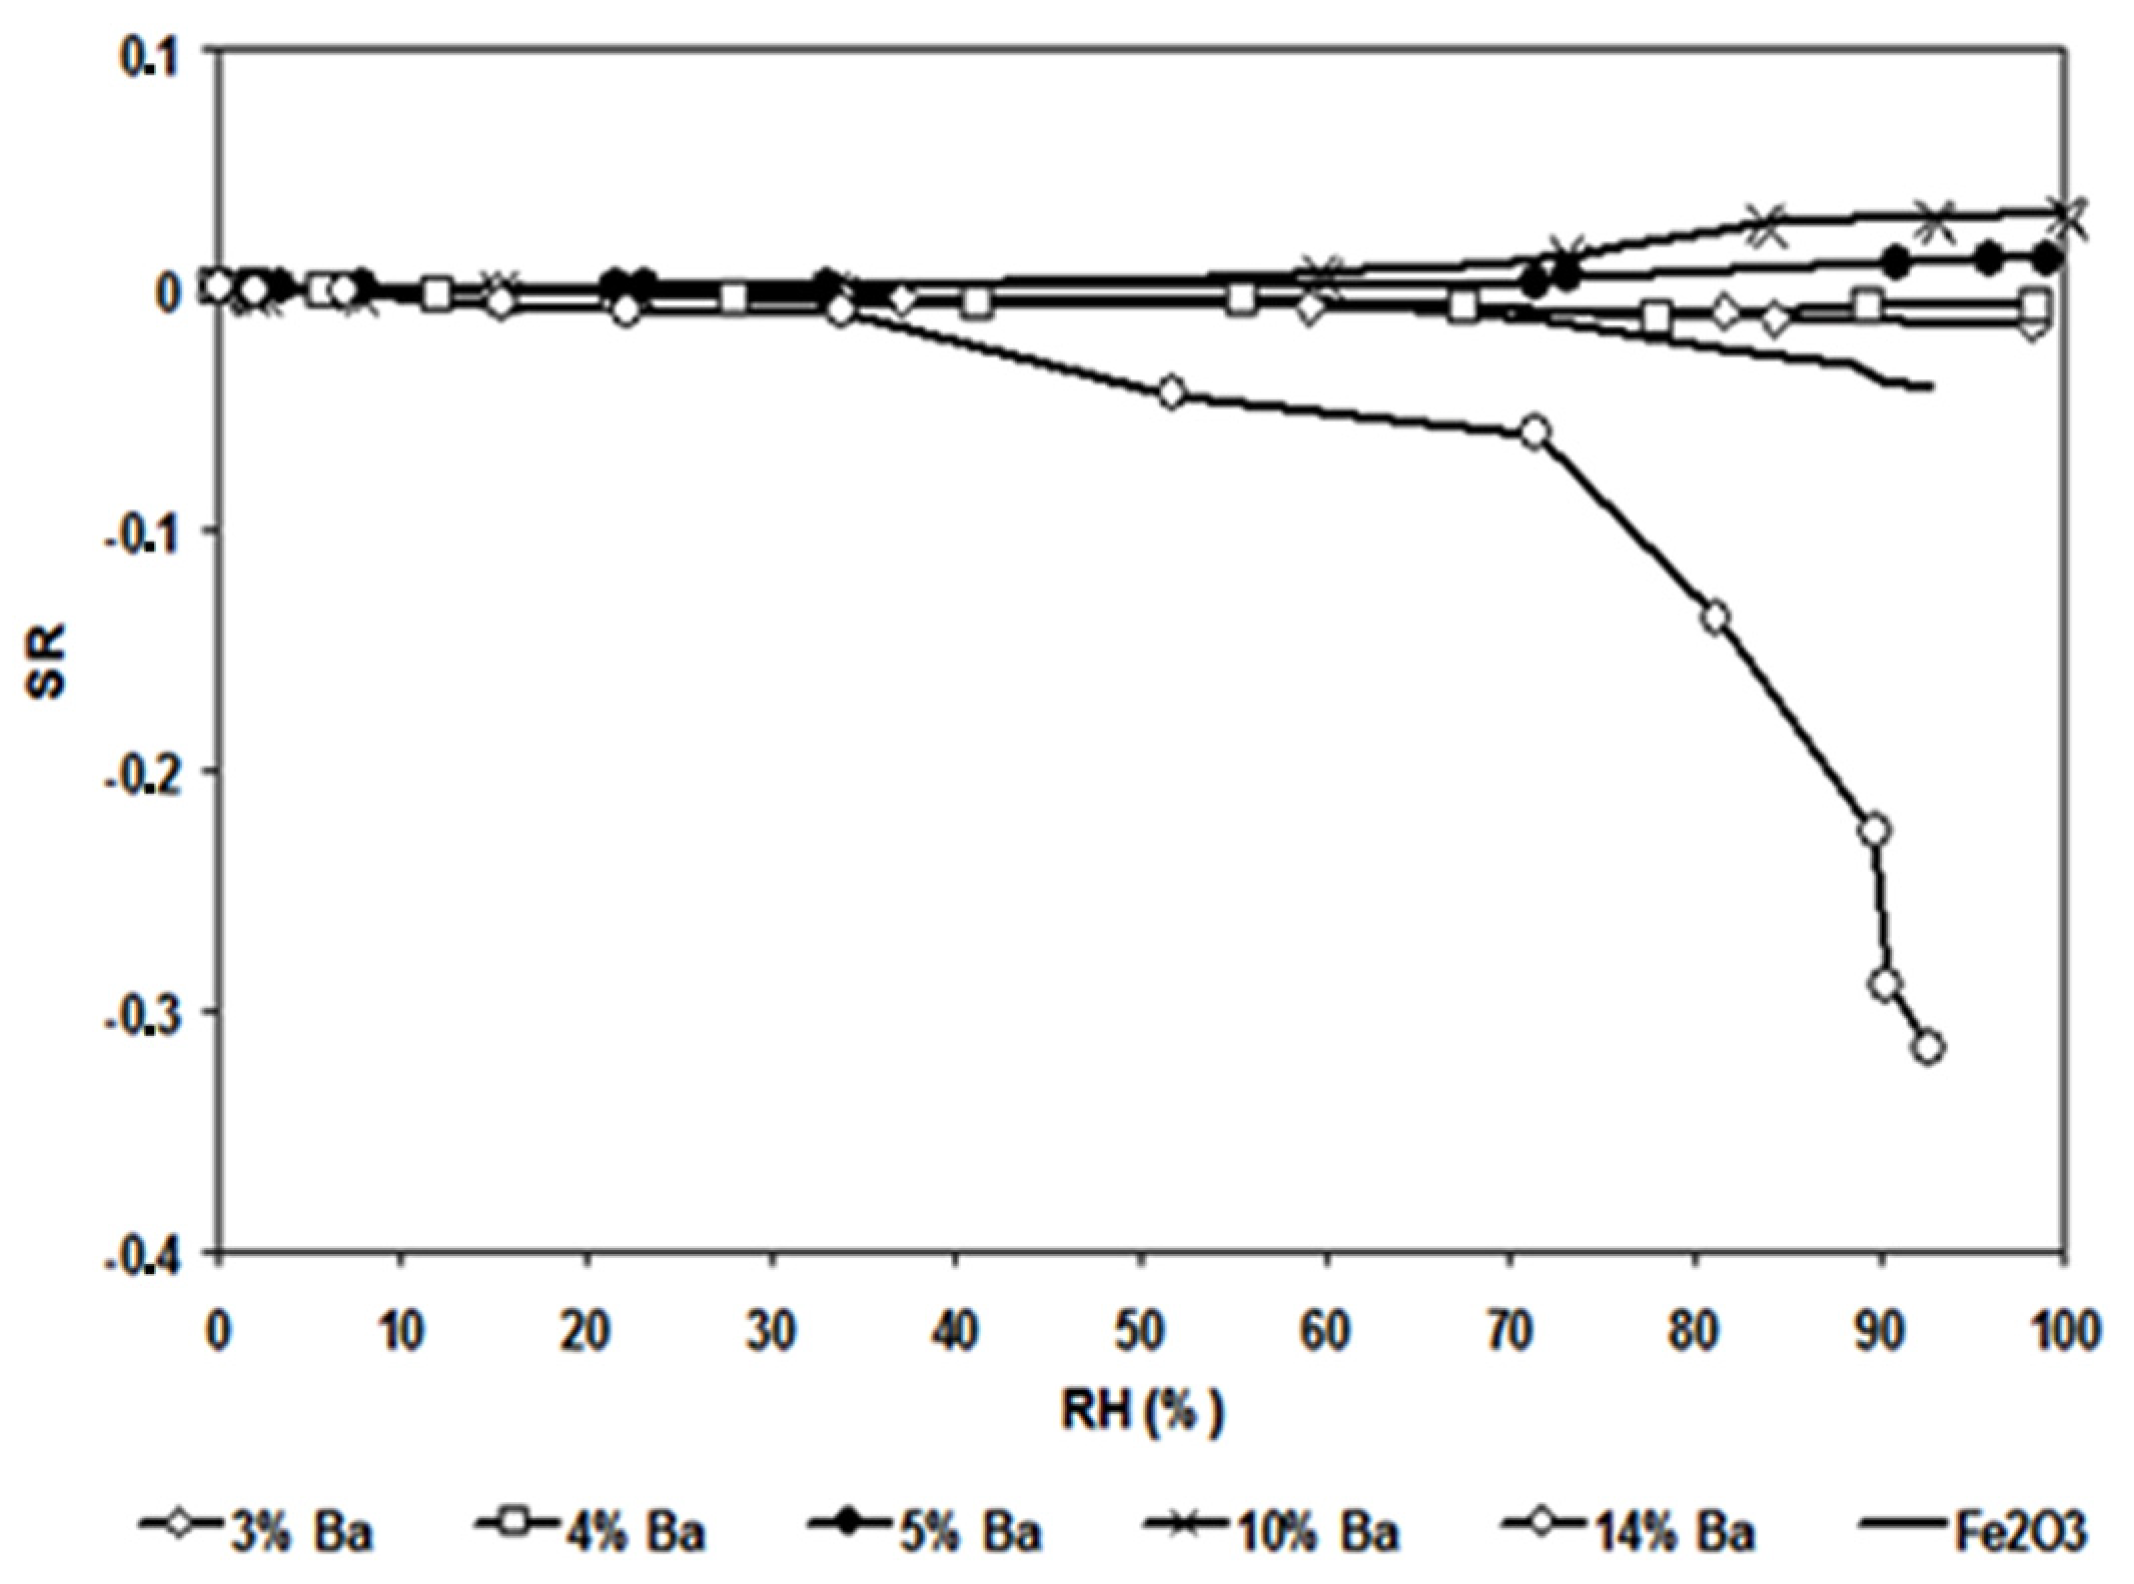
Subsequently, all the samples responses were characterized under humidity (Figure 5) at room temperature. They show no sensitivity to water vapor, with the exception of the 10% BA sample which exhibits a slightly increase of the SR above 70 RH % and the 14% BA sample for which an increase of the sensor response (negative values) is evidenced above 35 RH %.
3.3. Electrical Study
Impedance measurements were performed in dry synthetic air (20% O2) and under argon (<2 ppm O2), between 100 and 700 °C, in the 5 Hz–13 MHz frequency range.
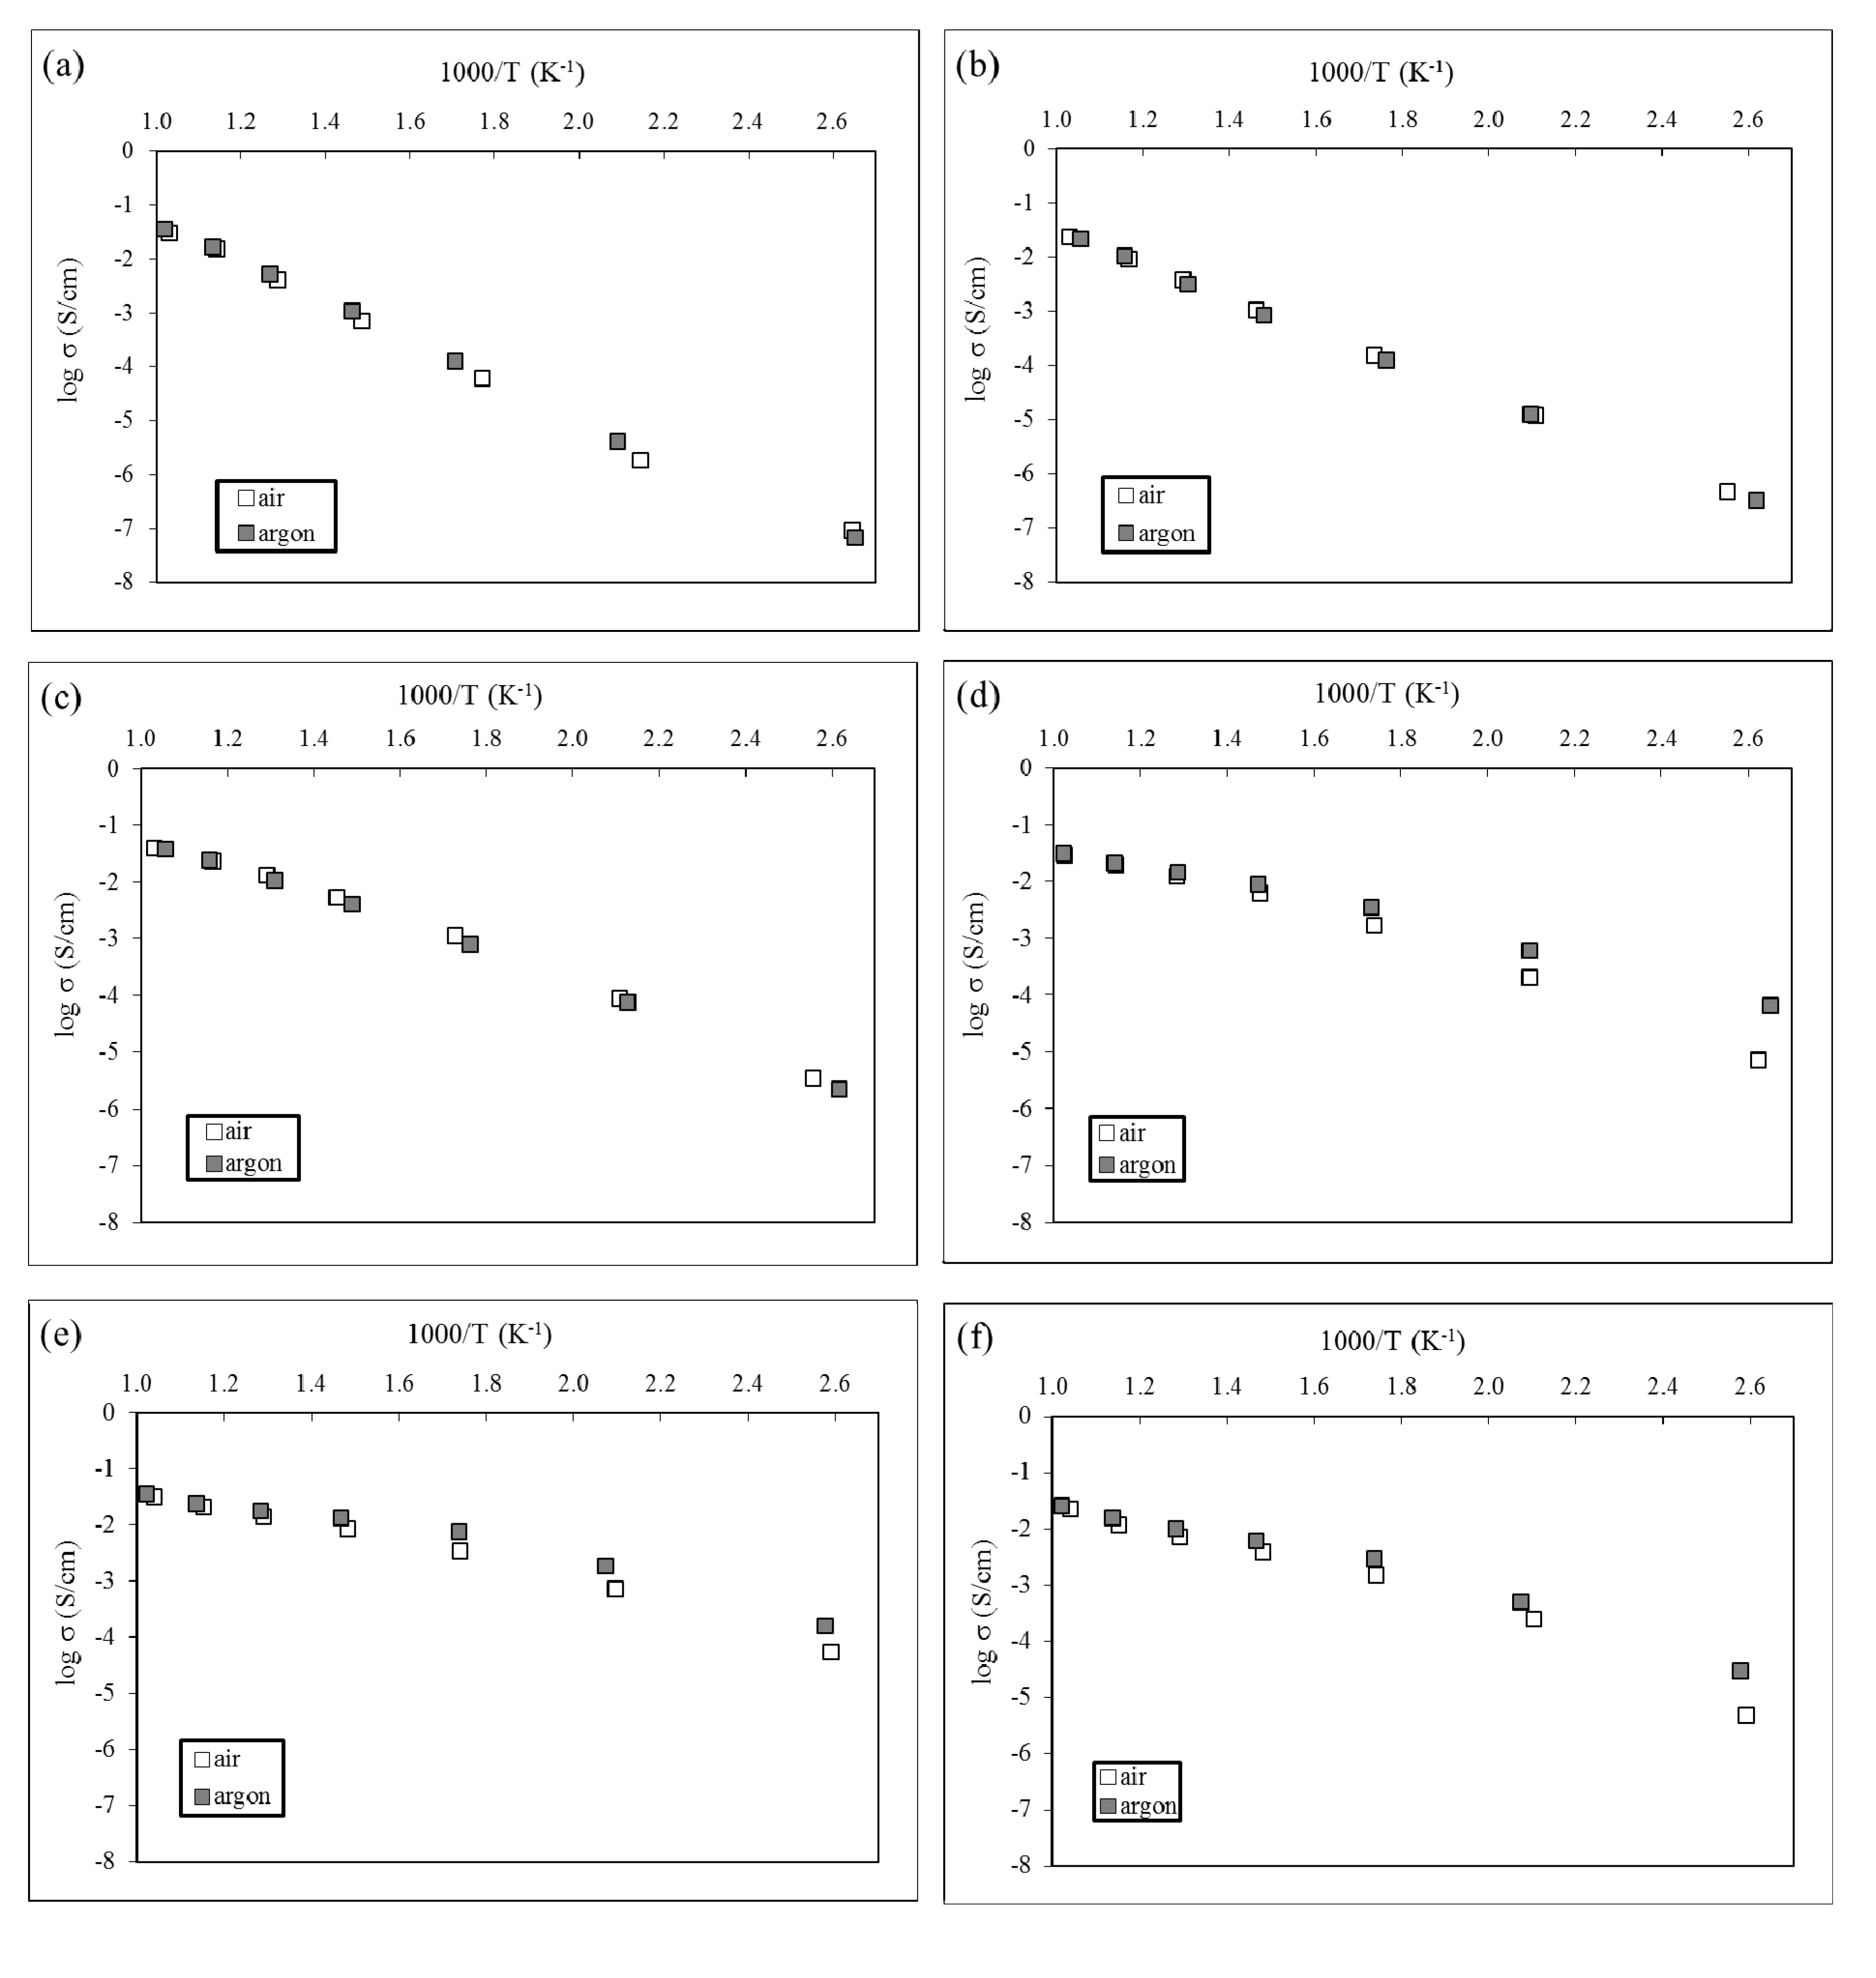
The conductivities evolutions in Arrhenius representations of pure hematite and the 5 compositions of barium-doped hematite samples showed that the samples behaved as semiconductors. Figure 6 shows two types of electrical behaviors. Pure hematite as well as 3% BA and 4% BA samples present a linear dependence of the conductivity with superimposition of the measurements under air and argon.
The n-type semiconductor behavior of hematite is clearly reported in literature [26]. Oxygen vacancies () can be produced by heating this material following the disorder Equation (3) [27]:
Figure 5.
Humidity sensors response of various barium-doped hematite samples, after 3 min of valve switch, in function of relative humidity (RH), at 20 °C.
Figure 5.
Humidity sensors response of various barium-doped hematite samples, after 3 min of valve switch, in function of relative humidity (RH), at 20 °C.

Gardner et al. [28] measured the oxygen deficit resulting from this equilibrium shift. Considering this structural disorder and the independence of the hematite conductivity regarding the oxygen partial pressure shown in the Figure 6a, we can conclude that this material is an intrinsic semiconductor [27,29]. The large value of activation energy measured in this work (Table 3) is the consequence of our experimental procedure where samples were sintered at 1300 °C and cooled under air laboratory. Under those conditions, the oxygen vacancies created during the heat treatment disappear by re-oxidation [28] and hematite becomes a slight n-type semiconductor [30]. The value of 0.71 eV obtained in the present work is close to the one reported by Gardner [28].
Table 3.
Activation energies calculated from the linear regions of the Figure 6.
| Sample | Activation Energy (eV) | |||
|---|---|---|---|---|
| Below 500 °C | Above 500 °C | |||
| Argon | Air | Argon | Air | |
| H | 0.71 | |||
| 3% BA | 0.61 | |||
| 4% BA | 0.54 | |||
| 5% BA | 0.36 | 0.51 | 0.27 | |
| 10% BA | 0.35 | 0.40 | 0.26 | |
| 14% BA | 0.43 | 0.52 | 0.34 | |
Figure 6.
Arrhenius plots in air and argon of samples: (a) H; (b) 3% BA; (c) 4% BA; (d) 5% BA; (e) 10% BA; (f) 14% BA.
Figure 6.
Arrhenius plots in air and argon of samples: (a) H; (b) 3% BA; (c) 4% BA; (d) 5% BA; (e) 10% BA; (f) 14% BA.

In the case of 5% BA, 10% BA and 14% BA samples, the Figure 6 exhibits two linear regions, below and above 500 °C (1000/T = 1.3 K−1): no influence of the oxygen partial pressure above 500 °C is observed, while a strong influence of the oxygen partial pressure below 500 °C is evidenced. The conductivities increase as the oxygen partial pressure decreases (the conductivities under argon are greater than the conductivities under air). This corresponds to the behavior of an n-type extrinsic semiconductor.
Kim et al. [27] suggested a doping process with reduction of a part of Fe(III) to Fe(II), oxygen vacancies formation and concentration increase of negative charge carriers (electrons). These authors measured the electrical conductivity of pure and CdO-α-Fe2O3 system with various mol % of CdO in the 300–1300 °C temperature range and 10−9–10−1 atm oxygen partial pressure range. They also suggested that the semiconductivity became intrinsic for temperatures above 500 °C. We observe the same phenomenon and the activation energies deduced from the Figure 6d–f are close to the values obtained by Gardner et al. [28] on pure hematite in the same temperature range (0.1 to 0.3 eV).
The increase of barium percentages in hematite is correlated with the increase of the conductivity for the different materials. It is particularly evident since we compare the Figure 6a,f. The XRD analyses presented earlier underlined the presence of two crystalline phases: α-Fe2O3 (hematite) and BaFe12O19 (barium hexaferrite). If we consider that the Figure 6a represents the pure hematite electrical behavior and the Figure 6f the pure barium hexaferrite one, we can conclude that this latter phase is a better electronic conductor than the hematite phase. Considering now the intermediate compositions presented in the Figure 6b–e, it is noticeable that the transition of electrical behavior observed between the Figure 6c,d corresponds, respectively, to a composition transition between 21 to 36 wt % of the most conductive phase (barium hexaferrite) in the material. Therefore, for a composition below 36 wt % of barium hexaferrite, hematite is the main crystalline phase and the materials exhibit the intrinsic semiconducting behavior observed in the Figure 6a–c. The Figure 6c,d define a percolation threshold of the barium hexaferrite crystalline phase in the hematite matrix. Thus, the materials which composition exceeds 36 wt % of this latter phase, exhibit the n type extrinsic semiconducting behavior observed on the Figure 6d–f.
3.4. NO2 Sensitivity
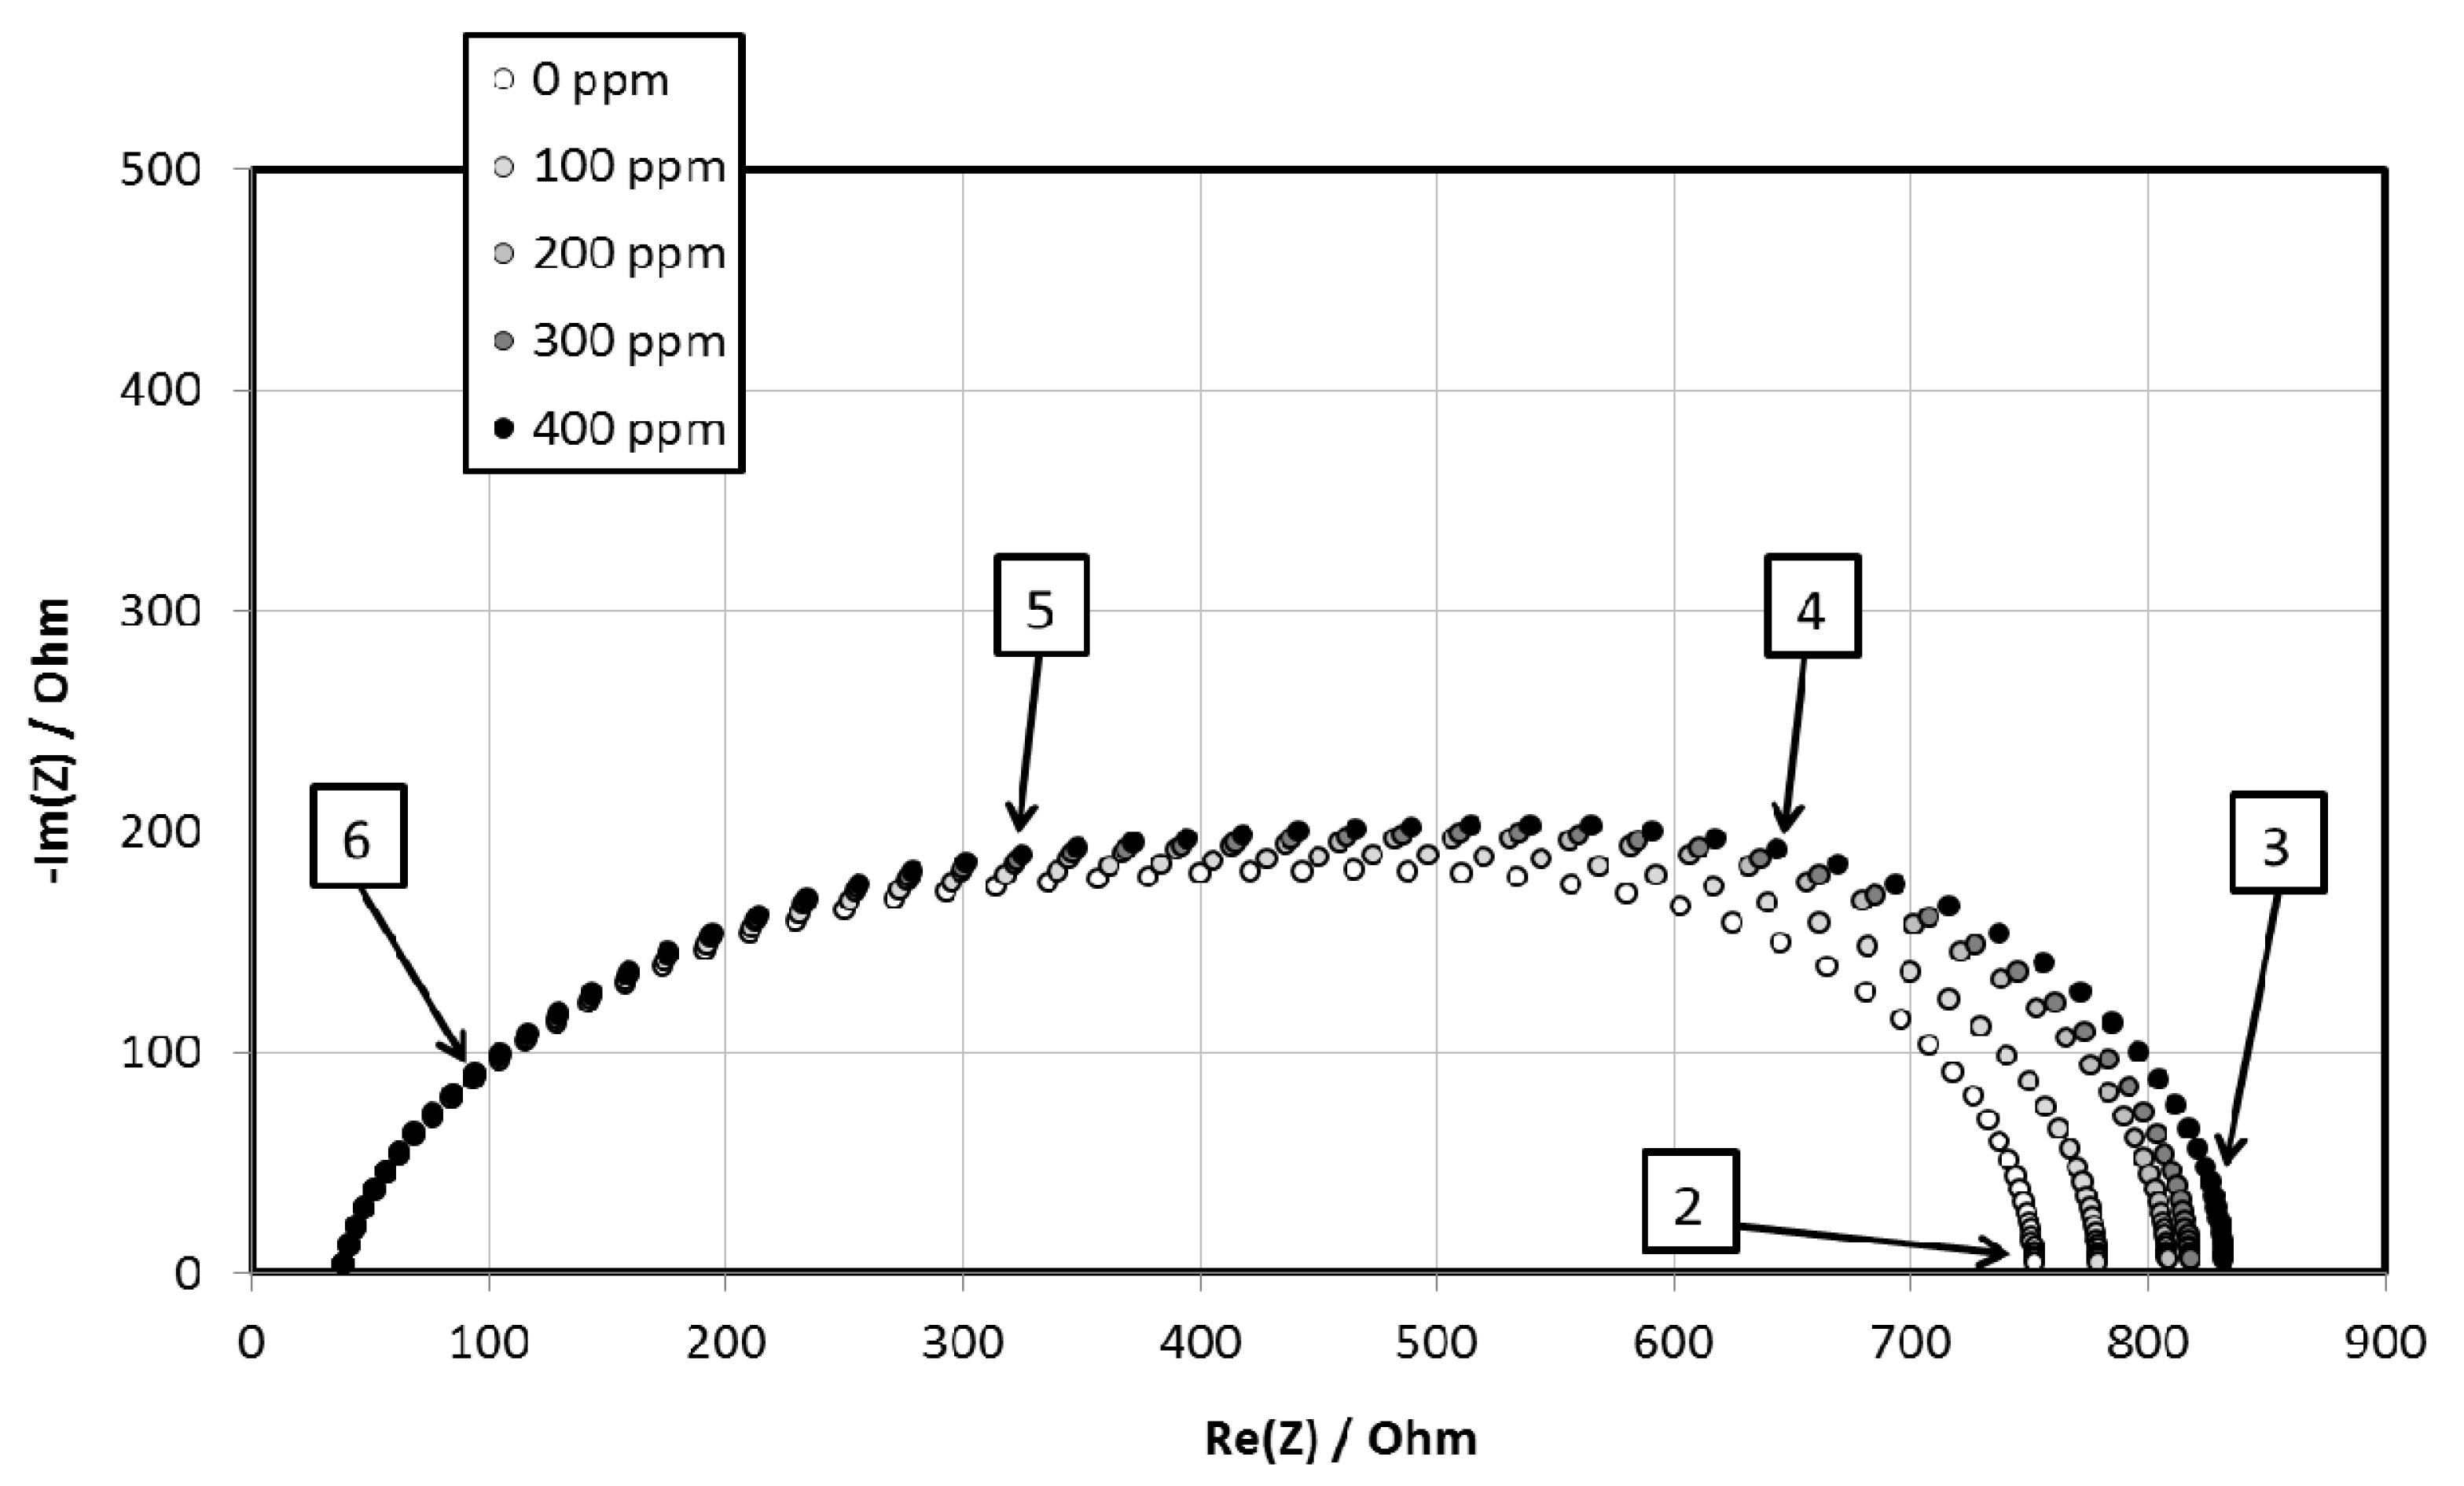
The response to NO2 was investigated in a mixed flux of helium and N2/NO2 under a flow rate of 40 mL/min (0–500 ppm of NO2), between 60 and 350 °C, in the 5 Hz–13 MHz frequency range. As an example, Figure 7 represents the evolution of impedance spectra regarding the NO2 partial pressure.
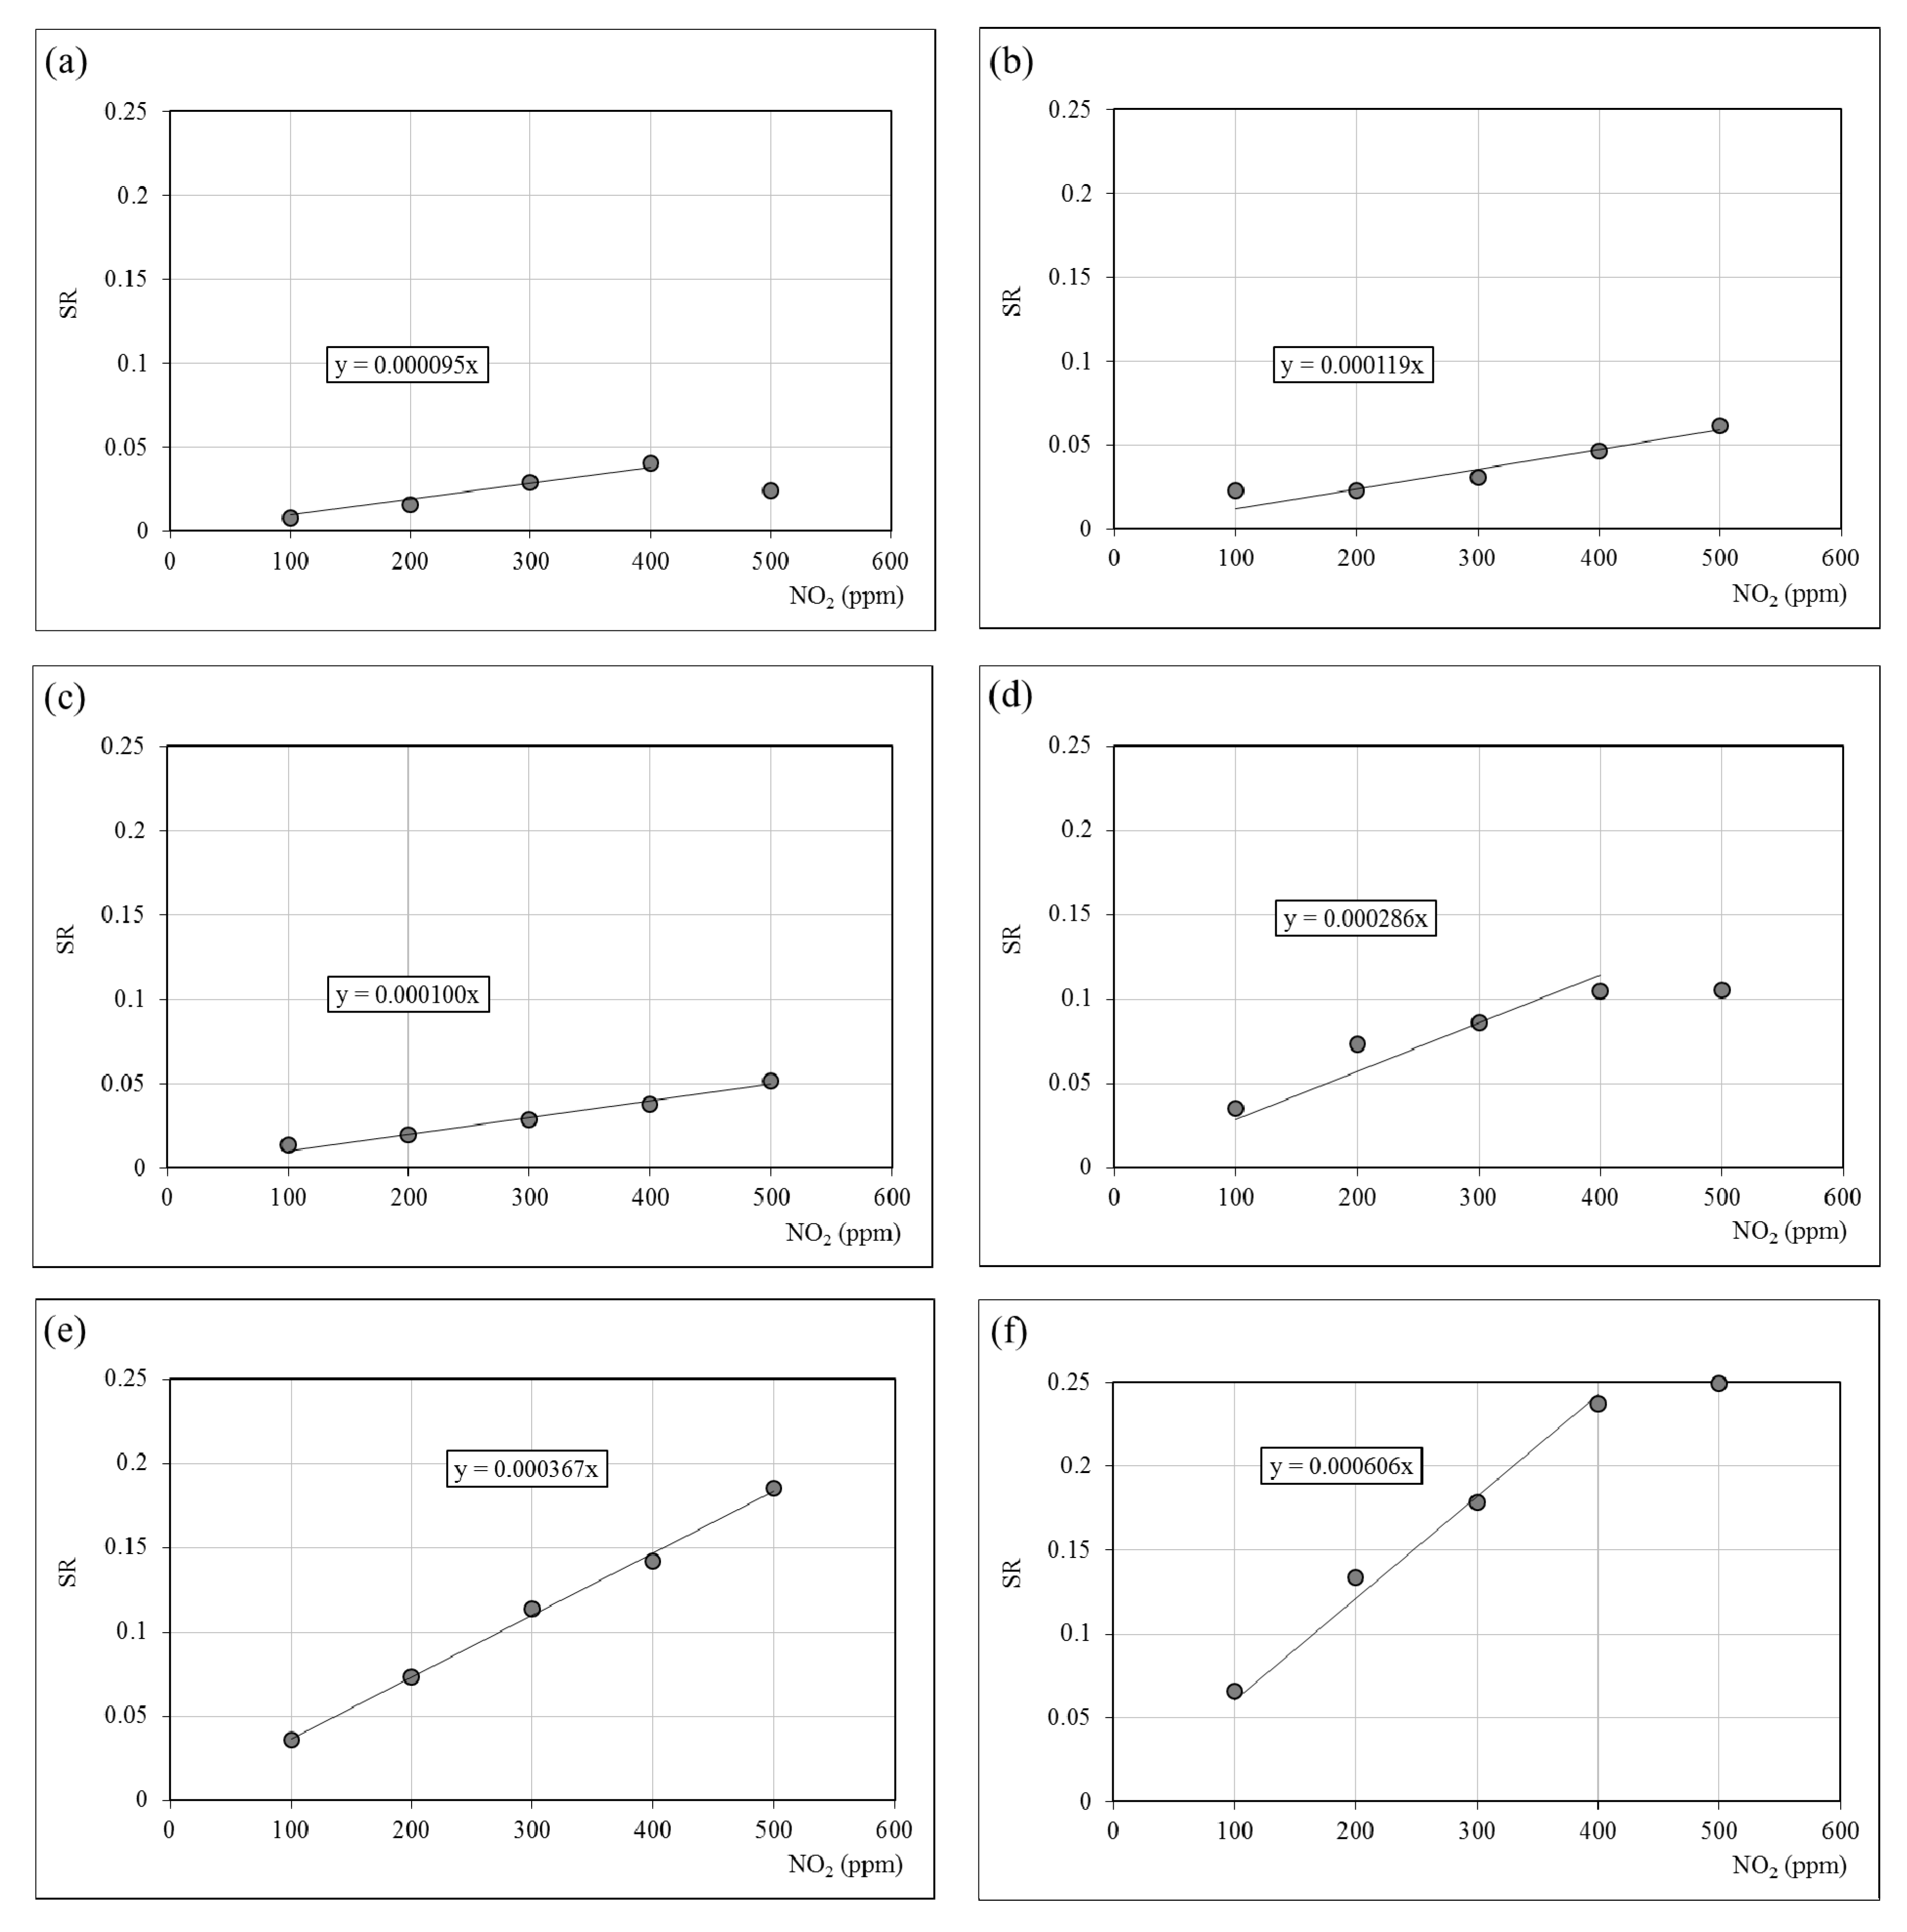
The gas composition clearly influences the low frequency impedance. Consequently the values of SR were calculated from resistance measured at 1000 Hz. Figure 8 represents the evolution of the SR (PNO2) of pure and doped hematite at 200 °C. We observed that for temperatures above 300 °C most of the materials exhibited a poor NO2 sensitivity while for temperatures below 200 °C the impedance of most of them were too high (and also the uncertainties) to permit a quantitative determination of the resistance. Therefore, considering the highest sensitivity S (slope of the representation SR (PNO2) gathered in the Table 4) and the lowest uncertainties, the optimal working temperature is estimated to 200 °C [16,31,32].
Figure 7.
Impedance spectra evolution of 5% BA sample at 200 °C for various nitrogen oxide partial pressures.
Figure 7.
Impedance spectra evolution of 5% BA sample at 200 °C for various nitrogen oxide partial pressures.
| Sample | S (ppm−1) | R(PNO2→0) (Ohm) |
|---|---|---|
| H | 0.95 × 10⁻⁴ | 115,200 |
| 3% BA | 1.19 × 10⁻⁴ | 11,485 |
| 4% BA | 1.00 × 10⁻⁴ | 3943 |
| 5% BA | 2.86 × 10⁻⁴ | 747 |
| 10% BA | 3.67 × 10⁻⁵ | 695 |
| 14% BA | 6.06 × 10⁻⁴ | 380 |
In the continuously regenerating diesel particulate filter (CRDPF) technology, NO2 is used to combust the soot collected in a particulate filter because it is a stronger oxidant than O2, promoting low temperature oxidation of soot in the range 200–500 °C [33]. This oxidation of carbon by NO2 is then achievable under normal driving conditions, particularly in heavy duty engine applications [34]. However, typically, NO2 is 5% to 15% of the total NOx in the diesel exhaust, but oxidation catalysts like Pt could oxidize NO to NO2 increasing NO2 concentrations to 50% of the total NOx, in the temperature range of 300–350 °C [33]. Then, emissions of NOx can be higher than 300 ppm [33,34], in function of the driving conditions, therefore, the materials studied in this work could be proposed as potential NOx sensors for diesel exhaust gases.
All the materials present a resistance increase with the NO2 partial pressure. This result has already been observed with hematite and various ferrites [16,32,35]. The 3% BA and 4% BA samples (Figure 8b,c) exhibit a SR evolution close to the pure hematite one (Figure 8a). Such a similarity was observed in the electrical study reported in the present paper. Otherwise, the Figure 8d–f show that beyond the percolation threshold described previously, the sensitivity to NO2 increases with the barium hexaferrite content in the sample. Nevertheless, considering the results of humidity sensitivity presented in the present paper the 5% BA sample seems to be the best compromise regarding the highest NO2 sensitivity with the lowest humidity interference.
Figure 8.
Sensor response (SR) evolution at 200 °C on the samples (a) H; (b) 3% BA; (c) 4% BA; (d) 5% BA; (e) 10% BA; (f) 14% BA in 0–500 ppm NO2. Resistance measured at 1000 Hz.
Figure 8.
Sensor response (SR) evolution at 200 °C on the samples (a) H; (b) 3% BA; (c) 4% BA; (d) 5% BA; (e) 10% BA; (f) 14% BA in 0–500 ppm NO2. Resistance measured at 1000 Hz.
In an n-type semiconductor, NO2 does not react with pre-adsorbed oxygen and resistance changes occur by a direct chemisorption process [36]. A series of reactions (Equations (4)–(8)) giving nitrates and nitrites is proposed in reference [37]:
NO2 + e− (c.b.) ↔ NO2−
NO2 + VO+ ↔ NO2− + VO2+
2NO2 + O2− + e− (c.b.) ↔ 2NO3−
2NO2 + O2− + VO+ (c.b.) ↔ 2NO3− + VO+
NO2 + O− ↔ NO3−
In surface reactions (4) to (7), electrons from the conduction band (c.b.) are trapped when surface species are formed, but not in reaction (8). If nitrates are formed by the last mechanism, a further equilibrium has to be considered, that is to say NO3− dissociation (Equations (9)–(10)):
when O− pressure increases, the resistance of the material also increases in an n-type semiconductor, as experimentally observed.
NO3− + e− (c.b.) ↔ NO + 2O−
NO3− + VO+ ↔ NO + 2O− + VO2+
4. Conclusions
Ba-doped hematite were investigated as NO2 sensing materials. Electrical characterizations were performed by ac impedance spectroscopy under various temperatures and gas atmospheres.
Pure hematite, 3 wt % and 4 wt % barium-doped hematite exhibit an intrinsic semiconducting behavior. They also show a poor NO2 sensitivity. 5, 10 and 14 wt % barium-doped hematite exhibit an n-type extrinsic semiconducting behavior.
They are also good candidates for NO2 detection. The nitrogen dioxide sensitivity increases with the barium hexaferrite content in the material. Finally, the best compromise regarding the highest NO2 sensitivity with the lowest humidity interference is the 5 wt % barium-doped hematite.
The electrical study also underlines a percolation threshold of the barium hexaferrite crystalline phase in the hematite matrix. The value was estimated to 36 wt % barium hexaferrite.
Acknowledgments
C. Baroni is grateful to Piedmont Region for partial financial support of her Ph.D grant, to INSTM (Inter-University National Consortium on Material Science and Technology), Italy and to the Italian Ministry of Foreign Affairs in collaboration with French Government.
Conflicts of Interest
The authors declare no conflict of interest.
References
- The European Parliament and the Council of the European Union. Directive 2008/50/EC of the European Parliament and of the Council of 21 May 2008 on ambient air quality and cleaner air for Europe. Available online: http://eur-lex.europa.eu/LexUriServ/LexUriServ.do?uri=OJ:L:2008:152:0001:0044:EN:PDF (accessed on 22 September 2013).
- The European Commission. Laying down rules for Directives 2004/107/EC and 2008/50/EC of the European Parliament and of the Council as regards the reciprocal exchange of information and reporting on ambient air quality. Available online: http://eur-lex.europa.eu/LexUriServ/LexUriServ.do?uri=OJ:L:2011:335:0086:0106:EN:PDF (accessed on 22 September 2013).
- Kanan, S.M.; El-Kadri, O.M.; Abu-Yousef, I.A.; Kanan, M.C. Semiconducting metal oxide based sensors for selective gas pollutant detection. Sensors 2009, 9, 8158–8196. [Google Scholar] [CrossRef] [PubMed]
- Ivanov, P.; Hubalek, J.; Malysz, K.; Prášek, J.; Vilanova, X.; Llobet, E.; Correig, X. A route toward more selective and less humidity sensitive screen-printed SnO2 and WO3 gas sensitive layers. Sens. Actuators Chem. 2004, 100, 221–227. [Google Scholar] [CrossRef]
- Chung, Y.K.; Kim, M.H.; Um, W.S.; Lee, H.S.; Song, J.K.; Choi, S.C.; Yi, K.M.; Lee, M.J.; Chung, K.W. Gas sensing properties of WO3 thick film for NO2 gas dependent on process condition. Sens. Actuators Chem. 1999, 60, 49–56. [Google Scholar] [CrossRef]
- Lee, D.S.; Han, S.D.; Huh, J.S.; Lee, D.D. Nitrogen oxides-sensing characteristics of WO3-based nanocrystalline thick film gas sensor. Sens. Actuators Chem. 1999, 60, 57–63. [Google Scholar] [CrossRef]
- Ismail, B.; Abaab, M.; Rezig, B. Structural and electrical properties of ZnO films prepared by screen printing technique. Thin Solid Film. 2001, 383, 92–94. [Google Scholar] [CrossRef]
- Yasushi, Y.; Katsuji, Y.; Yumi, M.; Masami, O. A Thick-film NO2 sensor fabricated using Zn–Sn–Sb–O composite material. Jpn. J. Appl. Phys. 2003, 42, 7594–7598. [Google Scholar] [CrossRef]
- Coppedè, N.; Villani, M.; Mosca, R.; Iannotta, S.; Zappettini, A.; Calestani, D. Low temperature sensing properties of a nano hybrid material based on ZnO nanotetrapods and titanyl phthalocyanine. Sensors 2013, 13, 3445–3453. [Google Scholar] [CrossRef] [PubMed]
- Tonezzer, M.; Hieu, N.V. Size-dependent response of single-nanowire gas sensors. Sens. Actuators Chem. 2012, 163, 146–152. [Google Scholar] [CrossRef]
- Ando, M.; Steffes, H.; Chabicovsky, R.; Haruta, M.; Stangl, G. Optical and electrical H2- and NO2-sensing properties of Au/InxOyNz films. IEEE Sens. J. 2004, 4, 232–236. [Google Scholar] [CrossRef]
- Sberveglieri, G.; Benussi, P.; Coccoli, G.; Groppelli, S.; Nelli, P. Reactively sputtered indium tin oxide polycrystalline thin films as NO and NO2 gas sensors. Thin Solid Film. 1990, 186, 349–360. [Google Scholar] [CrossRef]
- Siciliano, T.; Giulio, M.D.; Tepore, M.; Filippo, E.; Micocci, G.; Tepore, A. Room temperature NO2 sensing properties of reactivity sputtered TeO2 thin films. Sens. Actuators Chem. 2009, 137, 644–648. [Google Scholar]
- Suehiro, J.; Zhou, G.; Imakiire, H.; Ding, W.; Hara, M. Controlled fabrication of carbon nanotube NO2 gas sensor using dielectrophoretic impedance measurement. Sens. Actuators Chem. 2005, 108, 398–403. [Google Scholar] [CrossRef]
- Zhuiykov, S.; Ono, T.; Yamazoe, N.; Miura, N. High-temperature NOx sensors using zirconia solid electrolyte and zinc-family oxide sensing electrode. Solid State Ion. 2002, 152–153, 801–807. [Google Scholar] [CrossRef]
- Sun, H.T.; Cantalini, C.; Faccio, M.; Pelino, M. NO2 gas sensitivity of sol-gel-derived α-Fe2O3 thin films. Thin Solid Film. 1995, 269, 97–101. [Google Scholar] [CrossRef]
- Cantalini, C.; Sun, H.T.; Faccio, M.; Ferri, G.; Pelino, M. Niobium-doped α-Fe2O3 semiconductor ceramic sensors for the measurement of nitric oxide gases. Sens. Actuators Chem. 1995, 25, 673–677. [Google Scholar] [CrossRef]
- Tulliani, J.-M.; Baroni, C.; Lopez, C.; Dessemond, L. New NOx sensors based on hematite doped with alkaline and alkaline-earth elements. J. Eur. Ceram. Soc. 2011, 31, 2357–2364. [Google Scholar] [CrossRef]
- Korotcenkov, G. Metal oxides for solid-state gas sensors: What determines our choice? Mater. Sci. Eng. 2007, 139, 1–23. [Google Scholar] [CrossRef]
- Barsan, N.; Weimar, U. Understanding the fundamental principles of metal oxide based gas sensors; the example of CO sensing with SnO2 sensors in the presence of humidity. J. Phys. Condens. Matter 2003, 15, R813–R839. [Google Scholar] [CrossRef]
- Tulliani, J.M.; Bonville, P. Influence of the dopants on the electrical resistance of hematite-based humidity sensors. Ceram. Int. 2005, 31, 507–514. [Google Scholar] [CrossRef]
- Esteban-Cubillo, A.; Tulliani, J.M.; Pecharromán, C.; Moya, J.S. Iron-oxide nanoparticles supported on sepiolite as a novel humidity sensor. J. Eur. Ceram. Soc. 2007, 27, 1983–1989. [Google Scholar] [CrossRef]
- Nenov, T.G.; Yordanov, S.P. Ceramic Sensor: Technology and Applications; CRC PressTechnomic Publishing Company, Inc.: Lancaster, PA, USA, 1996. [Google Scholar]
- Traversa, E. Ceramic sensors for humidity detection: the state-of-the-art and future developments. Sens. Actuators Chem. 1995, 23, 135–156. [Google Scholar]
- Traversa, E.; Bearzotti, A. Humidity sensitive electrical properties of dense ZnO with non-ohmic electrode. J. Ceram. Soc. Jpn. 1995, 103, 11–15. [Google Scholar] [CrossRef]
- Santilli, C.V.; Bonnet, J.P.; Dordor, P.; Onillion, M.; Hagenmuller, P. Influence of structural defects on the electrical properties of α-Fe2O3 ceramics. Ceram. Int. 1990, 16, 25–32. [Google Scholar] [CrossRef]
- Kim, K.H.; Lee, S.H.; Choi, J.S. Electrical conductivity of pure and doped α-ferric oxides. J. Phys. Chem. Solids 1985, 46, 331–338. [Google Scholar] [CrossRef]
- Gardner, R.F.G.; Sweett, F.; Tanner, D.W. The electrical properties of alpha ferric oxide-II. Ferric oxide of high purity. J. Phys. Chem. Solids 1963, 24, 1183–1196. [Google Scholar] [CrossRef]
- Chang, R.H.; Wagner, J.B. Direct-current conductivity and iron tracer diffusion in hematite at high temperatures. J. Am. Ceram. Soc. 1972, 55, 211–213. [Google Scholar] [CrossRef]
- Stone, H.E.N. Electrical conductivity and sintering in iron oxides at high temperatures. J. Mater. Sci. 1968, 3, 321–325. [Google Scholar] [CrossRef]
- Han, J.S.; Davey, D.E.; Mulcahy, D.E.; Yu, A.B. Effect of pH value of the precipitation solution on the CO sensitivity of α-Fe2O3. Sens. Actuators Chem. 1999, 61, 83–91. [Google Scholar] [CrossRef]
- Ivanovskaya, M.; Gurlo, A.; Bogdanov, P. Mechanism of O3 and NO2 detection and selectivity of the In2O3 sensors. Sens. Actuators Chem. 2001, 77, 264–267. [Google Scholar] [CrossRef]
- Liu, Z.; Ge, Y.; Tan, J.; He, C.; Shah, A.N.; Ding, Y.; Yu, L.; Zhao, W. Impacts of continuously regenerating trap and particle oxidation catalyst on the NO2 and particulate matter emissions emitted from diesel engine. J. Environ. Sci. 2012, 24, 624–631. [Google Scholar] [CrossRef]
- Liu, Z.; Shah, A.N.; Ge, D.Y.; Tan, J.; Jiang, L.; Yu, L.; Zhao, W.; Wang, C.; Zeng, T. Effects of continuously regenerating diesel particulate filters on regulated emissions and number-size distribution of particles emitted from a diesel engine. J. Environ. Sci. 2011, 23, 798–807. [Google Scholar] [CrossRef]
- Aono, H.; Hirazawa, H.; Naohara, T.; Maehara, T. Surface study of fine MgFe2O4 ferrite powder prepared by chemical methods. Appl. Surf. Sci. 2008, 254, 2319–2324. [Google Scholar] [CrossRef]
- Berger, O.; Hoffmann, T.; Fischer, W.-J.; Melev, V. Tungsten-oxide thin films as a novel materials with high sensitivity to NO2, O3, and H2S. Part II: Application as gas sensors. J. Mater. Sci. Mater. Electron. 2004, 15, 483–493. [Google Scholar] [CrossRef]
- Chiorino, A.; Ghiotti, G.; Prinetto, F.; Carotta, M.C.; Gnani, D.; Martinelli, G. Preparation and characterization of SnO2 and MoOx–SnO nanosized powders for thick film gas sensors. Sens. Actuators Chem. 1999, 58, 338–349. [Google Scholar] [CrossRef]
© 2013 by the authors; licensee MDPI, Basel, Switzerland. This article is an open access article distributed under the terms and conditions of the Creative Commons Attribution license (http://creativecommons.org/licenses/by/3.0/).
Share and Cite
MDPI and ACS Style
Lopez, C.; Baroni, C.; Tulliani, J.-M. Ba-Doped Iron Oxide as a New Material for NO2 Detection. Materials 2013, 6, 4801-4816. https://doi.org/10.3390/ma6104801
AMA Style
Lopez C, Baroni C, Tulliani J-M. Ba-Doped Iron Oxide as a New Material for NO2 Detection. Materials. 2013; 6(10):4801-4816. https://doi.org/10.3390/ma6104801
Chicago/Turabian StyleLopez, Christian, Chiara Baroni, and Jean-Marc Tulliani. 2013. "Ba-Doped Iron Oxide as a New Material for NO2 Detection" Materials 6, no. 10: 4801-4816. https://doi.org/10.3390/ma6104801