2. Results and Discussion
In
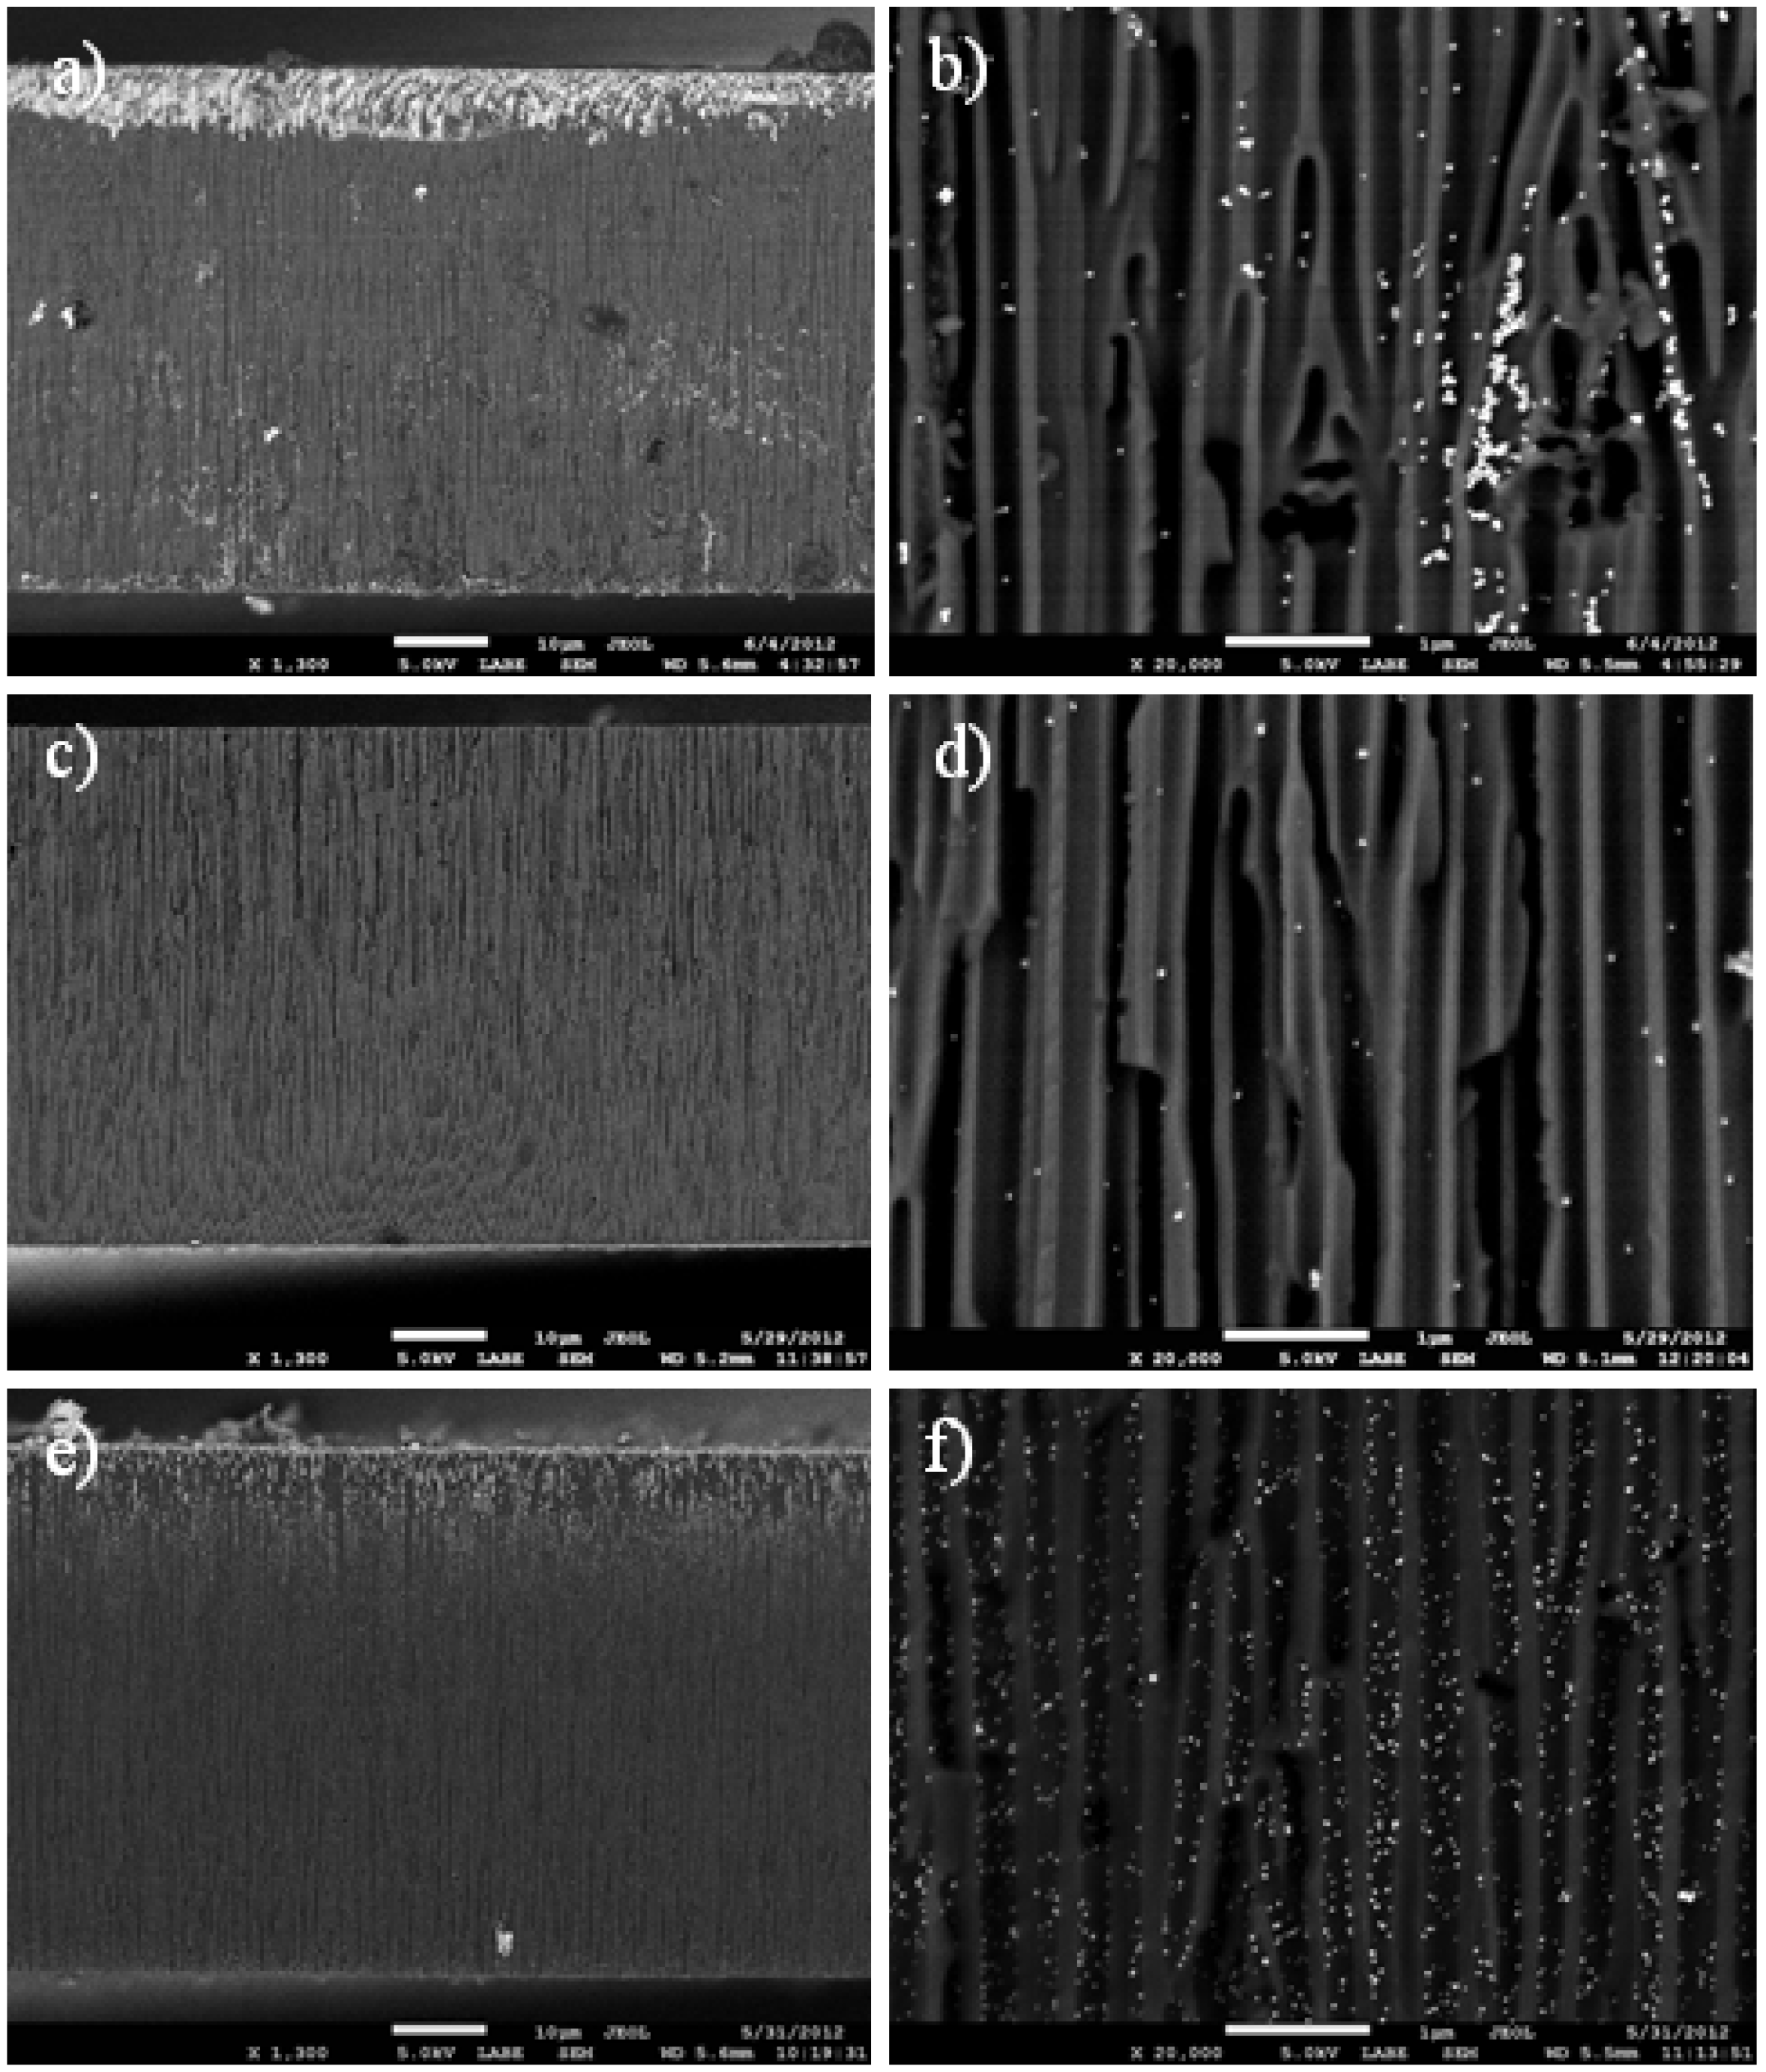
Figure 1, typical scanning electron microscope (SEM) images of the samples prepared according to the three different loading methods are presented. On the left column, lower magnification images (1300×) show the whole cross-section for a best overview of the APA loading, whereas on the right column, higher magnification images (20,000×) allow evaluation of the number and size of individual NPs deposited inside the pores. It appears clearly that for the NPs, filling (
Figure 1a) an inhomogeneous loading of Ag occurs, mainly concentrated at one side of the APA membrane. This is actually the top face of the APA sitting in the beaker containing the NPs solution. Obviously, the penetration of NPs into the APA occurs preferentially on this side, whereas the bottom side is hindered to access by the NPs in solution, as their diffusion into the pores is not favored there. At the same low magnification, for the physical method (
Figure 1c), a much more uniform distribution of particles is obtained, though with lower concentration on average. Indeed, at a closer look (compare
Figure 1b,d), only very few NPs appear in this case. Actually, the close-up in
Figure 1b is not really representative of the typical NPs filling sample: in most images, almost no particles at all appeared, and only in two of them, like the one presented here, clustered particles appeared instead. For calculation of the actual NPs size, we used images similar to that of
Figure 1b. However, for evaluation of the particle coverage across the section, we averaged all the images taken at different positions, according to what is described in
Section 3.3.
In the chemical method case (
Figure 1e,f), again, some large-scale non-uniformity appears, with denser Ag presence in the 10–15 µm in-depth section closer to the top face, but with much better local uniformity in the middle-depth region of the APA, and at a comparatively higher level of NPs content (compare
Figure 1d,f). The slight in-depth non-uniformity appearing here can also be justified by the chemical reactions involved in NPs formation being favored closer to the top face, similar to the NPs filling. However, in this case, much weaker restrictions due to diffusion appear, as the diffusing objects are here ionic or molecular species, rather than relatively large (≥10 nm size scale) NPs.
Figure 1.
Scanning electron microscope (SEM) images of Ag-loaded anodic porous alumina (APA) substrates prepared from different methods; (a)–(b) direct filling with commercial nanoparticles (NPs); (c)–(d) physical method; (e)–(f) chemical method. Magnification is 1300× for the left column images (a), (c) and (e), and 20,000× for the right column images (b), (d) and (f). (b) is not representative of the typical surface, but is rather selected on purpose in a region of high NPs aggregation.
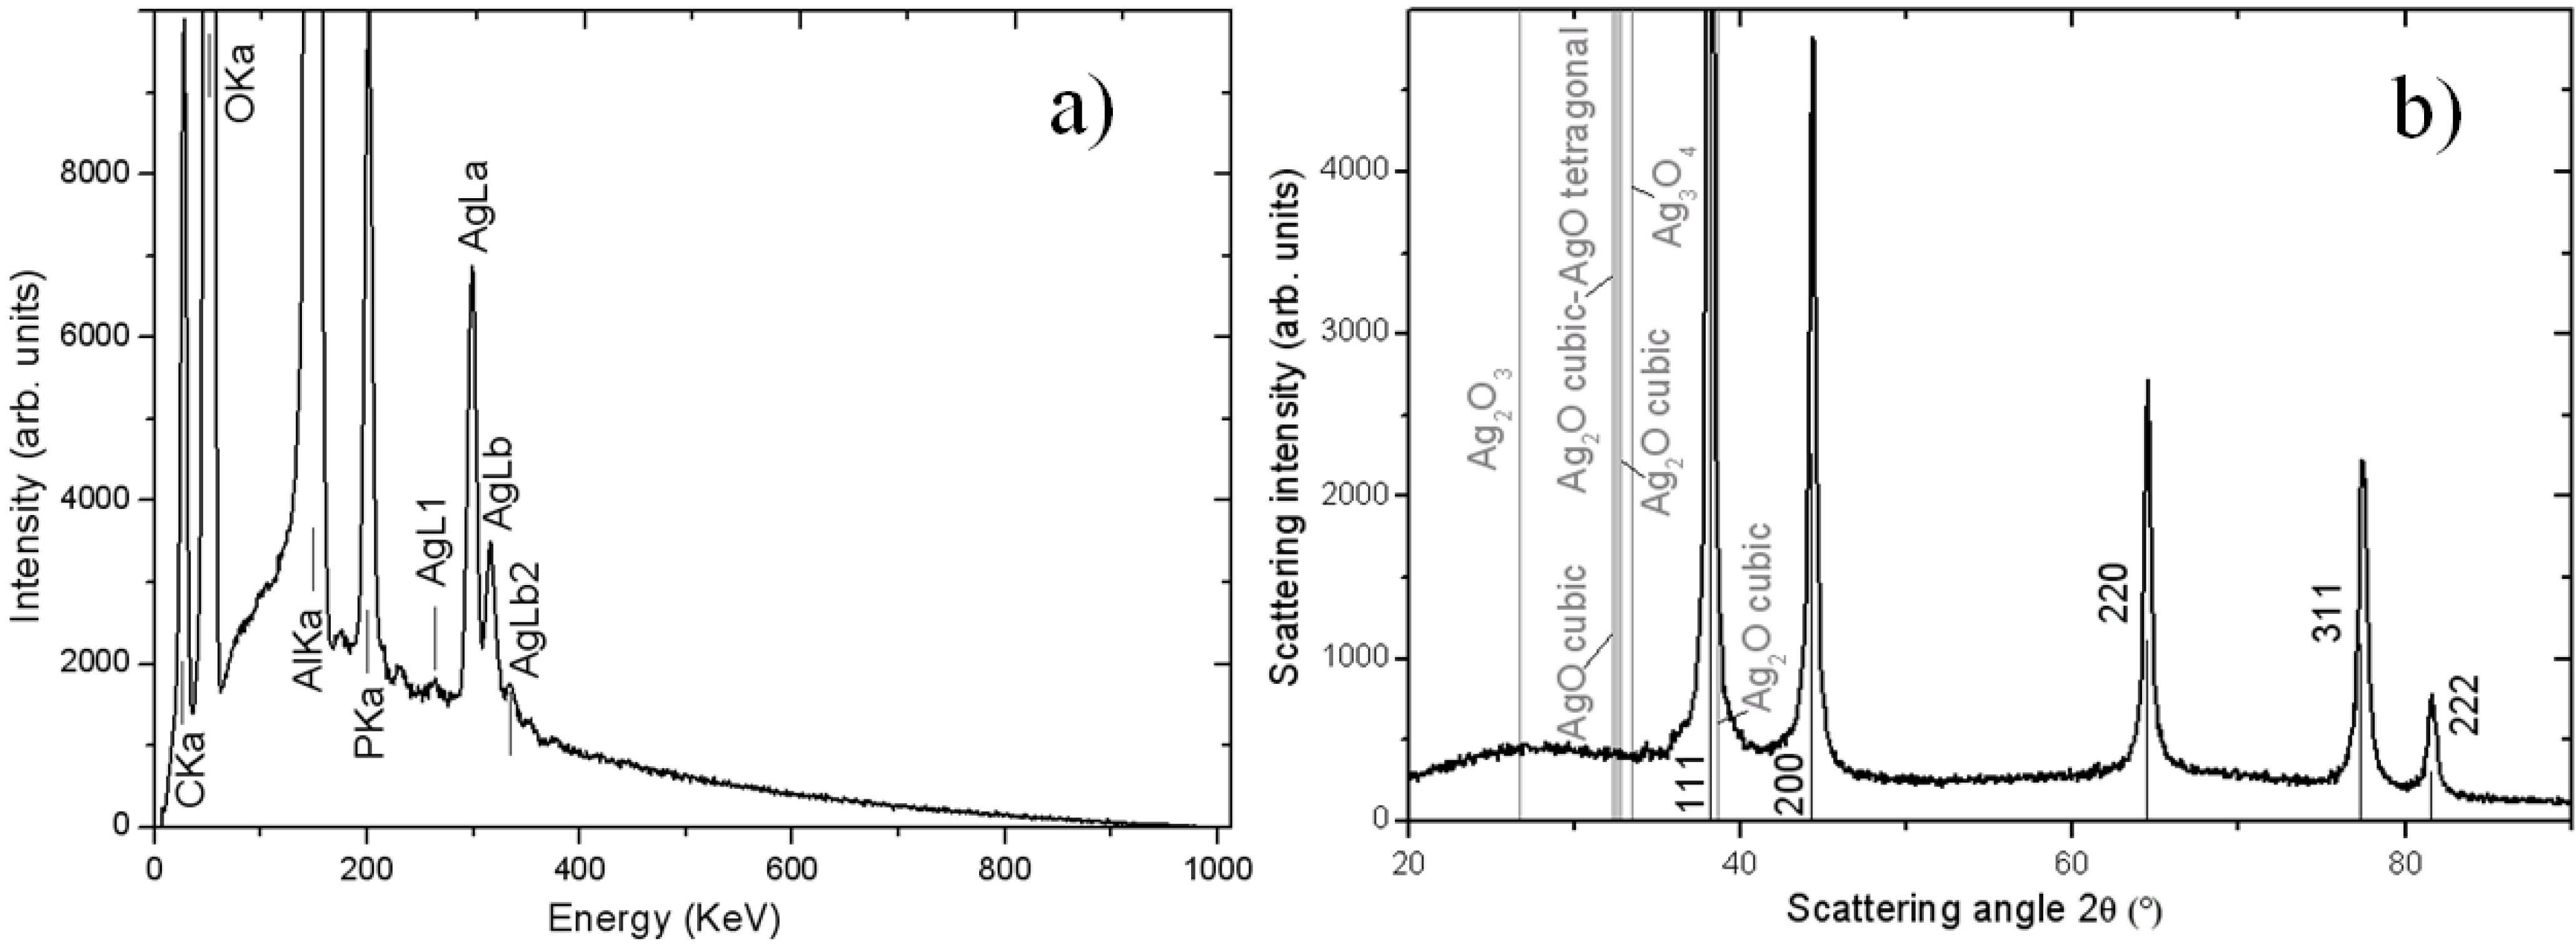
Since the backscattered electrons contrast in SEM was not sufficient to assess the chemical nature of the NPs, on the high magnification images we also carried out energy-dispersive X-ray microanalysis (EDS). One typical such spectrum is reported in
Figure 2a, for the case of the chemical loading method. As expected, among the different elemental species present, the contributions of aluminum (Al) and oxygen (O) from the APA frame are dominant. Additionally, we observed the presence of carbon (C), phosphorus (P) and Ag, as expected. C is there as the top conducting layer deposited on purpose on the samples (see Experimental section), in addition to being a common contaminant from organic compounds, resulting from solvents in the residual atmosphere of the SEM vacuum chamber. P is probably there as a contaminant from the fabrication itself of the APA templates, which at the industrial level are usually obtained by anodization of the Al in aqueous phosphoric acid electrolyte. This process is known to result in the trapping of some phosphate ions (3% atoms here, with respect to 6% reported in [
11], probably for so-called hard anodization). However, what is most important for us is the presence of Ag coming from our loading process.
In addition to EDS, for one Ag-loaded APA sample of each type, also powder X-ray diffraction (XRD) measurements were carried out, and the results for the same sample (chemical loading method) as for the EDS are shown in
Figure 2b. This type of analysis further confirmed the composition of the NPs being Ag. In particular, for all the loading methods, the XRD spectral features matched closely to the fingerprint of metallic Ag, with the peaks of the different orientations of cubic Ag crystals appearing, as contained in the Card No. 03-065-2871 of the JCPDS database (see labels in
Figure 2b). Note, that there is no presence of peaks from APA, which is present in amorphous form, giving rise to the shallow broad band in the 20°–35° range. Only upon heating up to ≥700 °C, APA is known to partly crystallize to the γ phase [
12].
Figure 2.
(a) Energy-dispersive X-ray microanalysis (EDS) spectrum of one APA substrate Ag-loaded with the chemical method; (b) X-ray diffraction (XRD) spectrum for the same sample.
Figure 2.
(a) Energy-dispersive X-ray microanalysis (EDS) spectrum of one APA substrate Ag-loaded with the chemical method; (b) X-ray diffraction (XRD) spectrum for the same sample.
In addition to confirming the results of EDS in terms of the presence of Ag, the XRD data provide extra information about the structure of the Ag. In
Figure 2b, along with the spectral positions (vertical black lines) corresponding to the cubic phase of metallic Ag, the positions (gray lines) corresponding to the dominant peaks of the different Ag oxides are also reported (see the labels in
Figure 2b). Clearly, no match of any oxide-specific line is there with the experimental spectrum, showing that all the loaded NPs were completely metallic soon after deposition. We can conclude that the Ag in the NPs is not passivated by oxidation in the short time (scale of h), and their bioactive potential is therefore preserved.
From the SEM images, a statistic of the NPs size and total relative area has been extracted, and the results are reported in
Table 1. For the NP diameter, the mean and standard deviation are used as the representative value and uncertainty, respectively. The surface coverage along the cross-sections of both the NPs and the APA pore voids has also been evaluated, and thus, it was possible to calculate the ratio of the two, which represents the coverage of the pore cross-sectional area by the NPs. This quantity is used here as a rough estimate of the volume filling (%) of the NPs inside the pores. The uncertainty assigned to the respective values (column ‘Pore coverage by NPs’ in
Table 1) is calculated after the propagation of errors, by considering as the best estimate the most probable error of the value resulting from summing the relative errors in quadrature, Δ(a/b) = <a/b>·√[(Δa/<a>)
2+(Δb/<b>)
2], where the <> signs represent the mean values.
From the numbers in
Table 1, it is clear that the Ag NPs fabricated
in situ by both the physical and the chemical methods are smaller than the commercial NPs, (approximately 35 and 25 nm diameter, respectively). The method that provided the highest filling was the chemical one (NPs pore coverage ~6.1%). In this respect, the NPs filling scores second, with ~2.6% coverage
versus the ~1.6% of the physical method. Additionally, the high spread of the NPs filling method, with a coefficient of variation (ratio of mean to standard deviation) of ±71%, confirms that in these samples, the distribution of NPs throughout the APA thickness is less uniform than for the physical and, especially, the chemical method, with a coefficient of variation of ±62 and ±39%, respectively. Thus, in both typical level (the highest mean) and uniformity (the lowest spread), the method that provides the best loading appears to be the chemical one.
Table 1.
Summary of morphological parameters extracted from the SEM images similar to those in
Figure 1b,d,f.
Table 1.
Summary of morphological parameters extracted from the SEM images similar to those in Figure 1b,d,f.
| Loading method | NPs diameter (nm) | Image coverage (%) | Pore coverage by NPs (%) |
| NPs | Pores |
| NPs filling | 50 ± 11 | 1.4 ± 1.0 | 54 ± 12 | 2.6 ± 1.9 |
| Physical | 36 ± 25 | 0.8 ± 0.5 | 49 ± 14 | 1.6 ± 1.1 |
| Chemical | 24 ± 10 | 2.8 ± 1.1 # | 46 ± 10 | 6.1 ± 2.7 |
In order to understand if the above mentioned differences are statistically significant, on the raw NPs coverage data (N = 6), we performed a one-way analysis of variance (ANOVA) with Tukey pairs test for comparison between the means. The significance levels selected were α = 0.01 (“much different”, **) and α = 0.06 (“different”, *). According to these levels, the chemical loading value appeared much different from (higher than) the physical loading value and different from (higher than) the NPs filling value, whereas there was no statistically significant difference between NPs filling and physical loading. Actually, the weaker “different” threshold has been set to 0.06, instead of the more common 0.05, for better discrimination of the above groups of experimental datapoints. In fact, the Tukey tests showed a probability that the means of the chemical loading and NPs filling data are different by chance—yet belonging to the same parent distribution—of p = 0.055, which would result in a “no difference” response with an α = 0.05 threshold. However, using this threshold, one would miss the point that the data from the remaining pair of loading methods (NPs filling–physical loading) is much less different (p = 0.423).
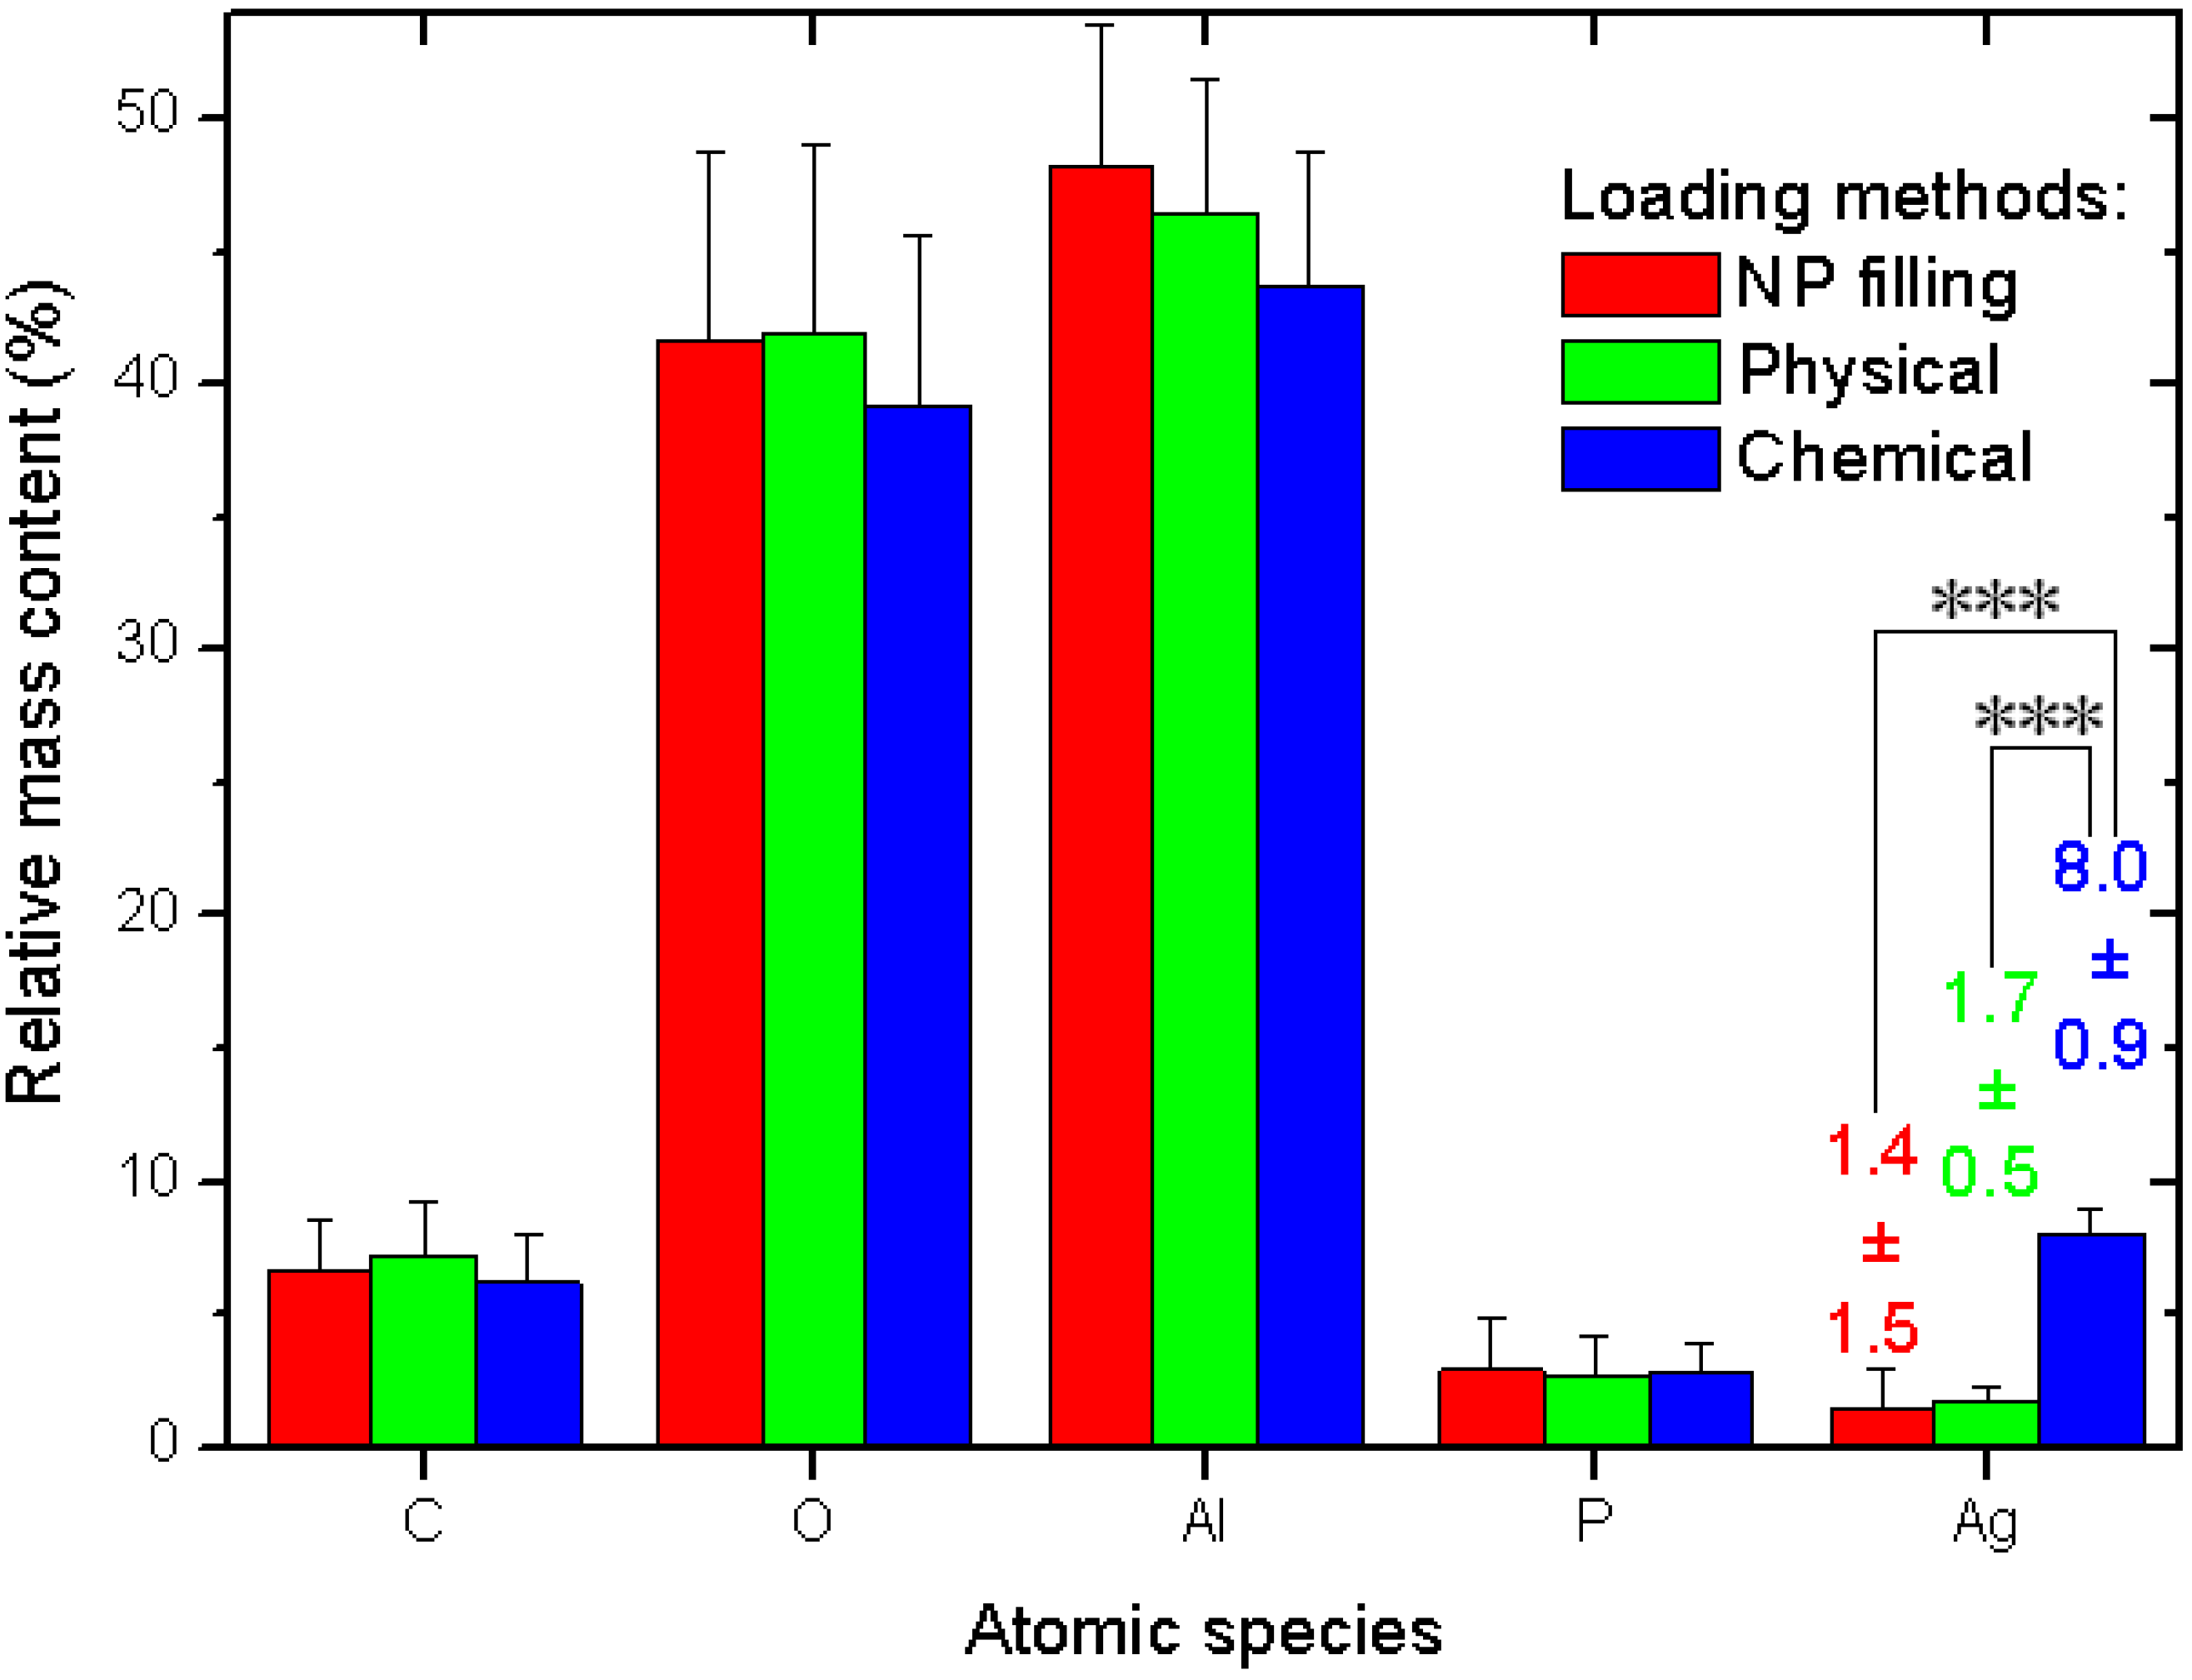
The quantitative data and related statistics obtained from all the EDS measurements are reported in
Figure 3. The plot represents the percent mass composition of the Ag-loaded APA substrates for different elemental species, with the respective mean (bar height) and standard deviation (error bar,
N = 6). As mentioned in the description of
Figure 2a, obviously Al and O are the dominating species. When converted into the respective atomic percent compositions, the ratio of the two (No. (atoms O)/No. (atoms Al)) gives the stoichiometric value of 1.50 ± 0.03, as expected for the alumina material (Al
2O
3) of which APA is made.
Figure 3.
Results of EDS analysis of Ag-loaded APA from different methods.
Figure 3.
Results of EDS analysis of Ag-loaded APA from different methods.
Our interest is rather focused on Ag. Whereas the other species show roughly constant contents—within the errors—for all the three different loading methods, the Ag loading shows significant difference between the methods. The NPs filling and physical method exhibit similar values, again, with a much higher spread for the former (see the numerical values label in
Figure 3). However, the chemical method shows a much higher value than both the other methods, with a difference that, after the ANOVA pairs comparison with Tukey test, appears in both cases statistically significant at the highest threshold level selected of α = 0.001, (very much different, ***), whereas the pair NPs filling–physical loading does not appear different at even the weakest level of α = 0.1.
We now compare the apparent efficacy of Ag filling of the different methods resulting from the SEM images and the EDS data. From the SEM analysis, it appears that the NPs filling method scores higher than the physical method, whereas the contrary appears for the EDS analysis. In fact, the relatively high uncertainty in the resulting numbers makes the NPs filling and the physical method results not significantly different from the statistical viewpoint for both types of analysis. However, in both cases, the chemical method shows the highest filling. When this is normalized to the value of the respective lowest filling method, it appears to be higher in a ratio of 3.8× from SEM data and 5.7× from EDS data. Actually, since the SEM values are obtained from a surface coverage rather than a volume filling, a first rough correction of these data would require them to be raised to the power 3/2, which would give 7.4×. This value is shifted to higher numbers in the direction of the EDS value and beyond that. Obviously, given the complex structure of the hexagonal pattern of APA pores, such a simple scaling with the spatial dimensions is probably only a crude approximation of the real behavior, also due to the finite depth of focus of the SEM images. Therefore, some intermediate value would be more correct for the SEM data and closer to the EDS ones.
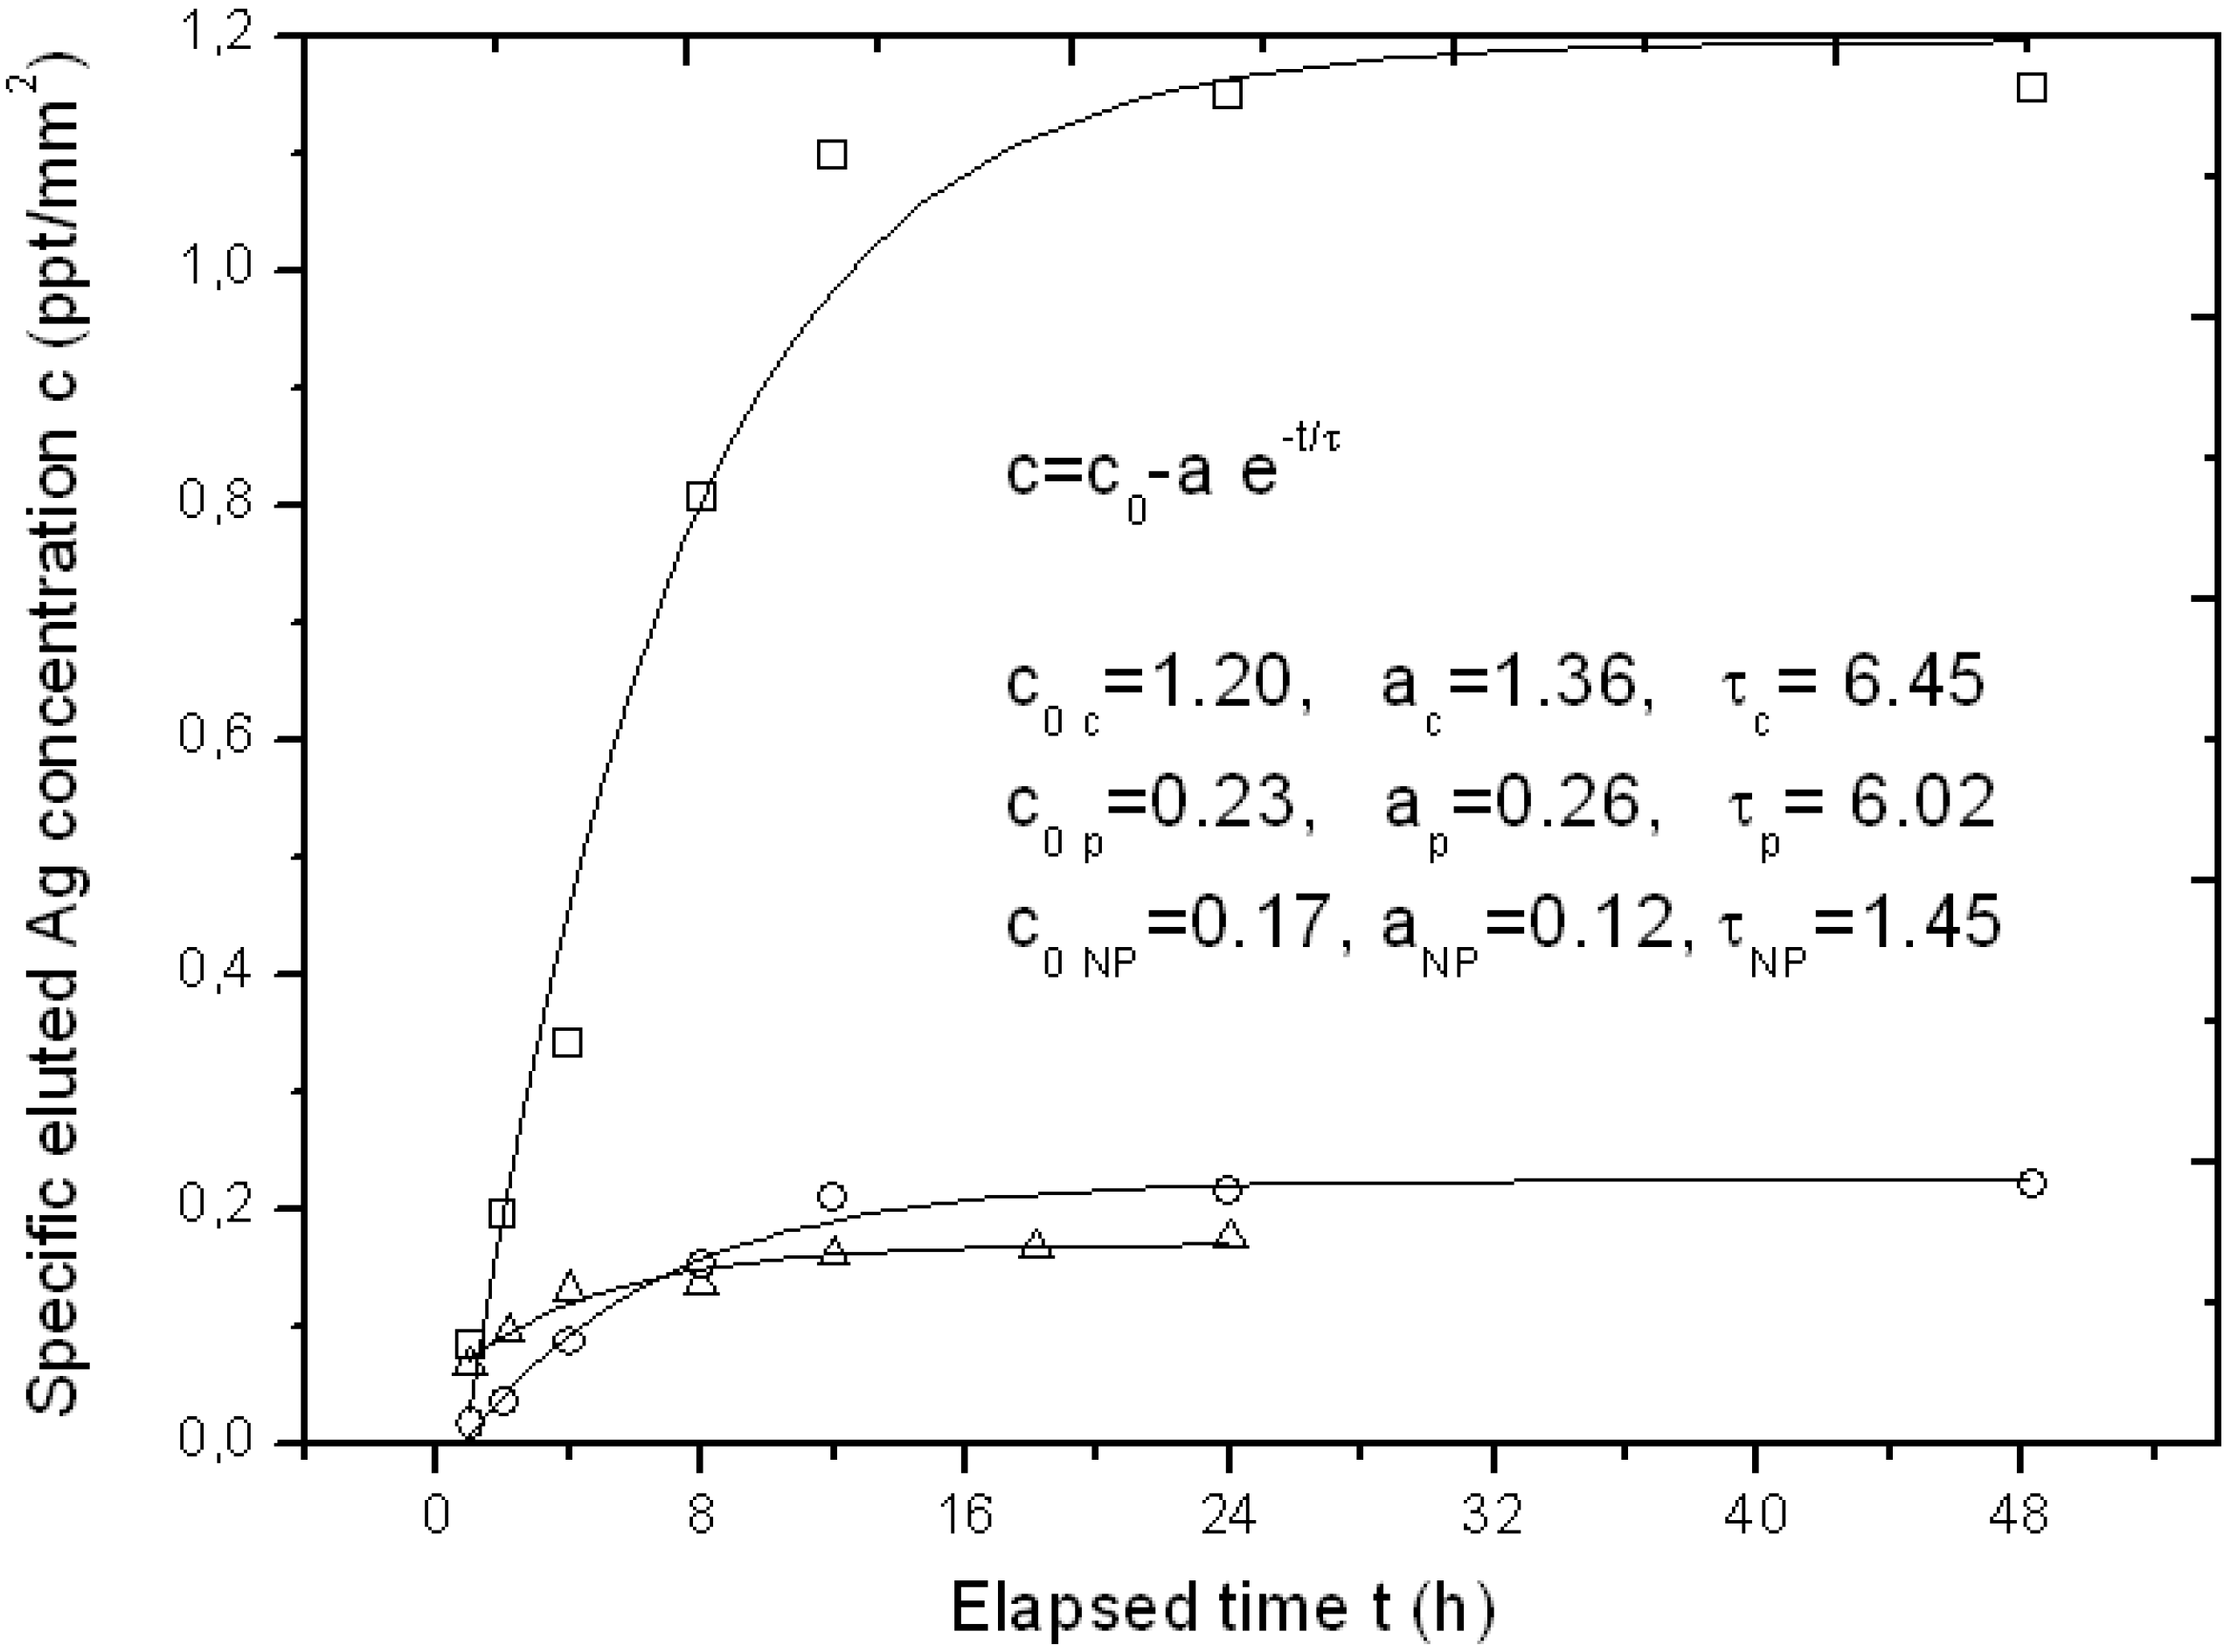
For some specimens of the APA template Ag-loaded with the three different methods, we also tested its function as a possible carrier for drug delivery of the bioactive Ag. Typical representative results of Ag elution as measured by inductive coupled plasma optical emission spectrometry (ICP-OES) over a time of up to two days have been reported in
Figure 4.
Figure 4.
Typical curves of eluted Ag concentration per unit surface area from APA loaded with the three different loading methods up to the first two days, with respective fitting parameters to an exponential growth model. The symbols legend for experimental datapoints is as follows: Squares (□) are used for chemical loading, circles (○) for physical loading and triangles (Δ) for NPs filling.
Since the APA specimens were of a different surface area, the amount of eluted Ag concentration was normalized to the approximate surface area of the APA piece, obtaining a specific concentration c (in ppt/mm
2). In
Figure 4, three representative profiles resulting from the APA samples loaded with the three different methods are shown. The typical sigmoidal profile of elution from a drug-delivery carrier appears, with an initially linear increase of released Ag over time, and a final saturation level c
0. The experimental datapoints have been fitted to a simple model of exponential growth with time, c = c
0−a·e
−t/τ, where c
0 represents the final specific concentration reached after elution is completed, a is a constant factor and τ is a characteristic rising time. All fitting results are reported in the inset of
Figure 4. Indices c, p and NP stand for chemical loading, phisical loading and NPs filling methods, respectively. It clearly appears that the type of sample with the highest release is the chemical loaded APA, as expected (c
0 c ~ 1.2 ppt/mm
2), whereas both the NPs filled and the physical loaded APA give roughly six-fold lower final elution levels. The c
0 levels for the two latter methods (c
0 NP and c
0 p) appear similar even if the loading level was higher for the NPs filling: obviously the Ag loaded into the APA with the latter method is not easily released upon immersion of the sample in a liquid, as it formed a compact layer on top of the APA rather than dispersed and loosely bound Ag NPs.
From
Figure 4, the characteristic time constant of the elution can also be derived. It appears that both the
in situ methods that provide dispersed Ag NPs,
i.e., the chemical and the physical loading, have similar time scales (τ
c ~ τ
p = 6–6.5 h), whereas the NPs filled APA reaches the final state c
0 in a shorter time (τ
NP ~ 1.5 h), since all the little Ag available for release is already facing the top surface in direct contact with the liquid.


