A Decolorization Technique with Spent “Greek Coffee” Grounds as Zero-Cost Adsorbents for Industrial Textile Wastewaters


Abstract
:1. Introduction
2. Materials and Methods
2.1. Adsorbents—Spent “Greek coffee” Grounds (COF)
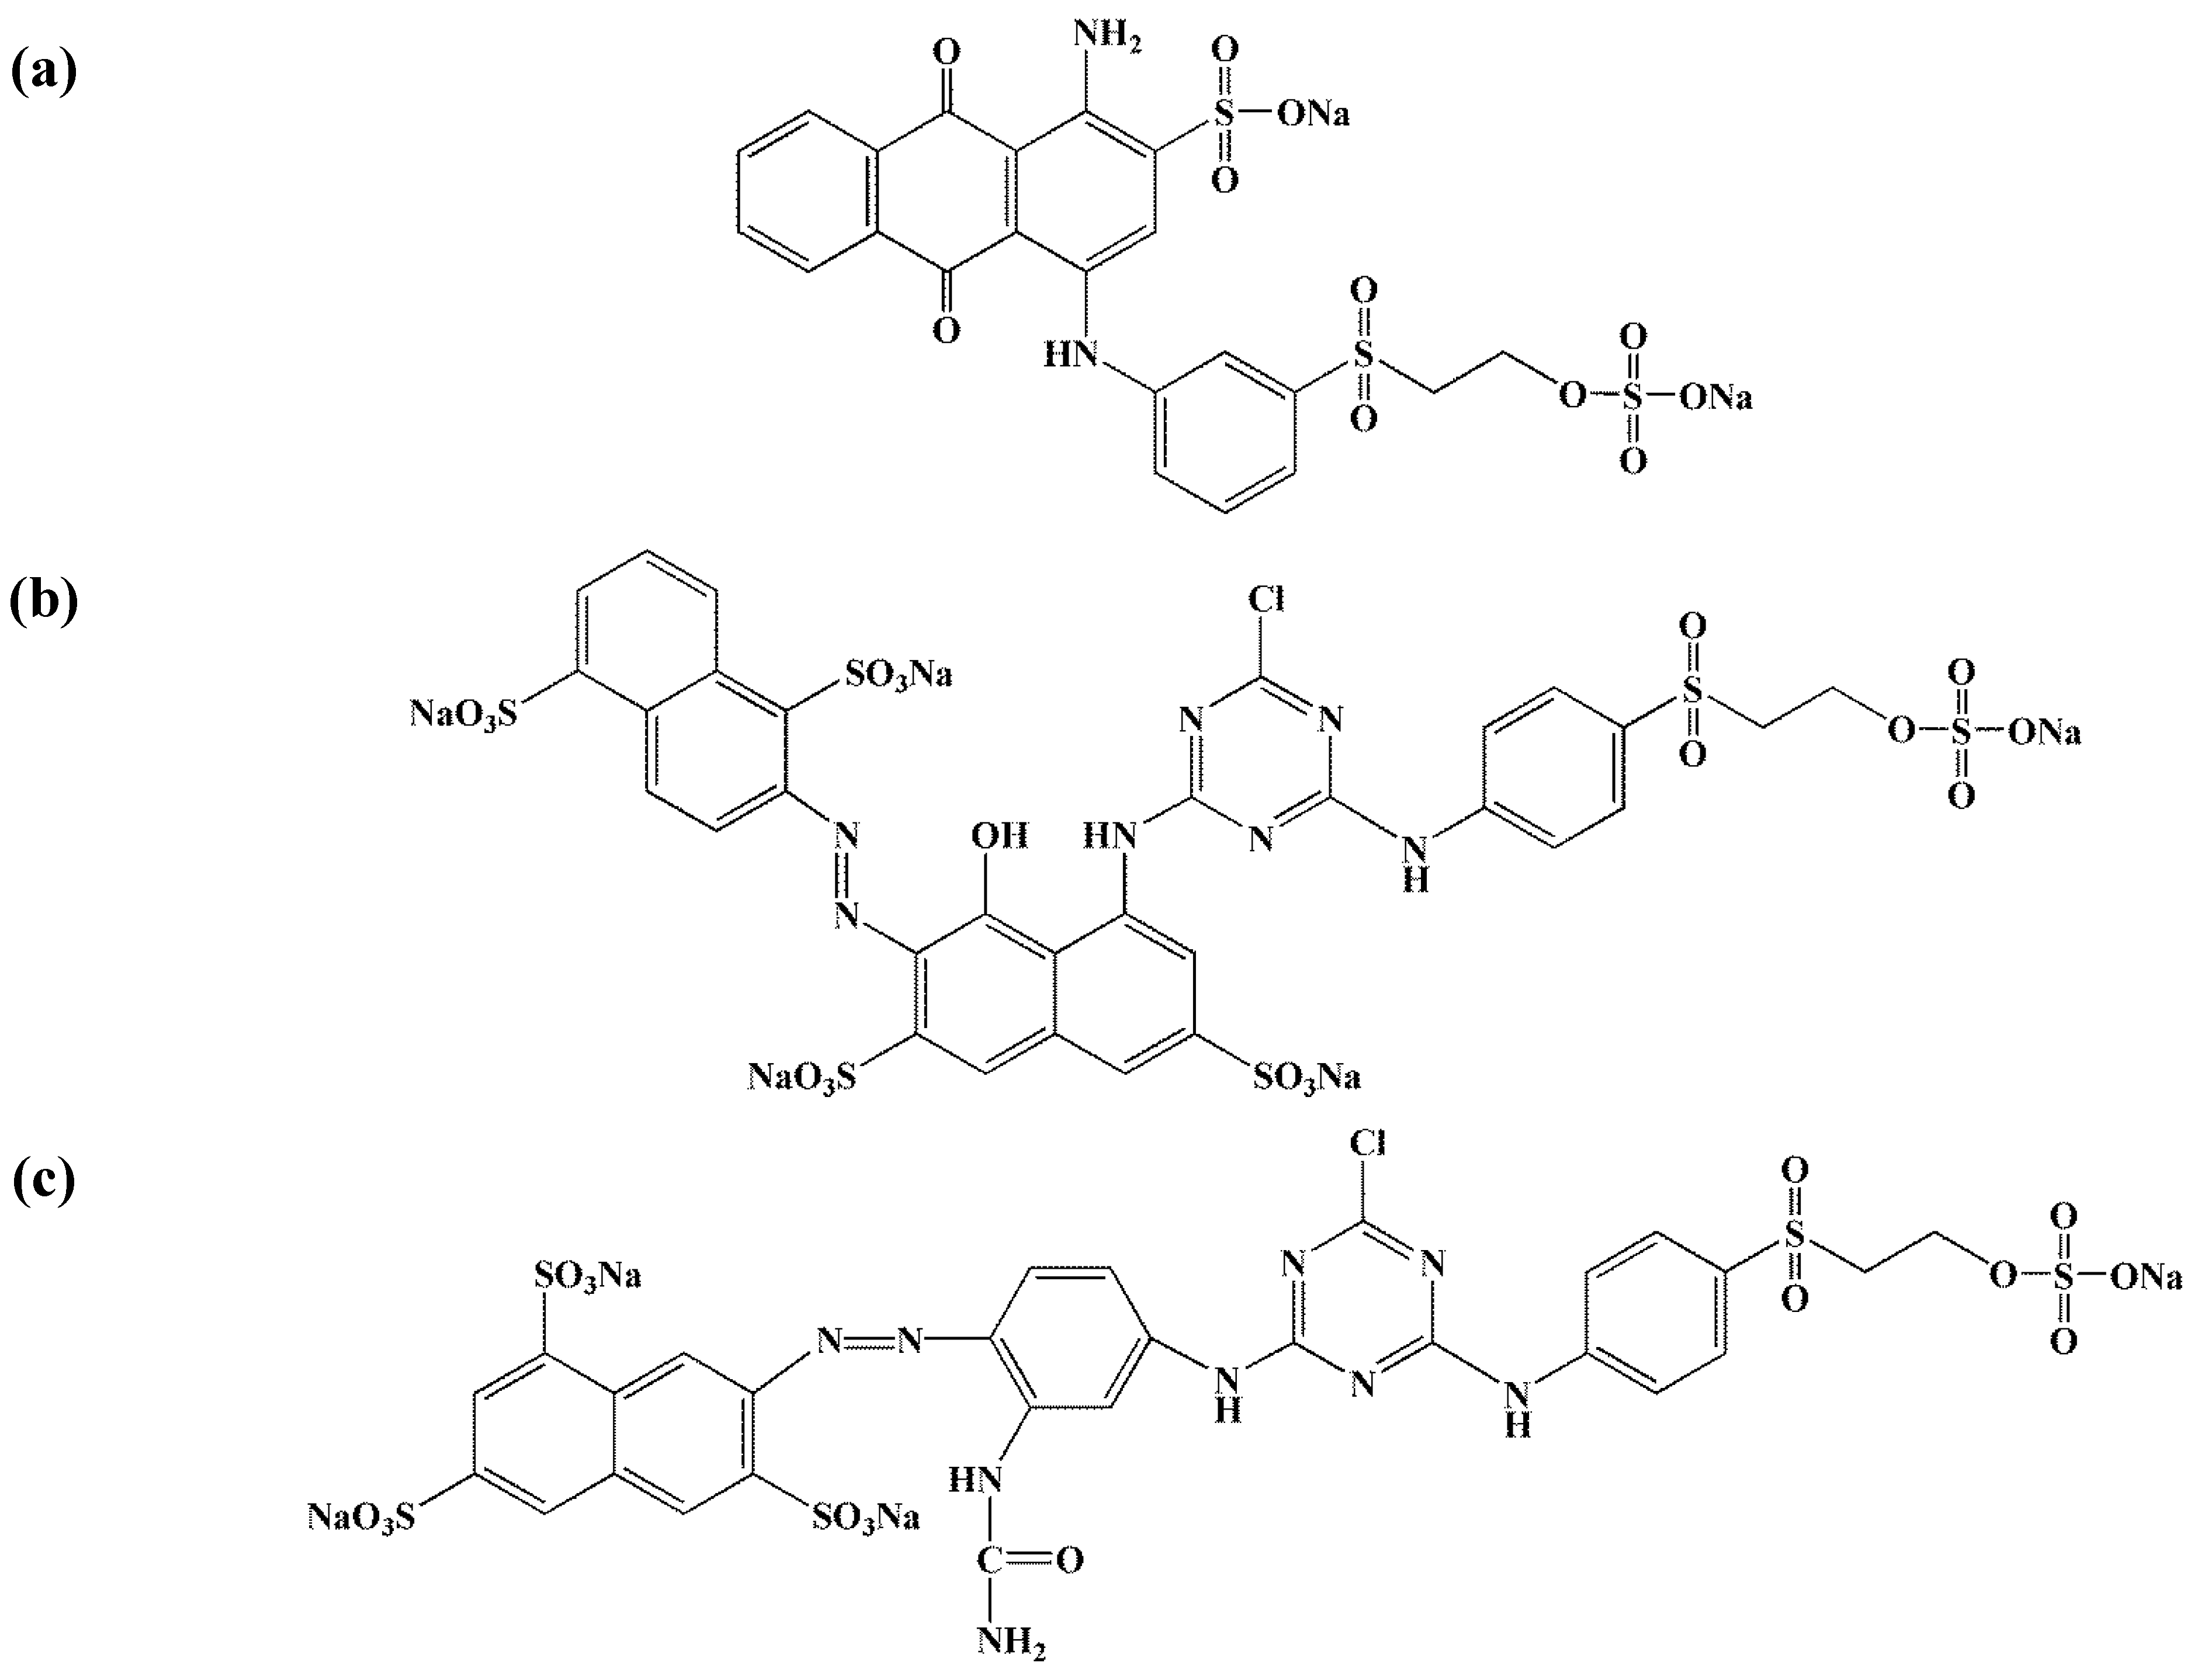
2.2. Adsorbates—Dyeing Mixtures

2.3. Characterization
2.4. Adsorption-Desorption Experiments
2.5. Analysis
3. Results and Discussion
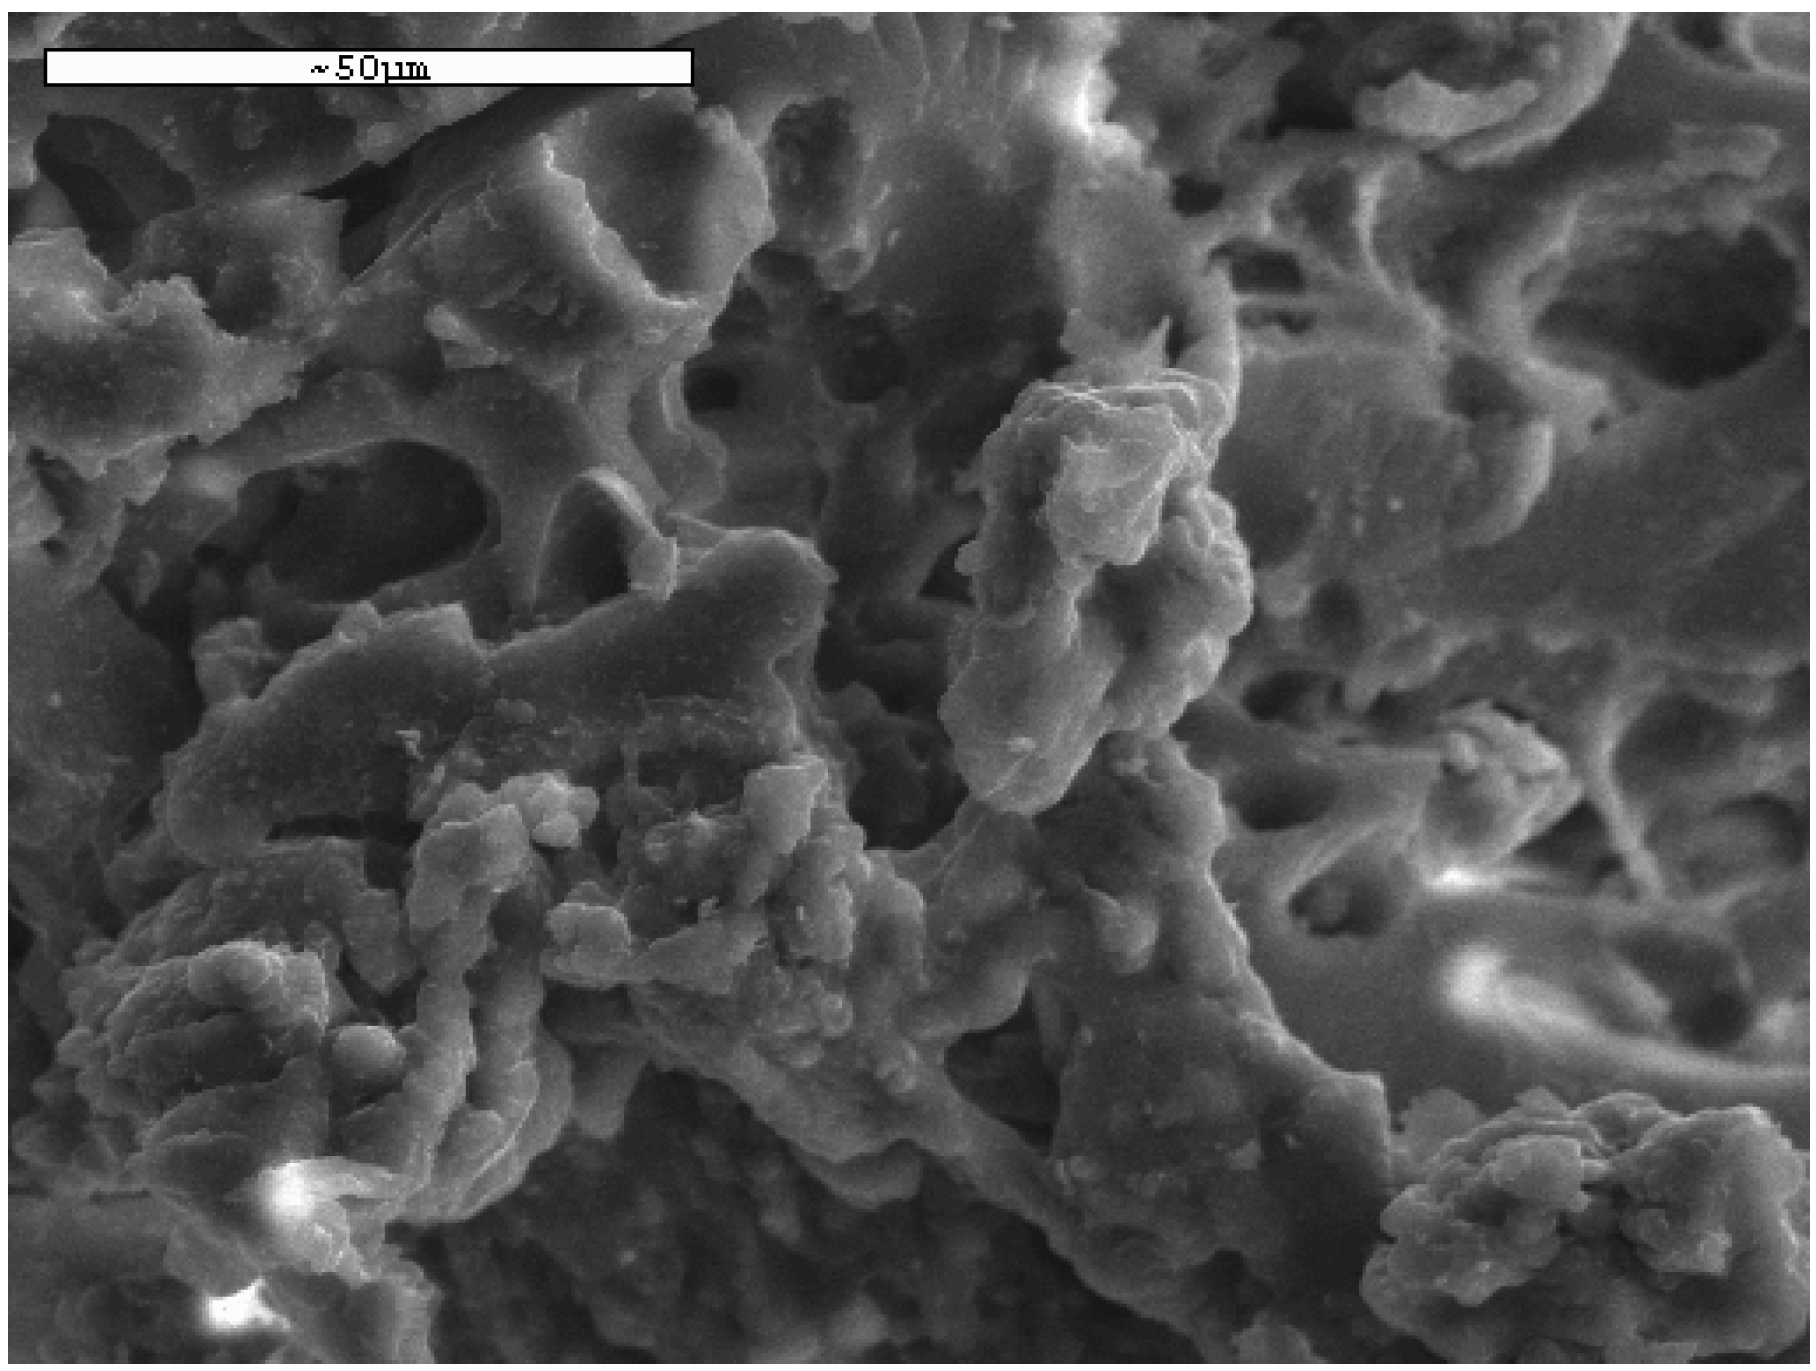
3.1. Characterization
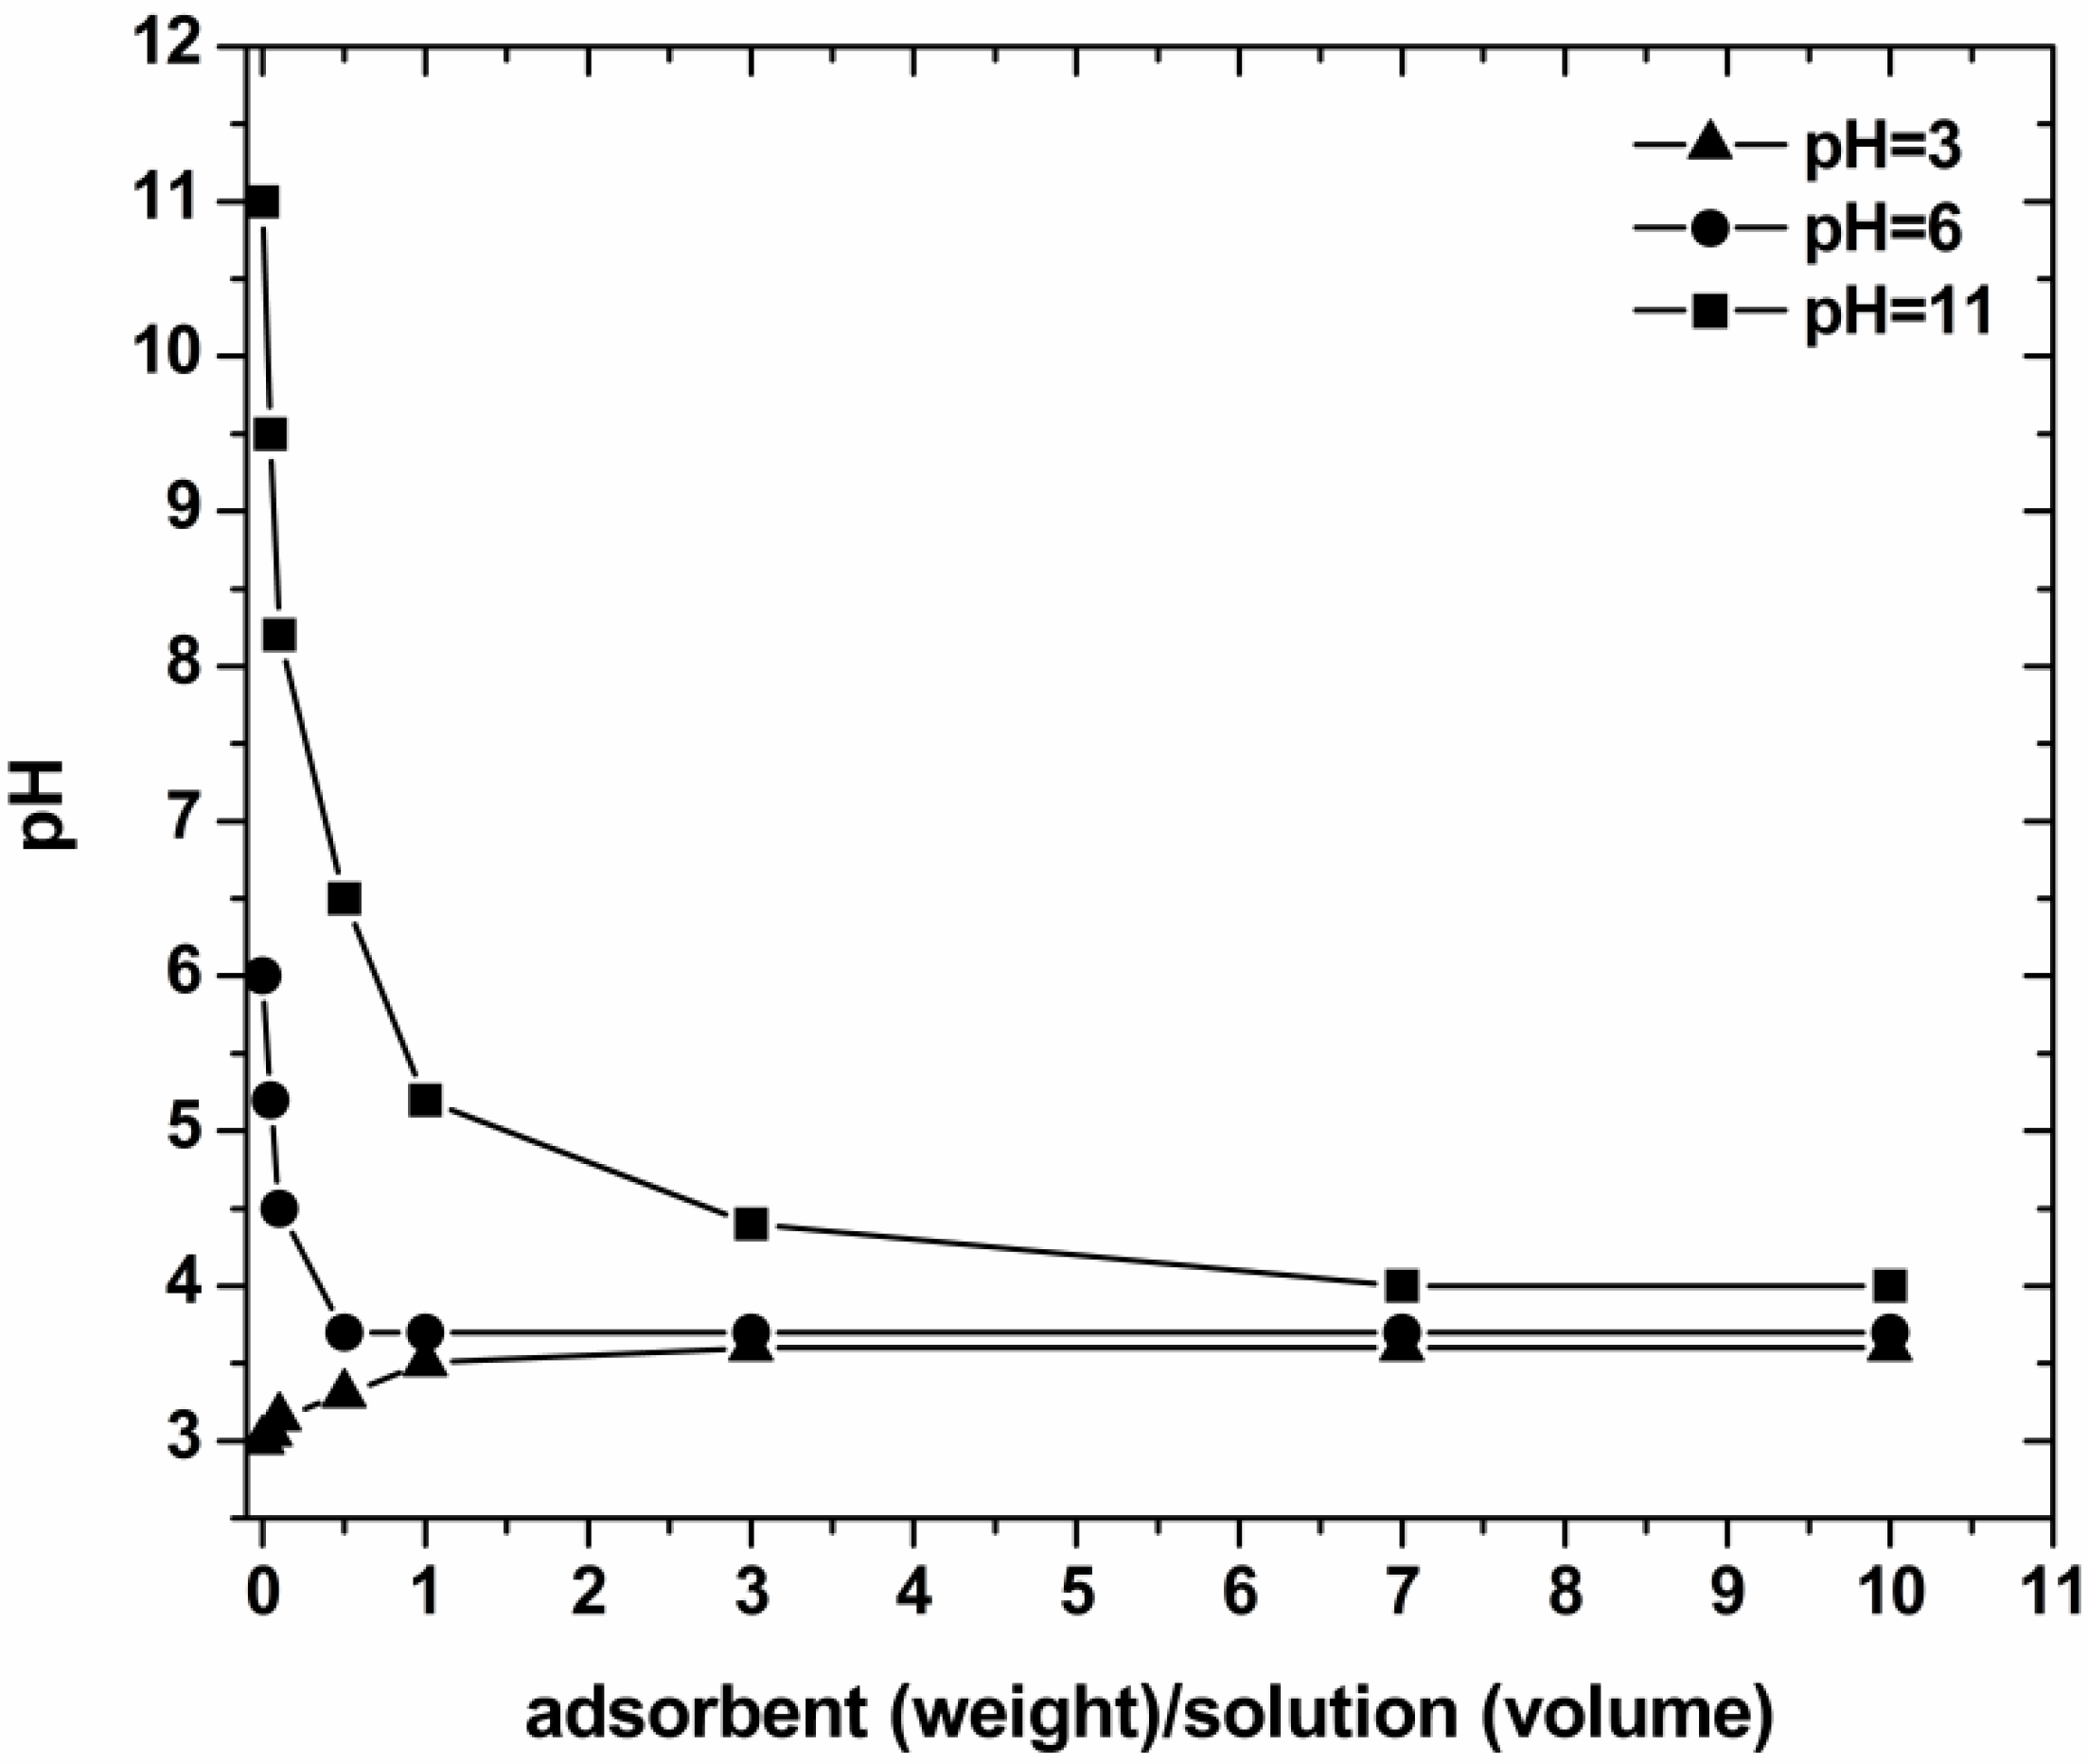
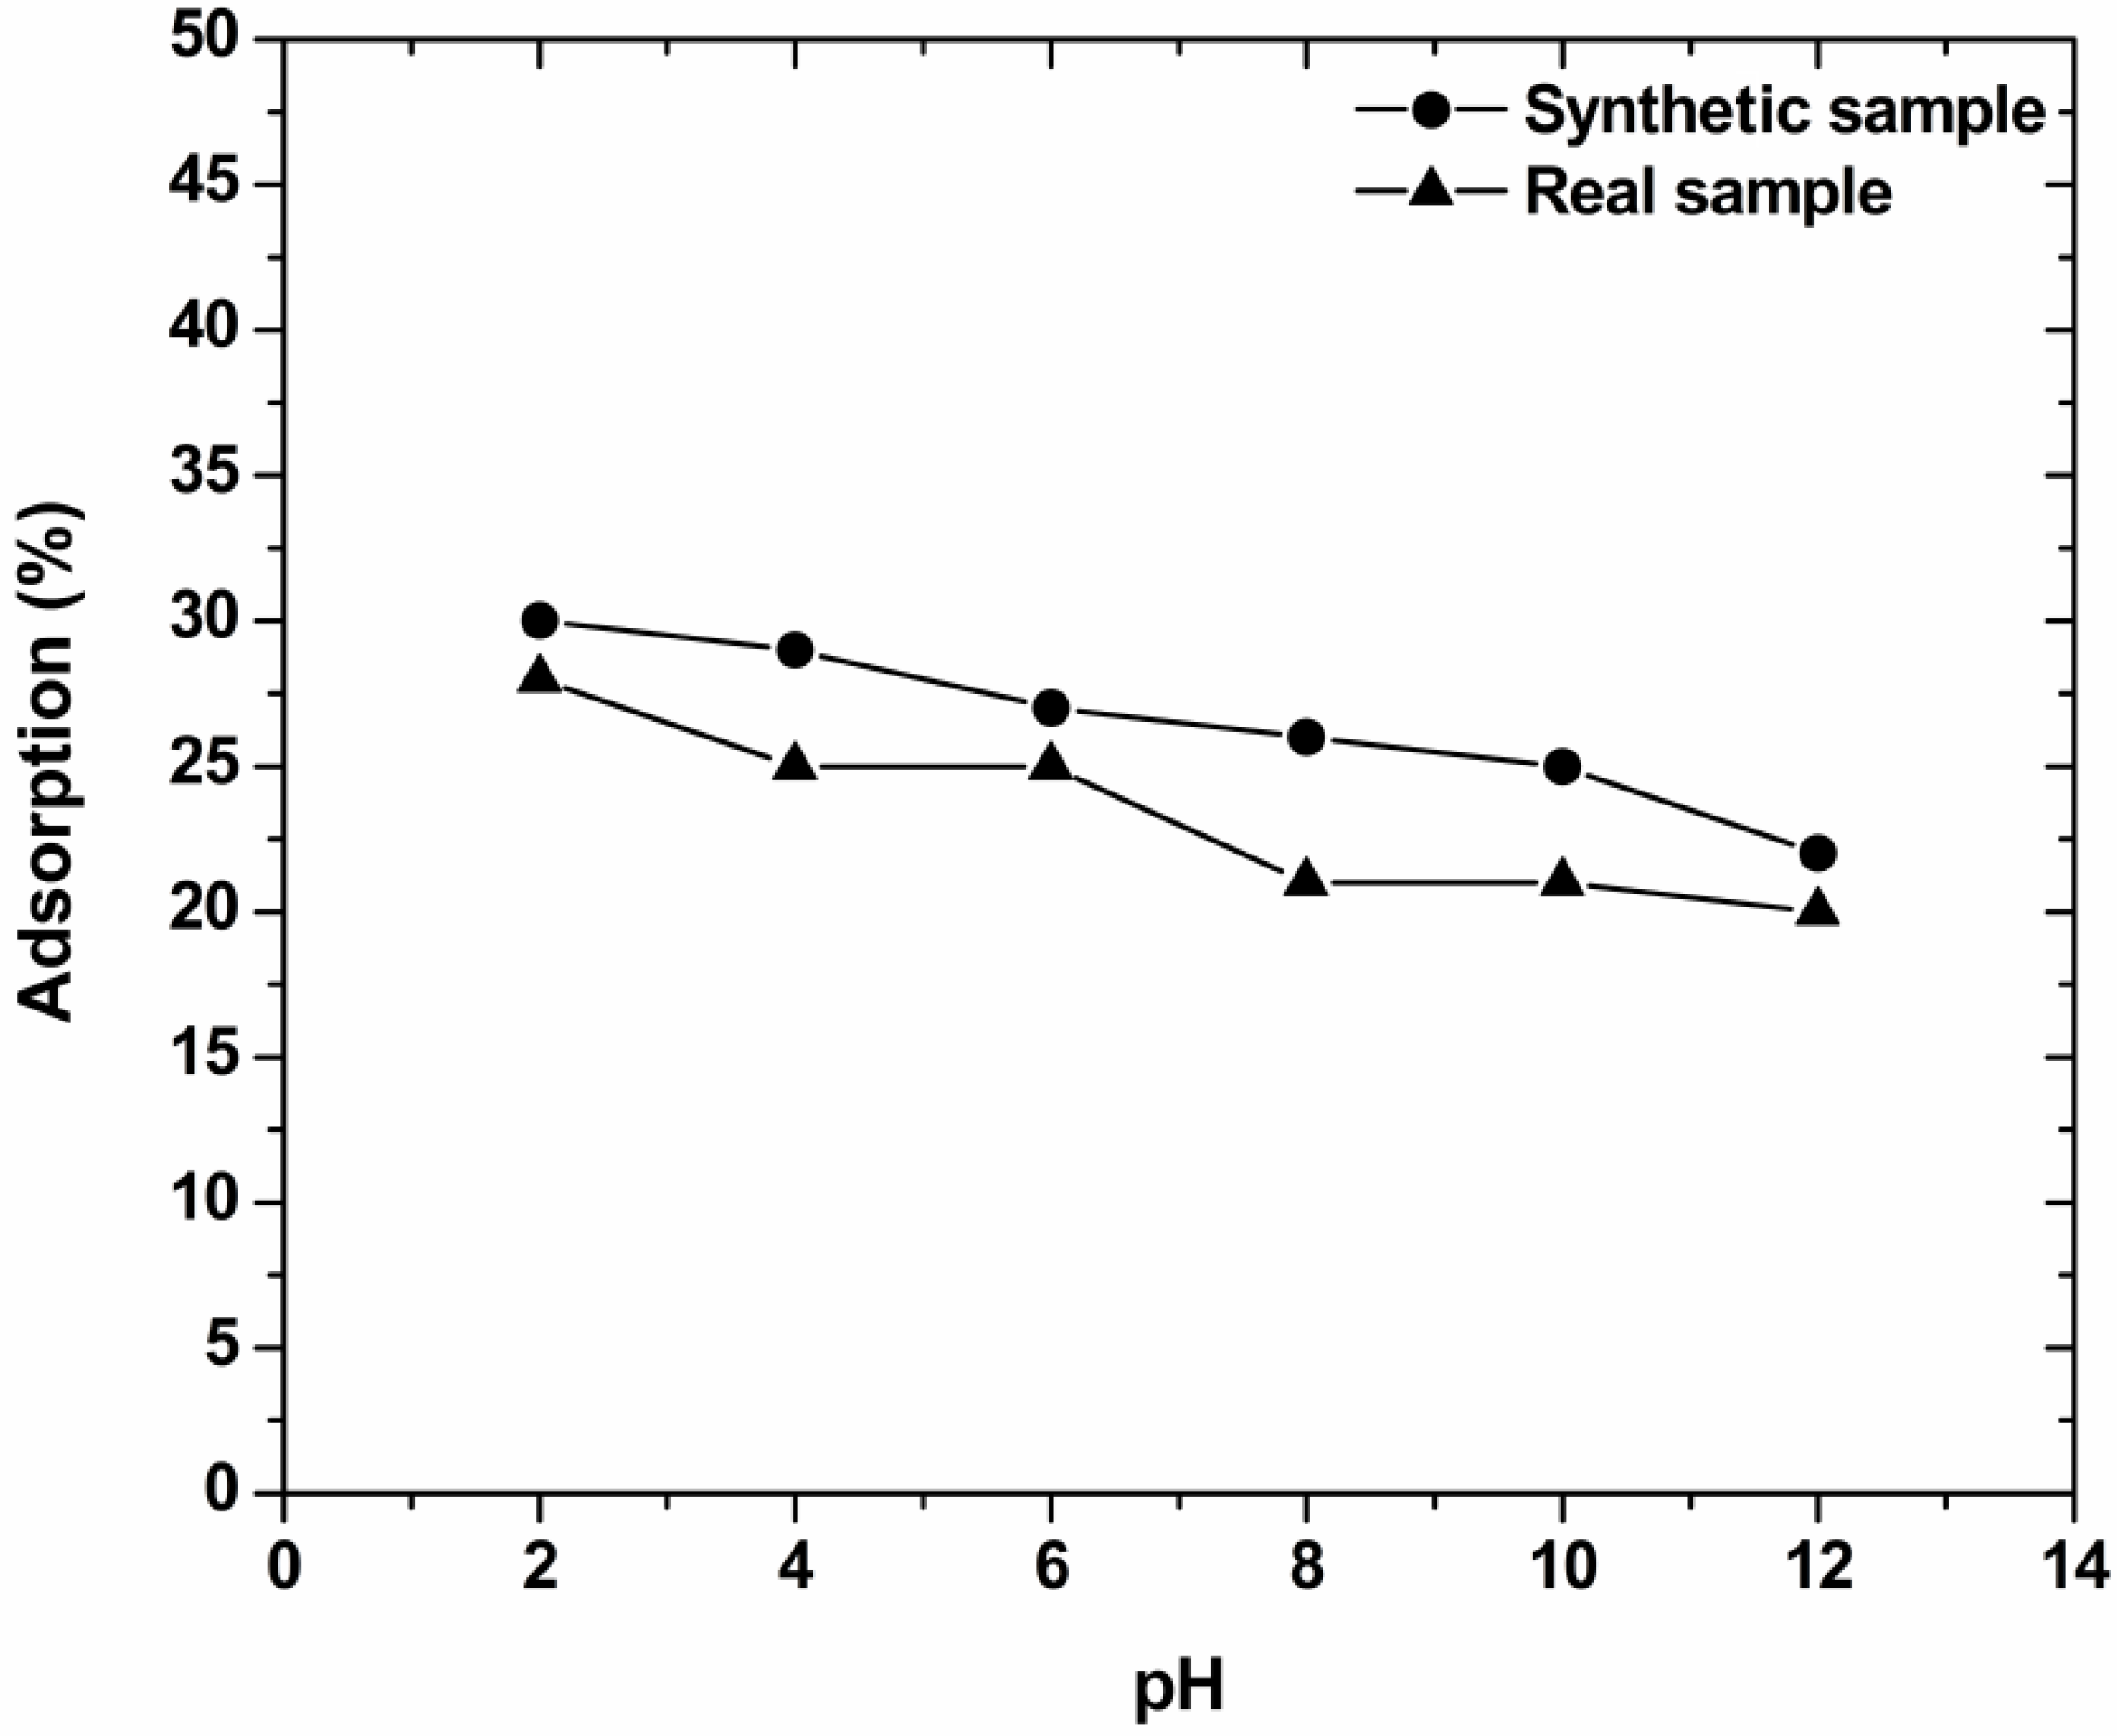
3.2. Effect of pH
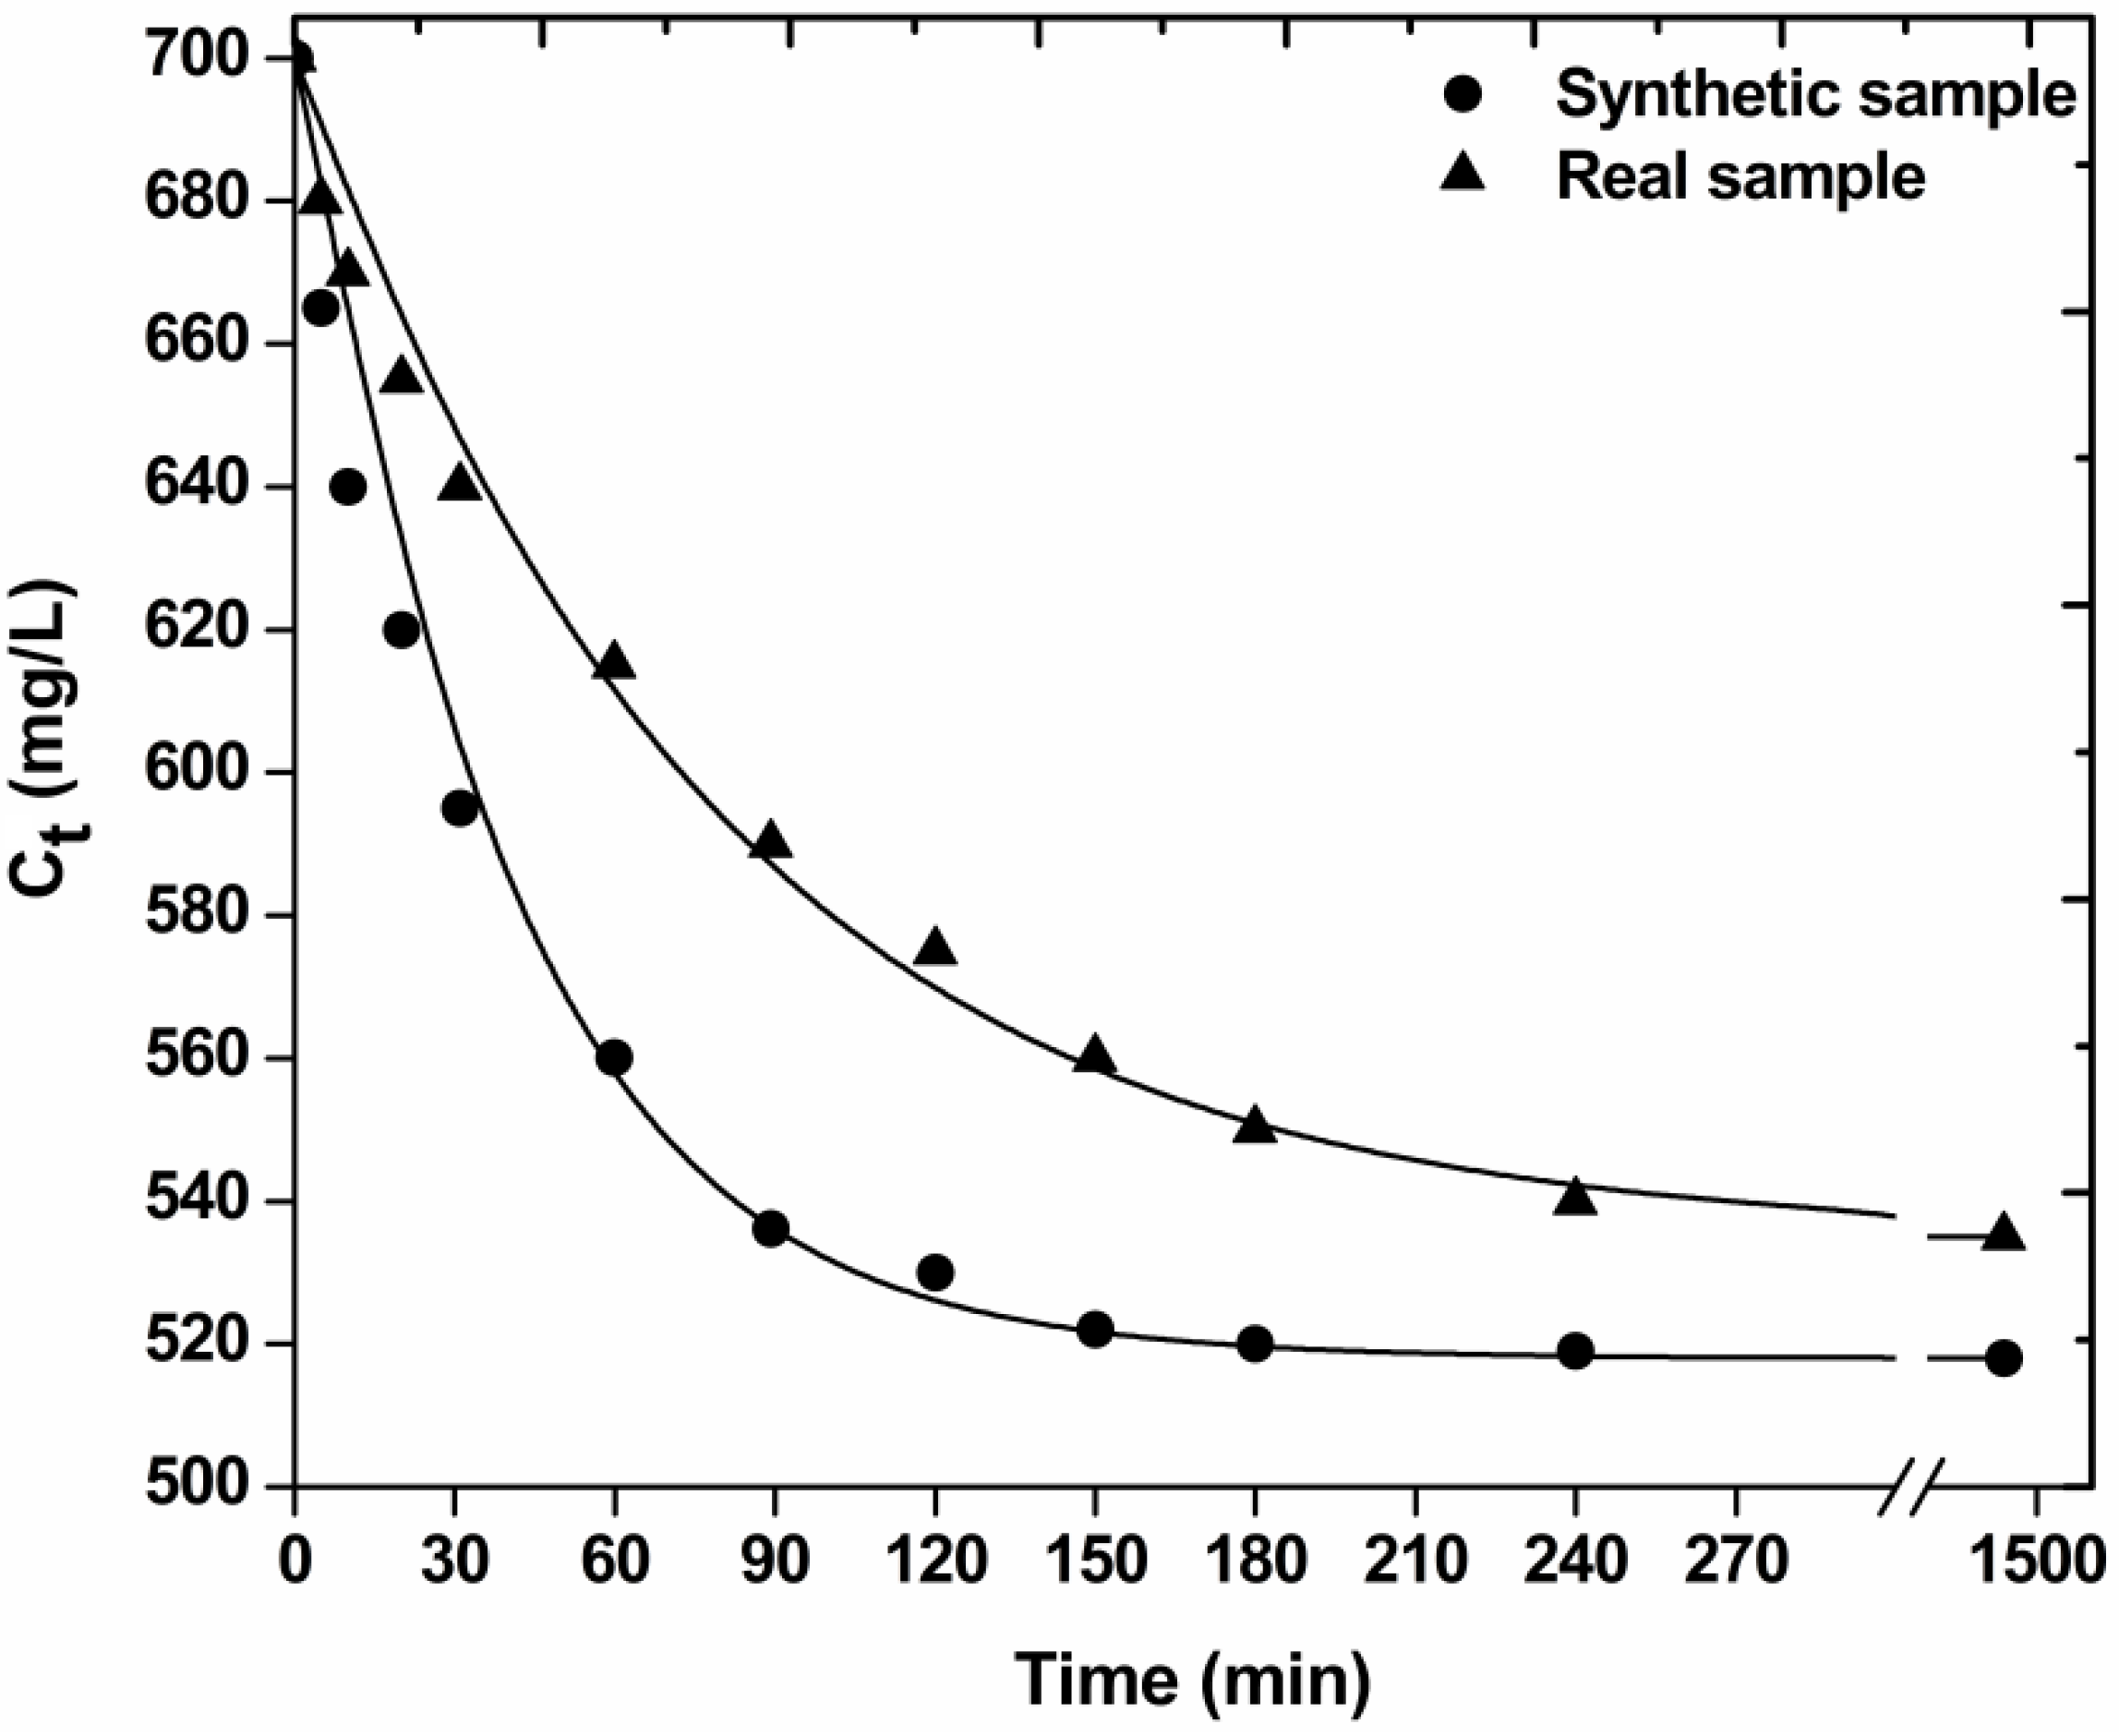
3.3. Kinetics


| Sample | Pseudo-first order | Pseudo-second order | Pseudo-third order | |||
|---|---|---|---|---|---|---|
| k1 | R2 | k2 | R2 | k3 | R2 | |
| min−1 | min−1 | min−1 | ||||
| Real | 0.013 | 0.994 | 0.026 | 0.967 | 0.051 | 0.889 |
| Synthetic | 0.021 | 0.994 | 0.031 | 0.966 | 0.058 | 0.877 |
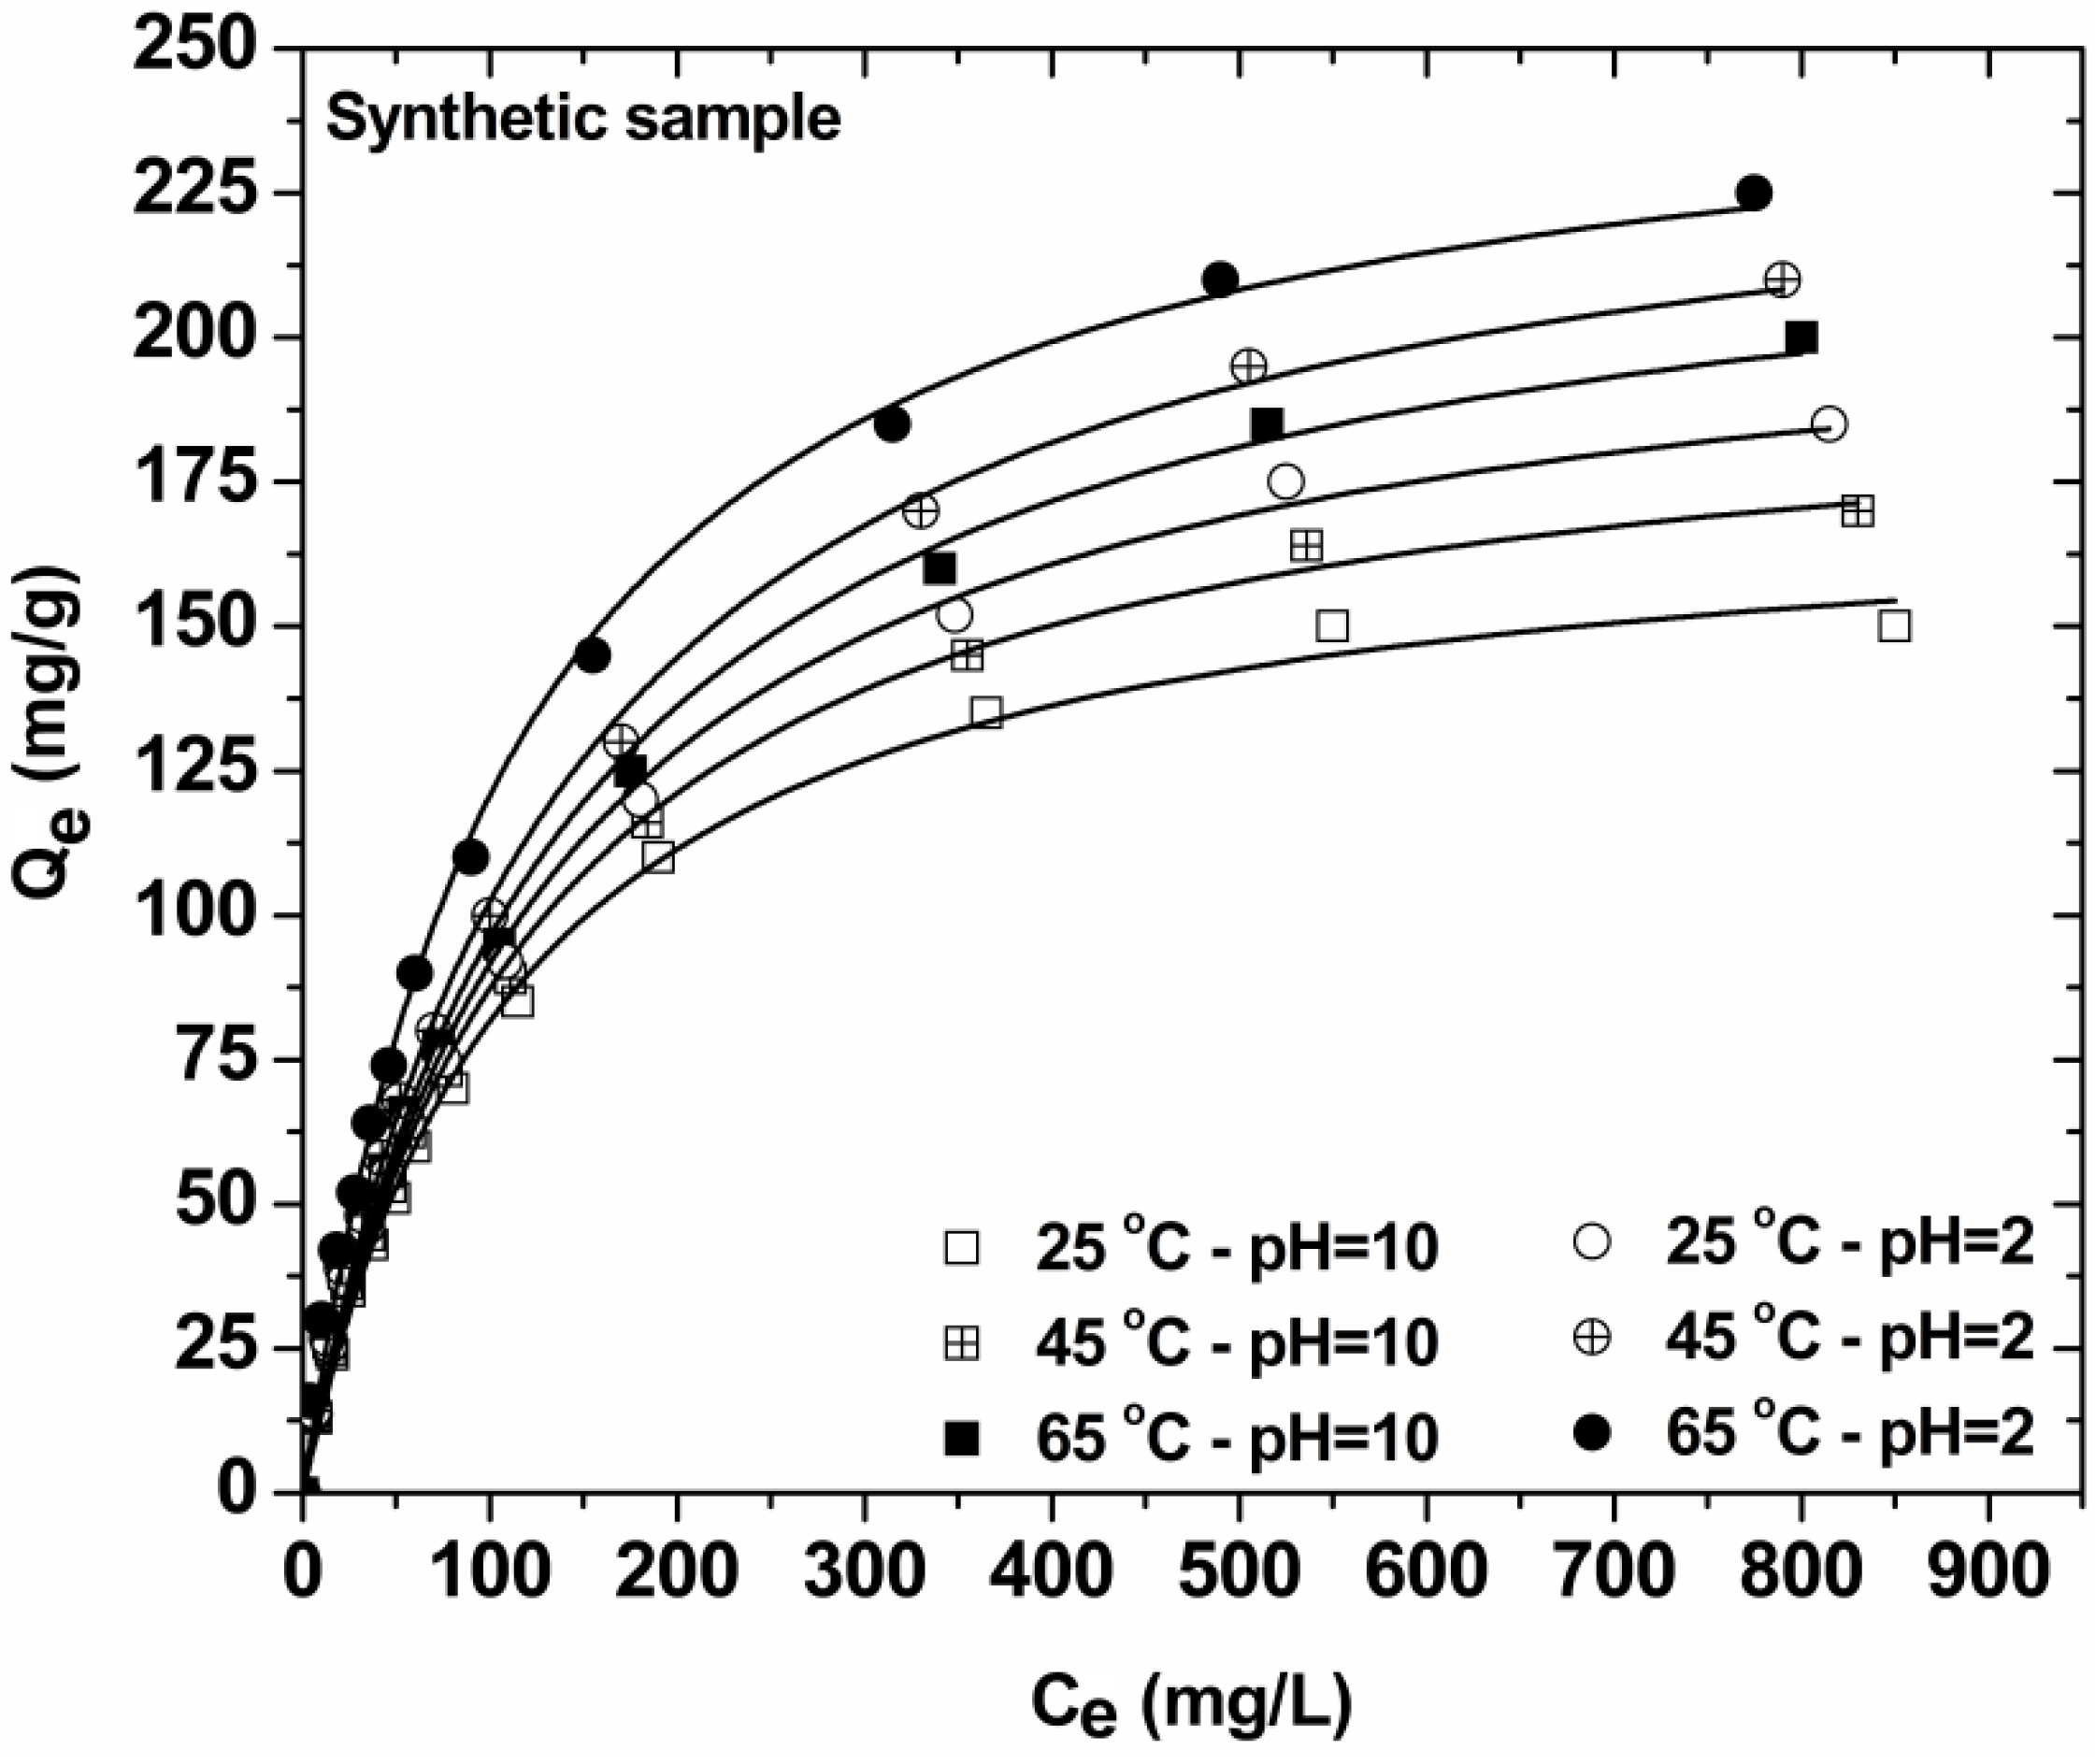
3.4. Effect of Initial Dye Concentration—Isotherms (Synthetic Samples)

| Synthetic sample | Langmuir equation | Freundlich equation | Langmuir-Freundlich (L-F) equation | ||||||||
|---|---|---|---|---|---|---|---|---|---|---|---|
| T | Qm | KL | R2 | KF | n | R2 | Qm | KLF | b | R2 | |
| °C | mg/g | L/mg | mg1−1/nL1/ng−1 | mg/g | (L/mg)1/b | ||||||
| pH = 10 | 25 | 175 | 0.0088 | 0.997 | 11.83 | 2.53 | 0.957 | 179 | 0.0082 | 0.957 | 0.997 |
| 45 | 197 | 0.0080 | 0.997 | 11.59 | 2.41 | 0.969 | 212 | 0.0066 | 0.898 | 0.999 | |
| 65 | 232 | 0.0071 | 0.997 | 11.44 | 2.27 | 0.980 | 269 | 0.0047 | 0.828 | 0.999 | |
| pH = 2 | 25 | 214 | 0.0075 | 0.997 | 11.47 | 2.34 | 0.976 | 241 | 0.0054 | 0.850 | 0.999 |
| 45 | 245 | 0.0072 | 0.997 | 12.08 | 2.27 | 0.978 | 278 | 0.0051 | 0.848 | 0.999 | |
| 65 | 254 | 0.0091 | 0.997 | 15.85 | 2.43 | 0.975 | 287 | 0.0064 | 0.835 | 0.999 | |
3.5. Thermodynamics
| Synthetic sample | C0 | T | Qe | Kc | ΔG0 | ΔH0 | ΔS0 |
|---|---|---|---|---|---|---|---|
| mg/L | K | mg/g | kJ/mol | kJ/mol | kJ/mol K | ||
| pH = 2 | 20 | 298 | 13.72 | 2.17 | −1.92 | +5.79 | +1.513 |
| (optimum) | 318 | 14.21 | 2.45 | −2.37 | |||
| 338 | 16.02 | 4.00 | −3.90 | ||||
| 100 | 298 | 55.01 | 1.22 | −0.50 | +3.32 | +0.935 | |
| 318 | 57.98 | 1.38 | −0.85 | ||||
| 338 | 64.04 | 1.78 | −1.62 | ||||
| 500 | 298 | 152.11 | 0.44 | 2.05 | +1.68 | +0.746 | |
| 318 | 170.05 | 0.52 | 1.75 | ||||
| 338 | 184.97 | 0.59 | 1.50 | ||||
| 1000 | 298 | 185.02 | 0.23 | 3.67 | +0.61 | +0.622 | |
| 318 | 209.98 | 0.27 | 3.50 | ||||
| 338 | 225.02 | 0.29 | 3.48 | ||||
| pH ~ 10 | 20 | 298 | 13.00 | 1.86 | −1.53 | +2.53 | +0.873 |
| (natural/non-adjusted) | 318 | 13.41 | 2.03 | −1.87 | |||
| 338 | 14.04 | 2.33 | −2.38 | ||||
| 100 | 298 | 51.01 | 1.04 | −0.10 | +1.72 | +0.603 | |
| 318 | 52.95 | 1.13 | −0.32 | ||||
| 338 | 56.04 | 1.27 | −0.68 | ||||
| 500 | 298 | 135.01 | 0.37 | 2.46 | +1.19 | +0.571 | |
| 318 | 145.07 | 0.41 | 2.37 | ||||
| 338 | 160.02 | 0.47 | 2.12 | ||||
| 1000 | 298 | 149.96 | 0.18 | 4.30 | +1.02 | +0.503 | |
| 318 | 170.07 | 0.20 | 4.19 | ||||
| 338 | 200.02 | 0.25 | 3.90 |
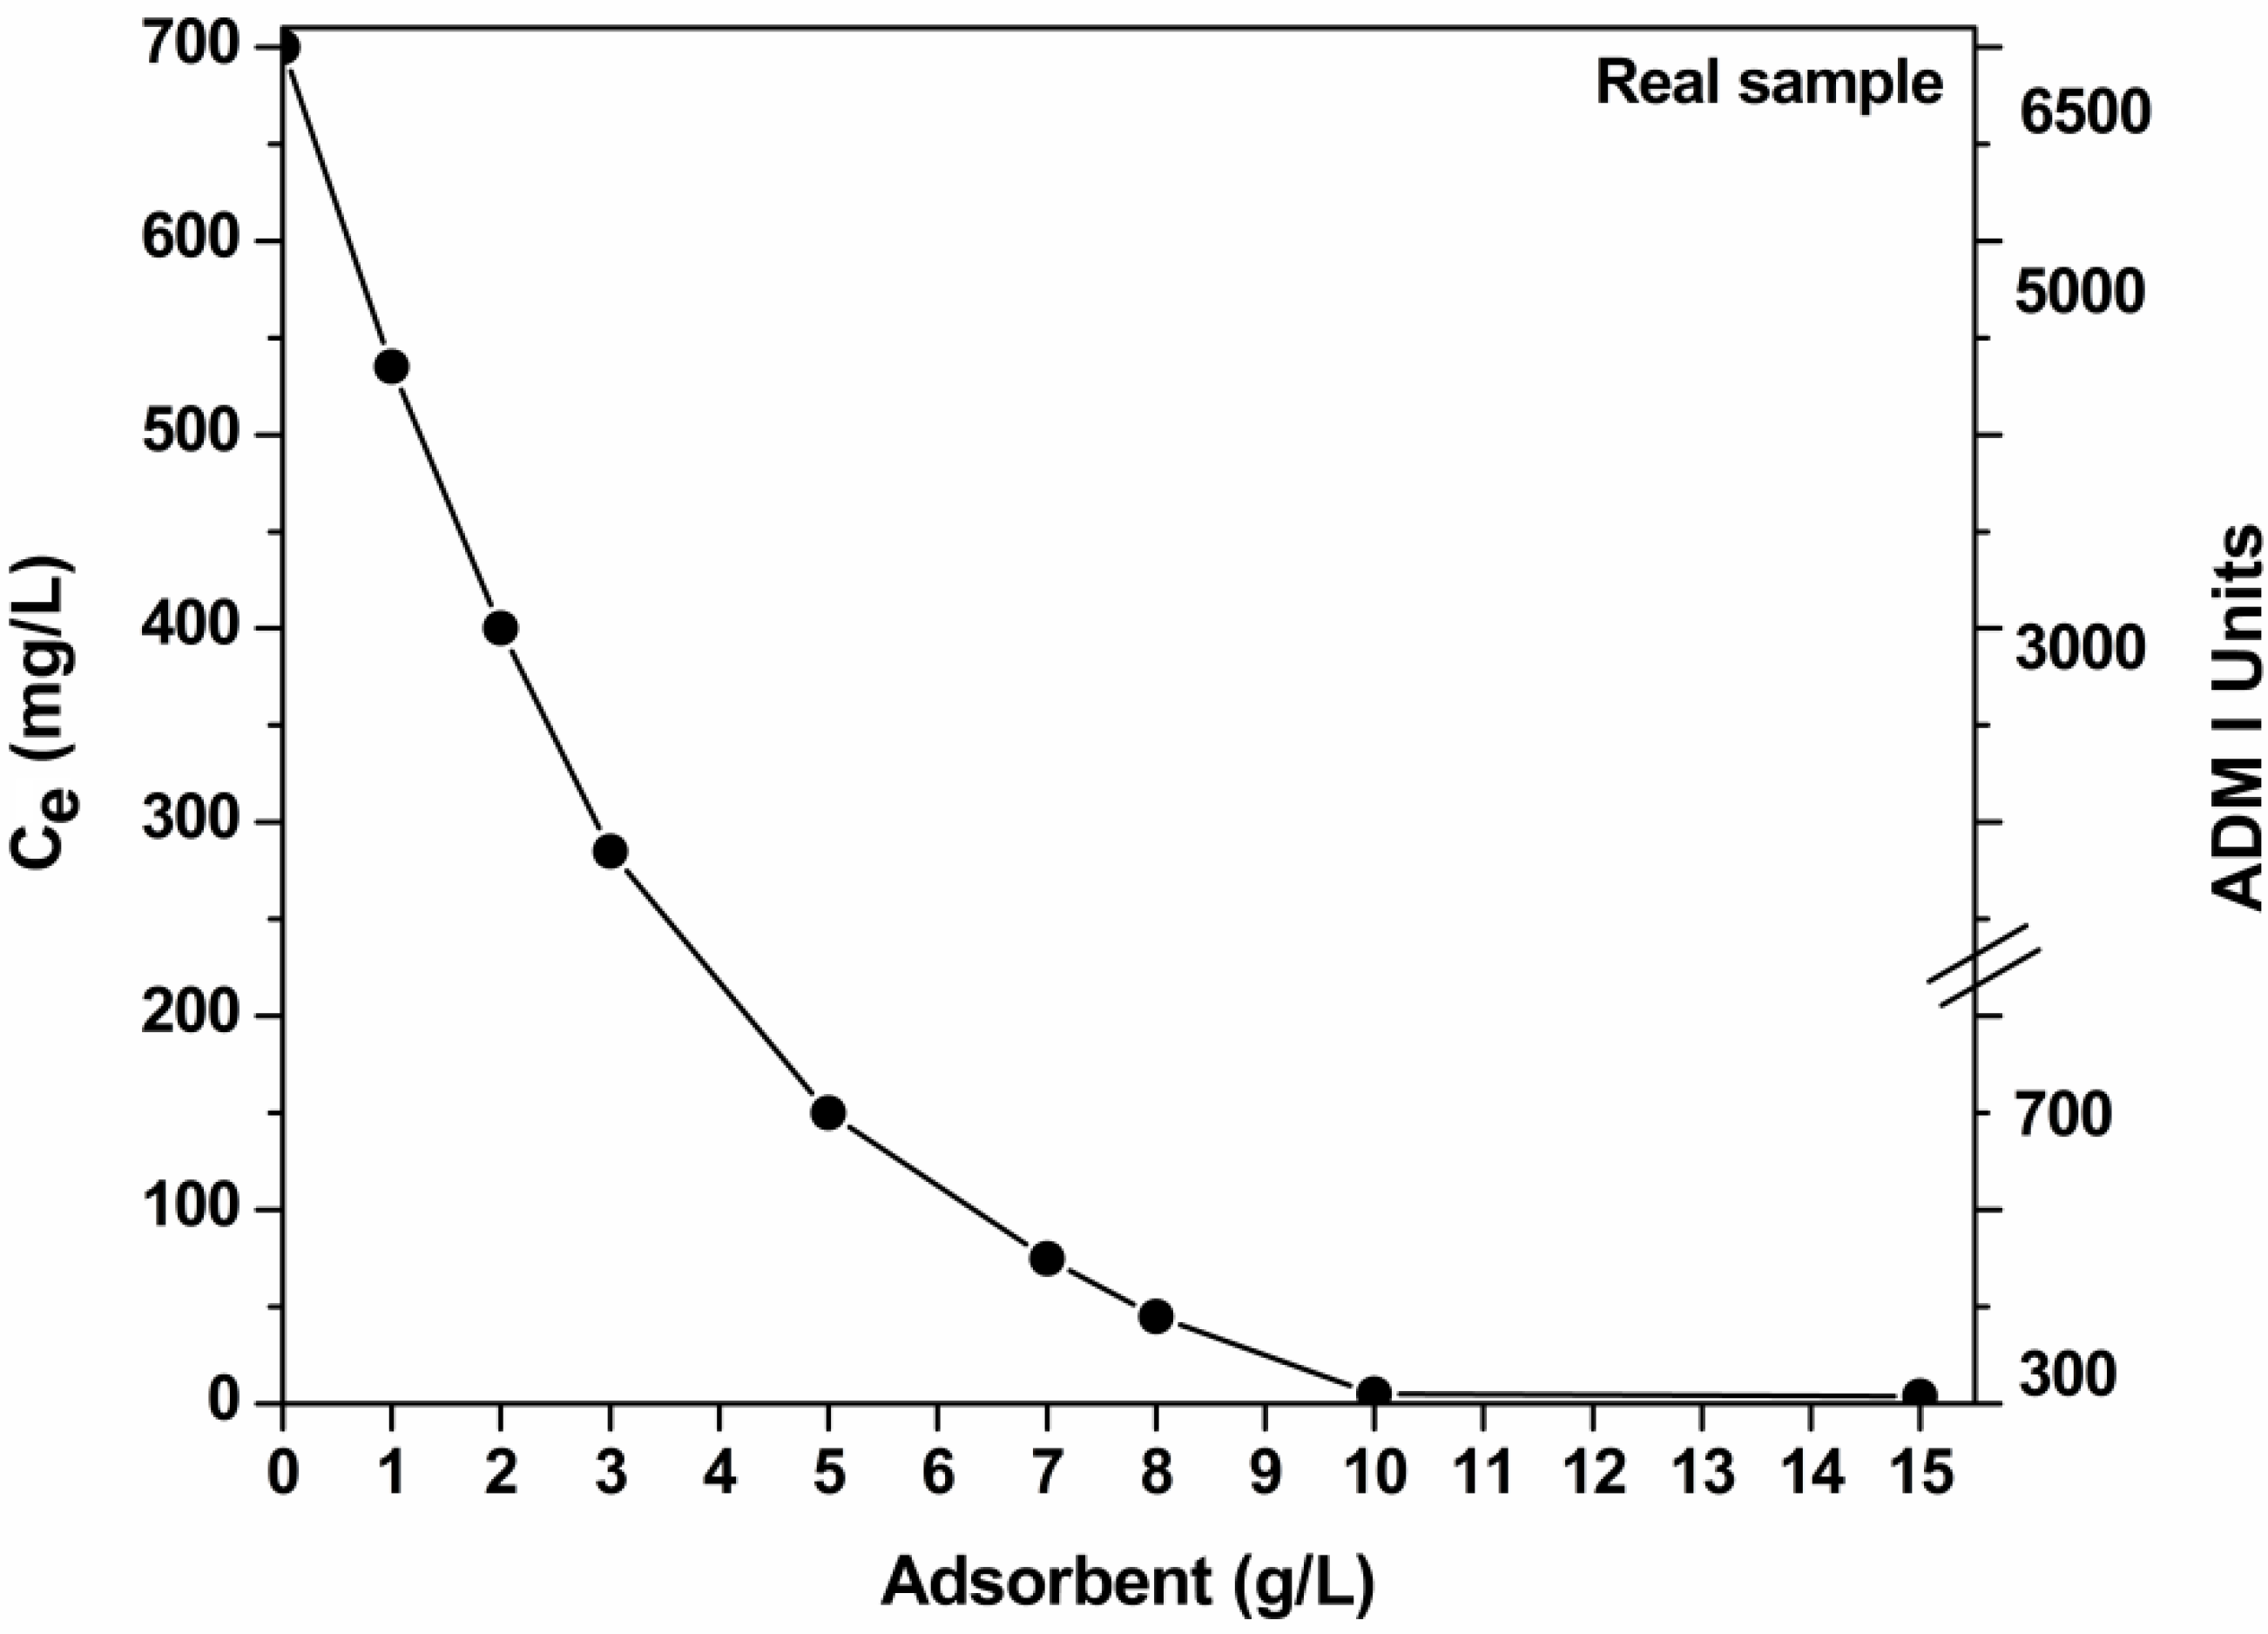
3.6. Effect of Dosage of Adsorbent (Real Samples)

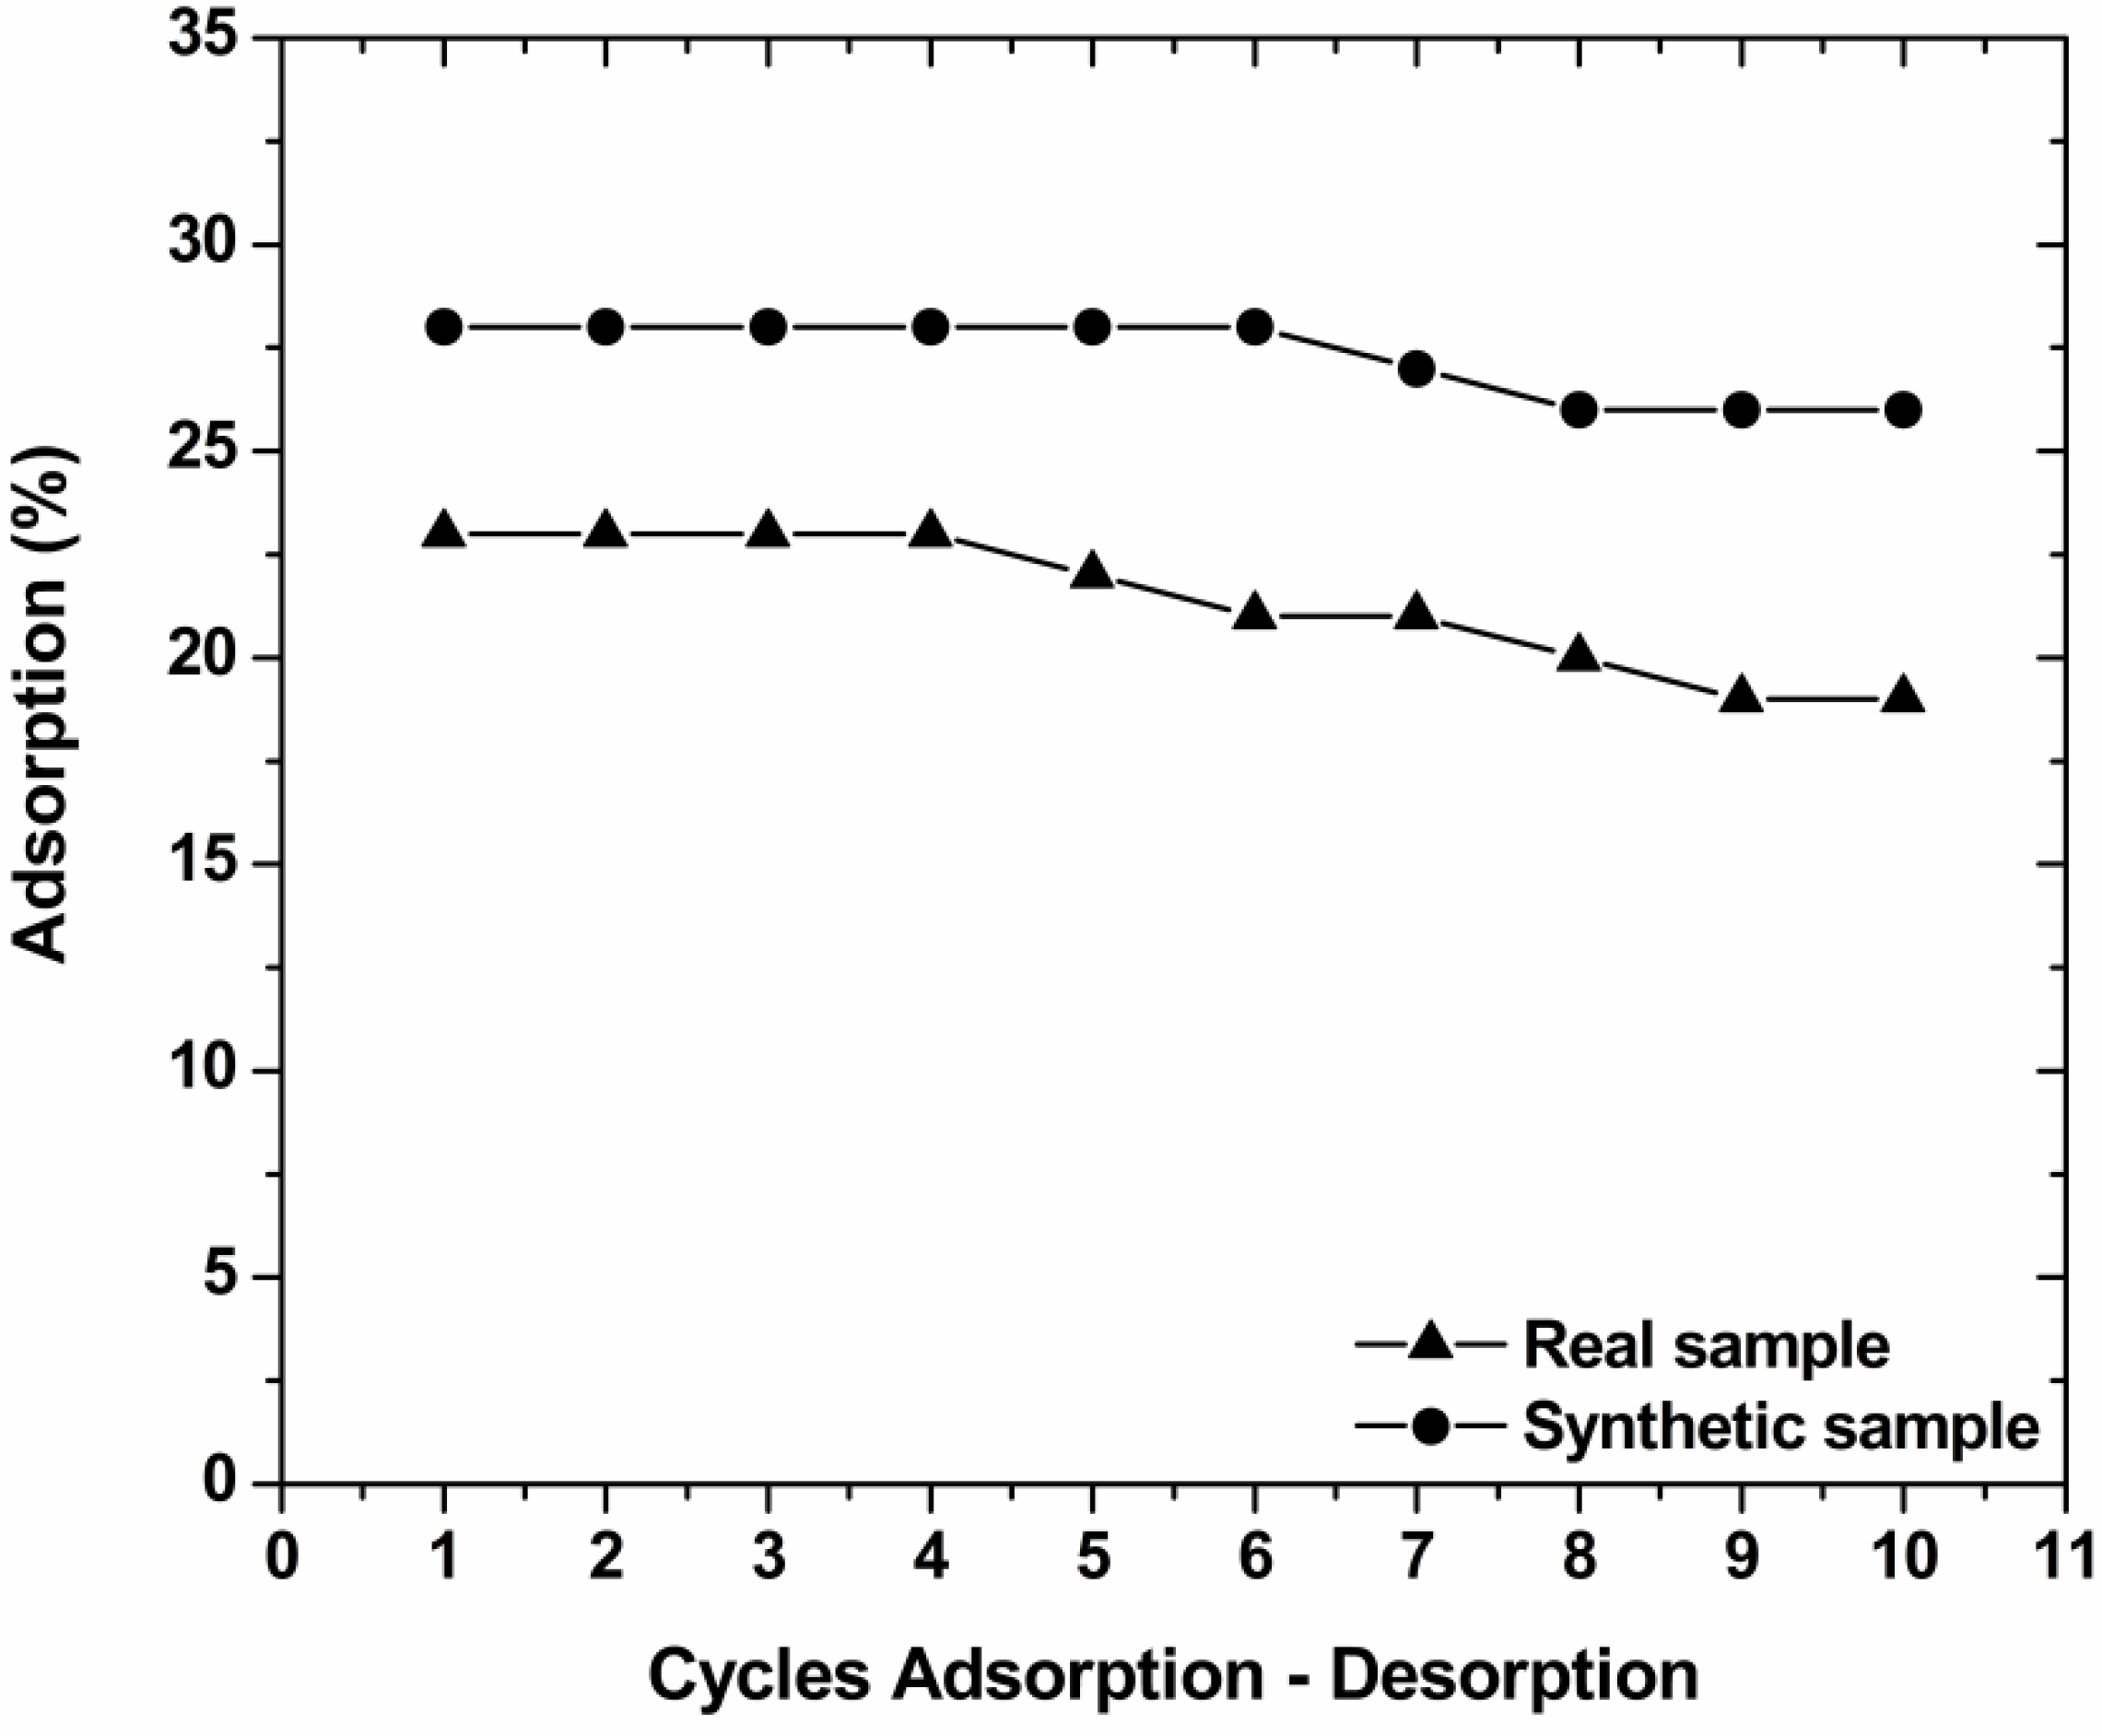
3.7. Desorption–Reuse

4. Conclusions
Acknowledgments
References
- Mishra, G.; Tripathy, M. A critical review of the treatments for decolourization of textile effluent. Colourage 1993, 40, 35–38. [Google Scholar]
- Blackburn, R.S. Natural polysaccharides and their interactions with dye molecules: Applications in effluent treatment. Environ. Sci. Technol. 2004, 38, 4905–4909. [Google Scholar] [CrossRef] [PubMed]
- Sun, Q.; Yang, L. The adsorption of basic dyes from aqueous solution on modified peat-resin particle. Water Res. 2003, 37, 1535–1544. [Google Scholar] [CrossRef] [PubMed]
- Kyzas, G.Z.; Kostoglou, M.; Vassiliou, A.A.; Lazaridis, N.K. Treatment of real effluents from dyeing reactor: Experimental and modeling approach by adsorption onto chitosan. Chem. Eng. J. 2011, 168, 577–585. [Google Scholar] [CrossRef]
- Robinson, T.; McMullan, G.; Marchant, R.; Nigam, P. Remediation of dyes in textile effluent: A critical review on current treatment technologies with a proposed alternative. Bioresour. Technol. 2001, 77, 247–255. [Google Scholar] [CrossRef] [PubMed]
- Zollinger, H. Color Chemistry: Synthesis, Properties and Applications of Organic Dyes and Pigments; Wiley-VCH Verlag GmbH: Weinheim, Germany, 1987. [Google Scholar]
- O'Neill, C.; Hawkes, F.R.; Hawkes, D.L.; Lourenço, N.D.; Pinheiro, H.M.; Delée, W. Colour in textile effluents—sources, measurement, discharge consents and simulation: A review. J. Chem. Technol. Biotechnol. 1999, 74, 1009–1018. [Google Scholar] [CrossRef]
- Al-Degs, Y.S.; Khraisheh, M.A.M.; Allen, S.J.; Ahmad, M.N. Adsorption characteristics of reactive dyes in columns of activated carbon. J. Hazard. Mater. 2009, 165, 944–949. [Google Scholar] [CrossRef] [PubMed]
- Crini, G. Non-conventional low-cost adsorbents for dye removal: A review. Bioresour. Technol. 2006, 97, 1061–1085. [Google Scholar] [CrossRef] [PubMed]
- Fiorentin, L.D.; Trigueros, D.E.G.; Módenes, A.N.; Espinoza-Quiñones, F.R.; Pereira, N.C.; Barros, S.T.D.; Santos, O.A.A. Biosorption of reactive blue 5G dye onto drying orange bagasse in batch system: Kinetic and equilibrium modeling. Chem. Eng. J. 2010, 163, 68–77. [Google Scholar] [CrossRef]
- Kaushik, C.P.; Tuteja, R.; Kaushik, N.; Sharma, J.K. Minimization of organic chemical load in direct dyes effluent using low cost adsorbents. Chem. Eng. J. 2009, 155, 234–240. [Google Scholar] [CrossRef]
- Konaganti, V.K.; Kota, R.; Patil, S.; Madras, G. Adsorption of anionic dyes on chitosan grafted poly(alkyl methacrylate)s. Chem. Eng. J. 2010, 158, 393–401. [Google Scholar] [CrossRef]
- Azouaou, N.; Sadaoui, Z.; Djaafri, A.; Mokaddem, H. Adsorption of cadmium from aqueous solution onto untreated coffee grounds: Equilibrium, kinetics and thermodynamics. J. Hazard. Mater. 2010, 184, 126–134. [Google Scholar] [CrossRef] [PubMed]
- Boonamnuayvitaya, V.; Chaiya, C.; Tanthapanichakoon, W.; Jarudilokkul, S. Removal of heavy metals by adsorbent prepared from pyrolyzed coffee residues and clay. Sep. Purif. Technol. 2004, 35, 11–22. [Google Scholar] [CrossRef]
- Ahmad, M.A.; Rahman, N.K. Equilibrium, kinetics and thermodynamic of Remazol Brilliant Orange 3R dye adsorption on coffee husk-based activated carbon. Chem. Eng. J. 2011, 170, 154–161. [Google Scholar] [CrossRef]
- Baek, M.H.; Ijagbemi, C.O.; O, S.J.; Kim, D.S. Removal of Malachite Green from aqueous solution using degreased coffee bean. J. Hazard. Mater. 2010, 176, 820–828. [Google Scholar] [CrossRef] [PubMed]
- Franca, A.S.; Oliveira, L.S.; Ferreira, M.E. Kinetics and equilibrium studies of methylene blue adsorption by spent coffee grounds. Desalination 2009, 249, 267–272. [Google Scholar] [CrossRef]
- Oliveira, L.S.; Franca, A.S.; Alves, T.M.; Rocha, S.D.F. Evaluation of untreated coffee husks as potential biosorbents for treatment of dye contaminated waters. J. Hazard. Mater. 2008, 155, 507–512. [Google Scholar] [CrossRef] [PubMed]
- Mussatto, S.I.; Machado, E.M.S.; Martins, S.; Teixeira, J.A. Production, composition, and application of coffee and its industrial residues. Food Bioprocess Technol. 2011, 4, 661–672. [Google Scholar] [CrossRef] [Green Version]
- Valdés, H.; Sánchez-Polo, M.; Rivera-Utrilla, J.; Zaror, C.A. Effect of ozone treatment on surface properties of activated carbon. Langmuir 2002, 18, 2111–2116. [Google Scholar] [CrossRef]
- Boehm, H.P. Chemical Identification of Surface Groups. Adv. Catal. 1966, 16, 179–274. [Google Scholar]
- Ho, Y.S.; Ng, J.C.Y.; McKay, G. Kinetics of pollutant sorption by biosorbents: Review. Sep. Purif. Methods 2000, 29, 189–232. [Google Scholar] [CrossRef]
- Langmuir, I. The adsorption of gases on plane surfaces of glass, mica and platinum. J. Am. Chem. Soc. 1918, 40, 1361–1403. [Google Scholar] [CrossRef]
- Freundlich, H. Over the adsorption in solution. Z. Phys. Chem. 1906, 57, 385–470. [Google Scholar]
- Tien, C. Adsorption Calculations and Modeling; Butterworth-Heinemann: Boston, MA, USA, 1994. [Google Scholar]
- Smith, J.M.; van Ness, H.C. Introduction to Chemical Engineering Thermodynamics; McGraw-Hill: New York, NY, USA, 1987. [Google Scholar]
- Beer, A. Bestimmung der absorption des rothen lichts in farbigen flussigkeiten. Ann. Phys. 1852, 86, 78–88. [Google Scholar] [CrossRef]
- Allen, W.; Prescott, W.B.; Derby, R.E.; Garland, C.E.; Peret, J.M.; Saltzman, M. Determination of color of water and wastewater by means of ADMI color values. In Proceeding of 28th Industrial Waste Conference, West Lafayette, IN, USA, 1–3 May 1973; pp. 661–675.
- AOAC International. Official Methods of Analysis of AOAC International, 18th ed.; AOAC International: Gaithersburg, MD, USA, 1995. [Google Scholar]
- Kyzas, G.Z.; Lazaridis, N.K.; Mitropoulos, A.C. Removal of dyes from aqueous solutions with untreated coffee residues as potential low-cost adsorbents: Equilibrium, reuse and thermodynamic approach. Chem. Eng. J. 2012, 189–190, 148–159. [Google Scholar] [CrossRef]
- Oliveira, L.S.; Franca, A.S. Low-cost adsorbents from agri-food wastes. In Food Science and Technology: New Research; Greco, L.V., Bruno, M.N., Eds.; Nova Science Publishers: New York, NY, USA, 2008; pp. 171–209. [Google Scholar]
- Sakkayawong, N.; Thiravetyan, P.; Nakbanpote, W. Adsorption mechanism of synthetic reactive dye wastewater by chitosan. J. Colloid Interface Sci. 2005, 286, 36–42. [Google Scholar] [CrossRef] [PubMed]
- Wang, L.; Wang, A. Adsorption properties of congo red from aqueous solution onto N,O-carboxymethyl-chitosan. Bioresour. Technol. 2008, 99, 1403–1408. [Google Scholar] [CrossRef] [PubMed]
- Lazaridis, N.K.; Kyzas, G.Z.; Vassiliou, A.A.; Bikiaris, D.N. Chitosan derivatives as biosorbents for basic dyes. Langmuir 2007, 23, 7634–7643. [Google Scholar] [CrossRef] [PubMed]
- Sharma, P.; Kaur, H.; Sharma, M.; Sahore, V. A review on applicability of naturally available adsorbents for the removal of hazardous dyes from aqueous waste. Environ. Monit. Assess. 2011, 183, 151–195. [Google Scholar] [CrossRef] [PubMed]
- Chatterjee, S.; Chatterjee, B.P.; Das, A.R.; Guha, A.K. Adsorption of a model anionic dye, eosin Y, from aqueous solution by chitosan hydrobeads. J. Colloid Interface Sci. 2005, 288, 30–35. [Google Scholar] [CrossRef] [PubMed]
- Chiou, M.S.; Chuang, G.S. Competitive adsorption of dye metanil yellow and RB15 in acid solutions on chemically cross-linked chitosan beads. Chemosphere 2006, 62, 731–740. [Google Scholar] [CrossRef] [PubMed]
- Brunauer, S.; Deming, L.S.; Deming, W.E.; Teller, E. On a theory of the van der Waals adsorption of gases. J. Am. Chem. Soc. 1940, 62, 1723–1732. [Google Scholar] [CrossRef]
- Kyzas, G.Z.; Kostoglou, M.; Lazaridis, N.K. Copper and chromium(VI) removal by chitosan derivatives-Equilibrium and kinetic studies. Chem. Eng. J. 2009, 152, 440–448. [Google Scholar] [CrossRef]
- Unnithan, M.R.; Anirudhan, T.S. The kinetics and thermodynamics of sorption of chromium(VI) onto the iron(III) complex of a carboxylated polyacrylamide-grafted sawdust. Ind. Eng. Chem. Res. 2001, 40, 2693–2701. [Google Scholar] [CrossRef]
- Niazi, A.; Yazdanipour, A.; Ghasemi, J.; Kubista, M. Spectrophotometric and thermodynamic study on the dimerization equilibrium of ionic dyes in water by chemometrics method. Spectrochim. Acta A 2006, 65, 73–78. [Google Scholar] [CrossRef]
- Srivastava, V.C.; Mall, I.D.; Mishra, I.M. Adsorption thermodynamics and isosteric heat of adsorption of toxic metal ions onto bagasse fly ash (BFA) and rice husk ash (RHA). Chem. Eng. J. 2007, 132, 267–278. [Google Scholar] [CrossRef]
© 2012 by the authors; licensee MDPI, Basel, Switzerland. This article is an open access article distributed under the terms and conditions of the Creative Commons Attribution license (http://creativecommons.org/licenses/by/3.0/).
Share and Cite
Kyzas, G.Z. A Decolorization Technique with Spent “Greek Coffee” Grounds as Zero-Cost Adsorbents for Industrial Textile Wastewaters. Materials 2012, 5, 2069-2087. https://doi.org/10.3390/ma5112069
Kyzas GZ. A Decolorization Technique with Spent “Greek Coffee” Grounds as Zero-Cost Adsorbents for Industrial Textile Wastewaters. Materials. 2012; 5(11):2069-2087. https://doi.org/10.3390/ma5112069
Chicago/Turabian StyleKyzas, George Z. 2012. "A Decolorization Technique with Spent “Greek Coffee” Grounds as Zero-Cost Adsorbents for Industrial Textile Wastewaters" Materials 5, no. 11: 2069-2087. https://doi.org/10.3390/ma5112069