Review

Controlling Morphological Parameters of Anodized Titania Nanotubes for Optimized Solar Energy Applications

1
Department of Chemistry, Virginia Tech, Blacksburg, VA 24061-0212, USA
2
Energy and Transportation Science Division, Oak Ridge National Laboratory, Oak Ridge, TN 37831, USA
*
Authors to whom correspondence should be addressed.
Materials 2012, 5(10), 1890-1909; https://doi.org/10.3390/ma5101890
Submission received: 3 September 2012 / Revised: 8 October 2012 / Accepted: 10 October 2012 / Published: 19 October 2012
(This article belongs to the Special Issue Advanced Materials for Water-Splitting)

Abstract

:
Anodized TiO2 nanotubes have received much attention for their use in solar energy applications including water oxidation cells and hybrid solar cells [dye-sensitized solar cells (DSSCs) and bulk heterojuntion solar cells (BHJs)]. High surface area allows for increased dye-adsorption and photon absorption. Titania nanotubes grown by anodization of titanium in fluoride-containing electrolytes are aligned perpendicular to the substrate surface, reducing the electron diffusion path to the external circuit in solar cells. The nanotube morphology can be optimized for the various applications by adjusting the anodization parameters but the optimum crystallinity of the nanotube arrays remains to be realized. In addition to morphology and crystallinity, the method of device fabrication significantly affects photon and electron dynamics and its energy conversion efficiency. This paper provides the state-of-the-art knowledge to achieve experimental tailoring of morphological parameters including nanotube diameter, length, wall thickness, array surface smoothness, and annealing of nanotube arrays.

1. Introduction

Ordered TiO2 nanostructures, including nanoparticles, nanotubes, and nanorods [1,2] have garnered much research for their use in solar energy applications [3,4,5]. In hybrid solar cells, the titania nanostructures accept electrons from photoexcited dye molecules or polymers adsorbed to the surface and direct the electrons into an external circuit. In photoelectrochemical cells for the degradation of pollutants or the oxidation of water, the photoexcited titania nanostructures donate electrons or holes to chemical species adsorbed to the surface. TiO2 nanotubes have also been experimentally applied as gas sensors and supercapacitors but these applications will not be discussed [6,7].
In 1999, Zwilling et al. reported on the anodization of titanium in solutions of fluoride-containing electrolytes to form porous titania nanotubes and Gong et al. later formed nanotubes using higher voltages (Figure 1) [8,9]. Although titania nanotubes can also be formed by other routes [10], the anodization method leads to an aligned array with an adjustable morphology that can be optimized for its various applications. The morphology parameters, e.g., nanotube length, diameter, smoothness, depend on the anodization conditions, such as voltage, electrolyte composition, temperature, and duration. After anodization, the amorphous nanotubes can be annealed to increase the electron mobility, sensitized with dyes or polymers to increase solar photon absorption, and doped or surface-functionalized to adjust the density of states [11,12,13].
Figure 1. Basic setup for the anodization of titanium to titania nanotubes. Reprinted with permission from [14].
Materials 05 01890 g001
Since Honda and Fujishima reported water oxidation by titania thin films in 1972, titania nanoparticles, nanorods and nanotubes have been investigated [15,16,17,18]. Due to their hollow nature, nanotubes have twice the surface area per unit volume compared to nanoparticles and nanorods that have the same outside diameter as the nanotubes. Recently, Zhang and Wang fabricated a photoelectrochemical cell for water splitting that achieved a photoconversion efficiency of 0.84% under AM 1.5 illumination using titania nanotubes without any catalysts [18].
Hybrid solar cells with titania nanotubes, illustrated in Figure 2, have several advantages over other nanostructures and planar solar cells. Nanotubes, which are aligned perpendicular to the conducting substrate, increase electron mobility within the nanotube by directing electrons along a shorter path than nanoparticles [19,20]. The high surface area of nanotubes, compared to nanorods or flat surfaces, allows for more adsorption by electron donors such as molecular dyes and polymers, thus increasing solar photon absorption and charge collection [21]. Commonly used donors include ruthenium polypyridyl complexes (N719, N749), porphyrin dyes, poly(3-hexylthiophene), and poly(p-phenylene vinylene) derivatives [22,23,24,25]. Although titania nanotubes have attracted extensive research as photoanodes in hybrid solar cells, there are several complications that need to be overcome including phase separation between electron donors and titania, polymer penetration into the nanotubes, and efficient electrical contact with conductive glass [20,26].
Figure 2. Solid-state solar cell with nanotubes sensitized by polythiophene polymerized in the nanotubes. Reprinted with permission from [21]. Copyright 2009 Wiley.
Materials 05 01890 g002

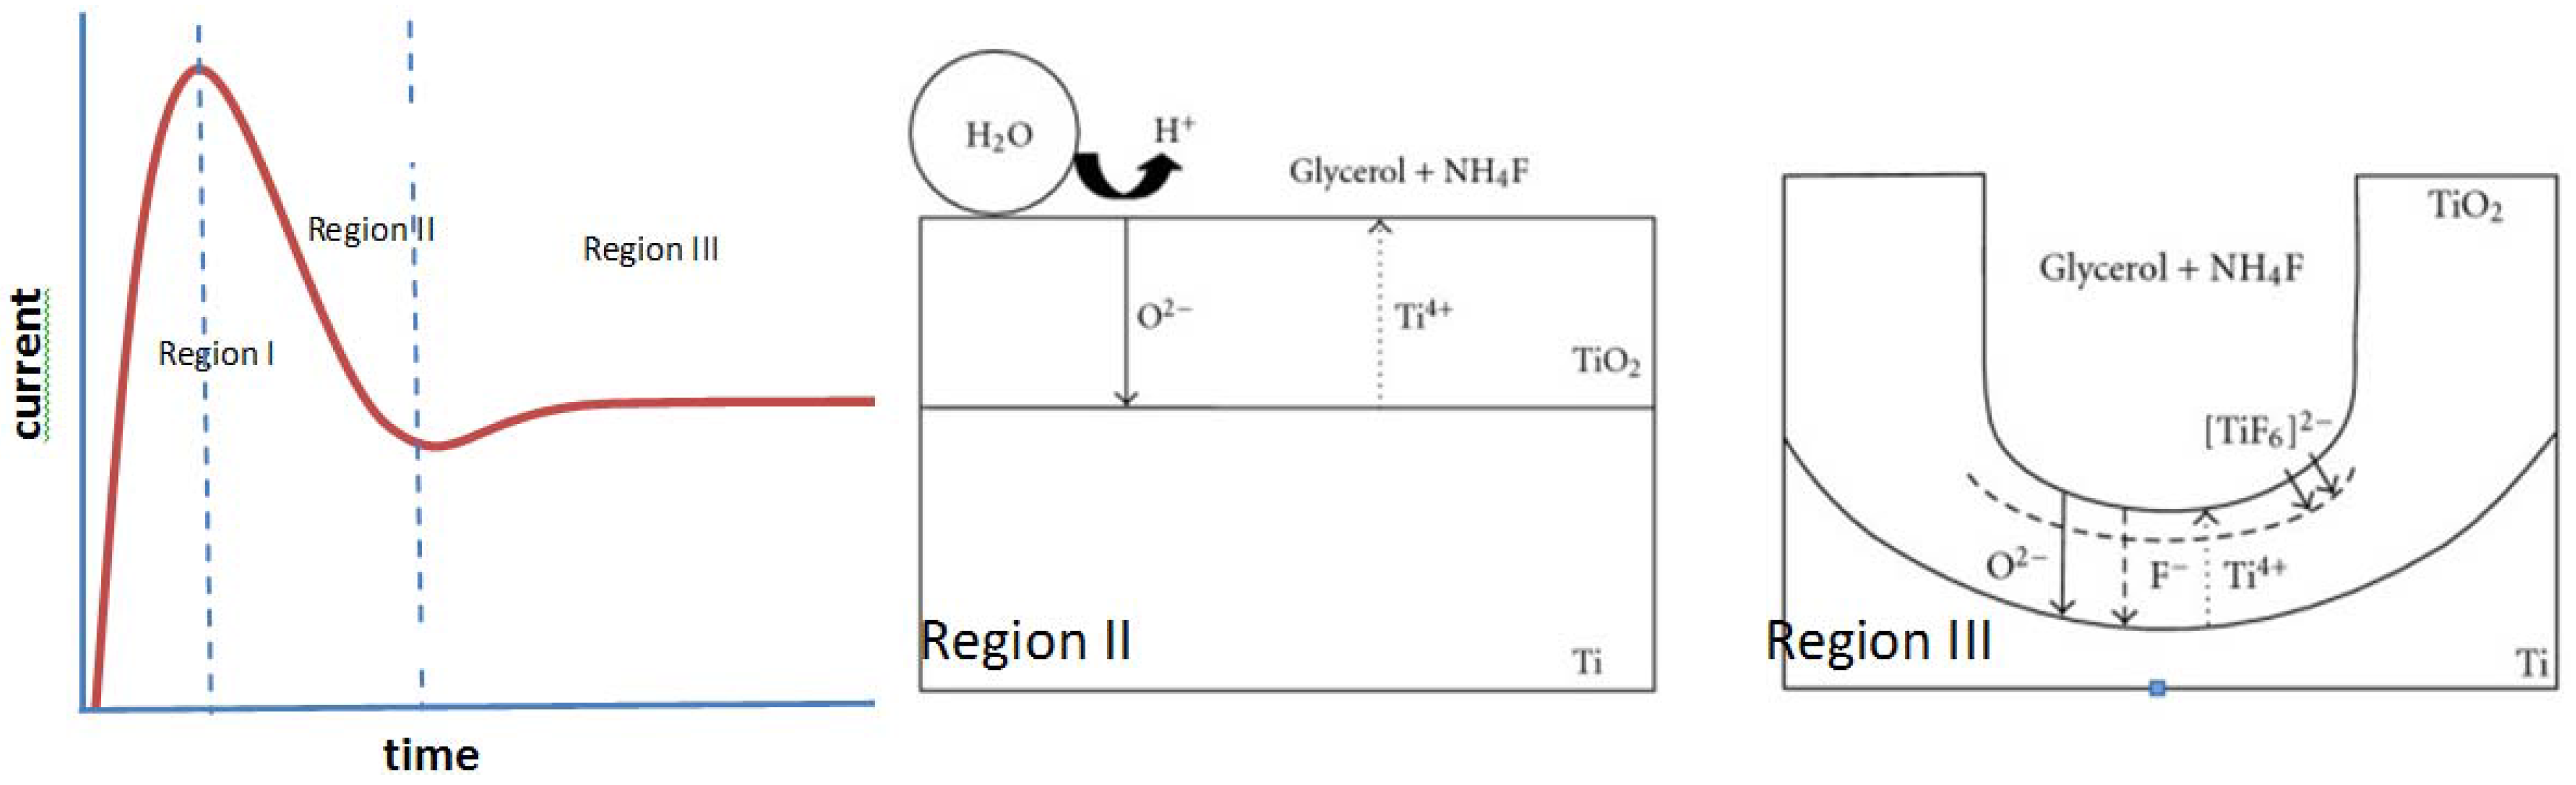
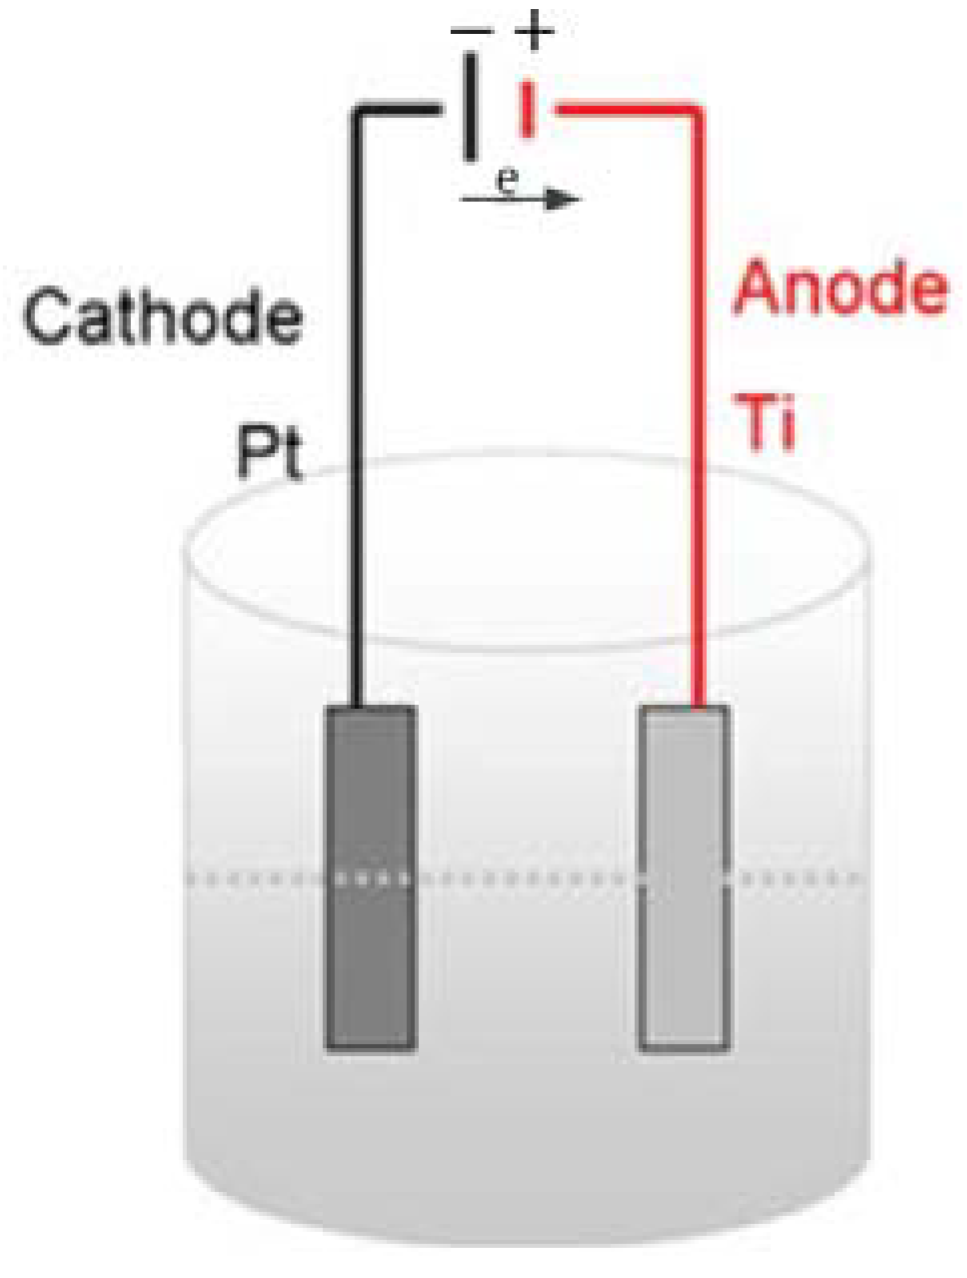
2. Anodized Titania Nanotube Formation

The formation of titania nanotubes by potentiostatic anodization proceeds by similar mechanisms as porous alumina [27,28]. In the first step of the anodization process, the titanium surface is electrochemically oxidized. A compact layer of titanium oxide is formed on the titanium surface through Equation (1) [27,28,29].
[ TiF 6 ] 2   +   2 H 2  TiO 2   +   4 H +   +   6 F
The electrolyte typically contains 0.1 M HF or NH4F providing fluoride ions that complex with Ti4+, Equation (2), and dissolve TiO2, Equation (3) [27,28,29].
Ti 4 + + 6 F     [ TiF 6 ] 2
TiO 2 +   6 F + 4 H + [ TiF 6 ] 2 +   2 H 2 O
Pitting of the oxide layer provides preferential locations for the field-assisted chemical dissolution of TiO2 by fluoride ions through Equations (2) and (3) [27,29]. Nanotubes are formed as the pits are chemically dissolved further into the oxide layer; the pits provide the least resistive route for the current, therefore the high dissolution rate forms the inside of the tubes from the pits. To form highly ordered nanotubes, the first nanotube array is often removed from the titanium foil leaving indentations that facilitate the pitting behavior during re-anodization (Figure 3) [30]. During the formation, the current typically behaves as illustrated in Figure 4. As the voltage increases to its set magnitude, the current increases (Region I) until the oxide layer provides enough resistance and the current decreases (Region II). The current increases again as Equation (2) begins to increase the surface area and thin the oxide layer. The oxidation continues and a steady state between Equations (1)–(3) is reached in Region III (Figure 4) [3,28]. Wang et al. recently published on the formation of metal oxides by anodization and analyze the formation thermodynamically and mechanistically [27].
Figure 3. Scanning electron microscopes (SEM) of titanium substrate after removal of (a) first; (b) second; and (d) third nanotube array. Reprinted with permission from [30]. Copyright 2007 Elsevier.
Materials 05 01890 g003
Figure 4. The current profile and nanotube formation scheme are shown. The current increases sharply in Region I as voltage is applied across the electrolyte and bare titanium foil. A compact titanium dioxide layer forms in Region II. In Region III, oxide formation and dissolution reach a steady state and nanotubes form (Equations (1)–(3)). Illustrations reprinted from [31]. Creative Commons 2010.
Materials 05 01890 g004

2.1. Control of Morphology

Many experimental conditions of the anodization process are controlled to form nanotubes with the desired morphology: duration, applied voltage, temperature, Ti foil roughness, electrolyte composition. While the duration, voltage, and fluoride concentration primarily controls the nanotube length, diameter, and growth rate, many characteristics of the electrolyte affect the process including the solvent, water content, pH, viscosity, conductivity, and organic additives. Table 1 shows the range of conditions that have been used to form titania nanotubes.
Table 1. Range of conditions used to control the nanotube morphology. Electrolyte age refers to its previous use for titanium anodization.
Voltage10–240V [32,33]Electrolyte Solventwater, ethylene glycol, diethylene glycol, DMSO, DMF, formamide, acetic acid [34,35]
Durationseconds–9 days [36,37]Water Content0%–100% [38]
Etching speciesHF, NH4F, Bu4NF [34]Electrolyte AdditivesNa2EDTA, H2O2 lactic acid [31,36,39]
Fluoride Conc.0.05–0.5M NH4F [3,31]Electrolyte Ageunused-120 h [40]

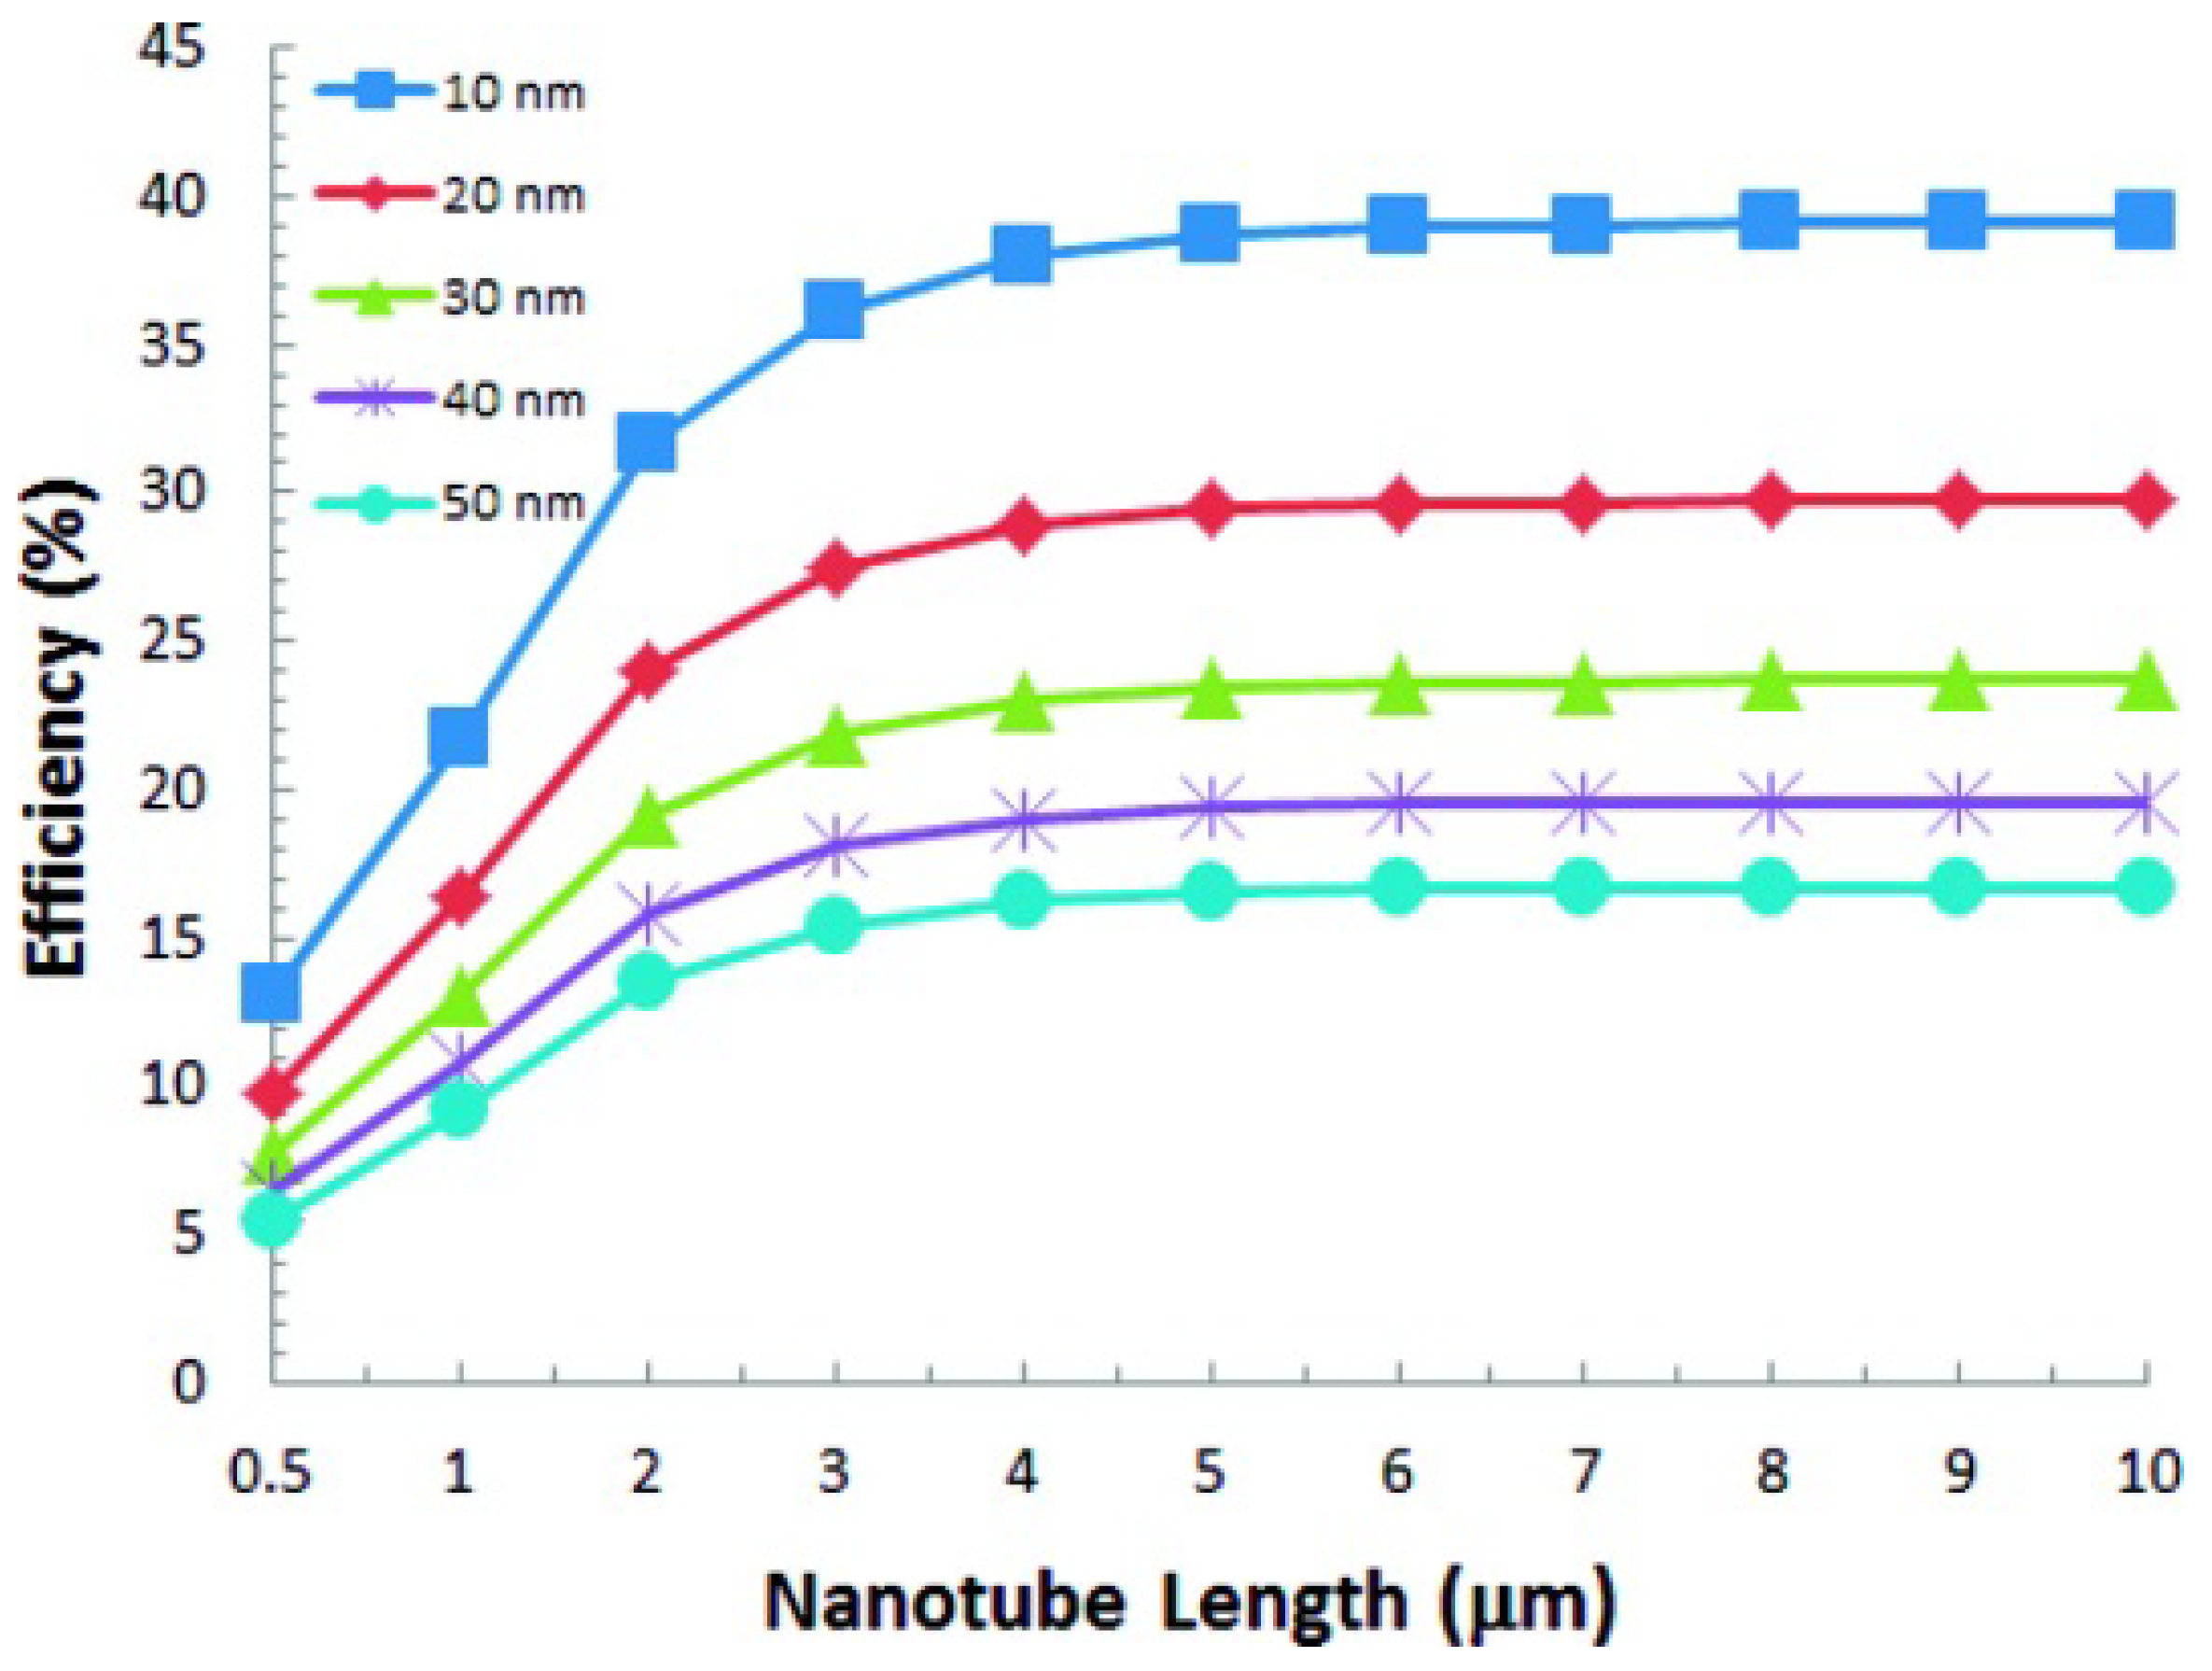
2.1.1. Nanotube Length

It is well established that the titania nanotube growth rate is directly proportional to the duration of anodization [3,41,42,43,44,45], the concentration of fluoride ions [3,4,43,45,46], the voltage (Figure 5) [3,43,44,45,46,47], and the electrolyte conductivity [40,46,48]. Aqueous electrolytes limit the nanotube length to 500 nm for acidic and 2 µm for neutral electrolytes since the rate of Equation (3) is faster in aqueous electrolytes [3]. The longest nanotubes reported, 1 mm, required nine days of anodization at 60 V with 0.5 wt % NH4F and 3% water in ethylene glycol [37]. With the same electrolyte concentration and voltage, 5 µm long nanotubes are obtained after 17 h [46].
Figure 5. Effect of (a) water content and (b) anodization voltage on the nanotube growth rate using 0.09 M (0.3 wt %) NH4F in ethylene glycol. Reprinted with permission from [38]. Copyright 2010 IOP Publishing.
Materials 05 01890 g005
Nanotube formation requiring long anodization durations would not be time-efficient on an industrial scale and several routes have addressed the concern and achieved fast growth rates. Most notably, nanotubes 7 μm long have been grown in 15 s by the addition of 1.5 M lactic acid to the electrolyte solution (Table 2) [36]. Addition of Na2EDTA, H2O2, and up to 0.5 M NH4F have been used to increase the nanotube growth rate [31,38,39]. Lactic acid and EDTA assist fluoride by chelating Ti4+ and H2O2 provides an alternate source for oxygen, possibly through radical species [31,36,39]. Fast nanotube growth rates are also determined by a balance between water and fluoride concentration. High fluoride concentration (>0.1 M NH4F) enhances the dissolution of TiO2 by Equation (3) while addition of water allows for a sufficient rate of titanium oxidation by Equation (1). However, addition of water also slows the dissolution of titania by Equation (3) and is supported by experimental results. Upon addition of 1% water to 0.5 M NH4F in anhydrous ethylene glycol, the growth rate increased from 83 nm/min to 308 nm/min at 60 V but 2% water only increased the formation rate to 217 nm/min [43].
Table 2. Experimental conditions to achieve efficient lengths.
Length (µm)DurationElectrolyteVoltage (V)Reference
202 h0.09 M NH4F ethylene glycol60[48] (SI)
200.5 h0.5 M NH4F, 0.25 M Na2EDTA, 5% water, ethylene glycol80[31]
181 min0.1 M NH4F, 1.5 M lactic acid, 5% water, ethylene glycol (60 °C)150[36]
Liu et al. used a theoretical model, based on the reduction of oxygen, to determine the most efficient dimensions of un-sensitized titania nanotubes for photocatalysis [49]. Based on the diffusion of oxygen and the molar absorptivity of TiO2, the photocatalytic efficiency plateaus with nanotubes greater than 5 µm long (Figure 6) [49]. Experimental results show similar saturation behavior, albeit at longer nanotube lengths [50,51,52,53]. For example, un-sensitized nanotube arrays 12 µm long were most efficient for the degradation of gaseous benzene and toluene when compared to nanotubes ranging from 800 nm to 12 µm in length [50]. Similarly, for the catalysis of acetaldehyde and phenol, the efficiency continued to increase with nanotube length ranging from 200 nm to 17 µm [51,52].
Figure 6. Theoretically efficient nanotube lengths for the reduction of oxygen. The theoretical model considers un-sensitized nanotubes illuminated by UV light. The series corresponds to the inner radius of the nanotubes, ranging from 10 nm to 50 nm. Reprinted with permission from [49]. Copyright 2012 American Chemical Society.
Materials 05 01890 g006
In solar cells using titania nanotubes as the photoanode, there is a balance between absorbing the most photons and reducing the distance the electron must travel in the nanotubes. In accordance with the Beer-Lambert law, more photons are harvested with longer nanotubes that can adsorb more dye or polymer (Figure 4). However, longer nanotubes have more recombination centers, higher series resistance, and lower open circuit potentials [54,55]. Thus, to ensure efficient electron collection, optimized nanotubes lengths do not exceed the electron diffusion length estimated to be 10–100 µm in titania nanotubes and 10 µm in nanoparticles [55,56,57,58].
Experimental results demonstrate the nanotube length optimization since the efficiency of hybrid solar cells employing nanotubes decreases after a certain length is exceeded (Figure 7). Park et al. found that the photocurrent density increased with increasing TiO2 nanotube length up to 35 µm and attributed the effect to the higher surface area for dye-loading [59] Dubey et al. found that the photocurrent density and energy conversion efficiency was a maximum for 22 µm long nanotubes (16.3 mA/cm2, 6.12%) and decreased at 38 µm because of increased recombination at surface defects [60].
Figure 7. Effect of the length of nanotubes in dye-sensitized solar cells (DSSCs) on the solar power conversion efficiency. Reprinted with permission from [3].
Materials 05 01890 g007

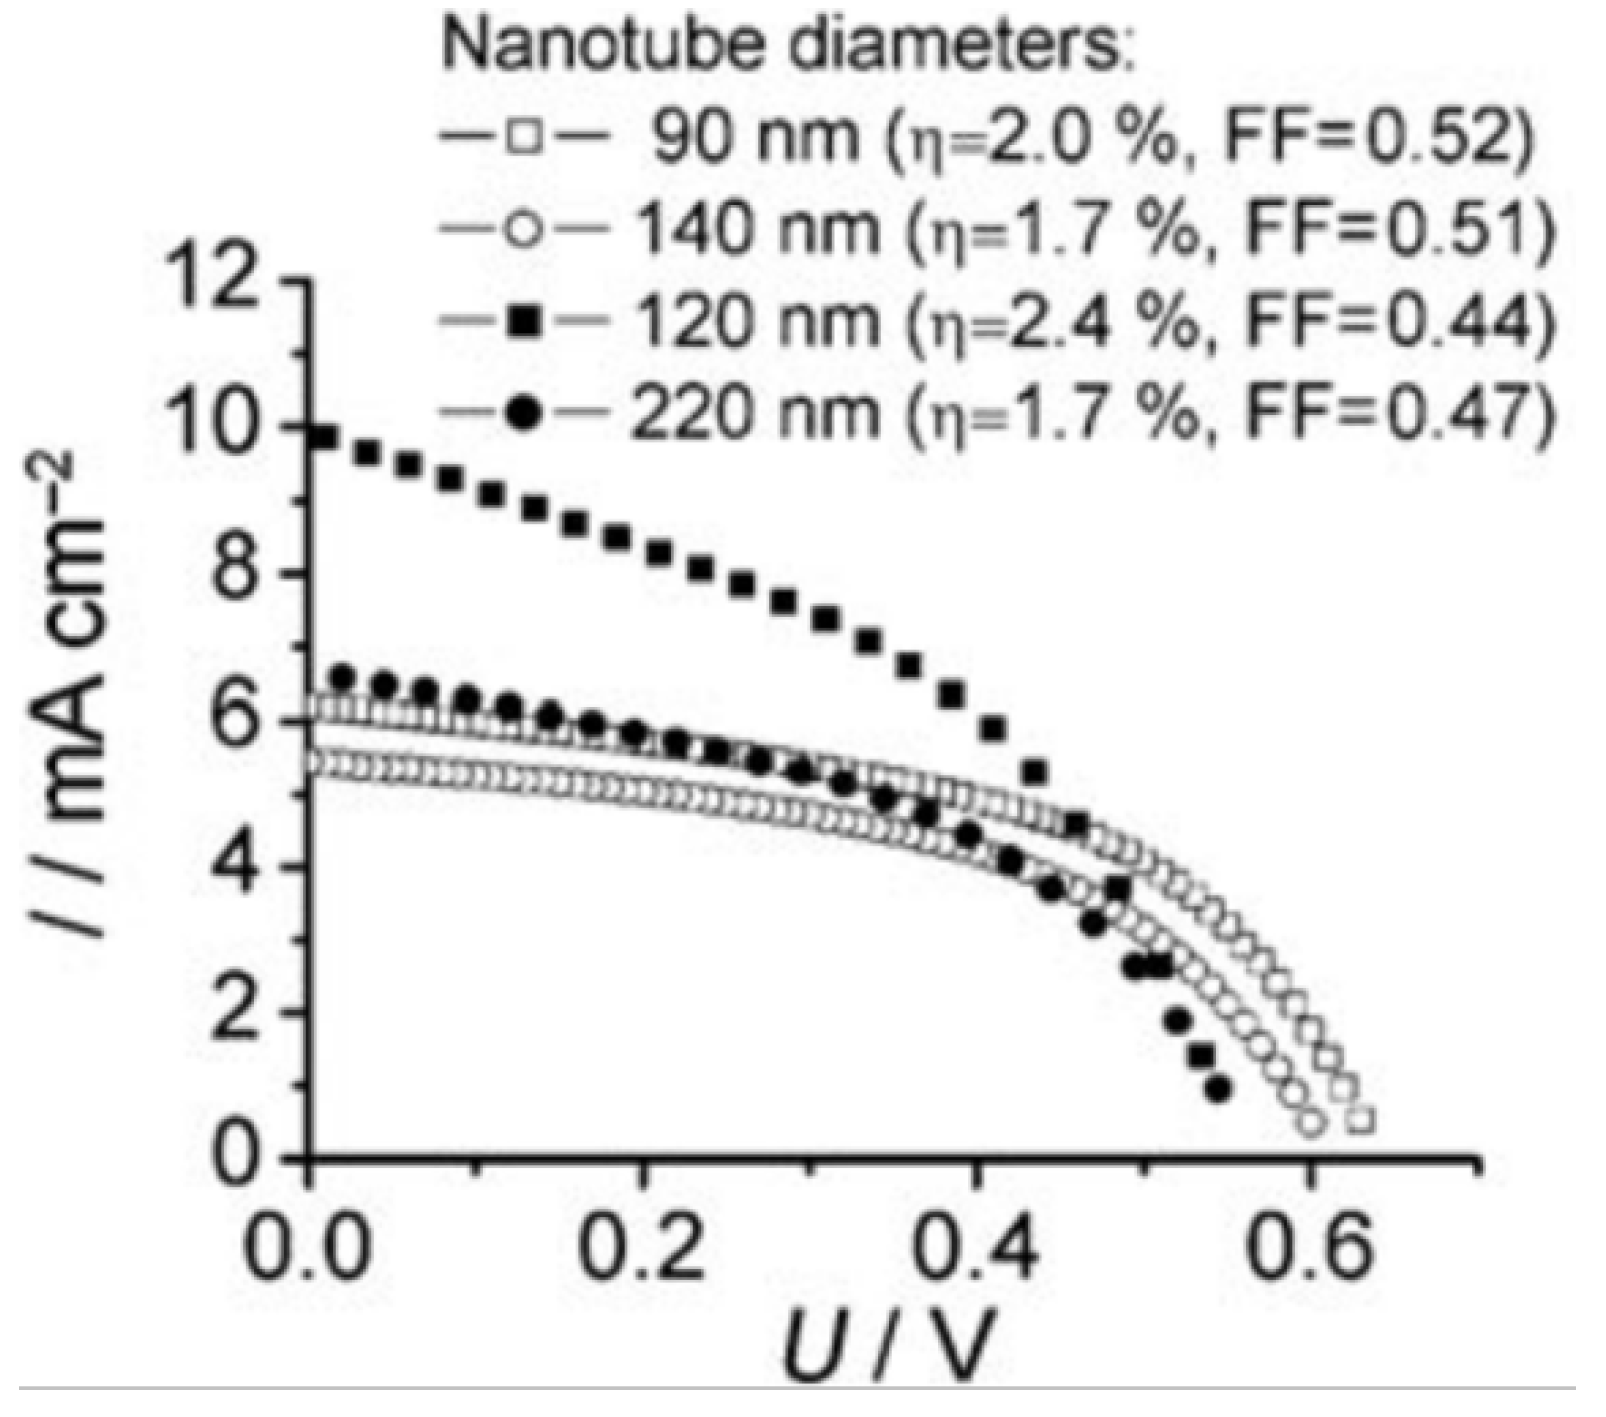
2.1.2. Diameter and Wall Thickness

Although great control over the nanotube length has been demonstrated, primarily adjusted by the anodization duration, less systematic control over the nanotube diameter and wall thickness has been shown. The nanotube diameter mostly varies with the anodization voltage (Figure 8) [3,29,41,44,45,46,61], but also varies with the solvent [29,32,62], duration [41,46], the water content [38] and the fluoride concentration [11,45]. Nanotubes have been synthesized by anodization that range from 15 nm to 709 nm by adjusting the voltage, solvent, and duration as seen in Table 3 [32,62].
Table 3. Experimental conditions to achieve nanotubes with different inner diameters.
Inner DiameterDurationElectrolyteVoltageReference
15 nm24 h0.2 M HF, 3.6% water, ethylene glycol10 V[32]
709 nm47 h0.25% HF, 1% water, diethylene glycol120 V[62]
80 nm1.5 h0.15 M NH4F, 3% water, glycerol80 V[29]
Figure 8. Effect of water content and voltage on the nanotube diameter. Water content under 20% increases the nanotube diameter while limiting the voltage at which nanotubes are formed. Reprinted with permission from [38]. Copyright 2010 IOP Publishing.
Materials 05 01890 g008
In addition to the nanotube length, the surface area and efficiency of a nanotube array is determined by the relationship between its diameter and wall thickness (Figure 9) [50,63]. Kontos et al. calculated the porosity of their nanotube arrays and compared it to the surface area per unit volume. It is calculated by,
P = 1   2 π W ( W + D ) 3 ( 2 W + D ) 2
where W is the wall thickness and D is the inner diameter. Based the theoretical model used by Liu et al., 20 nm is the most efficient inside diameter for photocatalysis of gaseous reactants (Figure 6) and 20–30 nm, is the most efficient wall thickness [49].
In hybrid solar cells, the high surface area for contact between the electron donor and acceptor (titania) reduces the distance excitons must travel before electrons are collected at the donor-acceptor interface. Thus, excitons are less likely to decay and a higher incident-photon-to-current efficiency (IPCE) is expected, compared to planar solar cells of the same thickness. Exciton diffusion lengths for commonly used organic polymer sensitizers are 8–20 nm for poly(3-hexylthiophene) (P3HT) [22], 20 nm for the poly(p-phenylene vinylene) derivative MEH-PPV [24], and 14 nm for ladder-type poly(p-phenylene) [64].
Figure 9. Experimental effect of the porosity (determined by the wall thickness and diameter) on the photoconversion efficiency of water-splitting cells. Reprinted with permission from [63]. Copyright 2012 American Chemical Society.
Materials 05 01890 g009
Correspondingly, Ghicov et al. found that the nanotube diameter in DSSCs correlated with the solar cell’s short circuit current and photoconversion efficiency, which is attributed to higher dye-loading due to higher surface area (Figure 10) [54]. However, for polymer sensitizers, small diameter nanotubes that have high porosity present an issue for polymer packing within the nanotubes. In the bulk, exciton mobility is enhanced by π-π stacking which allows excitons to delocalize over multiple polymer chains [65]. However, in confining nanotubes, disordered configurations are favored and π-π stacking is largely prevented [65]. Although So et al. report that changing the nanotube diameter within 100–200 nm has no significant effect on the solar cell efficiency, 100 nm diameter nanotubes are more efficient at certain lengths (Figure 10) [36,54].
Figure 10. Current-voltage characteristics of DSSCs based on different diameter nanotubes (empty symbols correspond to 8 µm and filled symbols to 16 µm nanotube length). Reprinted with permission from [54]. Copyright 2009 Wiley.
Materials 05 01890 g010

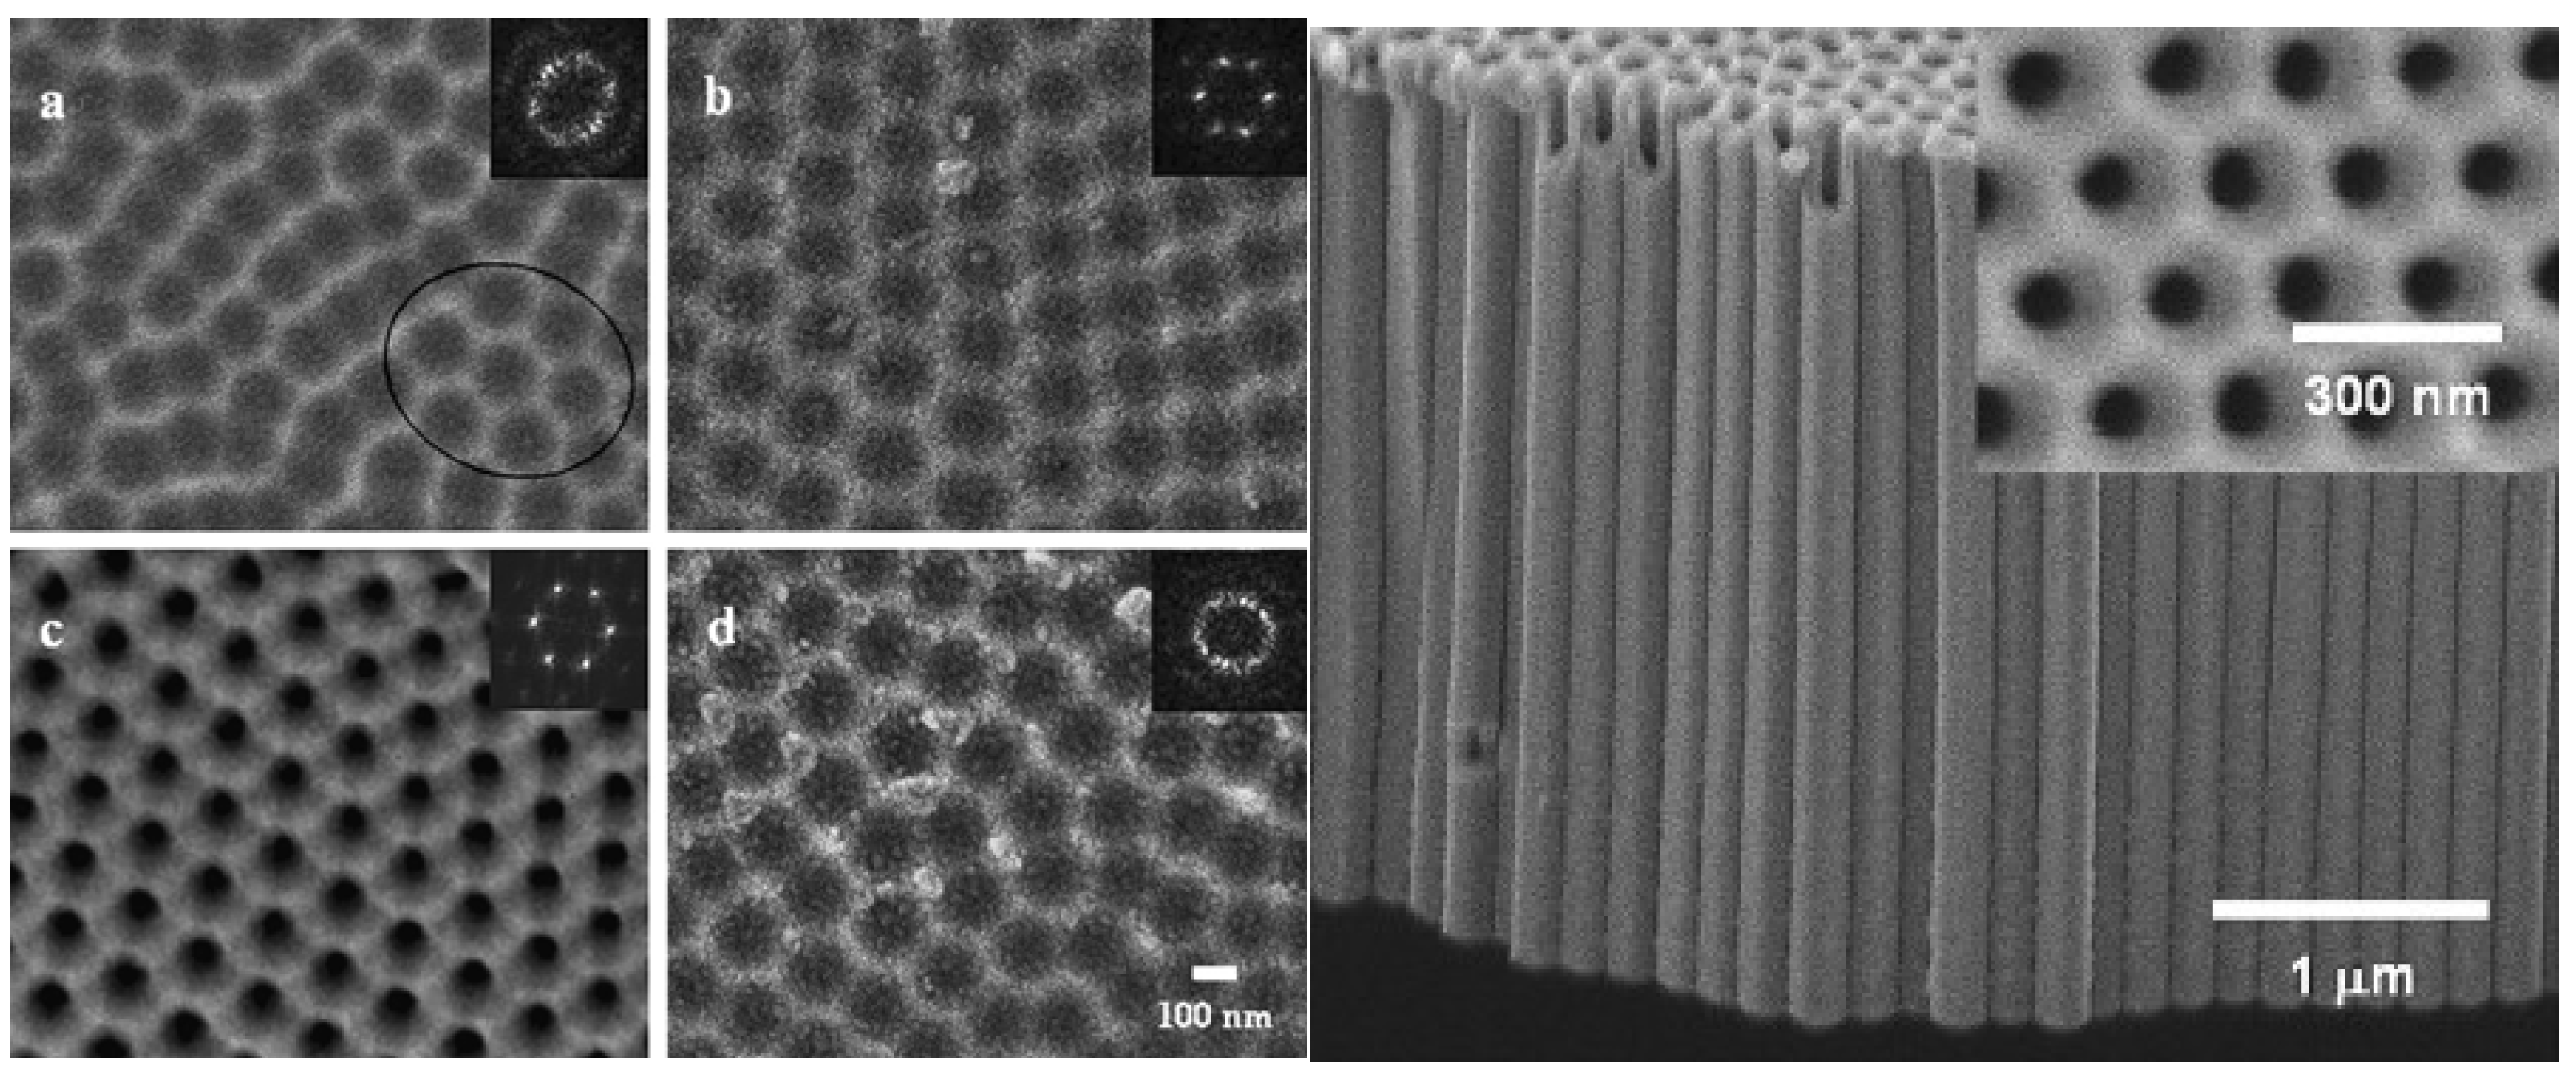
2.1.3. Nanotube Roughness and Intertube Spacing

Titania nanotubes with smooth walls are grown using viscous solvents for anodization. Solvents with high viscosity (Table 4) reduce the mobility of fluoride ions and other ionic species reducing the growth rate, but also reducing current fluctuations and therefore forming smoother nanotube walls [29,34,43,66]. Diffusion through a fluid is inversely proportional to the viscosity of the fluid according to the Stokes-Einstein equation:
D =   k B T 6 π η r
where D is the diffusion coefficient of a particle with radius r, in a fluid with viscosity η, at temperature T, and kB is the Boltzmann constant [14,29]. Current fluctuations during the anodization process result from local inhomogenieties of the concentration of ionic species, which cause rough nanotube walls to form [67,68].
Table 4. Solvent viscosities.
Electrolyte SolventViscosity (cP) [69]
Glycerol934
Ethylene Glycol16.1
Formamide3.34
DMSO1.99
Water0.89
Spacing between nanotubes, on the order of 100 nm, has been achieved by increasing the fluoride concentration and using diethylene glycol. Nanotube arrays grown in diethylene glycol electrolytes have intertube space but require 48 h of anodization to reach 7–20 μm in length [34]. Nanotubes spaced almost 1 µm apart have also been obtained by increasing the HF concentration to 4 wt % in ethylene glycol [70].
Well-ordered nanotube arrays with smooth walls and no intertube contact enhance electron transport by directing the injected electrons toward the conducting substrate and preventing undesired lateral transport between nanotubes [71]. Also, dyes or polymers can be adsorbed to the outside of the nanotubes if they are spaced apart, fully utilizing the available surface area. Intertube spacing smaller than that currently obtained (100 nm to 1 μm) should be more efficient by maximizing the number of nanotubes per unit area. However, no studies on the solar cell or photocatalytic efficiencies of nanotube arrays with intertube space have been published.

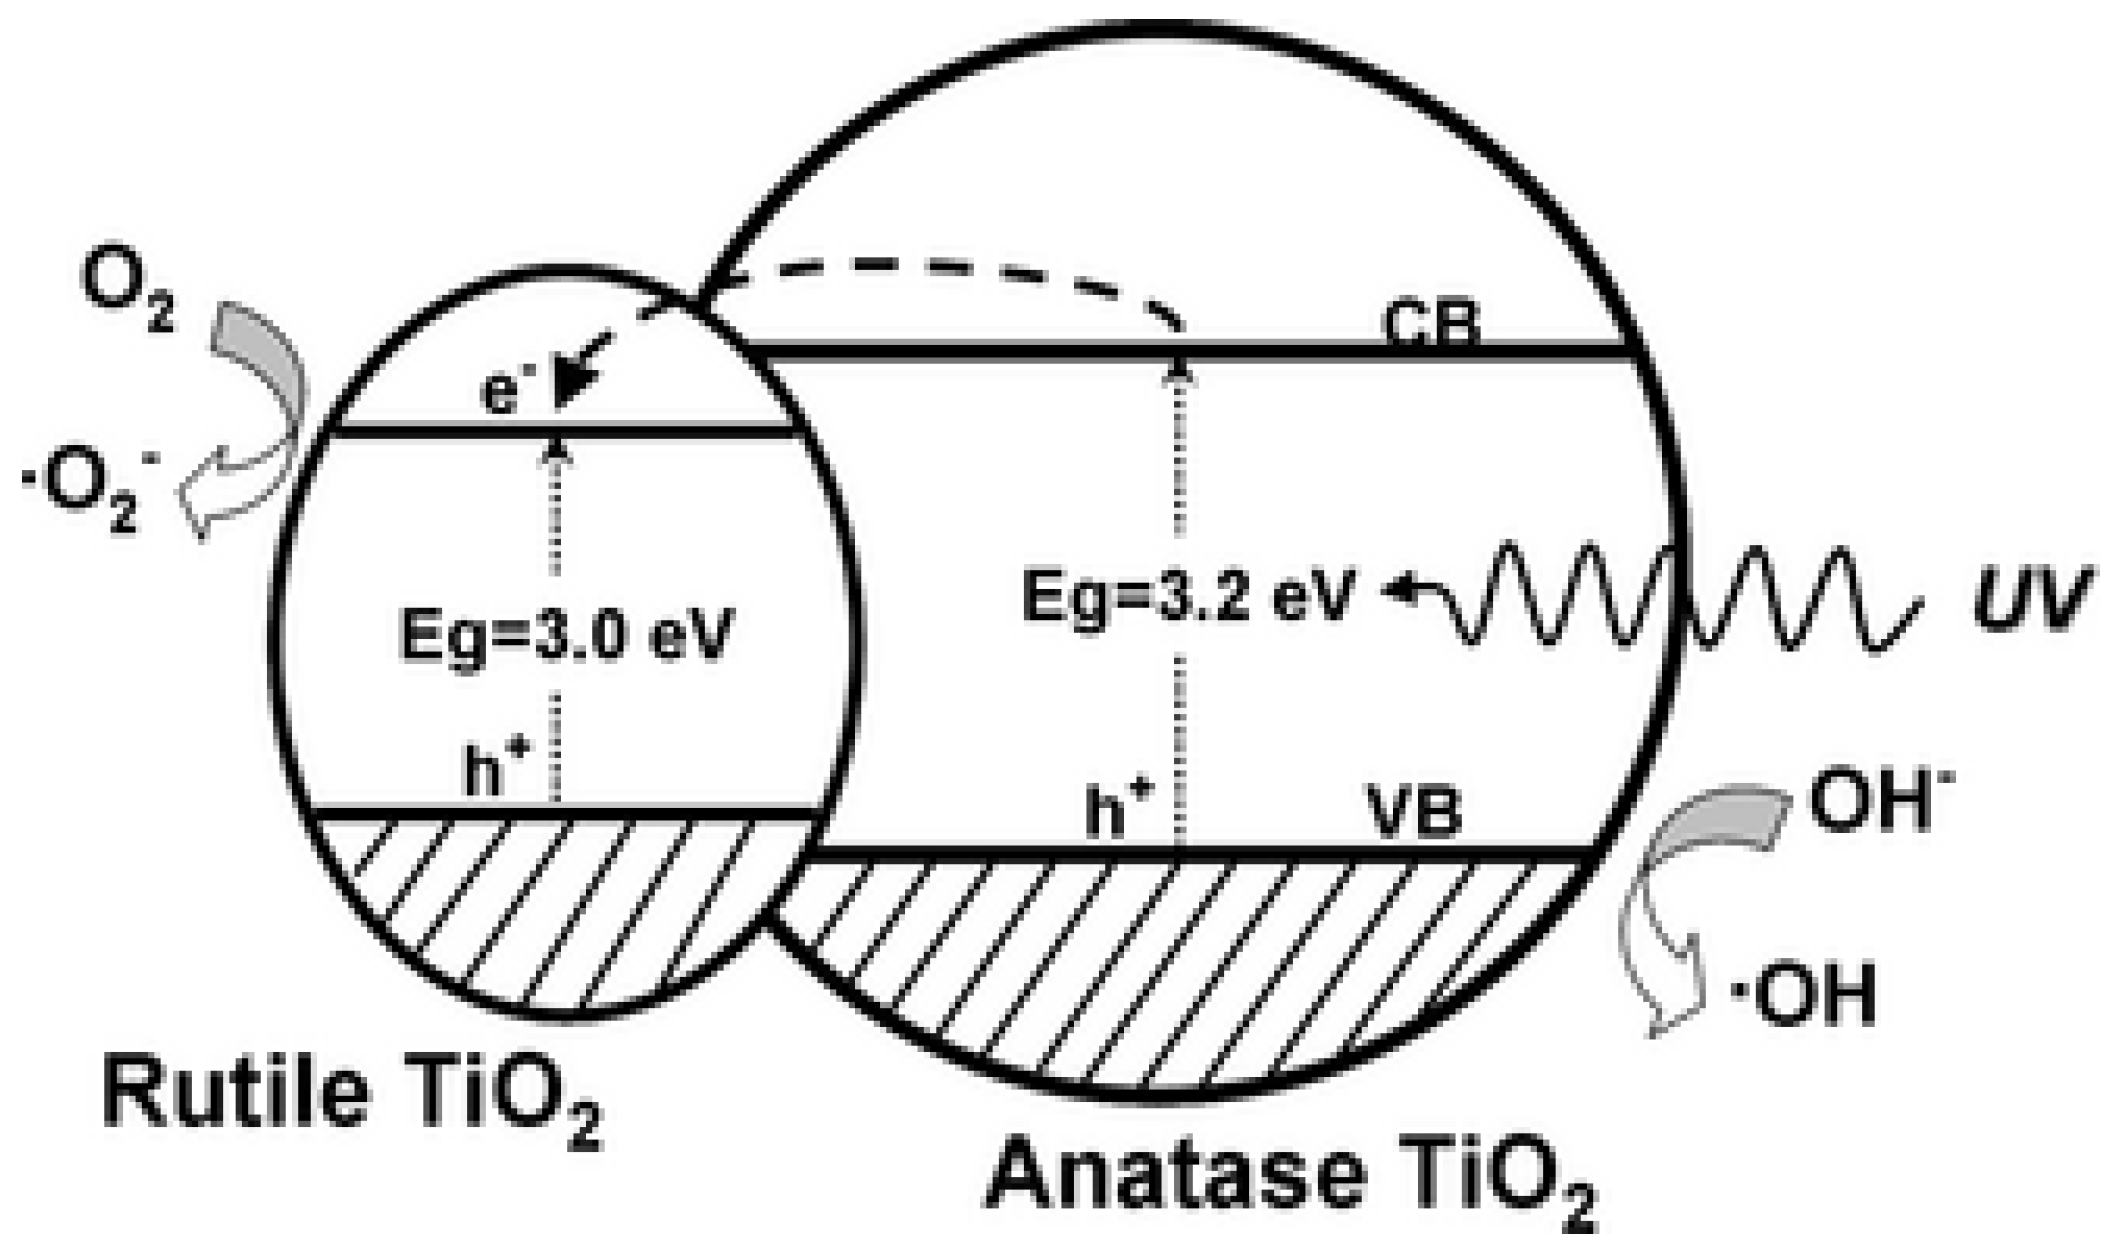
2.2. Control of Crystallinity

Amorphous titania nanotubes have minimal use in solar energy applications due to the high concentration of recombination centers (Table 5, “unannealed”) [11,44,72]. The anatase crystalline phase of titania is favored due to its higher electron mobility and larger surface area compared to the rutile phase [1,10,73,74]. Although titania nanotubes transformed to mostly rutile while annealing them at 750 °C, the nanotubes collapse at that temperature preventing the experimental comparison between pure rutile and pure anatase nanotubes [44]. Rather, amorphous titania nanotubes are typically annealed at 450 °C in various atmospheres to form the anatase phase [55]. By annealing the nanotubes at temperatures between 450 °C and 750 °C, a mixture of anatase and rutile is formed [44].
The annealing atmosphere affects the anatase-to-rutile phase transformation, and oxygen vacancies and other defects referred to as Ti+3 states, which lead to different recombination mechanisms and kinetics [10,11,75]. Ti+3 states create an impurity band in the titania nanotubes and limit electron transport, but the number of Ti+3 states can be reduced by annealing the nanotubes in an oxygen rich atmosphere [76]. Dry atmospheres inhibit the transformation of anatase to rutile in the nanotube walls while the interfacial region between the nanotubes and the Ti foil substrate transforms to rutile even at 430–450 °C, which may give the false indication that rutile is present throughout the nanotube array [10,11].
Although uncollapsed pure rutile nanotubes have not been studied, mixed phase nanotubes have been shown to be more efficient for photocatalysis than pure anatase nanotubes. The photocatalytic degradation of methyl orange using titania nanotubes is enhanced with rutile/anatase mixing by annealing the nanotube array at 550 °C [77]. Likewise, photodegredation of toluene and rhodamine B by titania powder and nanofibers, respectively, is enhanced when both rutile and anatase are present (3/97 wt %) by using calcination temperatures ≥600 °C [78,79]. Water oxidation is also most efficient after annealing nanotubes at 580 °C where both phases are present [80].
Table 5. Data from [44] on the photoconversion efficiency of un-sensitized titania nanotubes annealed at different temperatures in an oxygen atmosphere and illuminated under UV light. All of the samples were fabricated at 30 V for 3 h in 0.27 M NH4F, 50 vol % glycerol in water.
Annealing Temperature (°C)unannealed350450550650750
Anatase/Rutile Mass Fractionamorphous100/0100/01/1.21/2.21/37.2
Photoconversion Efficiency (%)1.45.865.937.258.560.4
To explain the mixed-phase phenomenon, Li et al. proposed that the rutile crystals provide electron trapping sites that extend the lifetime of photo-generated electron-hole pairs (Figure 11) [78]. However, Richter et al. found that rather than increasing the electron lifetime, the calcination temperature reduces the number of exciton-like trap states from oxygen vacancies, therefore improving electron transport [60]. Ghicov et al. attributed the mixed–phase phenomenon to increased crystallization at 600 °C, which minimized the number of recombination centers by reducing the amount of grain boundaries and amorphous TiO2 [11].
Figure 11. Proposed schematic illustration of the band structure related to photocatalytic mechanism of un-sensitized mixed-phase TiO2 structure. Reprinted with permission from [78]. Copyright 2011 Wiley.
Materials 05 01890 g011
Although there are many studies on un-sensitized crystalline nanotubes, systematic studies of crystallinity on titania nanotube solar cells is lacking. However, the crystallinity of nanoparticles has been studied. Anatase nanoparticle films have a higher energy conversion efficiency (21%), photocurrent (30%), and electron diffusion length (10×) than rutile nanoparticle films of the same thickness [81]. The difference was partly attributed to the increased interparticle contact and dye loading from the higher surface area of the anatase nanoparticles [81].

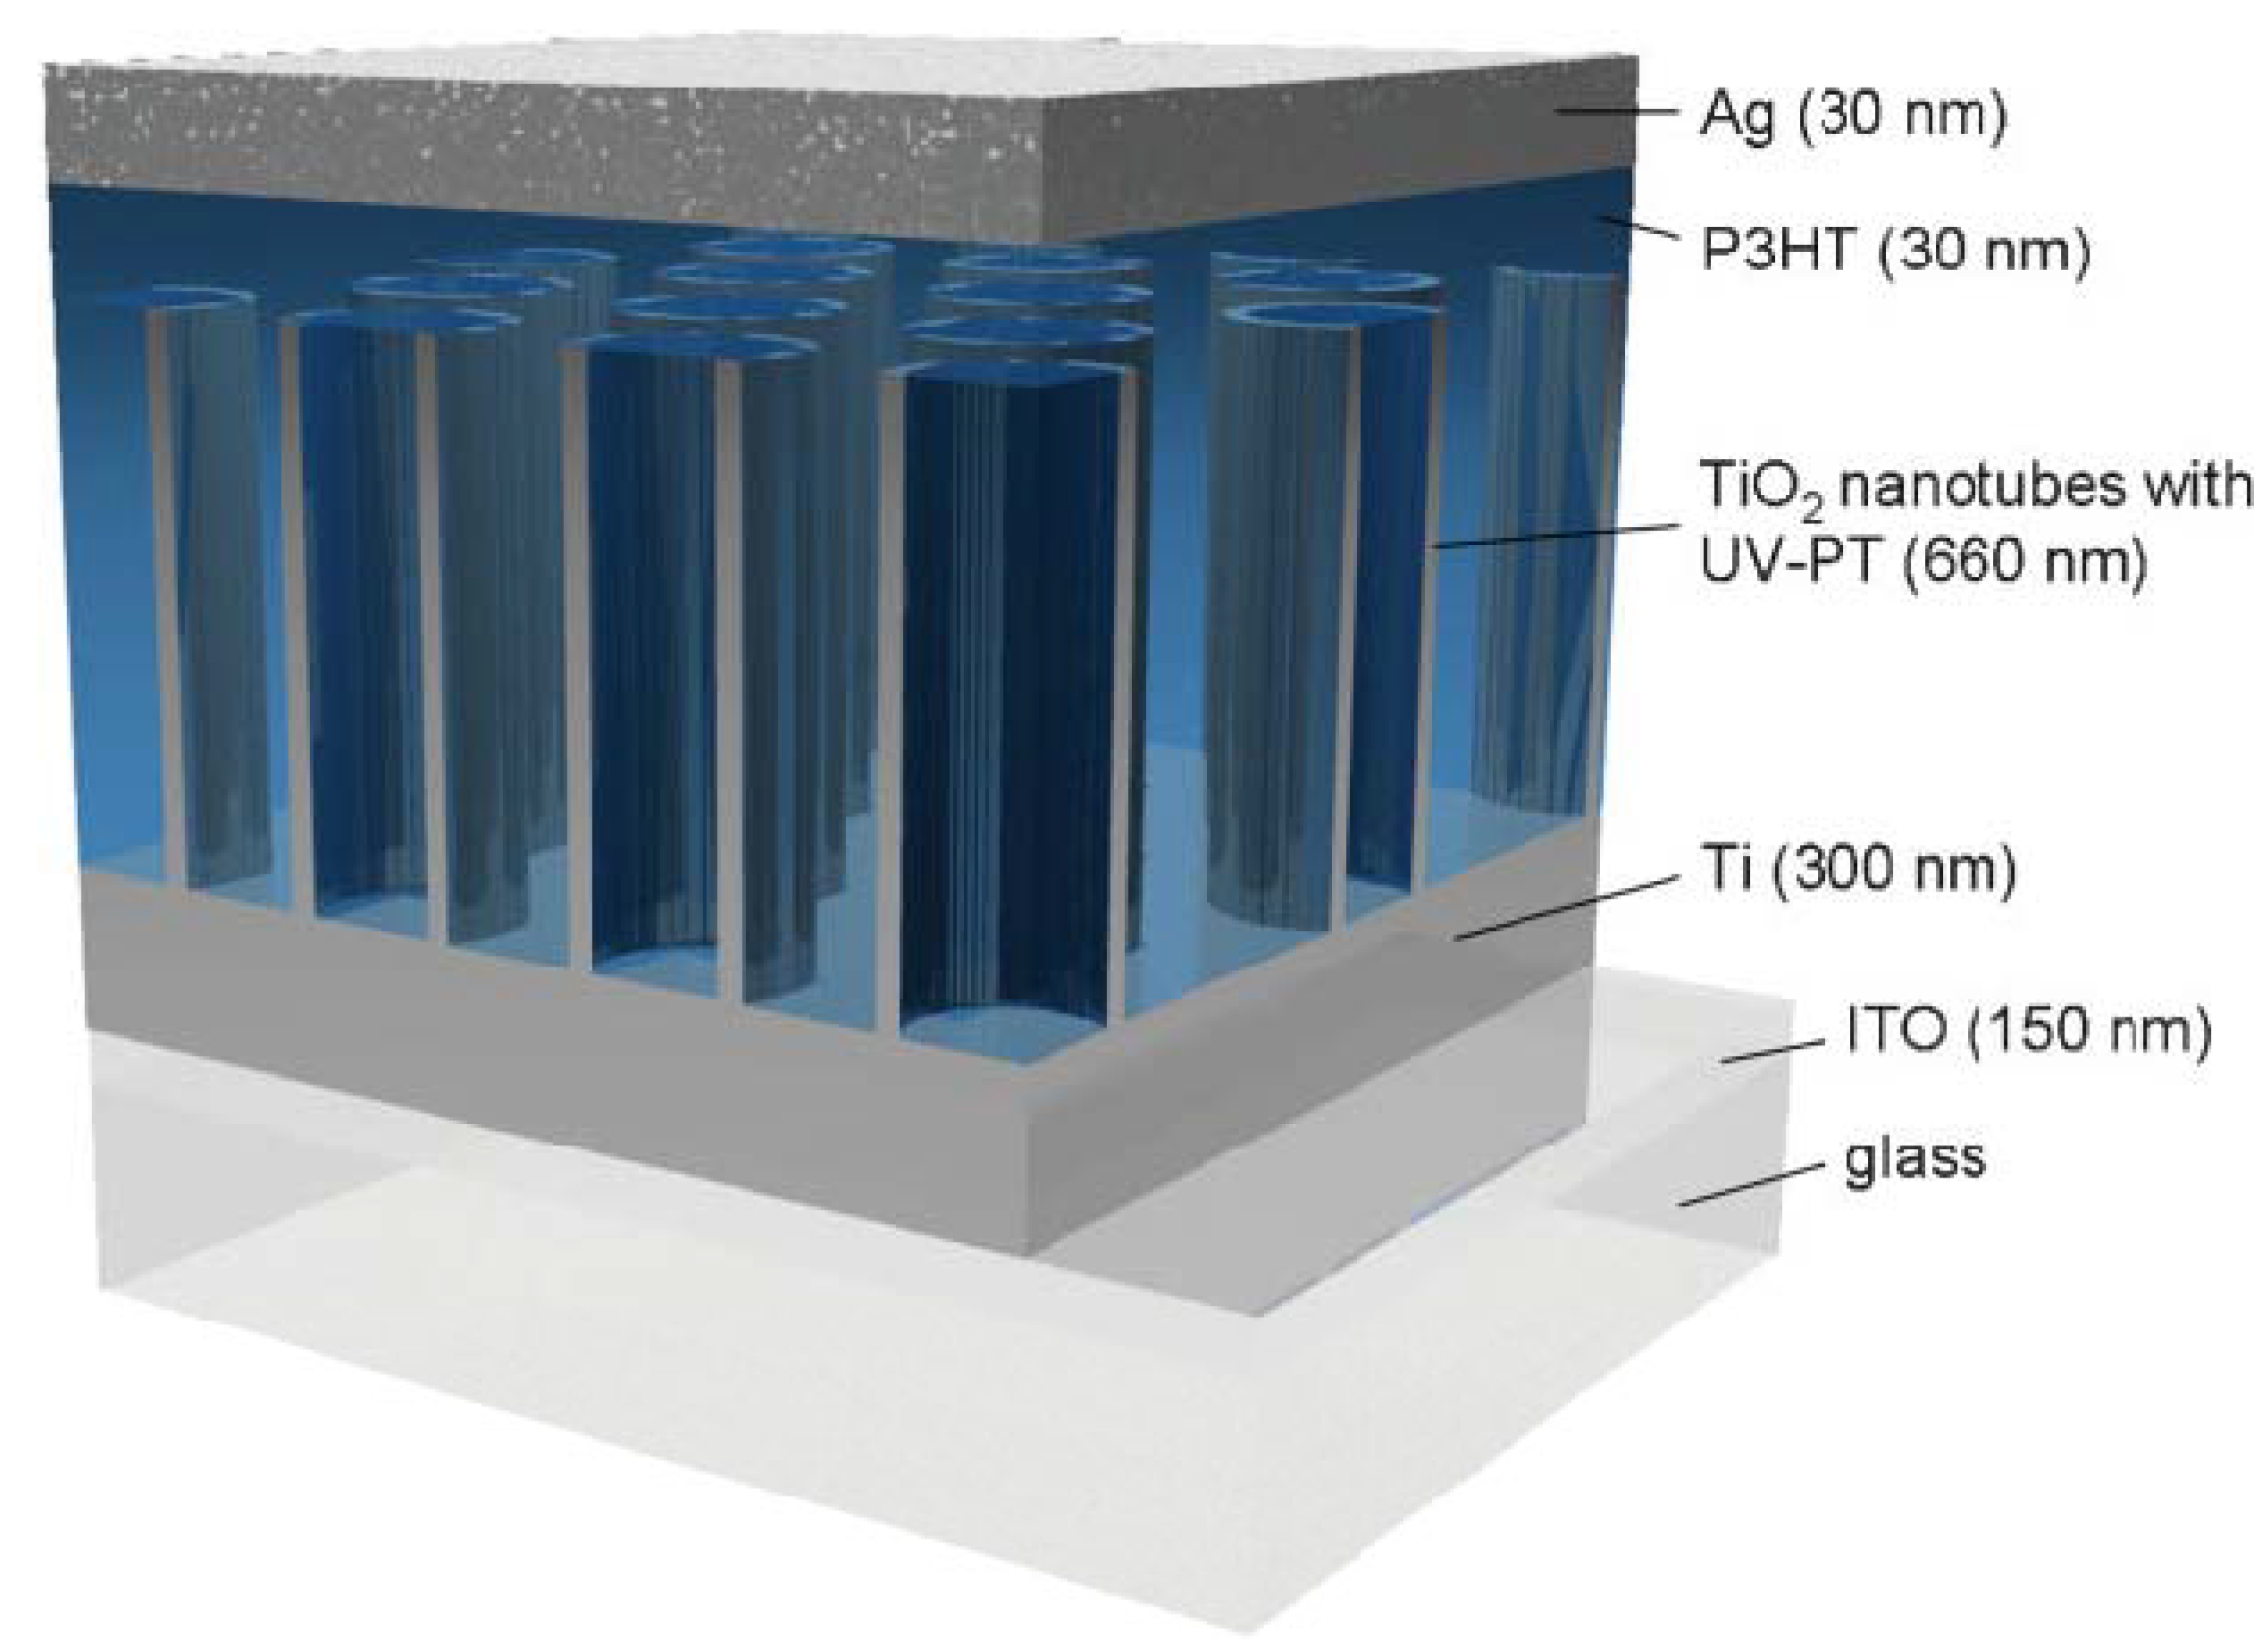
3. Solar Cell Fabrication

Hybrid solar cells benefit from front-side illumination where light is incident on the transparent conducting oxide and immediately reaches the sensitized TiO2 nanotube array (Figure 12b,c) [31,48]. In this orientation, reflection and absorption of light by the counter electrode and electrolyte is avoided. Nanotube arrays left on the titanium foil substrate can only be used in the less efficient back-side illuminated solar cell configuration since the foil is opaque (Figure 15a) [31,48]. Two routes have been used to fabricate front-side illuminated solar cells with TiO2 nanotube arrays: (1) transferring the nanotube array from the titanium foil to fluorine-doped tin oxide coated glass (FTO glass) [48,59] and (2) anodizing a film of titanium sputter-coated onto FTO glass [29].
Figure 12. Different orientations of DSSCs with TiO2 nanotubes. “bl” represents the barrier layer of TiO2 at the closed ends of the nanotubes. (a) Backside illumination with nanotubes on titanium foil; (b) Front-side illumination with nanotubes on fluorine-doped tin oxide coated glass (FTO glass); (c) Frontside illumination with nanotubes open on both ends. Reprinted with permission from [31]. Copyright 2010 IOP Publishing.
Materials 05 01890 g012

3.1. Removing the Array

Titania nanotube arrays have been removed from the Ti by dissolution in a bromine/methanol solution [82], aqueous HCl [59,83], solvent-evaporation of methanol [84], ultrasonication in water [46], acetone [85], ethanol/water solutions [86], and drying in air [31]. After removing the nanotube array, it can be attached to FTO glass with a few drops of 100 mM titanium isopropoxide or a layer of TiO2 nanoparticle paste 3 µm thick and then annealed (Figure 13d) [31,59,60,78]. Dubey et al. enhanced the adhesion by putting a 100 g weight onto the nanotube-FTO glass assembly in a freezer [60].
Figure 13. Scheme illustrating the transferal of a nanotube array from titanium foil to FTO glass coated with TiO2 nanoparticles for adhesion. Process (a) is the anodization; (b) the nanotube removal; (c) the removal of the barrier layer; and (d) the adhesion to FTO glass. Reprinted with permission from [87]. Copyright 2012 American Chemical Society.
Materials 05 01890 g013

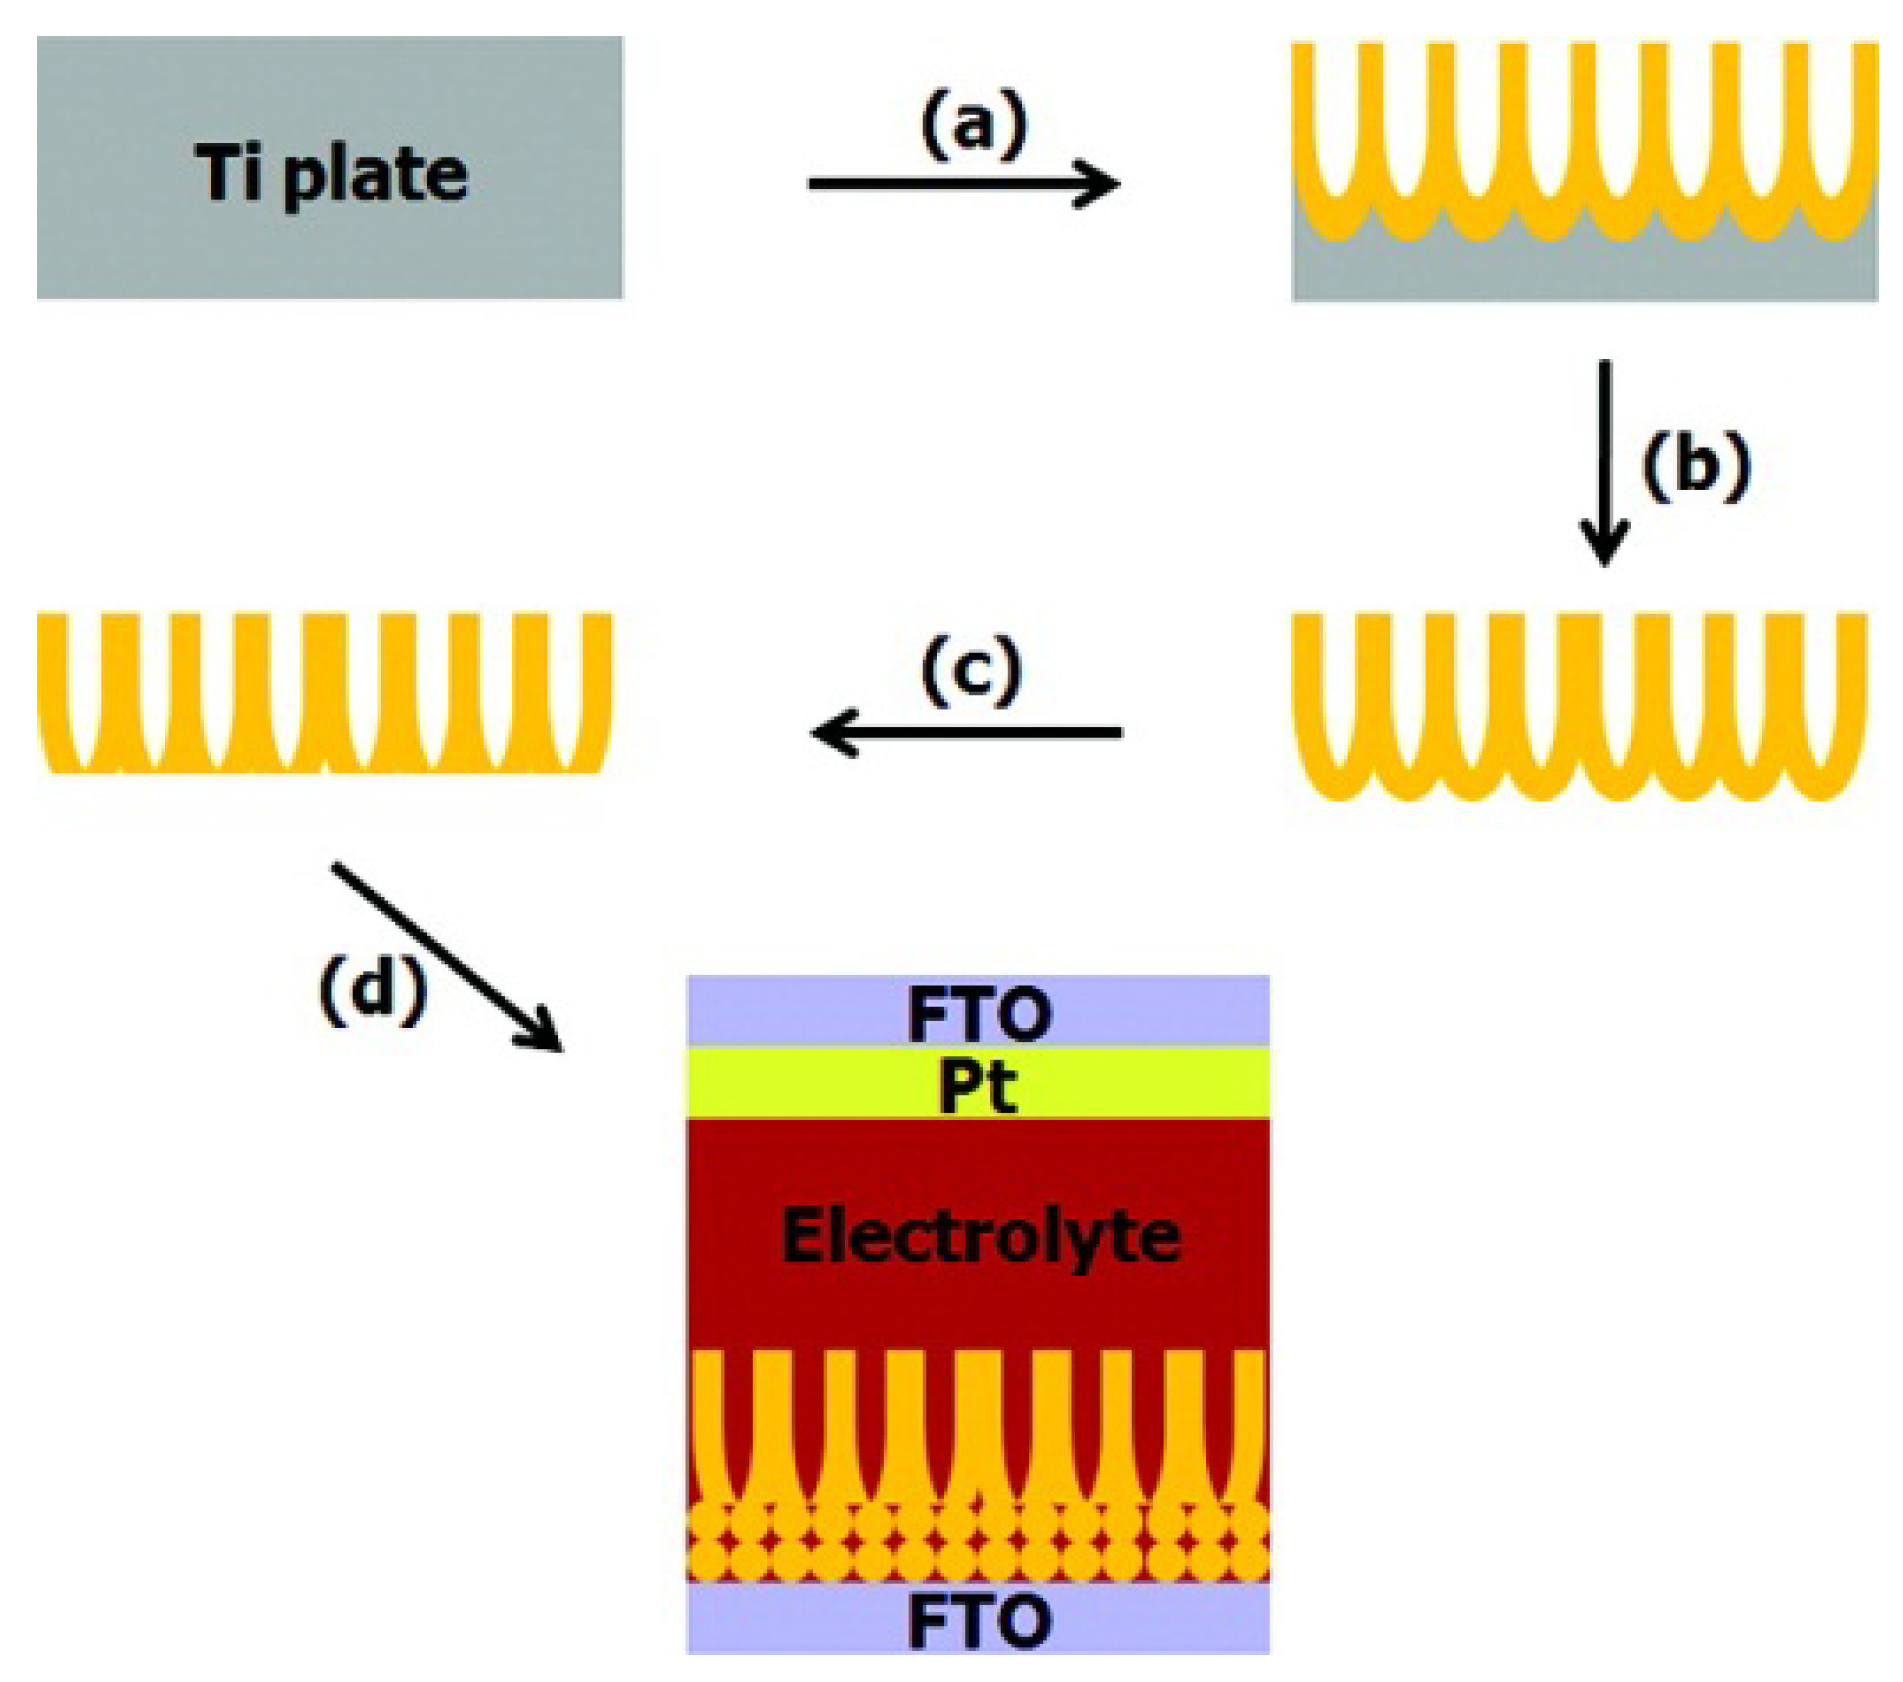
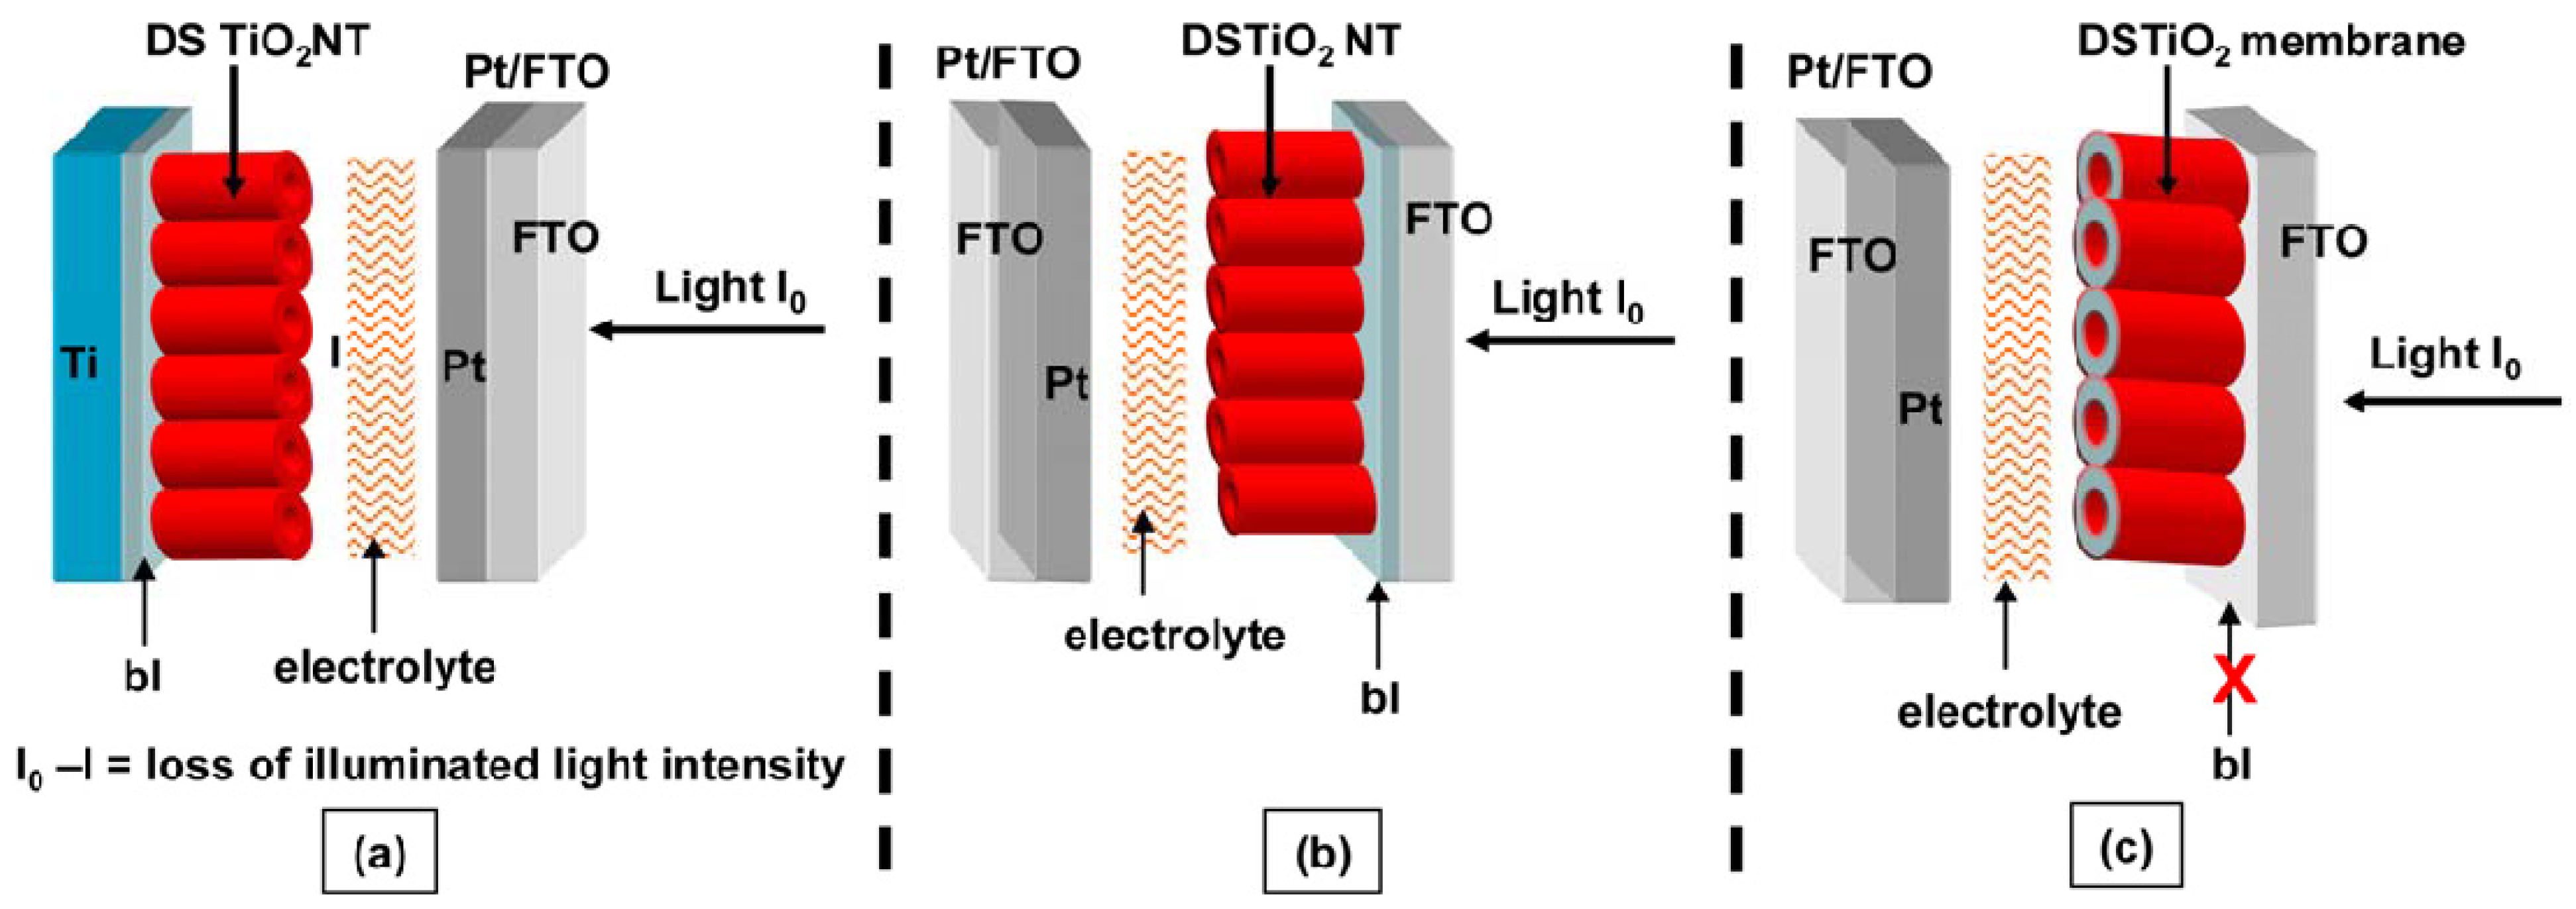
3.2. Anodizing on Conductive Substrates

Titania nanotubes have been grown by anodization of titanium films sputter-coated on alumina, indium-doped tin oxide [88] coated polyethylene terephthalate (ITO PET) [29], fluorine-doped tin oxide coated glass [29,48]. Titania films 0.5 to 20 µm thick have been coated onto the conducting substrates by RF or DC magnetron sputtering and subsequently anodized in electrolytes containing fluoride to form nanotubes [29]. To improve the adhesion of titanium films to FTO glass, the glass is heated to 45–400 °C before deposition [29,48] and bombarded with Ar+ during deposition of the titanium films [48]. By bombarding the titanium film with ions during deposition, weakly bound titanium atoms are removed, leaving the titanium atoms strongly bound to the substrate.

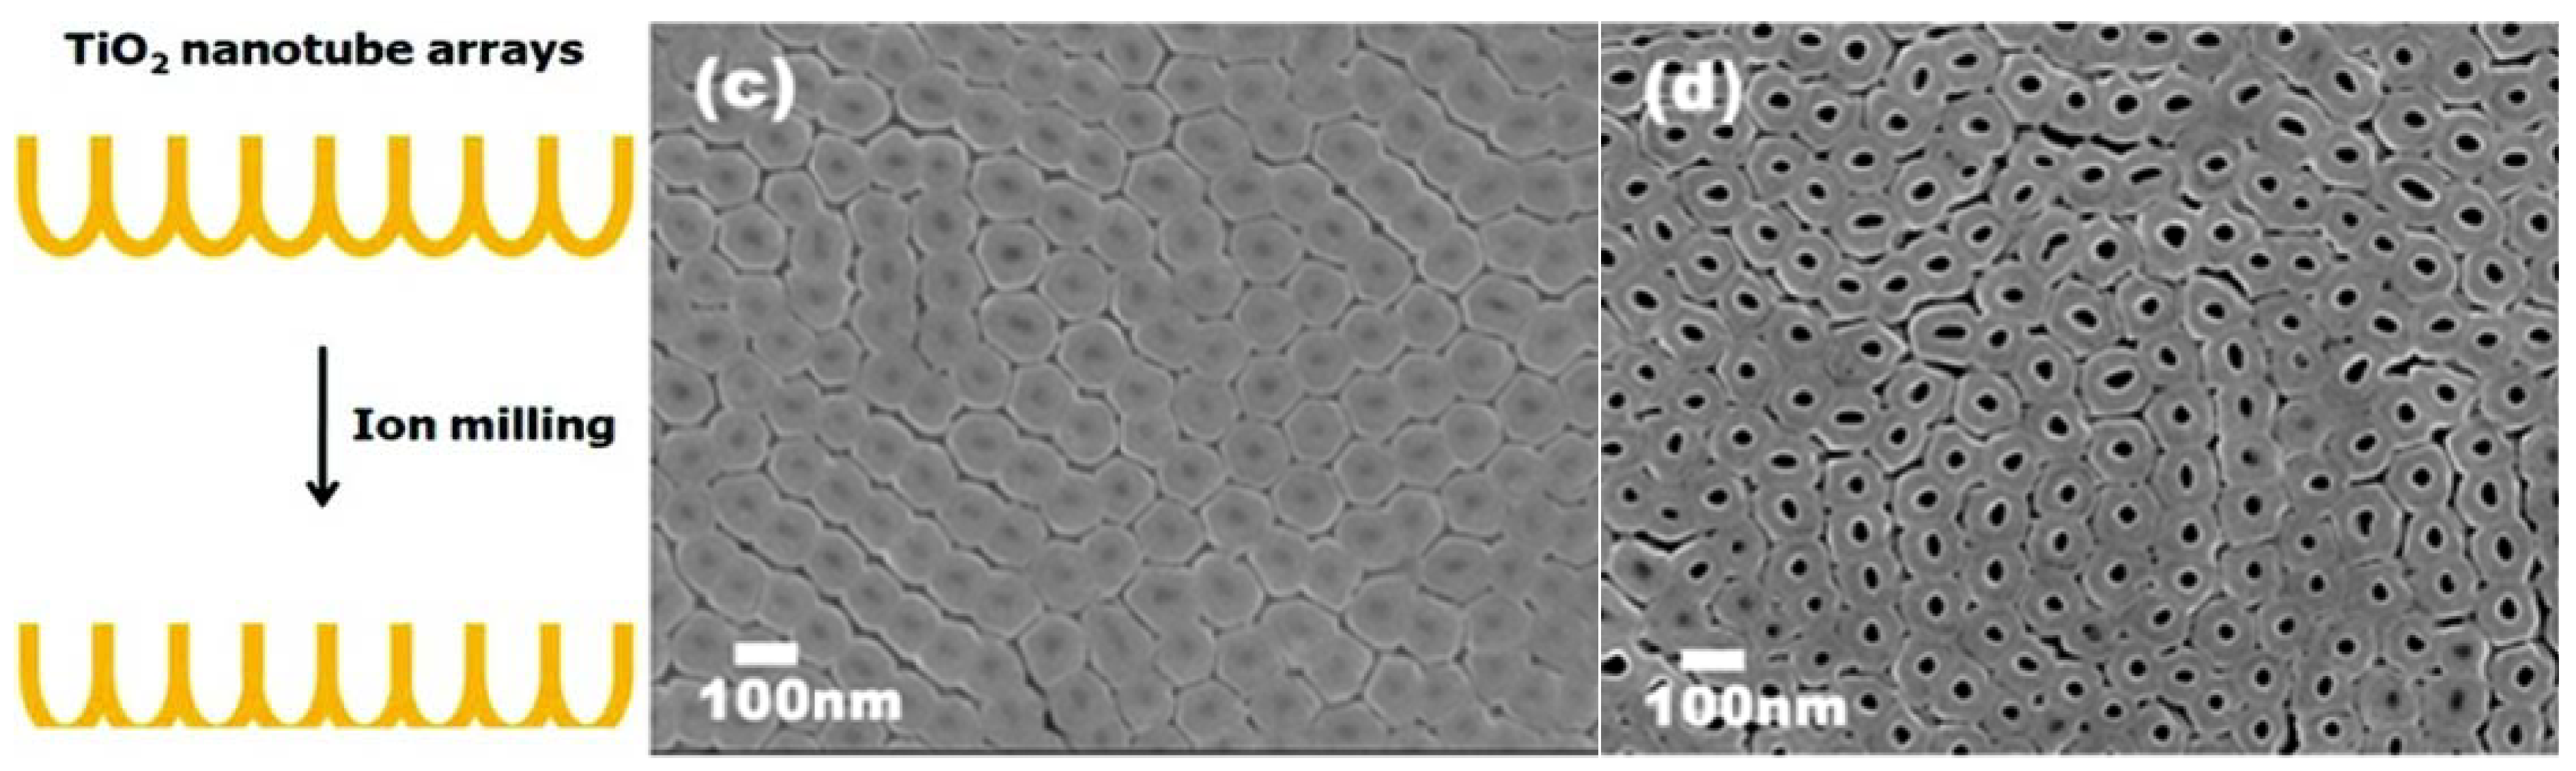
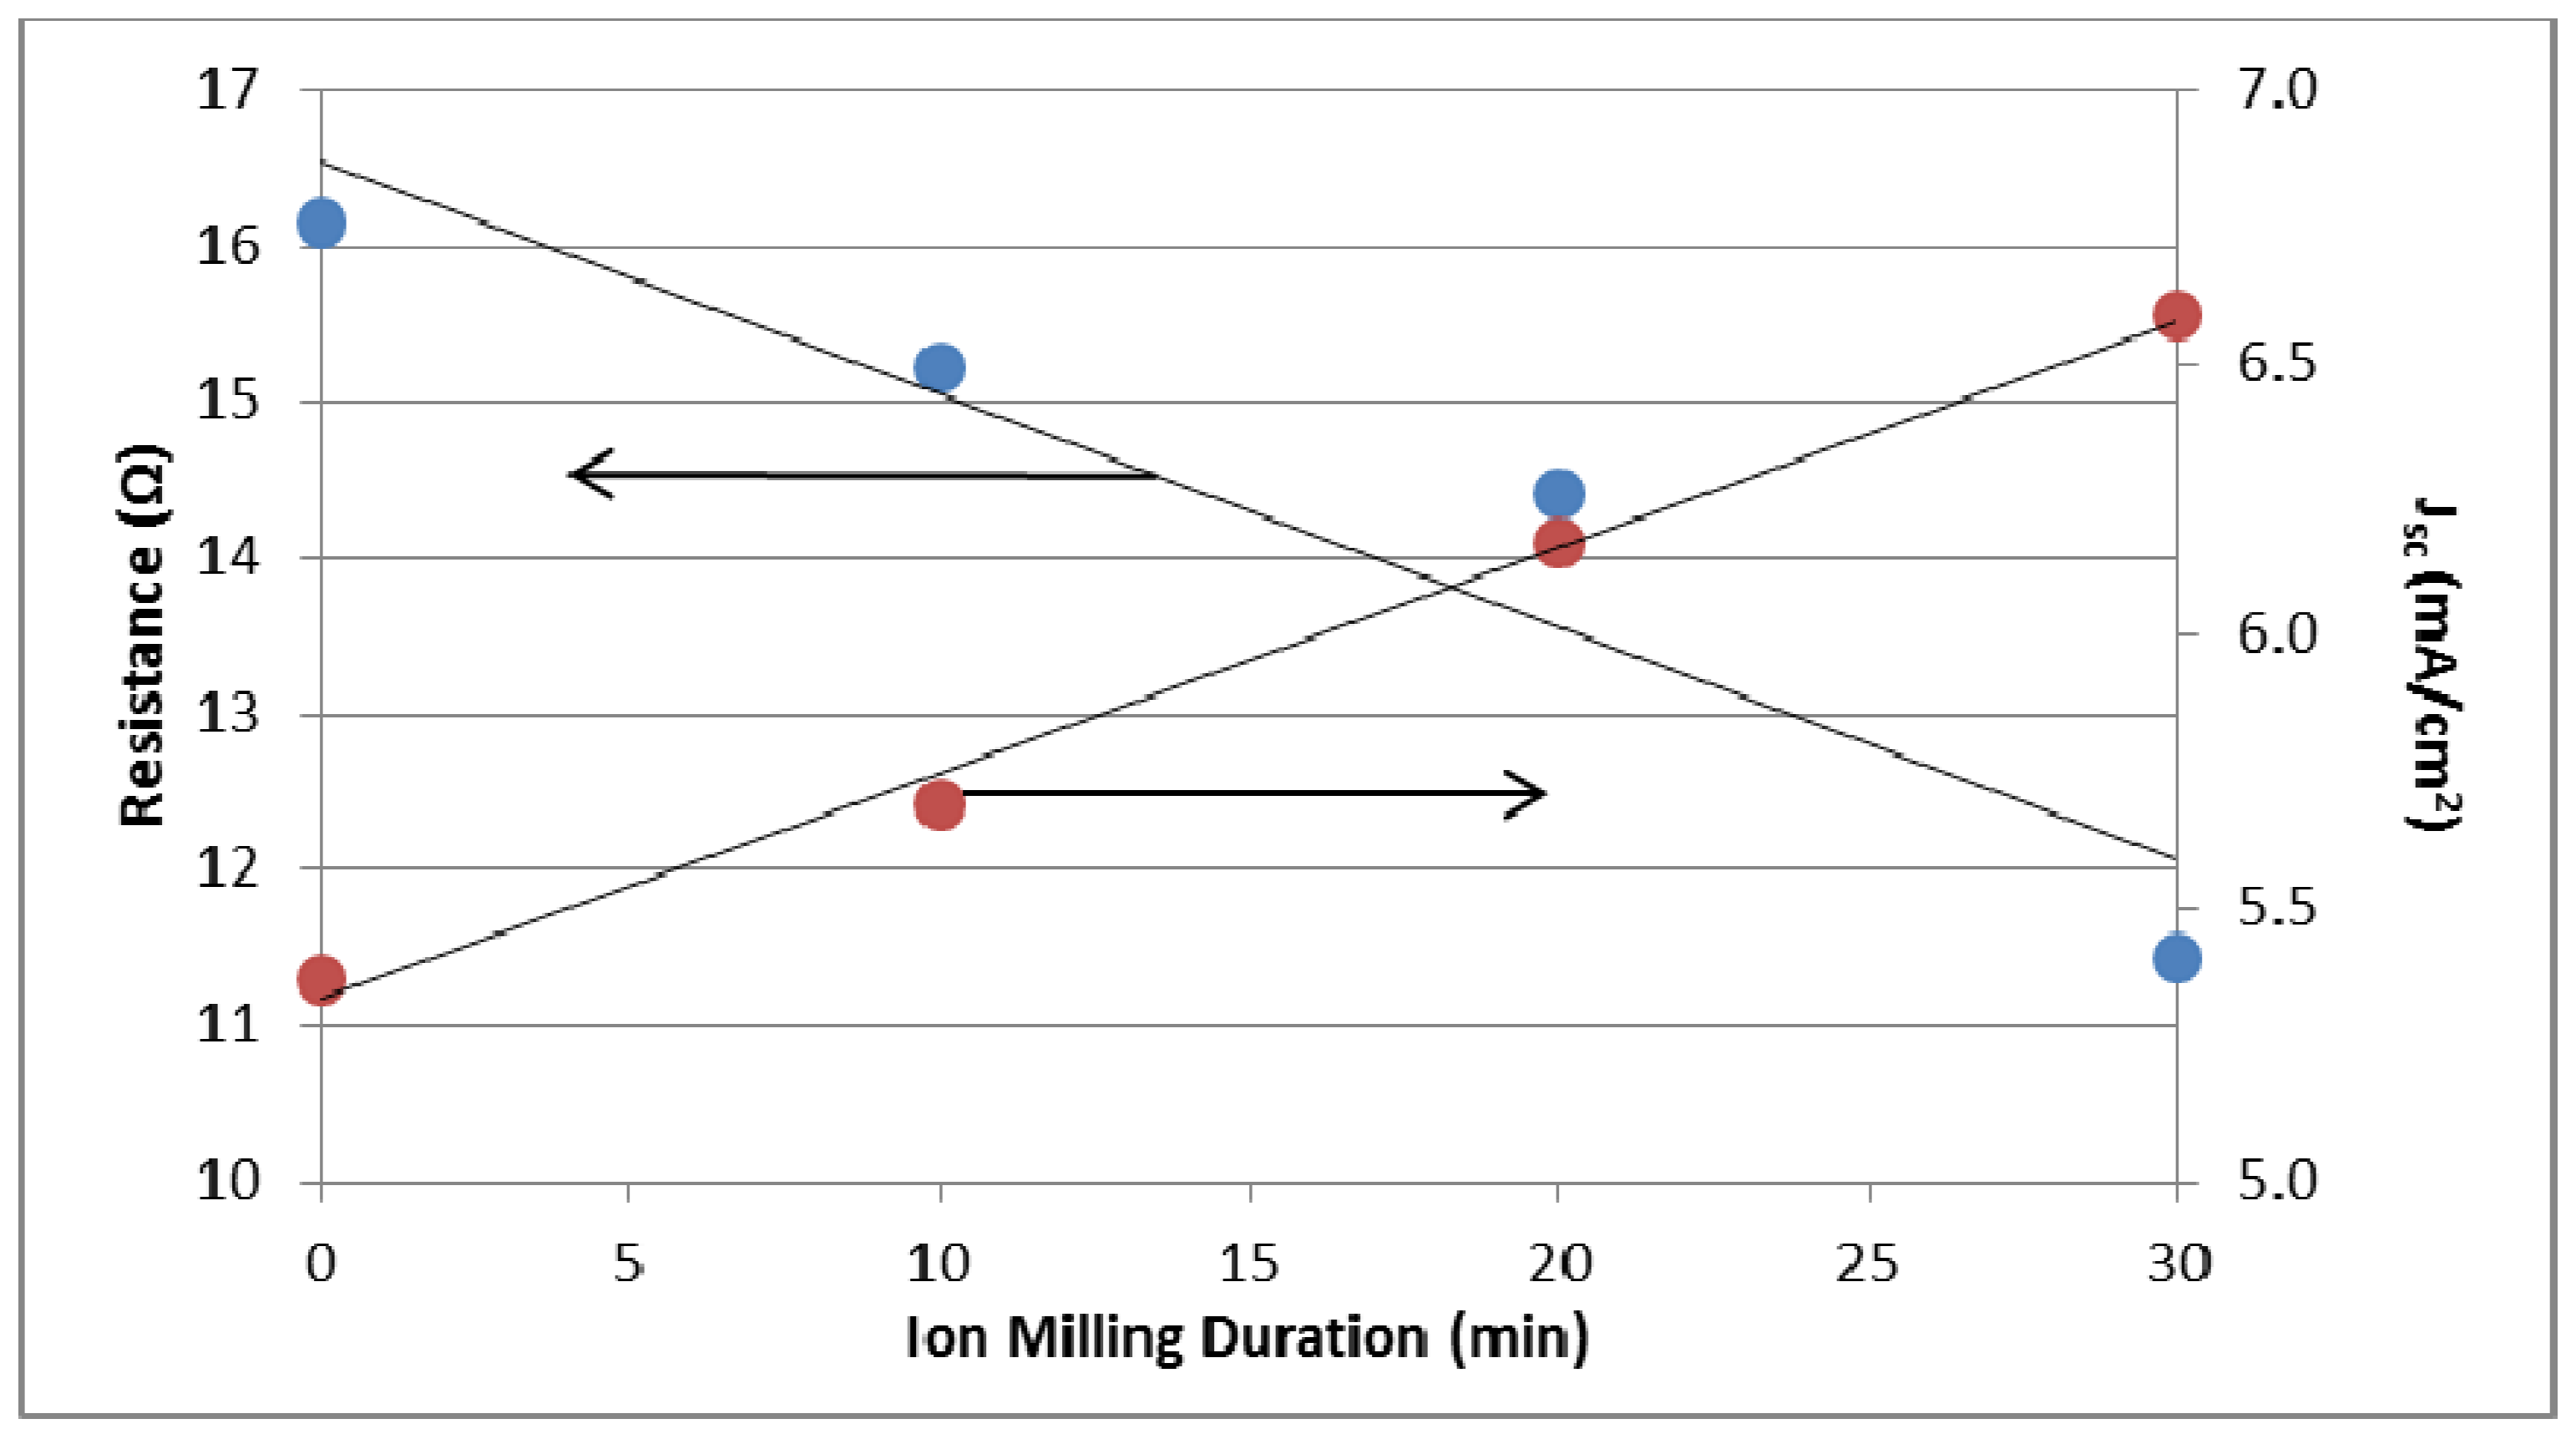
3.3. Removal of Barrier Layer

The closed ends of the nanotubes (barrier layer), originally attached to the titanium foil hinder light absorption from front-side illuminated hybrid solar cells [31,87]. Although nanotubes grown directly on conductive substrates suffer from the light reflection by the barrier layer, the barrier layer can be removed from nanotube arrays transferred from titanium foil. After removing the nanotube array from the titanium foil, the barrier layer can be removed by HF etching [31] or ion milling [87], similar to ion milling carbon nanotubes [89]. In the ion milling technique, the barrier layer is bombarded with Ar+ and removed by the sputtering process.
The barrier layer thickness decreases with increasing argon ion milling duration (0–90 min) and the barrier layer is perforated after 90 min as seen in Figure 14d [87]. Under backside-illumination of the ion milled N-719 sensitized solar cell, the photocurrent and energy conversion efficiency increased by 46% and 48% to 7.85 mA/cm2 and 3.7% , respectively, after 90 min of ion milling the nanotubes [87]. From electrochemical impedance spectroscopy measurements, Rho et al. determined that the barrier layer contributes to transport resistance in the nanotubes (Figure 15) [87]. Since the open-circuit voltage, Voc, is dependent on the recombination rate and there is no significant difference among the Voc for different barrier thicknesses, only the electron transport rate is affected [87].
Figure 14. SEM images of the closed-end/backside of TiO2 nanotube arrays removed from the Ti foil after (c) 30 min and (d) 90 min of ion milling. Reprinted with permission from [87]. Copyright 2012 American Chemical Society.
Materials 05 01890 g014
Figure 15. Effect of argon ion milling duration on the nanotube transport resistance and short circuit current measured from electrochemical impedance spectra. The nanotubes were sensitized with N-719 dye and illuminated with AM 1.5 illumination. Data from [87]. Copyright 2012 American Chemical Society.
Materials 05 01890 g015
As an alternative to removing the barrier layer, Dubey et al. configured solar cells with the nanotube opening facing the FTO glass, effectively removing the barrier layer from the nanotube-FTO glass interface [60]. This configuration led to better contact with the FTO layer, higher photoconversion efficiencies (η = 6.1% vs. 3.8%), and open-circuit current densities attributed to reduced recombination from better contact and twice the dye loading [60]. Dubey et al. achieved higher efficiencies with their inverse nanotube configuration than did Rho et al. with their ion milling technique (6.1% vs. 3.7%) using the same dye (N-719) and similar nanotube lengths (22 µm vs. 18 µm) [87]. The adhesion of the inverse nanotube configuration to the FTO glass may be superior to the ion milled nanotubes since Dubey et al. applied pressure and cold temperatures as described in Section 3.1.

4. Conclusions

The extensive research on anodized titania nanotube arrays has led to steady improvements of its morphological control [3,25]. A wide range of nanotube array dimensions have been grown and tested in various solar energy conversion applications for optimum performance (Table 1). Great advances have been made in controlling the nanotube length since the first anodized titania nanotube report, but systematically controlling the nanotube diameter and wall thickness to the narrow dimensions that are theoretically efficient requires continued research. Considering that the titania nanotubes’ crystallinity drastically affects its photoconversion efficiency and electron dynamics, the electron behavior in mixed-phase nanotubes requires attention to resolve disagreement in the literature [11,76,78]. Studies on hybrid solar cells with mixed-phase titania nanotubes may contribute to the understanding of the mixed-phase phenomenon in un-sensitized nanotubes.
Further optimization and characterization of the attachment of nanotube arrays to conductive substrates could benefit electron transport by reducing transport resistance between the phases [29,41,60]. For BHJs, improving polymer π-π packing and preventing phase separation with titania is needed to fully utilize the surface area available in the nanotubes and enhance photoconversion efficiencies [21].

Acknowledgments

The authors acknowledge Oak Ridge Associated Universities for the Ralph E. Powe Junior Faculty Enhancement Award and the partial sponsorship by the Laboratory Directed Research and Development (LDRD) and SEED Program of Oak Ridge National Laboratory (ORNL), managed by UT-Battelle, LLC for the U.S. Department of Energy under Contract No. DE-AC05-00OR22725.

References

  1. Park, J.T.; Patel, R.; Jeon, H.; Kim, D.J.; Shin, J.-S.; Kim, J.H. Facile fabrication of vertically aligned TiO2 nanorods with high density and rutile/anatase phases on transparent conducting glasses: High efficiency dye-sensitized solar cells. J. Mater. Chem. 2012, 22, 6131–6138. [Google Scholar] [CrossRef]
  2. Chen, R.S.; Chen, C.A.; Tsai, H.Y.; Wang, W.C.; Huang, Y.S. Ultrahigh efficient single-crystalline TiO2 nanorod photoconductors. Appl. Phys. Lett. 2012, 100, 123108:1–123108:4. [Google Scholar]
  3. Roy, P.; Berger, S.; Schmuki, P. TiO2 nanotubes: Synthesis and applications. Angew. Chem. Int. Ed. 2011, 50, 2904–2939. [Google Scholar] [CrossRef]
  4. Lockman, Z.; Ismail, S.; Sreekantan, S.; Schmidt-Mende, L.; MacManus-Driscoll, J. The rapid growth of 3 µm long titania nanotubes by anodization of titanium in a neutral electrochemical bath. Nanotechnology 2010, 21, 055601:1–055601:6. [Google Scholar] [CrossRef]
  5. Paulose, M.; Mor, G.; Varghese, O.; Shankar, K.; Grimes, C. Visible light photoelectrochemical and water-photoelectrolysis properties of titania nanotube arrays. J. Photochem. Photobiol. A 2006, 178, 8–15. [Google Scholar] [CrossRef]
  6. Li, Y.; Yu, X.; Yang, Q. Fabrication of TiO2 nanotube thin films and their gas sensing properties. J. Sens. 2009, 2009, 402174:1–402174:19. [Google Scholar]
  7. Lu, X.; Wang, G.; Zhai, T.; Yu, M.; Gan, J.; Tong, Y.; Li, Y. Hydrogenated TiO2 nanotube arrays for supercapacitors. Nano Lett. 2012, 12, 1690–1696. [Google Scholar] [CrossRef] [PubMed]
  8. Zwilling, V.; Aucoututier, M.; Darque-Ceretti, E. Anodic oxidation of titanium and TA6V alloy in chromic media. An electrochemical approach. Electrochim. Acta 1999, 45, 921–929. [Google Scholar] [CrossRef]
  9. Gong, D.; Grimes, C.; Varghese, O.; Hu, W.; Singh, R.; Chen, Z. Titanium oxide nanotube arrays prepared by anodic oxidation. J. Mater. Res. 2001, 16, 3331–3334. [Google Scholar] [CrossRef]
  10. Varghese, O.; Gong, D.; Paulose, M.; Grimes, C.; Dickey, E. Crystallization and high-temperature structural stability of titanium oxide nanotube arrays. J. Mater. Res. 2003, 18, 156–165. [Google Scholar] [CrossRef]
  11. Ghicov, A.; Tsuchiya, H.; Macak, J.; Schmuki, P. Annealing effects on the photoresponse of TiO2 nanotubes. Phys. Stat. Sol. A 2006, 203, R28–R30. [Google Scholar] [CrossRef]
  12. Fabregat-Santiago, F.; Barea, E.; Bisquert, J.; Mor, G.; Shankar, K.; Grimes, C.A. High carrier density and capacitance in TiO2 nanotube arrays induced by electrochemical doping. J. Am. Chem. Soc. 2008, 130, 11312–11316. [Google Scholar] [CrossRef] [PubMed]
  13. Morris, A.; Meyer, G. TiO2 surface functionalization to control the density of states. J. Phys. Chem. C 2008, 112, 18224–18231. [Google Scholar] [CrossRef]
  14. Sturgeon, M.; Lai, P.; Hu, M. A comparative study of anodized titania nanotube architectures in aqueous and nonaqueous solutions. J. Mater. Res. 2011, 26, 2612–2623. [Google Scholar] [CrossRef]
  15. Honda, K.; Fujishima, A. Electrochemical photolysis of water at a semiconductor electrode. Nature 1972, 238, 37–38. [Google Scholar] [CrossRef] [PubMed]
  16. Yun, H.J.; Lee, H.; Joo, J.B.; Kim, N.D.; Yi, J. Effect of TiO2 nanoparticle shape on hydrogen evolution via water splitting. J. Nanosci. Nanotechnol. 2011, 11, 1–4. [Google Scholar] [CrossRef] [PubMed]
  17. Wolcott, A.; Smith, W.; Kuykendall, T.; Zhao, Y.; Zhang, J. Photoelectrochemical water splitting using dense and aligned TiO2 nanorod arrays. Small 2009, 5, 104–111. [Google Scholar] [CrossRef] [PubMed]
  18. Zhang, Z.; Wang, P. Optimization of photoelectrochemical water splitting performance on hierarchical TiO2 nanotube arrays. Energy Environ. Sci. 2012, 5, 6506–6512. [Google Scholar] [CrossRef]
  19. Ghicov, A.; Schmuki, P. Self-ordering electrochemistry: A review on growth and functionality of TiO2 nanotubes and other self-aligned MOx structures. Chem. Commun. 2009, 2791–2808. [Google Scholar]
  20. Yan, J.; Zhou, F. TiO2 nanotubes: Structure optimization for solar cells. J. Mater. Chem. 2011, 21, 9406–9418. [Google Scholar] [CrossRef]
  21. Tepavcevic, S.; Darling, S.; Dimitrijevic, N.; Rajh, T.; Sibener, S. Improved hybrid solar cells via in situ UV polymerization. Small 2009, 5, 1776–1783. [Google Scholar] [CrossRef] [PubMed]
  22. Ayzner, A.; Tassone, C.; Tolbert, S.; Schwartz, B. Reappraising the need for bulk heterojunctions in polymer-fullerene photovoltaics: The role of carrier transport in all-solution-processed P3HT/PCBM bilayer solar cells. J. Phys. Chem. C 2009, 113, 20050–20060. [Google Scholar] [CrossRef]
  23. Yella, A.; Lee, H.-W.; Tsao, H.N.; Yi, C.; Chandiran, A.; Nazeeruddin, M.K.; Diau, E.; Yeh, C.-Y.; Zakeeruddin, S.; Grätzel, M. Porphyrin-sensitized solar cells with cobalt (II/III)-based redox electrolyte exceed 12 percent efficiency. Science 2011, 334, 629–634. [Google Scholar] [CrossRef] [PubMed]
  24. Kannan, B.; Castelino, K.; Majumdar, A. Design of nanostructured heterojunction polymer photvoltaic devices. Nano Lett. 2003, 3, 1729–1733. [Google Scholar] [CrossRef]
  25. Roy, P.; Kim, D.; Lee, K.; Spiecker, E.; Schmuki, P. TiO2 nanotubes and their application in dye-sensitized solar cells. Nanoscale 2010, 2, 45–49. [Google Scholar] [CrossRef] [PubMed]
  26. Boucle, J.; Ackermann, J. Solid-state dye-sensitized and bulk heterojunction solar cells using TiO2 and ZnO nanostructures: Recent progress and new concepts at the borderline. Polym. Int. 2012, 61, 355–373. [Google Scholar] [CrossRef]
  27. Wang, M.; Liu, Y.; Yang, H. A unified theory for the formation of anodized metal oxide structures. Electrochim. Acta 2012, 62, 424–432. [Google Scholar] [CrossRef]
  28. Li, S.; Zhang, G.; Guo, D.; Yu, L.; Zhang, W. Anodization fabrication of highly ordered TiO2 nanotubes. J. Phys. Chem. C 2009, 113, 12759–12765. [Google Scholar] [CrossRef]
  29. Galstyan, V.; Vomiero, A.; Comini, E.; Faglia, G.; Sberveglieri, G. TiO2 nanotubular and nanoporous arrays by electrochemical anodization on different substrates. RSC Adv. 2011, 1, 1038–1044. [Google Scholar] [CrossRef]
  30. Zhang, G.; Huang, H.; Zhang, Y.; Chan, H.; Zhou, L. Highly ordered nanoporous TiO2 and its photocatalytic properties. Electrochem. Commun. 2007, 9, 2854–2858. [Google Scholar] [CrossRef]
  31. Banerjee, S.; Misra, M.; Mohapatra, S.K.; Howard, C.; Mohapatra, S.K.; Kamilla, S.K. Formation of chelating agent driven anodized TiO2 nanotubular membrane and its photovoltaic application. Nanotechnology 2010, 21, 145201:1–145201:9. [Google Scholar]
  32. Liu, N.; Lee, K.; Schmuki, P. Small diameter TiO2 nanotubes vs. nanopores in dye sensitized solar cells. Electrochem. Commun. 2012, 15, 1–4. [Google Scholar] [CrossRef]
  33. Alivov, Y.; Pandikunta, M.; Nikishin, S.; Fan, Z. The anodization voltage influence on the properties of TiO2 nanotubes grown by electrochemical oxidation. Nanotechnology 2009, 20, 225602:1–225602:6. [Google Scholar]
  34. Yoriya, S.; Mor, G.; Sharma, S.; Grimes, C. Synthesis of ordered arrays of discrete, partially crystalline titania nanotubes by Ti anodization using diethylene glycol electrolytes. J. Mater. Chem. 2008, 18, 3332–3336. [Google Scholar] [CrossRef]
  35. Tsuchiya, H.; Macak, J.; Taveira, L.; Balaur, E.; Ghicov, A.; Sirotna, K.; Schmuki, P. Self-organized TiO2 nanotubes prepared in ammonium fluoride containing acetic acid electrolytes. Electrochem. Commun. 2005, 7, 576–580. [Google Scholar] [CrossRef]
  36. So, S.; Lee, K.; Schmuki, P. Ultrafast growth of highly ordered anodic TiO2 nanotubes in lactic acid electrolytes. J. Am. Chem. Soc. 2012, 134, 11316–11318. [Google Scholar] [CrossRef] [PubMed]
  37. Paulose, M.; Prakasam, H.; Varghese, O.; Peng, L.; Popat, K.; Mor, G.; Desai, T.; Grimes, C. TiO2 Nanotube Arrays of 1000 µm length by anodization of titanium foil: Phenol red diffusion. J. Phys. Chem. C 2007, 111, 14992–14997. [Google Scholar] [CrossRef]
  38. Yin, H.; Liu, H.; Shen, W.Z. The large diameter and fast growth of self-organized TiO2 nanotube arrays achieved via electrochemical anodization. Nanotechnology 2010, 21, 035601:1–035601:7. [Google Scholar]
  39. Sreekantan, S.; Wei, L.; Lockman, Z. Extremely fast growth rate of TiO2 nanotube arrays in electrochemical bath containing H2O2. J. Electrochem. Soc. 2011, 158, C397–C402. [Google Scholar] [CrossRef]
  40. Lee, K.; Kim, J.; Kim, H.; Lee, Y.; Tak, Y.; Kim, D.; Schmuki, P. Effect of electrolyte conductivity on the formation of a nanotubular TiO2 photoanode for a DSSC. J. Korean Phys. Soc. 2009, 54, 1027–1031. [Google Scholar] [CrossRef]
  41. Portan, D.; Papaefthymiou, K.; Arvanita, E.; Jiga, G.; Papanicolaou, G. A combined statistical and microscopic analysis of TiO2 nanotubes synthesized under different electrochemical anodizing conditions. J. Mater. Res. 2012, 47, 4696–4705. [Google Scholar]
  42. Chin, L.; Zainal, Z.; Hussein, M.; Tee, T.W. Fabrication of highly ordered TiO2 nanotubes from fluoride containing aqueous electrolyte and their photoelectrochemical response. J. Nanosci. Nanotechnol. 2011, 11, 4900–4909. [Google Scholar] [CrossRef] [PubMed]
  43. Sreekantan, S.; Saharudin, K.A.; Lockman, Z.; Tzu, T.W. Fast-rate formation of TiO2 nanotube arrays in an organic bath and their applications in photocatalysis. Nanotechnology 2010, 21, 365603:1–365603:8. [Google Scholar] [CrossRef]
  44. Li, D.; Shiwei, L.; Li, S.; Huang, X.; Cao, X.; Li, J. Effects of geometric and crystal structures on the photoelectrical properties of highly ordered TiO2 nanotube arrays. J. Mater. Res. 2012, 27, 1029–1036. [Google Scholar] [CrossRef]
  45. Yoriya, S.; Paulose, M.; Varghese, O.; Mor, G.; Grimes, C. Fabrication of vertically oriented TiO2 nanotube arrays using dimethyl sulfoxide electrolytes. J. Phys. Chem. C 2007, 111, 13770–13776. [Google Scholar] [CrossRef]
  46. Prakasam, H.; Shankar, K.; Paulose, M.; Varghese, O.; Grimes, C. A new benchmark for TiO2 nanotube array growth by anodization. J. Phys. Chem. C 2007, 111, 7235–7241. [Google Scholar] [CrossRef]
  47. Lai, C.W.; Sreekantan, S. Effect of applied potential on the formation of self-organized TiO2 nanotube arrays and its photoelectrochemical response. J. Nanomater. 2011, 2011, 142463:1–142463:7. [Google Scholar]
  48. Varghese, O.; Paulose, M.; Grimes, C. Long vertically aligned titania nanotubes on transparent conducting oxide for highly efficient solar cells. Nat. Nanotechnol. 2009, 4, 592–597. [Google Scholar] [CrossRef] [PubMed]
  49. Liu, B.; Nakata, K.; Liu, S.; Sakai, M.; Ochiai, T.; Murakami, T.; Takagi, K.; Fujishima, A. Theoretical kinetic analysis of heterogeneous photocatalysis by TiO2 nanotube arrays: The effects of nanotube geometry on photocatalytic activity. J. Phys. Chem. C 2012, 116, 7471–7479. [Google Scholar] [CrossRef]
  50. Kontos, A.; Katsanaki, A.; Maggos, T.; Likodimos, V.; Ghicov, A.; Kim, D.; Kunze, J.; Vasilakos, C.; Schmuki, P.; Falara, P. Photocatalytic degradation of gas pollutants on self-assembled titania nanotubes. Chem. Phys. Lett. 2010, 490, 58–62. [Google Scholar] [CrossRef]
  51. Liu, Z.; Zhang, X.; Nishimoto, S.; Murakami, T.; Fujishima, A. Efficient photocatalytic degradation of gaseous acetaldehyde by highly ordered TiO2 nanotube arrays. Environ. Sci. Technol. 2008, 42, 8547–8551. [Google Scholar] [CrossRef] [PubMed]
  52. Liu, Z.; Zhang, X.; Nishimoto, S.; Jin, M.; Tryk, D.; Murakami, T.; Fujishima, A. Highly ordered TiO2 nanotube arrays with controllable length for photoelectrocatalytic degradation of phenol. J. Phys. Chem. C 2008, 112, 253–259. [Google Scholar] [CrossRef]
  53. Zhuang, H.-F.; Lin, C.-J.; Lai, Y.-K.; Sun, L.; Li, J. Some critical structure factors of titanium oxide nanotube array in its photocatalytic activity. Environ. Sci. Technol. 2007, 41, 4735–4740. [Google Scholar] [CrossRef] [PubMed]
  54. Ghicov, A.; Albu, S.; Hahn, R.; Kim, D.; Stergiopoulos, T.; Kunze, J.; Schiller, C.-A.; Falaras, P.; Schmuki, P. TiO2 nanotubes in dye-sensitized solar cells: Critical factors for the conversion efficiency. Chem. Asian J. 2009, 4, 520–525. [Google Scholar] [CrossRef] [PubMed]
  55. Jennings, J.; Ghicov, A.; Peter, L.; Schmuki, P.; Walker, A. Dye-sensitized solar cells based on oriented TiO2 nanotube arrays: Transport, trapping, and transfer of electrons. J. Am. Chem. Soc. 2008, 130, 13364–13372. [Google Scholar] [CrossRef] [PubMed]
  56. Peter, L. Transport, trapping and interfacial transfer of electrons in dye-sensitized nanocrystalline solar cells. J. Electroanal. Chem. 2007, 599, 233–240. [Google Scholar] [CrossRef]
  57. Kang, S.H.; Kim, H.S.; Kim, J.; Sung, Y.E. An investigation on electron behavior employing vertically-aligned TiO2 nanotube electrodes for dye-sensitized solar cells. Nanotechnology 2009, 20, 355307:1–355307:6. [Google Scholar]
  58. Leng, W.; Barnes, P.; Juozapavicius, M.; O’Regan, B.; Durrant, J. Electron diffusion in mesoporous nanocrystalline TiO2 photoelectrodes during water oxidation. J. Phys. Chem. Lett. 2010, 1, 967–972. [Google Scholar] [CrossRef]
  59. Park, J.; Lee, T-W.; Kang, M. Growth, detachment and transfer of highly-ordered TiO2 nanotube arrays: Use in dye-sensitized solar cells. Chem. Commun. 2008, 2867–2869. [Google Scholar]
  60. Dubey, M.; Shrestha, M.; Zhong, Y.; Galipeau, D.; He, H. TiO2 nanotube membranes on transparent conducting glass for high efficiency dye-sensitized solar cells. Nanotechnology 2011, 22, 285201:1–285201:9. [Google Scholar] [CrossRef]
  61. Dale, G.; Hamilton, W.; Dunlop, P.; Lemoine, P.; Byrne, J. Electrochemical growth of titanium oxide nanotubes: Effect of surface roughness and applied potential. J. Nanosci. Nanotechnol. 2009, 9, 4215–4219. [Google Scholar] [CrossRef] [PubMed]
  62. Mohammadpour, A.; Shankar, K. Anodic TiO2 nanotube arrays with optical wavelength-sized apertures. J. Mater. Chem. 2010, 20, 8474–8477. [Google Scholar] [CrossRef]
  63. Liang, S.; He, J.; Sun, Z.; Liu, Q.; Jiang, Y.; Cheng, H.; He, B.; Xie, Z.; Wei, S. Improving photoelectrochemical water splitting activity of TiO2 nanotube arrays by tuning geometrical parameters. J. Phys. Chem. C 2012, 116, 9049–9053. [Google Scholar] [CrossRef]
  64. Haugeneder, A.; Neges, M.; Kallinger, C.; Spirkl, W.; Lemmer, U.; Feldmann, J. Exciton diffusion and dissociation in conjugated polymer/fullerene blends and heterostructures. Phys. Rev. B 1999, 59, 15346–15351. [Google Scholar] [CrossRef]
  65. Coakley, K.; Liu, Y.; McGehee, M.; Frindell, K.; Stucky, G. Infiltrating semiconducting polymers into self-assembled mesoporous titania films for photovoltaic applications. Adv. Funct. Mater. 2003, 13, 301–306. [Google Scholar] [CrossRef]
  66. Macak, J.; Tsuchiya, H.; Taveira, L.; Aldabergerova, S.; Schmuki, P. Smooth anodic TiO2 nanotubes. Angew. Chem. Int. Ed. 2005, 44, 7463–7465. [Google Scholar] [CrossRef]
  67. Macak, J.; Tsuchiya, H.; Schmuki, P. High-aspect-ratio TiO2 nanotubes by anodization of titanium. Angew. Chem. Int. Ed. 2005, 44, 2100–2102. [Google Scholar] [CrossRef]
  68. Balaur, E.; Macak, J.; Tsuchiya, H.; Schmuki, P. Wetting behavior of layers of TiO2 nanotubes with different diameters. J. Mater. Chem. 2005, 15, 4488–4491. [Google Scholar] [CrossRef]
  69. Lide, D.R. CRC Handbook of Chemistry and Physics, 85th ed.; CRC Press: Boca Raton, FL, USA, 2004. [Google Scholar]
  70. Chen, Y.; Lu, H.; Wang, X.; Lu, S. Large-scale sparse TiO2 nanotube arrays by anodization. J. Mater. Chem. 2012, 22, 5921–5923. [Google Scholar] [CrossRef]
  71. Zhu, K.; Vinzant, T.; Neale, N.; Frank, A. Removing structural disorder from oriented TiO2 nanotube arrays: Reducing the dimensionality of transport and recombination in dye-sensitized solar cells. Nano Lett. 2007, 7, 3739–3746. [Google Scholar] [CrossRef] [PubMed]
  72. Allman, N.; Grimes, C. Room temperature one-step polyol synthesis of anatase TiO2 nanotube arrays: Photoelectrochemical properties. Langmuir 2009, 25, 7234–7240. [Google Scholar] [CrossRef] [PubMed]
  73. Lee, K.; Kim, D.; Roy, P.; Paramasivam, I.; Birajdar, B.I.; Spiecker, E.; Schmuki, P. Anodic formation of thick anatase TiO2 mesosponge layers for high-efficiency photocatalysis. J. Am. Chem. Soc. 2010, 132, 1478–1479. [Google Scholar] [CrossRef] [PubMed]
  74. Liu, B.; Khare, A.; Aydil, E. Synthesis of single-crystalline anatase nanorods and nanoflakes on transparent conducting substrates. Chem. Commun. 2012, 48, 8565–8567. [Google Scholar] [CrossRef]
  75. Fàbrega, C.; Hernández-Ramírez, F.; Prades, J.D.; Jiménez-Díaz, R.; Andreu, T.; Morante, J.R. On the photoconduction properties of low resistivity TiO2 nanotubes. Nanotechnology 2010, 21, 445703:1–445703:6. [Google Scholar] [CrossRef]
  76. Richter, C.; Schmuttenmaer, C. Exciton-like trap states limit electron mobility in TiO2 nanotubes. Nat. Nanotechnol. 2010, 5, 769–772. [Google Scholar] [CrossRef] [PubMed]
  77. Liao, Y.; Que, W. Preparation and photocatalytic activity of TiO2 nanotube powders derived by a rapid anodization process. J. Alloy. Compd. 2010, 1, 243–248. [Google Scholar] [CrossRef]
  78. Li, H.; Zhang, W.; Pan, W. Enhanced photocatalytic activity of electrospun TiO2 nanofibers with optimal anatase/rutile ratio. J. Am. Ceram. Soc. 2011, 94, 3184–3187. [Google Scholar] [CrossRef]
  79. Berry, R.; Mueller, M. Photocatalytic decomposition of crude oil slicks using TiO2 on a floating substrate. Microchem. J. 1994, 50, 28–32. [Google Scholar] [CrossRef]
  80. Allam, N.; El-Sayed, M. Photoelectrochemical water oxidation characteristics of anodically fabricated TiO2 nanotube arrays: Structural and optical properties. J. Phys. Chem. C 2010, 114, 12024–12029. [Google Scholar] [CrossRef]
  81. Park, N.-G.; van de Lagemaat, J.; Frank, A. Comparison of dye-sensitized rutile- and anatase-based TiO2 solar cells. J. Phys. Chem. B 2000, 104, 8989–8994. [Google Scholar] [CrossRef]
  82. Albu, S.; Ghicov, A.; Macak, J.; Hahn, R.; Schmiki, P. Self-organized, free-standing TiO2 nanotube membrane for flow-through photocatalytic applications. Nano Lett. 2007, 7, 1286–1289. [Google Scholar] [CrossRef] [PubMed]
  83. Chen, B.; Lu, K.; Tian, Z. Effects of titania nanotube distance and arrangement during focused ion beam guided anodization. J. Mater. Chem. 2011, 21, 8835–8840. [Google Scholar] [CrossRef]
  84. Wang, J.; Lin, Z. Freestanding TiO2 nanotube arrays with ultrahigh aspect ratio via electrochemical anodization. Chem. Mater. 2008, 20, 1257–1261. [Google Scholar] [CrossRef]
  85. Lai, C.W.; Sreekantan, S. Photoelectrochemical performance of smooth TiO2 nanotube arrays: Effect of anodization temperature and cleaning methods. Int. J. Photoenergy 2012, 2012, 356943:1–356943:11. [Google Scholar] [CrossRef]
  86. Chen, Q.; Xu, D.; Wu, Z.; Liu, Z. Free-standing TiO2 nanotube arrays made by anodic oxidation and ultrasonic splitting. Nanotechnology 2008, 19, 365708:1–365708:5. [Google Scholar]
  87. Rho, C.; Min, J.; Suh, J.S. Barrier layer effect on the electron transport of the dye-sensitized solar cells based on TiO2 nanotube arrays. J. Phys. Chem. C 2012, 116, 7213–7218. [Google Scholar] [CrossRef]
  88. Kim, D.; Lee, K.; Roy, P.; Birajdar, B.I.; Spiecker, E.; Schmuki, P. Formation of a non-thickness-limited titanium dioxide mesosponge and its use in dye-sensitized solar cells. Angew. Chem. Int. Ed. 2009, 48, 9326–9329. [Google Scholar] [CrossRef]
  89. Jung, H.Y.; Jung, S.M.; Gu, G.H.; Suh, J.S. Anodic aluminum oxide membrane bonded on a silicon wafer for carbon nanotube field emitter arrays. Appl. Phys. Lett. 2006, 89, 013121:1–013121:3. [Google Scholar]

