Effective Heat and Mass Transport Properties of Anisotropic Porous Ceria for Solar Thermochemical Fuel Generation

Abstract
:
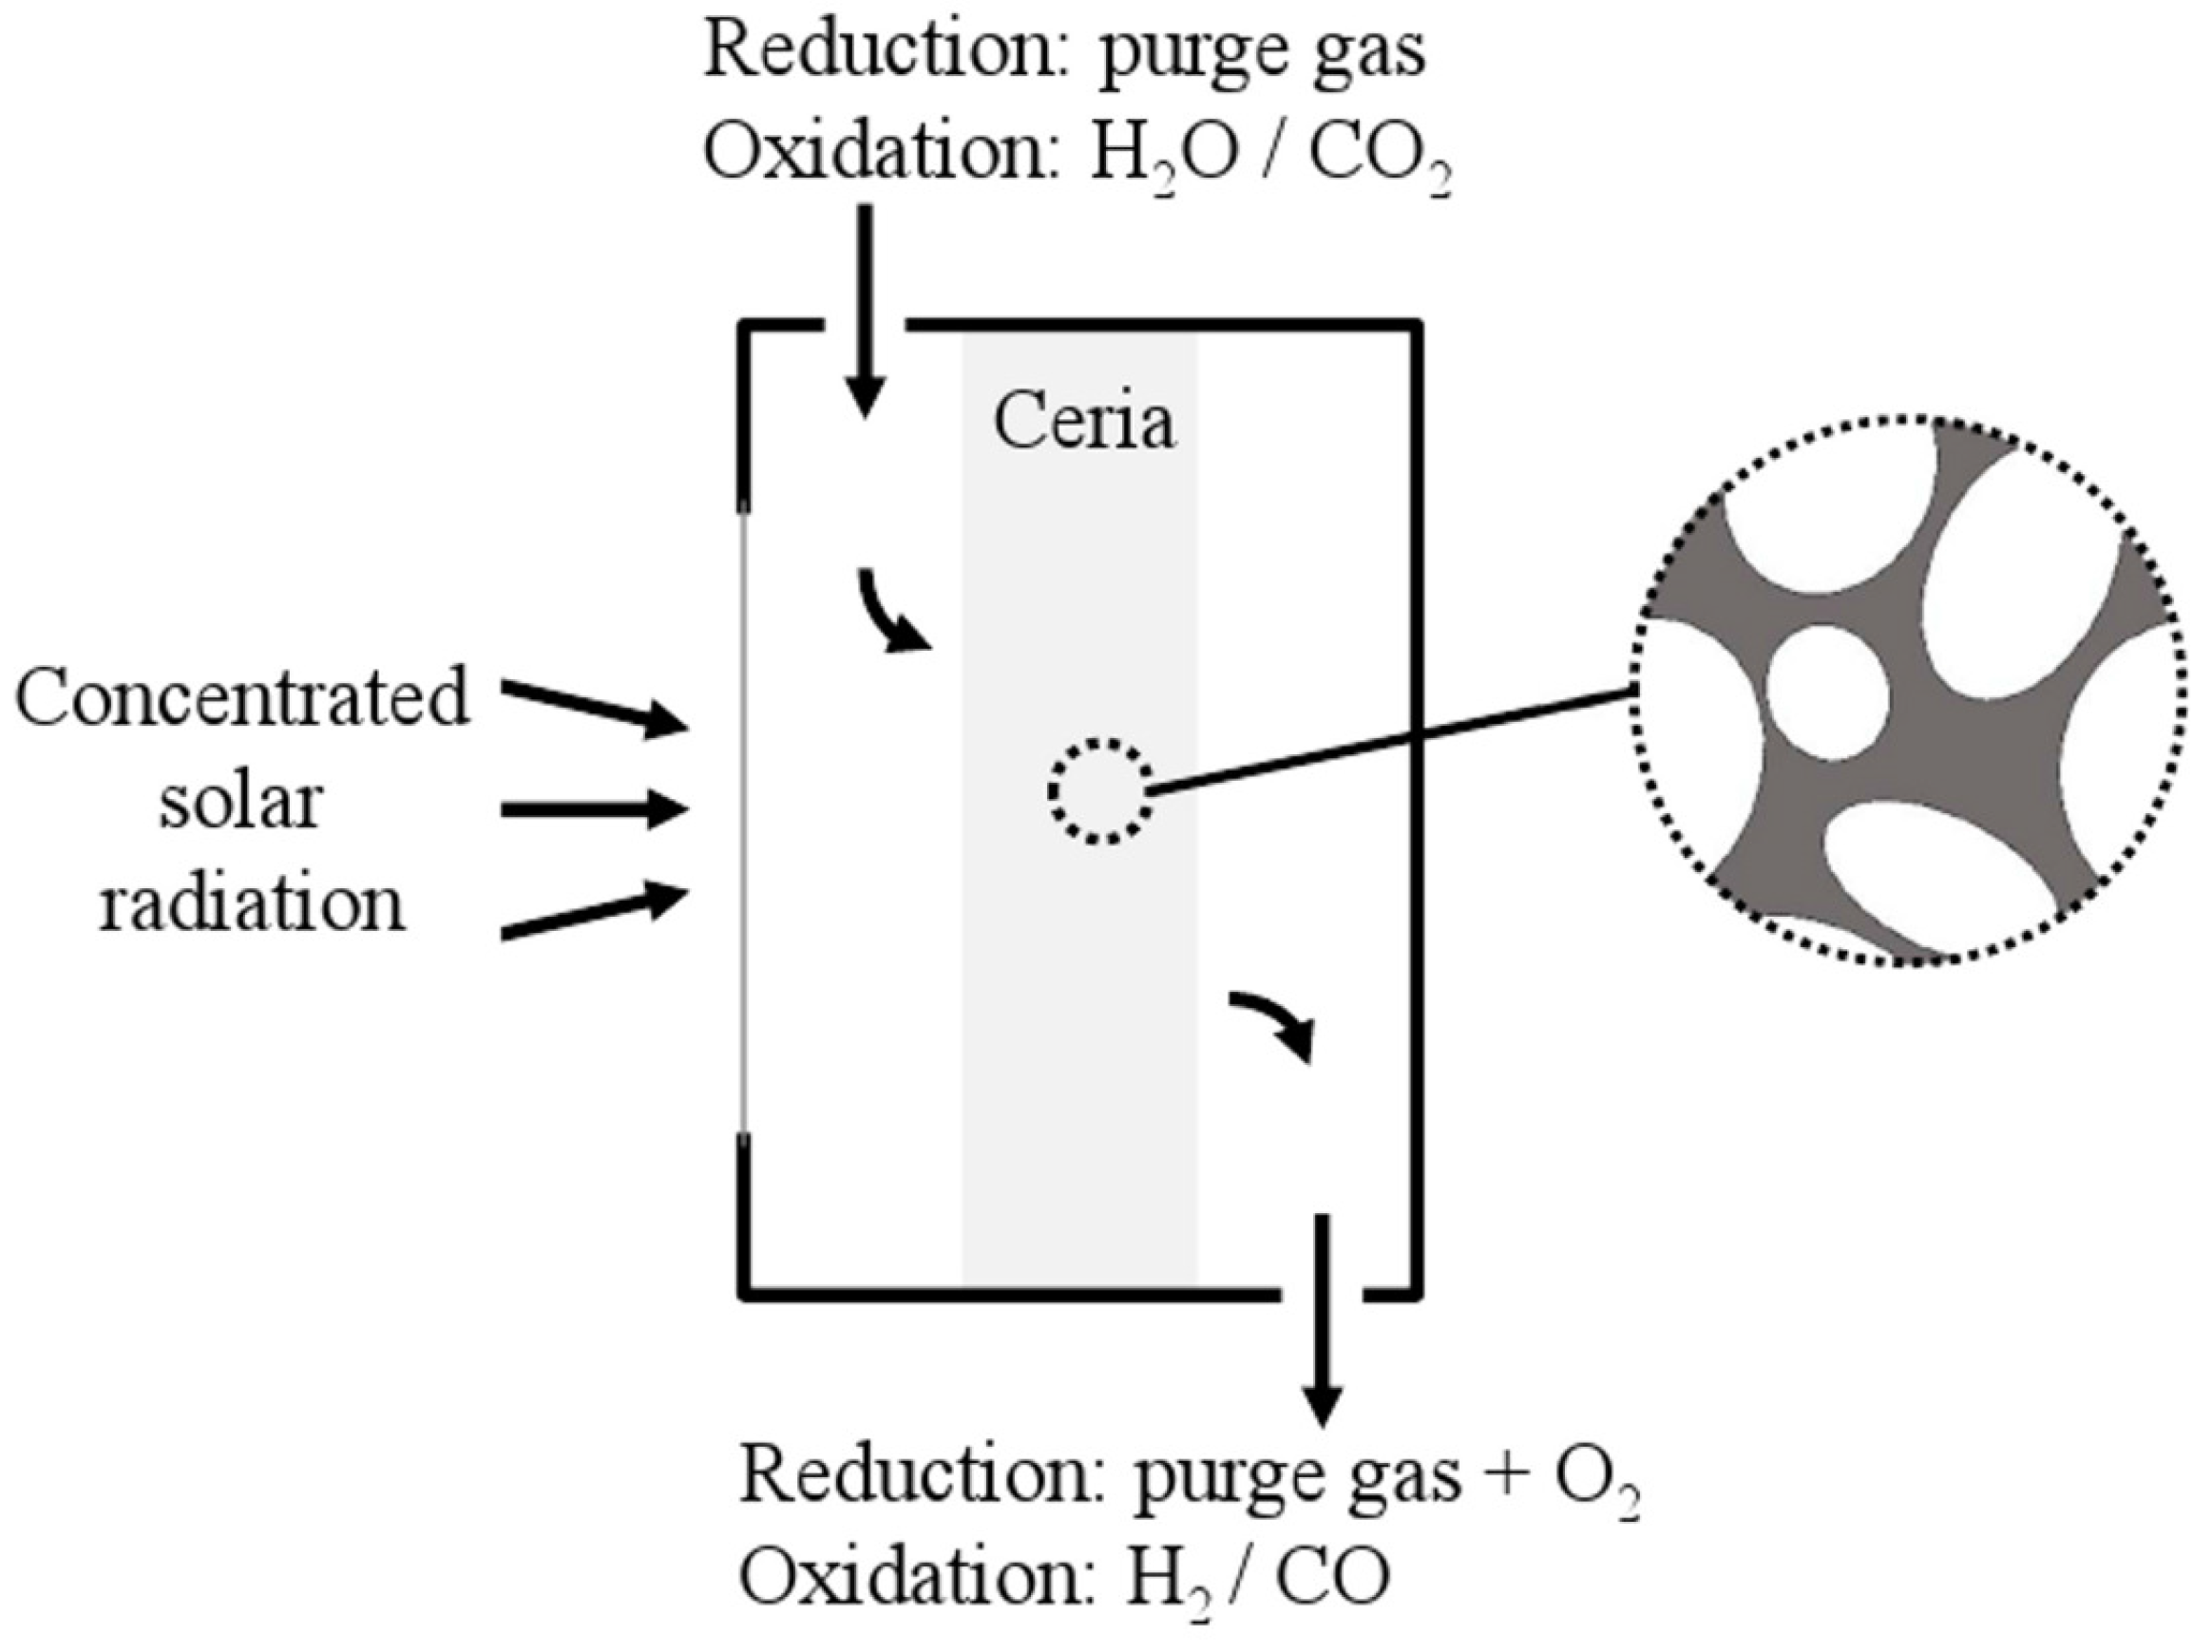
1. Introduction
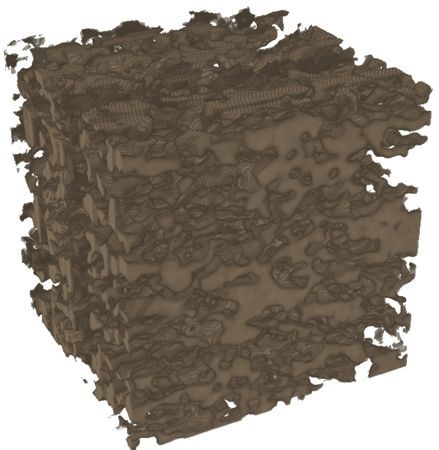
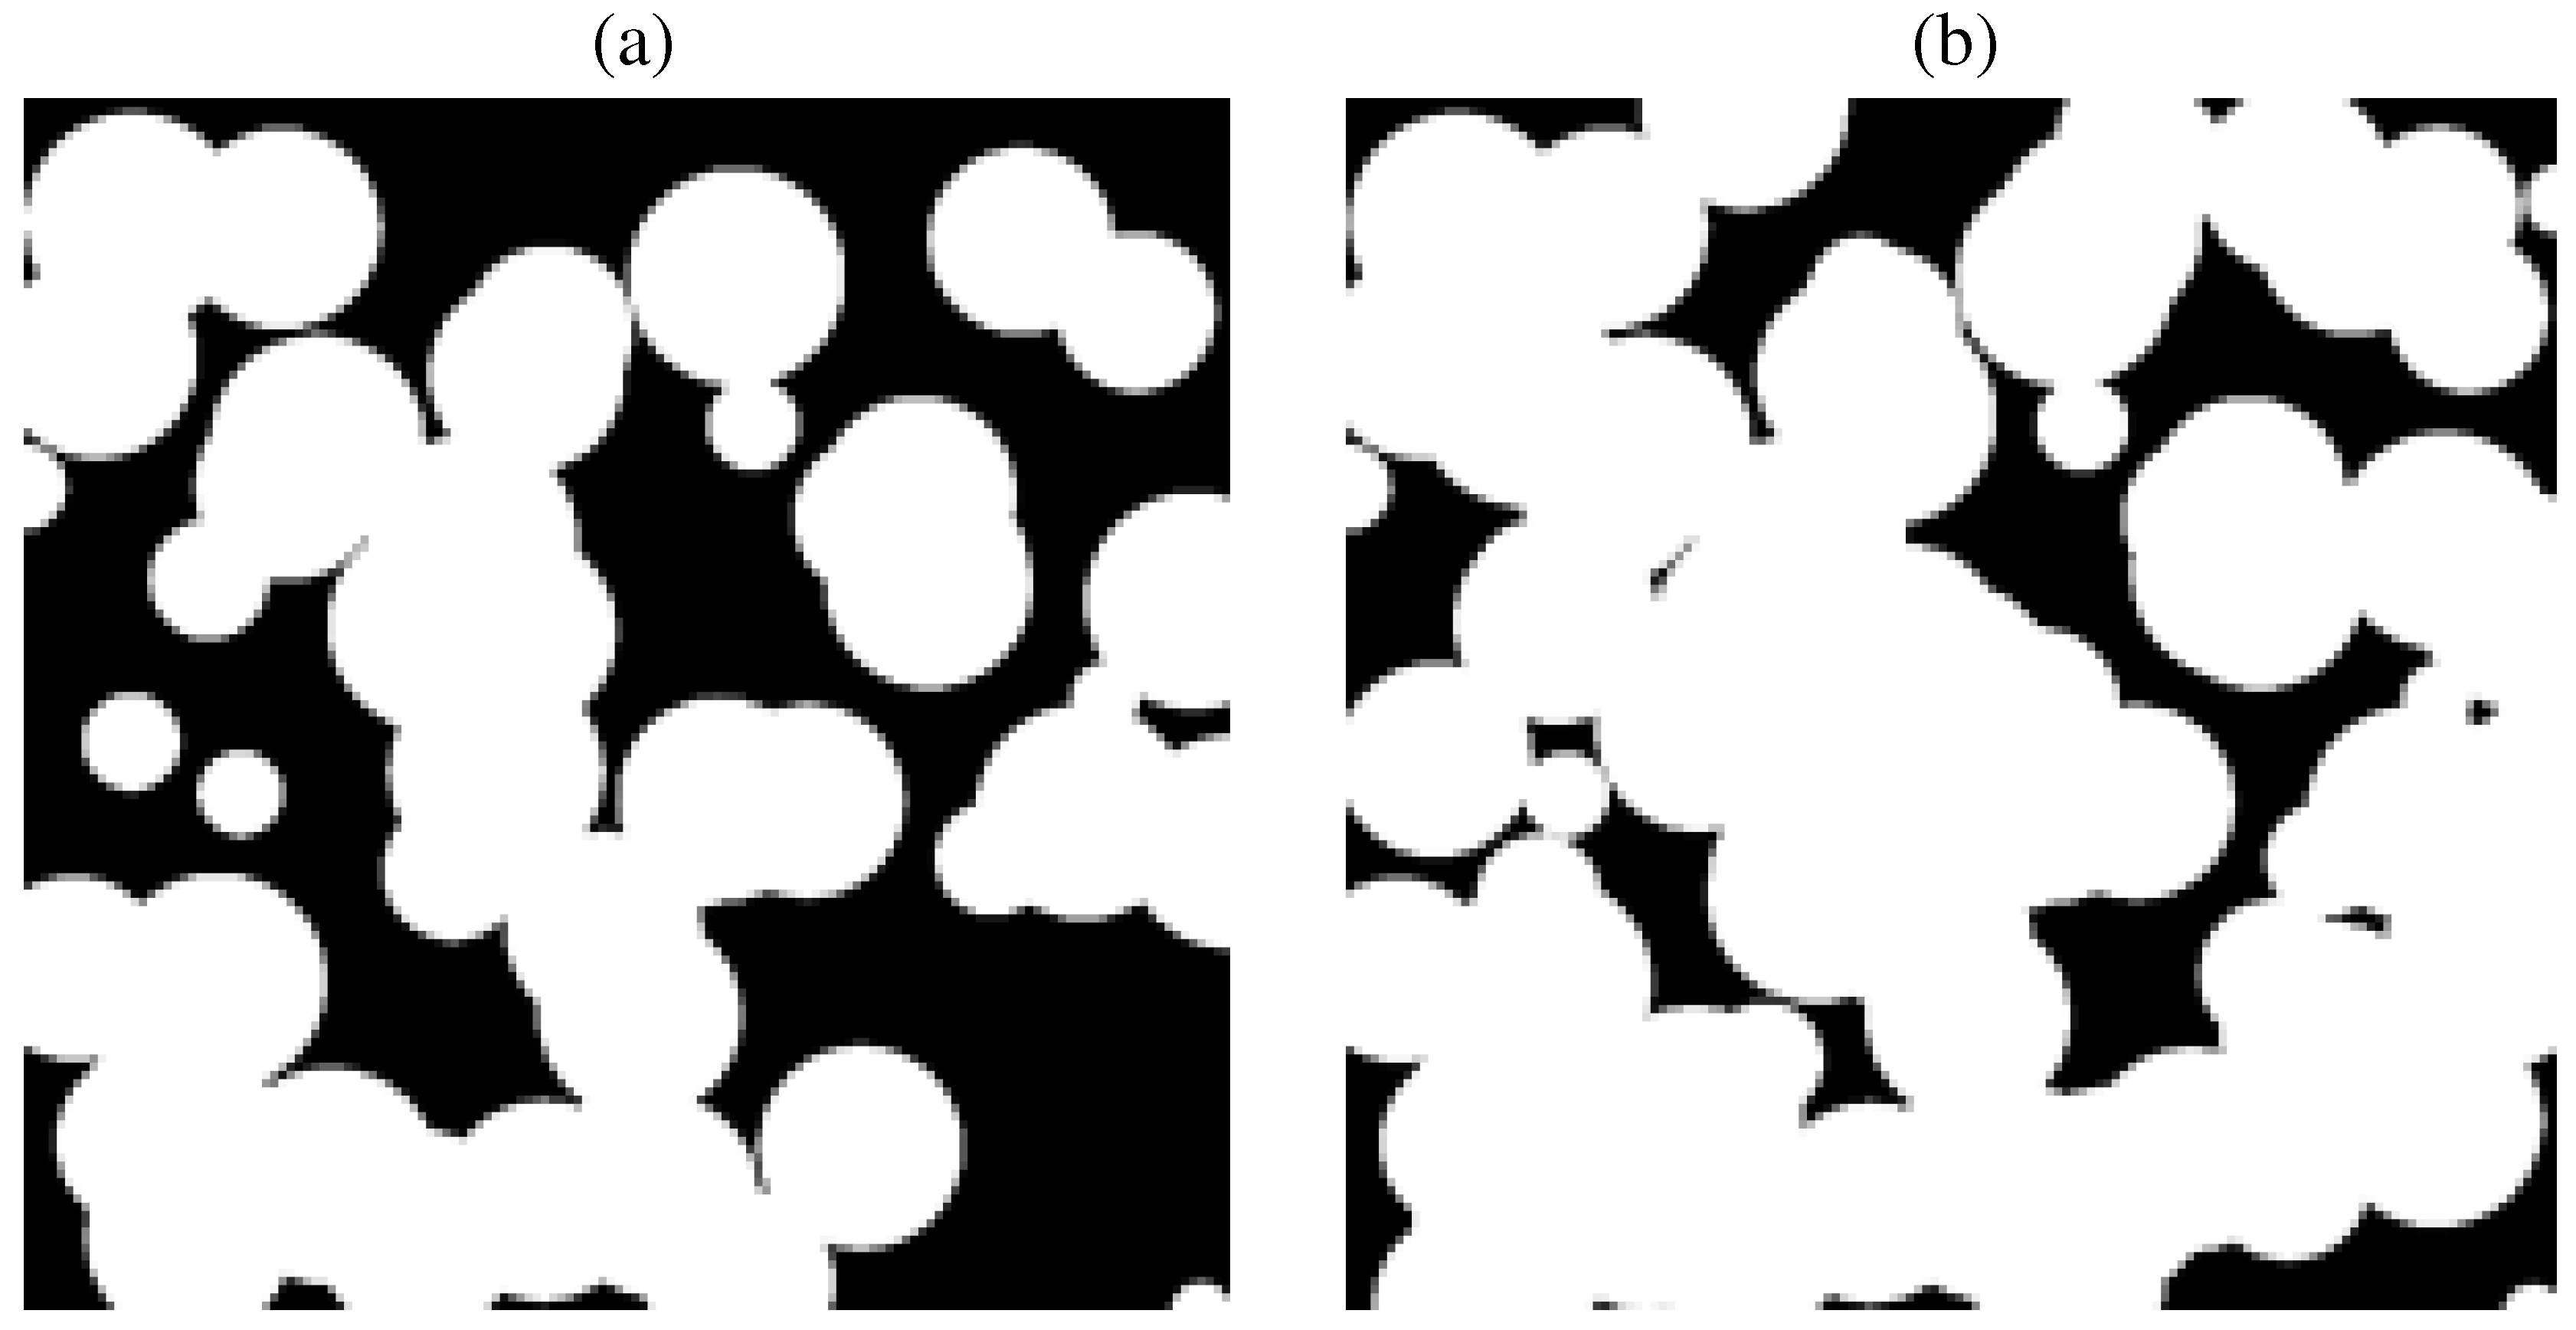
2. Computed Tomography


| Sample No. | 1 | 2 | 3 |
|---|---|---|---|
| vol% ratio 1 | 1:3:1 | 1:2:2 | 1:1:3 |
| 0.51 | 0.56 | 0.55 | |
| 0.65 ± 0.1 | 0.65 ± 0.1 | 0.65 ± 0.1 | |
| (mm) | 672 | 706 | 675 |
| (μm) | 13.7 | 11.9 | 10.0 |
| (μm) | 13.3 | 11.8 | 8.9 |
| (μm) | 13.1 | 11.5 | 9.7 |
| β (m), x-direction | 30,003 ± 8,282 | 38,143 ± 6,277 | 45,173 ± 4,665 |
| β (m), y-direction | 31,757 ± 7,067 | 35,042 ± 4,546 | 46,277 ± 6,485 |
| β (m), z-direction | 69,018 ± 14,735 | 65,665 ± 9,809 | 74,835 ± 15,022 |
| a, x-direction | 0.427 | 0.443 | 0.506 |
| a, y-direction | 0.354 | 0.482 | 0.512 |
| a, z-direction | 0.751 | 0.740 | 0.705 |
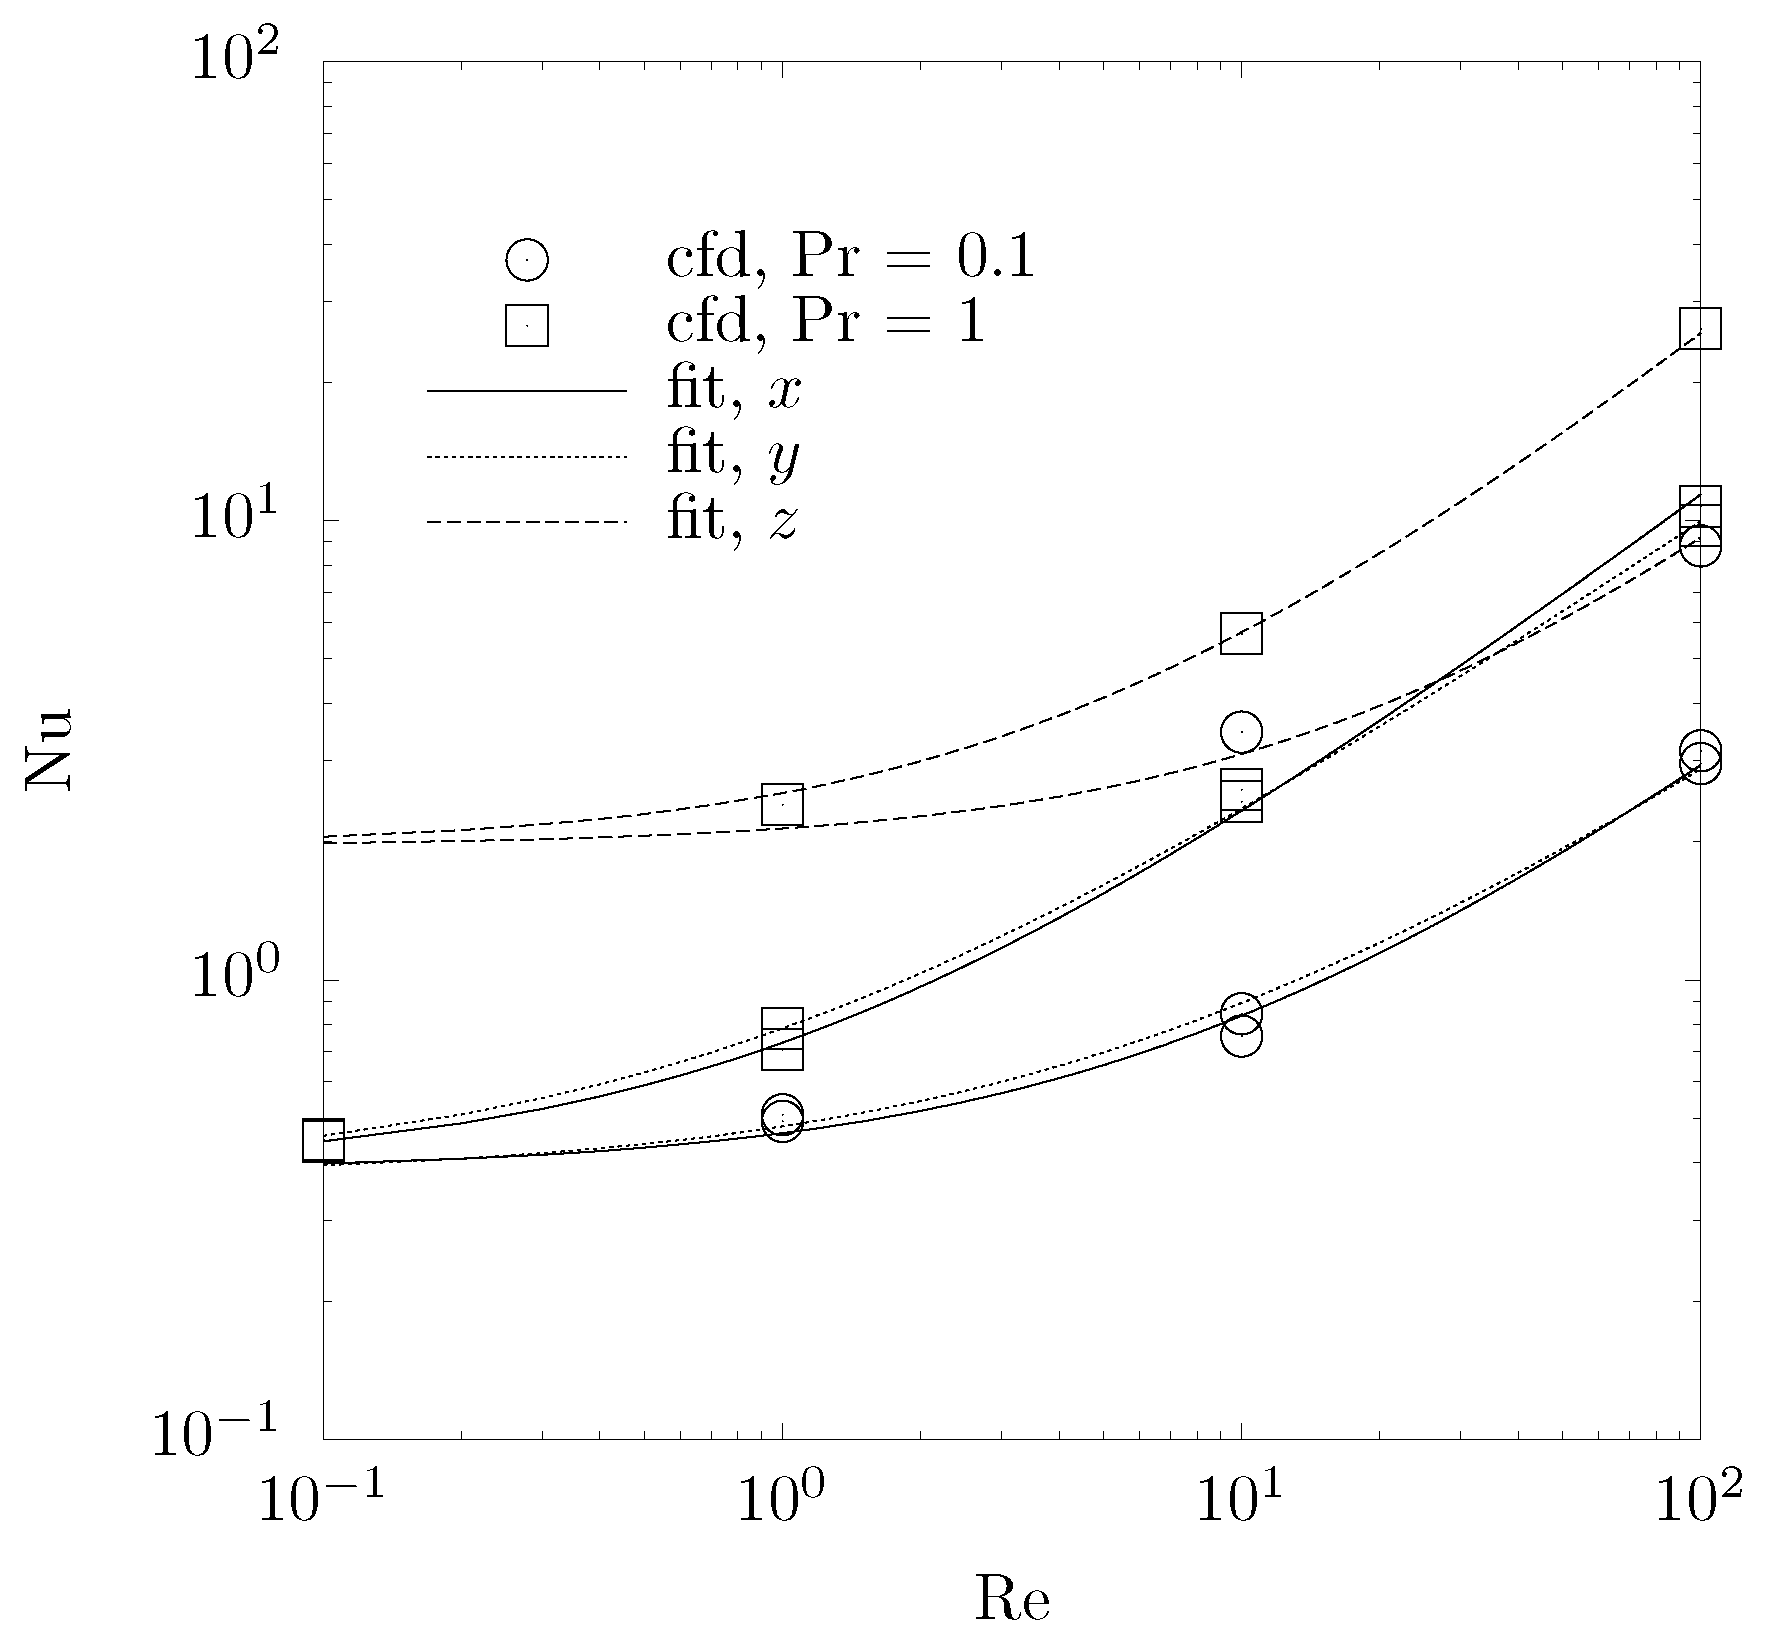
| Nu, x-direction | 0.38 + 0.35RePr | 1.09 + 0.50RePr | 0.82 + 0.64RePr |
| Nu, y-direction | 0.37 + 0.41RePr | 0.75 + 0.53RePr | 1.13 + 0.56RePr |
| Nu, z-direction | 1.96 + 0.60RePr | 1.28 + 0.65RePr | 1.96 + 0.94RePr |
| K (m), x-direction | 6.04 × 10 | 3.54 × 10 | 2.92 × 10 |
| K (m), y-direction | 7.97 × 10 | 3.80 × 10 | 3.03 × 10 |
| K (m), z-direction | 7.43 × 10 | 1.27 × 10 | 1.30 × 10 |
| (m) , x-dir. | 18.4 × 10 | 16.8 × 10 | 19.4 × 10 |
| (m) , y-dir. | 12.4 × 10 | 17.5 × 10 | 19.3 × 10 |
| (m) , z-dir. | 278.9 × 10 | 93.5 × 10 | 75.3 × 10 |
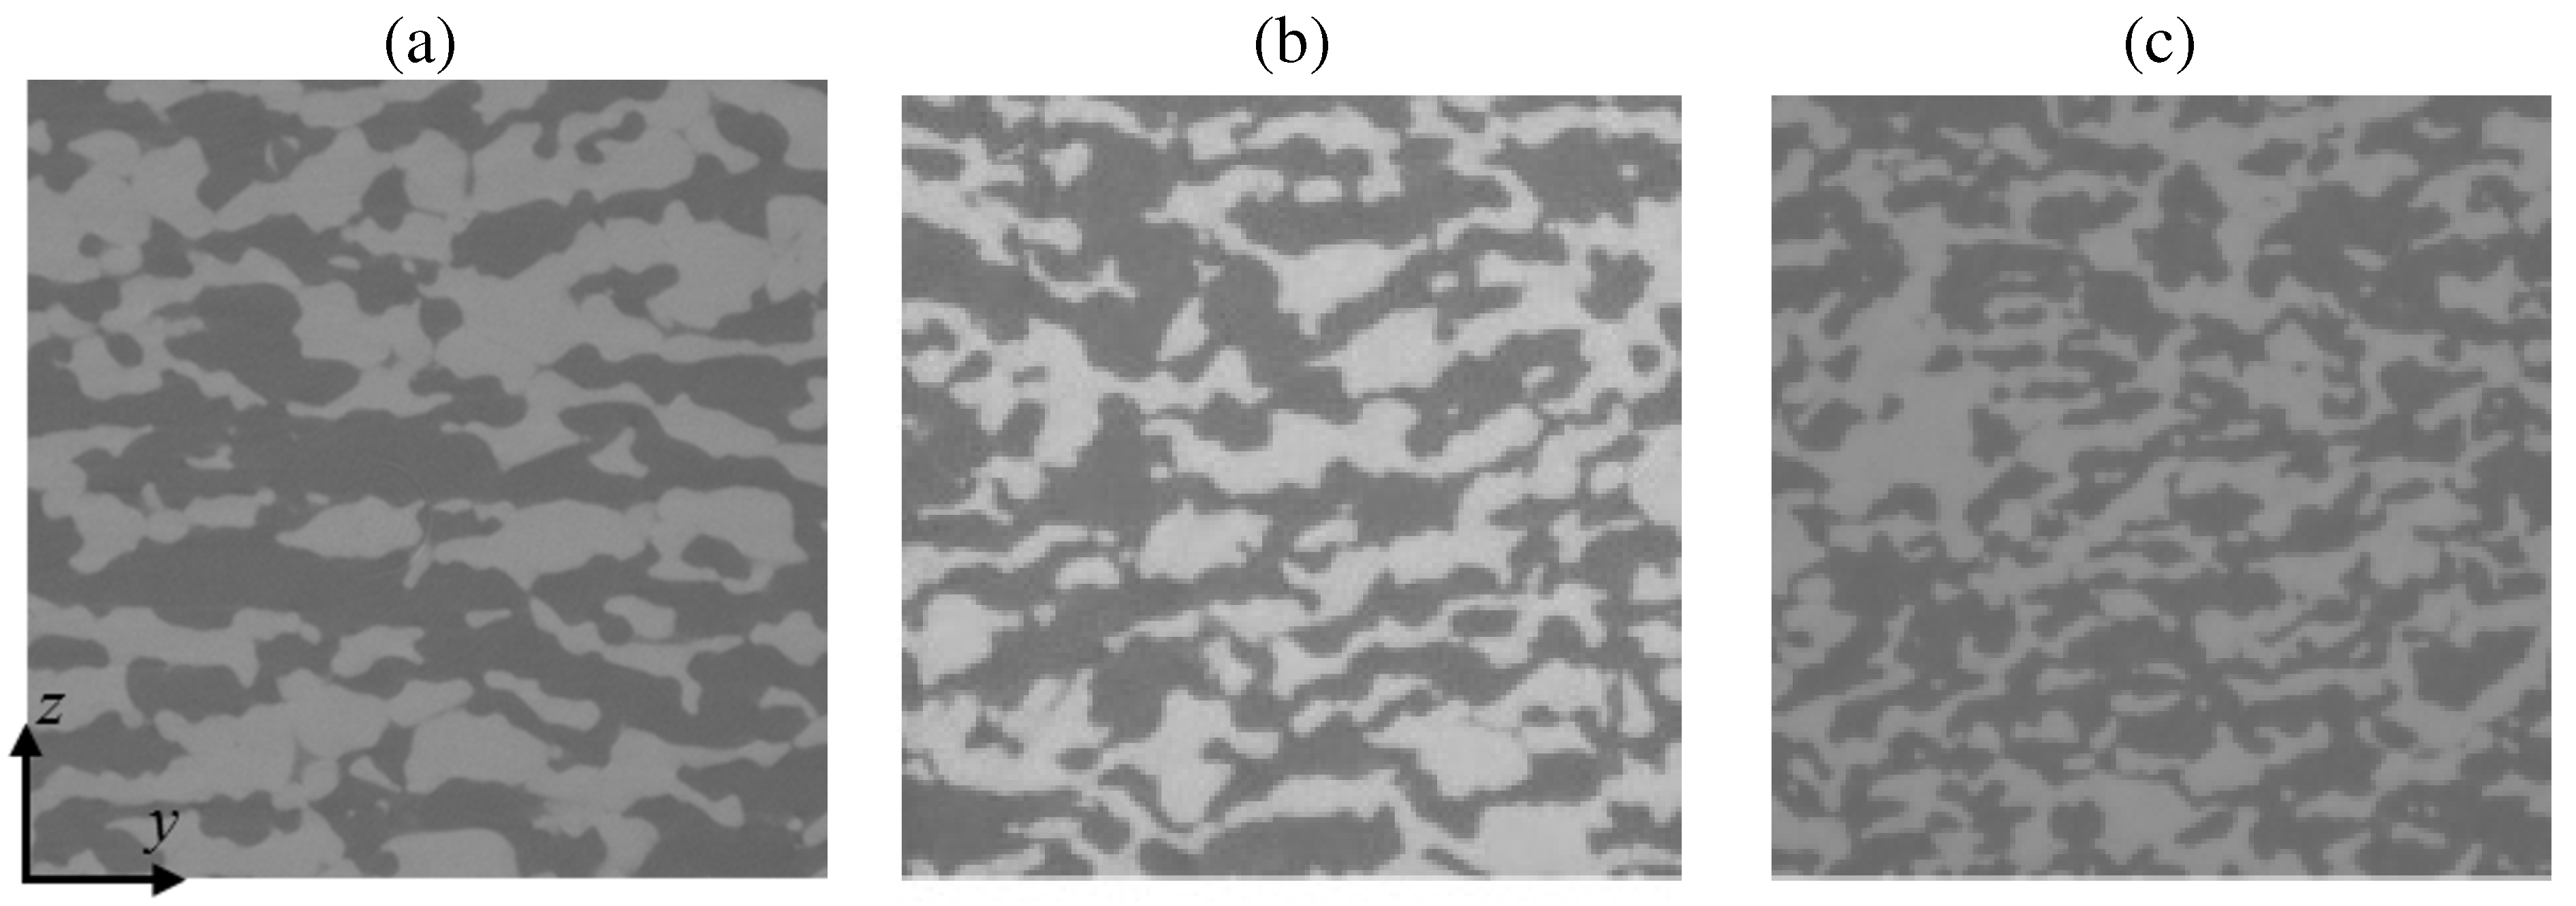
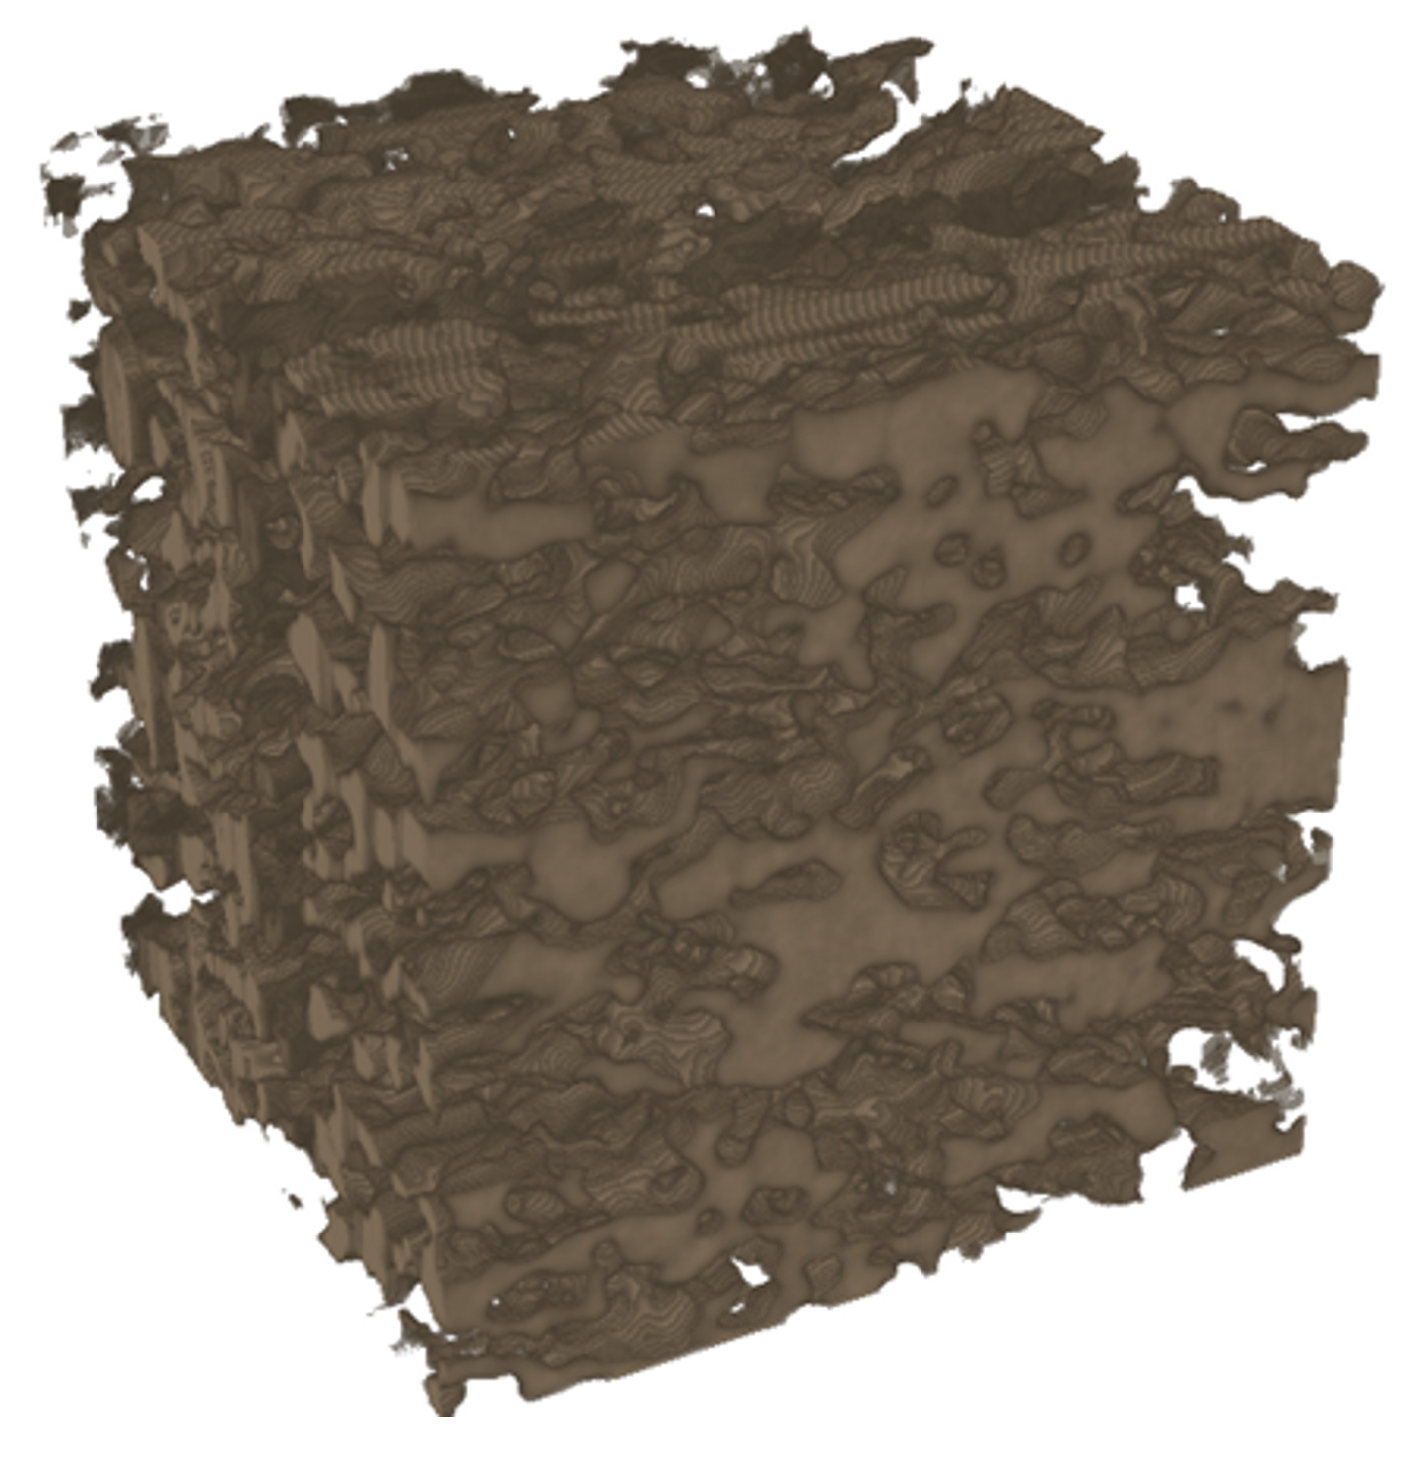
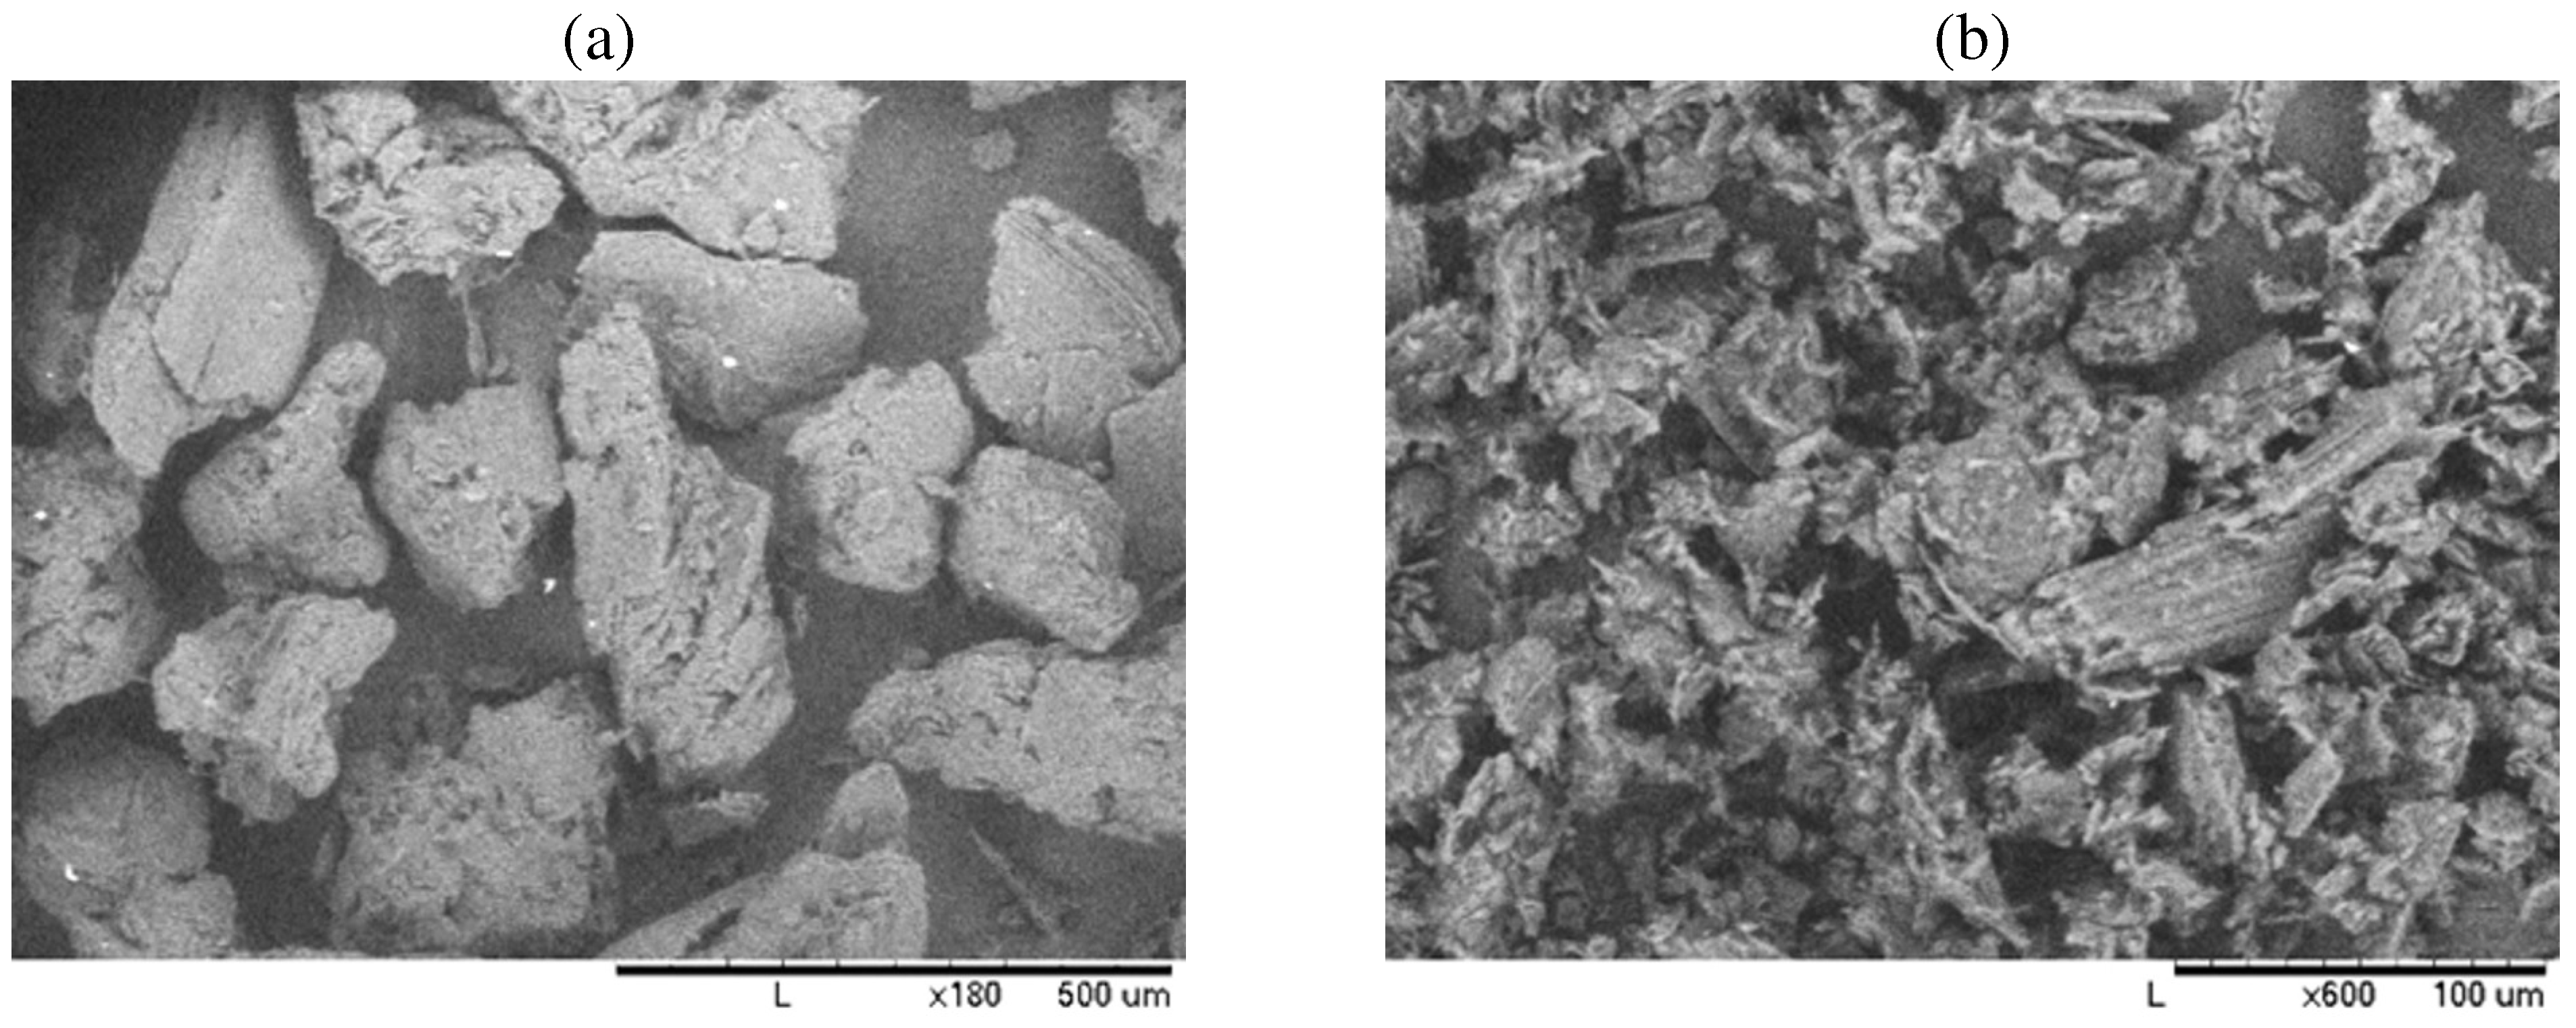
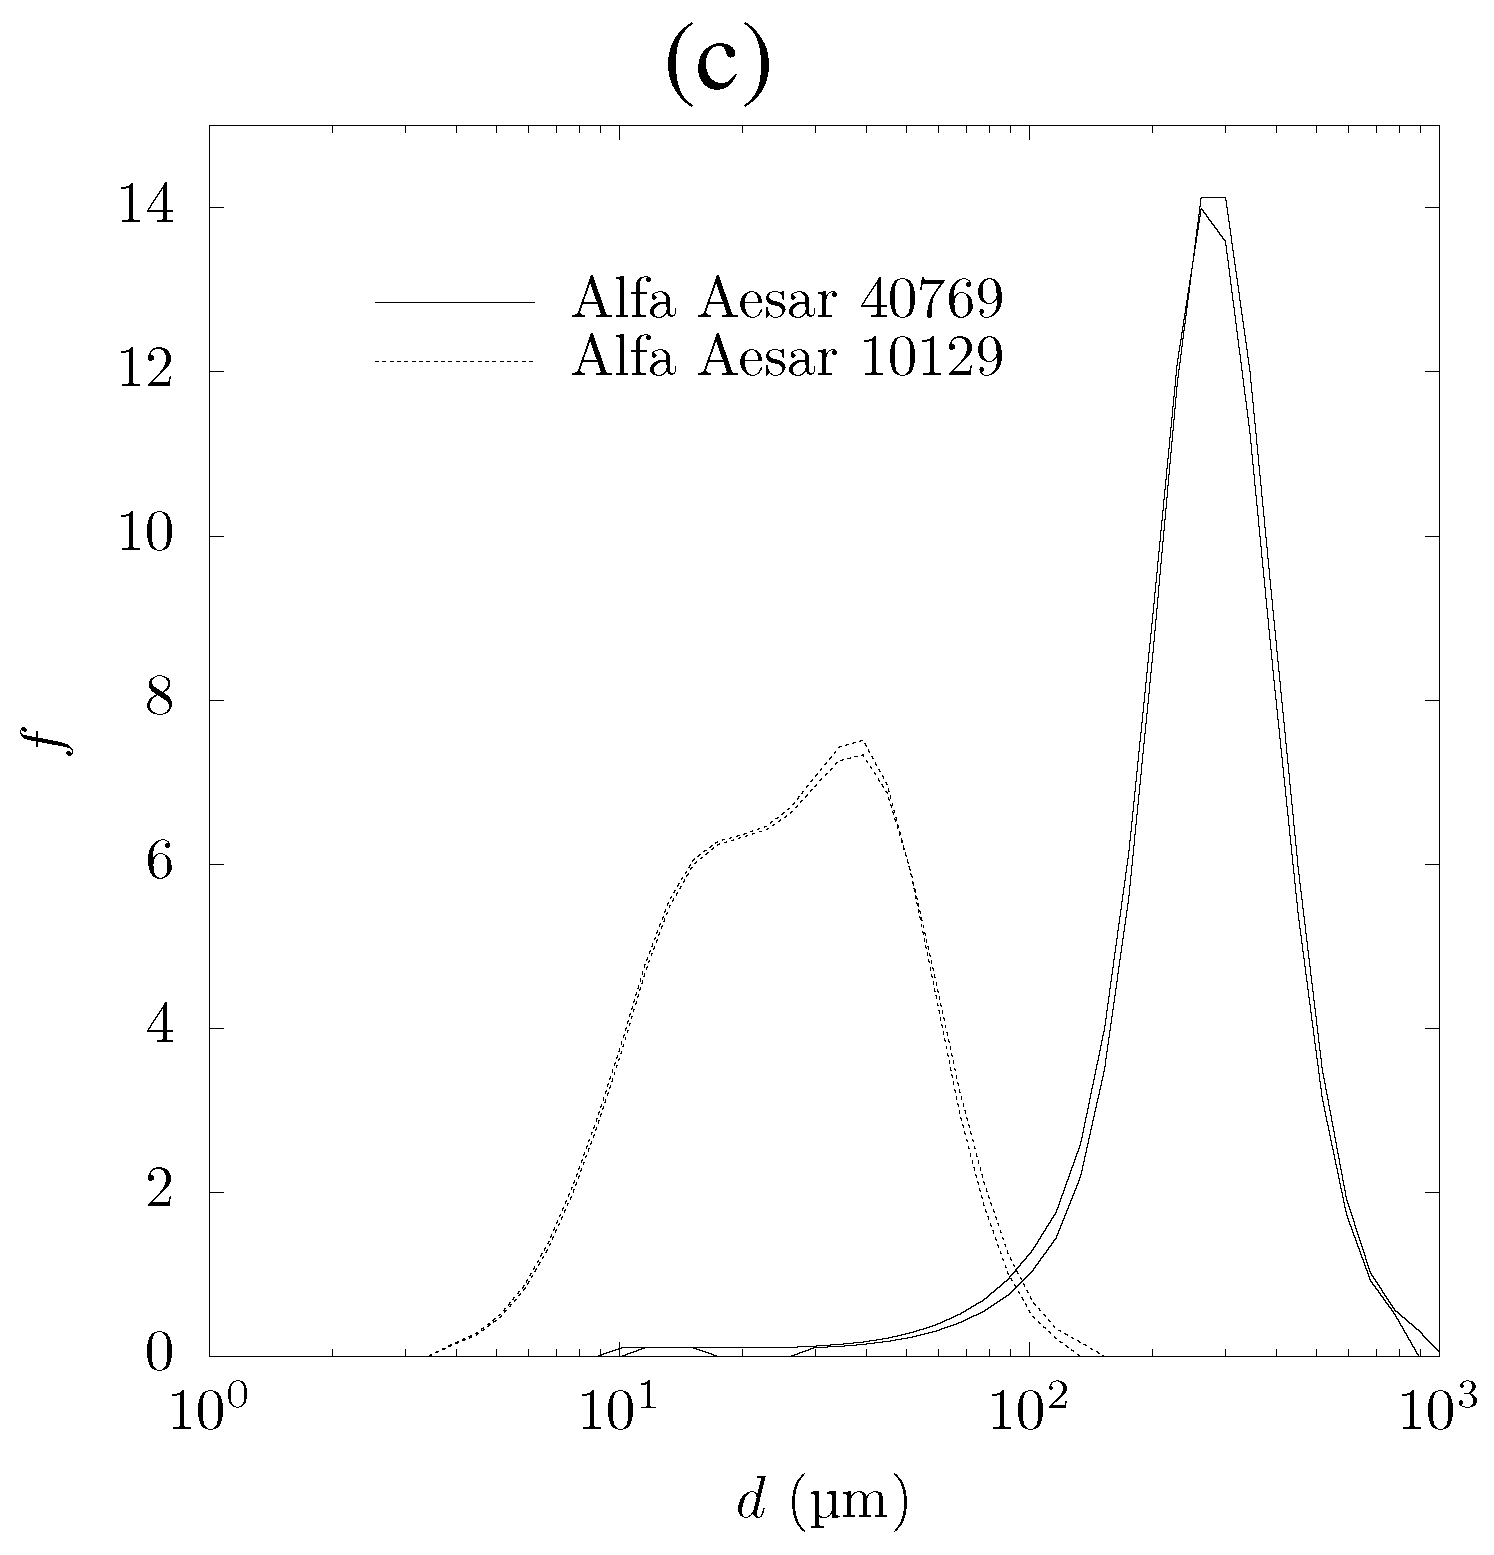
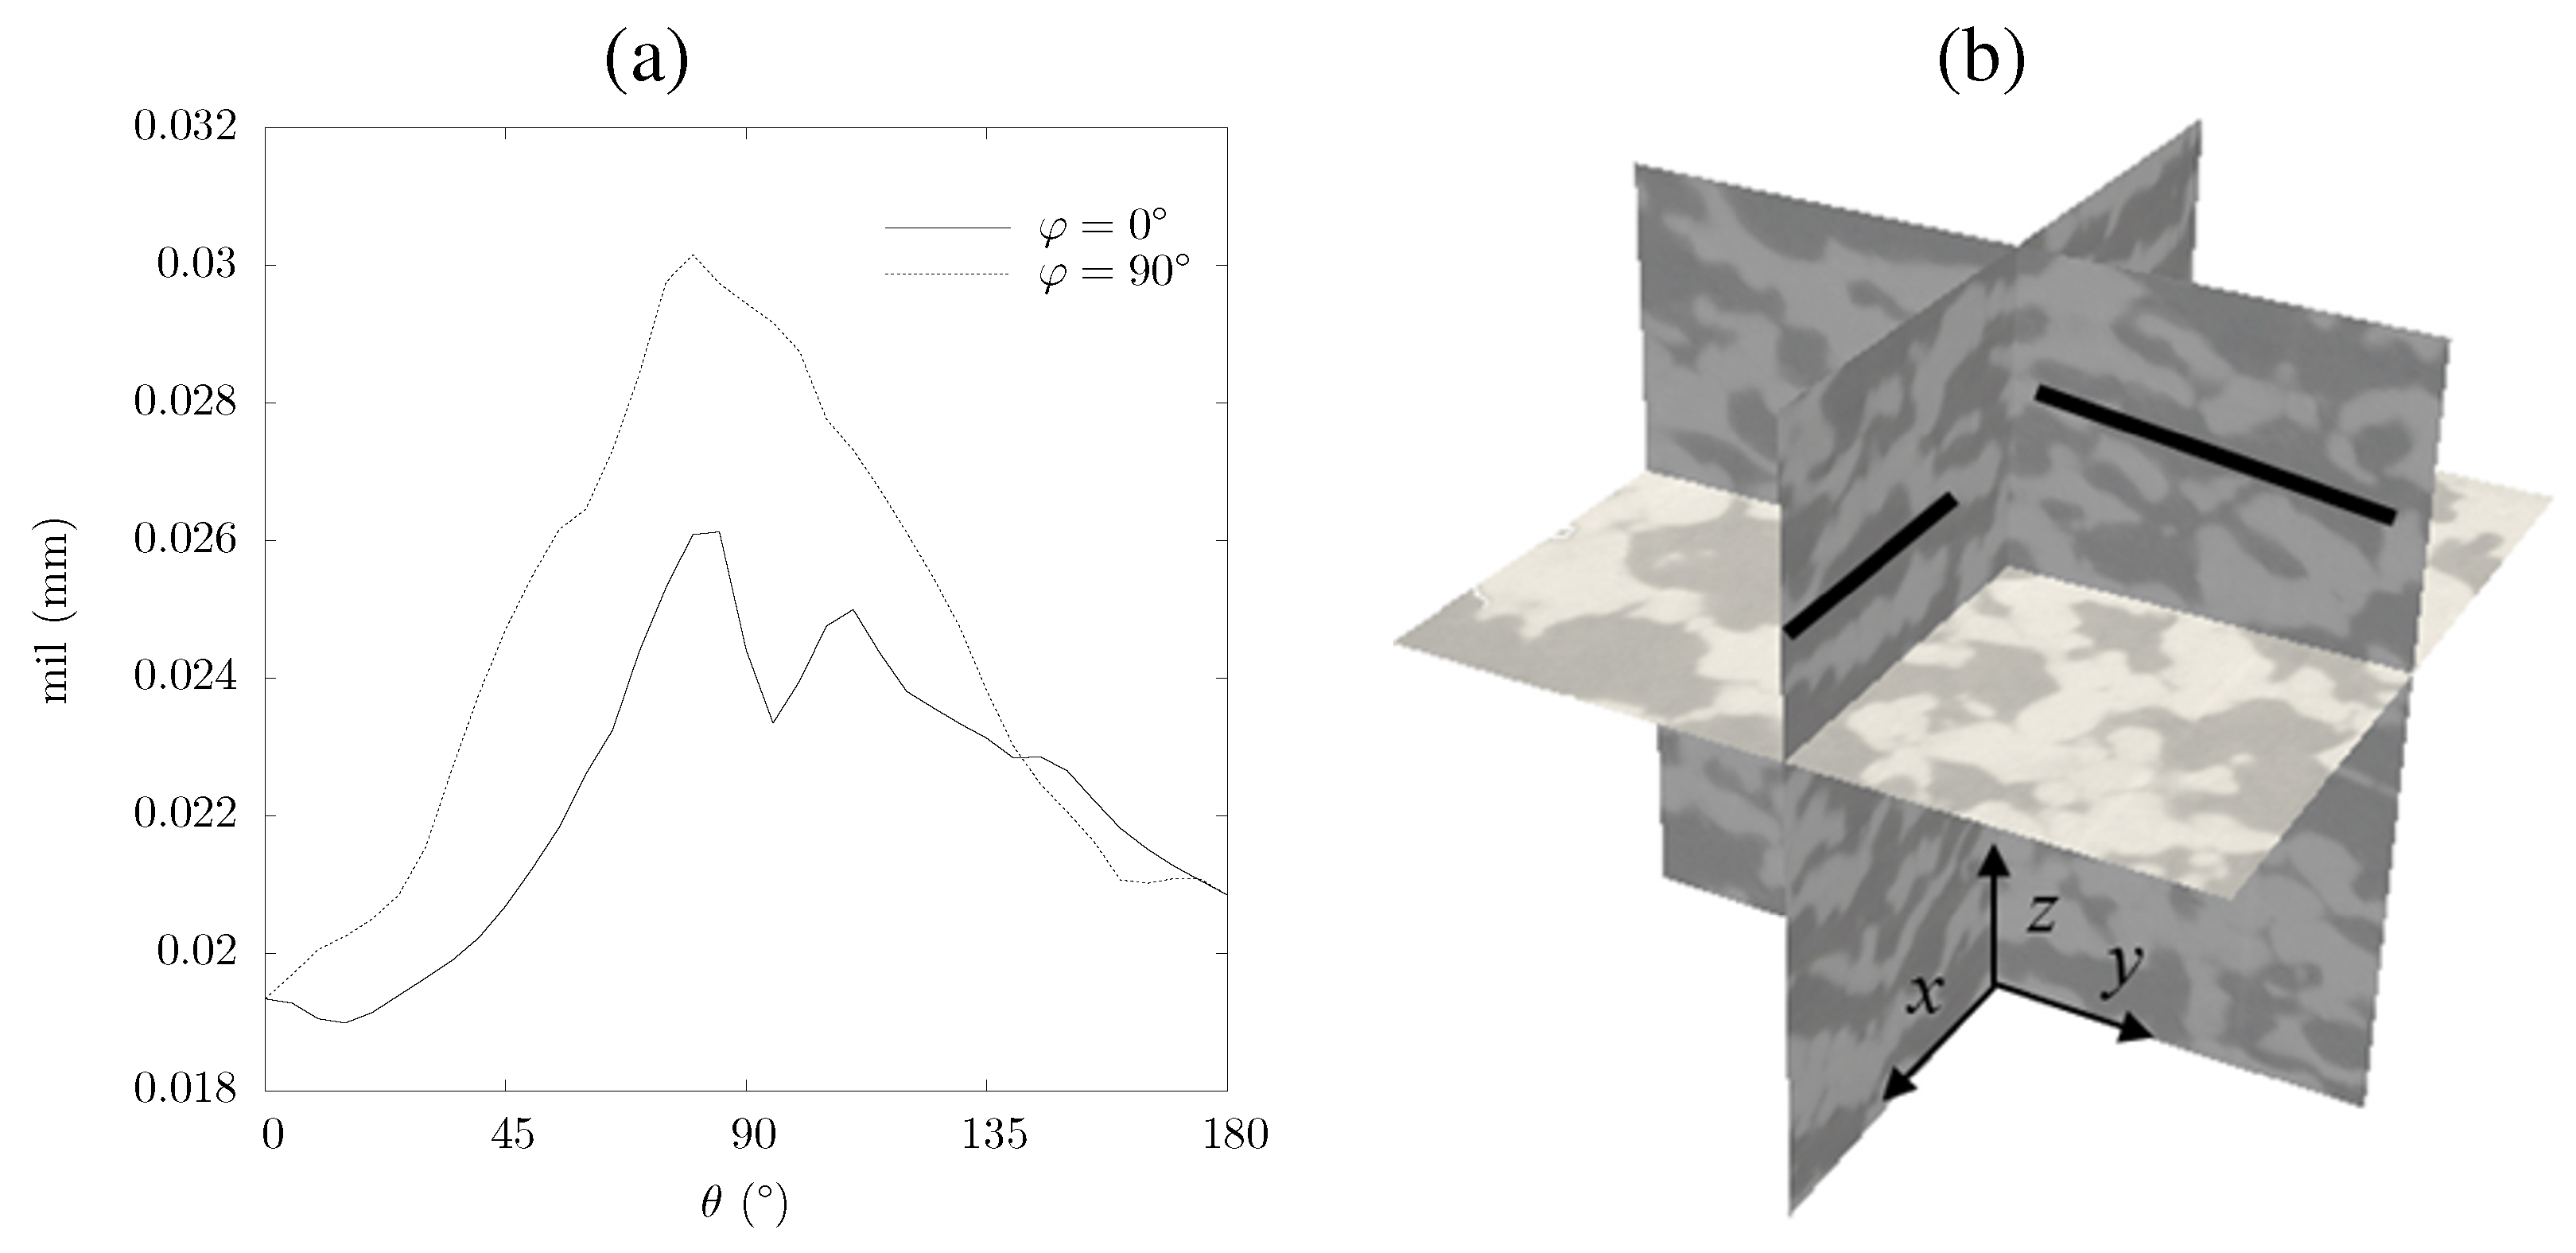
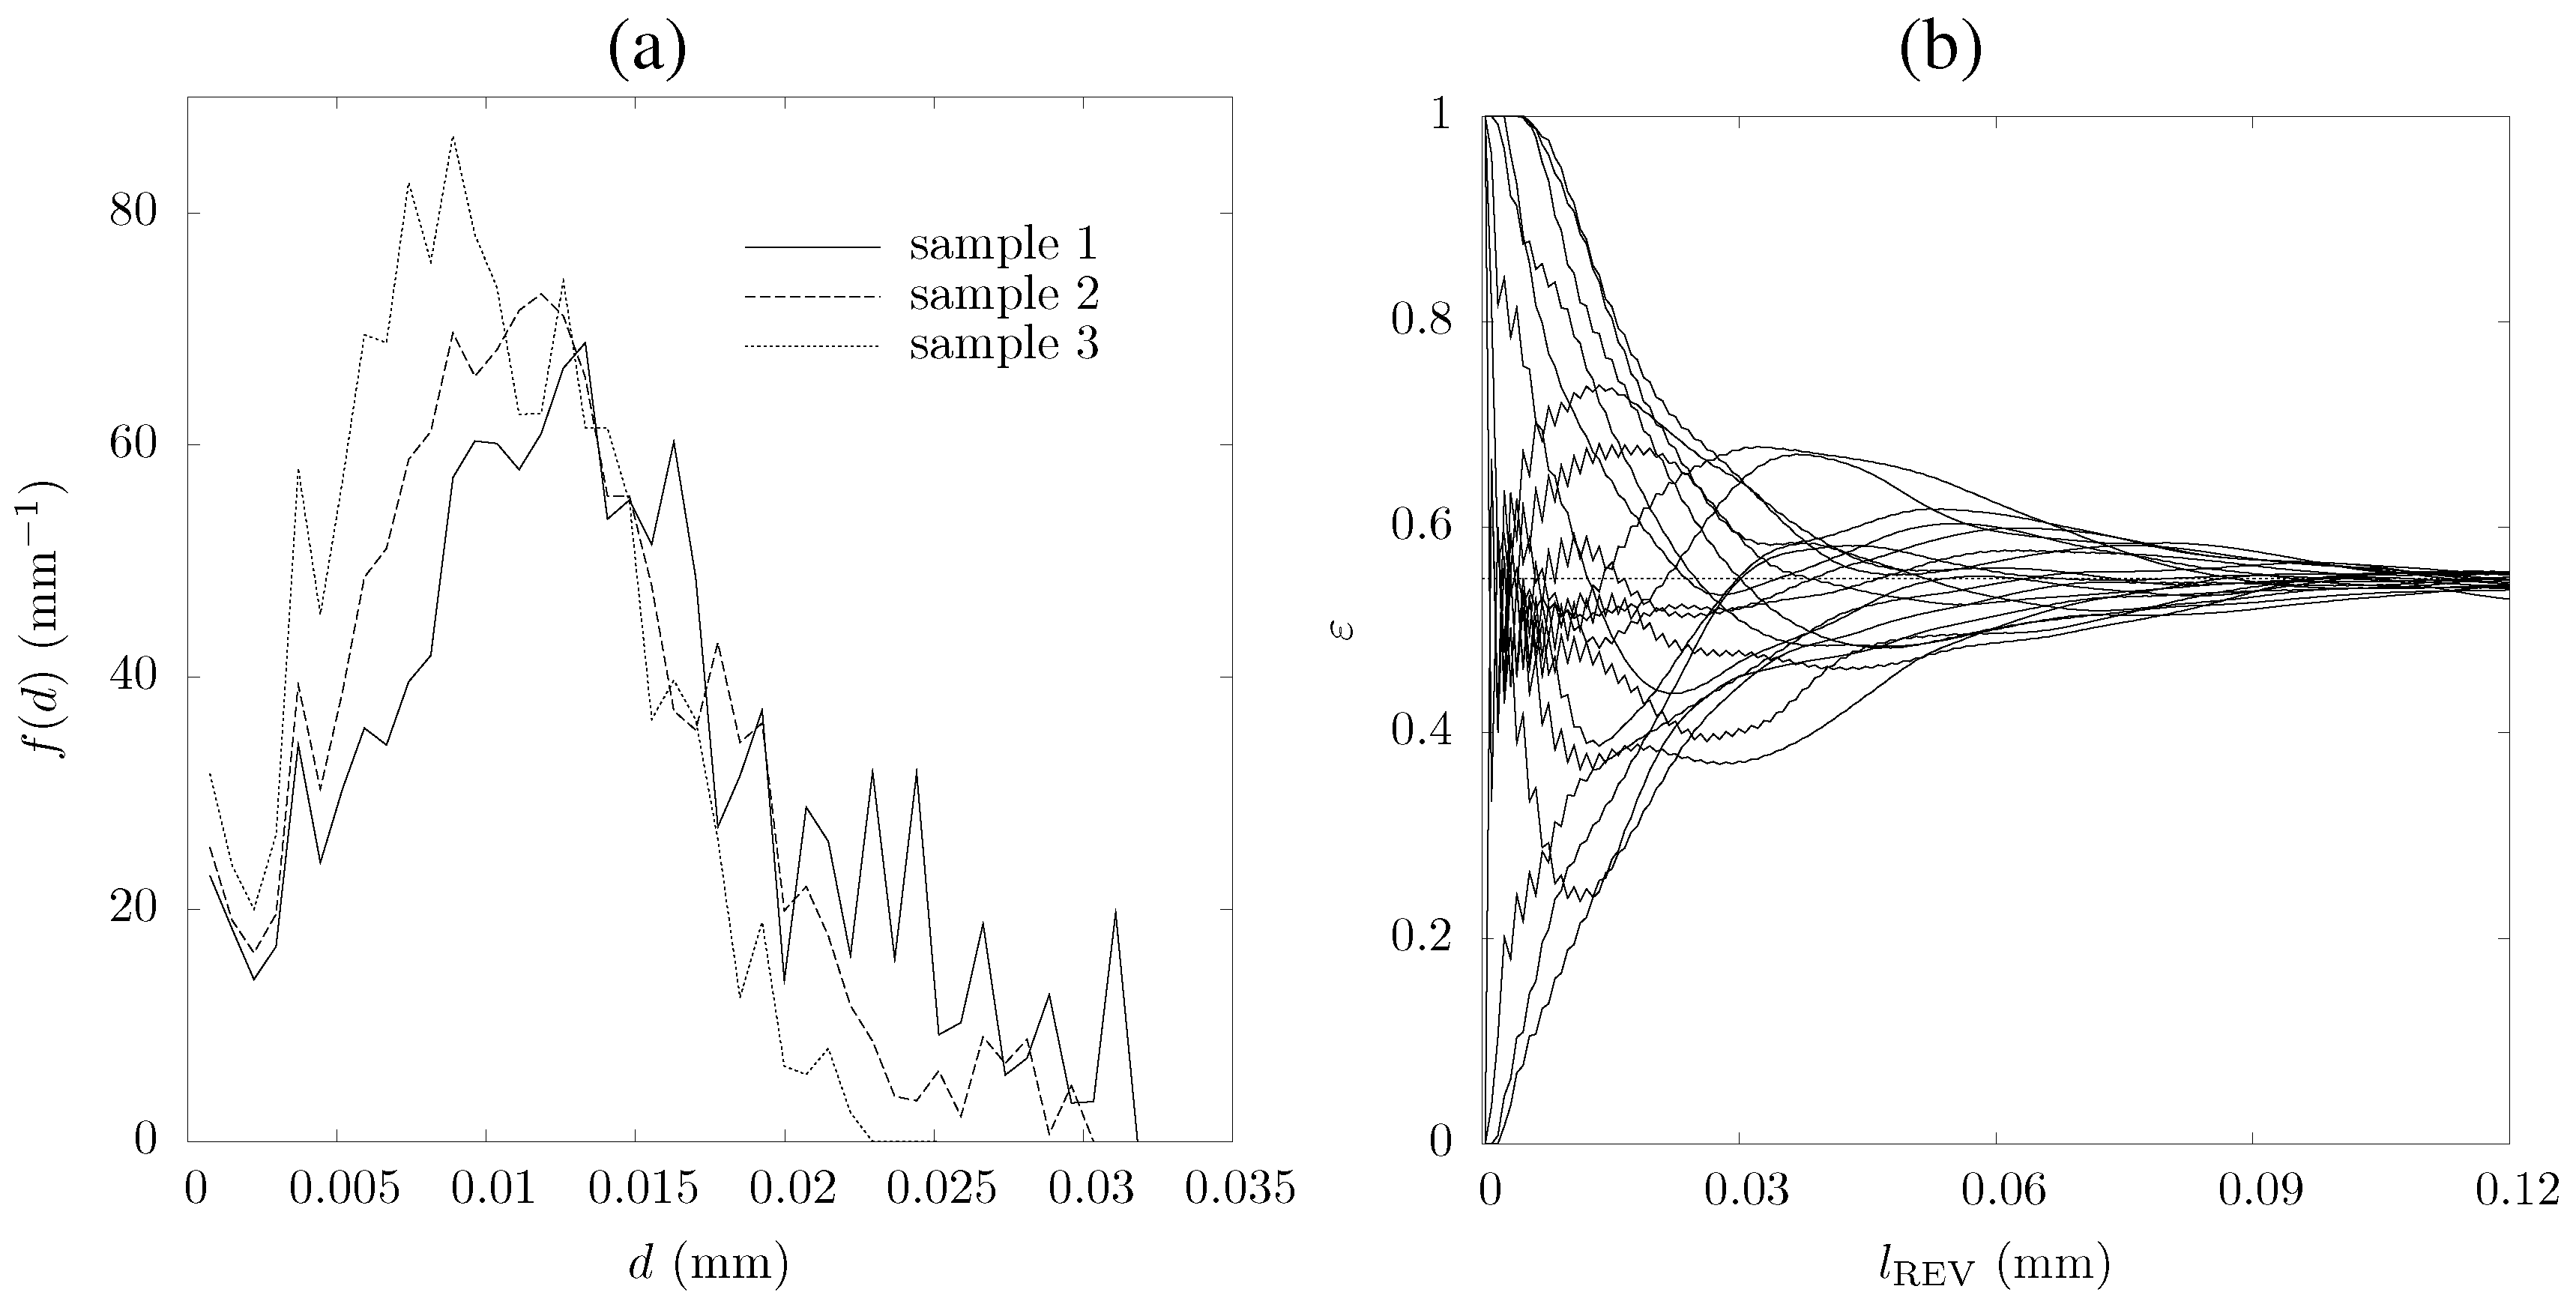
3. Morphological Characterization
4. Heat Transfer Characterization
4.1. Radiation Heat Transfer
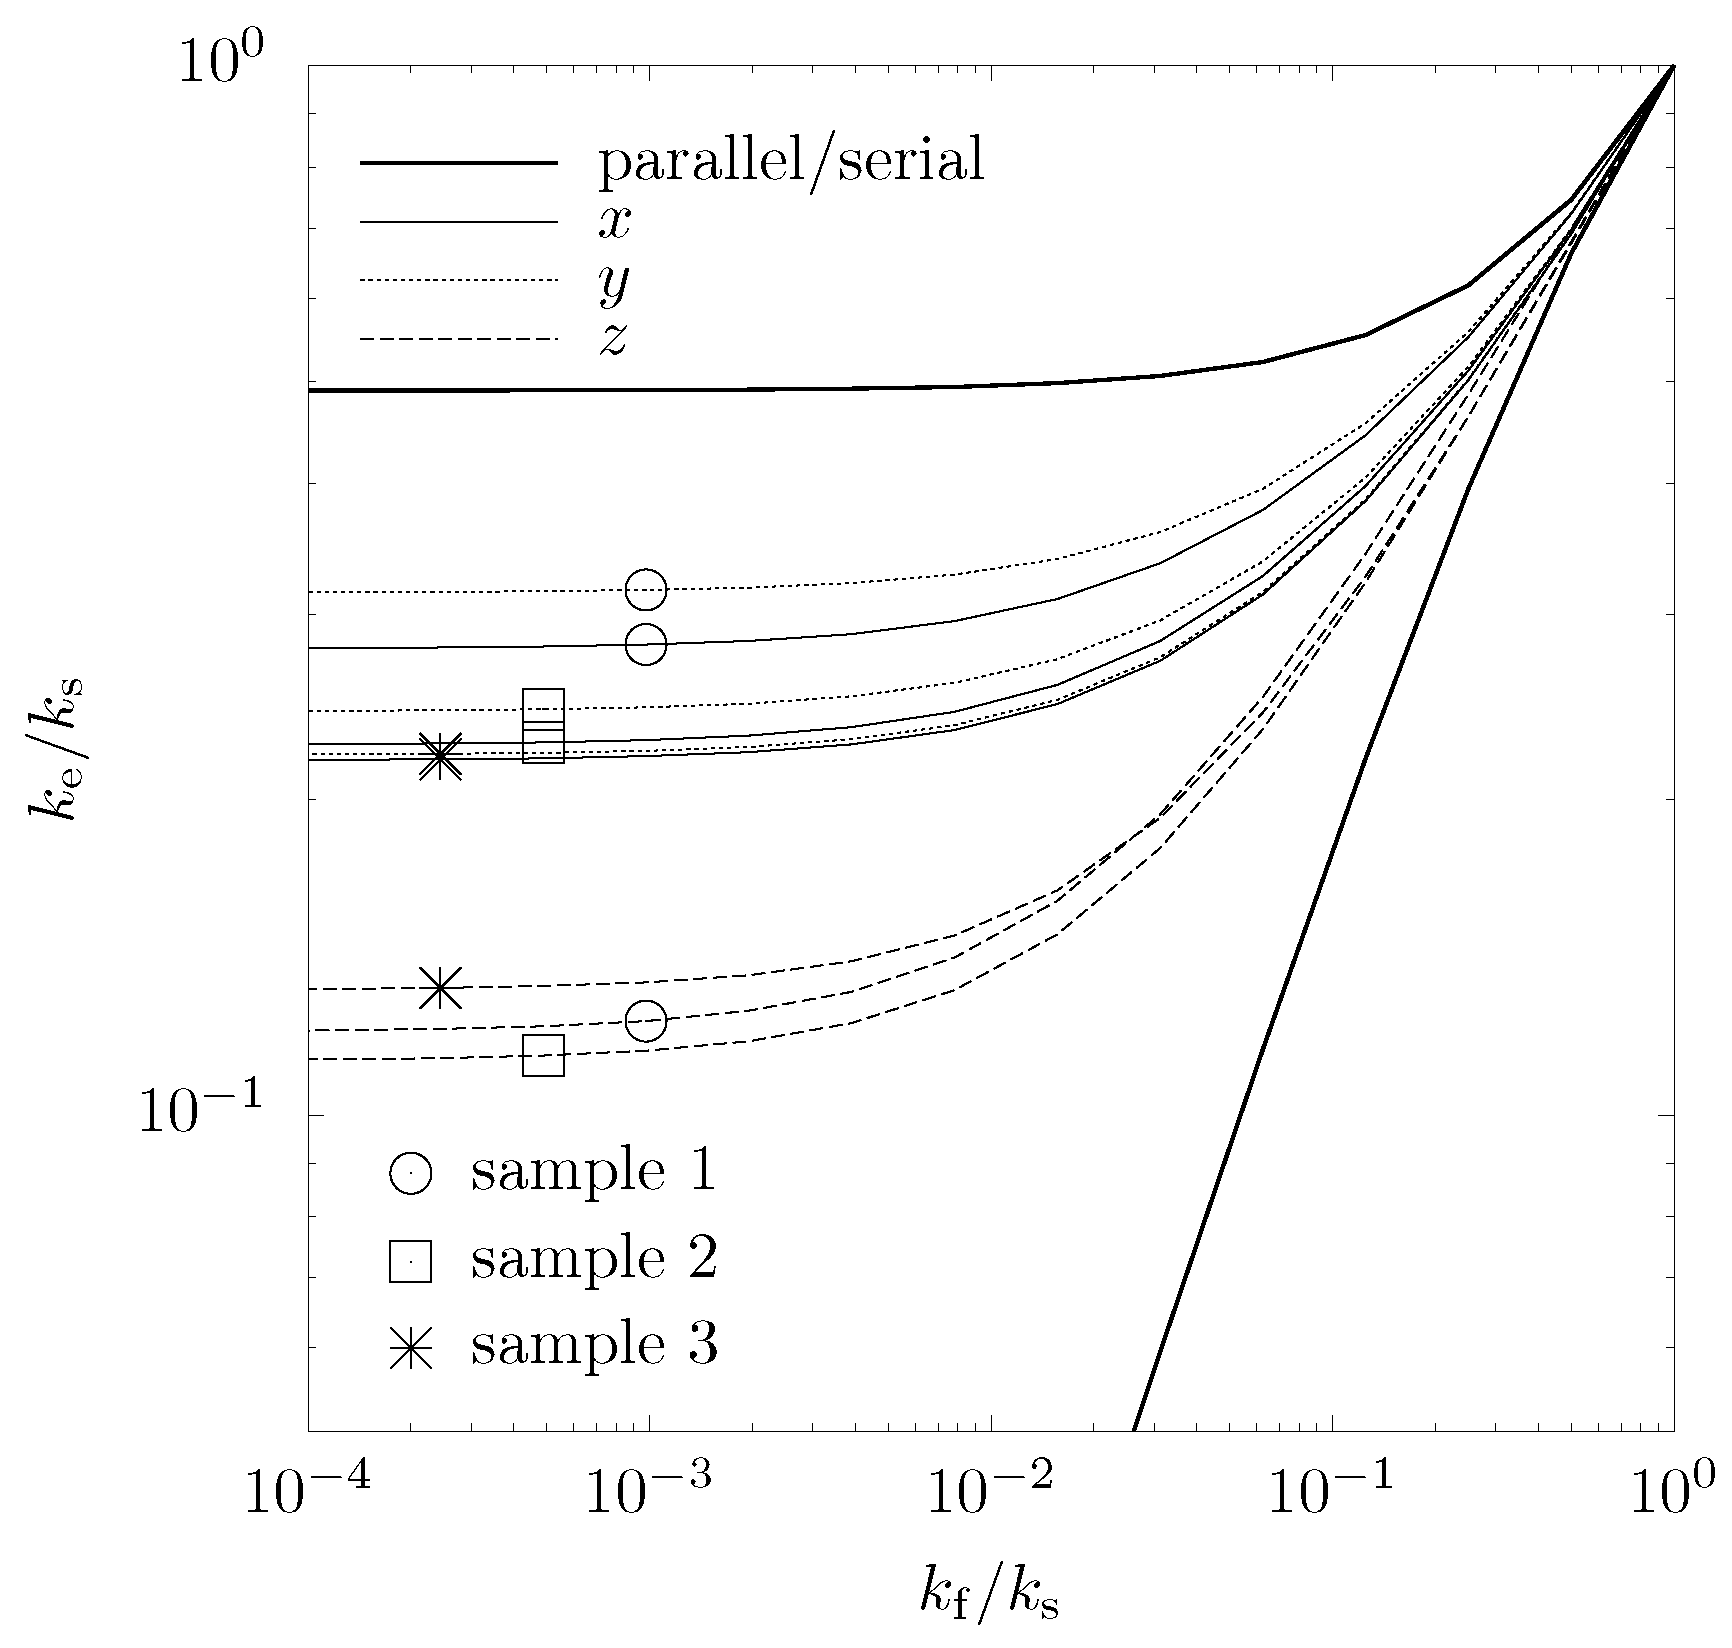
4.2. Conduction Heat Transfer
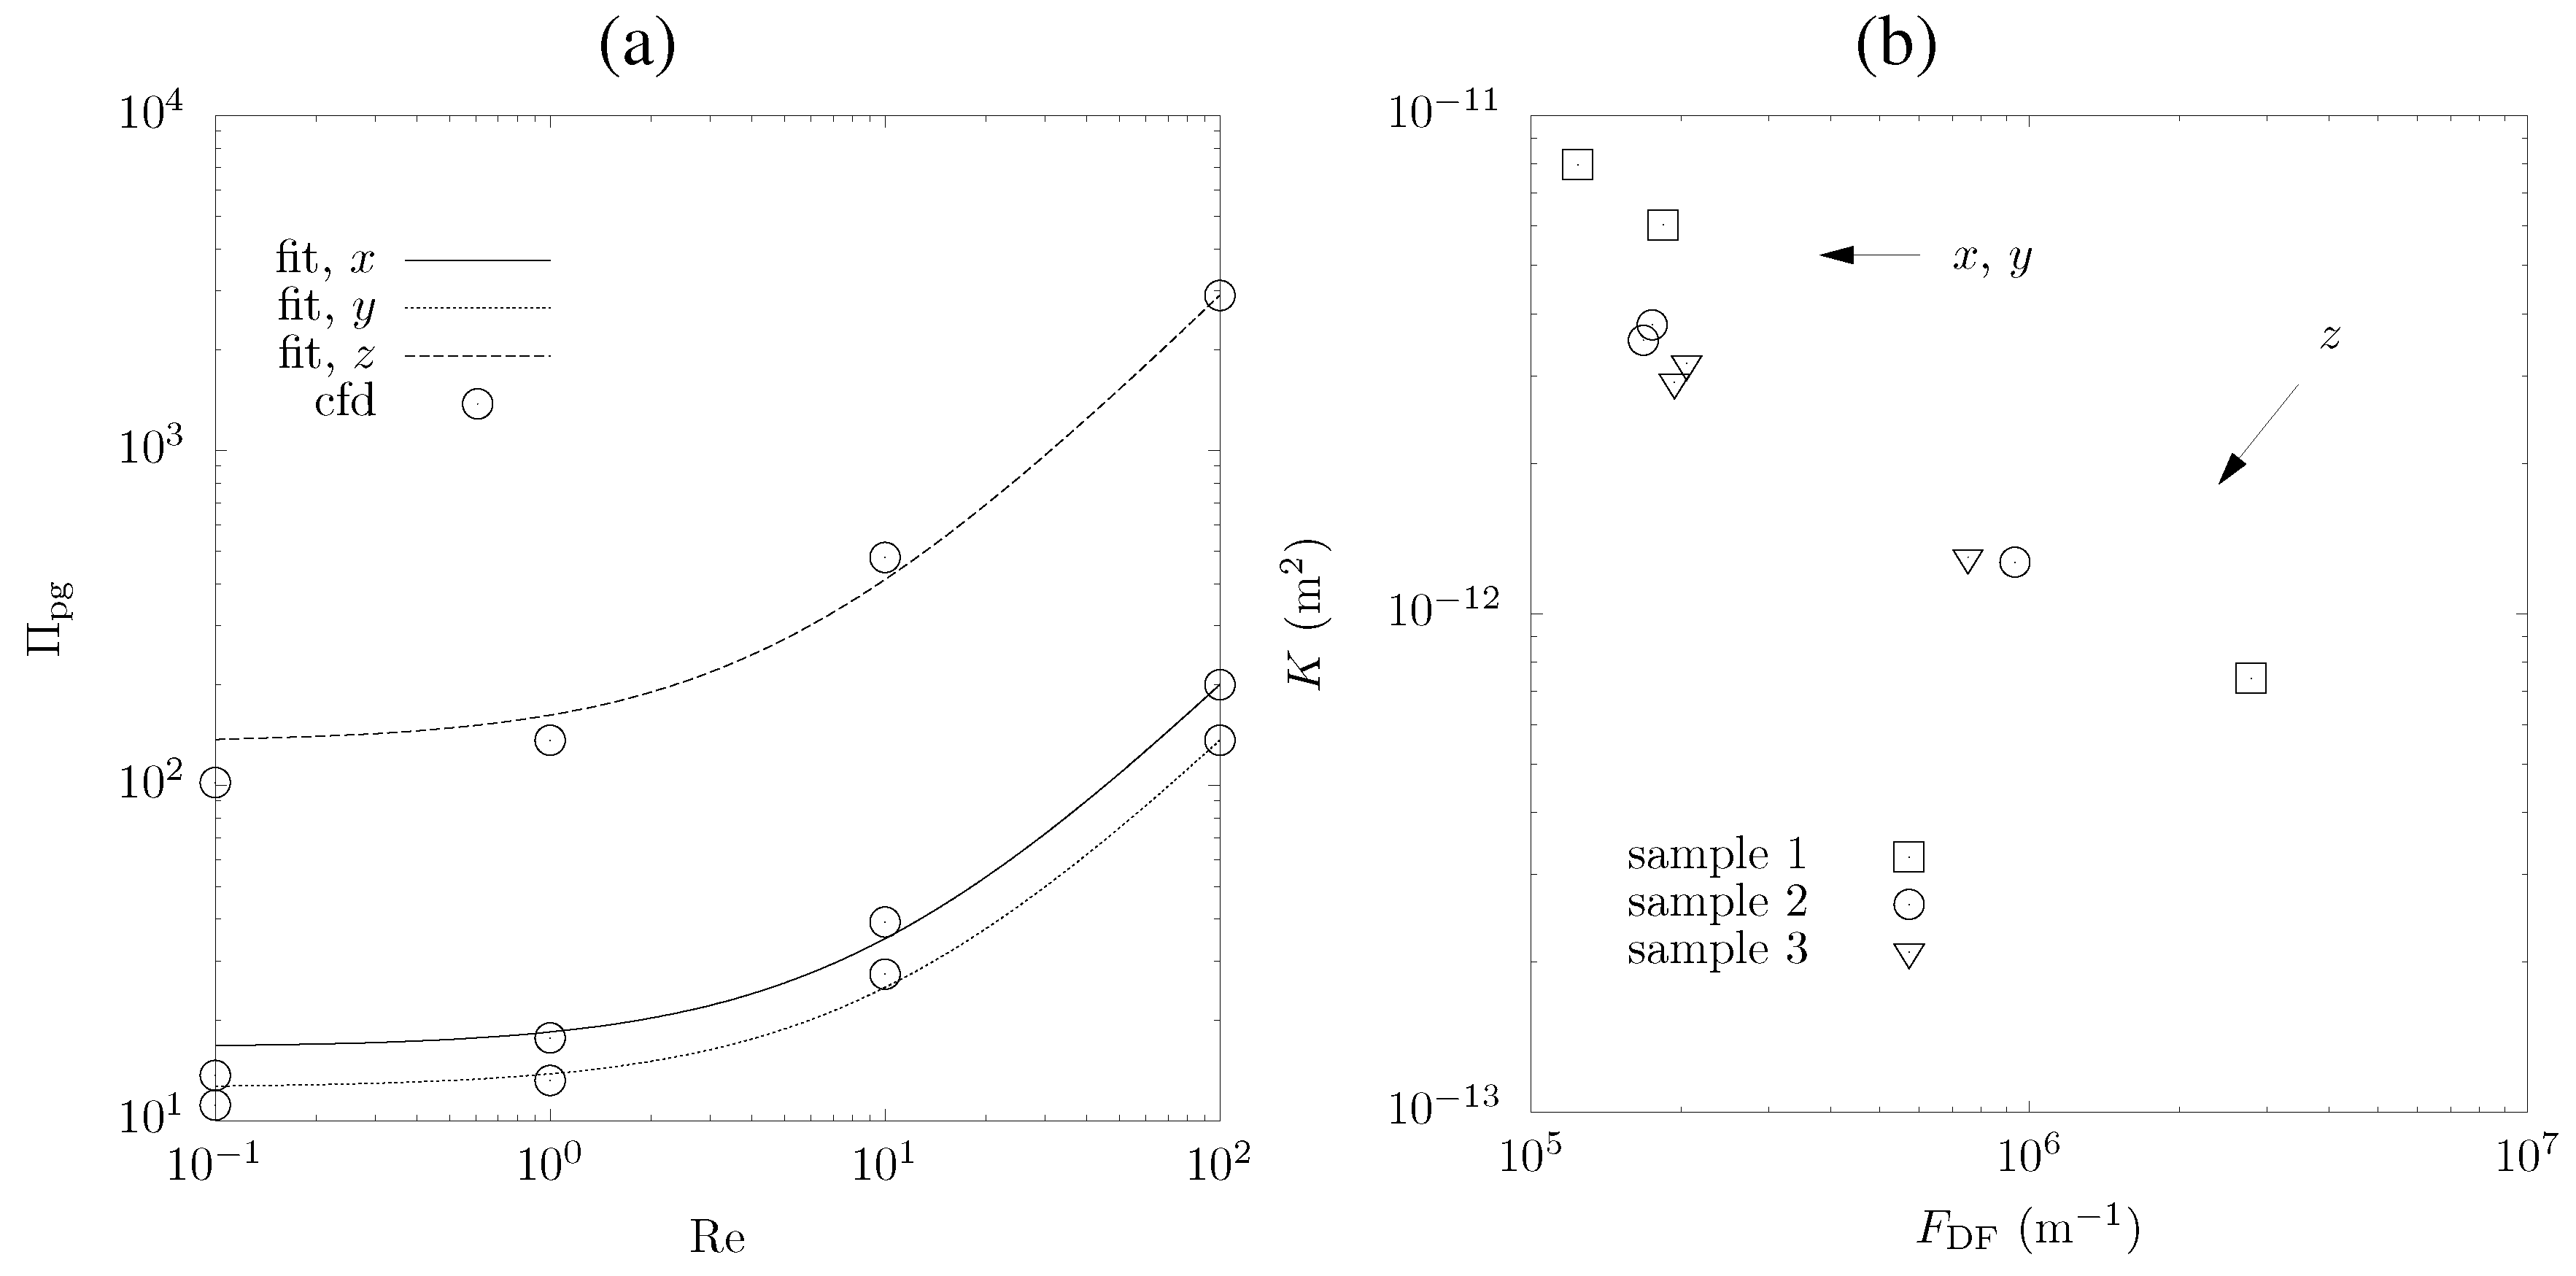
4.3. Convection Heat Transfer
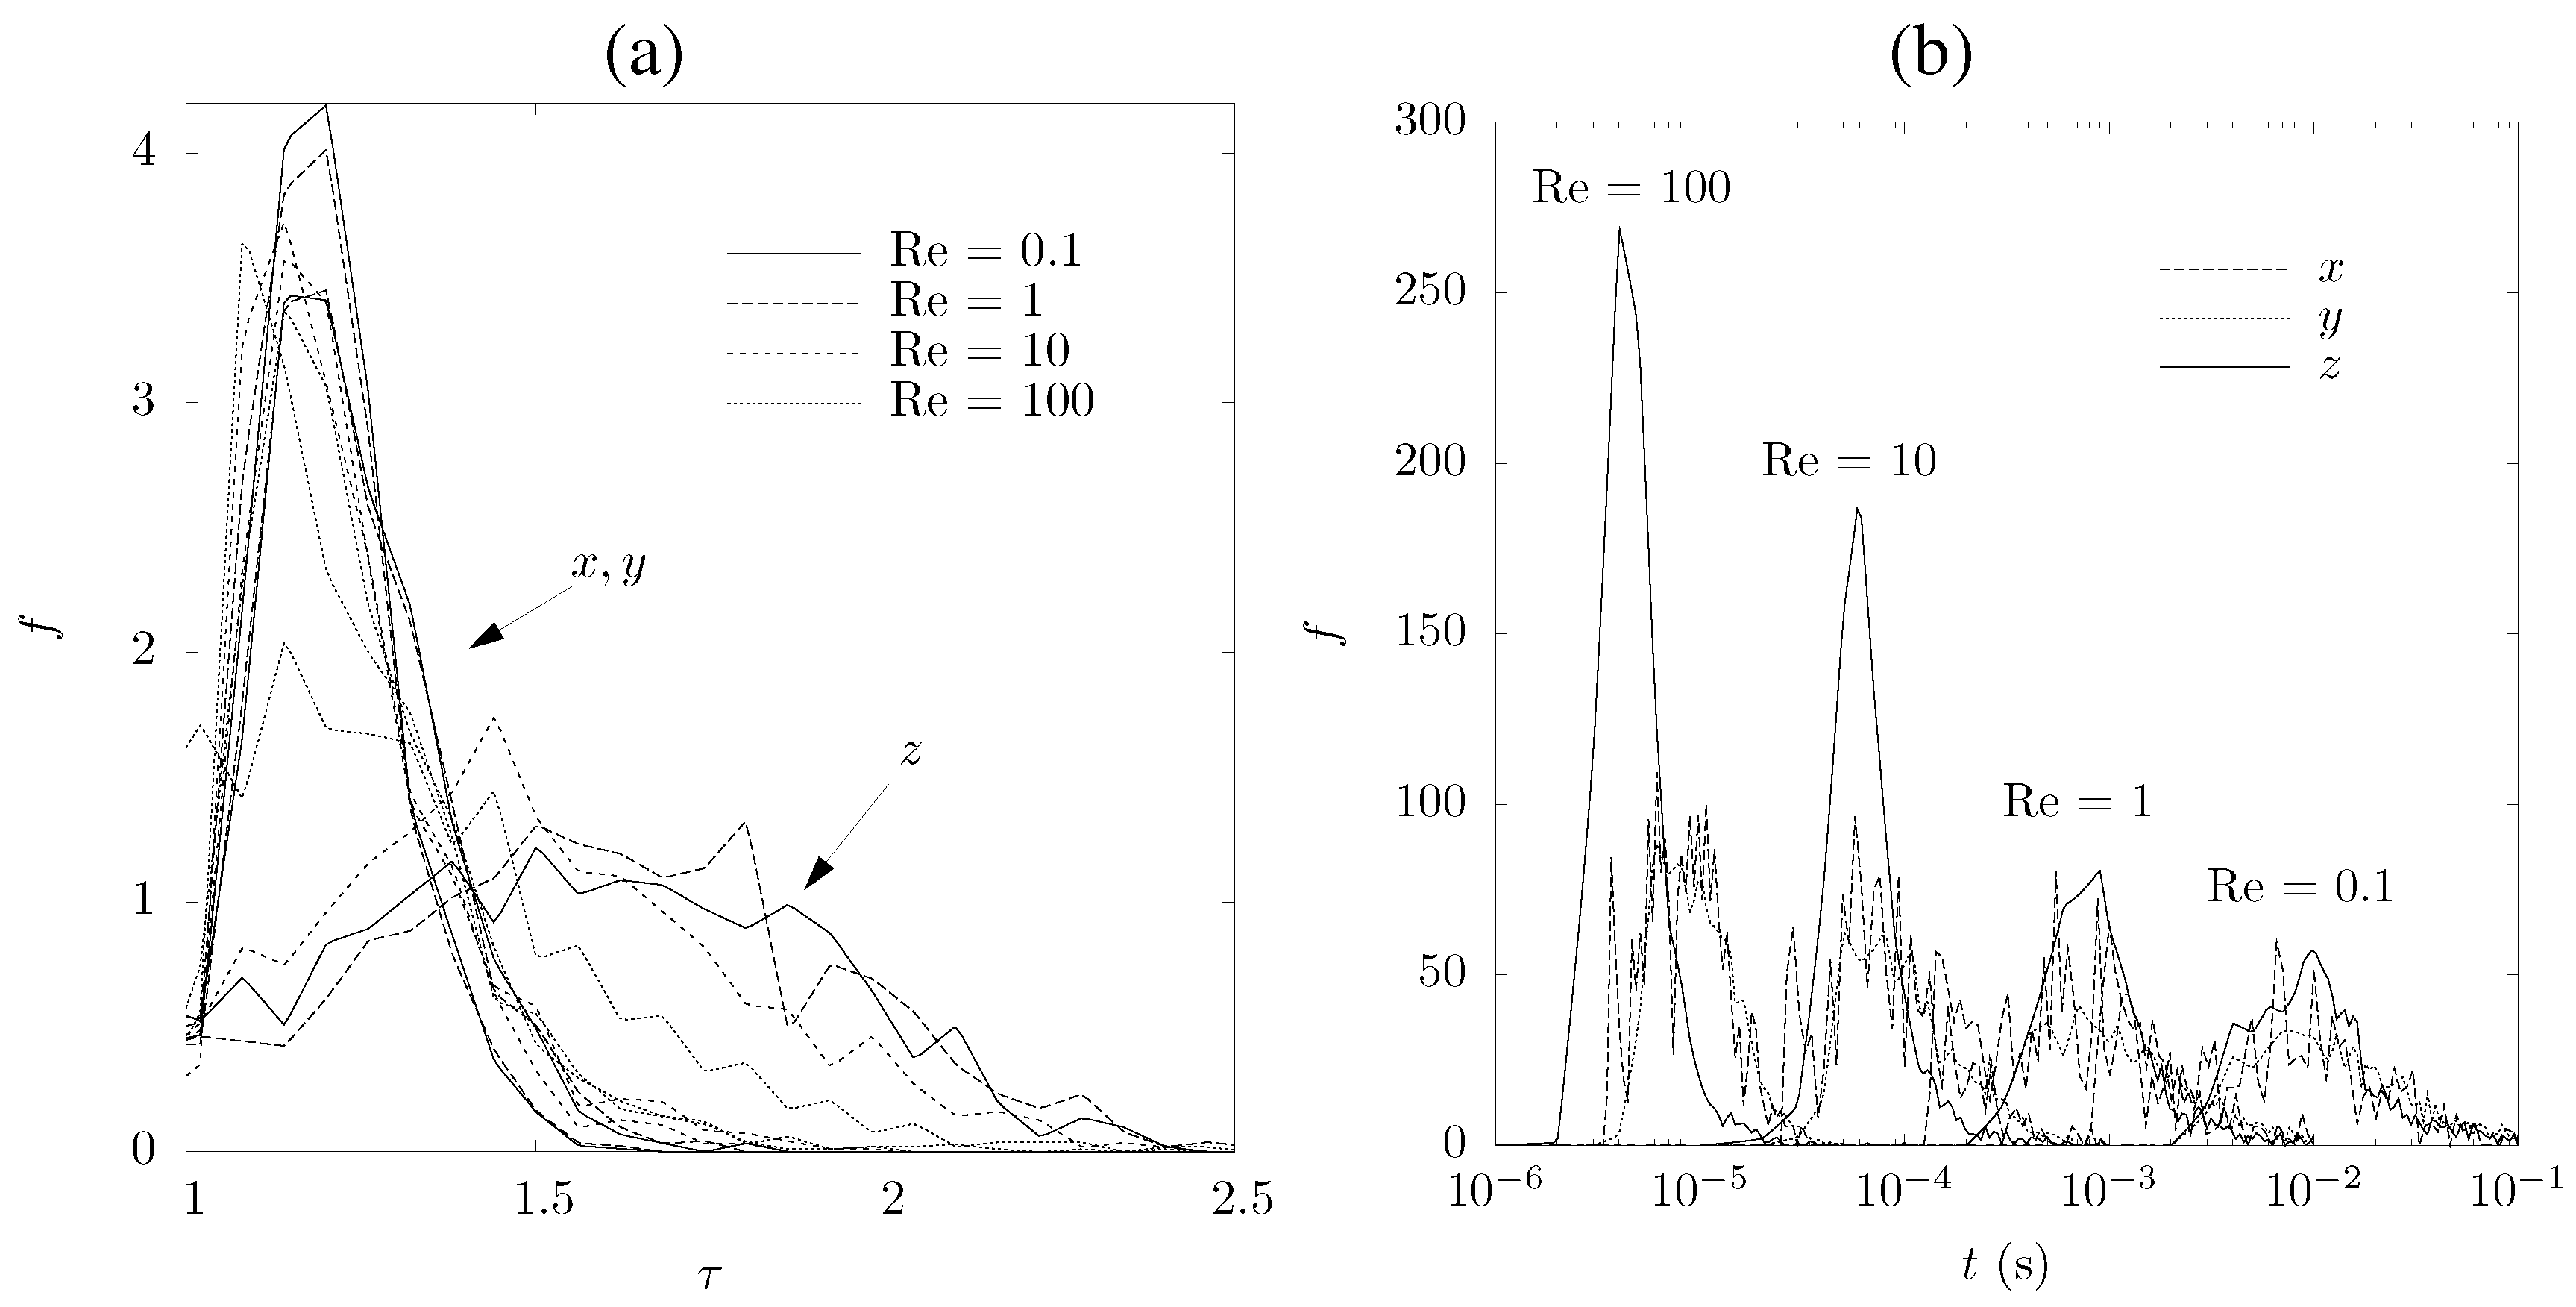
5. Mass Transfer Characterization

| Direction | (s) | (s) | (s) | |||
|---|---|---|---|---|---|---|
| x | 1.24 | 1.20 | 1.22 | 0.0026 | 0.0006 | 0.0018 |
| y | 1.20 | 1.20 | 1.19 | 0.0028 | 0.0007 | 0.0020 |
| z | 1.61 | 1.80 | 1.59 | 0.0018 | 0.0009 | 0.0011 |
6. Tailored Foam Design
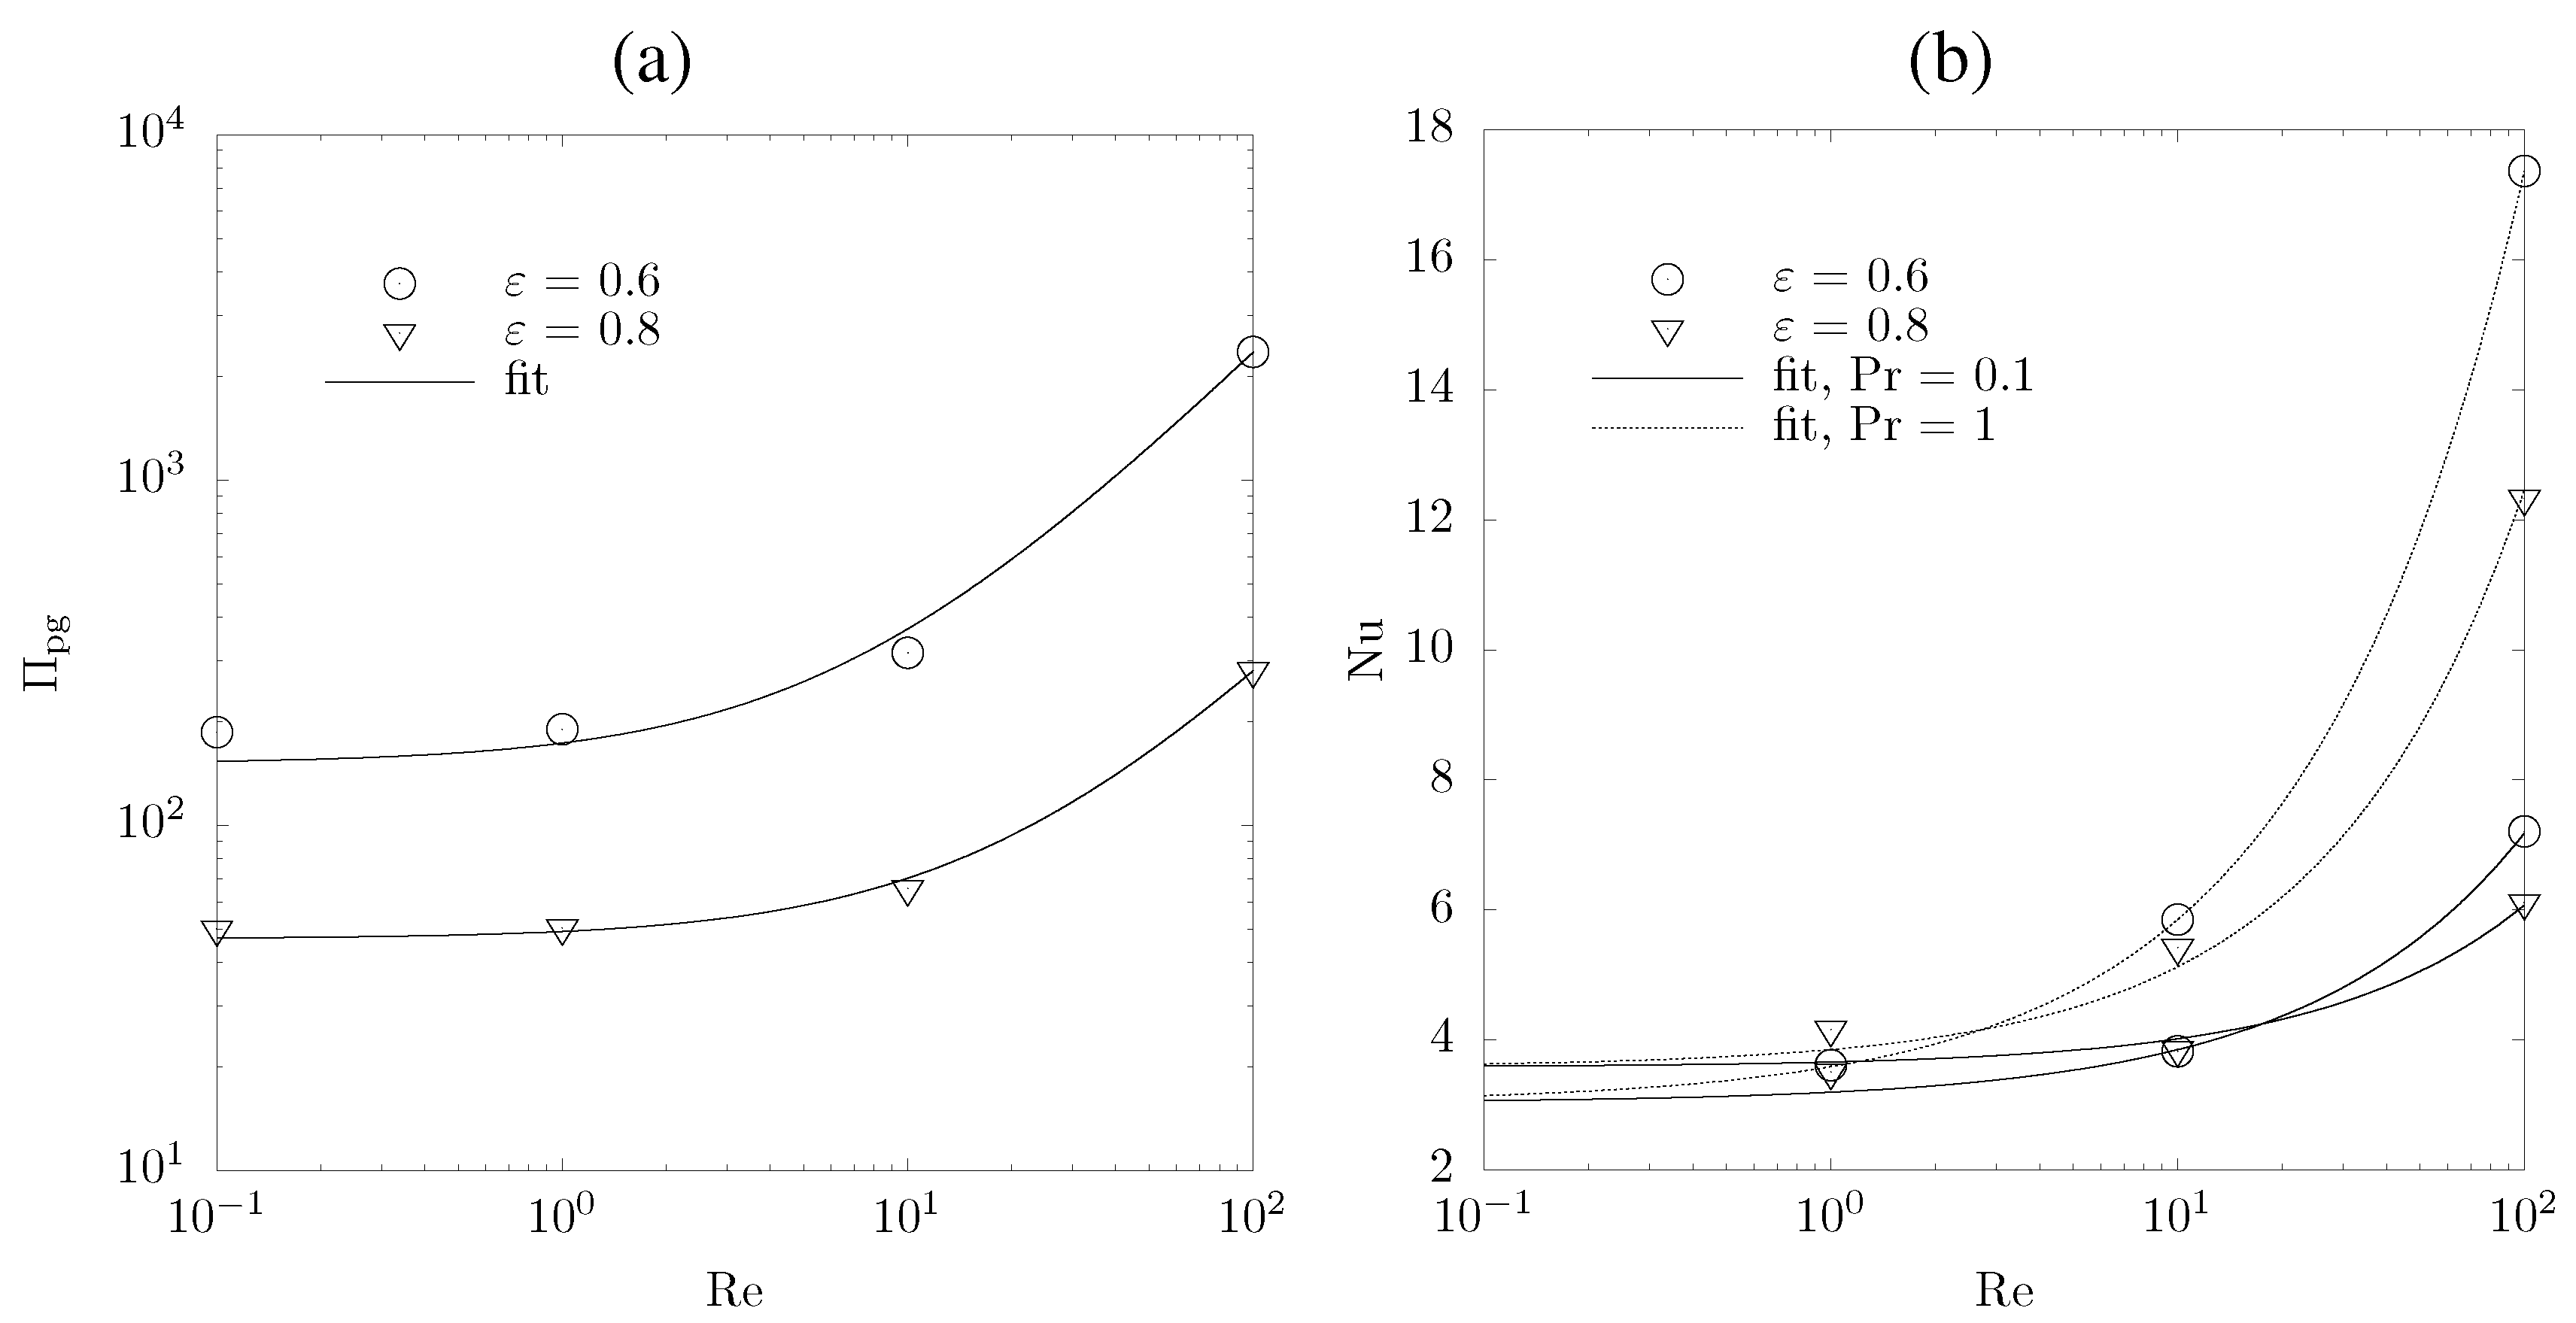
| K (m) | (m) | Nu | |
|---|---|---|---|
| 0.6 | 6.62 × 10 | 219143 | 3.03 + 0.55RePr |
| 0.8 | 2.13 × 10 | 23315 | 3.59 + 0.28RePr |
7. Summary and Conclusions
Acknowledgements
References
- Steinfeld, A. Solar thermochemical production of hydrogen—A review. Sol. Energy 2005, 78, 603–615. [Google Scholar] [CrossRef]
- Allendorf, M.D.; Diver, R.B.; Siegel, N.P.; Miller, J.E. Two-step water splitting using mixed-metal ferrites: Thermodynamic analysis and characterization of synthesized materials. Energy Fuels 2008, 24, 4115–4124. [Google Scholar] [CrossRef]
- Chueh, W.; Haile, S. A thermochemical study of ceria: Exploring an old material for new modes of energy conversion and CO2 mitigation. Philos. Trans. R. Soc. 2010, 368, 3269–3294. [Google Scholar] [CrossRef] [PubMed]
- Chueh, W.; Haile, S. Ceria as a thermochemical reaction medium for selectively generating syngas or methane from H2O and CO2. Chem. Sus. Chem. 2009, 2, 735–739. [Google Scholar] [CrossRef] [PubMed]
- Singh, P.; Hegde, M. Ce0.67Cr0.33O2.11: A new low-temperature O2 evolution material and H2 generation catalyst by thermochemical splitting of water. Chem. Mater. 2010, 22, 762–768. [Google Scholar] [CrossRef]
- Abanades, S.; Legal, A.; Cordier, A.; Peraudeau, G.; Flamant, G.; Julbe, A. Investigation of reactive cerium-based oxides for H2 production by thermochemical two-step water-splitting. J. Mater. Sci. 2010, 45, 4163–4173. [Google Scholar] [CrossRef]
- Kaneko, H.; Miura, T.; Ishihara, H.; Taku, S.; Yokoyama, T.; Nakajima, H.; Tamaura, Y. Reactive ceramics of CeO2–MOx (M = Mn, Fe, Ni, Cu) for H2 generation by two-step water splitting using concentrated solar thermal energy. Energy 2007, 32, 656–663. [Google Scholar] [CrossRef]
- Miller, J.; Allendorf, M.; Diver, R.; Evans, L.; Siegel, N.; Stuecker, J. Metal oxide composites and structures for ultra-high temperature solar thermochemical cycles. J. Mater. Sci. 2008, 43, 4714–4728. [Google Scholar] [CrossRef]
- Chueh, C.; Falter, C.; Abbott, M.; Scipio, D.; Furler, P.; Haile, S.; Steinfeld, A. High-flux solar-driven thermochemical dissociation of CO2 and H2O using nonstoichiometric ceria. Science 2010, 330, 1797–1801. [Google Scholar] [CrossRef] [PubMed]
- Whitaker, S. The method of volume averaging. In Bear J. Theory and Applications of Transport in Porous Media; Kluwer Academic Publishers: Dordrecht, The Netherlands, 1999. [Google Scholar]
- Haussener, S.; Coray, P.; Lipiński, W.; Wyss, P.; Steinfeld, A. Tomography-based heat and mass transfer characterization of reticulate porous ceramics for high-temperature processing. ASME J. Heat Transf. 2010, 132, 023305:1–023305:9. [Google Scholar] [CrossRef]
- Petrasch, J.; Wyss, P.; Stämpfli, R.; Steinfeld, A. Tomography-based multiscale analyses of the 3D geometrical morphology of reticulated porous ceramics. J. Am. Ceram. Soc. 2008, 91, 2659–2665. [Google Scholar] [CrossRef]
- Petrasch, J.; Wyss, P.; Steinfeld, A. Tomography-based Monte Carlo determination of radiative properties of reticulate porous ceramics. J. Quant. Spectrosc. Radiat. Transf. 2007, 105, 180–197. [Google Scholar] [CrossRef]
- Petrasch, J.; Schrader, B.; Wyss, P.; Steinfeld, A. Tomography-based determination of the effective thermal conductivity of reticulate porous ceramics. J. Heat Transf. 2008, 103, 032602:1–032602:10. [Google Scholar] [CrossRef]
- Petrasch, J.; Meier, F.; Friess, H.; Steinfeld, A. Tomography based determination of permeability, Dupuit-Forchheimer coefficient, and interfacial heat transfer coefficient in reticulate porous ceramics. Int. J. Heat Fluid Flow 2008, 29, 315–326. [Google Scholar] [CrossRef]
- Rintoul, M.; Torquato, S.; Yeong, C.; Keane, D.; Erramilli, S.; Jun, Y.; Dabbas, D.; Aksay, I. Structure and transport properites of a porous magnetic gel via X-ray microtomography. Phys. Rev. E 1996, 54, 2663–2669. [Google Scholar] [CrossRef]
- Nakashima, Y.; Watanabe, Y. Estimate of transport properties of porous media by microfocus X-ray computed tomography and random walk. Water Resour. Res. 2002, 38, 1272:1–1272:12. [Google Scholar] [CrossRef]
- Haussener, S.; Lipiński, W.; Wyss, P.; Steinfeld, A. Tomographic characterization of a semitransparent-particle packed bed and determination of its thermal radiative properties. ASME J. Heat Transf. 2009, 131, 072701:1–072701:11. [Google Scholar] [CrossRef]
- Haussener, S.; Lipiński, W.; Petrasch, J.; Wyss, P.; Steinfeld, A. Tomography-based analysis of radiative transfer in reacting packed beds undergoing a soild-gas thermochemical transformation. ASME J. Heat Transf. 2009, 132, 023305:1–023305:7. [Google Scholar]
- Tancrez, M.; Taine, J. Direct identification of absorption and scattering coefficients and phase function of a porous medium by a Monte Carlo technique. Int. J. Heat Mass Transf. 2004, 47, 373–383. [Google Scholar] [CrossRef]
- Zeghondy, B.; Iacona, E.; Taine, J. Determination of the anisotroic radiative properties of a porous material by Radiative Distribution Function Identification (RDFI). Int. J. Heat Mass Transf. 2006, 49, 2810–2819. [Google Scholar] [CrossRef]
- Nakashima, Y.; Kamiya, S.; Nakano, T. Diffusion ellipsoids of anisotropic porous rocks calculated by x-ray computed tomography-based random walk simulations. Water Resour. Res. 2008, 44, W12435:1–W12435:19. [Google Scholar] [CrossRef]
- Vignoles, G.; Coindreau, O.; Ahmadi, A.; Bernard, D. Assessment of geometrical and transport properties of a fibrous C/C composite preform as digitalized by x-ray computerized microtomography: Part II. Heat and gas transport properties. J. Mater. Res. 2007, 20, 2328–2339. [Google Scholar]
- Clavaud, J.P.; Maineult, A.; Zamora, M.; Rasolofosaon, P.; Schlitter, C. Permeability anisotropy and its relations with porous medium structure. J. Geophys. Res. 2008, 113, B01202:1–B01202:10. [Google Scholar] [CrossRef]
- Nakasima, Y.; Kamiya, S. Mathematica programs for the analysis of the three-dimensional pore connectivity and anisotropic turtuosity of porous rocks using x-ray computed tomography image data. J. Nucl. Sci. Technol. 2007, 44, 1233–1247. [Google Scholar] [CrossRef]
- Bohren, C.; Huffman, D. Absorption and Scattering of Light by Small Particles; John Wiley & Sons Inc.: New York, NY, USA, 2004. [Google Scholar]
- Streun, A.; Böge, A.; Dehler, M.; Gough, C.; Joho, W.; Korhonen, T.; Lüdeke, A.; Marchand, P.; Muñoz, M.; Pedrozzi, M.; Rivkin, L.; Schilcher, T.; Schlott, V.; Schulz, L.; Wrulich, A. Commissioning of the Swiss light source. In Proceedings of the 2001 Particle Accelerator Conference, Chicago, IL, USA, 18–22 June 2001; pp. 224–226.
- Stampanoni, M.; Groso, A.; Isenegger, A.; Mikuljian, G.; Chen, Q.; Bertrand, A.; Henein, S.; Betemps, R.; Frommherz, U.; Böhler, P.; Meister, D.; Lnage, M.; Abela, R. Trands in synchrotron-based tomographic imaging: The SLS experience. Proc. SPIE 2006, 6318, 63180M:1–63180M:14. [Google Scholar]
- Serra, J. Image Analysis and Mathematical Morphology; Academic Press: London, UK, 1982. [Google Scholar]
- Smit, T.; Schneider, E.; Odgaard, A. Star length distribution: A volume-based concept for the characterization of structural anisotropy. J. Microsc. 1998, 19, 249–257. [Google Scholar] [CrossRef]
- Rothman, L. The HITRAN-2004 molecular spectroscopic database. J. Quant. Spectrosc. Radiat. Transf. 2005, 96, 139–204. [Google Scholar] [CrossRef]
- Lipiński, W.; Keene, D.; Haussener, S.; Petrasch, J. Continuum radiative transfer modeling in media consisting of optically distinct components in the limit of geometrical optics. J. Quant. Spectrosc. Radiat. Transf. 2010, 111, 2474–2480. [Google Scholar] [CrossRef]
- Hendricks, T.J.; Howell, J.R. Absorption/scattering coefficients and scattering phase functions in reticulated porous ceramics. J. Heat Transf. 1996, 118, 79–87. [Google Scholar] [CrossRef]
- Liang, Z.; Chueh, W.C.; Ganesan, K.; Haile, S.M.; Lipiński, W. Experimental determination of transmittance of porous cerium dioxide media in the spectral range 300–1,100 nm. Exp. Heat Transf. 2011, 24, 285–299. [Google Scholar] [CrossRef]
- Kaviany, M. Principles of Heat Transfer in Porous Media; Springer-Verlag: Berlin, Heidelberg, Germany, 1995. [Google Scholar]
- Ansys Inc. Ansys-CFX; Ansys: Canonsburg, PA, USA, 2009; Available online: http://www.ansys.com (accessed on 22 November 2011).
- Friess, H.; Haussener, S.; Steinfeld, A.; Petrasch, J. Tetrahedral mesh generation based on space indicator functions. Int. J. Numer. Methods Eng. 2012, in press. [Google Scholar] [CrossRef]
- Younis, L.; Viskanta, R. Experimental investigation of the volumetric heat transfer coefficient between stream of air and ceramic foam. Int. J. Heat Mass Transf. 1993, 36, 1425–1434. [Google Scholar] [CrossRef]
- Wakao, N.; Kaguei, S. Heat and Mass Transfer in Packed Beds; Gordon and Breach Science Publishers: New York, NY, USA, 1982. [Google Scholar]
- Habisreuther, P.; Djordjevic, N.; Zarzalis, N. Statistical distribution of residence time and tortuosity of flow through open-cell foams. Chem. Eng. Sci. 2009, 64, 4943–4954. [Google Scholar] [CrossRef]
- Kyan, C.; Wasan, D.; Kintner, R. Flow of single-phase fluids through fibrous beds. Ind. Eng. Chem. Fundam. 1970, 9, 596–603. [Google Scholar] [CrossRef]
- Macdonald, I.F.; El-Sayed, M.S.; Mow, K.; Dullien, F.A.L. Flow through porous media—The ergun equation revisited. Ind. Eng. Chem. Fundam. 1979, 18, 199–208. [Google Scholar] [CrossRef]
- Salles, J.; Thovert, J.F.; Delannay, R.; Prevors, L.; Auriault, J.L.; Adler, P. Taylor dispersion in porous media. Determination of the dispersion tensor. Phys. Fluids 1993, 5, 2348–2376. [Google Scholar] [CrossRef]
© 2012 by the authors; licensee MDPI, Basel, Switzerland. This article is an open access article distributed under the terms and conditions of the Creative Commons Attribution license (http://creativecommons.org/licenses/by/3.0/.)
Share and Cite
Haussener, S.; Steinfeld, A. Effective Heat and Mass Transport Properties of Anisotropic Porous Ceria for Solar Thermochemical Fuel Generation. Materials 2012, 5, 192-209. https://doi.org/10.3390/ma5010192
Haussener S, Steinfeld A. Effective Heat and Mass Transport Properties of Anisotropic Porous Ceria for Solar Thermochemical Fuel Generation. Materials. 2012; 5(1):192-209. https://doi.org/10.3390/ma5010192
Chicago/Turabian StyleHaussener, Sophia, and Aldo Steinfeld. 2012. "Effective Heat and Mass Transport Properties of Anisotropic Porous Ceria for Solar Thermochemical Fuel Generation" Materials 5, no. 1: 192-209. https://doi.org/10.3390/ma5010192