Matrices for Sensors from Inorganic, Organic, and Biological Nanocomposites

Abstract
:1. Introduction
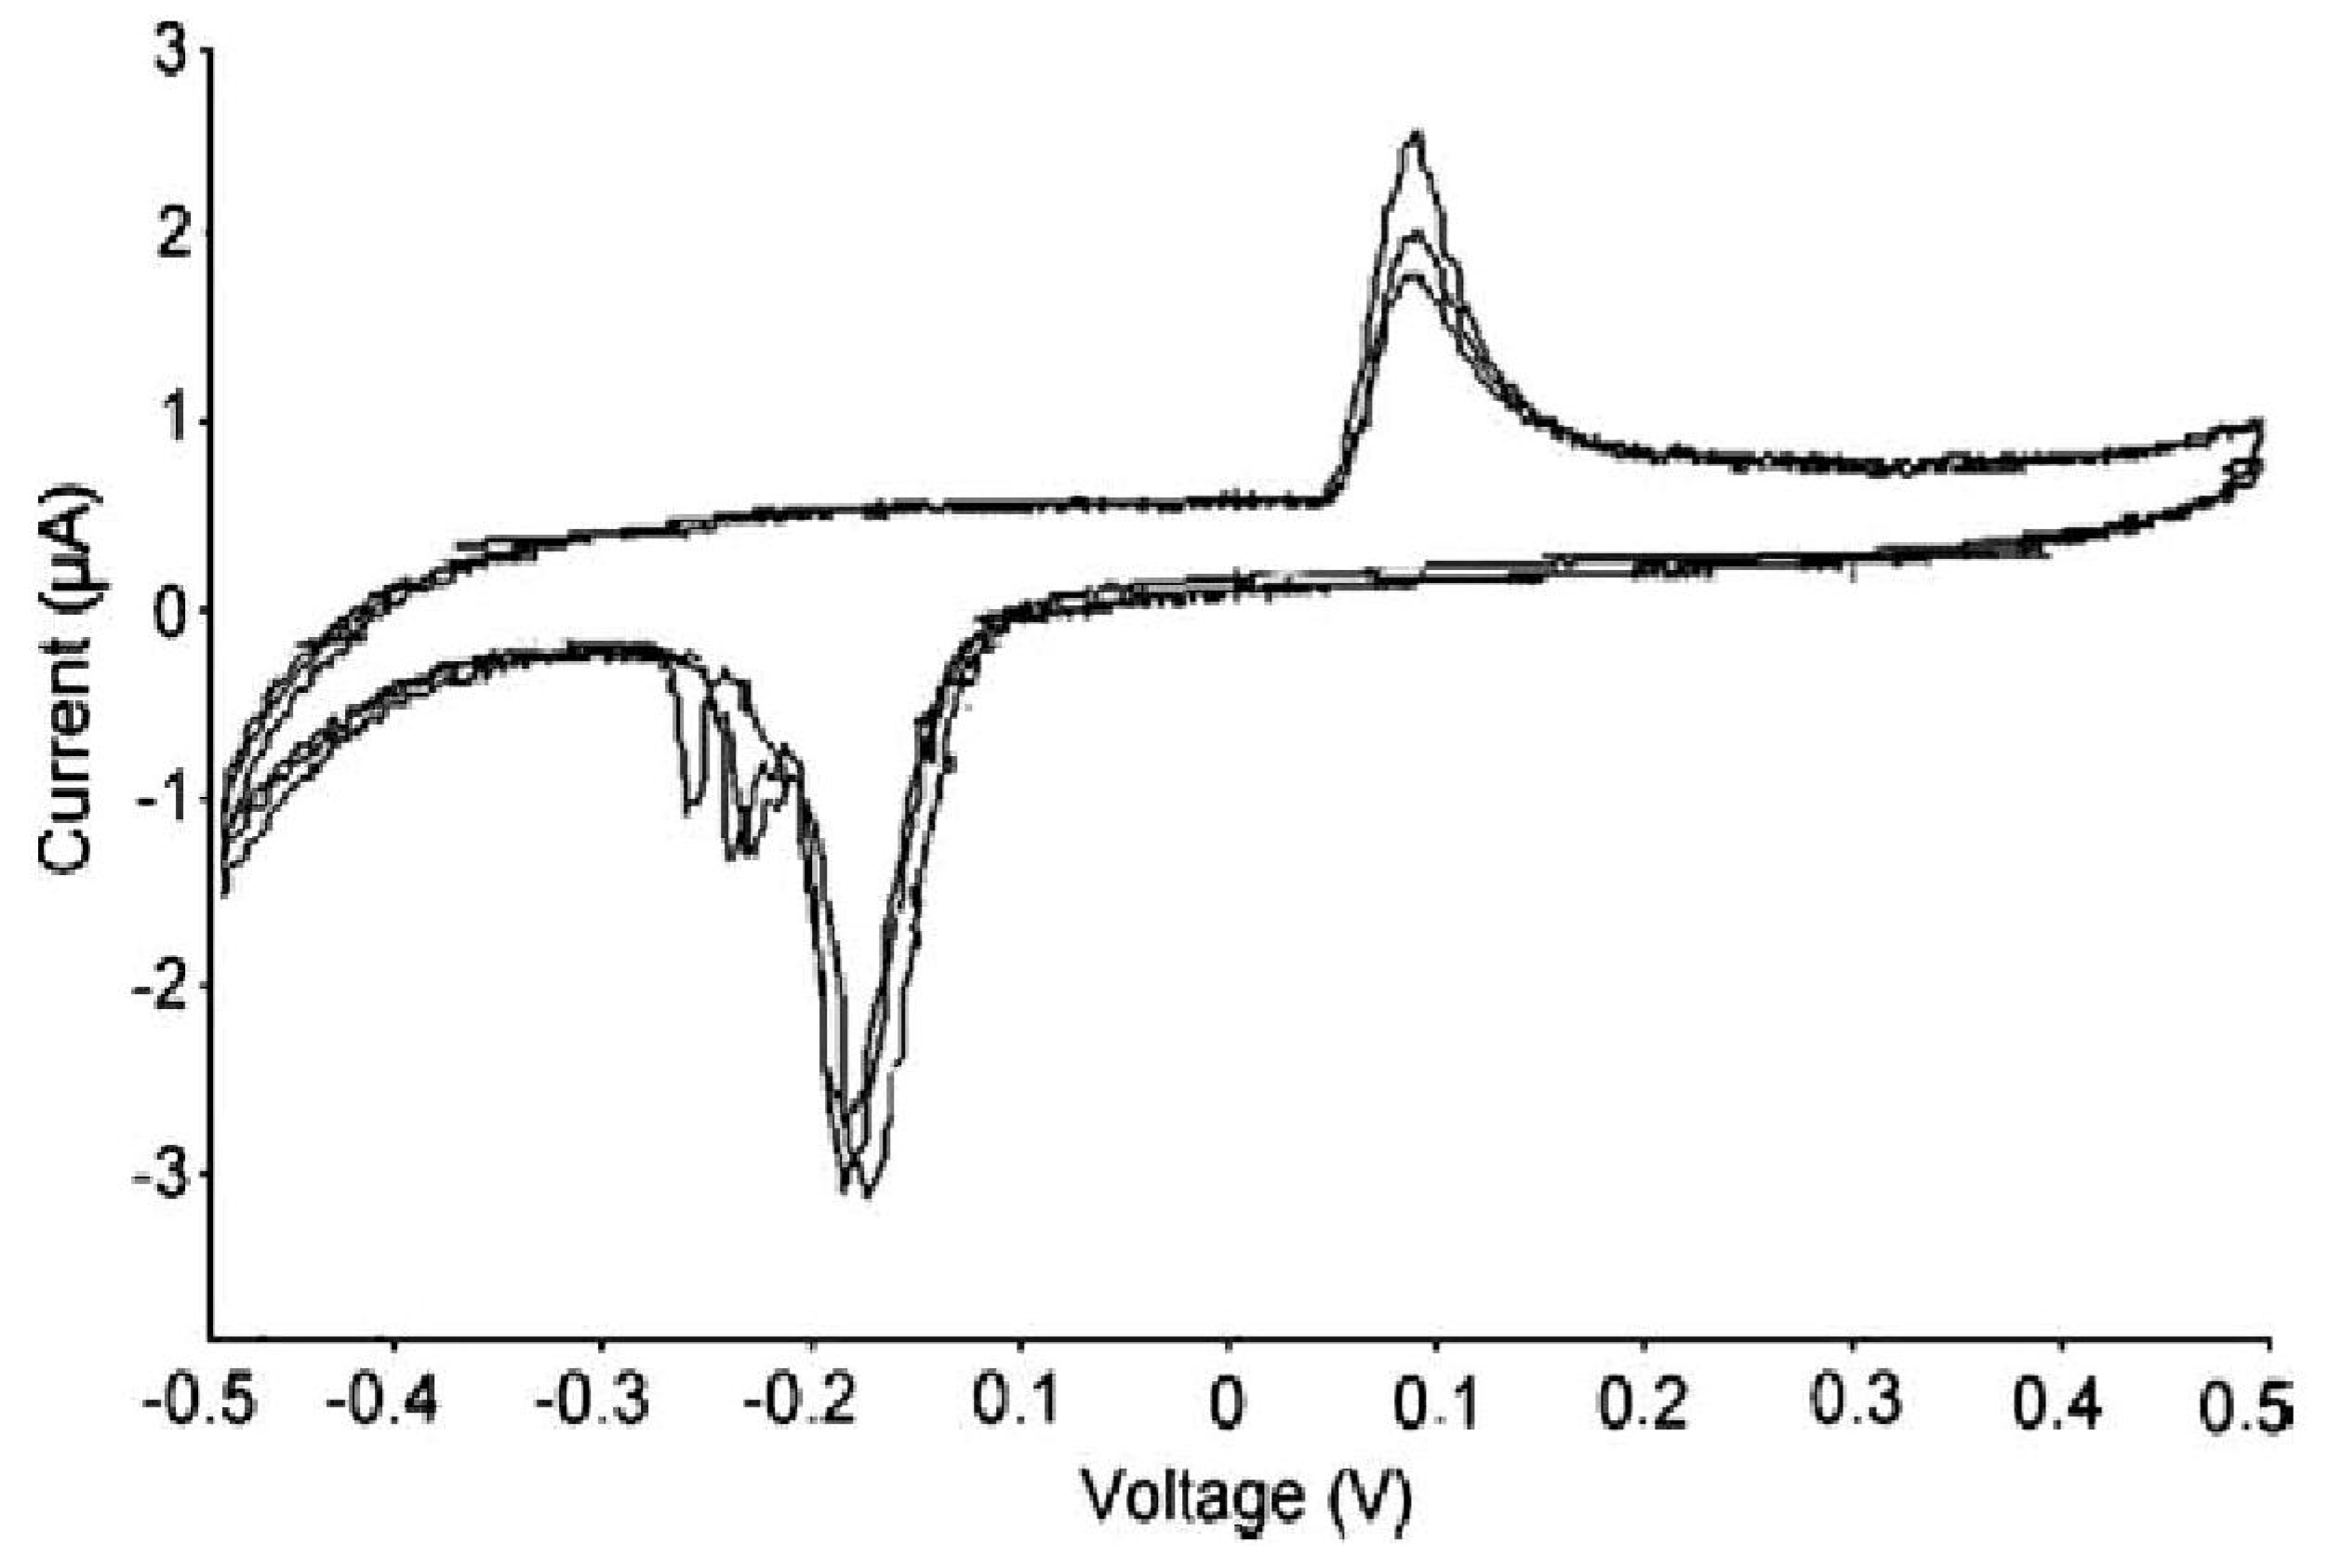
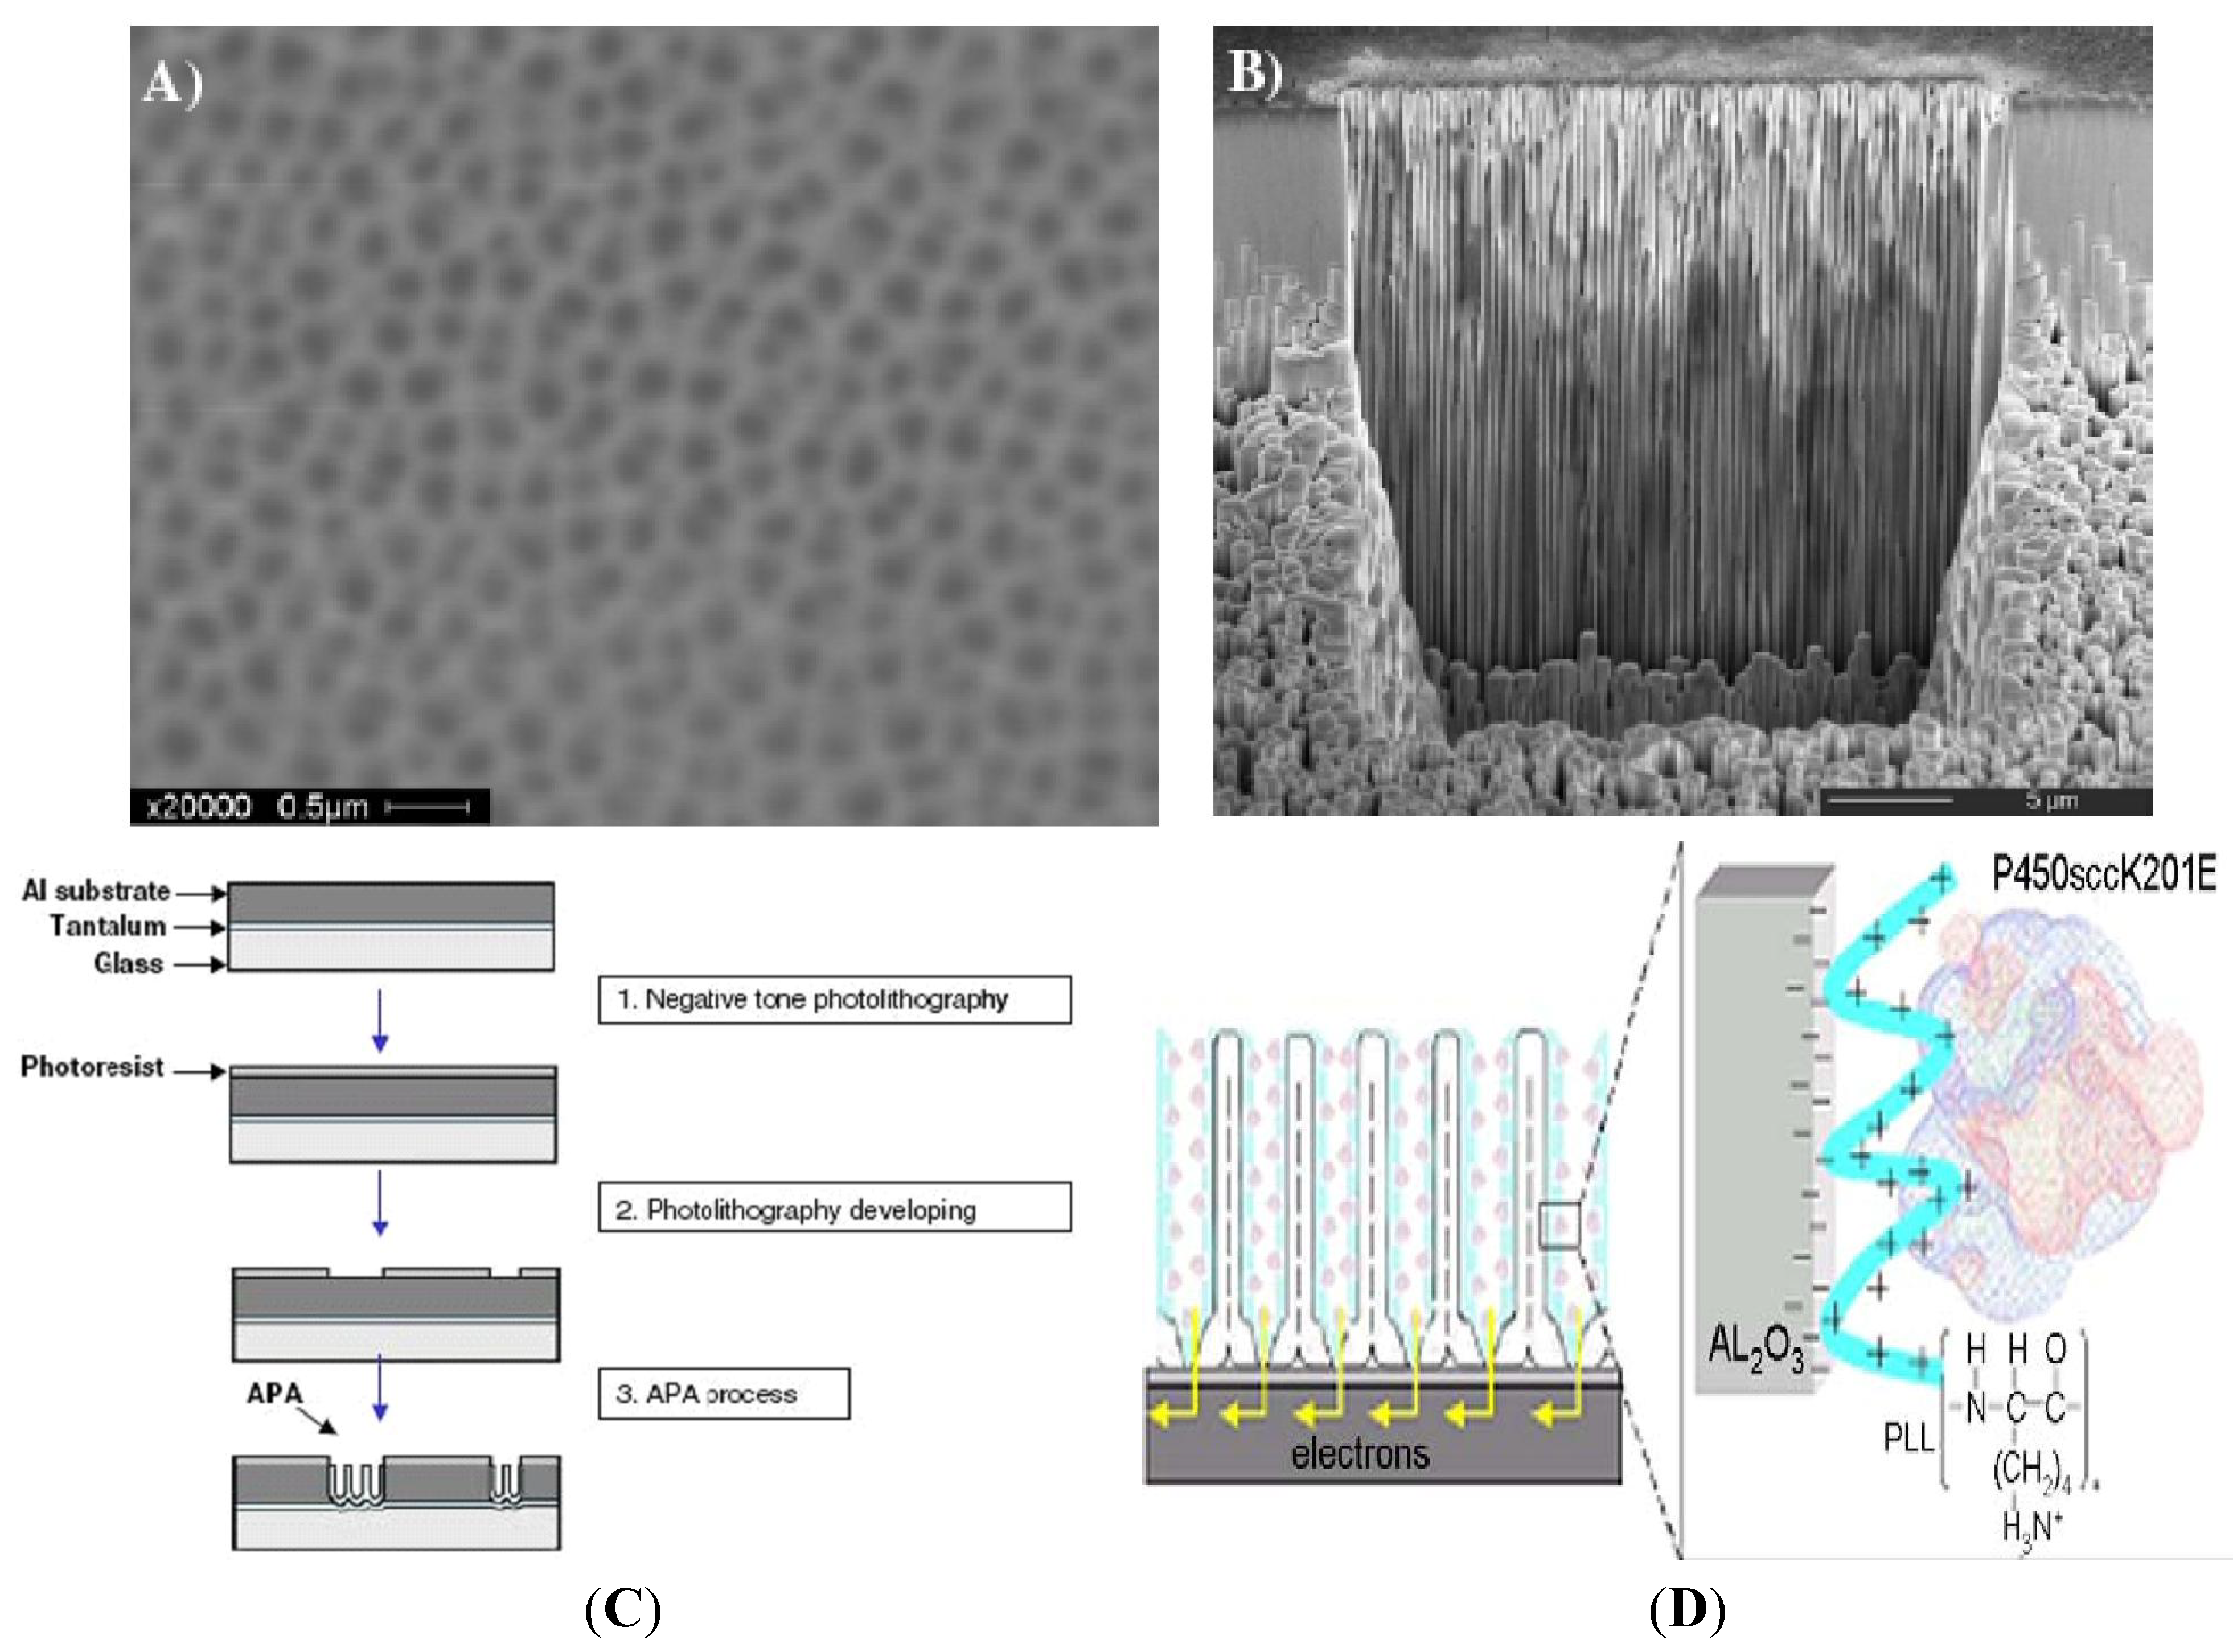
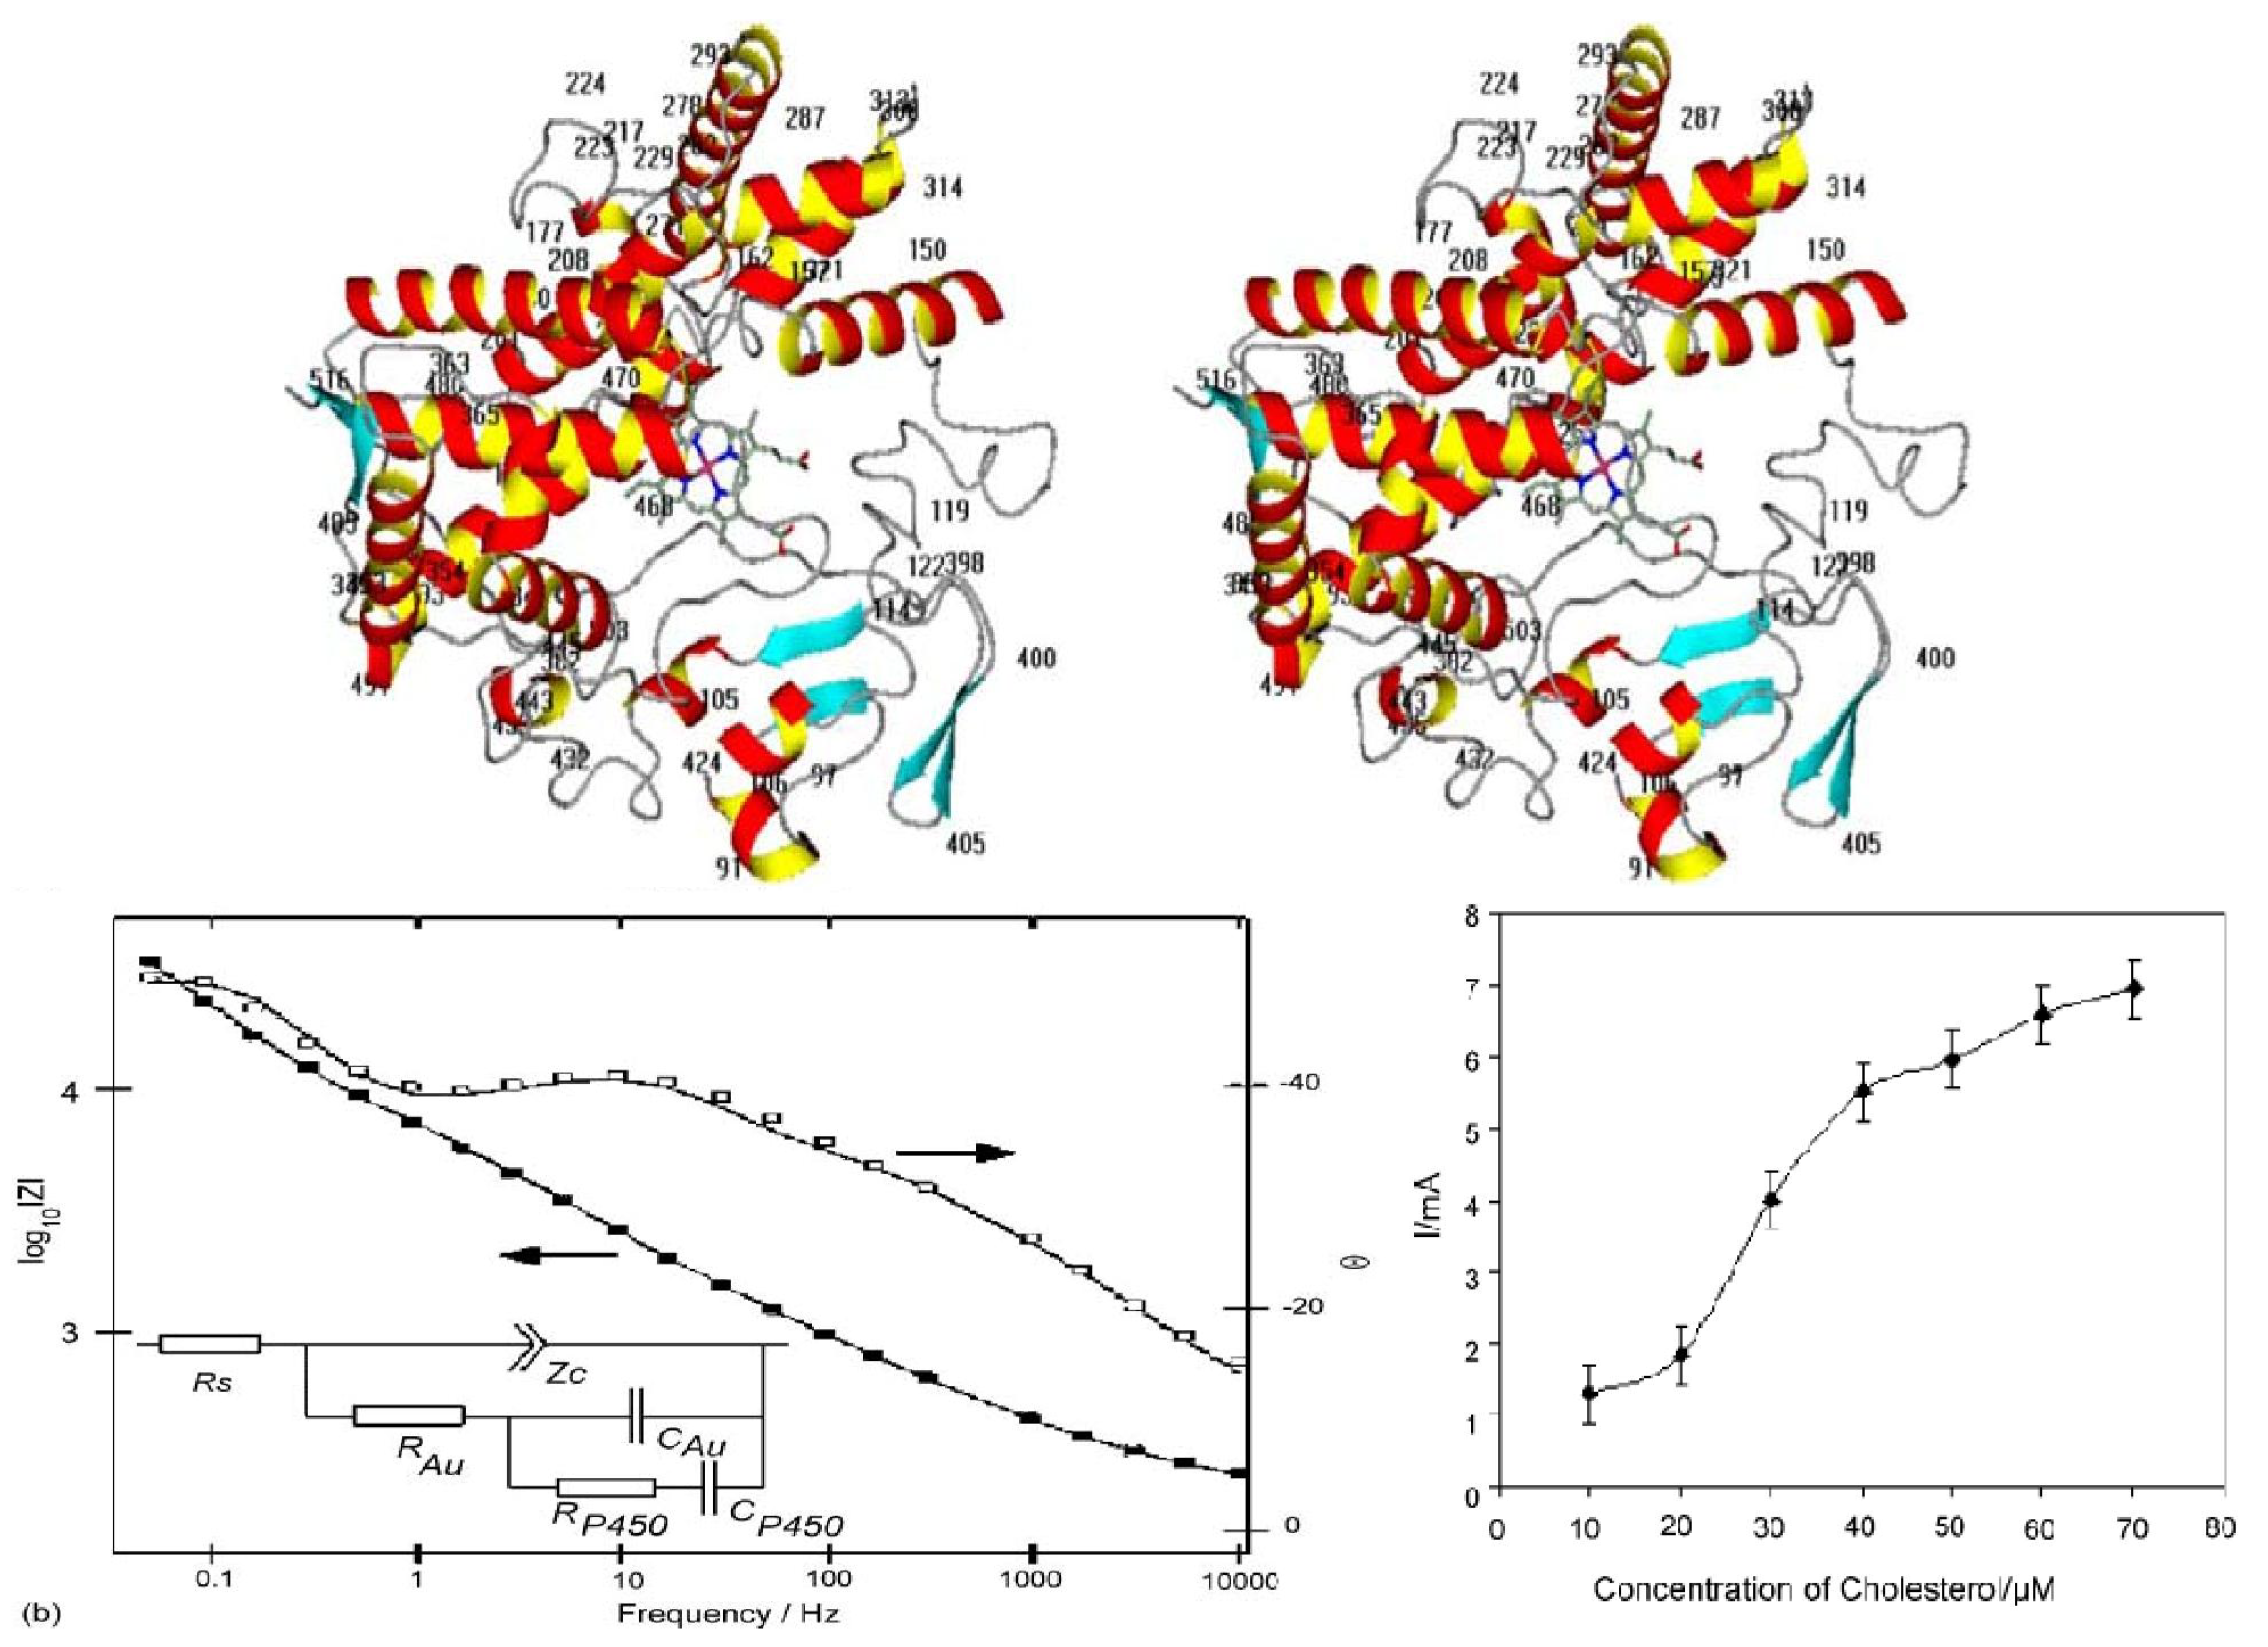
2. Anodic Porous Allumina and P450scc for Cholesterol Sensor

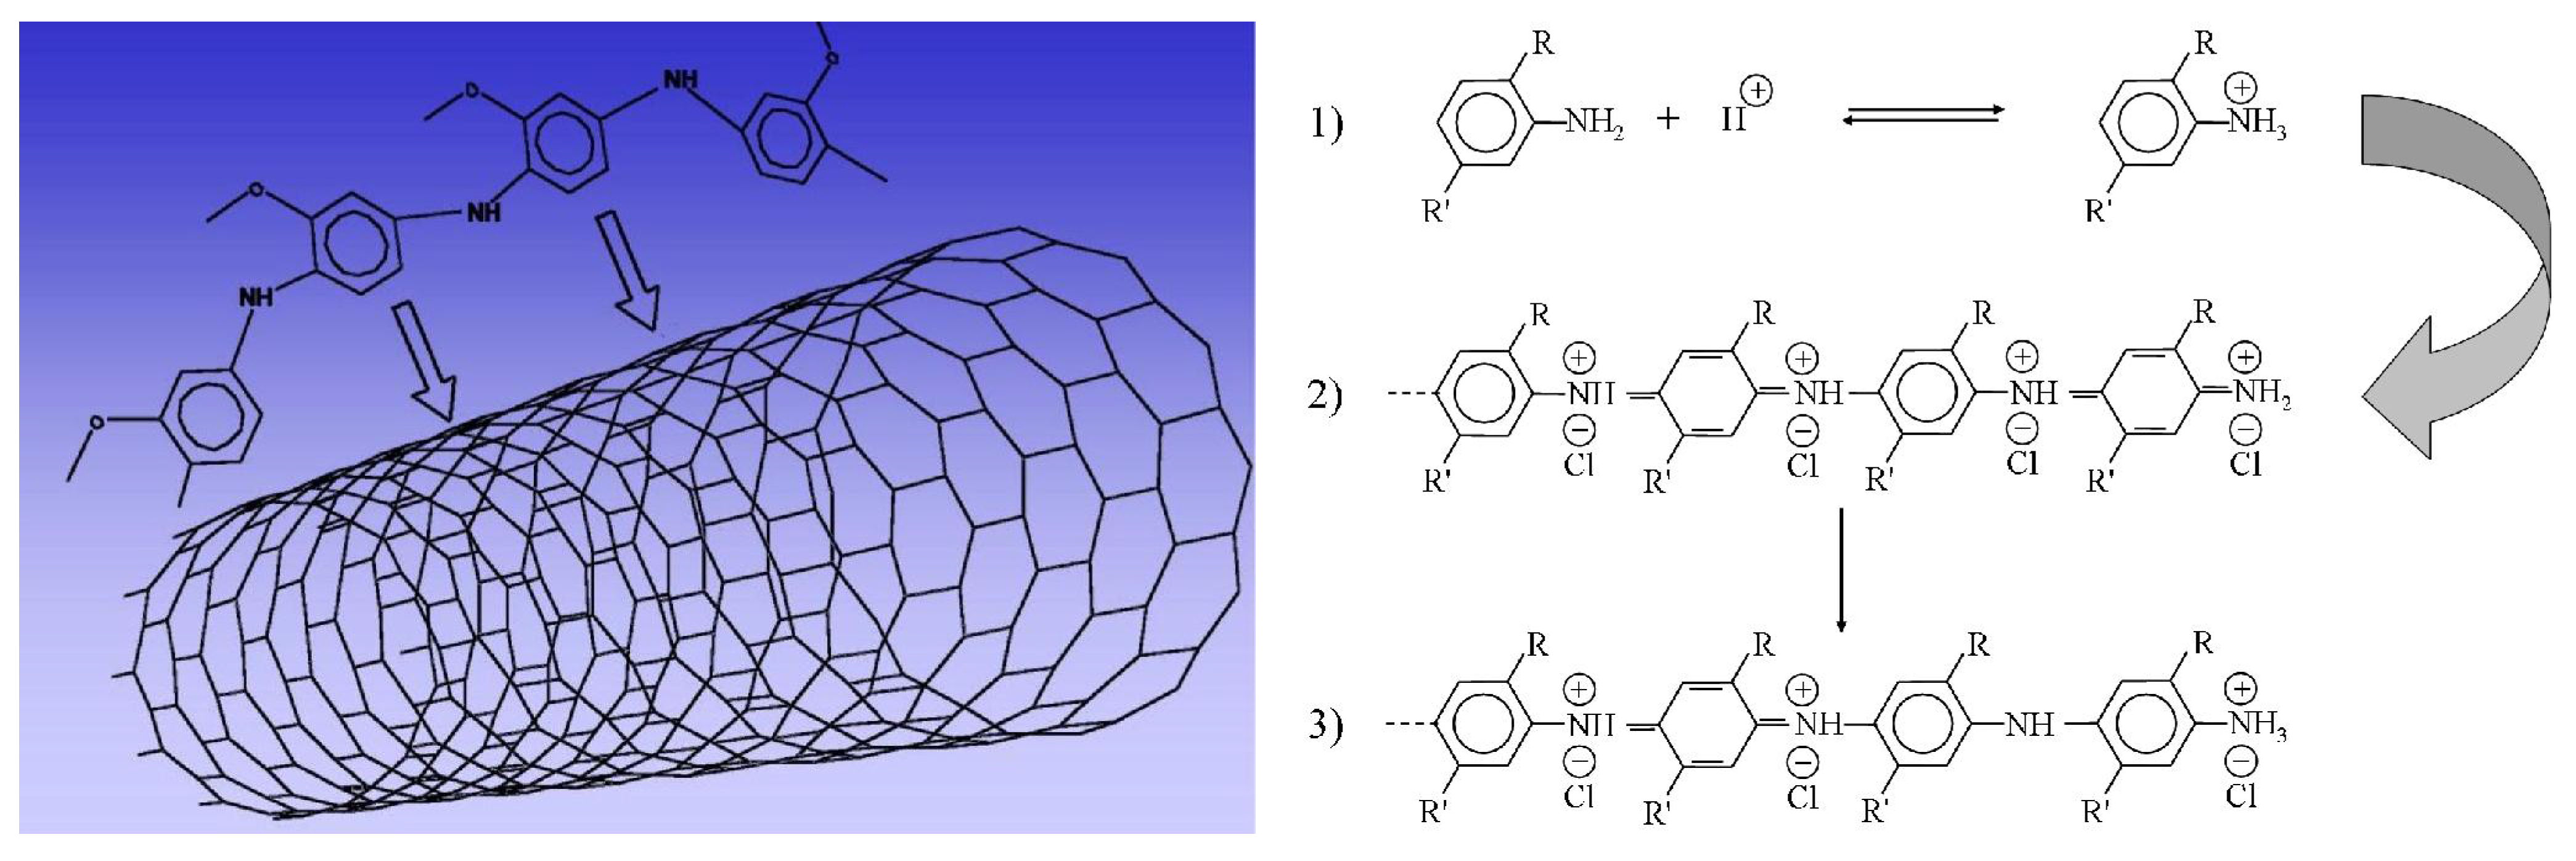
3. Carbon Nanotubes and Conductive Polymers for Gas Sensors

| Synthesized Material | MWNTs (mg) | SWNTs (mg) | Monomer (g) | Oxidant (g) |
|---|---|---|---|---|
| POTO | ~ | ~ | 9.97 | 5.26 |
| POTO-MWNTs | 100.8 | ~ | 10.08 | 5.32 |
| POTO-SWNTs | ~ | 100.5 | 10.05 | 5.30 |
| POAS | ~ | ~ | 10.03 | 4.61 |
| POAS-MWNTs | 99.2 | ~ | 9.92 | 4.56 |
| POAS-SWNTs | ~ | 100.7 | 10.07 | 4.63 |
| PDMA | ~ | ~ | 9.89 | 4.62 |
| PDMA-MWNTs | 99.5 | ~ | 9.95 | 4.65 |
| PDMA-SWNTs | ~ | 100.9 | 10.09 | 4.71 |
| PDOA | ~ | ~ | 10.04 | 3.70 |
| PDOA-MWNTs | 100.2 | ~ | 10.02 | 3.71 |
| PDOA-SWNTs | ~ | 99.7 | 9.97 | 3.69 |
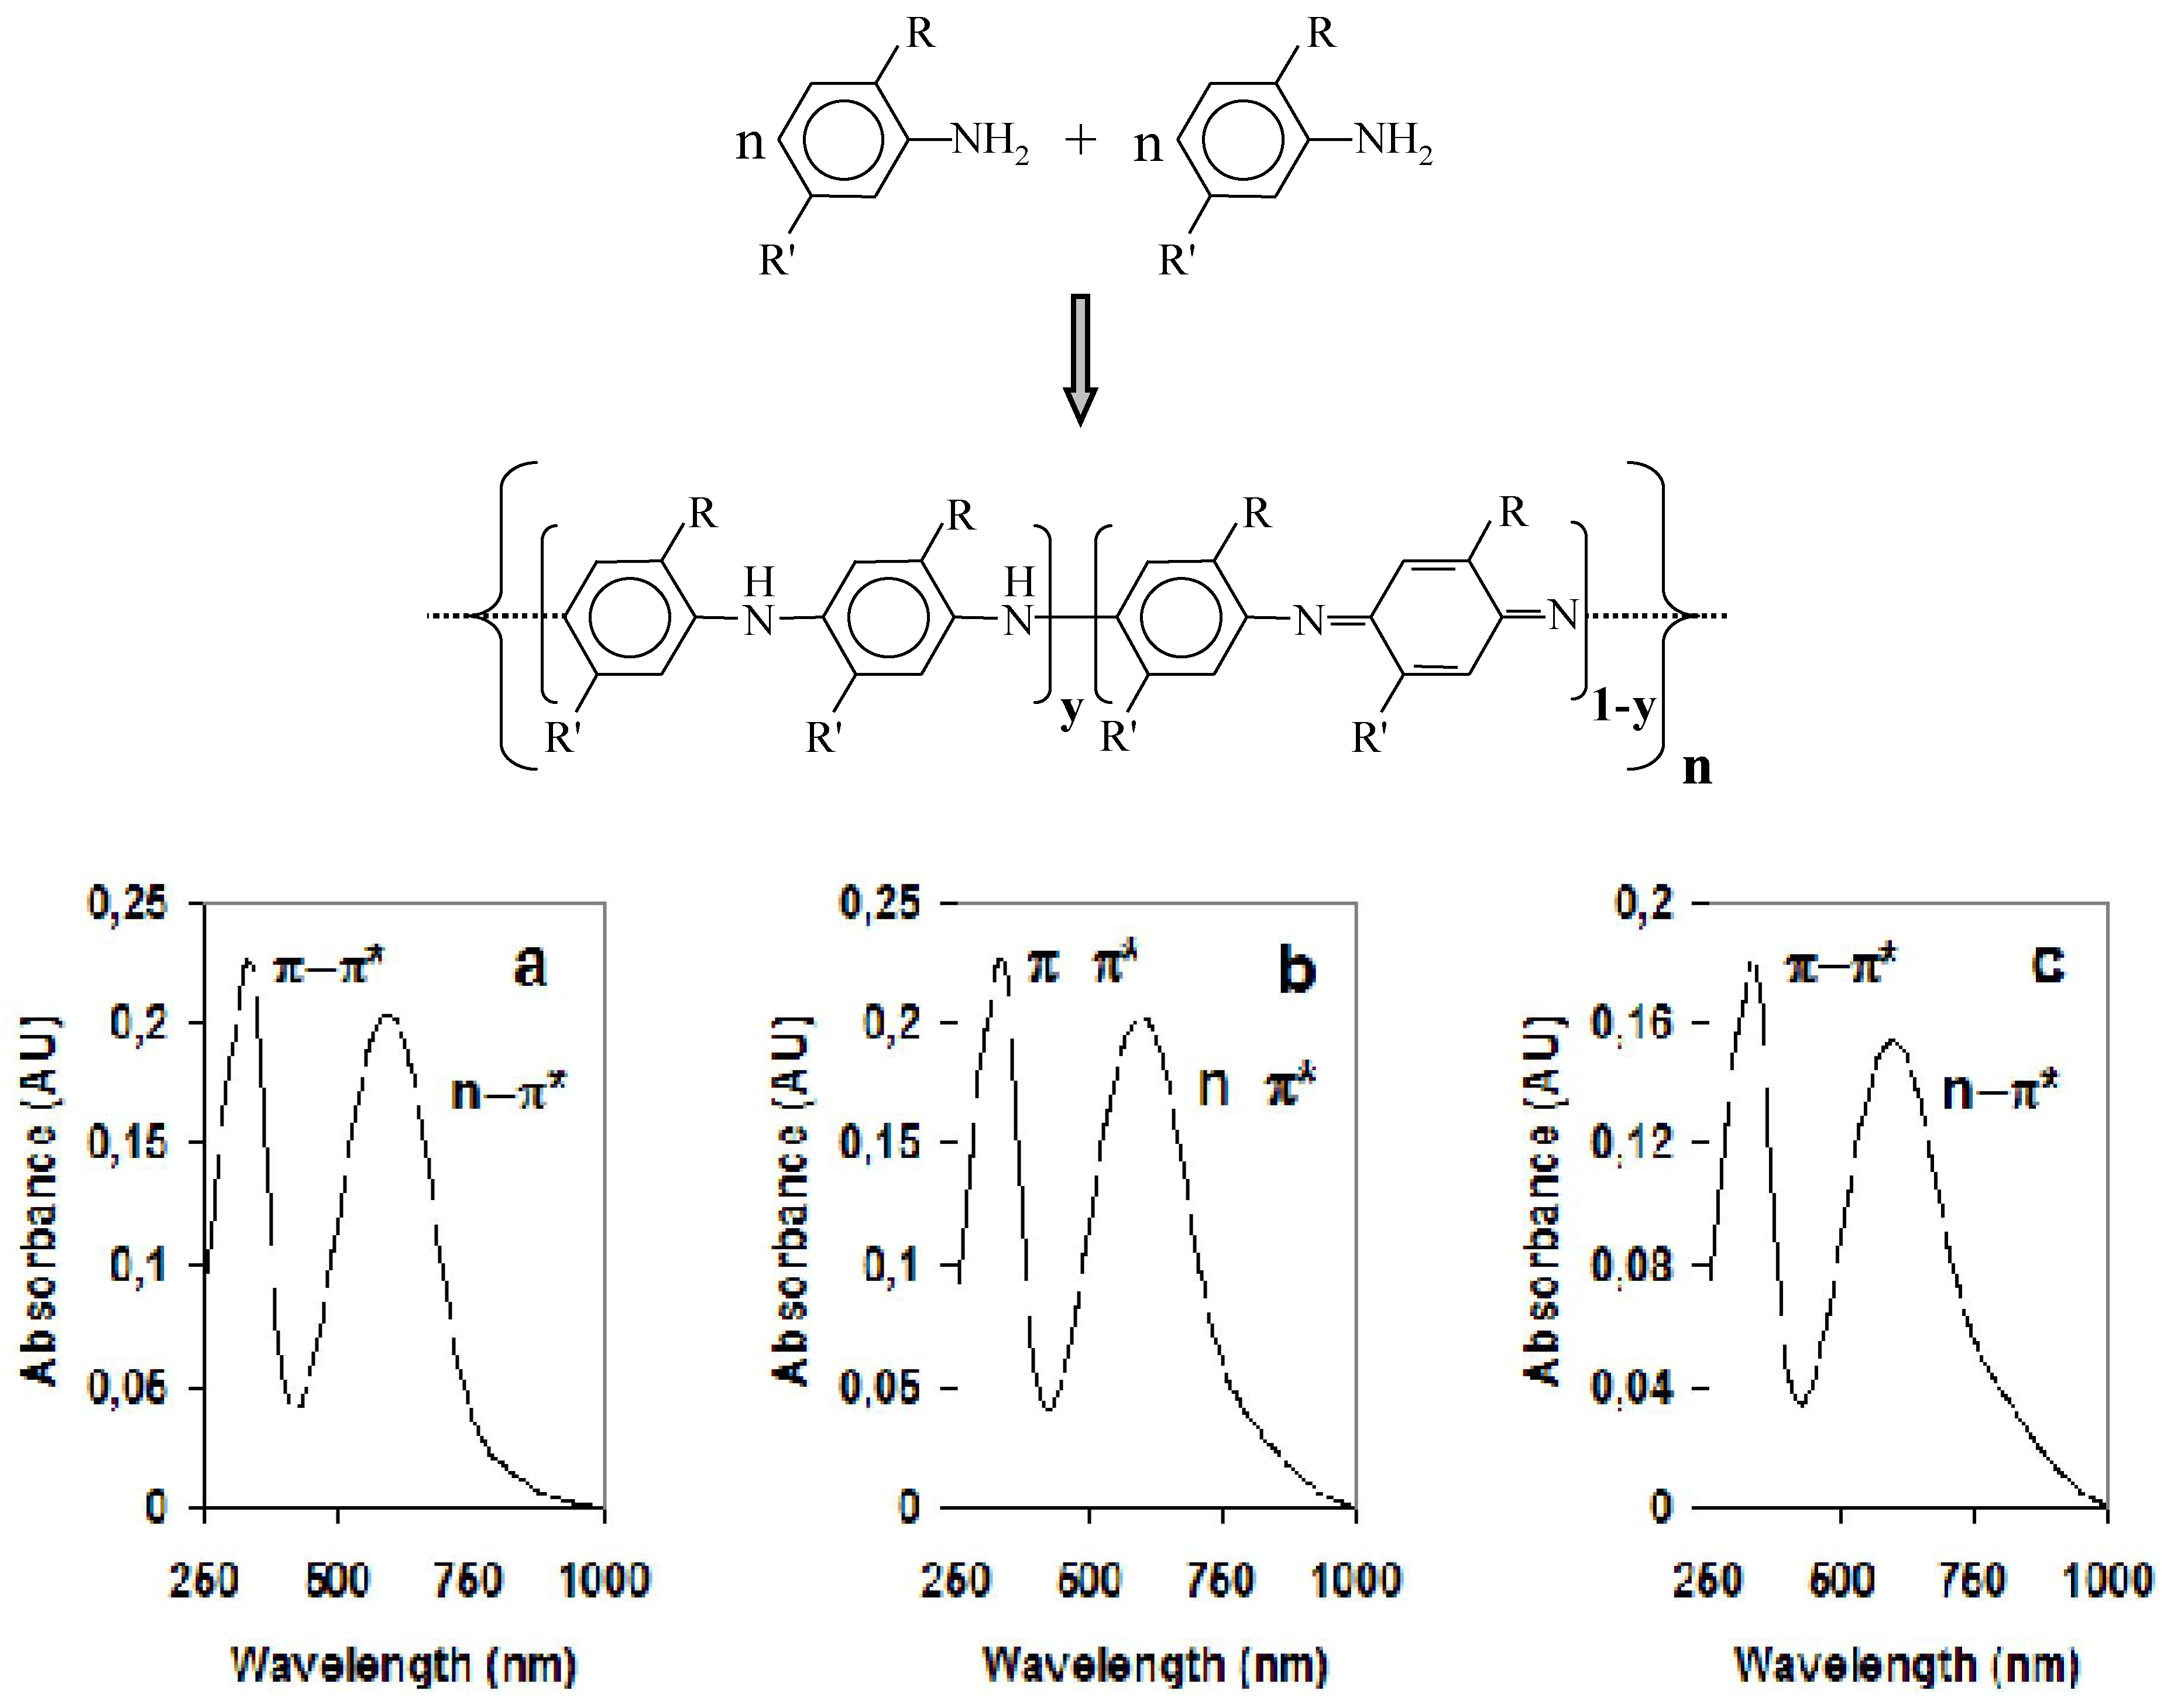
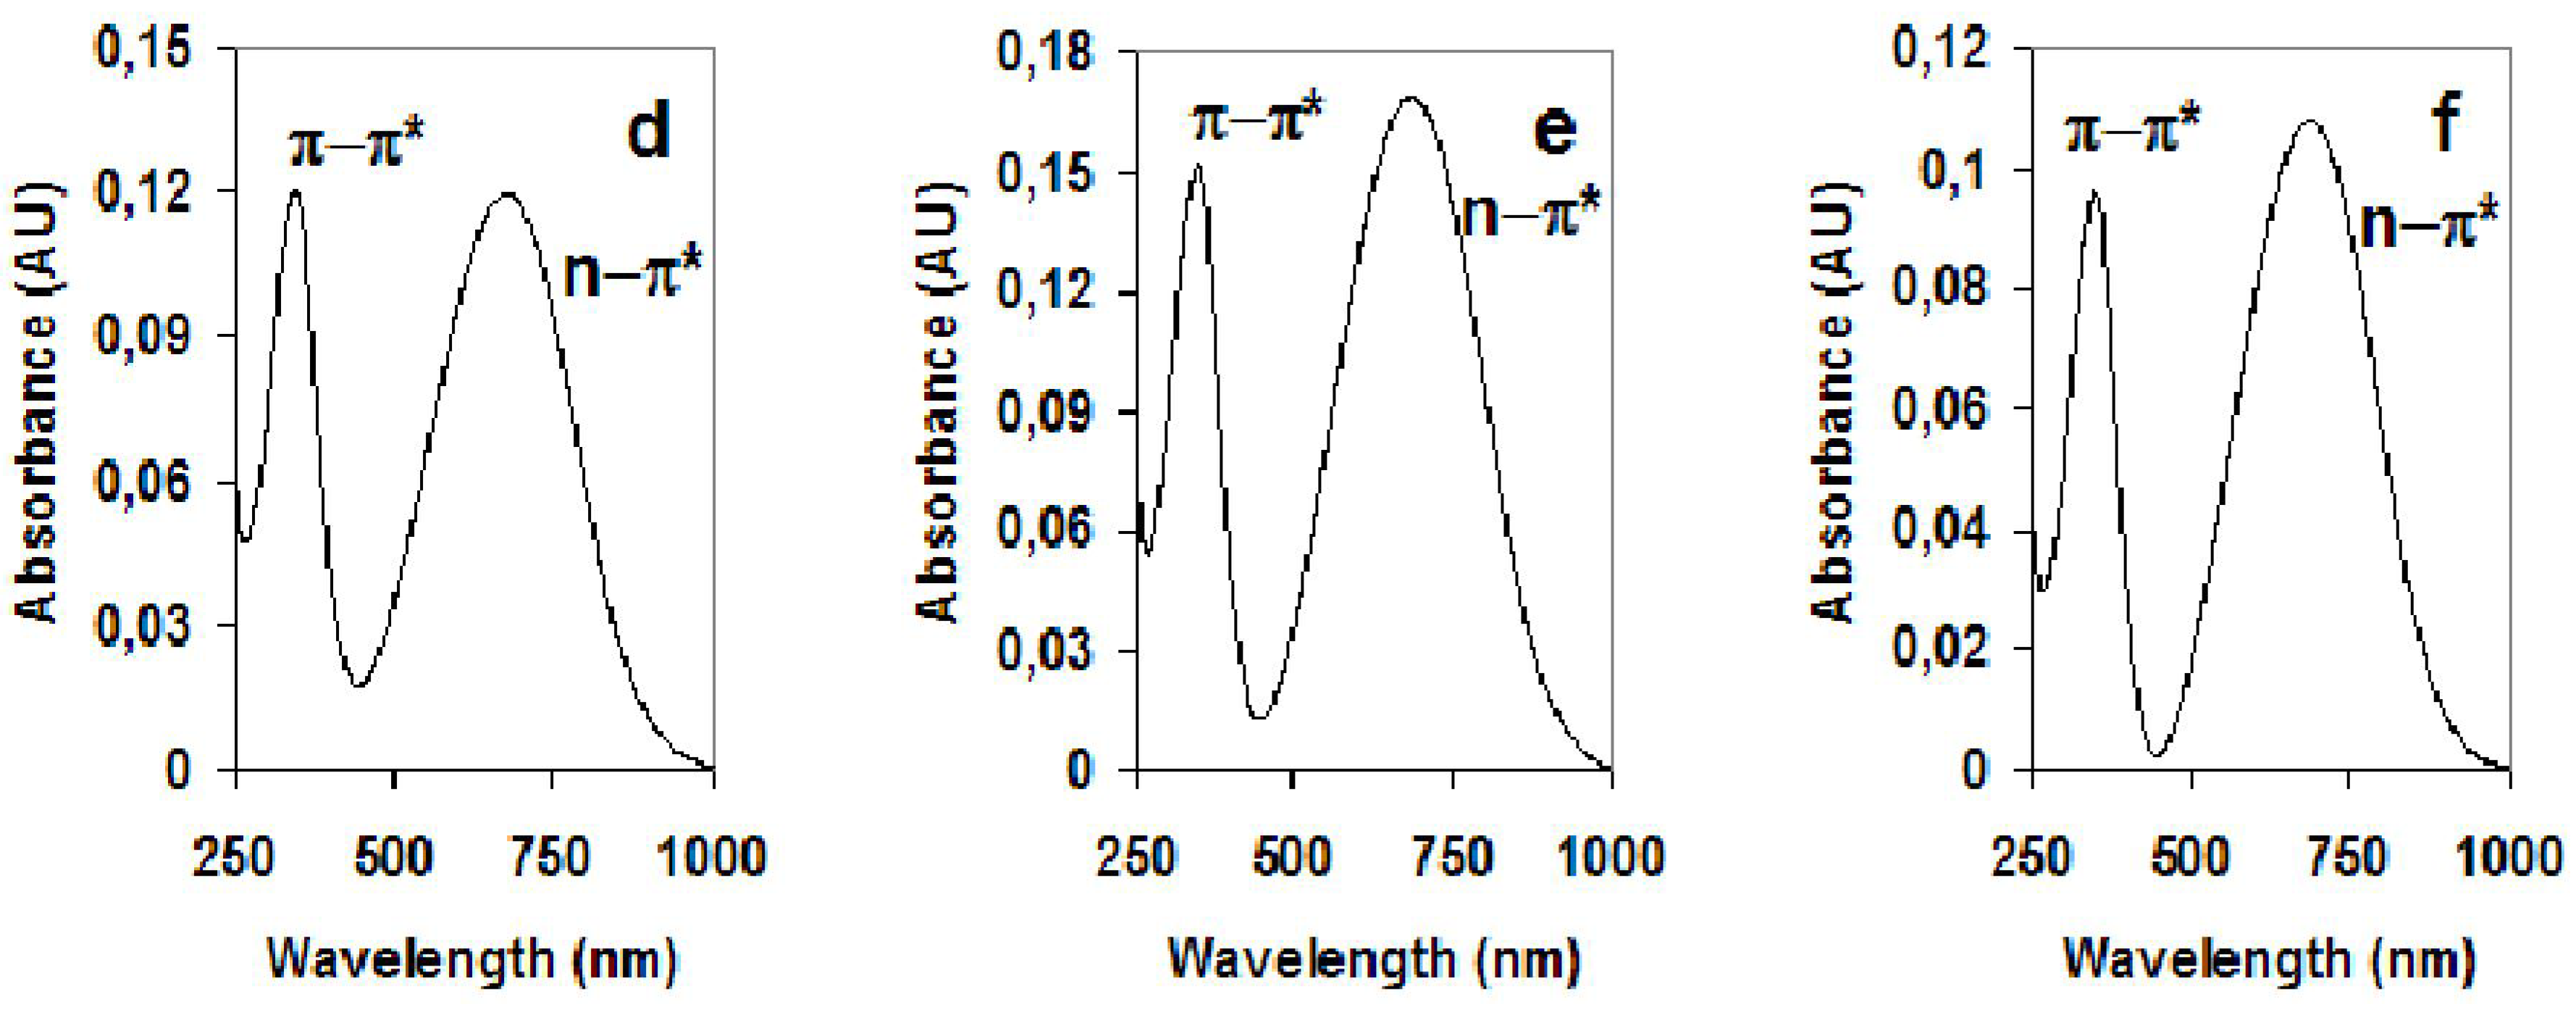
| Material | π-π*(Undoped) | n-π*(Undoped) |
|---|---|---|
| PDMA | 331 nm | 594 nm |
| PDMA-MWNTs | 332 nm | 597 nm |
| PDMA-SWNTs | 331 nm | 597 nm |
| PDOA | 345 nm | 677 nm |
| PDOA-MWNTs | 345 nm | 685 nm |
| PDOA-SWNTs | 348 nm | 688 nm |
| POTO | 314 nm | 601 nm |
| POTO-MWNTs | 316 nm | 600 nm |
| POTO-SWNTs | 316 nm | 599 nm |
| POAS | 328 nm | 654 nm |
| POAS-MWNTs | 328 nm | 661 nm |
| POAS-SWNTs | 327 nm | 661 nm |
| Material | Eg (Doped) |
|---|---|
| PDMA | 3.1 eV |
| PDMA-MWNTs | 3.1 eV |
| PDMA-SWNTs | 3.0 eV |
| PDOA | 2.3 eV |
| PDOA-MWNTs | 2.3 eV |
| PDOA-SWNTs | 2.3 eV |
| POTO | 2.7 eV |
| POTO-MWNTs | 2.7 eV |
| POTO-SWNTs | 2.7 eV |
| POAS | 2.5 eV |
| POAS-MWNTs | 2.5 eV |
| POAS-SWNTs | 2.5 eV |

4. Langmuir-Blodgett Multilayers of Proteins for Health and Environment Sensors
- -
- -
- The high temporal and thermal stability allow the use of these matrixes in the biocatalysts and biosensors devises. Moreover, the protein organization in the designed multiplayer can increase its enzymatic activity and the numbers of working cycles [54].
- -
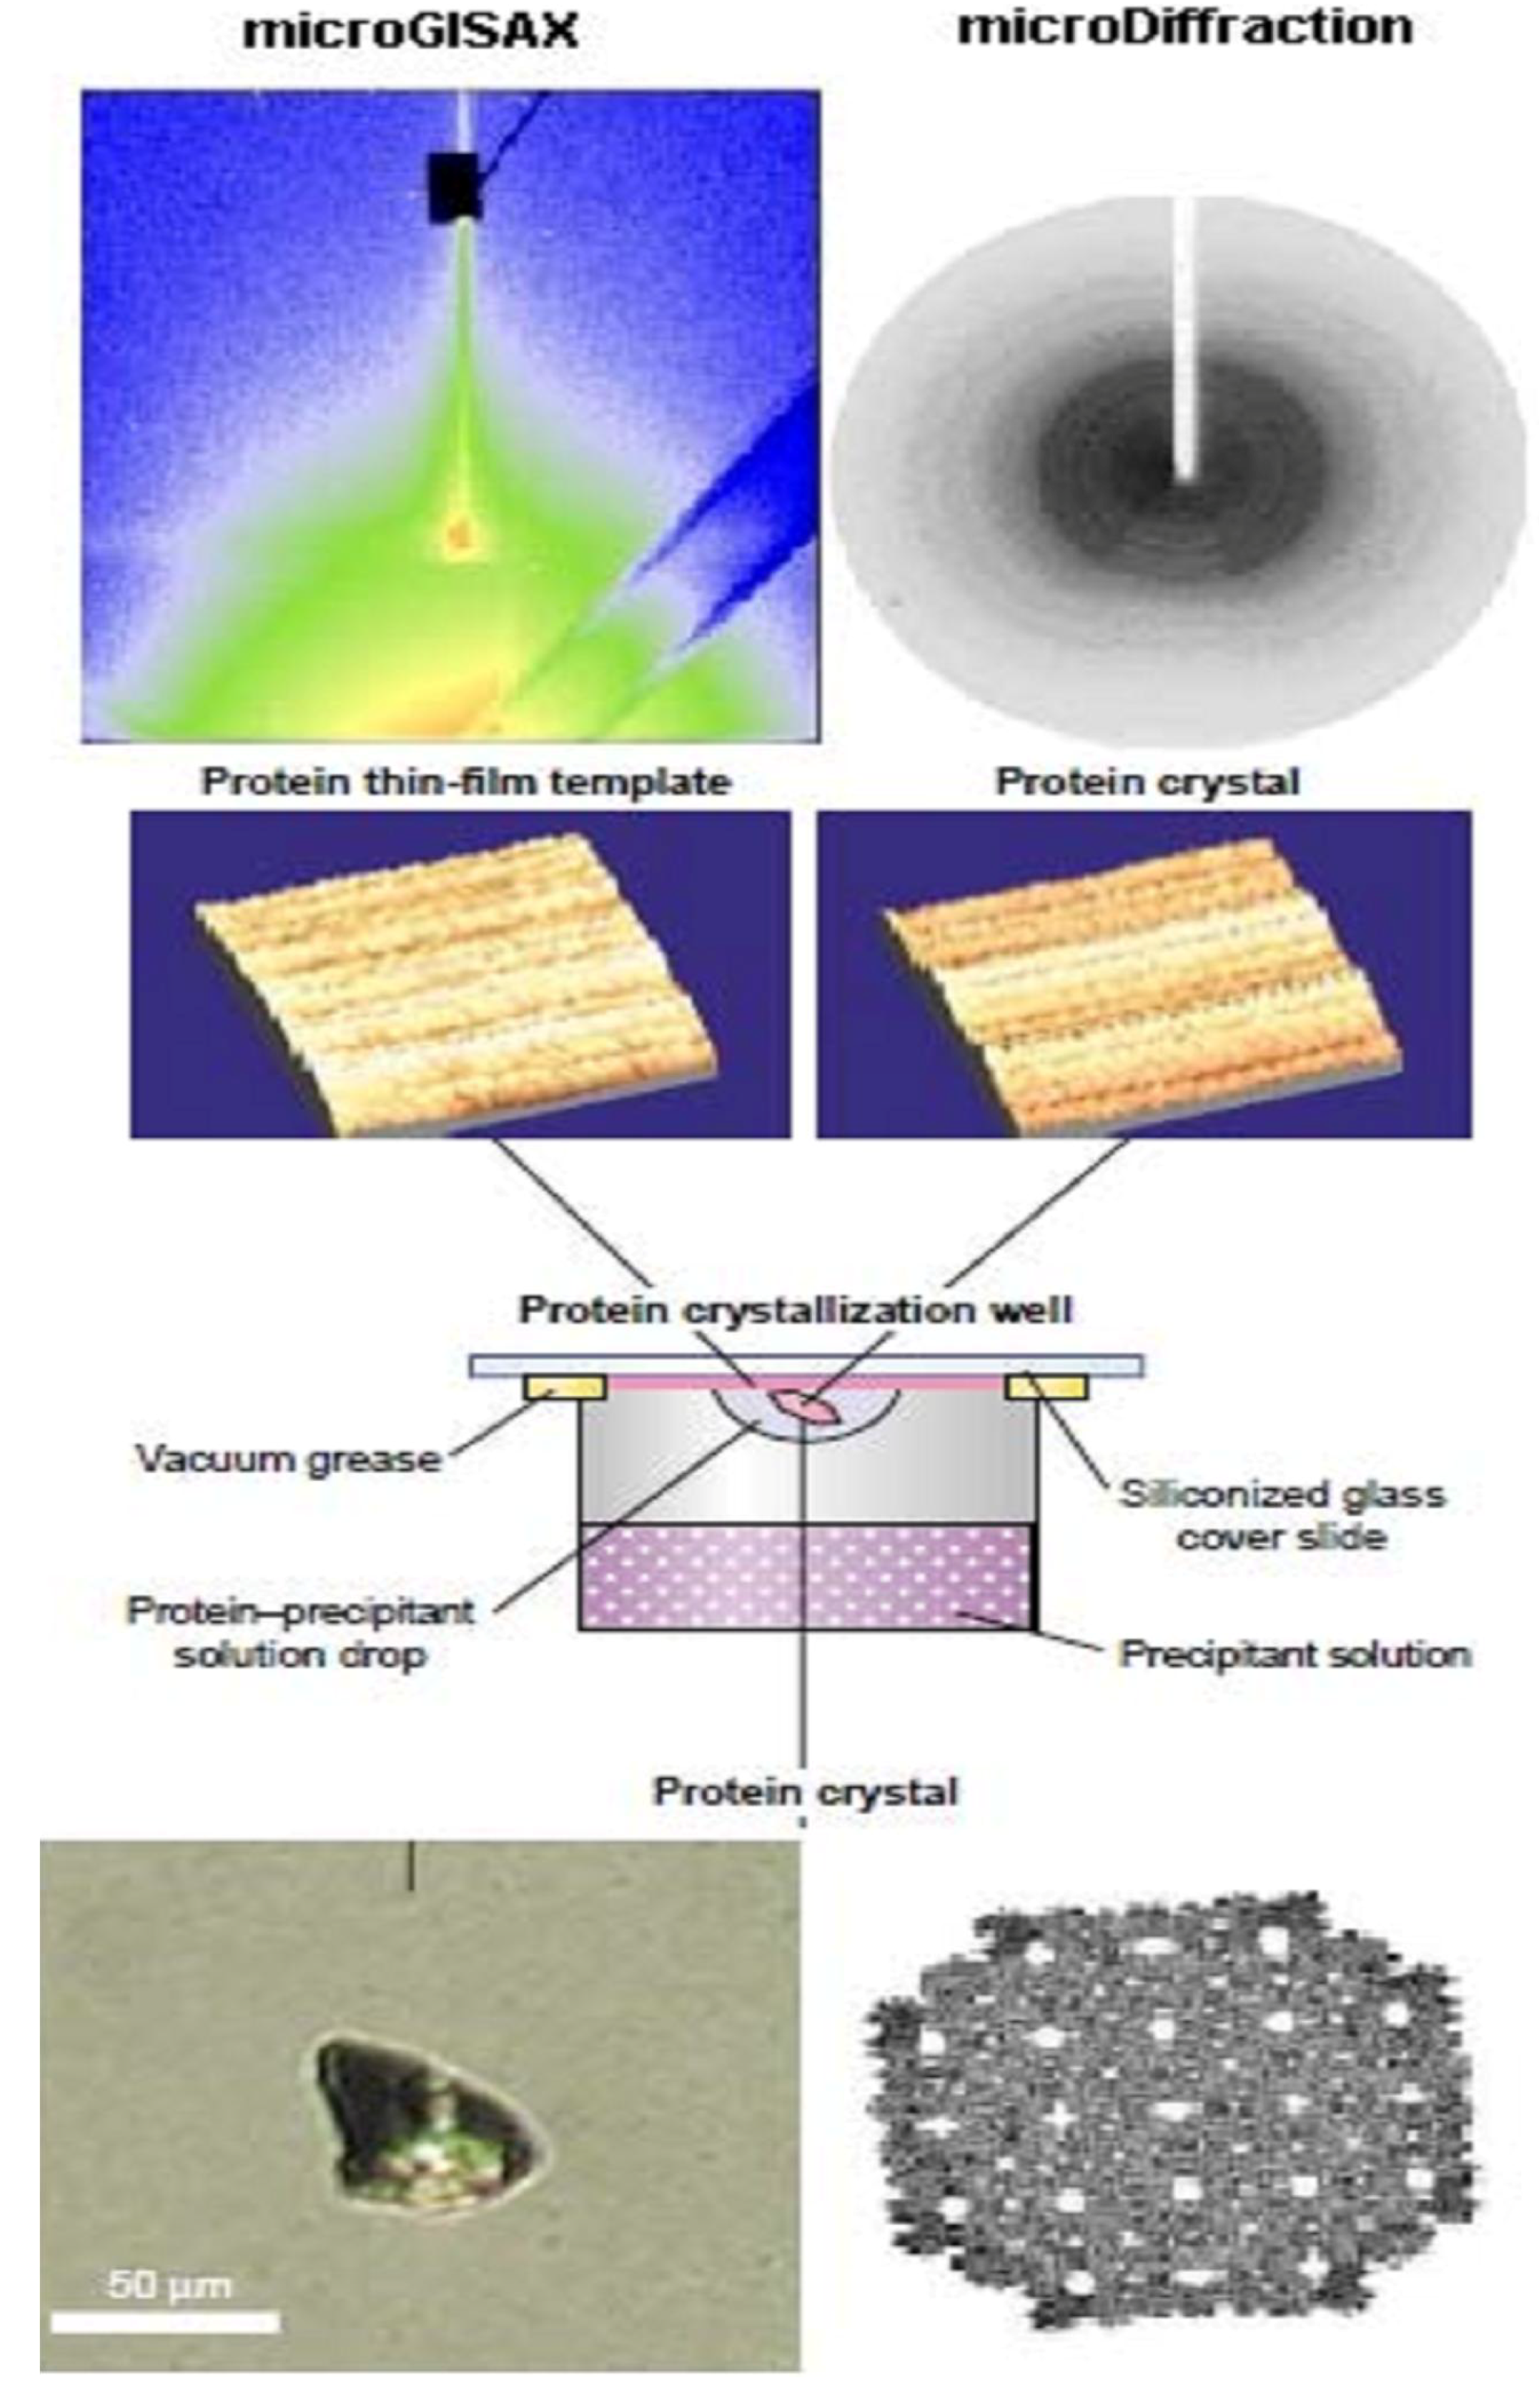
- The protein LB nanotemplate matrixes, obtained by protein monolayes immobilization can be successfully used in initiation and acceleration of crystallization of proteins, not crystallizable so far [58], introducing the new field of advanced research, namely nanocrystallography [59]. LB-based protein crystals preparation and characterization is shown in Figure 5.
- -
- The proven crystals obtained by these matrixes have exceptional radiation stability. This can help to overcome the major problem in protein X-ray crystallography—the radiation damage issue [60].
- -
- Nanogravimetry, namely the technique which exploits the properties of piezoelectric quartz crystals to vary their resonance frequency when a mass is adsorbed to, or desorbed from, their surface, can give information on the uniformity and reproducibility of protein LB matrix deposition. Moreover, knowing the molecular weight of the protein molecule, it is possible to evaluate experimentally the area per molecule in the film obtained, and to compare it with the area theoretically estimated for the closely packed system. The latter value can be calculated easily, knowing the geometrical parameters of the protein from the Brookhaven Protein Data Bank. In cases in which the structure of the protein has not yet been resolved, homologous protein parameters or geometrical features from molecular modeling can be used for the calculation.
- -
- -
- Scattering analysis can give better in-depth insight onto the LB film long range order. Huge progress in X-ray scattering technique have been achieved, namely at ID13 beamline at European Synchrotron Facility (ESRF) in Grenoble [63], where the micro and nanoGISAX set up has been developed [64,65]. Now it is possible to investigate laterally inhomogeneous surfaces and interfaces with a two order-of-magnitude increase in spatial resolution compared to standard reflection set-ups. This allowed obtaining a coherent explanation for the origin and the molecular mechanisms of the protein heat proof in LB film. [66].
- -
- -
- -
- the comparative atomic structure characterization of thermophilic versus mesophilic proteins by X-ray crystallographic diffraction and nanogravimetric analysis in protein solution, thin film and crystal, recently pointed to the role inner bound water in determining protein thermostability ([70] and references therein).

4.1. Three-Dimensional Nanoporous Lysozyme Materials
- In vitro reconstitution of purified natural structural protein, e.g., reconstruction of bacterial S-layer on a supporting surface.
- Protein crystallization from saturated solutions, e.g., preparation of crystals for X-ray crystallography.
- Specific crosslinking of binding proteins by bi or multi ligands, e.g., crosslinking of lectins by di or oligosaccharides, in analogy to natural processes.
- Directed self-assembly of a binding protein into a pre-designed crystal by specific crosslinking affected by bi-ligand imposing predetermined relative orientation of the crosslinked binding protein, an approach recently introduced by our laboratory.
- Directed self-assembly of chimeric proteins into a pre-designed crystal by specific recognition of protein subunits into linear or circular structures, affected by synthetic chimeric protein “building blocks”.
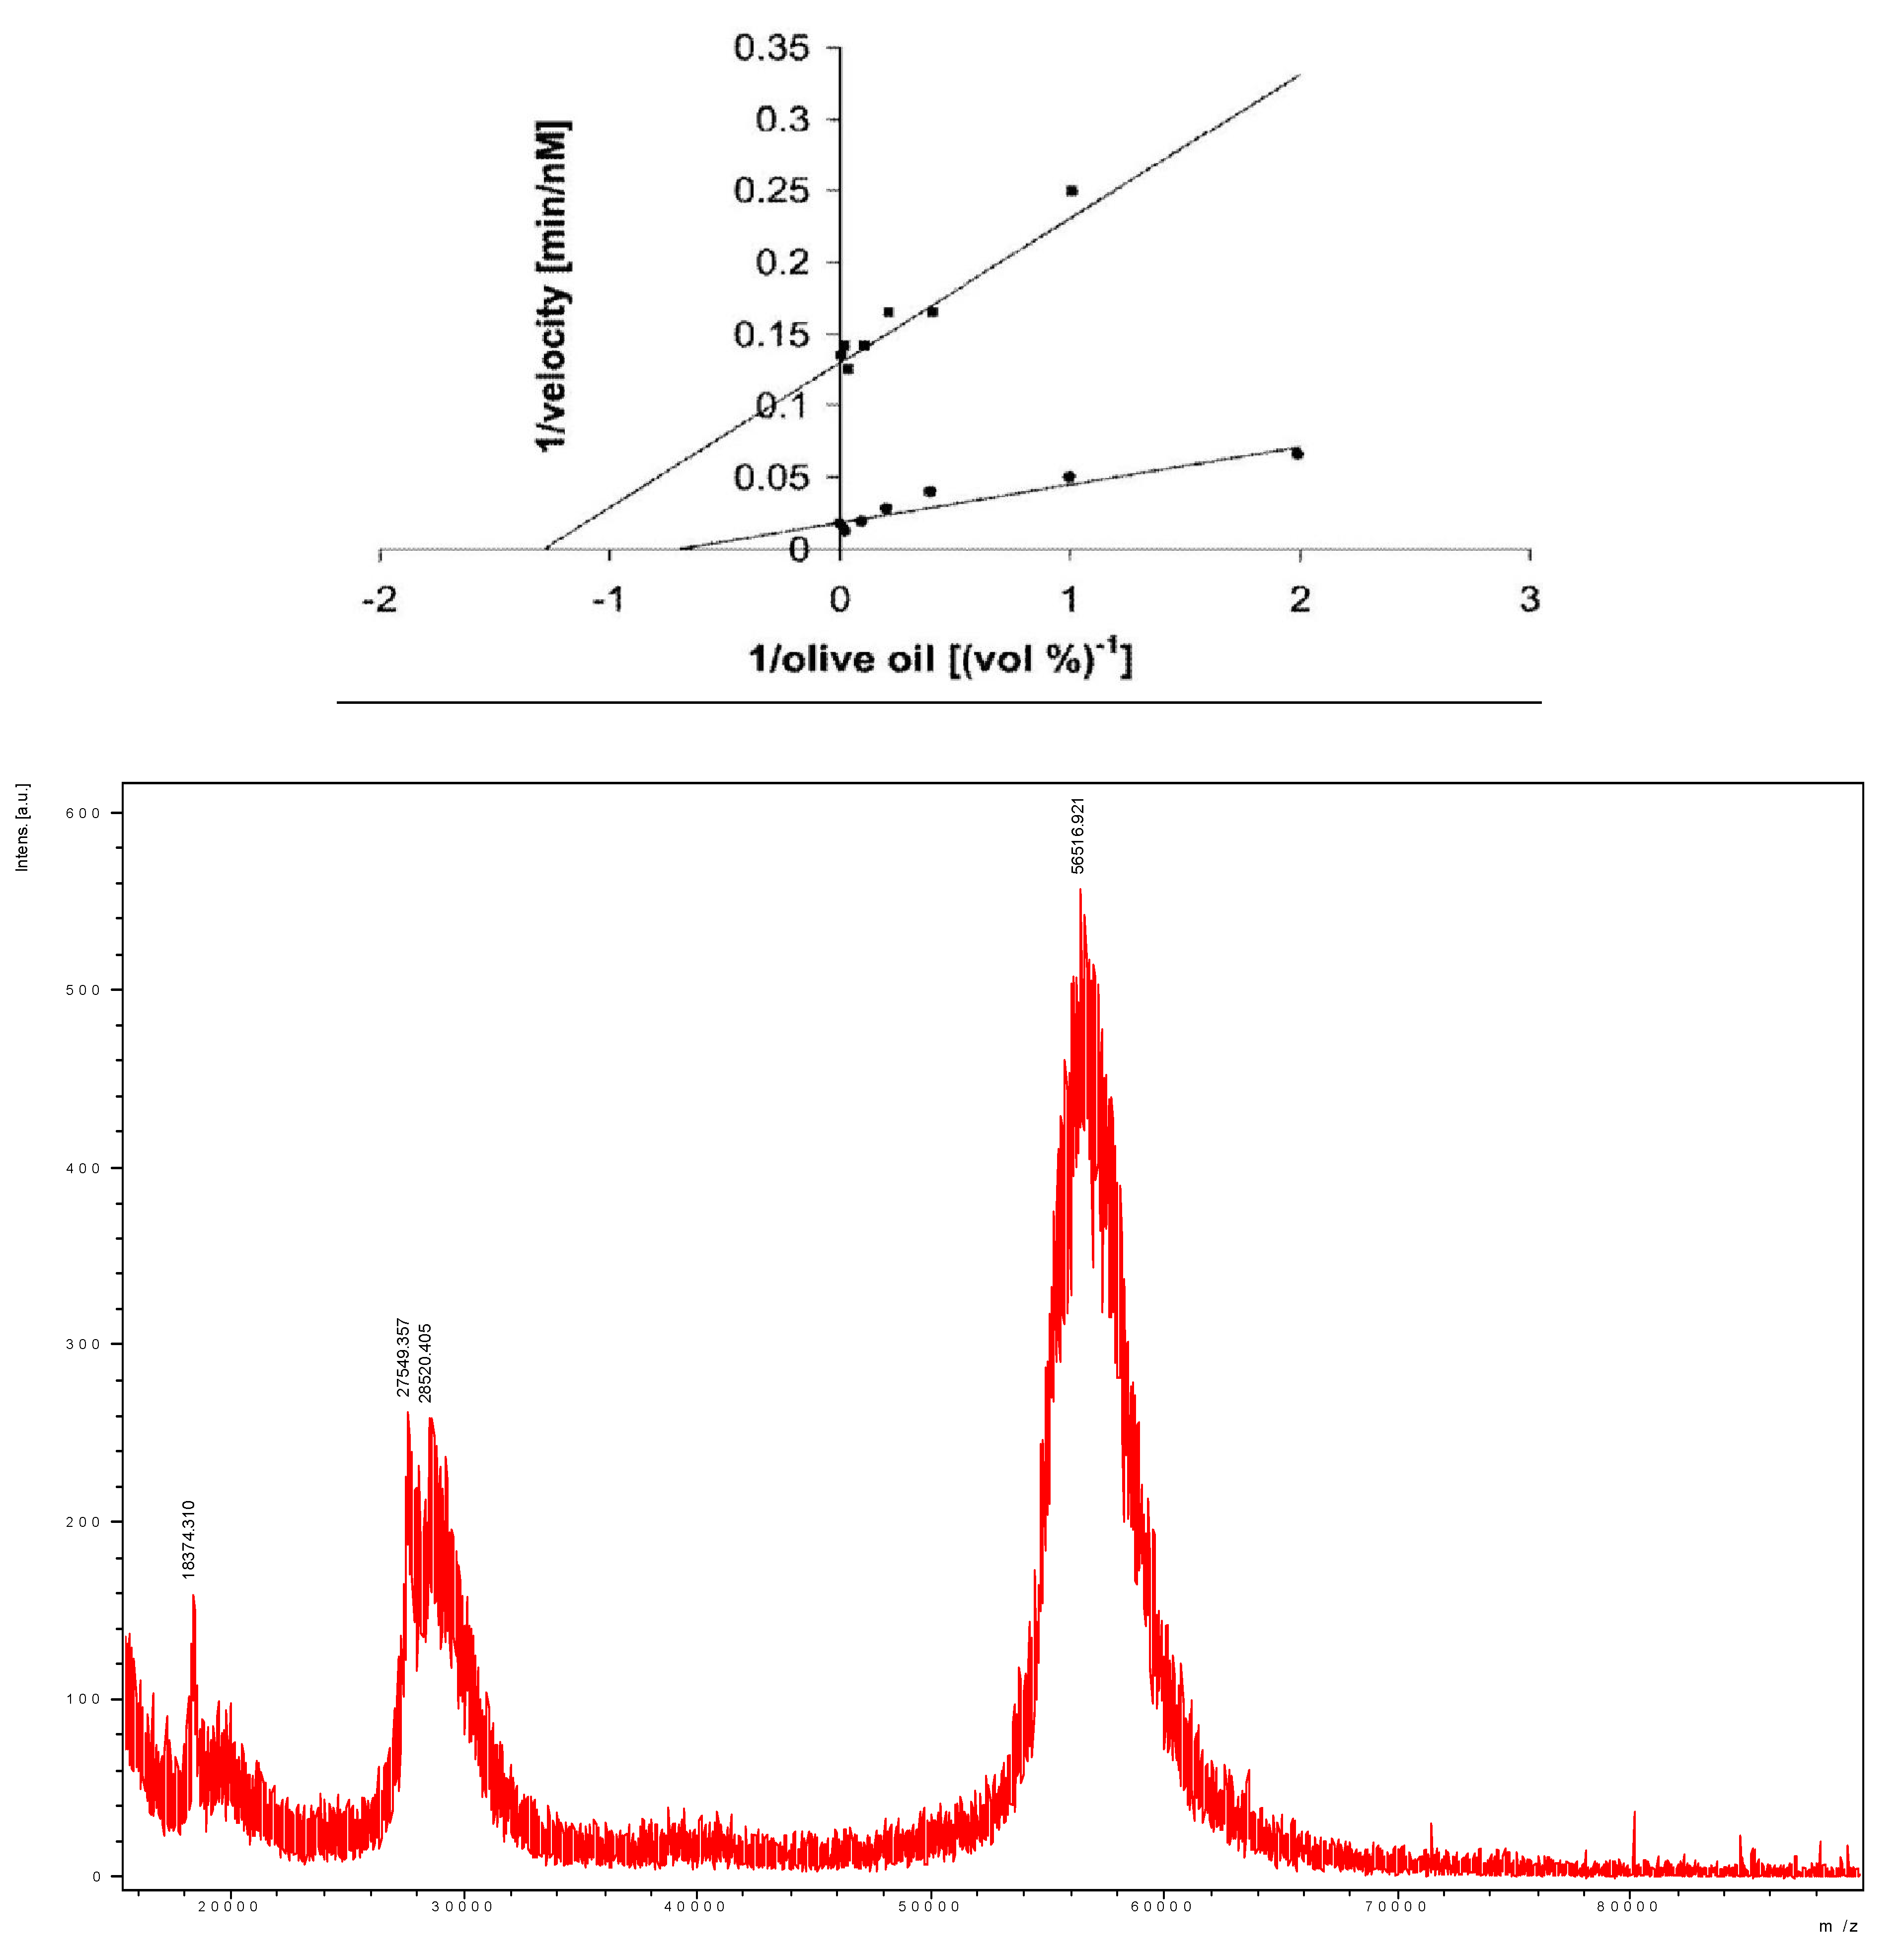
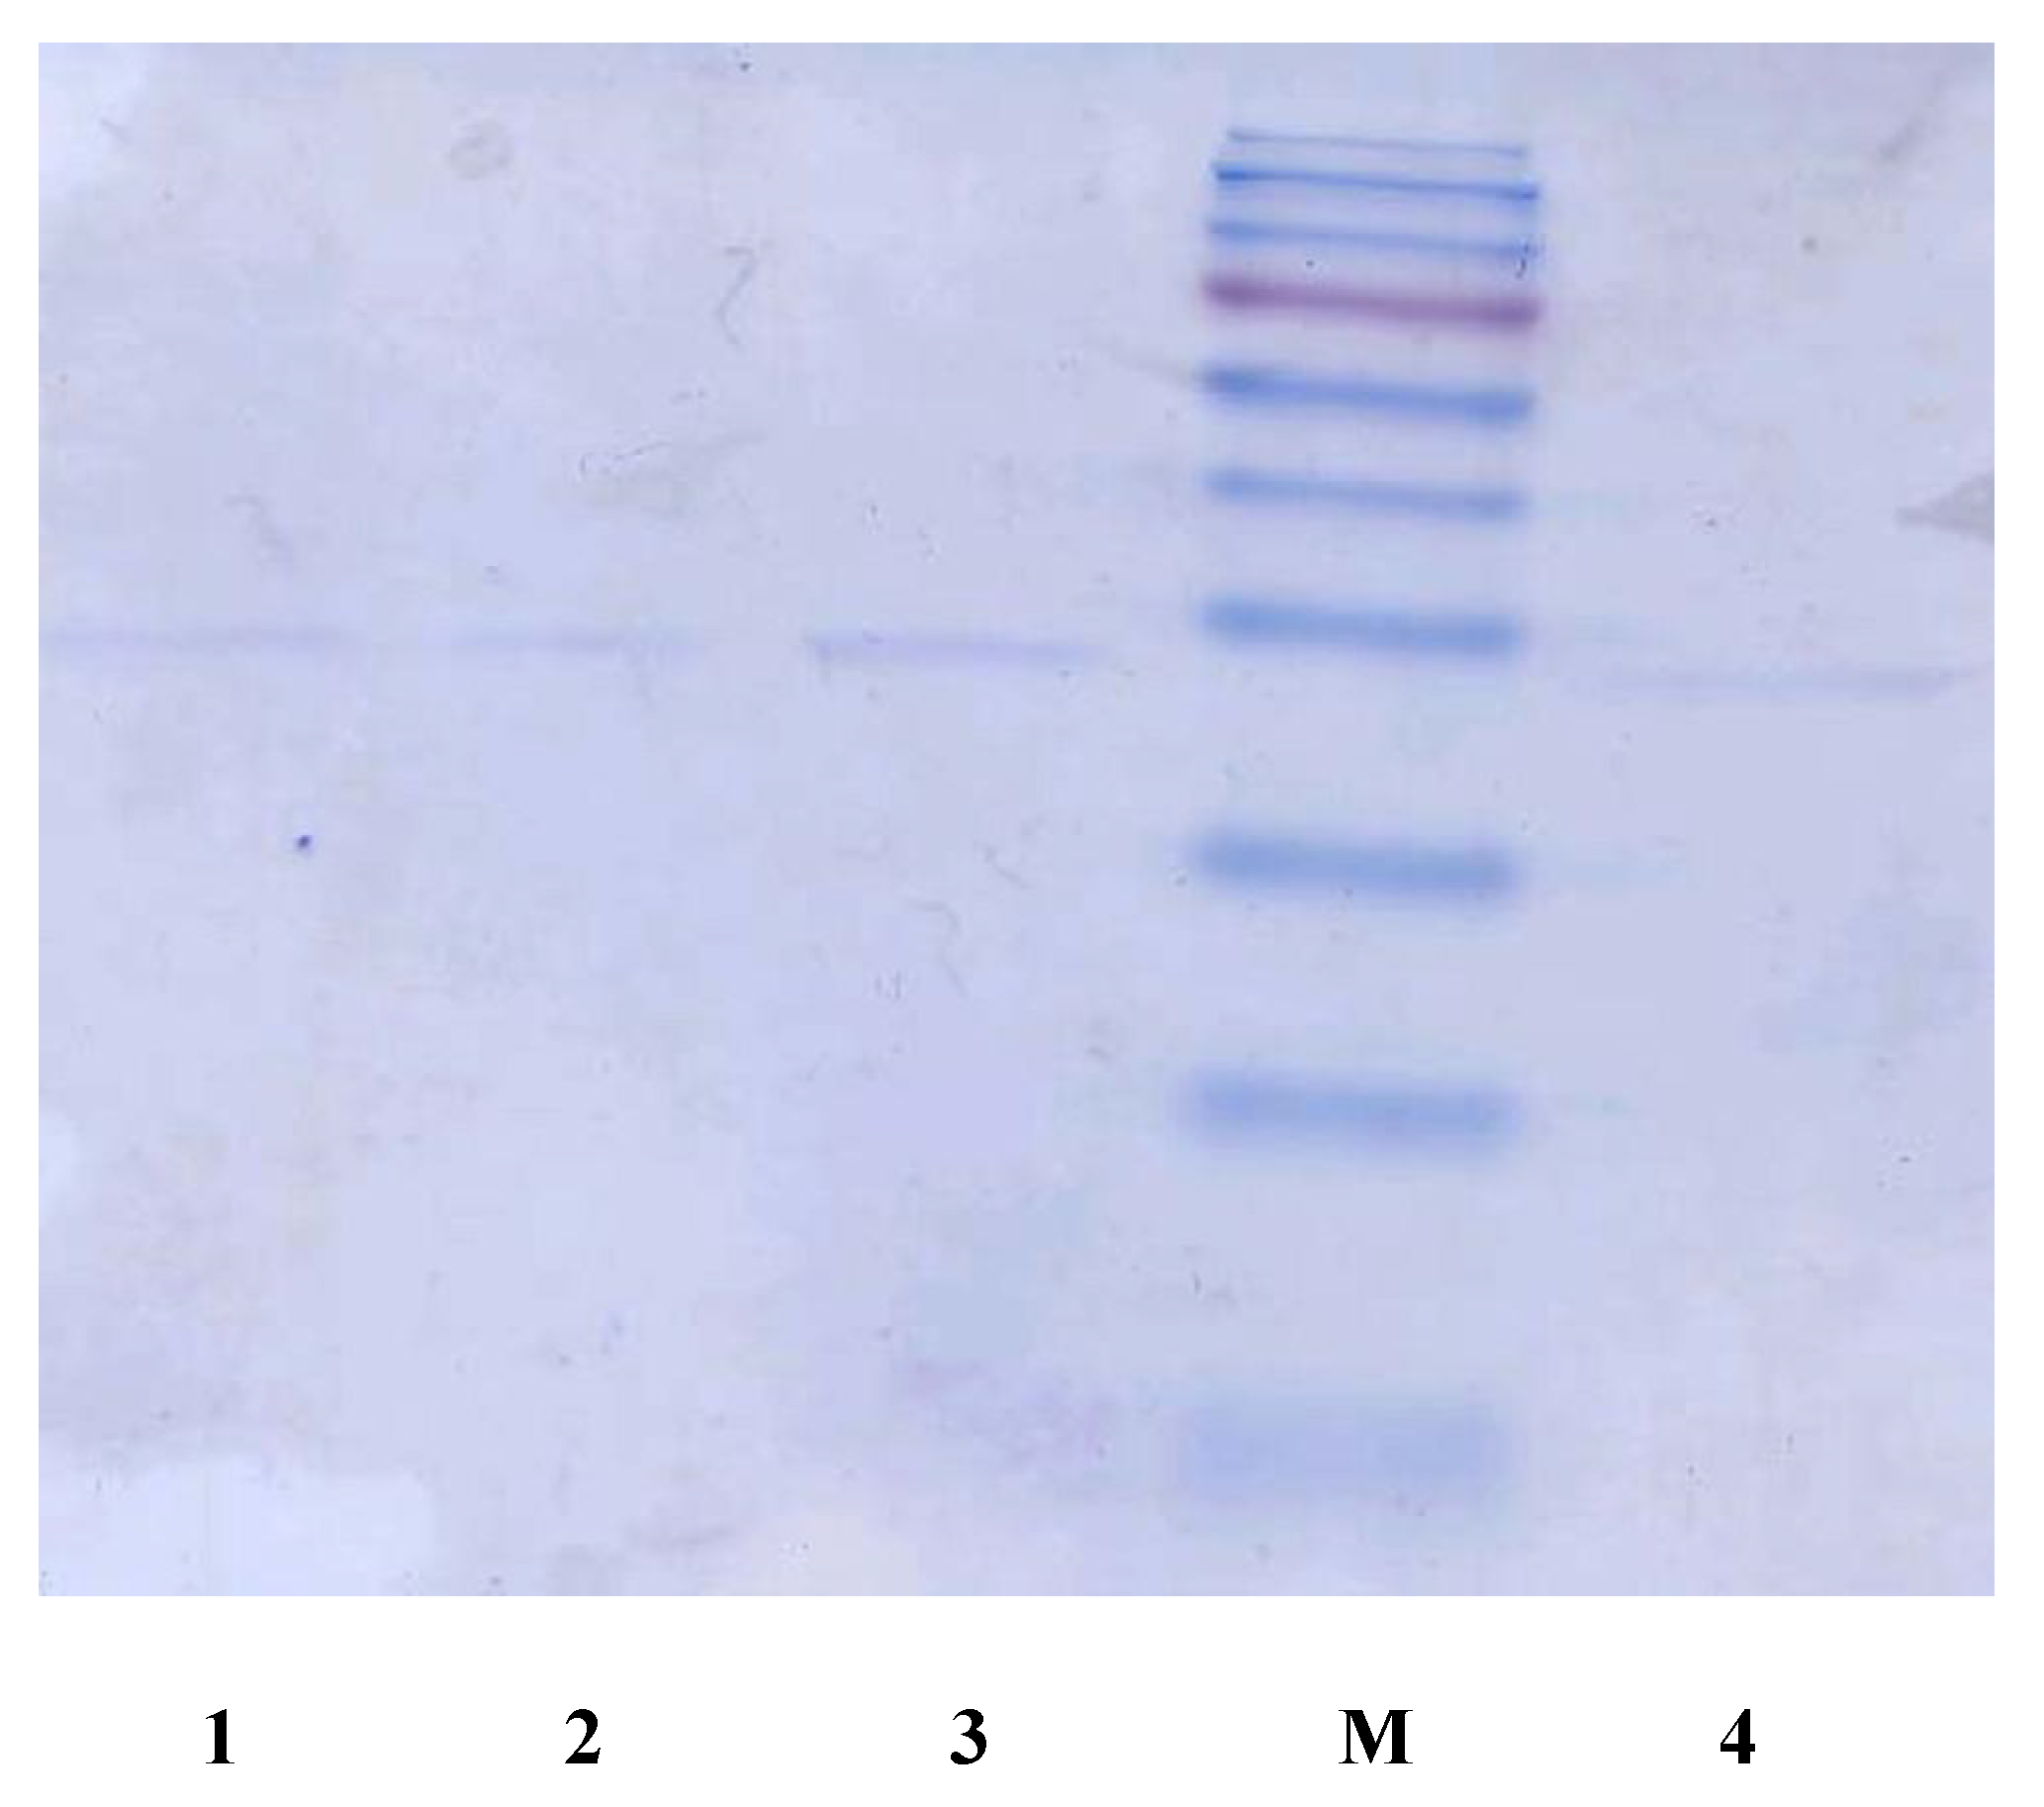
4.2. Lipases

4.3. Octopus Rhodospins

4.4. Laccases
4.5. Cytochromes

4.6. Bacterial Globins
| Protein and species | Sensing element/analyte | Transducer |
|---|---|---|
| LIPASES [76,77] Mucor miehei, Candida rugosa | Active site/Ttriglycerides, fatty acids | Release of protons -> Change of local pH* -> voltage |
| OCTOPUS RHODOSPIN [78,79,87] | Retinal/Light, including single- photon and polarization | Conformational/nanoscale motions* |
| BACTERIORHODOPSIN [95] Halobacterium Halobium | Overall conformation of protein/Anaesthetics | Pumping of protons -> voltage |
| CYTOCHROMES P450 [8,103,104,105] Multiorganism P450scc (mammalian adrenal cortex), P4501A2 (mammalian liver), P450cam (bacterial) | Heme/Multisensors. Almost any xenobiotic/organic molecule will induce expression of its appropriate Cytochrome P450 | Change in electrochemical potential of heme -> voltage/current |
| LACCASE Rigidoporus lignosus, Trametes versicolor | Active site/phenolic compounds | Oxygen consumption* -> current |
| BACTERIALHEMOGLOBIN Methylacidiphilum infernorum | Heme/Oxygen (reversible), cyanide, carbon monoxide (irreversible) | Conformational/nanoscalemotions*; Change in optical and electrochemical properties |
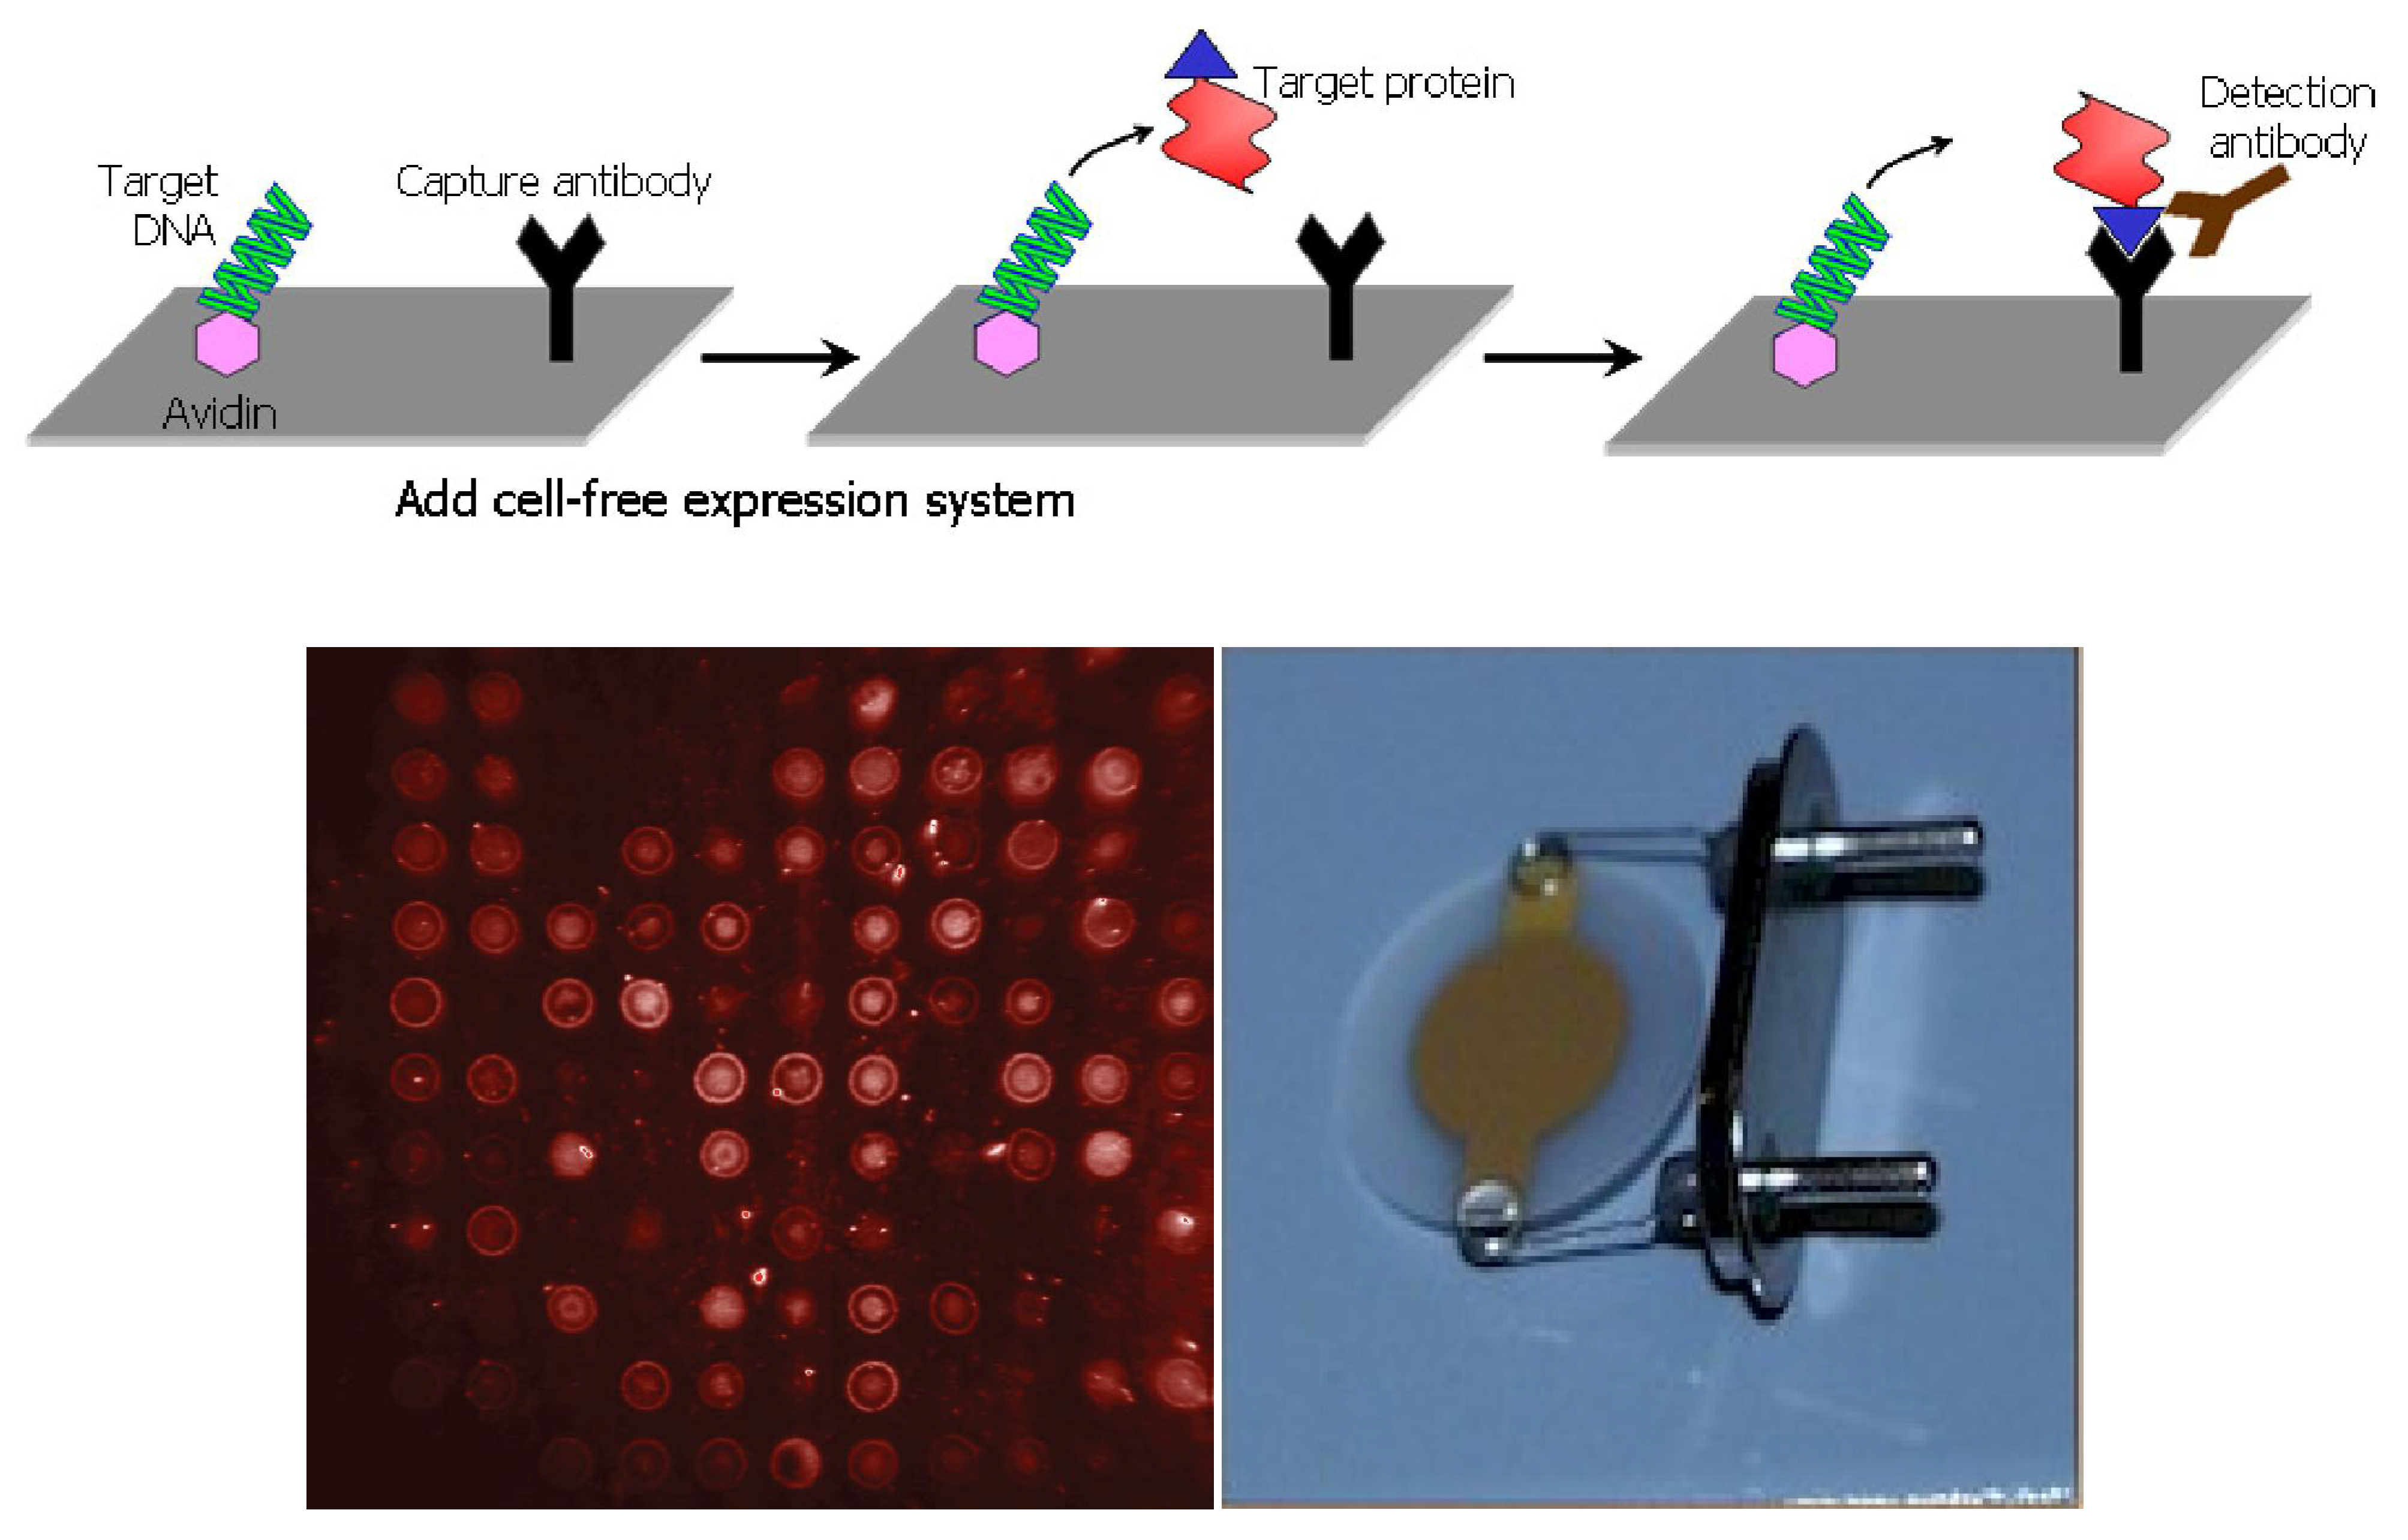
5. Nucleic Acid Programmable Protein Arrays for Nanogravimetric Sensor

- Cytochrome P4501A2 (Cyp1a2 in HIP Plasmid ID Database) for clozapine sensing.
- Cytochrome P450scc or P45011a1 (CYP11A1 in HIP and DNASU Plasmid ID Database) for LDL cholesterol sensing (P450 E468Q).
- Laccase (find the gene in HIP Plasmid ID database) for health relevant compound.
- Lipase (lpl in DNASU database) for clozapine sensing.
- Cytochrome P450 2B4 for styrene sensing.
- Laccase for phenole derivative sensing.
6. Conclusions and Perspective
Acknowledgements
References
- Grasso, V.; Lambertini, V.; Ghisellini, P.; Valerio, F.; Stura, E.; Perlo, P.; Nicolini, C. Nanostructuring of a porous alumina matrix for a biomolecular microarray. Nanotechnology 2006, 17, 795–798. [Google Scholar] [CrossRef]
- Feigel, I.M.; Vedala, H.; Star, A. Biosensors based on one-dimensional nanostructures. J. Mater. Chem. 2011, 21, 8940–8954. [Google Scholar] [CrossRef]
- Zhai, T.; Fang, X.; Liao, M.; Xu, X.; Zeng, H.; Yoshio, B.; Golberg, D. A comprehensive review of one-dimensional metal-oxide nanostructure photodetectors. Sensors 2009, 9, 6504–6529. [Google Scholar] [CrossRef] [PubMed]
- Yeom, S.H.; Kang, B.H.; Kim, K.J.; Kang, S.W. Nanostructures in biosensor—A review. Front. Biosci. 2011, 16, 997–1023. [Google Scholar] [CrossRef]
- Stura, E.; Bruzzese, D.; Valerio, F.; Grasso, V.; Perlo, P.; Nicolini, C. Anodic porous alumina as mechanical stability enhancer for LDL-cholesterol sensitive electrodes. Biosens. Bioelectron. 2007, 23, 655–660. [Google Scholar] [CrossRef] [PubMed]
- Shumyantseva, V.; Carrara, S.; Bavastrello, V.; Jason Riley, D.; Bulko, T.; Skryabin, K.; Archakov, A.; Nicolini, C. Direct electron transfer between cytochrome P450scc and gold nanoparticles on screen-printed rhodium-graphite electrodes. Biosens. Bioelectron. 2005, 21, 217–222. [Google Scholar] [CrossRef] [PubMed]
- Antonini, M.; Ghisellini, P.; Paternolli, C.; Nicolini, C. Electrochemical study of the interaction between cytochrome P450sccK201E and cholesterol. Talanta 2004, 62, 945–950. [Google Scholar] [CrossRef] [PubMed]
- Nicolini, C.; Erokhin, V.; Ghisellini, P.; Paternolli, C.; Ram, M.; Sivozhelezov, V. P450scc engineering and nanostructuring for cholesterol sensing. Langmuir 2001, 17, 3719–3726. [Google Scholar] [CrossRef]
- MacDiarmid, A.; Yang, L.; Huang, W.; Humphrey, B. Polyaniline: Electrochemistry and application to rechargeable batteries. Synth. Met. 1987, 18, 393–398. [Google Scholar] [CrossRef]
- Iijima, S. Helical microtubules of graphitic carbon. Nature 1991, 354, 56–58. [Google Scholar] [CrossRef]
- Dresselhaus, M.; Dresselhaus, G.; Eklund, P. Science of Fullerenes and Carbon Nanotubes; Academic Press: New York, NY, USA, 1996. [Google Scholar]
- Iijima, S.; Brabec, C.; Maiti, A.; Bernholc, J. Structural flexibility of carbon nanotubes. J. Chem. Phys. 1996, 104, 2089–2092. [Google Scholar] [CrossRef]
- Cooper, C.; Young, R.; Halsall, M. Investigation into the deformation of carbon nanotubes and their composites through the use of Raman spectroscopy. Composites A 2001, 32, 401–411. [Google Scholar] [CrossRef]
- Gao, G.; Agin, T.; William, A., III. Energetics, structure, mechanical and vibrational properties of single-walled carbon nanotubes. Nanotechnology 1998, 9, 184–191. [Google Scholar] [CrossRef]
- Coleman, J.; Curran, S.; Dalton, A.; Davey, A.; McCarthy, B.; Blau, W.; Barklie, R. Percolation-dominated conductivity in a conjugated-polymer-carbon-nanotube composite. Phys. Rev. B 1998, 58, 7492–7495. [Google Scholar] [CrossRef]
- Bavastrello, V; Ram, M.; Nicolini, C. Synthesis of multiwalled carbon nanotubes and poly(o-anisidine) nanocomposite material: Fabrication and characterization of its Langmuir-Schaefer films. Langmuir 2002, 18, 1535–1541. [Google Scholar] [CrossRef]
- Valentini, L.; Bavastrello, V.; Stura, E.; Armentano, I.; Nicolini, C.; Kenny, J. Sensors for inorganic vapor detection based on carbon nanotubes and poly(o-anisidine) nanocomposite material. Chem. Phys. Lett. 2004, 383, 617–622. [Google Scholar] [CrossRef]
- Ates, M.; Sarac, A.S. Conducting polymer coated carbon surfaces and biosensor applications. Prog. Org. Coat. 2009, 66, 337–358. [Google Scholar] [CrossRef]
- Macdiarmid, A.G.; Mu, S.-L.; Somasiri, N.L.D.; Wu, W. Electrochemical characteristics of polyaniline cathodes and anodes in aqueous electrolytes. Mol. Cryst. Liq. Cryst. 1985, 121, 187–190. [Google Scholar] [CrossRef]
- Paul, E.; Ricco, A.; Wrighton, M. Resistance of polyaniline films as a function of electrochemical potential and the fabrication of polyaniline-based microelectronic devices. J. Phys. Chem. 1985, 89, 1441–1447. [Google Scholar] [CrossRef]
- Epstein, A.; MacDiarmid, A. Polyaniline: An old polymer with new chemistry, new physics, and potential new technology. In Electronic Properties of Conjugated Polymers III: Basic Models and Applications; Springer-Verlag: Berlin, Germany, 1989; pp. 282–289. [Google Scholar]
- Kobayashi, T.; Yoneyama, H.; Tamura, H. Electrochemical reactions concerned with electrochromism of polyaniline film-coated electrodes. J. Electroanal. Chem. 1984, 177, 281–291. [Google Scholar] [CrossRef]
- Epstein, A.J.; Ginder, J.M.; Zuo, F.; Bigelow, R.W.; Woo, H.-S.; Tanner, D.B.; Richter, A.F.; Huang, W.-S.; MacDiarmid, A.G. Insulator-to-metal transition in polyaniline. Synth. Met. 1987, 18, 303–309. [Google Scholar] [CrossRef]
- Genies, E.M.; Lapkowski, M. Electrochemical in situ per evidence of two polaron-bipolaron states in polyaniline. J. Electroanal. Chem. 1987, 236, 199–208. [Google Scholar] [CrossRef]
- Bavastrello, V.; Stura, E.; Carrara, S.; Erokhin, V.; Nicolini, C. Poly(2,5-dimethylaniline)-MWNTs nanocomposite: A new material for conductometric acid vapours sensor. Sens. Actuators B 2004, 98, 247–253. [Google Scholar] [CrossRef]
- Karyakin, A.; Bobrova, O.; Lukachova, L.; Karyakina, E. Potentiometric biosensors based on polyaniline semiconductor films. Sens. Actuators B 1996, 33, 34–38. [Google Scholar] [CrossRef]
- Lindino, C.; Bulhoes, L. The potentiometric response of chemically modified electrodes. Anal. Chim. Acta 1996, 334, 317–322. [Google Scholar] [CrossRef]
- Ge, Z.; Brown, C.; Sun, L.; Yang, S. Fiber-optic pH sensor based on evanescent wave absorption spectroscopy. Anal. Chem. 1993, 65, 2335–2338. [Google Scholar] [CrossRef]
- Pringsheim, E.; Terpetschnig, E.; Wolfbeis, O. Optical sensing of pH using thin films of substituted polyanilines. Anal. Chim. Acta 1997, 357, 247–252. [Google Scholar] [CrossRef]
- Grummt, U.; Pron, A.; Zagorska, M.; Lefrant, S. Polyaniline based optical pH sensor. Anal. Chim. Acta 1997, 357, 253–259. [Google Scholar] [CrossRef]
- De Oliveira, Z.T.; dos Santos, M.C. Relative stability of polarons and bipolarons in emeraldine oligomers: A quantum chemical study. Solid State Commun. 2000, 114, 49–53. [Google Scholar] [CrossRef]
- Bavastrello, V.; Carrara, S.; Ram, M.; Nicolini, C. Optical and electrochemical properties of poly (O-toluidine) multiwalled carbon nanotubes composite Langmuir-Schaefer films. Langmuir 2004, 20, 969–973. [Google Scholar] [CrossRef] [PubMed]
- Konyushenko, E.; Stejskal, J.; Trchov, M.; Hradil, J.; Kovrov, J.; Prokes, J.; Cieslar, M.; Hwang, J.; Chen, K.; Sapurina, I. Multi-wall carbon nanotubes coated with polyaniline. Polymer 2006, 47, 5715–5723. [Google Scholar] [CrossRef]
- Maser, W.; Benito, A.; Callejas, M.; Seeger, T.; Martinez, M.; Schreiber, J.; Muszynski, J.; Chauvet, O.; Osvath, Z.; Koos, A. Synthesis and characterization of new polyaniline/nanotube composites. Mater. Sci. Eng. C 2003, 23, 87–91. [Google Scholar] [CrossRef]
- Sainz, R.; Benito, A.; Martinez, M.; Galindo, J.; Sotres, J.; Bar, A.; Corraze, B.; Chauvet, O.; Maser, W. Soluble self aligned carbon nanotube/polyaniline composites. Adv. Mater. 2005, 17, 278–281. [Google Scholar] [CrossRef]
- Panhuis, M.; Doherty, K.; Sainz, R.; Benito, A.; Maser, W. Carbon nanotube mediated reduction in optical activity in polyaniline composite materials. J. Phys. Chem. 2008, 112, 441–448. [Google Scholar]
- Valentini, L.; Kenny, J. Novel approaches to developing carbon nanotube based polymer composites: Fundamental studies and nanotech applications. Polymer 2005, 46, 6715–6718. [Google Scholar] [CrossRef]
- Tai, H.; Jiang, Y.; Xie, G.; Yu, J.; Zhao, M. Self-assembly of TiO2/polypyrrole nanocomposite ultrathin films and application for an NH3 gas sensor. Int. J. Environ. Anal. Chem. 2007, 87, 539–551. [Google Scholar] [CrossRef]
- Tawde, S.; Mukesh, D.; Yakhmi, J. Redox behavior of polyaniline as influenced by aromatic sulphonate anions: Cyclic voltammetry and molecular modeling. Synth. Met. 2001, 125, 401–413. [Google Scholar] [CrossRef]
- Bavastrello, V.; Erokhin, V.; Carrara, S.; Sbrana, F.; Ricci, D.; Nicolini, C. Morphology and conductivity in poly(ortho-anisidine)/carbon nanotubes nanocomposite films. Thin Solid Films 2004, 468, 17–22. [Google Scholar] [CrossRef]
- Ram, M.; Adami, M.; Sartore, M.; Salerno, M.; Paddeu, S.; Nicolini, C. Comparative studies on Langmuir-Schaefer films of polyanilines. Synth. Met. 1999, 100, 249–259. [Google Scholar] [CrossRef]
- Athawale, A.; Kulkarni, M. Polyaniline and its substituted derivatives as sensor for aliphatic alcohols. Sens. Actuators B 2000, 67, 173–177. [Google Scholar] [CrossRef]
- Christie, S.; Scorsone, E.; Persaud, K.; Kvasnik, F. Remote detection of gaseous ammonia using the near infrared transmission properties of polyaniline. Sens. Actuators B 2003, 90, 163–169. [Google Scholar] [CrossRef]
- Surwade, S.; Agnihotra, S.; Dua, V.; Manohar, S. Nitrogen dioxide vapor detection using poly-O-toluidine. Sens. Actuators B 2009, 143, 454–457. [Google Scholar] [CrossRef]
- Jin, X.; Yu, L.; Zeng, X. Enhancing the sensitivity of ionic liquid sensors for methane detection with polyaniline template. Sens. Actuators B 2008, 133, 526–532. [Google Scholar] [CrossRef]
- Ram, M.; Yavuz; Lahsangah, V.; Aldissi, M. CO gas sensing from ultrathin nano-composite conducting polymer film. Sens. Actuators B 2005, 106, 750–757. [Google Scholar] [CrossRef]
- Tarachiwin, L.; Kiattibutr, P.; Ruangchuay, L.; Sirivat, A.; Schwank, J. Electrical conductivity response of polyaniline films to ethanol-water mixtures. Synth. Met. 2002, 129, 303–308. [Google Scholar] [CrossRef]
- Sharma, A. Electrochemical synthesis of poly(aniline-co-fluoroaniline) films and their application as humidity sensing material. Thin Solid Films 2009, 517, 3350–3356. [Google Scholar] [CrossRef]
- Wang, S.; Zhang, Q.; Wang, R.; Yoon, S. A novel multi-walled carbon nanotube-based biosensor for glucose detection. Biochem. Biophys. Res. Commun. 2003, 311, 572–576. [Google Scholar] [CrossRef] [PubMed]
- Angaleeswari, B.; Dura Amirtham, R.; Jeevithaa, T.; Vaishnavi, V.; Eevera, T.; Berchmans, S.; Yegnaraman, V. Poly(o-anisidine)-anion composite films as sensing platform for biological molecules. Sens. Actuators B 2008, 129, 558–565. [Google Scholar] [CrossRef]
- Li, G.; Liao, J.; Hu, G.; Ma, N.; Wu, P. Study of carbon nanotube modified biosensor for monitoring total cholesterol in blood. Biosens. Bioelectron. 2005, 20, 2140–2144. [Google Scholar] [CrossRef] [PubMed]
- Timur, S.; Anik, U.; Odaci, D.; Gorton, L. Development of a microbial biosensor based on carbon nanotube (CNT) modified electrodes. Electrochem. Commun. 2007, 9, 1810–1815. [Google Scholar] [CrossRef]
- Nicolini, C.; Erokhin, V.; Antolini, F.; Catasti, P.; Facci, P. Thermal stability of protein secondary structure in Langmuir-Blodgett films. Biochim. Biophys. Acta Gen. Subj. 1993, 1158, 273–278. [Google Scholar] [CrossRef]
- Nicolini, C. Protein-monolayer engineering: principles and application to biocatalysis. Trends Biotechnol. 1997, 15, 395–401. [Google Scholar] [CrossRef]
- Nicolini, C.; Pechkova, E. Structure and growth of ultrasmall protein microcrystals by synchrotron radiation: I. GISAXS and diffraction of P450scc. J. Cell. Biochem. 2006, 97, 544–552. [Google Scholar] [CrossRef] [PubMed]
- Nicolini, C.; Pechkova, E. Nanostructured biofilms and biocrystals. J. Nanosci. Nanotechnol. 2006, 6, 2209–2236. [Google Scholar] [CrossRef] [PubMed]
- Facci, P.; Erokhin, V.; Nicolini, C. Scanning tunnelling microscopy of a monolayer of reaction centres. Thin Solid Films 1994, 243, 403–406. [Google Scholar] [CrossRef]
- Pechkova, E.; Nicolini, C. Protein nanocrystallography: A new approach to structural proteomics. Trends Biotechnol. 2004, 22, 117–122. [Google Scholar] [CrossRef] [PubMed]
- Pechkova, E.; Nicolini, C. Proteomics and Nanocrystallography; Kluwer Academic/Plenum Publishers: New York, NY, USA, 2003. [Google Scholar]
- Pechkova, E.; Tripathi, S.; Ravelli, R.; McSweeney, S.; Nicolini, C. Radiation stability of proteinase K crystals grown by LB nanotemplate method. J. Struct. Biol. 2009, 168, 409–418. [Google Scholar] [CrossRef] [PubMed]
- Sartore, M.; Pace, R.; Faraci, P.; Nardelli, D.; Adami, M.; Ram, M.; Nicolini, C. Controlled-atmosphere chamber for atomic force microscopy investigations. Rev. Sci. Instrum. 2000, 71, 2409–2413. [Google Scholar] [CrossRef]
- Pechkova, E.; Sartore, M.; Giacomelli, L.; Nicolini, C. Atomic force microscopy of protein films and crystals. Rev. Sci. Instrum. 2007, 78, 093704:1–093704:7. [Google Scholar] [CrossRef]
- Riekel, C. New avenues in X-ray microbeam experiments. Rep. Prog. Phys. 2000, 63, 233–262. [Google Scholar] [CrossRef]
- Muller-Buschbaum, P. Grazing incidence small-angle X-ray scattering: An advanced scattering technique for the investigation of nanostructured polymer films. Anal. Bioanal. Chem. 2003, 376, 3–10. [Google Scholar] [PubMed]
- Roth, S.; Burghammer, M.; Riekel, C.; M ller-Buschbaum, P.; Diethert, A.; Panagiotou, P.; Walter, H. Self-assembled gradient nanoparticle-polymer multilayers investigated by an advanced characterization method: Microbeam grazing incidence x-ray scattering. Appl. Phys. Lett. 2003, 82, 1935–1937. [Google Scholar] [CrossRef]
- Pechkova, E.; Tripathi, S.; Nicolini, C. MicroGISAXS of Langmuir-Blodgett protein films: Effect of temperature on long-range order. J. Synchrotron Radiat. 2009, 16, 330–335. [Google Scholar] [CrossRef] [PubMed]
- Gebhardt, R.; Vendrely, C.; Burghammer, M.; Riekel, C. Characterization of the boundary zone of a cast protein drop: Fibroin sheet and nanofibril formation. Langmuir 2009, 25, 6307–6311. [Google Scholar] [CrossRef] [PubMed]
- Pastorino, L.; Berzina, T.; Troitsky, V.; Bernasconi, E.; Nicolini, C. Application of monolayer engineering for immobilization of penicillin G acylase. Colloids Surf. B 2002, 23, 289–293. [Google Scholar] [CrossRef]
- Pastorino, L.; Berzina, T.; Troitsky, V.; Fontana, M.; Bernasconi, E.; Nicolini, C. Biocatalytic Langmuir-Blodgett assemblies based on penicillin G acylase. Colloids Surf. B 2002, 23, 357–363. [Google Scholar] [CrossRef]
- Pechkova, E.; Sivozhelezov, V.; Nicolini, C. Protein thermal stability: The role of protein structure and aqueous environment. Arch. Biochem. Biophys. 2007, 466, 40–48. [Google Scholar] [CrossRef] [PubMed]
- Vilenchik, L.; Griffith, J.; Clair, N.; Navia, M.; Margolin, A. Protein crystals as novel microporous materials. J. Am. Chem. Soc. 1998, 120, 4290–4294. [Google Scholar] [CrossRef]
- Chen, C.; Chang, H.; Shih, J. Optical isomer piezoelectric crystal sensor for l-amino acid esters based on immobilized C60-lipase enzyme. Sens. Actuators B 2007, 123, 1025–1033. [Google Scholar] [CrossRef]
- Gandhi, N. Applications of lipase. J. Am. Chem. Soc. 1997, 74, 621–634. [Google Scholar]
- Moraes, M.L.; Graciano, W.M.; Olivati, C.A.; Oliveira, O.N., Jr; Ferreira, M. Electrical biosensors for triglycerides based on lipase immobilization in layer-by-layer films. In Proceedings of the 11th International Conference in Advanced Materials, Rio De Janeiro, Brazil, 20–25 September 2009.
- Kartal, F.; KilinC, A.; Timur, S. Lipase biosensor for tributyrin and pesticide detection. Int. J. Environ. Anal. Chem. 2007, 87, 715–722. [Google Scholar] [CrossRef]
- Sivozhelezov, V.; Bruzzese, D.; Pastorino, L.; Pechkova, E.; Nicolini, C. Increase of catalytic activity of lipase towards olive oil by Langmuir-film immobilization of lipase. Enzyme Microb. Technol. 2009, 44, 72–76. [Google Scholar] [CrossRef]
- Nicolini, C.; Bruzzese, D.; Sivozhelezov, V.; Pechkova, E. Langmuir-Blodgett based lipase nanofilms of unique structure-function relationship. Biosystems 2008, 94, 228–232. [Google Scholar] [CrossRef] [PubMed]
- Sivozhelezov, V.; Nicolini, C. Theoretical framework for octopus rhodopsin crystallization. J. Theor. Biol. 2006, 240, 260–269. [Google Scholar] [CrossRef] [PubMed]
- Sivozhelezov, V.; Nicolini, C. Prospects for octopus rhodopsin utilization in optical and quantum computation. Phys. Part. Nucl. Lett. 2007, 4, 189–196. [Google Scholar] [CrossRef]
- Bertoncello, P.; Nicolini, D.; Paternolli, C.; Bavastrello, V.; Nicolini, C. Bacteriorhodopsin-based Langmuir-Schaefer films for solar energy capture. IEEE Trans. NanoBioscience 2003, 2, 124–132. [Google Scholar] [CrossRef] [PubMed]
- Koutalos, Y.; Ebrey, T.; Tsuda, M.; Odashima, K.; Lien, T.; Park, M.; Shimizu, N.; Derguini, F.; Nakanishi, K. Regeneration of bovine and octopus opsins in situ with natural and artificial retinals. Biochemistry 1989, 28, 2732–2739. [Google Scholar] [CrossRef] [PubMed]
- Schadel, S.; Heck, M.; Maretzki, D.; Filipek, S.; Teller, D.; Palczewski, K.; Hofmann, K. Ligand channeling within a G-protein-coupled receptor: The entry and exit of retinals in native opsin. J. Biol. Chem. 2003, 278, 24896–24903. [Google Scholar] [CrossRef] [PubMed]
- Pepe, I.; Cugnoli, C. New trends in photobiology: Retinal photoisomerase role in invertebrate visual cells. J. Photochem. Photobiol. B 1992, 13, 5–17. [Google Scholar]
- Terakita, A.; Hara, R.; Hara, T. Retinal-binding protein as a shuttle for retinal in the rhodopsin-retinochrome system of the squid visual cells. Vision Res. 1989, 29, 639–652. [Google Scholar]
- Pepe, I.; Cugnoli, C.; Schwemer, J. Rhodopsin reconstitution in bleached rod outer segment membranes in the presence of a retinal-binding protein from the honeybee. FEBS Lett. 1990, 268, 177–179. [Google Scholar] [CrossRef] [PubMed]
- Molina, T.; Torres, S.; Flores, A.; Hara, T.; Hara, R.; Robles, L. Immunocytochemical localization of retinal binding protein in the octopus retina: A shuttle protein for 11-cis retinal. Exp. Eye Res. 1992, 54, 83–90. [Google Scholar] [CrossRef] [PubMed]
- Paternolli, C.; Neebe, M.; Stura, E.; Barbieri, F.; Ghisellini, P.; Hampp, N.; Nicolini, C. Photoreversibility and photostability in films of octopus rhodopsin isolated from octopus photoreceptor membranes. J. Biomed. Mater. Res. A 2009, 88, 947–951. [Google Scholar] [CrossRef] [PubMed]
- Kusumi, A.; Ohnishi, S.; Tsuda, M. Light-induced conformational change of octopus rhodopsin as detected by a spin label method. Biochem. Biophys. Res. Commun. 1980, 95, 1635–1641. [Google Scholar] [CrossRef] [PubMed]
- Ostrovsky, M.; Weetall, H. Octopus rhodopsin photoreversibility of a crude extract from whole retina over several weeks’ duration. Biosens. Bioelectron. 1998, 13, 61–65. [Google Scholar] [CrossRef]
- Tsuda, M.; Tsuda, T.; Terayama, Y.; Fukada, Y.; Akino, T.; Yamanaka, G.; Stryer, L.; Katada, T.; Ui, M.; Ebrey, T. Kinship of cephalopod photoreceptor G-protein with vertebrate transducin. FEBS Lett. 1986, 198, 5–10. [Google Scholar] [CrossRef]
- Laemmli, U. Cleavage of structural proteins during the assembly of the head of bacteriophage T4. Nature 1970, 227, 680–685. [Google Scholar] [CrossRef] [PubMed]
- Vergani, L.; Canneva, F.; Ghisellini, P.; Nicolini, C. Expression, purification, and structural characterization of human histone H4. Protein Express. Purif. 2002, 24, 420–428. [Google Scholar] [CrossRef]
- Kito, Y.; Naito, T.; Nashima, K. Purification of squid and octopus rhodopsin. Method. Enzymol. 1982, 81, 167–171. [Google Scholar]
- Ashida, A.; Matsumoto, K.; Ebrey, T.; Tsuda, M. A purified agonist-activated G-protein coupled receptor: truncated octopus acid metarhodopsin. Zool. Sci. 2004, 21, 245–250. [Google Scholar] [CrossRef] [PubMed]
- Maccioni, E.; Radicchi, G.; Erokhin, V.; Paddeu, S.; Facci, P.; Nicolini, C. Bacteriorhodopsin thin film as a sensitive layer for an anaesthetic sensor. Thin Solid Films 1996, 284-285, 898–900. [Google Scholar]
- Nicolini, C.; Erokhin, V.; Facci, P.; Rossi, A.; Guerzoni, S.; Paschkevitch, P. DNA based multiquartz sensor. Biosens. Bioelectron. 1997, 12, 613–618. [Google Scholar] [CrossRef] [PubMed]
- Rosenberger, R. Translational errors during recombinant protein synthesis. Dev. Biol. Stand. 1994, 83, 21–26. [Google Scholar] [PubMed]
- Hoffmann, F.; Rinas, U. Role of heat shock protein in the production of recombinant proteins in Escherichia coli. Adv. Biochem. Eng. Biotecnol. 2004, 89, 143–161. [Google Scholar]
- Light, D.; Orme-Johnson, N. Beef adrenal cortical cytochrome P-450 which catalyzes the conversion of cholesterol to pregnenolone. Oxidation-reduction potentials of the free, steroid-complexed and adrenodoxin-complexed P-450. J. Biol. Chem. 1981, 256, 343–350. [Google Scholar] [PubMed]
- Lambeth, J.; Kriengsiri, S. Cytochrome P-450scc-adrenodoxin interactions. Ionic effects on binding, and regulation of cytochrome reduction by bound steroid substrates. J. Biol. Chem. 1985, 260, 8810–8816. [Google Scholar] [PubMed]
- Hannemann, F.; Rottmann, M.; Schiffler, B.; Zapp, J.; Bernhardt, R. The loop region covering the iron-sulfur cluster in bovine adrenodoxin comprises a new interaction site for redox partners. J. Biol. Chem. 2001, 276, 1369–1375. [Google Scholar] [CrossRef] [PubMed]
- Shumyantseva, V.; Bulko, T.; Usanov, S.; Schmid, R.; Nicolini, C.; Archakov, A. Construction and characterization of bioelectrocatalytic sensors based on cytochromes P450. J. Inorg. Biochem. 2001, 87, 185–190. [Google Scholar] [CrossRef] [PubMed]
- Ghisellini, P.; Paternolli, C.; Antonini, M.; Nicolini, C. P450scc mutant nanostructuring for optimal assembly. IEEE Trans. NanoBioscience 2004, 3, 121–128. [Google Scholar] [CrossRef] [PubMed]
- Sivozhelezov, V.; Nicolini, C. Homology modeling of cytochrome P450scc and the mutations for optimal amperometric sensor. J. Theor. Biol. 2005, 21, 479–485. [Google Scholar] [CrossRef]
- Nicolini, C.; Erokhin, V.; Ghisellini, P.; Paternolli, C.; Ram, M.K.; Sivozhelezov, V. P450scc engineering and nanostructuring for cholesterol sensing. Langmuir 2001, 17, 3719–3726. [Google Scholar] [CrossRef]
- Cretich, M.; Damin, F.; Pirri, G.; Chiari, M. Protein and peptide arrays: Recent trends and new directions. Biomol. Eng. 2006, 23, 77–88. [Google Scholar] [CrossRef] [PubMed]
- Spera, R.; Nicolini, C. NAPPA microarrays and mass spectrometry: New trends and challenges. In Essential in Nanoscience Booklet Series; Taylor and Francis: London, UK, 2008. [Google Scholar]
- Predki, P. Functional protein microarrays: Ripe for discovery. Curr. Opin. Chem. Biol. 2004, 8, 8–13. [Google Scholar] [CrossRef] [PubMed]
- Tomizaki, K.; Usui, K.; Mihara, H. Protein detecting microarrays: Current accomplishments and requirements. Chem. Biochem. 2005, 6, 782–799. [Google Scholar]
- Angenendt, P. Progress in protein and antibody microarray technology. Drug Discov. Today 2005, 10, 503–511. [Google Scholar] [CrossRef] [PubMed]
- Templin, M.F.; Stoll, D.; Schwenk, J.M.; Pötz, O.; Kramer, S.; Joos, T. Protein microarrays: Promising tools for proteomic research. Proteomics 2003, 3, 2155–2166. [Google Scholar] [CrossRef] [PubMed]
- Merkel, J.; Michaud, G.; Salcius, M.; Schweitzer, B.; Predki, P. Functional protein microarrays: Just how functional are they? Curr. Opin. Biotechnol. 2005, 16, 447–452. [Google Scholar] [CrossRef] [PubMed]
- Ramachandran, N.; Larson, D.; Stark, P.; Hainsworth, E.; LaBaer, J. Emerging tools for real time label free detection of interactions on functional protein microarrays. FEBS J. 2005, 272, 5412–5425. [Google Scholar] [CrossRef] [PubMed]
- Ramachandran, N.; Hainsworth, E.; Bhullar, B.; Eisenstein, S.; Rosen, B.; Lau, A.; Walter, J.; LaBaer, J. Self-assembling protein microarrays. Science 2004, 305, 86–90. [Google Scholar] [CrossRef] [PubMed]
- Espina, V.; Dettloff, K.; Cowherd, S.; Petricoin III, E.; Liotta, L. Use of proteomic analysis to monitor responses to biological therapies. Expert Opin. Biol. Ther. 2004, 4, 83–93. [Google Scholar] [CrossRef] [PubMed]
- LaBaer, J.; Ramachandran, N. Protein microarrays as tools for functional proteomics. Curr. Opin. Chem. Biol. 2005, 9, 14–19. [Google Scholar] [CrossRef] [PubMed]
- Nelson, R.; Nedelkov, D.; Tubbs, K. Biosensor chip mass spectrometry: A chip-based proteomics approach. Electrophoresis 2000, 21, 1155–1163. [Google Scholar] [CrossRef] [PubMed]
- Spera, R.; Badino, F.; Hainsworth, E.; Fuentes, M.; Srivastava, S.; LaBaer, J.; Nicolini, C. Label-free detection of NAPPA via mass spectrometry. In Functional Proteomics and Nanotechnology-based Microarrays; Nicolini, C., LaBaer, J., Eds.; Pan Stanford Publishing: Singapore, 2010; Volume 2, Chapter 3; pp. 61–78. [Google Scholar]
- Ramachandran, N.; Raphael, J.; Hainsworth, E.; Demirkan, G.; Fuentes, M.; Rolfs, A.; Hu, Y.; LaBaer, J. Next-generation high-density self-assembling functional protein arrays. Nat. Methods 2008, 5, 535–538. [Google Scholar] [CrossRef] [PubMed]
- Spera, R.; Labaer, J.; Nicolini, C. MALDI-TOF analysis of NAPPA. J. Mass Spectrom. 2011, in press. [Google Scholar]
- Ji, Q.; Honma, I.; Paek, S.M.; Akada, M.; Hill, J.P.; Vinu, A.; Ariga, K. Layer-by-layer films of graphene and ionic liquids for highly selective gas sensing. Angew. Chem. Int. Ed. Engl. 2010, 10, 9737–9739. [Google Scholar] [CrossRef]
- Mori, T.; Okamoto, K.; Endo, H.; Hill, J.P.; Shinoda, S.; Matsukura, M.; Tsukube, H.; Suzuki, Y.; Kanekiyo, Y.; Ariga, K. Mechanical tuning of molecular recognition to discriminate the single-methyl-group difference between thymine and uracil. J. Am. Chem. Soc. 2010, 132, 12868–12870. [Google Scholar] [CrossRef] [PubMed]
- Mori, T.; Okamoto, K.; Endo, H.; Sakakibara, K.; Hill, J.P.; Shinoda, S.; Matsukura, M.; Tsukube, H.; Suzuki, Y.; Kanekiyo, Y.; Ariga, K. Mechanical tuning of molecular machines for nucleotide recognition at the air-water interface. Nanoscale Res. Lett. 2011, 6, 1–6. [Google Scholar] [CrossRef]
© 2011 by the authors; licensee MDPI, Basel, Switzerland. This article is an open access article distributed under the terms and conditions of the Creative Commons Attribution license (http://creativecommons.org/licenses/by/3.0/).
Share and Cite
Nicolini, C.; Sivozhelezov, V.; Bavastrello, V.; Bezzerra, T.; Scudieri, D.; Spera, R.; Pechkova, E. Matrices for Sensors from Inorganic, Organic, and Biological Nanocomposites. Materials 2011, 4, 1483-1518. https://doi.org/10.3390/ma4081483
Nicolini C, Sivozhelezov V, Bavastrello V, Bezzerra T, Scudieri D, Spera R, Pechkova E. Matrices for Sensors from Inorganic, Organic, and Biological Nanocomposites. Materials. 2011; 4(8):1483-1518. https://doi.org/10.3390/ma4081483
Chicago/Turabian StyleNicolini, Claudio, Victor Sivozhelezov, Valter Bavastrello, Tercio Bezzerra, Dora Scudieri, Rosanna Spera, and Eugenia Pechkova. 2011. "Matrices for Sensors from Inorganic, Organic, and Biological Nanocomposites" Materials 4, no. 8: 1483-1518. https://doi.org/10.3390/ma4081483