2. Experimental
P-type La
1.98Sr
0.02CuO
4 [
15] and
n-type CaMn
0.98Nb
0.02O
3 [
16] materials are used to build a series of four-leg thermoelectric oxide modules with leg lengths of 4, 5 and 10 mm, respectively. The materials were prepared by a chimie douce synthesis procedure previously described [
17]. The main advantage of this synthesis method, compared to the conventional solid state reaction method, is the homogeneity and purity of the product. The
p- and
n-type powders were characterized by X-Ray Diffraction (XRD) [
15,
16]. The powders were pressed into disc-shaped pellets with a diameter of 20 mm using a hydrostatic press (up to 200 kPa pressure). The
p- and
n-type pellets were sintered for 16 h at 1,373 K and 1,523 K, respectively.
The electrical resistivity and the Seebeck coefficient were measured with a RZ2001i Ozawa Science measurement system. The thermal conductivity was evaluated indirectly by separate measurements of the thermal diffusivity (Netzsch LFA apparatus) and the specific heat (Netzsch DSC apparatus). The electric and thermal transport properties were measured in the temperature range of 300 K < T < 800 K. A detailed description of the TE measurements is reported in [
18].
The four–leg thermoelectric oxide modules were assembled by connecting the
p- and
n-type legs electrically in series and pressing them between two electrically insulated and thermally conductive Al
2O
3 layers [
19]. A series of TOMs with different
A/l ratio (
A is the cross-section area and
l is the leg length) were prepared. To Each leg had a surface area of ~ 4.5 × 4.5 mm
2 to get an
A/l ratio which differs from ~ 2 mm to 5 mm. For validation of the experiment two of the TOMs with the same leg length were mounted and tested. The thermal contacts were provided by two Al
2O
3 substrates [
19].The electrical contacts between the legs and the Al
2O
3 layers were made by brazing with a 0.1 mm thick Ag sheet by means of a conductor paste (DuPont). The TOMs were coated on the hot side by a homogeneous black graphite layer (
Figure 1a) in order to increase the absorption of solar radiation by improving the emissivity (
ε). The 5 mm TOM 1 without coating as well as the 5 mm TOM 4 coated by SiC were measured for comparison. All the TOMs are summarized in
Table 1.
Figure 1.
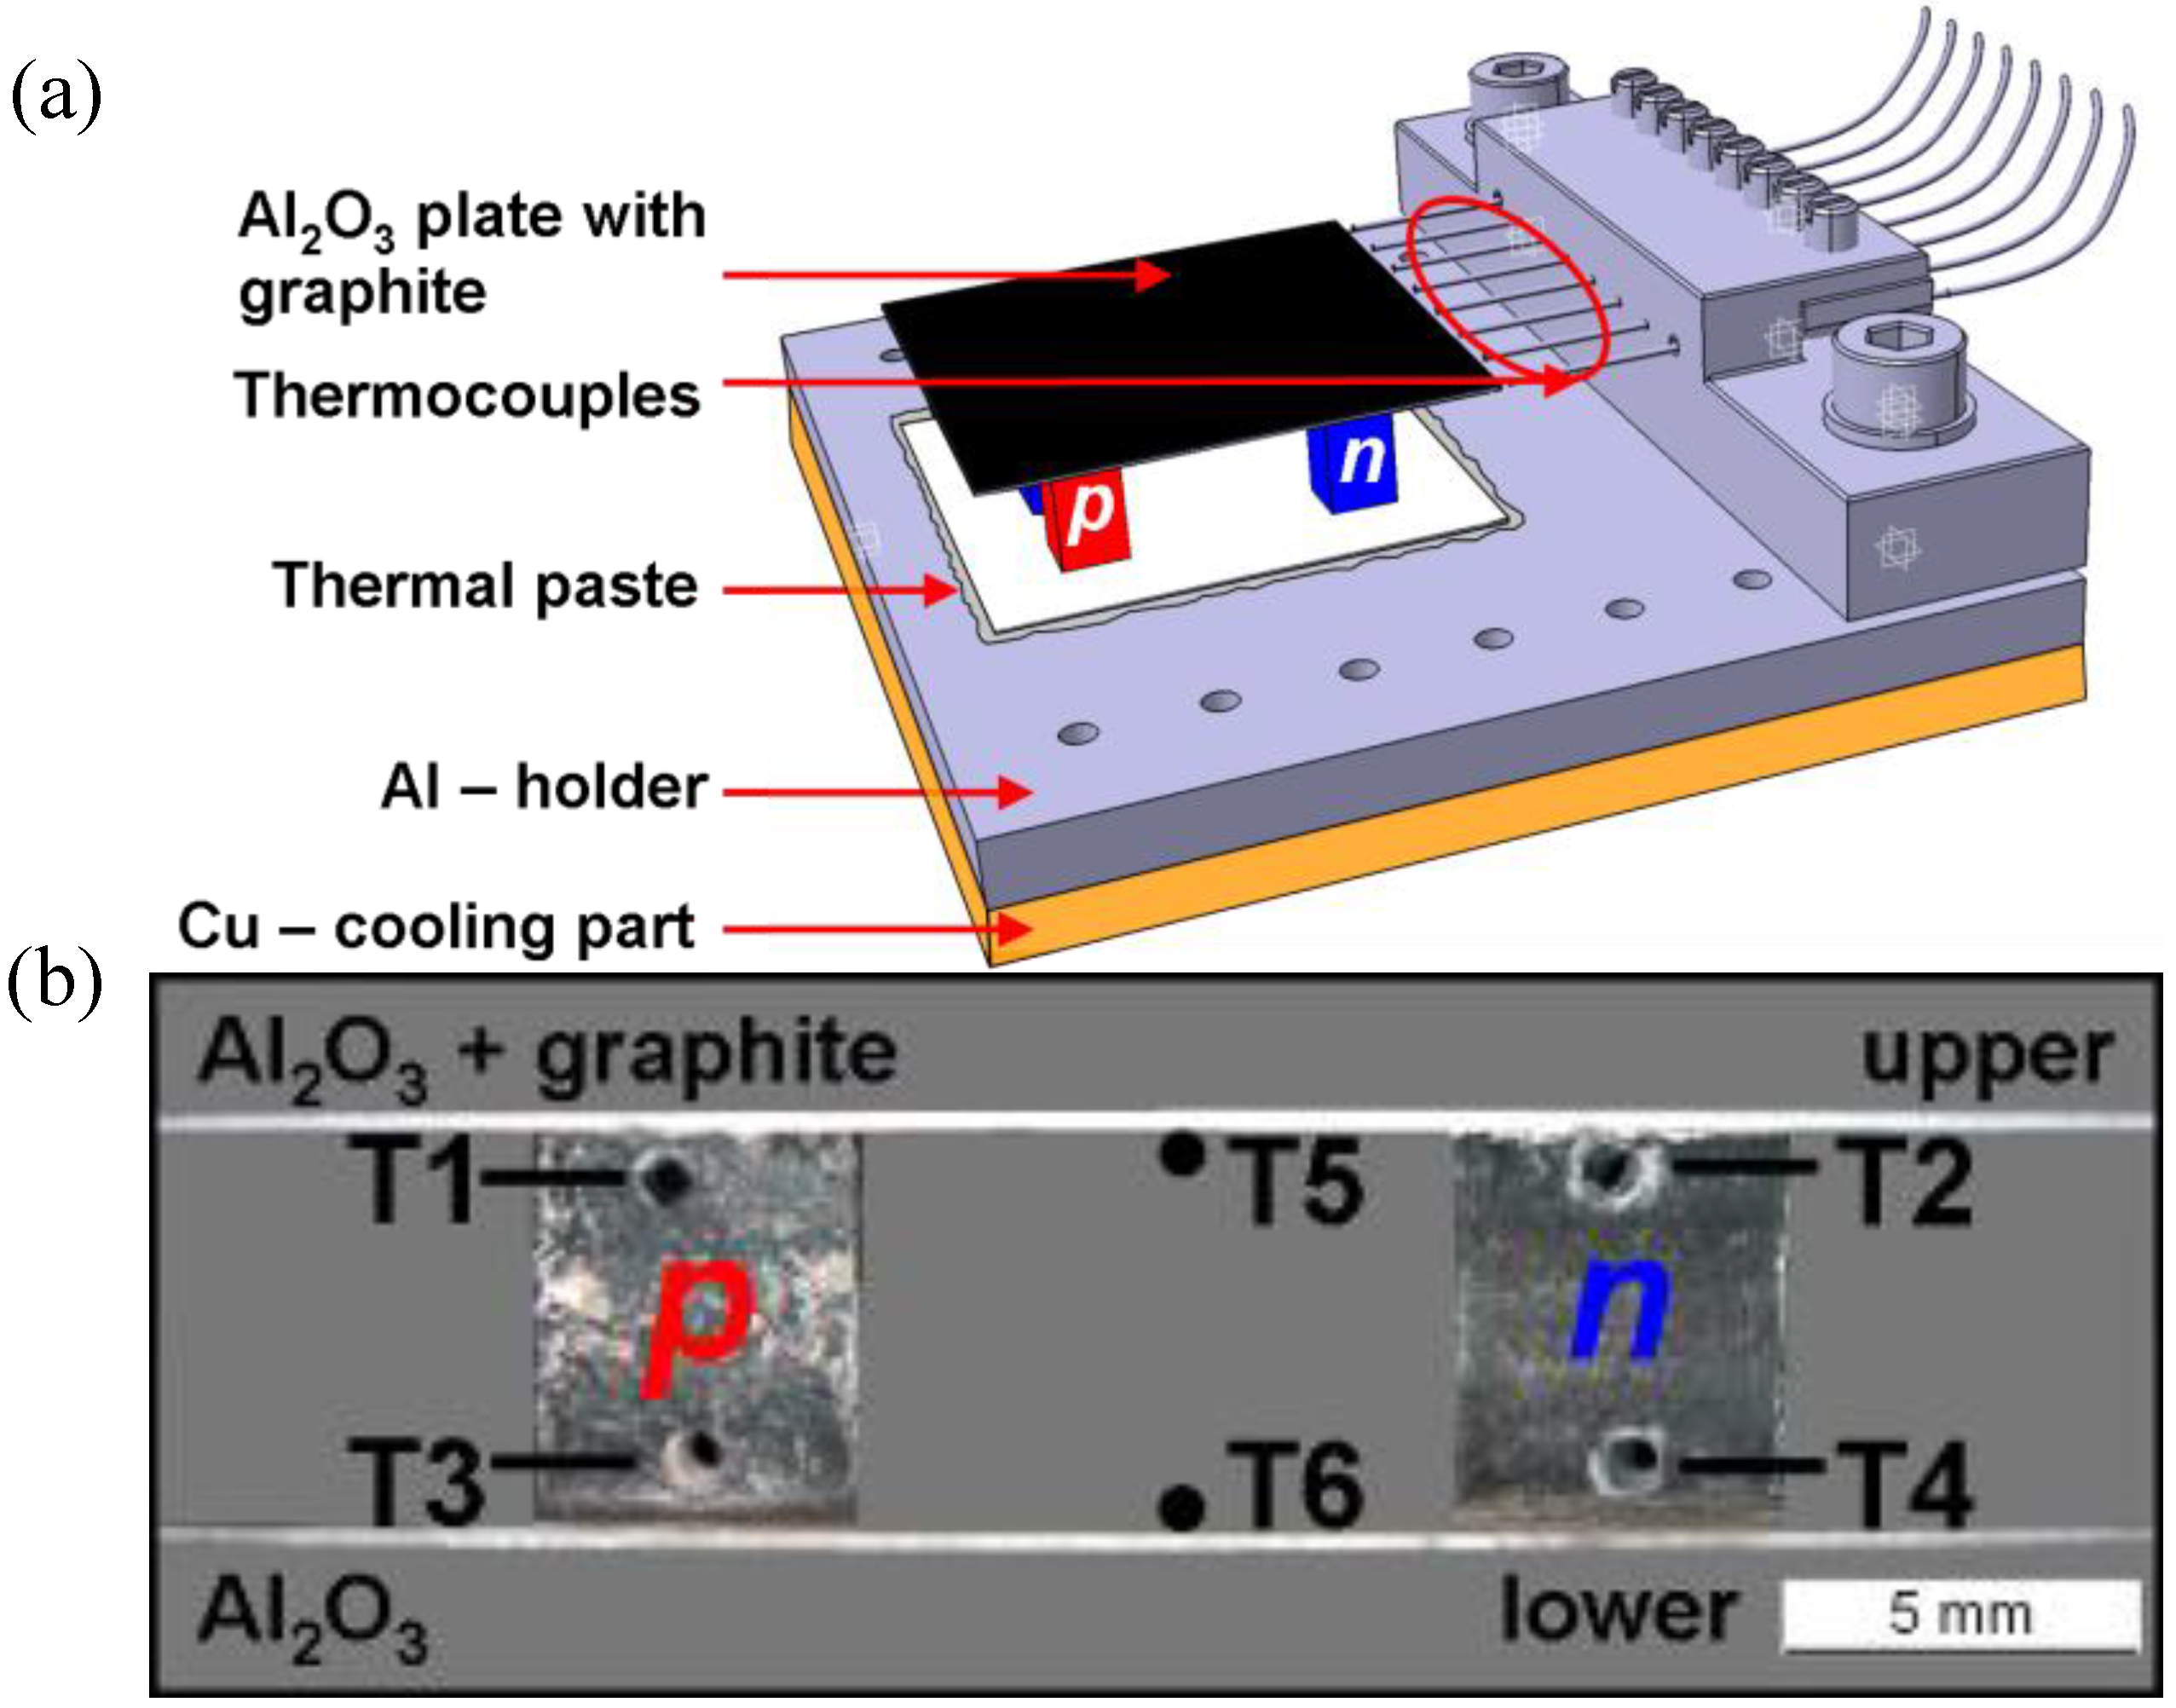
(a) Sketch of a TOM testing unit mounted on the Al-holder for the thermocouples and glued on the Cu–cooling part by means of thermal paste. The hot Al2O3 layer of the four - leg TOM is coated by a graphite layer. (b) Positions of the thermocouples in a cross-sectional profile of the 5mm TOM. 0.5 mm K—type thermocouples were placed in drilled holes.
Figure 1.
(a) Sketch of a TOM testing unit mounted on the Al-holder for the thermocouples and glued on the Cu–cooling part by means of thermal paste. The hot Al2O3 layer of the four - leg TOM is coated by a graphite layer. (b) Positions of the thermocouples in a cross-sectional profile of the 5mm TOM. 0.5 mm K—type thermocouples were placed in drilled holes.
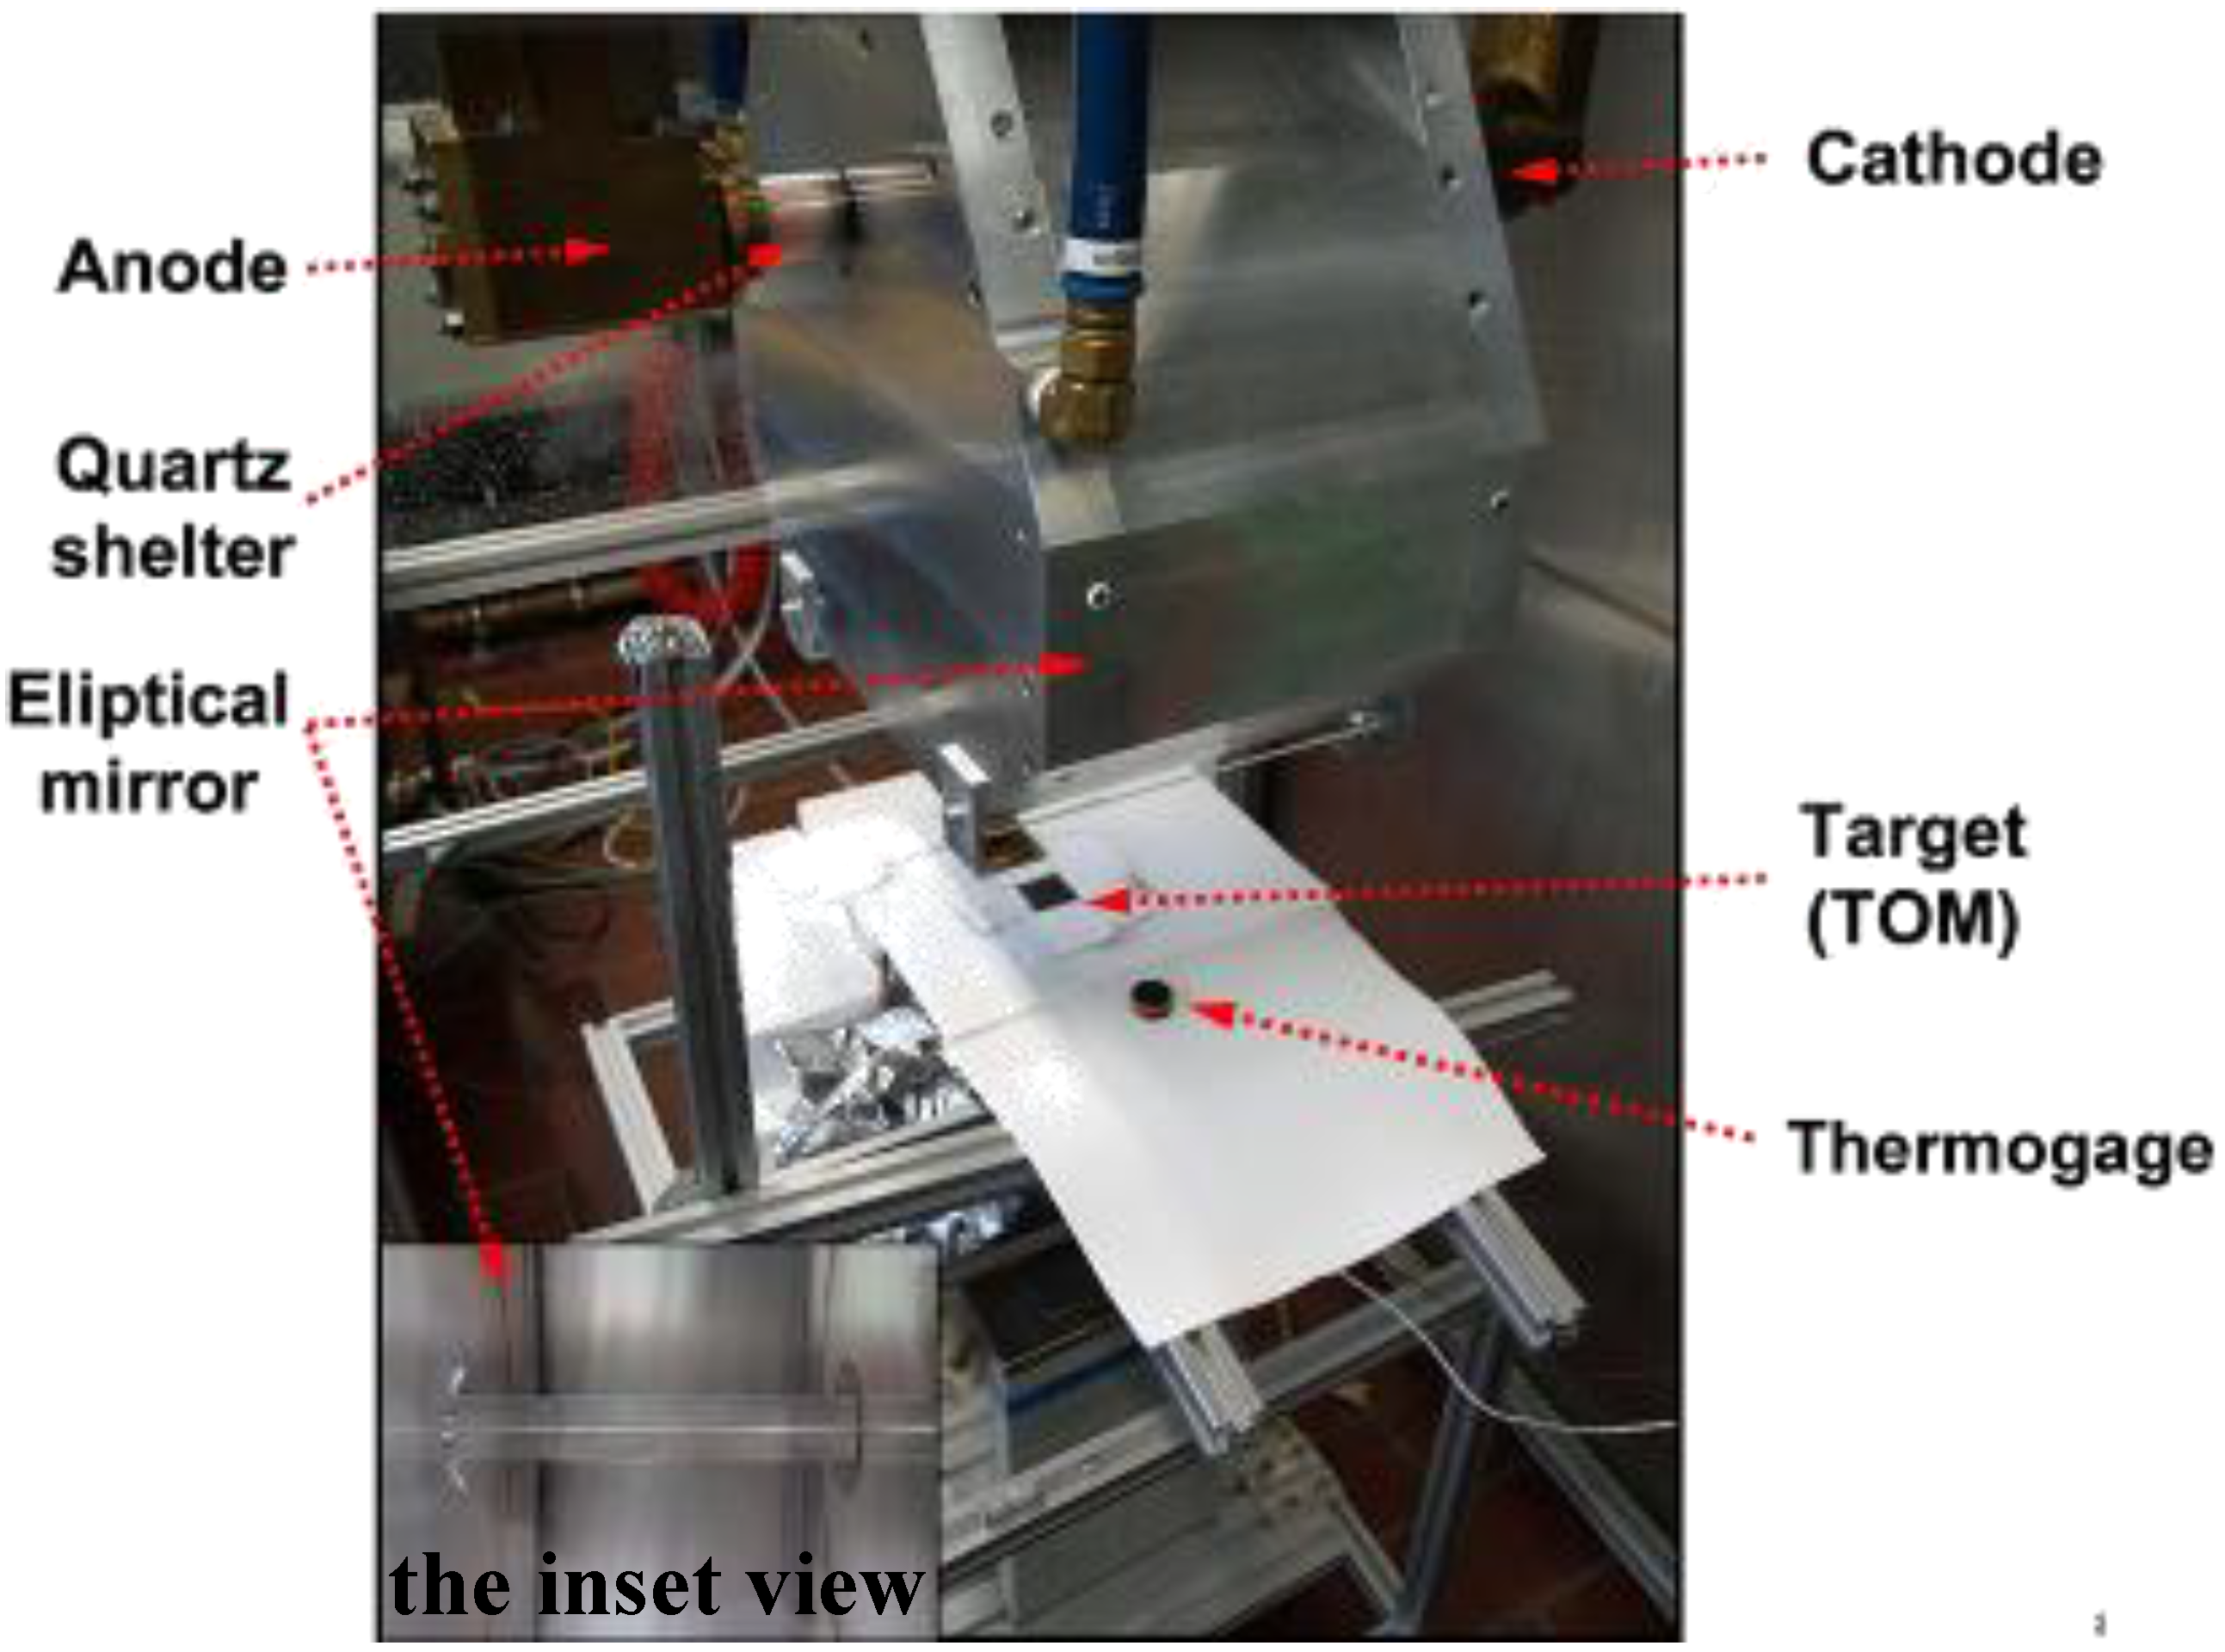
A HFSS was used as heat source (
Figure 2) [
20]. A water-cooled high-pressure argon arc lamp, enclosed in a quartz tube produces radiation in the visible, infrared and ultraviolet region. The power flux intensity and the temperature can be adjusted by varying the position of the target along the axis of the focusing mirrors or by changing the electrical input power at the arc electrodes. The HFSS is able to supply a flux intensity above 500 W cm
-2 and to provide temperatures above 3000 K. The input heat fluxes (0–14.4 W cm
-2) were measured by a water cooled Thermogage Circular Foil Heat Flux Transducer TG1000-1 (Vatell Corporation) with a calibration range between 0–179 W cm
-2, a sensor sensitivity of 0.084 mV W
-1 cm
-2 and a sensor emissivity of 0.97.
The bottom side of the TOM was cooled by cold water circulating in a Cu block. TOMs were attached to the Al–holder using a thermally conductive paste (DuPont
TM) in order to increase the heat transfer from the cold Al
2O
3 layer to the Al–holder. The Al–holder itself was placed on the Cu block cooling unit with surface area of 50 × 50 mm
2 (
Figure 1a).
A series of the 0.5 mm thick K-type thermocouples were used to measure the temperature on the hot and cold side of the TOM as well as in the
p- and
n-type legs. One thermocouple was attached to the hot and cold Al
2O
3 absorber layer, respectively, and two to each TE leg by means of drilled holes with 0.6 mm in diameter (
Figure 1b). The measurement accuracy of the temperature is limited by the thickness and position of the thermocouples. As the thickness of the thermocouple
d is 0.25 mm, the measurement error of the temperature is: δT = δd*(ΔT/ Δd).
Typical measurement started by applying different heat fluxes until the temperatures at the TOM showed steady state behavior. The man value temperatures were evaluated from the time dependence of temperatures for the given heat fluxes. The voltages in the open circuit mode, the load resistances and the temperatures on the hot and cold side of the TOMs and the Al2O3 substrates were recorded simultaneously.
A test unit with a data logger was used to measure the voltage in an open circuit mode and under load resistances. The test unit consisted of four resistances connected in parallel to yield 10 loads and a digital multimeter to measure the voltages. The measurements were monitored using the software LABVIEW. The output power was calculated from the voltage and load resistance values.
Figure 2.
The High-Flux Solar Simulator at ETH: An elliptical mirror redirects the radiant power of the enclosed argon arc lamp onto the target (TOM).
Figure 2.
The High-Flux Solar Simulator at ETH: An elliptical mirror redirects the radiant power of the enclosed argon arc lamp onto the target (TOM).
3. Results and Discussion
The
p- and
n- type TE materials were hydrostatically pressed into pellets. They showed 90% of the theoretical density without any crack formation due to the uniformly applied pressure. A high density of the TE legs is required in order to increase the electrical conductivity and to ensure a sufficient mechanical stability of the TE modules. The thermoelectrical properties of the materials are summarized in
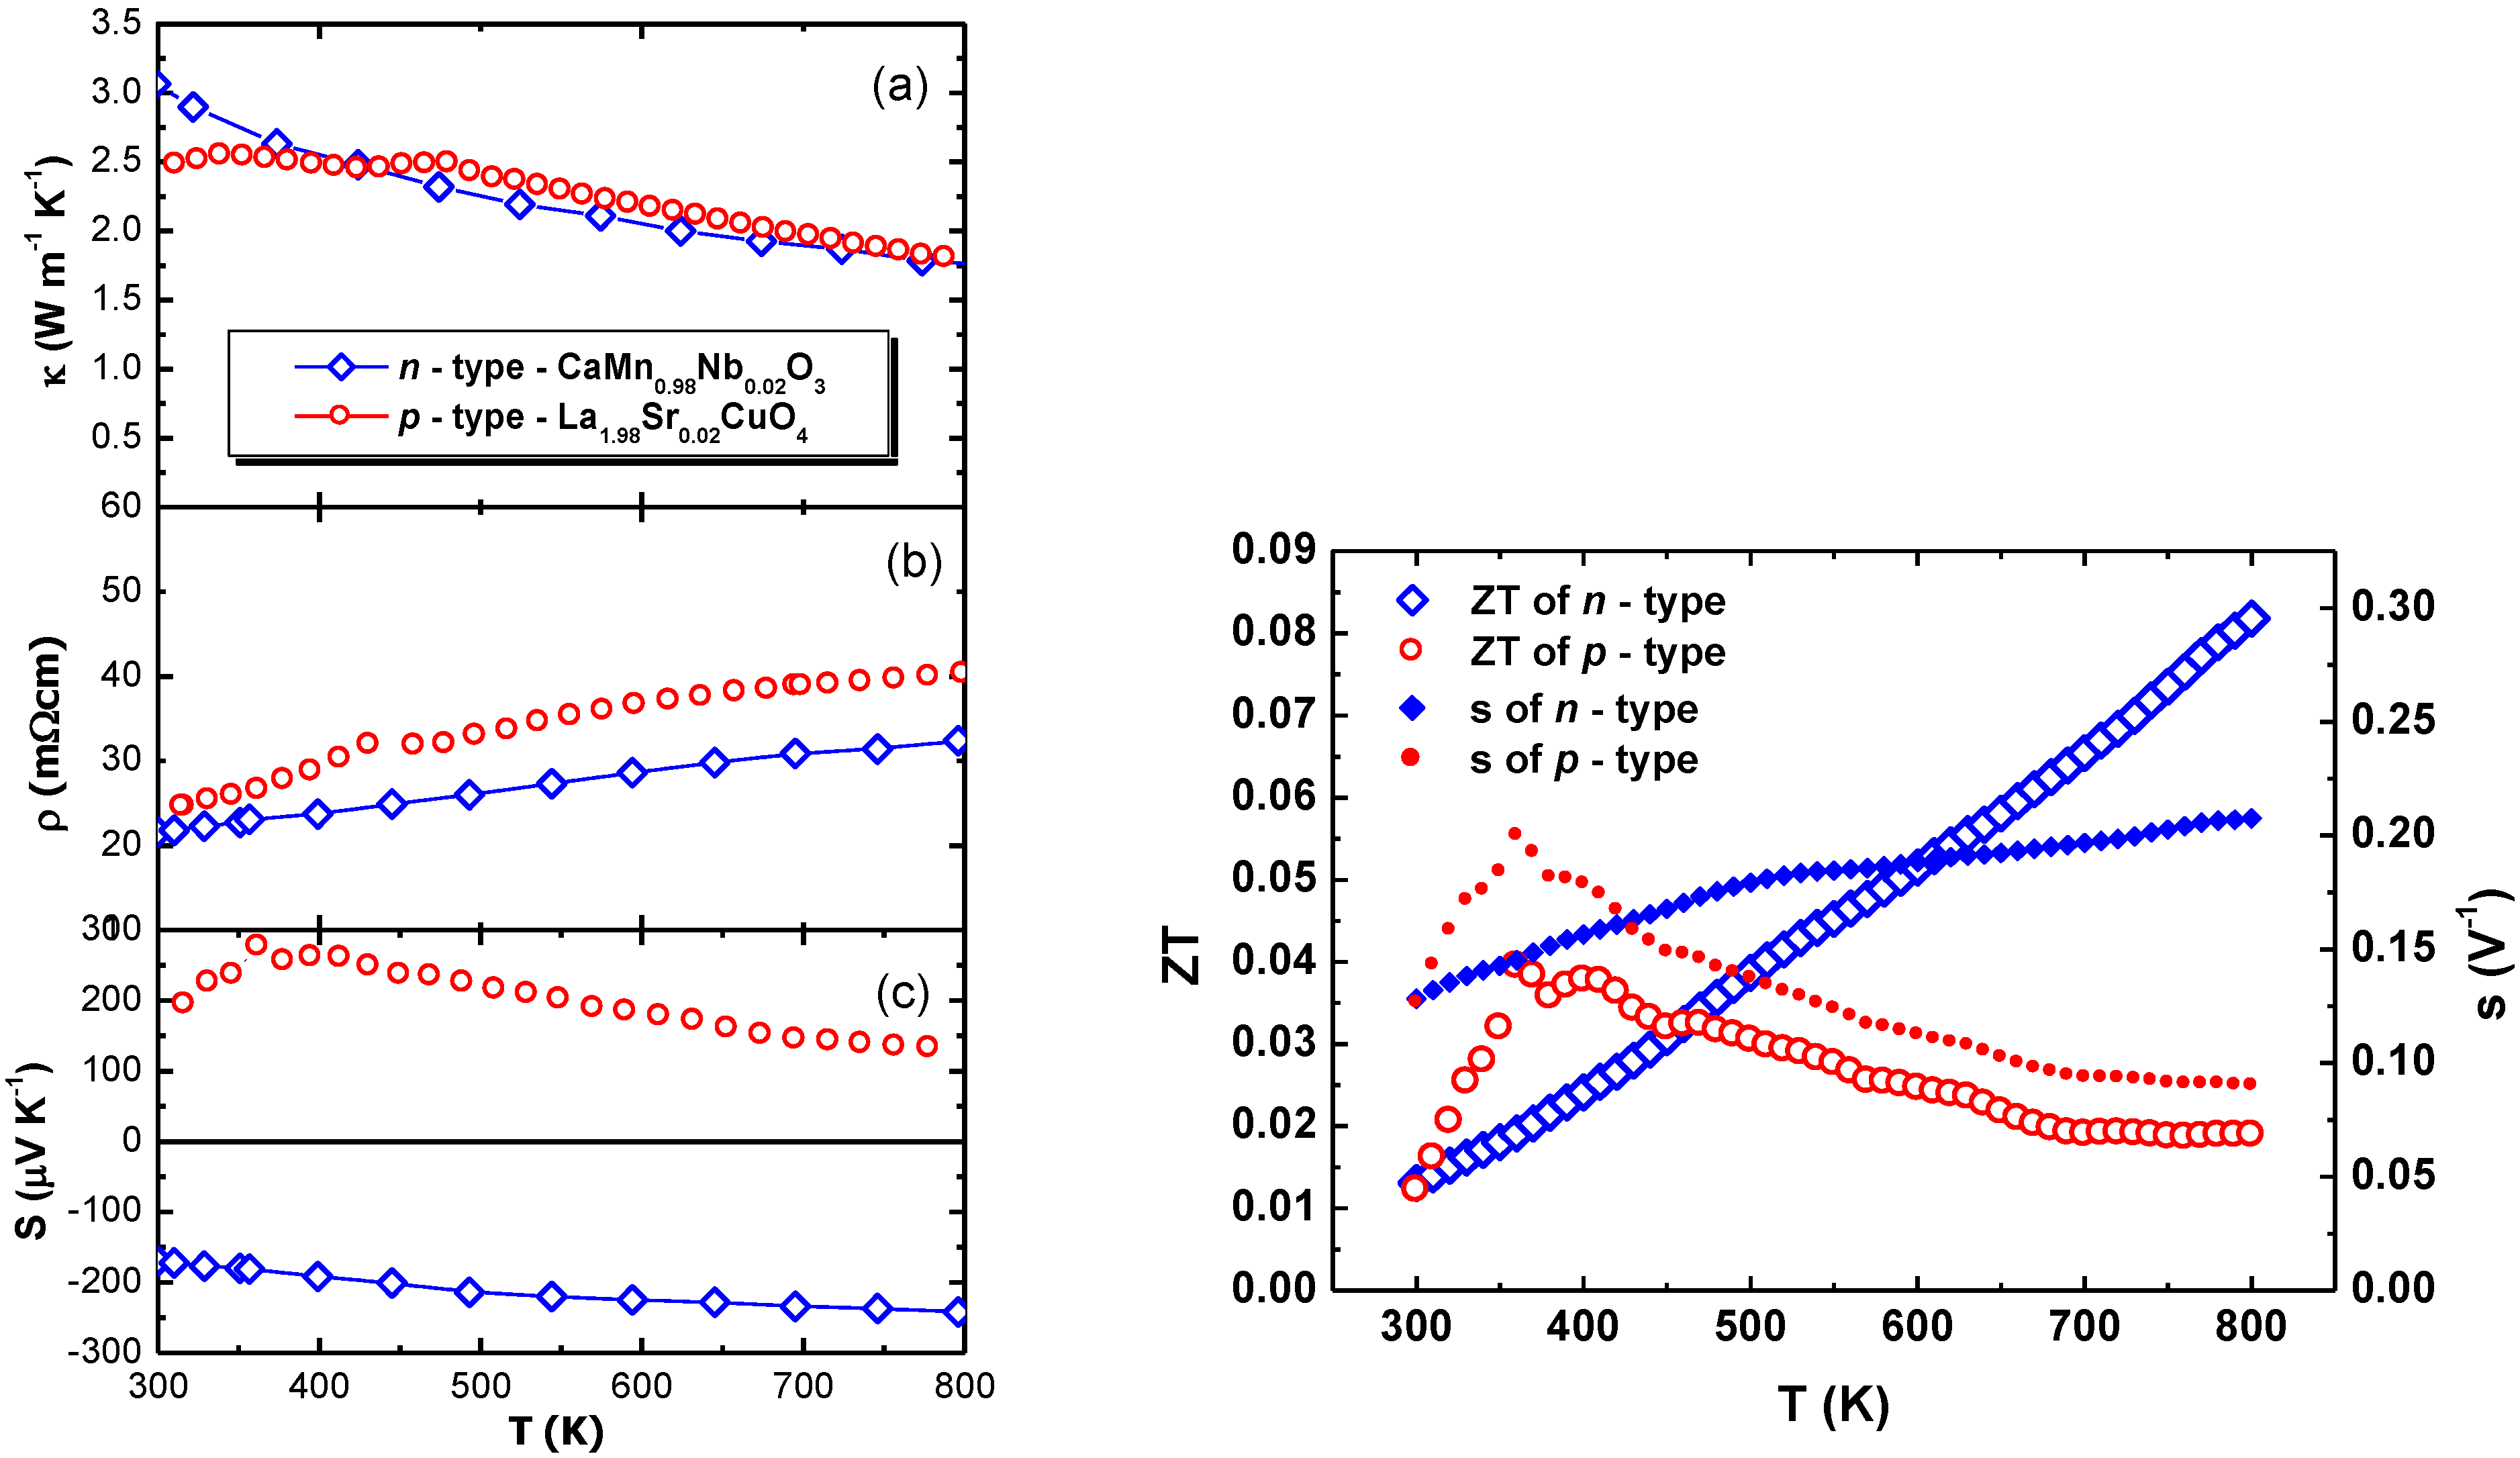
Figure 3. The
p- and
n-type materials had thermal conductivities of 2.5 W m
-1 K
-1 and 3 W m
-1 K
-1 above 300 K, respectively. Bocher
et al. [
21] measured a thermal conductivity 0.78 W m
-1 K
-1 lower above 300 K for the
n-type material. The difference between the data can be attributed to modified synthesis conditions in order to obtain dense TE legs with good mechanical properties. A shorter sintering time and a lower sintering temperature (T = 1,473 K) resulted in samples with 80.77% of the theoretical density. In our case, the density exceeds 90% of the theoretical density. Further research on the relation between thermal conductivity and mechanical stability of the TE materials is needed.
Similar thermoelectric properties of the materials are a prerequisite for good conversion efficiencies of TE modules as was described previously by Snyder
et al. [
22]. The compatibility factor
s, defined as:
is used to assess the similarity of the TE properties of different material. For maximum conversion efficiencies of the thermoelectric modules at large temperature gradients, the compatibility factor should not vary much with temperature [
22]. Both, the
p- and the
n-type legs show similar metallic electrical resistivity values of
ρp = 24 mΩ cm and
ρn = 20 mΩ cm at T = 300 K, respectively. Both materials exhibit a large thermopower (
Sp = +200 μV K
-1 and
Sn = -160 μV K
-1) at T = 300 K.
In
Figure 3d, the open symbols show the temperature dependence of the Figure of Merit
ZT for the
p- and
n-type material. In the temperature range of 300 K–450 K the
p-type material has a higher
ZT than the
n-type material due to its higher Seebeck coefficient. At T > 400 K the
ZT of the
p-type material decreases which is correlated to a decrease of the Seebeck coefficient (
S ~ 130 μV K
-1 at 800 K) while the
ZT of the
n-type material still increases due to
S ~ -240 μV K
-1 in the same temperature region. The closed symbols in
Figure 3d show the temperature dependence of the compatibility factor
s. The compatibility factors of both materials are perfectly matching around T = 425 K but differ by a factor of 1.3 at T = 500 K and by a factor of 2.3 at T = 800 K. This implies a decrease of the conversion efficiency of the four–leg modules at high temperature gradients.
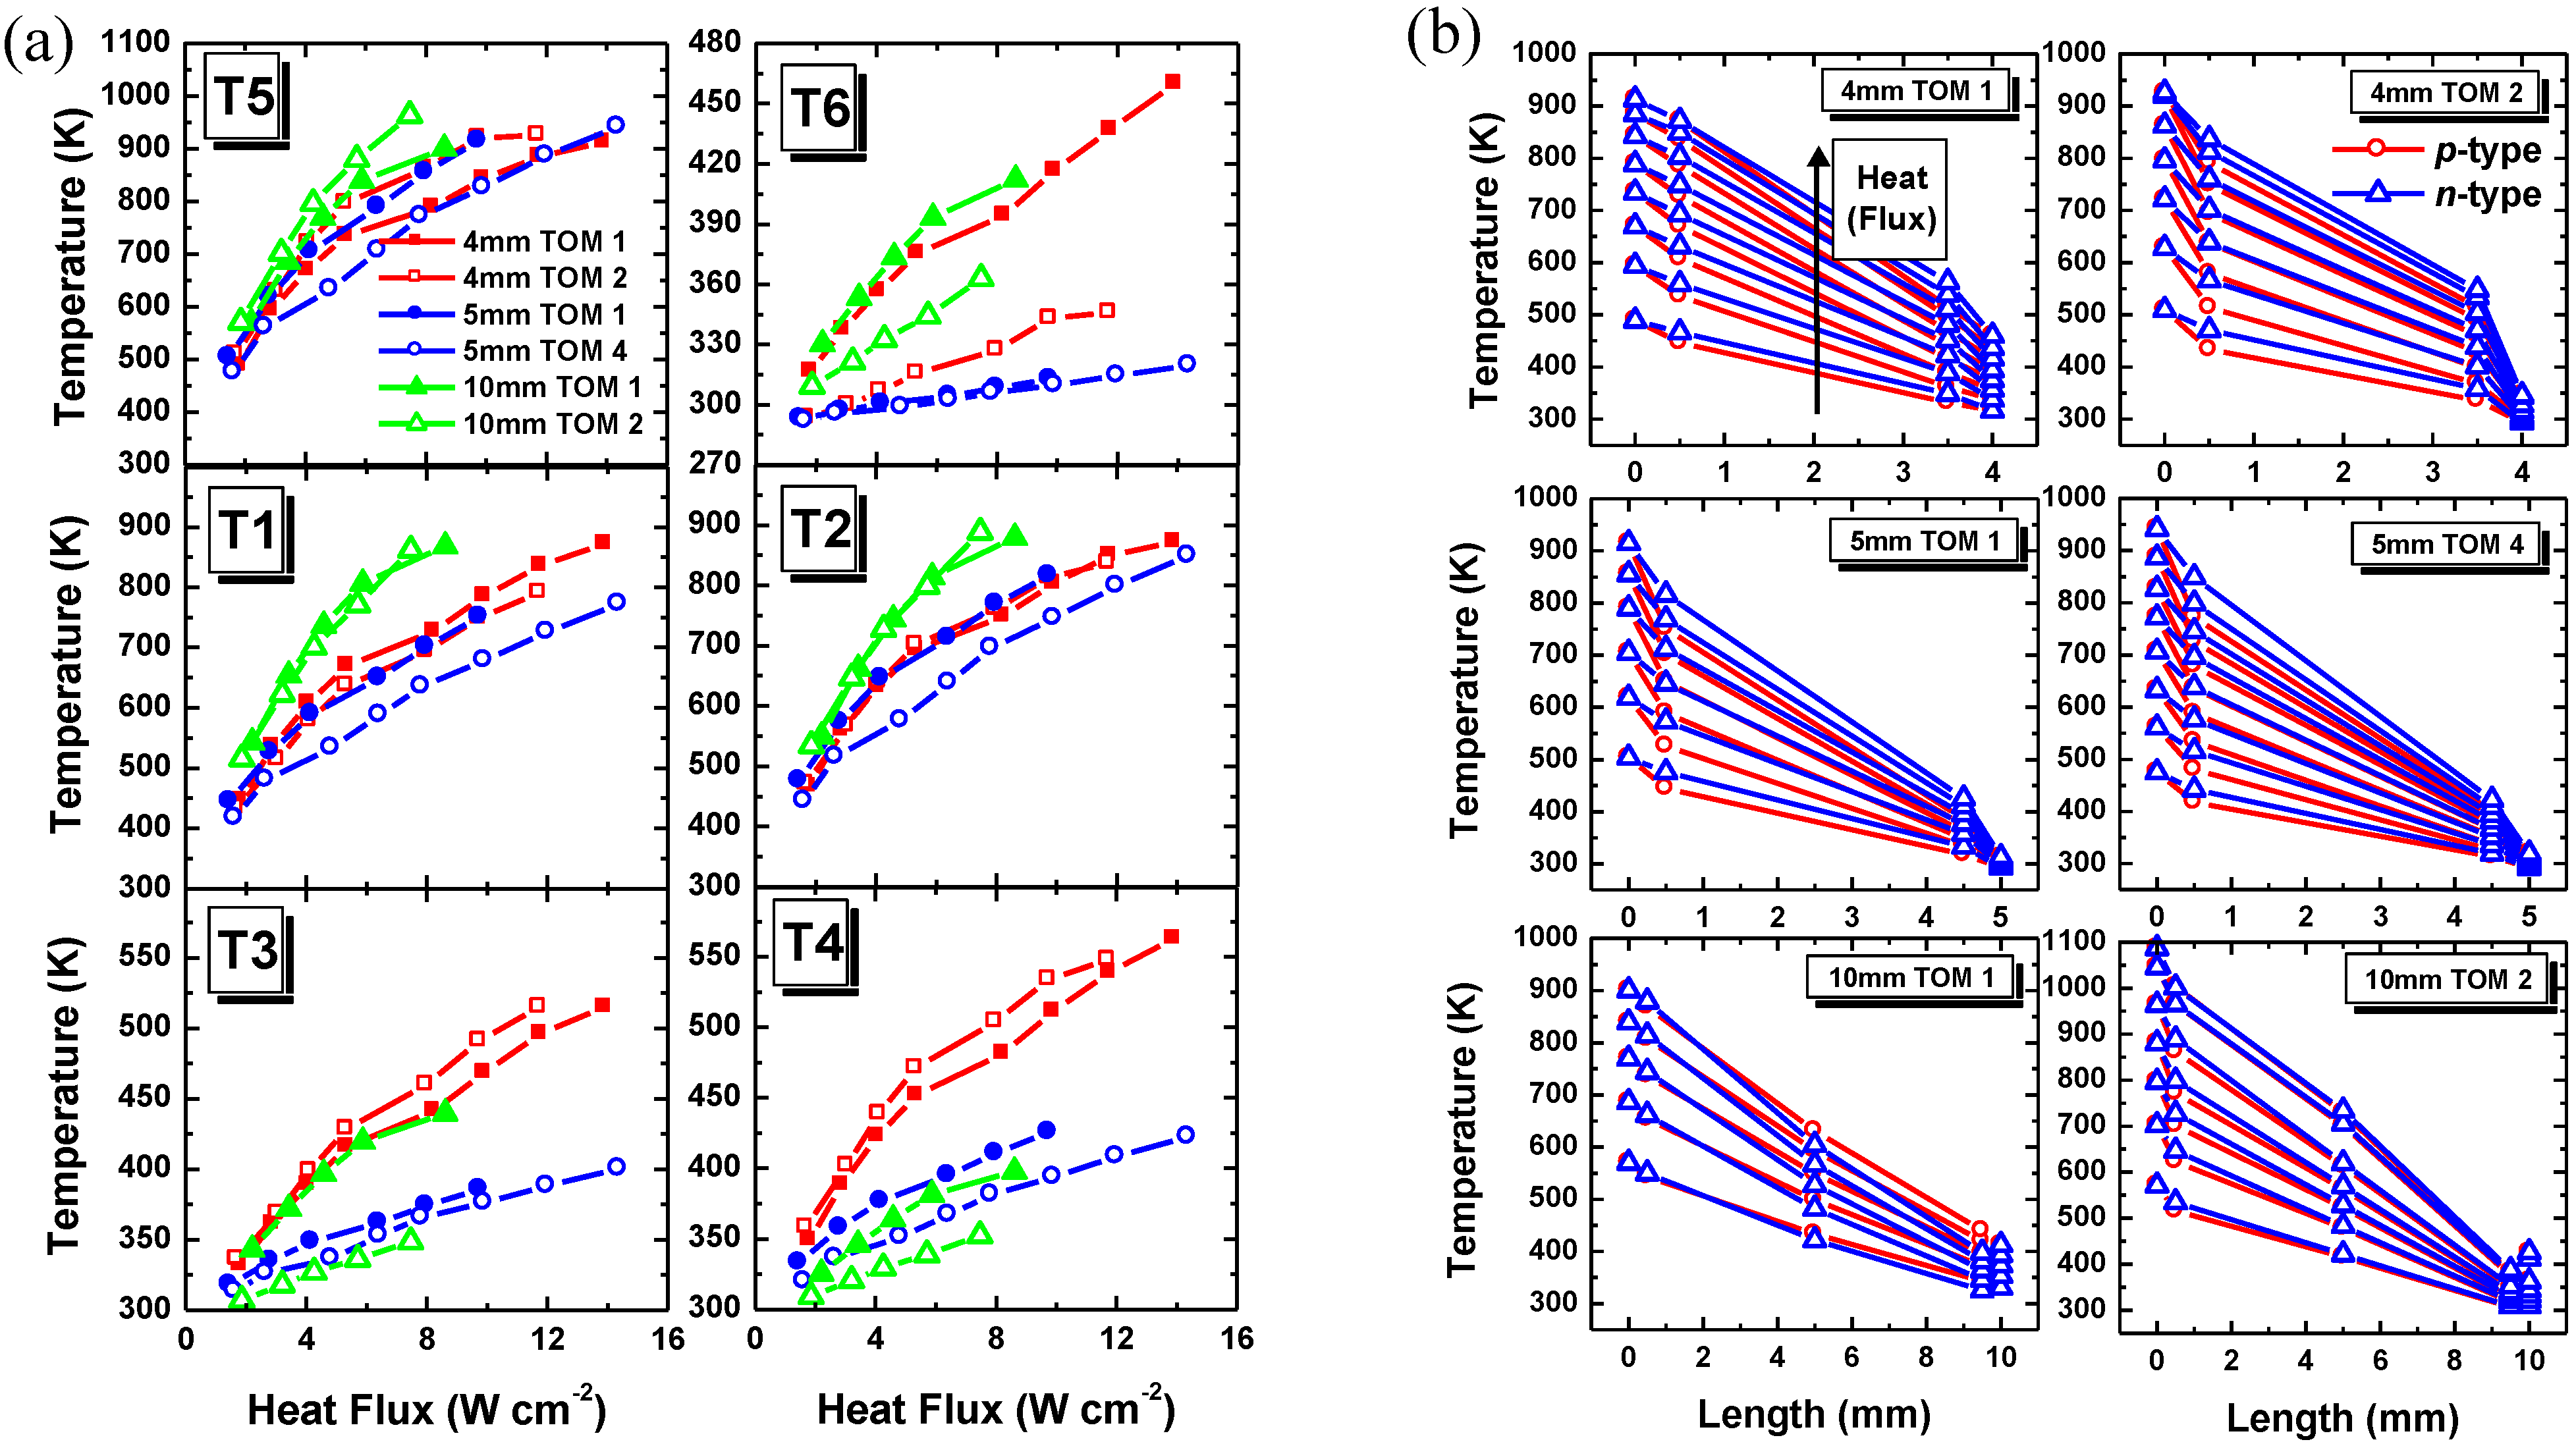
The average temperature along the TOMs at different measurement positions depending on the heat flux are plotted in
Figure 4a for 4, 5 and 10 mm leg length. At T ~ 910 K the graphite coating on the Al
2O
3 absorber plate starts to decompose which results in the decrease of the temperature difference between the hot and cold side of the module as well as in the decrease of the output power and conversion efficiency (cf.
Figure 6). This is caused by the lower absorptivity of the Al
2O
3 absorber plate when the graphite layer is declining. With increasing heat flux, the temperature on the hot side of the module (
T5) increases as expected. All measured results are summarized in
Table I.
Figure 3.
Temperature dependence of (a) the thermal conductivity, (b) the electrical resistivity, (c) the Seebeck coefficient, (d) the Figure of Merit ZT and compatibility factor s of the p-type (La1.98Sr0.02CuO4) and the n-type (CaMn0.98Nb0.02O3) TE legs.
Figure 3.
Temperature dependence of (a) the thermal conductivity, (b) the electrical resistivity, (c) the Seebeck coefficient, (d) the Figure of Merit ZT and compatibility factor s of the p-type (La1.98Sr0.02CuO4) and the n-type (CaMn0.98Nb0.02O3) TE legs.
At the same heat flux, temperatures on the hot side of the
p- and
n-type TE legs (
T1,
T2), for the same TOM, are comparable which means the manufacturing quality of the interconnections between the hot Al
2O
3 layer and the
p- and
n-type TE legs are rather reproducible and equivalent. Inducing absolute temperatures of T > 400 K, temperatures on the cold side of the module are lower in the
p-type leg (
T3) than the
n-type leg (
T4) at the same heat flux due to a higher thermal conductivity of the
p-type material. At the cold Al
2O
3 plate (
T6), temperatures are not alike which can be explained by an insufficient contact between the module and the Al-holder and deficiencies of the thermal paste. The difference is up to ~ 140 K for the 4 mm TOM 1 and the 5 mm TOM 4. The 5 mm TOM 4 was coated with SiC (
ε ~ 0.7; total spectrum measured) [
23] so the lower temperature gradient compared to the graphite-coated 5 mm TOM 1 (
ε ~ 0.95–0.97; total spectrum measured) [
23], was expectable (open blue circles in
Figure 4a).
Figure 4b shows the temperature profiles along the
p- and
n-type legs. In the center of the 10 mm legs one additional
K-type thermocouple was mounted (10 mm TOM 1). The error on the x-axis is estimated to be ± 0.25 mm which corresponds to an error of ~ 6% of the absolute measured temperature value. The temperature gradient along the TE legs is almost linear. The 10 mm TOM 1 is showing lower temperatures in the
n-type leg. This abnormality can be explained by the accuracy of the temperature measurement (position and embedding of the thermocouples) and/or a slightly larger cross-section of the
p-type legs.
Figure 4.
(a) Temperatures in the module as a function of the heat flux for 4, 5 and 10 mm TOMs. 5 mm TOM 4 was coated with SiC on the hot Al2O3 layer. (b) Temperature profiles along the p- (red circle) and n-type (blue triangle) legs of the 4 mm, 5 mm and 10 mm TOMs.
Figure 4.
(a) Temperatures in the module as a function of the heat flux for 4, 5 and 10 mm TOMs. 5 mm TOM 4 was coated with SiC on the hot Al2O3 layer. (b) Temperature profiles along the p- (red circle) and n-type (blue triangle) legs of the 4 mm, 5 mm and 10 mm TOMs.
Table 1.
Summary of the properties of four–leg TOMs.
Table 1.
Summary of the properties of four–leg TOMs.
| | T5max
[K] | T6max
[K] | ΔT
[K] | ε
[const.] | qin, max
[W cm-2] | VOC, max
[mV] | η
[%] | Pmax
[mW] | qin, opt
[W cm-2] | ηmax
[%] |
|---|
| 4 mm TOM 1 | 913 | 460 | 453 | ~ 0.95 | 13.90 | 42.9 | 0.043 | 53.7 | 4.06 | 0.065 |
| 4 mm TOM 2 | 926 | 346 | 580 | ~ 0.95 | 11.72 | 39.4 | 0.044 | 46.1 | 5.33 | 0.060 |
| 5 mm TOM 1 | 915 | 313 | 602 | ~ 0.95 | 9.75 | 44.5 | 0.059 | 51.6 | 7.98 | 0.060 |
| 5 mm TOM 4 * | 941 | 319 | 622 | ~ 0.70 | 14.37 | 46.4 | 0.069 | 88.8 | 7.83 | 0.073 |
| 10 mm TOM 1 | 901 | 412 | 489 | ~ 0.95 | 8.61 | 45.3 | 0.058 | 44.5 | 5.87 | 0.069 |
| 10 mm TOM 2 | 964 | 363 | 601 | ~ 0.95 | 7.46 | 52.4 | 0.081 | 54.4 | 4.26 | 0.082 |
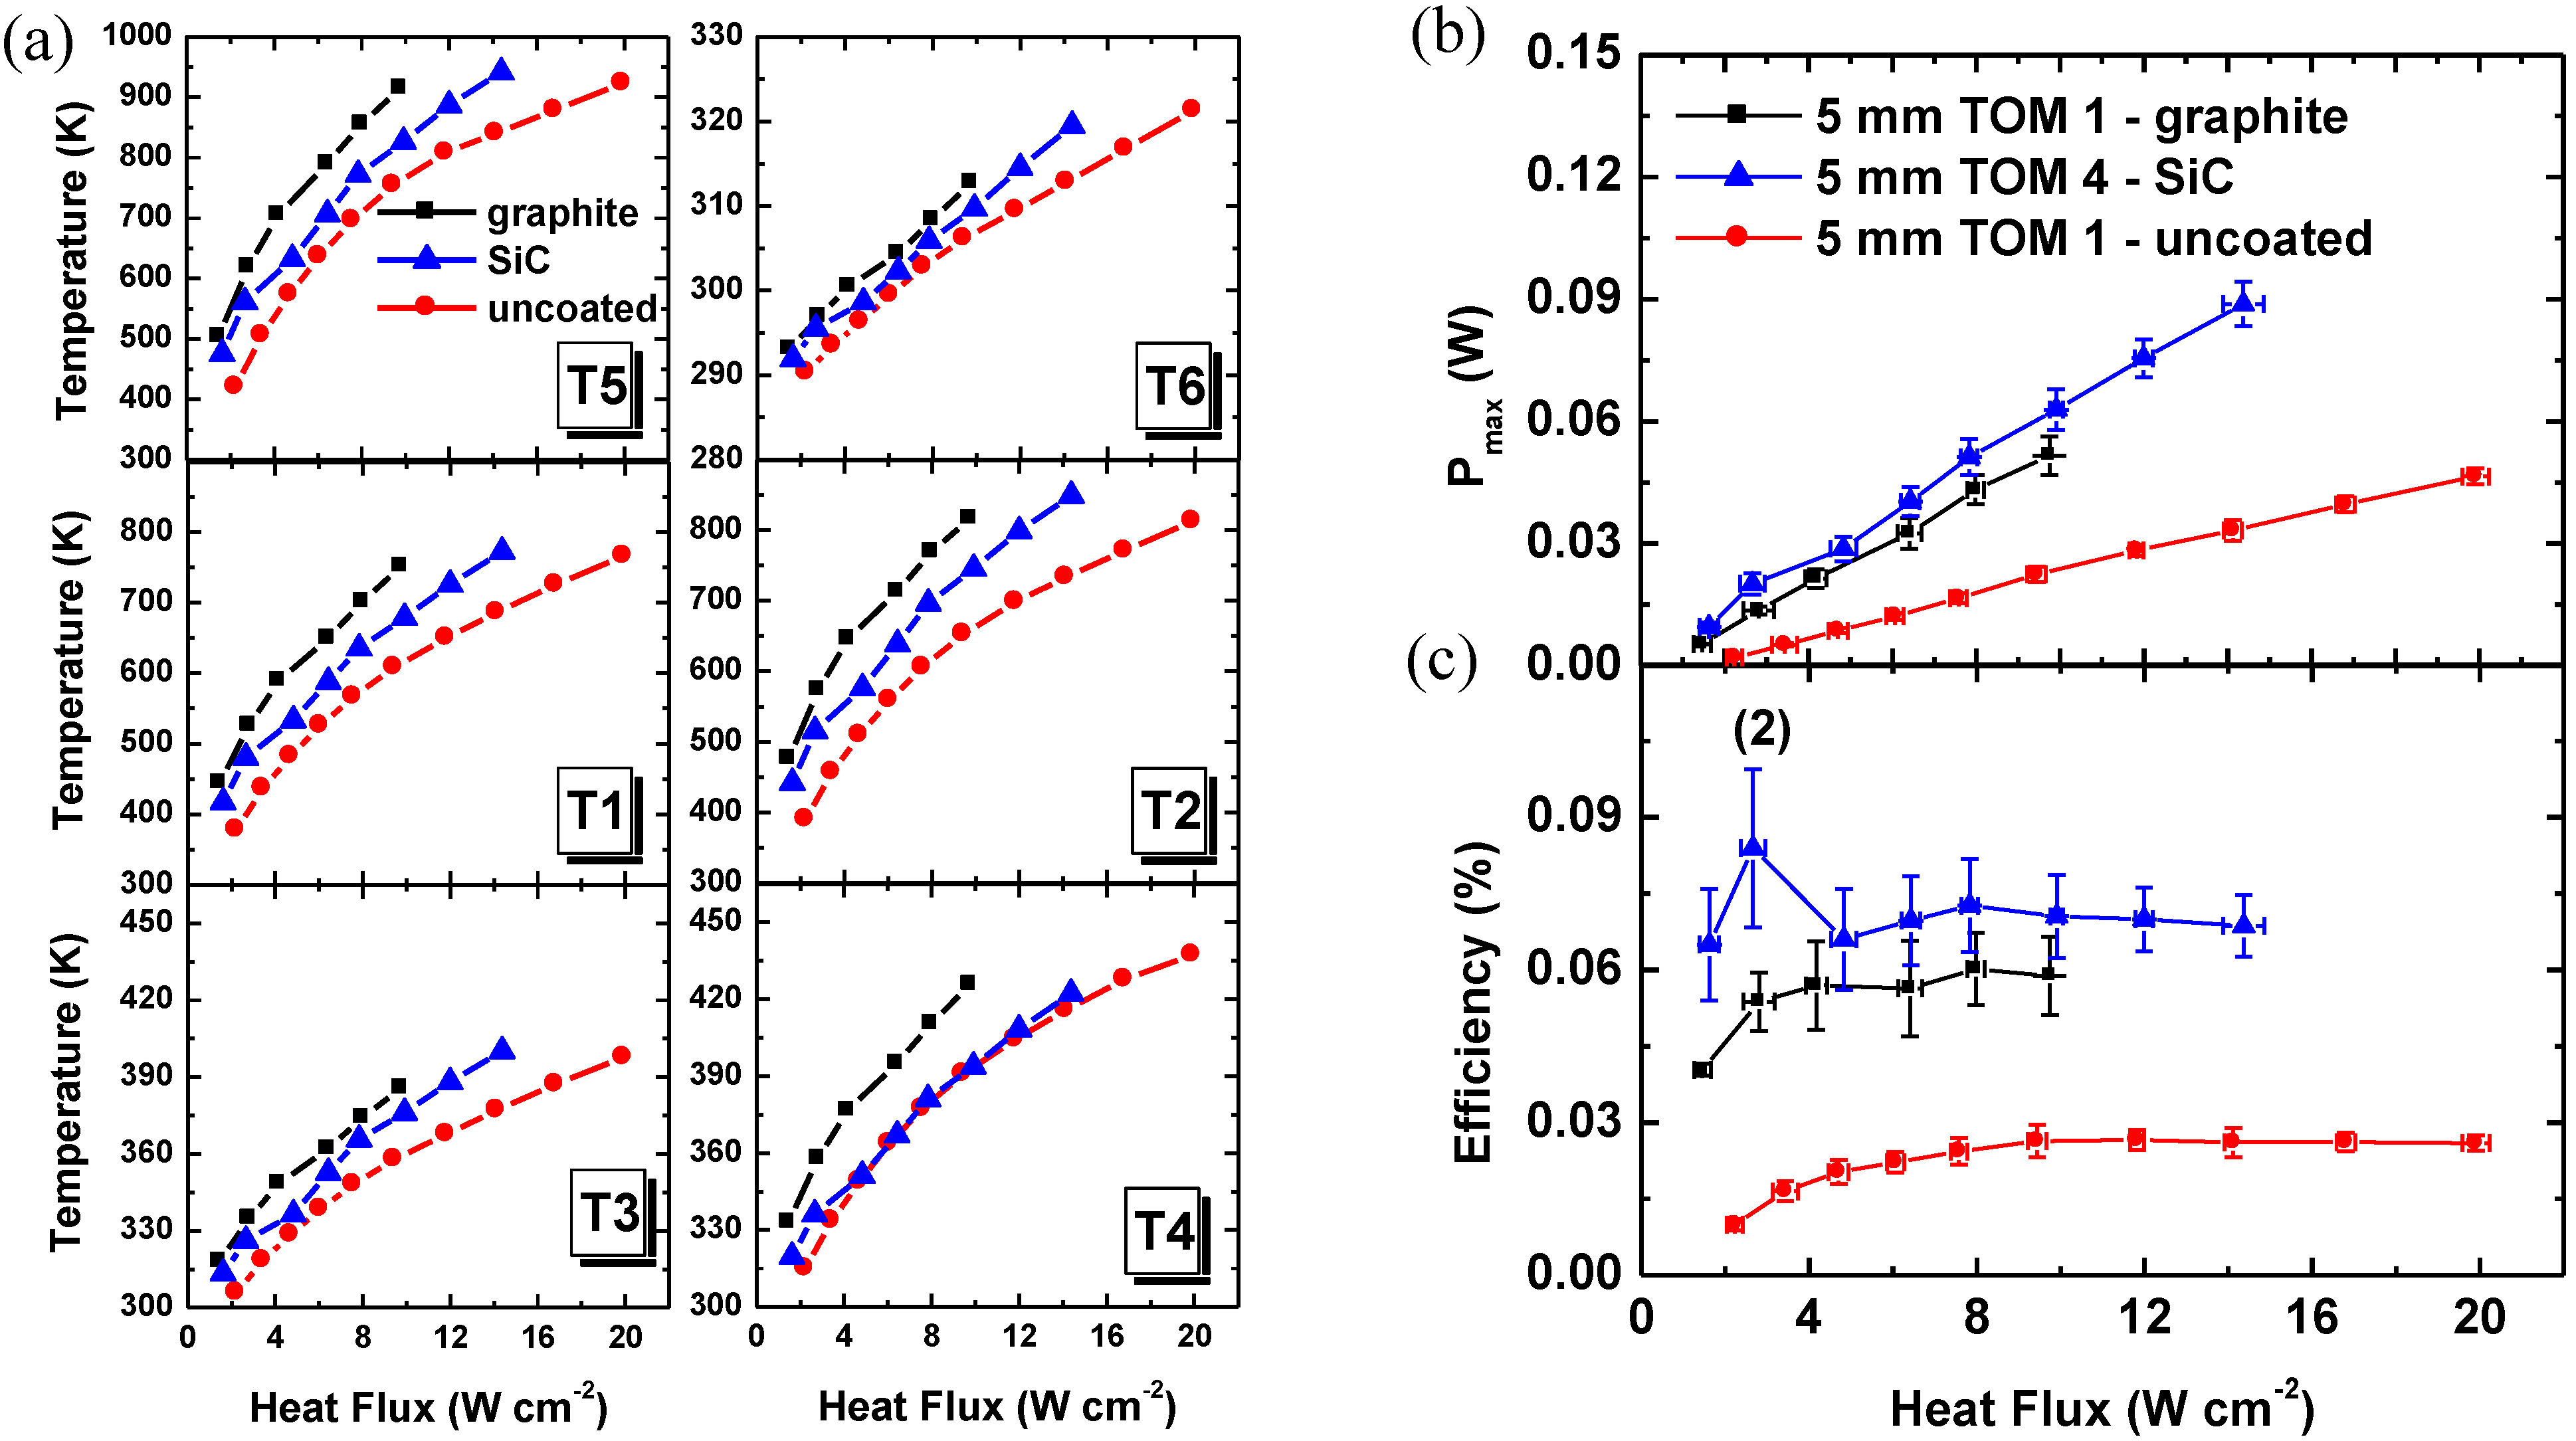
Figure 5a shows the influence of the absorber plate coating (graphite, SiC, non) on the absorptivity, the temperatures on the hot and cold Al
2O
3 plates, and on the temperatures in the
p- and
n-type TE legs using the 5 mm TOM as example. The temperature difference on the hot Al
2O
3 absorber plate(
T5) between the uncoated and the graphite-coated TOM is approximately 160 K at a heat flux of 9.5 W cm
-2. On the one hand, the heat absorption is improved by changing the emissivity of the coated surface, but on the other hand insufficient cooling on the cold side of the module leads to an increase of
T6 by 7 K at the same heat flux.
Figure 5.
(a) Temperatures as a function of the heat flux for a graphite-coated (black squares) and an uncoated (red circles) 5 mm TOM 1, compared with a SiC-coated (blue triangles) 5 mm TOM. (b) Maximum output power and (c) conversion efficiency as function of the heat flux of a 5 mm TOM 1 and 5 mm TOM 4.
Based on the voltage measurement in open circuit mode (
Voc) and at load resistances, the maximum output power (
Pmax) was calculated considering the load resistance equal to the internal resistance [
19].
Pmax is plotted in
Figure 5b. As expected it was found that
Pmax is higher for the graphite-coated than for the uncoated module. At the same heat flux of ~ 9.5 W cm
-2, the temperature difference between
T5 and
T6 is 602 K and 448 K for the graphite-coated and the uncoated 5 mm TOM, respectively. Accordingly, an open circuit voltage
VOC of 44.6 mV (graphite-coated) and 31.7 mV (uncoated) was measured which results in values for
Pmax of 51.6 mW and 22.6 mW for the graphite-coated and uncoated 5 mm TOM, respectively. For the 5 mm SiC-coated TOM 4,
VOC = 38.3 mV,
T5 – T6 = 507 K and
Pmax = 60.6 mW at a heat flux of ~ 9.5 W cm
-2 was determined. Despite the lower emissivity of SiC (ε = 0.7) compared to graphite (ε ~ 0.95) the 5 mm TOM 4 has a higher maximum output power
Pmax even though the open circuit-voltage
VOC is smaller. As the same
p- and
n-type materials are used for all the TOMs, this finding might be explained by small manufacturing deviations which could affect the contact resistances
Rcont.
Knowing the input heat flux measured by the Thermogage and the open-circuit voltage
Voc measured by a test unit with a data logger, we can calculate the conversion efficiency
η, defined by:
where
Vload is the voltage at load resistance,
Rload is the load resistance, and
Qin is the solar power input in [W] on the surface of the Al
2O
3 absorber plate. Conversion efficiencies against heat flux for the 5 mm TOMs are presented in
Figure 5c. The conversion efficiencies of the graphite-coated 5 mm TOM 1 and the SiC-coated 5 mm TOM 4 are higher than the efficiency of the uncoated 5 mm TOM 1 which is in agreement with the
Pmax results. As for the 5 mm TOM 4, the fluctuation of
η (2
nd point of the blue curve in
Figure 5c) was caused by a combination of the radiation fluctuation (horizontal error bars) and the instability of
Vload (vertical error bars).
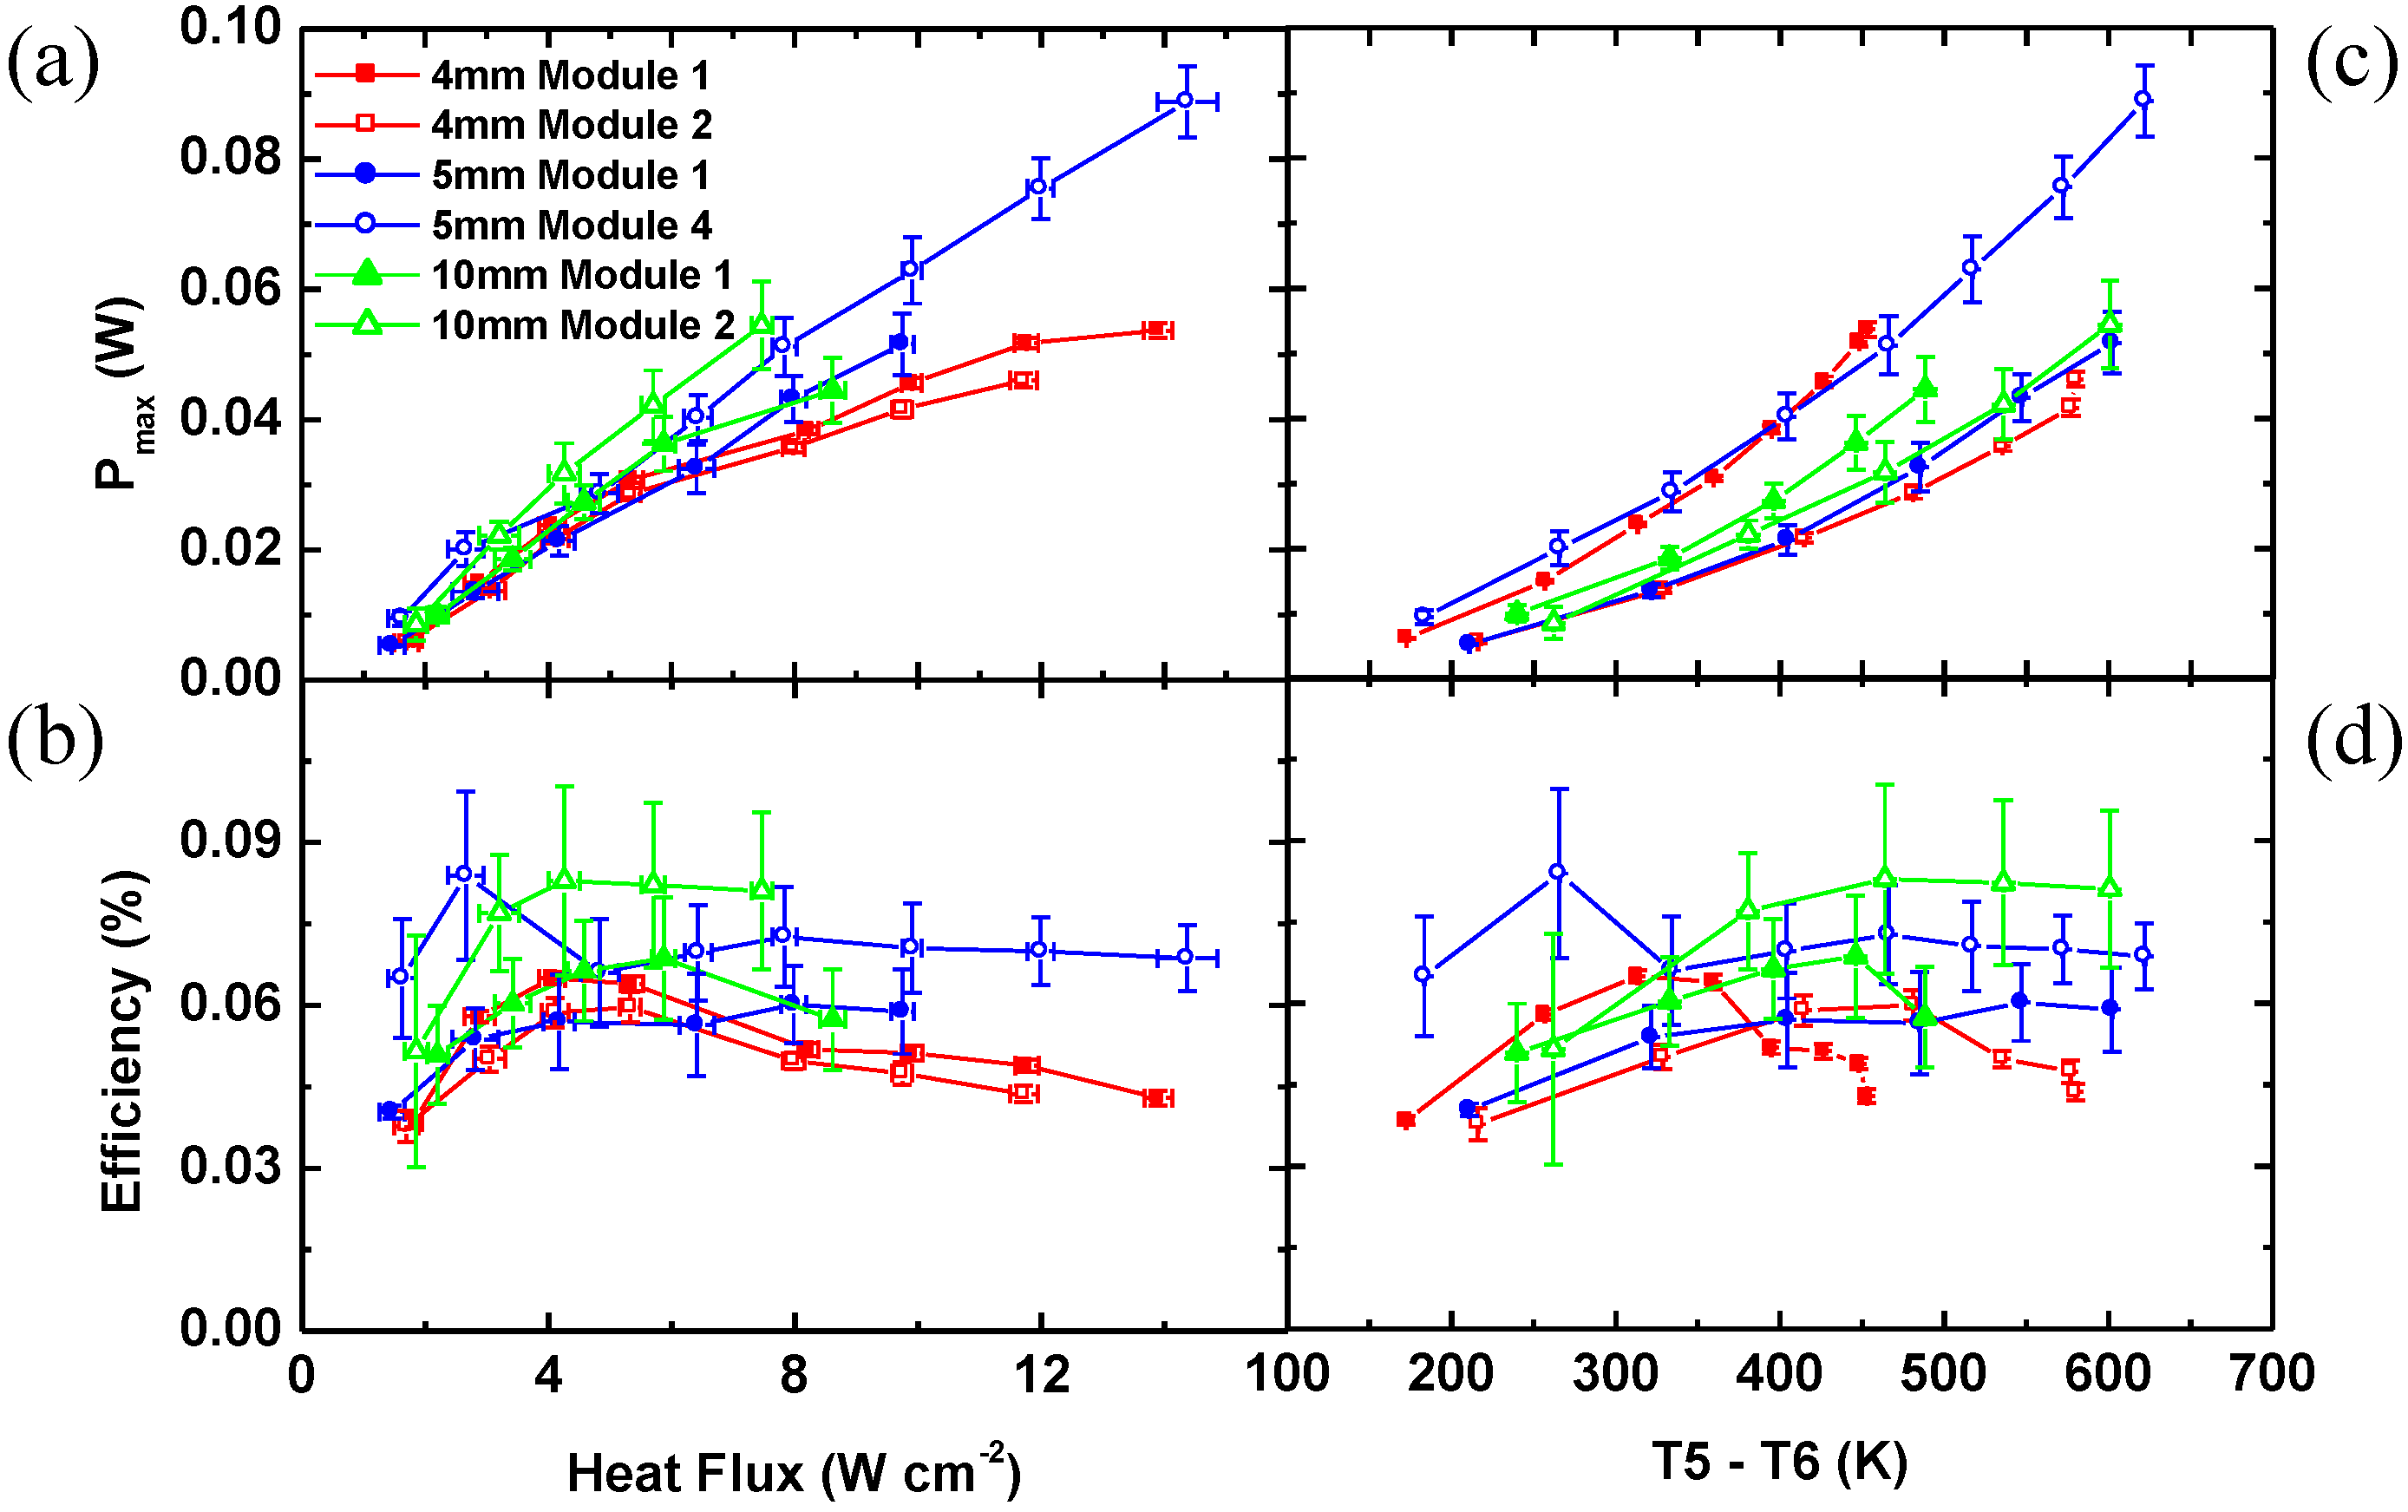
Figure 6a-d summarize the data of
Pmax and
η vs. heat flux and
T5 – T6 for 4, 5 and 10 mm TOMs coated by graphite (5 mm TOM 4 coated by SiC). Depending on the temperature difference
T5 – T6 the maximum output power
Pmax increases as
Pmax ~ f (
ΔT2) and a maximum value of 54.4 mW was achieved for a leg length of 10 mm at a heat flux of 9.5 W cm
-2 (5
th point in
Figure 6a). A maximum output power of 88.8 mW was obtained for the 5 mm TOM 4 at a heat flux of 14.4 W cm
-2 and a temperature difference of
T5 – T6 = 622 K. A conversion efficiency of 0.082% was obtained for a TOM with 10 mm leg length and an Al
2O
3 absorber area of 30 × 30 mm
2 (
Figures 6b, d). As expected longer TE legs lead to higher conversion efficiency [
24].
The conversion efficiency is higher at higher heat fluxes resulting in higher temperature differences T5 – T6 which improves the Carnot efficiency. The conversion efficiency reaches the maximum for 4 mm TOMs around 4 W cm-2, for 5 mm TOMs between 4–8 W cm-2 and for 10 mm TOMs around 6 W cm-2. After reaching the maximum value, the conversion efficiency decreases because of a degradation of the graphite at high temperatures when the heat flux exceeds 7.5 W cm-2. A further reason for decrease of the conversion efficiency are the re-radiation losses from the Al2O3 absorber plate. The re-radiation losses from the Al2O3 absorber plate increase with T4.
As the radiation losses are difficult to measure directly, a simulation procedure was developed [
25]. The results show that there is no significant radiation between the Al
2O
3 absorber plates and the TE legs, but the major heat losses of ~ 60% are due to the re-radiation from the hot side of the Al
2O
3 absorber plate.
In an ideal case the internal resistance
Rint of the module is equal to the resistance of the thermoelectric oxide material
Rmater. However, in real thermoelectric modules, the effect of the contact resistance on the conversion is not negligible. It is well known that high contact resistances lower the conversion efficiency of the devices remarkably. The internal resistances, contact resistances and resistances of the material for the TOMs were evaluated for the highest applied ΔT based on the following equations:
Figure 6.
Maximum output power and conversion efficiency of the TOMs as a function of the heat flux (a, b) and the temperature difference between the hot and the cold plate (c, d).
Figure 6.
Maximum output power and conversion efficiency of the TOMs as a function of the heat flux (a, b) and the temperature difference between the hot and the cold plate (c, d).
The results are summarized in
Table 2 as well as the other relevant physical parameters, such as average values of Seebeck coefficient and electrical resistivity of
p- and
n-type TE legs for all TOMs. The internal resistance increases with leg length because of the increase of the
Rmater. The contact resistance vary in the range of 0.29 Ω <
Rcont < 0.64 Ω depending on the manufacturing quality of TOMs.
Table 2.
Physical parameters of four–leg TOMs.
Table 2.
Physical parameters of four–leg TOMs.
| | ΔT
[K] | A/l
[mm] | <Sp>
[μV K-1] | <Sn>
[μV K-1] | <ρp>
[mΩ cm] | <ρn>
[mΩ cm] | Rint
[Ω] | Rmater
[Ω] | Rcont
[Ω] | MQF1
[%] | MQF2
[%] |
|---|
| 4 mm TOM 1 | 453 | 5.06 | 162.0 | -230.8 | 37.8 | 30.0 | 0.86 | 0.27 | 0.59 | 23 | 31 |
| 4 mm TOM 2 | 580 | 5.06 | 179.3 | -223.5 | 36.3 | 28.9 | 0.84 | 0.26 | 0.58 | 11 | 31 |
| 5 mm TOM 1 | 602 | 4.05 | 182.6 | -220.4 | 35.6 | 28.5 | 0.96 | 0.32 | 0.64 | 14 | 33 |
| 5 mm TOM 4 | 622 | 4.05 | 179.8 | -221.9 | 35.9 | 28.7 | 0.61 | 0.32 | 0.29 | 23 | 52 |
| 10 mm TOM 1 | 489 | 2.03 | 171.3 | -227.4 | 37.1 | 29.4 | 1.15 | 0.66 | 0.49 | 38 | 57 |
| 10 mm TOM 2 | 601 | 2.03 | 173.2 | -226.1 | 37.0 | 29.0 | 1.26 | 0.65 | 0.61 | 31 | 52 |
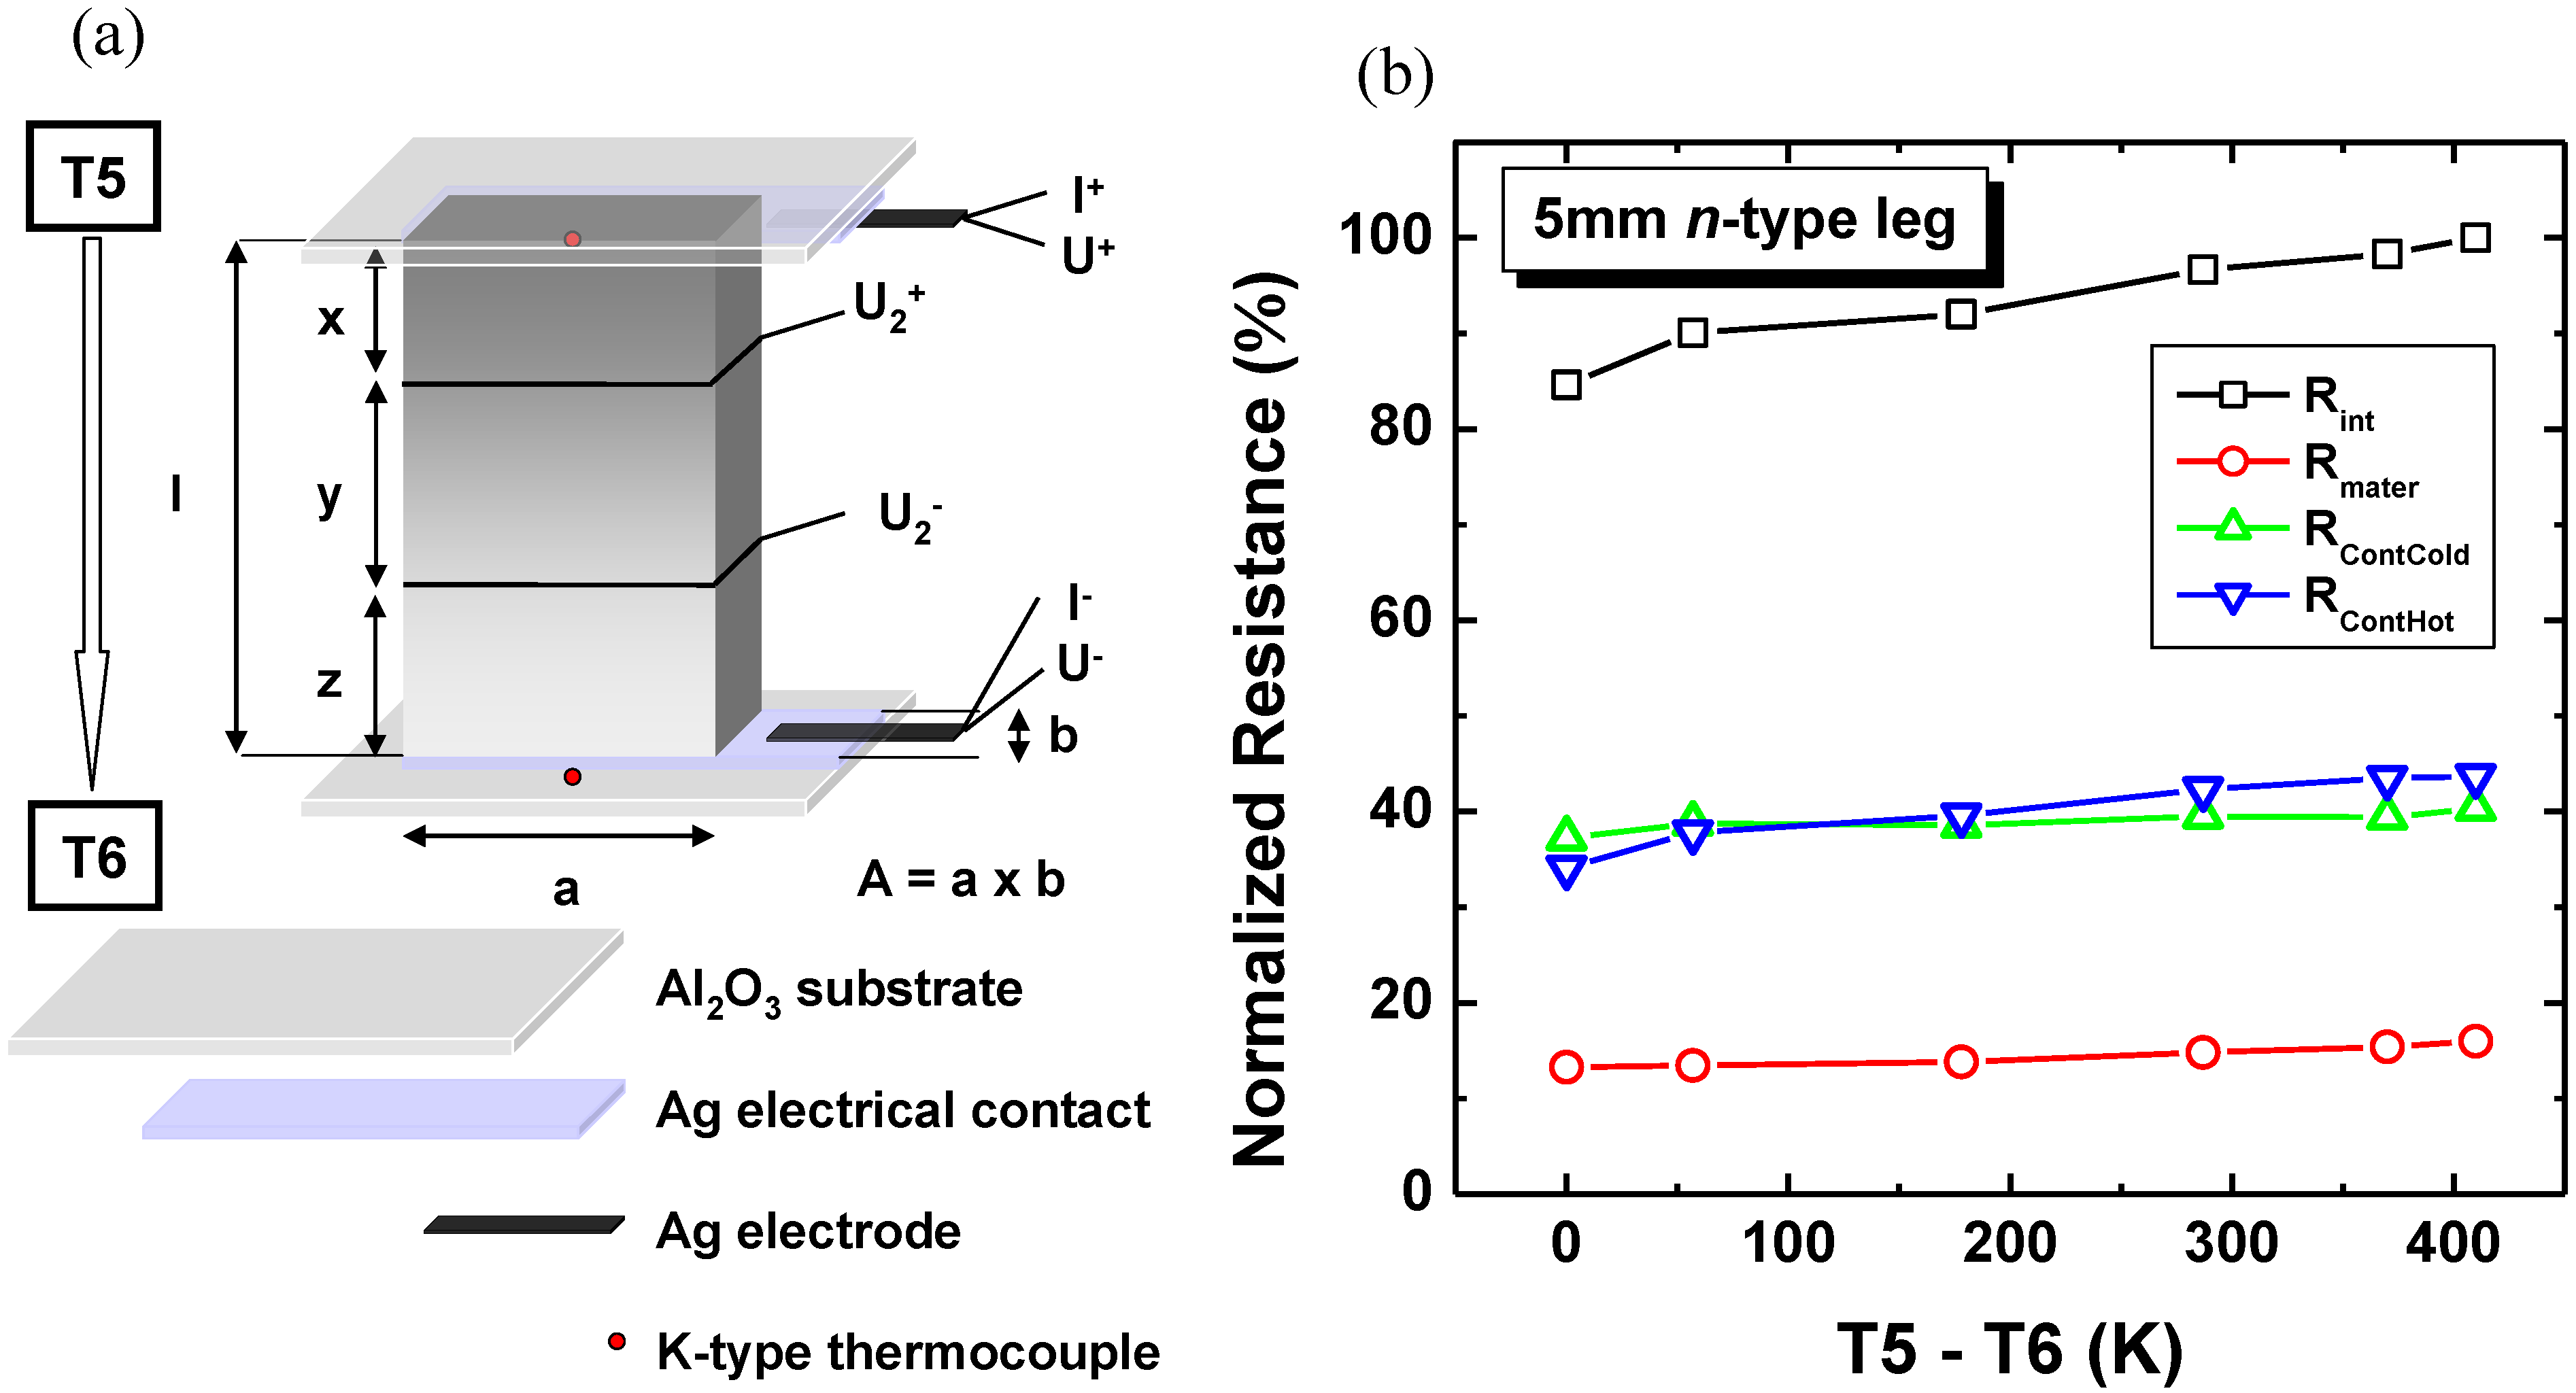
The more detailed determination of the contact resistance was done by measurement of 5 mm
n-type TE leg at several temperature differences which vary from 0 K to 410 K. The measurement configuration is shown in
Figure 7a. From the evaluation of <ρ
n> and the internal resistance
Rint measurement, the contact resistance on the hot side
Rconthot and the cold side
Rcontcold of the 5 mm
n-type leg was determined. The evaluation of
Rconthot,
Rcontcold and
Rint was done based on the following equations:
The data of the contact resistance measurement were normalized and plotted in
Figure 7b. It was shown, that the major contribution to internal resistance is the contact resistance on the cold side and the hot side of the TOM compared to the resistance of the thermoelectric oxide materials. Thus, it can be concluded that for better conversion experiments the contacts have to be improved to decrease the contact resistance of the TOMs by e.g. developing better contact materials.
Figure 7.
Contact resistance measurement configuration based on Equations 5-7 (a) and normalized Rint, Rmater, Rcontcold and Rconthot for 5 mm n-type TE leg (b).
Figure 7.
Contact resistance measurement configuration based on Equations 5-7 (a) and normalized Rint, Rmater, Rcontcold and Rconthot for 5 mm n-type TE leg (b).
Quantitative measures of the device quality are the manufacture quality factors
MQF1, and
MQF2 [
24,
26]. These factors were calculated to determine the eventual ambiguity associated with the manufacturing defects of TOMs based on the following equations:
where
N is the number of thermocouples in a TOM,
ΔT is the temperature gradient between the hot side and the cold side of the TOM,
S is the Seebeck coefficient,
ρ is the electrical resistivity,
A is the cross-sectional area of TE leg and
l is the leg length. The manufacture quality factors vary in the range of 11% <
MQF1 < 38% and 31% <
MQF1 < 57%, respectively. The manufacture quality factor values calculated by using Equation 9 were comparable with previous studies on thermoelectric oxide modules [
26]. In the case of the 5 mm TOM 1 with
Pmax = 51.6 mW and 5 mm TOM 4 with
Pmax = 88.8 mW it was evident that the maximum output power was enhanced by lowering the contact resistance. The manufactory quality factor measured under a similar temperature gradients of the 5 mm TOM 4 was
MQF2 = 52% while the 5 mm TOM 1 revealed a different MQF of
MQF2 = 33%.


