On The Microstructures and Hardness of The Nb-24Ti-18Si-5Al-5Cr-5Ge and Nb-24Ti-18Si-5Al-5Cr-5Ge-5Hf (at.%) Silicide Based Alloys


Department of Materials Science and Engineering, The University of Sheffield, Sir Robert Hadfield Building, Mappin Street, Sheffield S1 3JD, UK
*
Author to whom correspondence should be addressed.
Materials 2019, 12(17), 2655; https://doi.org/10.3390/ma12172655
Submission received: 9 July 2019
/
Revised: 12 August 2019
/
Accepted: 19 August 2019
/
Published: 21 August 2019
Abstract
:The microstructures and hardness of the as cast and heat treated (1400 °C/100 h) alloys Nb-24Ti-18Si-5Ge-5Cr-5Al (ZF6) and Nb-24Ti-18Si-5Ge-5Cr-5Al-5Hf (ZF9) were studied. Both alloys were compared with refractory metal bcc solid solution + intermetallic High Entropy Alloys (HEAs). There was macrosegregation of Si, Ti, Cr and Al in both alloys. The roles of Ge and Hf on macrosegregation are discussed. In both alloys the primary phase was the βNb5Si3. In the as cast alloy ZF6 the Nbss, βNb5Si3 and C14-NbCr2 Laves phase and Nbss + βNb5Si3 eutectic were formed. The microstructure of the as cast alloy ZF9 consisted of Nbss, βNb5Si3, γNb5Si3 and C14-NbCr2 Laves phase. The heat-treated microstructures of the alloys ZF6 and ZF9 consisted of Nbss, βNb5Si3 and αNb5Si3 and Nbss, βNb5Si3, αNb5Si3 and γNb5Si3, respectively. The surfaces of both alloys were contaminated by oxygen where TiO2 and HfO2 formed respectively in the alloys ZF6 and ZF9. Alloying with Hf increased the lattice parameter of Nbss and decreased the hardness of ZF9 and Nb5Si3. The roles of alloying additions on the hardness of the Nbss and Nb5Si3 and relationships between alloy hardness and alloy parameters VEC (valence electron concentration), δ (related to atomic size) and Δχ (related to electronegativity) were discussed.
1. Introduction
The search for new alloys capable of operating in the demanding conditions in gas turbine engines at temperatures higher than those experienced by the currently used Ni-based superalloys has concentrated on refractory metal silicide-based alloys, in particular Nb-Si based alloys and Mo-Si based alloys [1,2]. The former also are known as Nb-silicide based alloys or Nb in situ composites and have microstructures consisting of Nbss and intermetallic(s), such as Nb5Si3, Nb3Si, NbCr2 and others, depending on alloy chemistry and processing [2,3].
The tetragonal Nb5Si3 silicide is most desirable compared with Nb3Si owing to its better creep properties and oxidation resistance. Alloying additions can enhance the stability of the tetragonal βNb5Si3, suppress the Nbss + Nb3Si eutectic and replace it by the Nbss + βNb5Si3 eutectic, enhance the eutectoid decomposition of Nb3Si and modify the properties and morphology of the silicides [3,4].
Important alloying additions in Nb-silicide based alloys are Al, Cr, Ti and Hf. These four elements are essential for oxidation resistance [3,5], the first two are expected to confer oxidation resistance with Si, and Hf scavenges oxygen and forms hafnia. The solid solubilities of Al, Cr and Hf in the Nbss increase with increasing Ti content and all four elements strengthen the Nbss. Aluminium and Cr increase the ductile to brittle transition temperature (DBTT) of bcc Nb. Aluminium has a stronger effect than Cr, and Ti and Hf have a weak effect on DBTT [6]. Alloying with Cr and Ti respectively increases and decreases the shear modulus of Nb. Aluminium and Cr additions in Nb or Nb-Ti increase the Peierls-Nabarro energy and thus reduce dislocation mobility, tensile ductility and thereby decrease the resistance to fracture of the Nbss [7].
Titanium and Hf substitute Nb in Nb5Si3 and can destabilise its desirable tetragonal structure [2,3], and decrease its hardness [8]. In Nb5Si3 the solid solubility of Cr is low, and Si can be substituted by Al [8]. Germanium, like Al, substitutes for Si in Nb5Si3 [9] and in synergy with Ti and Hf improves the fracture toughness of Nb5Si3 from about 3 MPa√m to 8–11 MPa√m for 24 at.% Ti in solution [10,11].
Our research group has shown that in Nb-24Ti-18Si-5Al-5Cr based alloys, the Al and Cr in synergy with Ti stabilise the Nbss + βNb5Si3 eutectic, and Al in synergy with Ti enhances the transformation of βNb5Si3 to αNb5Si3 and promotes the precipitation of Nbss via the transformation βNb5Si3 → αNb5Si3 + Nbss [12]. The latter transformation was enhanced even in the absence of Ti when Al and Ge were in synergy with Si in the alloy Nb-18Si-5Al-5Ge [13]. Cretegny et al. have attributed the increased strength of MASC (Nb-24Ti-16Si-8.2Hf-2Cr-1.9Al) type alloys (compared with Nb-25Ti-8Hf-xSi alloys) to the propensity of Al and Cr additions to favour eutectic growth compared with the simpler quaternary alloys [14].
The authors have shown that Ge promotes the Nbss + βNb5Si3 eutectic and microstructures similar to those achieved in Nb-silicide based alloys where Ti was in synergy with Al and Cr [13,15]. Considering the reported beneficial effect of Ge on the oxidation of Nb-silicide based alloys [5] and the restrictions imposed on the Al, Cr and Hf contents of Nb-24Ti-18Si-zxAl-yCr-zHf based alloys owing to mechanical property targets, we embarked on the work presented in this paper in order to understand how the synergy of Ge with the alloying elements Al, Cr, Ti and Hf at the concentrations of the “base” alloy Nb-24Ti-18Si-5Al-5Cr affects the stability of βNb5Si3 and NbCr2, and the vol.% of Nbss and the shape and size of Nb5Si3. This knowledge is important for optimising room and elevated temperature mechanical properties and oxidation resistance [3]. The effects of the synergy of the above elements on the oxidation behaviour of alloys based on Nb-24Ti-18Si-5Al-5Cr will be the subject of a separate publication. In this paper we report on two alloys with Ge and Hf additions. The results for each alloy are presented separately. The as solidified and heat-treated microstructures are compared with similar alloys without Ge. The nominal compositions of the latter alloys are given in the Appendix A.
2. Experimental
The nominal compositions of the alloys of this study (all compositions are given in at.%) were Nb-24Ti-18Si-5Al-5Cr-5Ge (alloy ZF6) and Nb-24Ti-18Si-5Al-5Cr-5Ge-5Hf (alloy ZF9). The Ge, Si and Ti concentrations were set respectively at 5, 18 and 24 at.%, as in previous research [12,13]. The DBTT of aero engine materials must not exceed −50 °C [3]. The Al composition was kept at 5 at.% because the DBTT of Nb increases above −50 °C at higher Al concentrations [6] and the Cr composition was kept at 5 at.% as in previous work [12,15]. This choice of alloys makes possible their comparison with non-Ge containing alloys regarding stability of microstructure (this work) and oxidation (separate publication).
We used arc melting and high purity elements (Nb 99.99 wt.%, Ti 99.95 wt.%, Si 99.999 wt.%, Ge 99.999 wt.%, Cr 99.5 wt.%, Hf 99.99% wt.% and Al 99.999% wt.%) to prepare the alloys. The elemental charges were placed in a copper water-cooled crucible and were melted in a high purity argon atmosphere using a tungsten electrode. Each alloy was melted five times to homogenize its composition as much as possible. A tube furnace (Lenton Furnaces, Market Harborough, UK) was used for the heat treatments. The specimens for the latter were cut from the bulk of the buttons, wrapped in Ta foil and placed in an alumina crucible. They were heat treated at 1400 °C for 100 h under an argon atmosphere. Pure Ti sponge was used in the tube furnace as oxygen getter.
The microstructures of the cast and heat-treated alloys were characterized using X-ray diffraction (XRD), scanning electron microscopy (SEM) with micro-analysis and electron microprobe analysis (EPMA). For XRD we used a Siemens D500 X-ray diffractometer (HiltonBrooks Ltd, Crew, UK) with CuKα radiation (λ = 1.540562 Å), an acceleration voltage of 40 kV, a current of 30 mA and a step of 0.02 degrees per second. The phases were identified using ICDD (International Centre for Diffraction Data) database. The XRD experiments used bulk specimens and thus texture effects were likely. The lattice parameters of the Nbss were calculated using the Nelson-Riley extrapolation method to an accuracy of 0.1%. For imaging and micro-analysis we used a Camscan Mk2 SEM (Camscan Electron Optics Ltd., Cambridge, UK) equipped with an energy dispersive X-ray spectrometer (EDS) and a CAMECA SX-51 Electron Microprobe (EPMA) (CAMECA SAS, Gennevilliers Cedex, France) with high purity standards of Nb, Ti, Si, Ge, Cr, Hf and Al elements that were ground and polished to 1 μm finish. High purity Co was used for calibration prior to EDS analysis. An accelerating voltage of 20 kV was used and the electron beam size was 1 μm. The count rate for the calibration was controlled to be about 3000 cps by adjusting the probe current. The ZAF correction method was used.
Specimens from the top, bulk and bottom of the buttons were used for micro-analysis. In each specimen we did large area (0.5 mm × 0.5 mm) analysis, point (phase) analysis and area analysis of eutectic microstructures. Large area analysis data was used to study macrosegregation, which is common in arc melted Nb-silicide based alloys [16]. At least 10 point analyses were performed on phases with size ≥ 5 μm and at least 5 large area analyses were taken from each of the top, bulk and bottom areas of the buttons to determine actual compositions. In the results section, the analysis data is given with the average, minimum and maximum values and the standard deviation.
The macrohardness of the alloys was measured using a CV Instruments Vickers hardness tester (CV Instruments, Bowers Group, Camberley, UK) (430 AAT) with a load of 10 kg and holding time of 15 s. For each measurement we ensured that the typical alloy microstructure was sampled by the indenter. The microhardness of Nb5Si3 was measured using a Mitutoyo hardness machine with a load of 0.05 kg and holding time of 15 s. The microhardness of the Nbss was measured with a load of 0.025 kg and holding time of 15 s. At least 10 measurements were taken for the macrohardness of the alloys and the microhardness of the aforementioned phases. Each indent was measured twice. A gas pycnometer was used to measure the densities of the as cast alloys. We used the Zeiss KSRun version 3 high resolution imaging analysis software and the large area backscatter electron images that were used for large area analyses to measure the area fractions of phases.
3. Results
3.1. Nb-24Ti-18Si-5Al-5Cr-5Ge (Alloy ZF6)
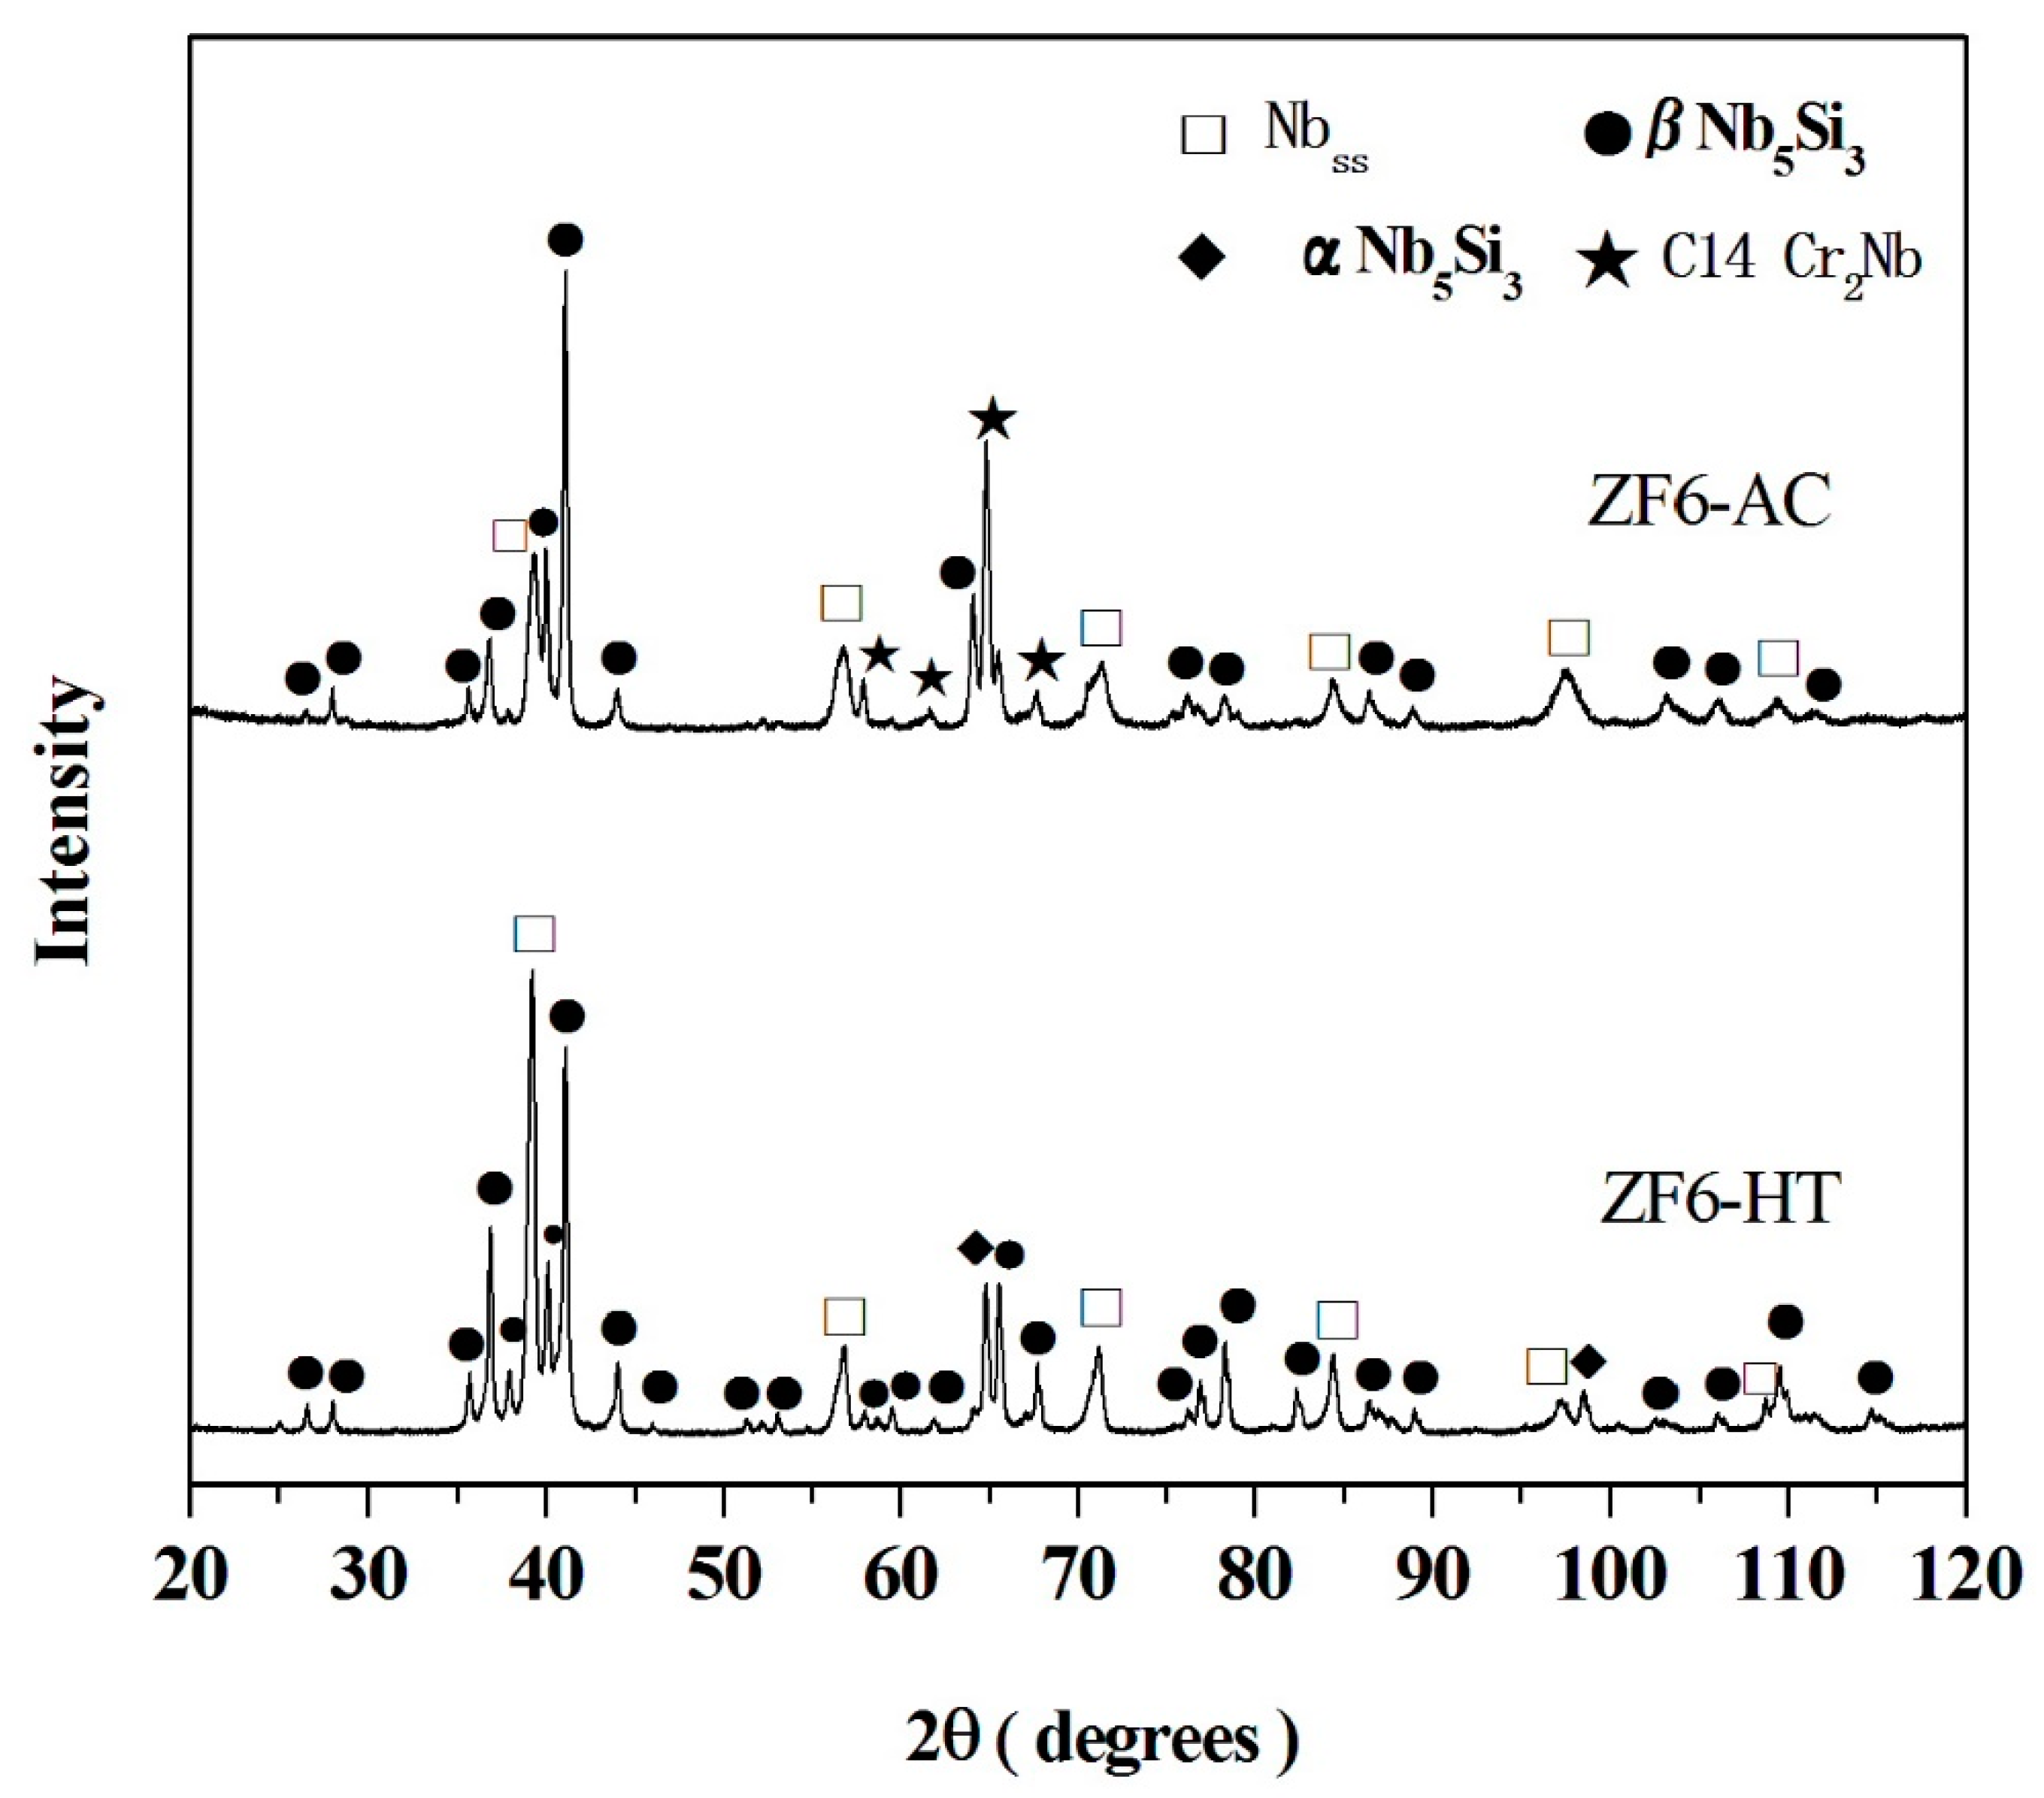
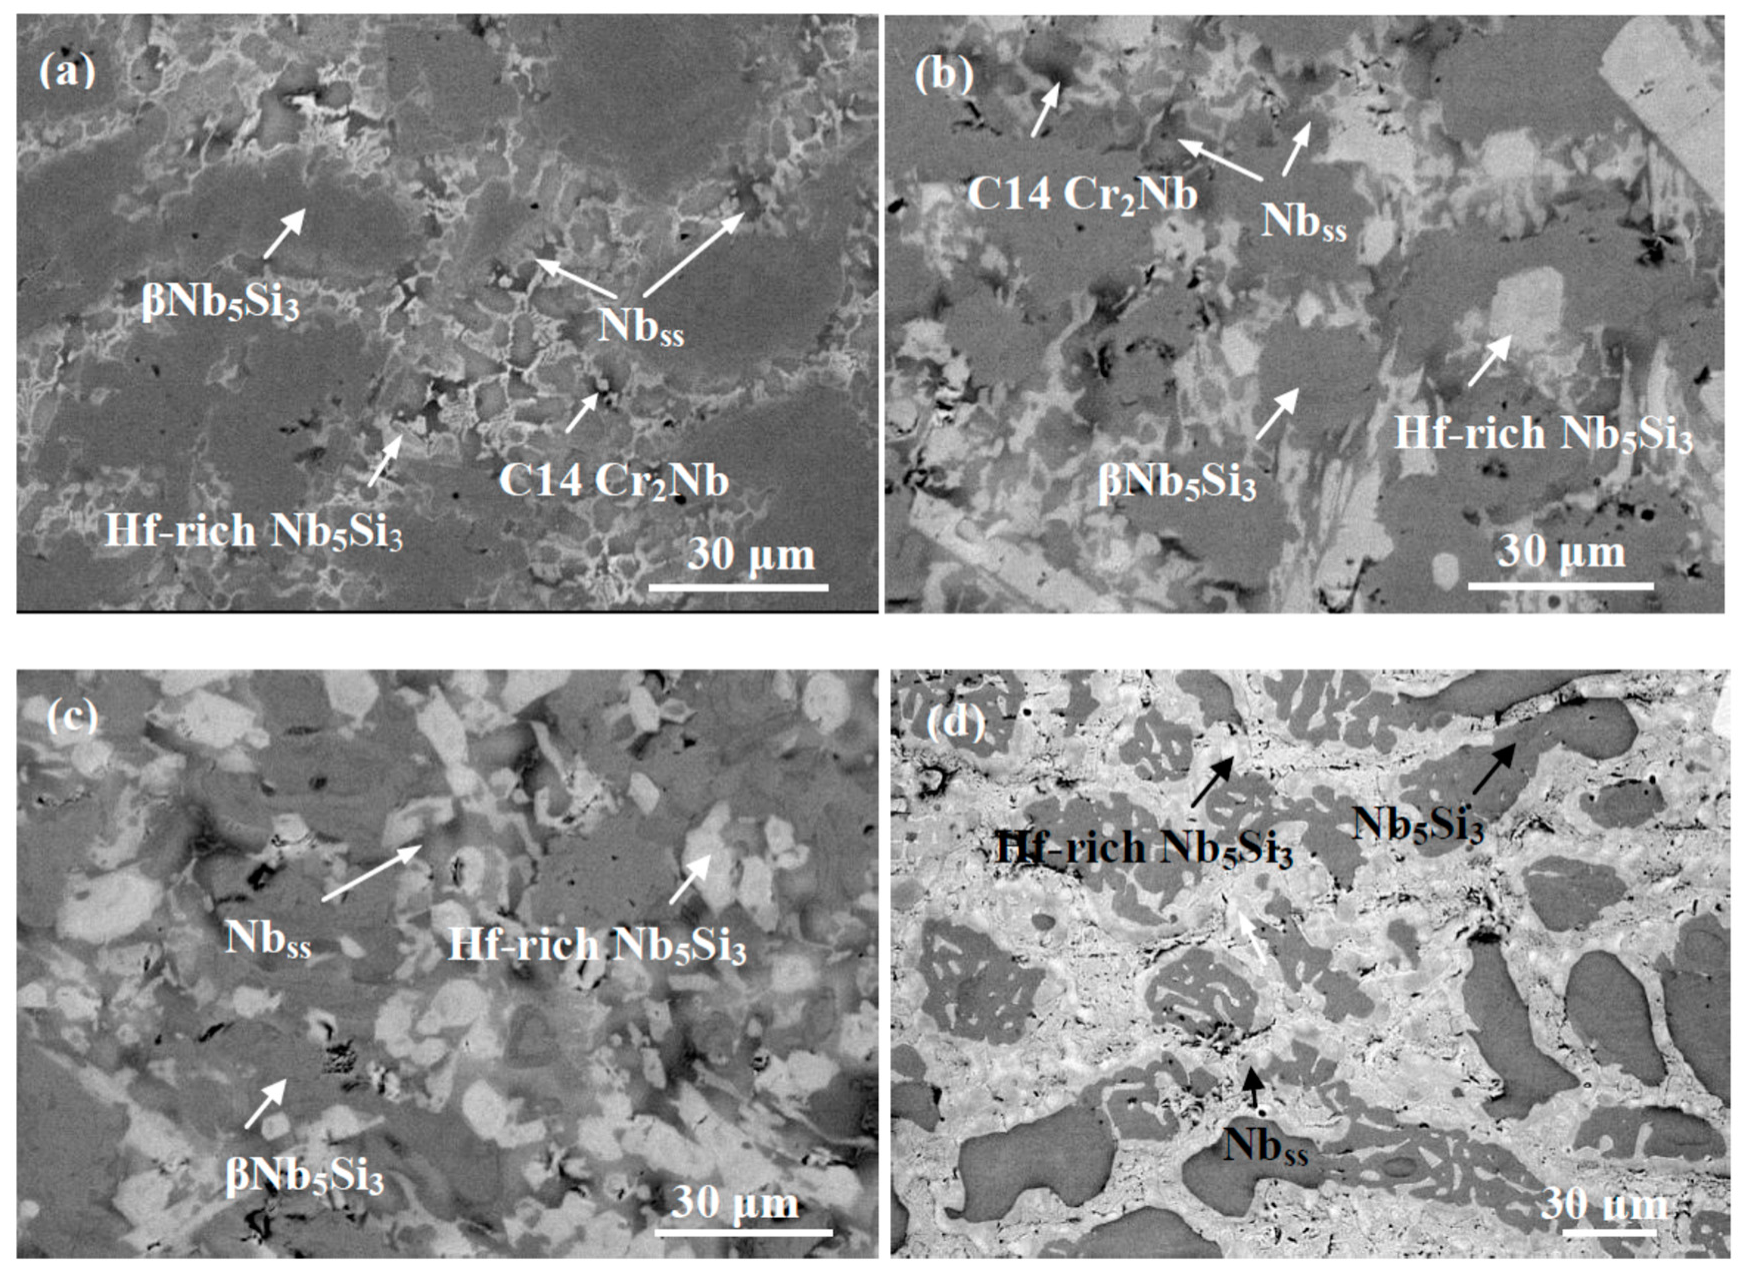
The actual composition of the as cast alloy (ZF6-AC) was Nb-25.7Ti-16.8Si-5.1Ge-5.0Cr-5.8Al and its density was 6.54 ± 0.01 g/cm3 (Table 1). There was macrosegregation of Si, Cr, Ti and Al the concentrations of which were in the range 15.8 to 20.1 at.%, 3.5 to 5.6 at.%, 23.9 to 26.3 at.% and 4.1 to 6.7 at.%, respectively (Table 2). The microstructure of ZF6-AC consisted of the Nbss, βNb5Si3 and C14-Cr2Nb phases (Figure 1 and Table 2). Typical images of the microstructure of different parts of ZF6-AC are shown in Figure 2a–c. The βNb5Si3 grains in the bulk of ZF6-AC were large and faceted (Figure 2b). The Laves phase was formed between Ti-rich Nbss dendrites only in the bulk of the button (Figure 2b) where it was present at a small volume fraction and its average composition was 18.4Nb-24.8Ti-6.2Si-1.2Ge-46.3Cr-3.1Al (Table 2). The Nbss + βNb5Si3 eutectic was also observed in the top and bulk of ZF6-AC with average composition 45.5Nb-28.4Ti-8.1Si-3.7Ge-8.0Cr-6.3Al. Ti-rich areas were formed at the edges of Nbss and βNb5Si3. In the Ti-rich Nbss the concentrations of Si, Ge and Al were very close to those in the Nbss but the Cr concentration was higher (Table 2). The βNb5Si3 was leaner than the Si concentration in unalloyed Nb5Si3. The microstructure in the bottom of the button was different compared with the top and bulk and consisted only of the βNb5Si3 and Nbss phases (Figure 2c) with a higher volume fraction of the Nbss (Table 1). The microstructure shown in Figure 2c had evolved from a very fine eutectic that had formed at the very bottom of ZF6-AC where the melt had been in direct contact with the water-cooled copper crucible.
After the heat treatment the actual composition of the heat-treated specimen (ZF6-HT) was 43.1Nb-24.3Ti-17.4Si-5.8Ge-4.2Cr-5.2Al (Table 2). The XRD data (Figure 1) would suggest that the Nbss, βNb5Si3 and αNb5Si3 phases were present. The microstructure is shown in Figure 2d. The volume fraction of the Nbss did not change significantly (Table 1). Ti-rich areas were still observed in the Nb5Si3. The C14-Cr2Nb Laves phase and the eutectic were absent after the heat treatment. A phase with black contrast was formed at a small volume fraction at the edges of some Nbss and Nb5Si3 grains. X-ray elemental maps taken in EPMA confirmed that this phase was rich in oxygen and Ti (Figure 3).
3.2. Nb-24Ti-18Si-5Ge -5Cr-5Al-5Hf (Alloy ZF9)
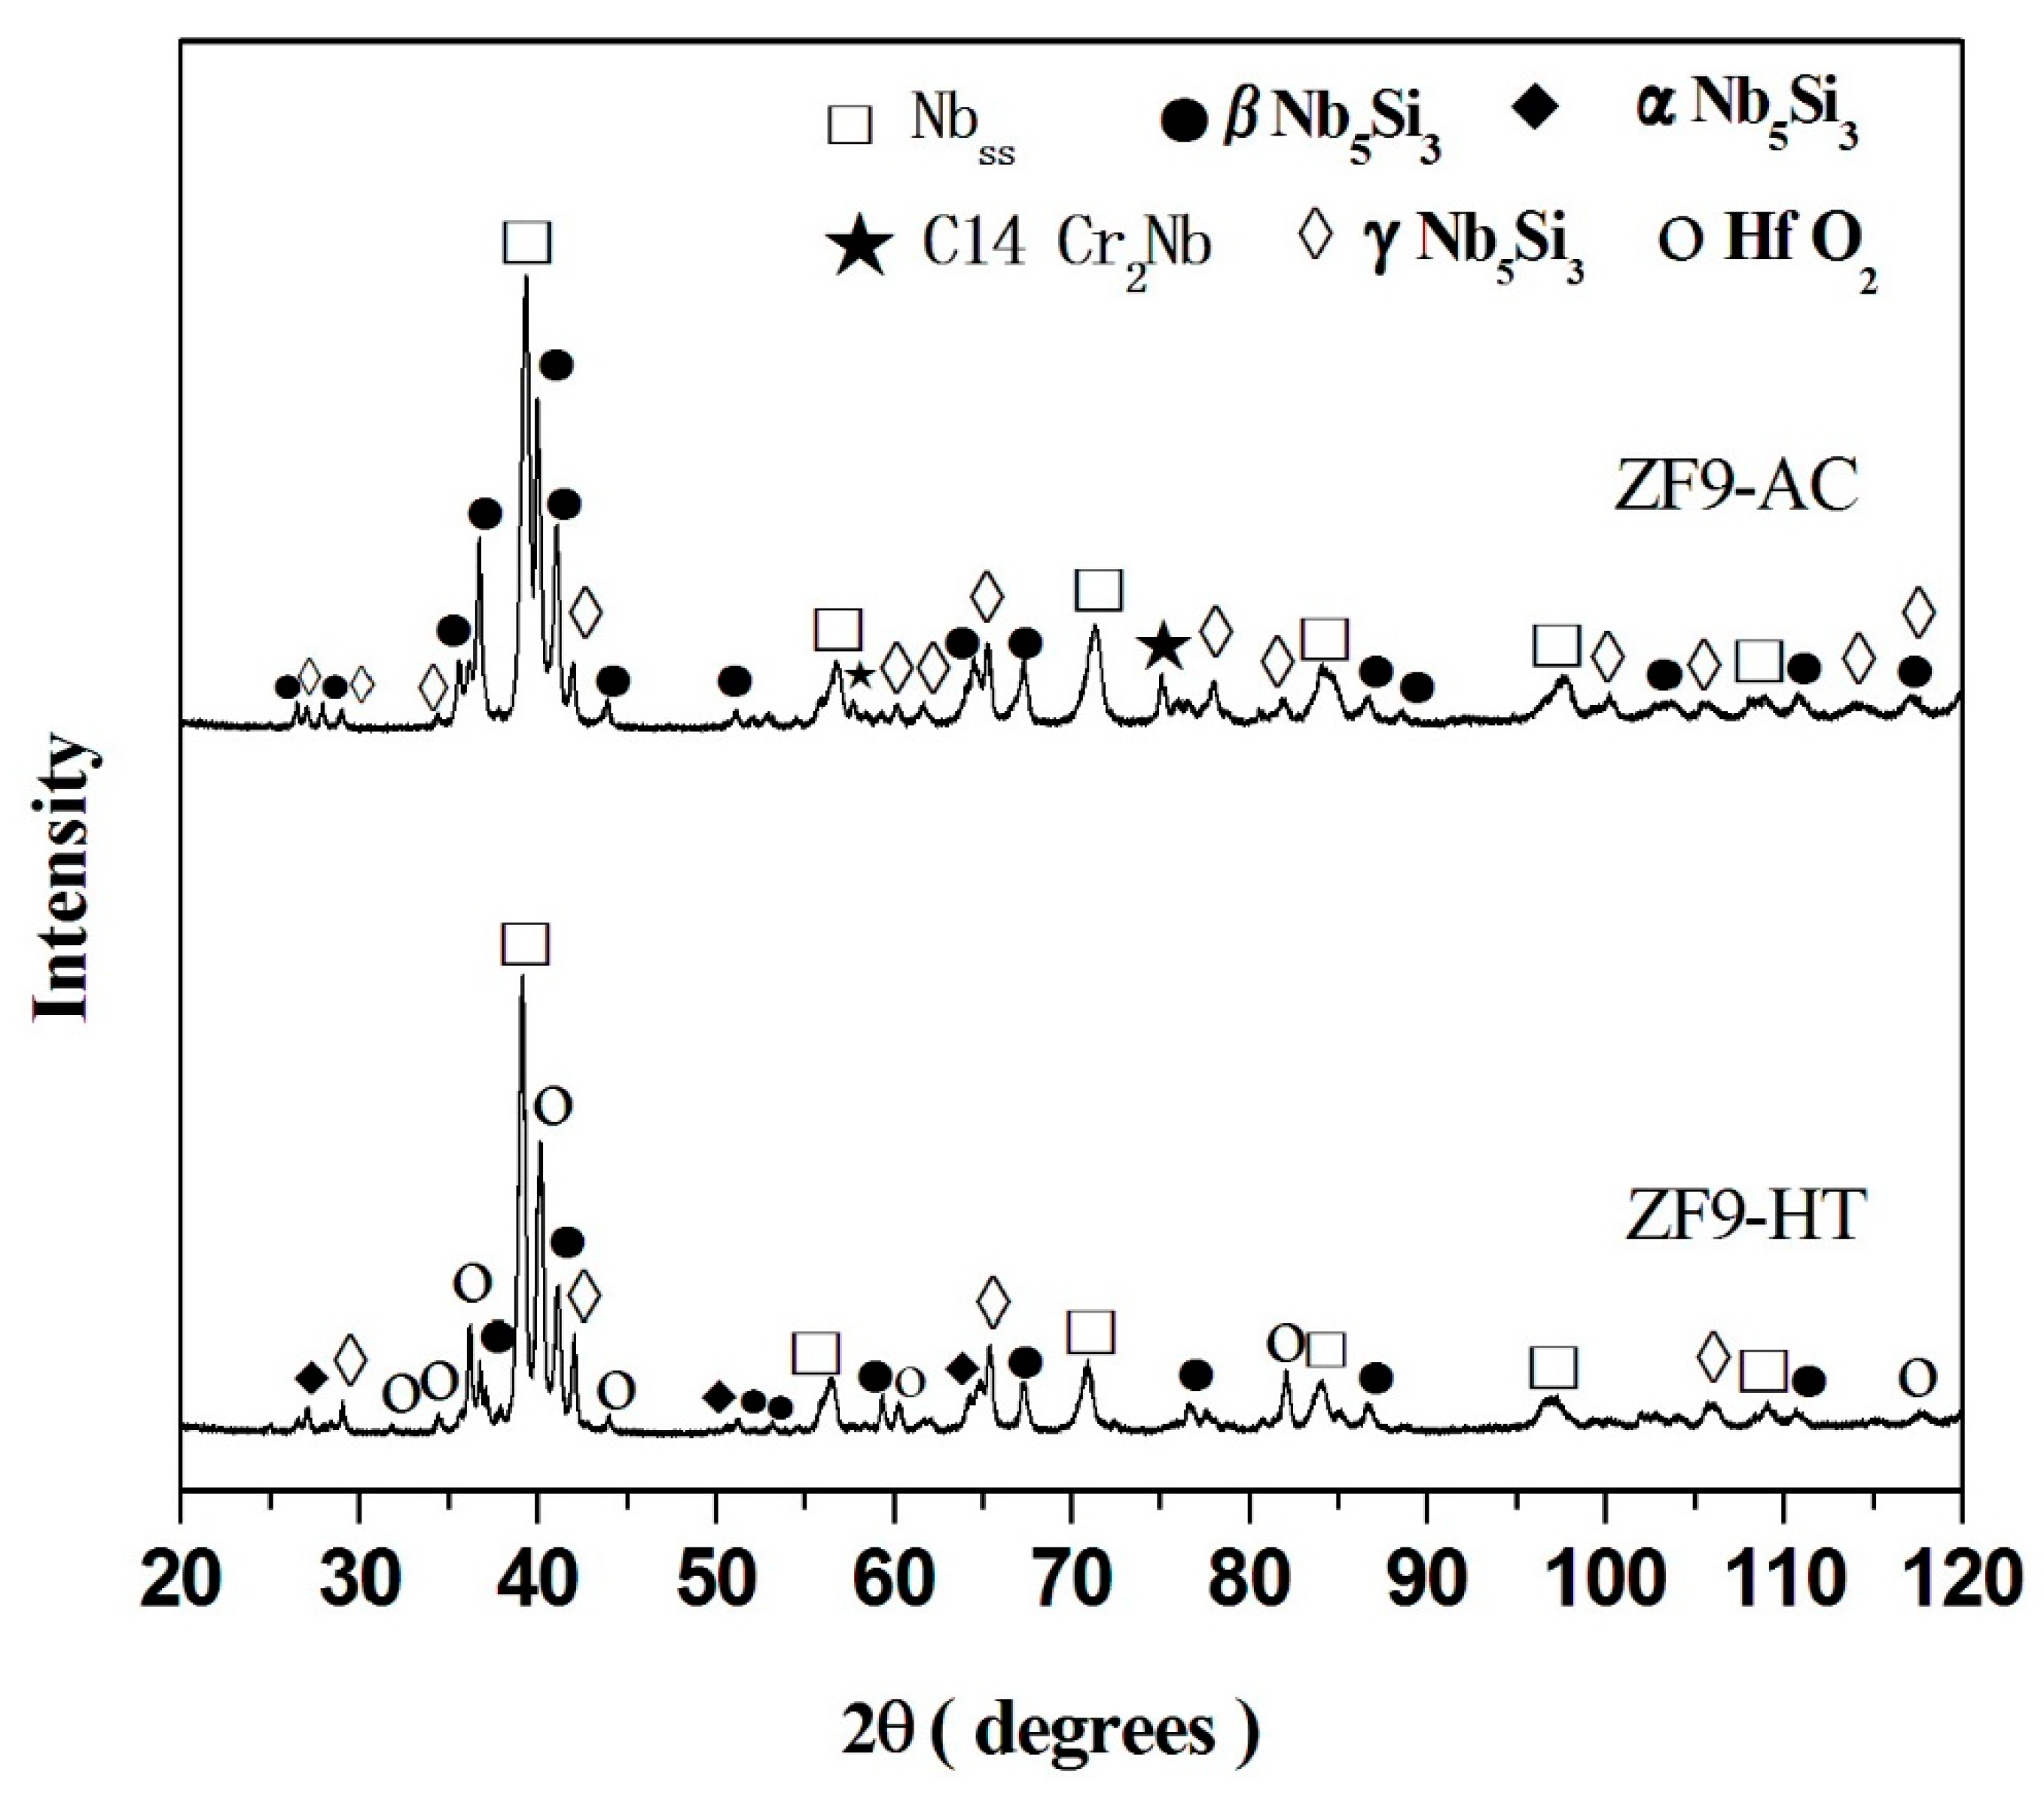
The actual composition of the as cast alloy (ZF9-AC) was 35.8Nb-26.4Ti-16.4Si-5.3Ge-5.6Cr-5.1Al-5.4Hf and its density was 6.96 ± 0.02 g/cm3 (Table 1). There was macrosegregation of Ti, Si, Al and Cr the concentrations of which were in the ranges 24.1 to 27.5 at.%, 15.3 to 18.4 at.%, 4.1 to 6.1 at.% and 4.3 to 6.4 at.%, respectively (Table 3). The phases present in the microstructure of ZF9-AC were the Nbss, βNb5Si3, γNb5Si3 and C14-Cr2Nb (Figure 4 and Table 3). Typical images of the microstructure are shown in Figure 5a–c. The partitioning of Hf between the aforementioned phases made the characterisation of the microstructure extremely difficult owing to only slight variations in contrast between different phases under back scatter electron imaging conditions. The phase with grey contrast in Figure 5 was Nb5Si3 with average composition 37.2Nb-21.0Ti-24.2Si-6.6Ge-1.2Cr-5.0Al-4.8Hf and Si + Ge + Al concentration about 35.8 at.%, close to the Si concentration in unalloyed Nb5Si3. The phase with light grey contrast in Figure 5 was Hf-rich Nb5Si3 in which the Hf concentration was almost double that in the Nb5Si3. The Nbss was formed between the former two phases and exhibited dark gray contrast. Reliable results of the volume fraction of the Nbss in this alloy could not be obtained as the contrast of the solid solution was close to that of the Nb5Si3 and Hf-rich Nb5Si3. The C14-NbCr2 Laves phase was formed between the Nbss and Hf-rich Nb5Si3 in the top and bulk of ZF9-AC and its average composition was 20.5Nb-19.7Ti-5.6Si-1.3Ge-43.7Cr-4.0Al-5.2Hf. As was the case in the alloys Nb-24Ti-18Si-5Cr-5Ge [15] and ZF6, the Laves phase was absent in the bottom of the button of ZF9-AC. The Nbss + Nb5Si3 eutectic was not observed in any part of the button of this alloy. A microstructure exhibiting fine features that could be representative of eutectic was observed only once in one area in the top of ZF9-AC. Detailed study of the button did not find any other areas with similar features.
After the heat treatment the actual composition of the heat-treated specimen (ZF9-HT) was 38.0Nb-24.2Ti-17.1Si-5.2Ge-4.8Cr-5.5Al-5.2Hf (Table 3). The XRD data (Figure 4) would suggest that the phases Nbss, βNb5Si3, γNb5Si3, αNb5Si3 and HfO2 were present. The C14-NbCr2 Laves phase was absent. The microstructure is shown in Figure 5d. The Hf-rich Nb5Si3 was still observed. Hafnia particles exhibiting white contrast were found only near the surface of ZF9-HT (Figure 5e). Their average composition (EPMA/WDS) was 34.7Hf-65.3O.
4. Discussion
4.1. Macrosegregation
Macrosegregation is a common phenomenon in as cast Nb-silicide based alloys that are produced in water cooled copper crucibles using non-consumable W electrodes for arc melting [16]. It is also observed in Nb-silicide based alloys that are prepared using vacuum induction melting and induction skull melting [17].
In the alloy ZF6 there was macrosegregation of Si. The latter was low when Ge was in synergy only with Si and increased after alloying with Ti (see Table 6 and compare alloys ZF1 [9] and ZF3 [18]) and with Ti, Al and Cr (Table 6, alloy ZF6). In the alloy ZF9, the addition of Hf reduced the macrosegregation of Si and Al (Table 6 and Table 7), increased that of Ti (Table 7) and did not change the macrosegregation of Cr (Table 7).
Long range transport due to the flow of melt and movement of solid during solidification play a key role in the formation of macrosegregation [19]. The latter also is affected by the composition of the alloy and the viscosity of its melt [19]. Complex interrelationships of heat transfer, solute transport, solid movement and fluid flow control macrosegregation [16]. The macrosegregation of Si in Nb-silicide based alloys has been attributed to such interrelationships that affect the buoyancy and thermo-capillary forces that arise by solute partitioning in these alloys and their effects on the densities of phases and the sign and value of dγL/dT (γL is the liquid surface tension) [16].
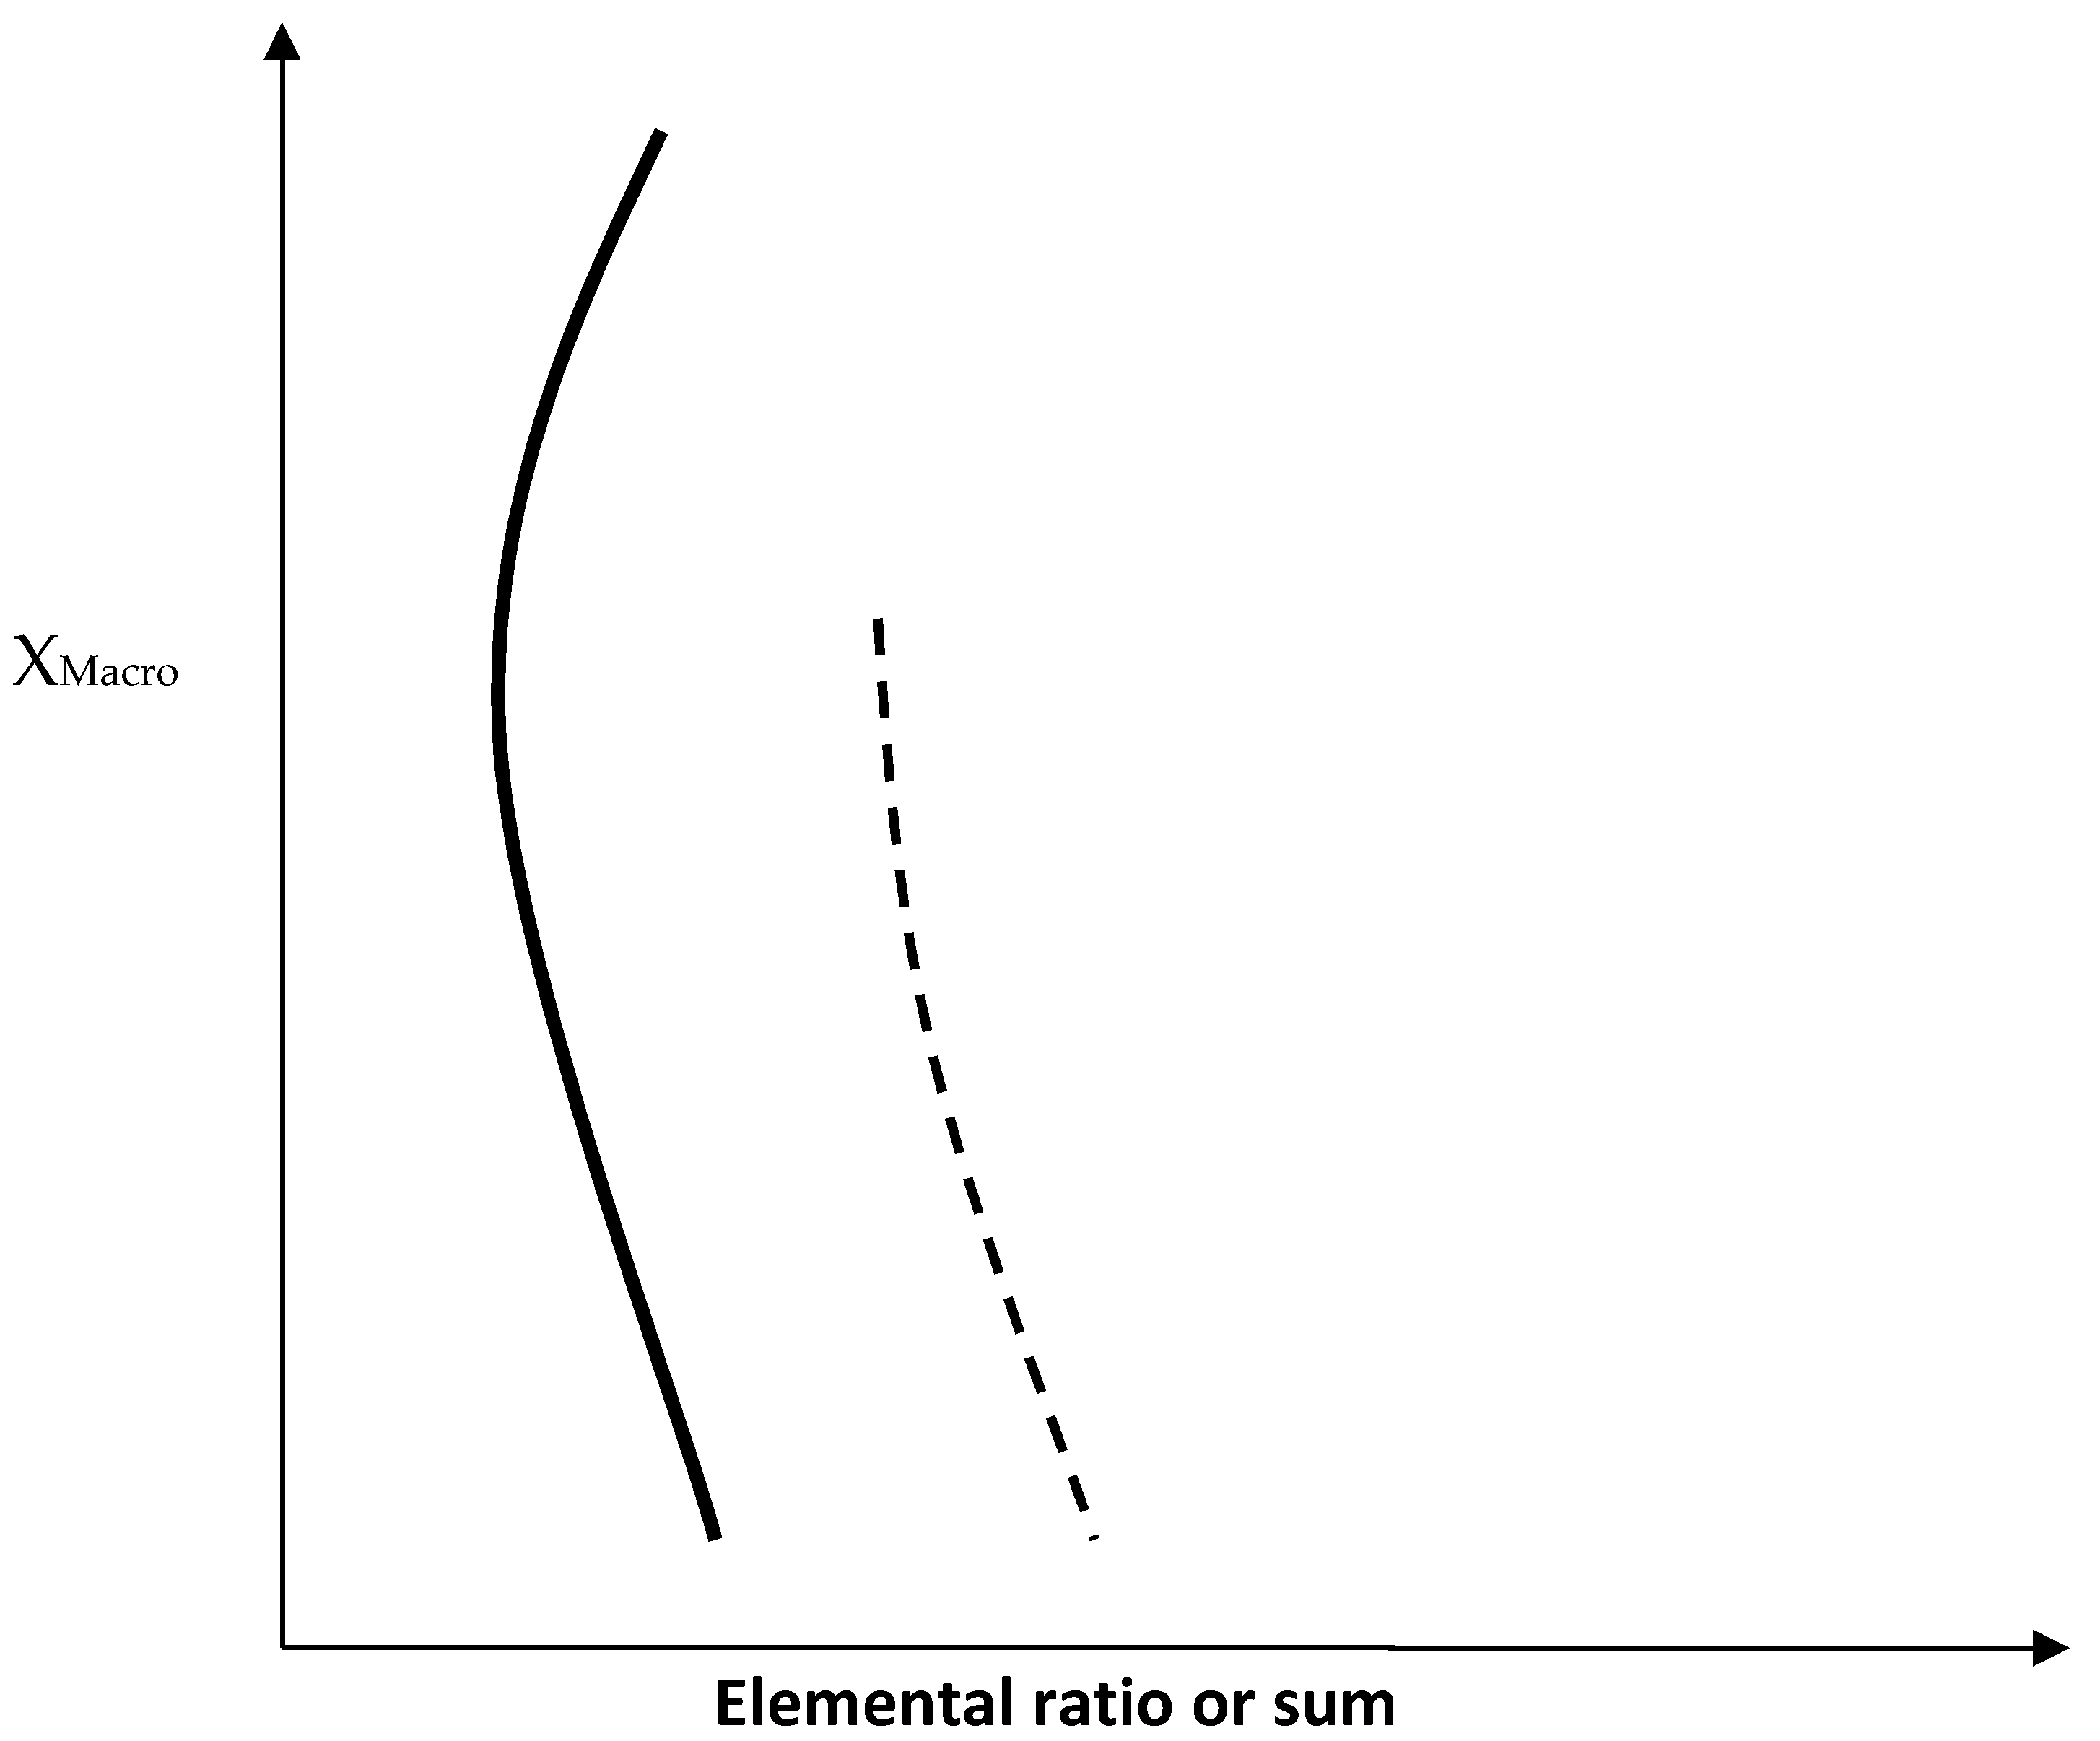
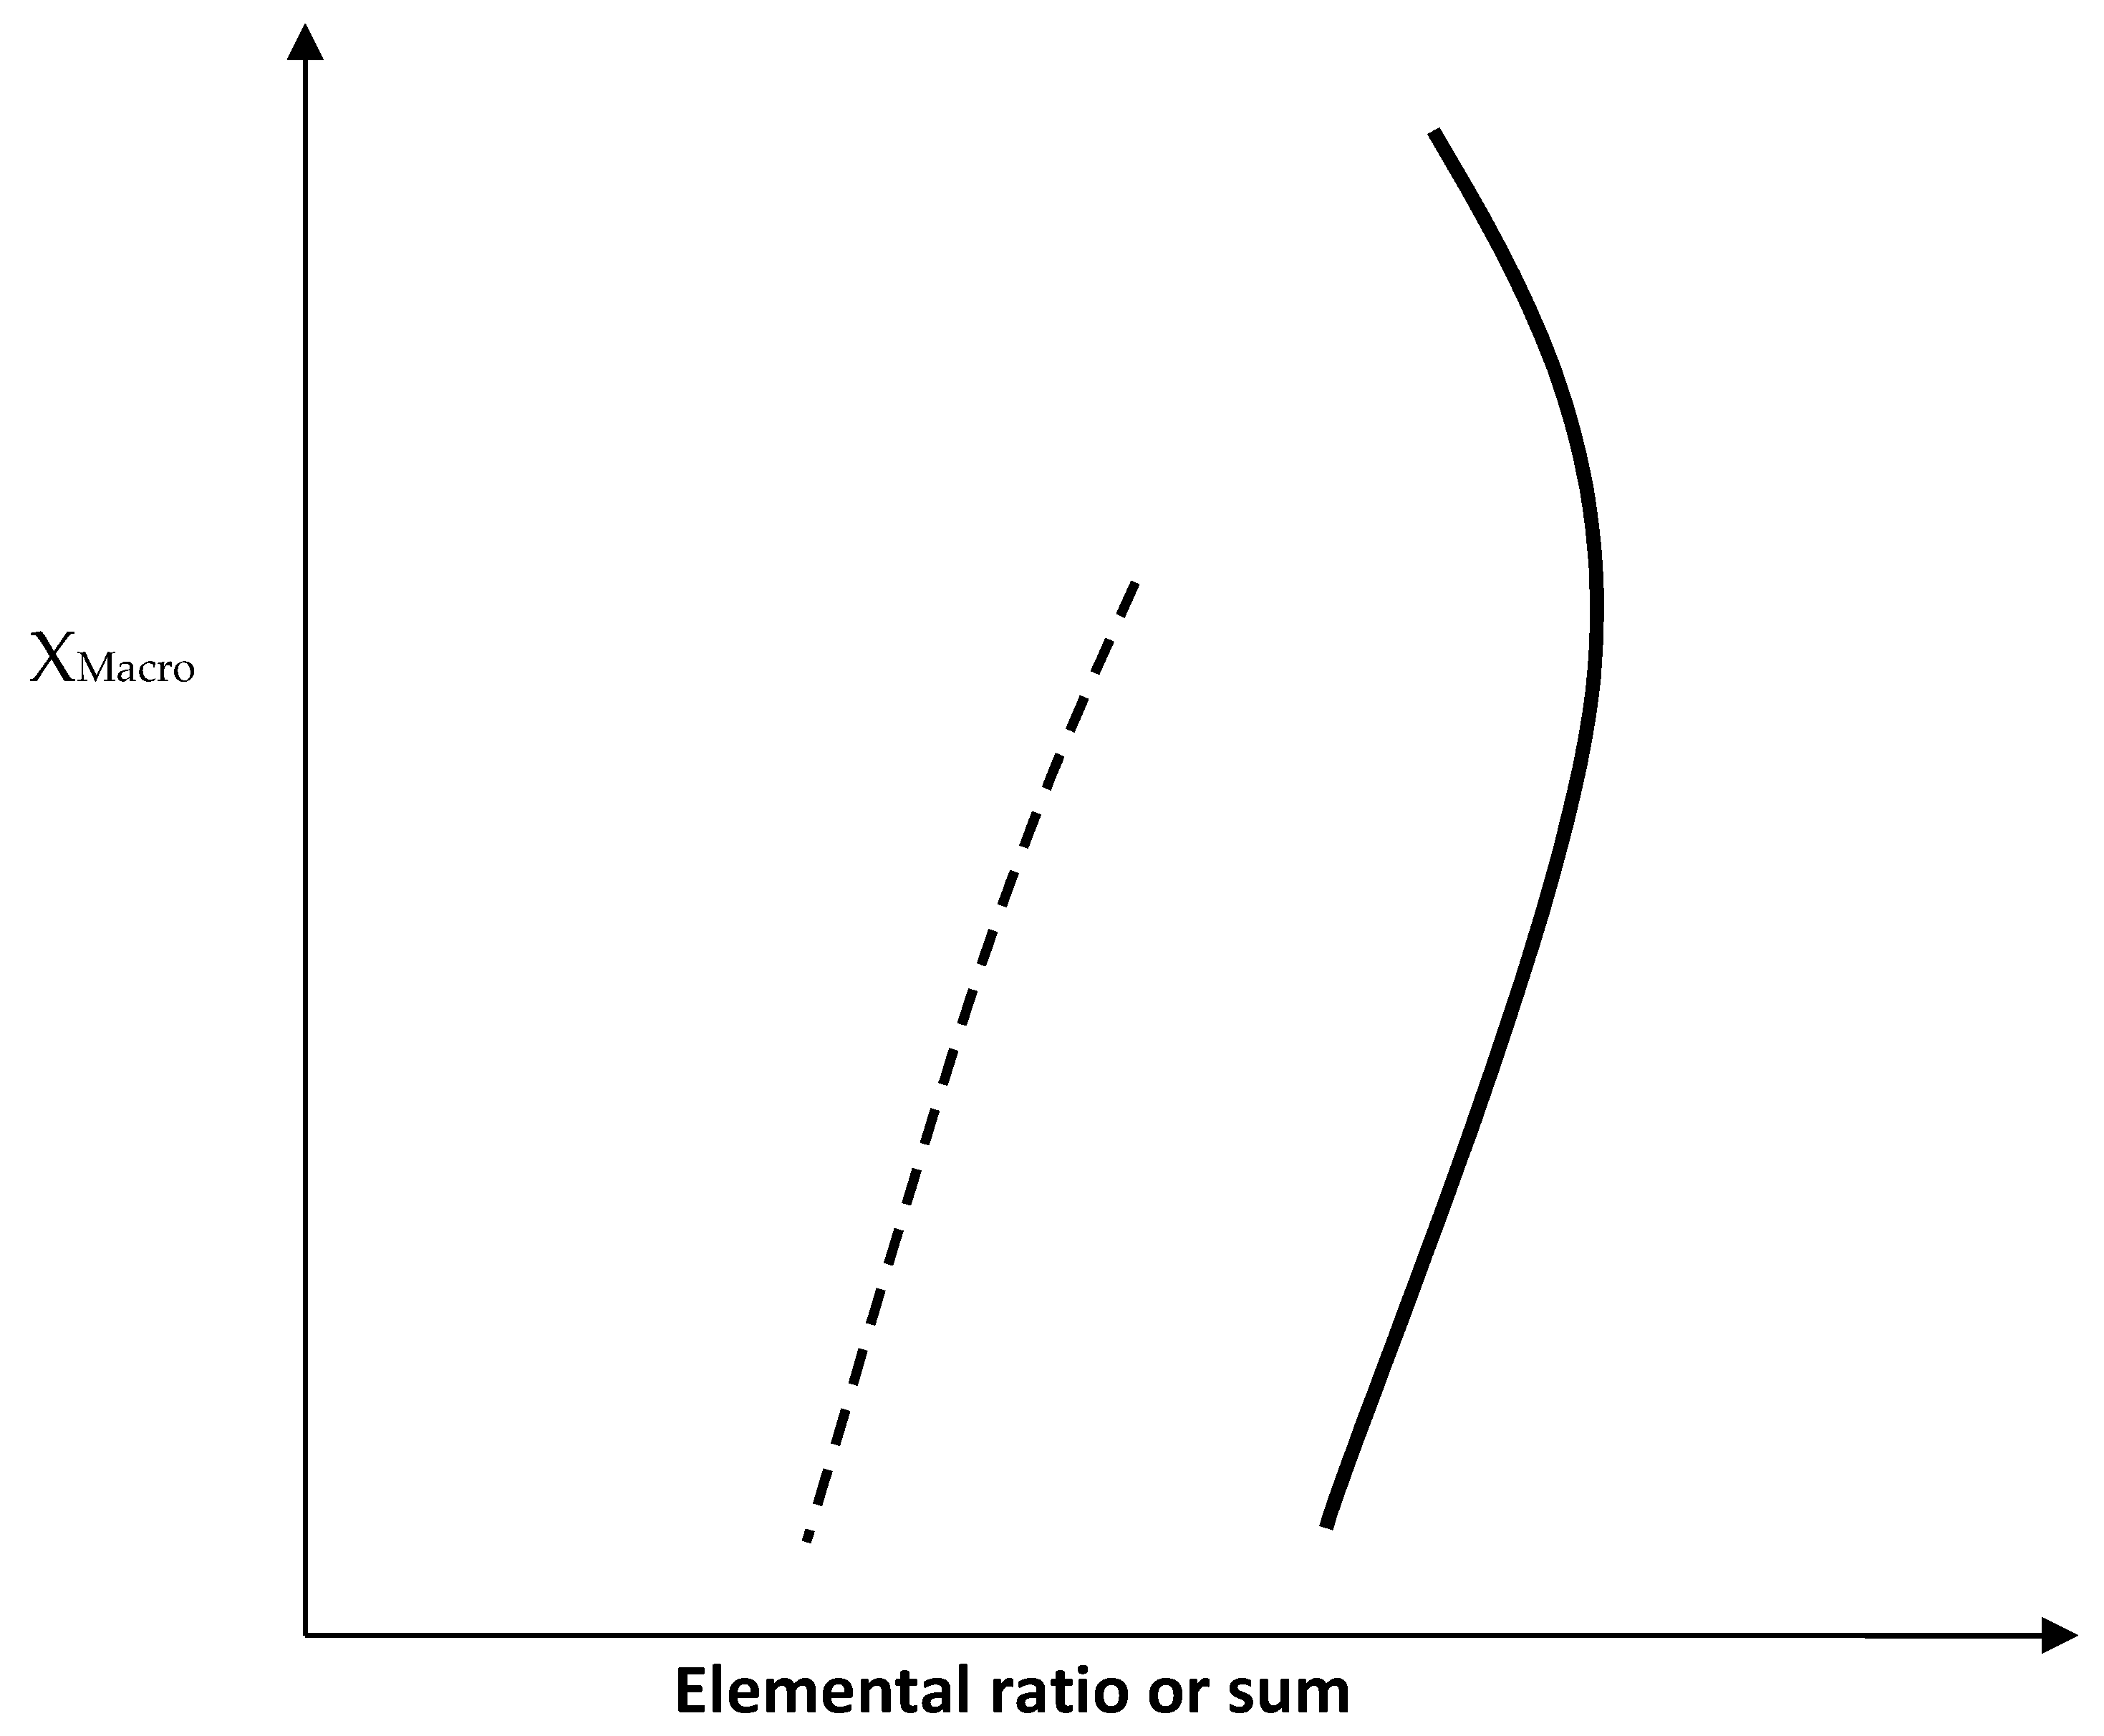
The effect of the synergy of Ge with Hf and other alloying elements on the macrosegregation of Si, Ti and Cr can be understood by studying the role played by solute partitioning in the solidification of Nb-silicide based alloys. The chemical analysis data for the phases present in the alloys for which macrosegregation data is summarised in the Table 6 and Table 7 can help one to find out whether there is dependence of macrosegregation on elemental ratios or sums in the Nbss, Nb5Si3, NbCr2 phases and the Nbss + Nb5Si3 eutectic. Trends for the Si + Ge + Al and Si + Ge concentrations in Nbss + βNb5Si3 eutectics are shown in the Table 8 and Table 9, respectively. The Figure 6 and Figure 7 show the trends in the macro-segregation of Si and Ti for different elemental ratios and sums.
The Figure 6 and Figure 7 show that Si macrosegregation in Nb-silicide based alloys is linked with solute partitioning during solidification, as evidenced by the variation of Si macrosegregation with the ratios and sums of different elements. Figure 6 shows that the ratios (Si/Al)Nbss, (Si/Cr)Nbss, (Ti/Cr)Nbss, (TM/SM)Nbss, (TM/SM)Ti rich Nbss (where TM = Ti + Cr + Hf and SM = Si + Ge + Al), (Si/Al)Nb5Si3, (Si/Cr)Nb5Si3, and the (Si+Ge)eutrectic all exhibit the same trend with increasing Si macrosegregation. The “nose” of the curves corresponds to the alloys ZF6 or ZF9. In Figure 6 the trend of the (Si/Al)Ti rich Nb5Si3 and (Si + Al + Ge)eutectic is shown by the lower part of the curves. The trend in Figure 6 is opposite to the trend shown in Figure 7 for the ratios (Ti/Cr)Nb5Si3, (Ti/Cr)Ti rich Nb5Si3, (TM/SM)Nb5Si3, (TM/SM)Ti rich Nb5Si3, (TM/([Si + Ge])Nb5Si3 (where TM = Ti + Cr + Hf and SM = Si + Ge + Al) and (TM/[Si + Ge])Nbss, ([Si + Ge]/Cr)Laves where the “nose” corresponds to the alloy ZF9. The trend of ([Si + Ge + Al]/Cr)Laves and (TM/([Si + Ge])Ti rich Nbss in Figure 7 is shown by the lower part of the curves and is opposite to that shown in Figure 6. The data would thus suggest that Hf in synergy with Ge, Al, Cr and Ti can reduce, but not eliminate, the macrosegregation of Si and this can be attributed to solute partitioning leading to “maxima” or minima” is specific elemental ratios and sums in the key phases that are present in these alloys. It should be noted that all the aforementioned elements are required for achieving a balance between environmental and mechanical properties in Nb-silicide based alloys [3].
The Figure 6 and Figure 7 also show that Ti macrosegregation in Nb-silicide based alloys is linked with solute partitioning during solidification as evidenced by the variation of Ti macrosegregation with different element ratios and sums. The Figure 6 shows that the ratios (Si/Cr)Nb5Si3, (Si/Al)Ti rich Nb5Si3, (Ti/Cr)Nb5Si3 and (Ti/Cr)Ti rich Nb5Si3 exhibit the same trend with increasing Ti macrosegregation. The “nose” of the curves corresponds to the alloys ZF6 or ZF4. In Figure 6 the trend of (Si/Al)Nb5Si3 and (Si/Al)Nbss is shown by the lower part of the curves. The trend in Figure 6 is opposite to the trend shown in Figure 7 for the ratios (Si/Cr)Nbss and (Ti/Cr)Nbss where the “nose” corresponds to the alloy ZF4. The trend of (Ti/Cr)Ti rich Nbss in Figure 7 is shown by the lower part of the figure and is opposite to that shown in Figure 6. The data would thus suggest that in Ge containing Nb-silicide based alloys the Cr plays the important role in the macrosegregation of Ti owing to partitioning between the Nbss and the Nb5Si3 silicide.
Figure 6 and Figure 7 also show that Cr macrosegregation in Nb-silicide based alloys is linked with solute partitioning during solidification as evidenced by the variation of Cr macrosegregation with different elemental ratios and sums. These two figures show that the ratios (Si/Cr)Nb5Si3 and (Si/Cr)Nbss exhibit opposite trends with the “nose” of the curves corresponding to the alloy ZF9. This would suggest that Hf plays a role in the macro-segregation of Cr. The latter is not strong in Nb-silicide based alloys with Cr ≤ 8 at.% compared with Si or Ti (see Table 7). The Hf is also known not to affect significantly the partitioning of Cr between the Nbss and the Nb5Si3 silicide. Thus, the effect of the synergy of Ge and Hf on the macrosegregation of Cr is expected to be weak.
4.2. Microstructures
4.2.1. Cast Alloys
In both alloys the Nb5Si3 was the primary phase. The solidification paths in the bulk of the ingots were L → L + βNb5Si3 → L + βNb5Si3 + (Nbss + βNb5Si3) eutectic → L + βNb5Si3 + (Nbss + βNb5Si3) eutectic + C14-NbCr2 and L → L+ Nb5Si3 → L + Nb5Si3 + Nbss → L + Nb5Si3 + Nbss + C14-NbCr2, respectively for the alloys ZF6 and ZF9 with the C14-NbCr2 forming from the last to solidify liquid. The addition of Hf suppressed the Nbss + βNb5Si3 eutectic but not the Laves phase.
The formation of the Laves phase is linked with Cr redistribution during solidification [12]. This would explain its absence in the bottom of the buttons owing to the effect of cooling rate on Cr partitioning [14,15]. The addition of Hf made possible the formation of the C14-NbCr2 Laves phase at higher cooling rates in ZF9-AC, compared with ZF6-AC.
Compared with the alloy KZ5-AC (Nb-24Ti-18Si-5Al-5Cr [12]) the addition of Ge in ZF6-AC decreased the solid solubility of Cr in the Nbss. Compared with the alloy ZF6-AC the addition of Hf in ZF9-AC (i) increased the solid solubilities of Cr and Al and decreased the solid solubility of Ge in the Nbss.
There are three types of 5-3 silicides in the binary Nb-Si system [20], namely the βNb5Si3 (tI32, I4/mcm, prototype W5Si3), αNb5Si3 (tI32, I4/mcm, prototype Cr5B3) and γNb5Si3 (hP16, P63/mcm, prototype Mn5Si3), the former two are the equilibrium phases and the third is metastable and is stabilised by interstitial impurities [20]. The latter silicide has the same structure with the Ti5Si3 and Hf5Si3 [21] silicides. Thus, it is expected that alloying the Nb5Si3 with Ti or/and Hf would tend to increase the stability of the γNb5Si3. The XRD data of ZF9-AC (Figure 4) contained characteristic peaks corresponding to the γNb5Si3. Bewlay et al [22] suggested that the Nb5Si3 had hexagonal rather than tetragonal structure when the Nb/(Ti+Hf) ratio was less than one in the alloy and silicide. For the Nb5Si3 and Hf rich Nb5Si3 silicides in the present work the above ratio was in the range 1.4 to 1.5 (Table 3).
The Al content of the Nbss + βNb5Si3 eutectic in the alloy ZF6 (Table 8) was the same with the eutectic in the cast alloy ZF5 (Nb-24Ti-18Si-5Al-5Ge [13]) but not the Si + Ge content (Table 9). This was attributed to the synergy of Al and Ti, which is stronger than that of Cr and Ti (Table 9, compare the alloys ZF8-AC and ZF5-AC with the alloys ZF7-AC and ZF4-AC).
The C14-NbCr2 Laves phase was observed in the bulk of the buttons of the alloys ZF6-AC, ZF9-AC and in ZF4 (Nb-24Ti-18Si-5Cr-5Ge [15]), and was absent in the bottom of the buttons of all three alloys but present in the top only of the latter two alloys. If we were to use the ratio Λ = [Si + Ge (+ Al)]/Cr as a criterion for the sensitivity of C14-NbCr2 Laves phase formation on alloy composition and consider the large area analysis data for the top, bulk and bottom of the above alloys given in Table 2 and Table 3 and [15], it is concluded that the lowest value of Λ for Laves phase formation in Ge containing alloys is about 3.7 at.% when Al is not present in the alloy and about 4.3 at.% when Al is in synergy with Cr.
In the alloys ZF6-AC and ZF9-AC the Laves phase was the hexagonal C14-Cr2Nb (hP12) (Figure 1 and Figure 4). In the Laves phase the Al and Si atoms substitute for Cr atoms [23]. Furthermore, alloying with Si [24] or Al [25] stabilises the C14-NbCr2 to low temperatures. The Si + Ge + Al + Cr concentration in the Laves phase (or B element content in AB2 = NbCr2) in the alloys ZF6 and ZF9 was respectively 56.8 at.% and 54.6 at.% and the Ge concentrations were 1.2 at.% and 1.3 at.%, respectively. Thus, the B element content in the C14-NbCr2 was similar to that reported in the alloys KZ4 (Nb-24Ti-18Si-5Cr) and KZ7 (Nb-24Ti-18Si-5Al) [12] and JG3 (Nb-24Ti-18Si-5Al-5Cr-5Hf-2Mo [26]) where the (Cr + Si + X)/(Nb + Y) ratio (X = Al, Y = Hf, Ti) was in the range 1.1 to 1.5 compared with (Cr + Si + X)/(Nb + Y) ratios of 1.3 and 1.2, respectively for the alloys ZF6 and ZF9 (X = Al, Ge, Y = Hf, Ti). The off-stoichiometric and lean in B element content NbCr2 has also been reported in alloys of the Nb-Cr-Ti [27] and Nb-Cr-Hf [28] ternary systems and was attributed to the anti-site defect substitution with Ti or Hf partitioning to A site and thus displacing some Nb atoms to the B site in AB2 = NbCr2. The Ge concentration in the Laves phase was in agreement with [10]. Considering the data for the C14-NbCr2 Laves phase in [15] it is suggested (a) that Al does not affect the solid solubility of Ge in this phase, which is about 1.3 at.% and (b) that in the presence of Ge the solid solubility of Si in the Laves phase is in the range 5.5 to 6.5 at.%.
4.2.2. Heat Treated Alloys
After the heat treatment no Ti rich areas were observed in the Nbss, meaning the latter was “homogenized”. The Si and Ge concentrations in the Nbss were low (Table 2 and Table 3) and in agreement with those in the binary Nb-Si and Nb-Ge systems [20,21]. Thus, the synergy of Cr and Al with/out Hf did not change significantly the solid solubilities of both Si and Ge in the Nbss and did not affect the “homogenization” of the solid solution. In the Nbss in ZF6-HT the solid solubilities of Cr and Al did not change but in ZF9-HT the solid solubility of both Cr and Al decreased. This was attributed to the synergy of Hf and Ge. The Laves phase was absent in both alloys, as was also the case in the heat-treated alloys KZ5 (Nb-24Ti-18Si-5Al-5Cr [12]) and JG3 (Nb-24Ti-5Al-5Cr-5Hf-2Mo [26]).
According to the XRD data (Figure 1 and Figure 4) the βNb5Si3 had partially transformed to the αNb5Si3 in both alloys. Thus, equilibrium was not reached in both alloys after 100 h at 1400 °C. This and the data in [13,15,18] for heat treated Ti and Ge containing alloys would suggest that alloying with Ge makes the transformation of βNb5Si3 to αNb5Si3 more sluggish.
In the Nb5Si3 the solid solubilities of Ti, Si, Cr, Al and Ge were essentially the same in both alloys. The Hf-rich areas in Nb5Si3 were still present in ZF9-HT with no significant change in the solubility of Hf. Compared with the data for Hf containing Nb-silicide based alloys in [29,30] it is concluded that the solubility of Hf in Nb5Si3 is not affected by the presence of Ge in the alloy.
In the alloy ZF6-HT, a very small volume fraction of Ti rich oxide was formed at the edges of some of its Nbss and Nb5Si3 grains (Figure 2d and Figure 3). This oxide was also observed in heat treated Ti and Ge containing alloys with no Hf present [13,15,18], but was absent in Ti free but Ge containing heat treated Nb-silicide based alloys [9,13,18]. This phase formed because of the contamination of the alloy by O during heat treatment. In the ZF9-HT, HfO2 was formed instead of titanium oxide. This is in agreement with data for heat treated Hf and Ti-containing Nb-silicide based alloys [29,30] and confirmed the scavenging of oxygen by Hf.
4.2.3. Lattice Parameter of The Nbss
The atomic radii of Nb, Ti, Si, Ge, Cr, Al and Hf are 1.47 Å, 1.47 Å, 1.17 Å, 1.39 Å, 1.30 Å, 1.43 Å and 1.59 Å, respectively [31]. Compared with the alloys ZF4 (Nb-24Ti-18Si-5Cr-5Ge [15]) and ZF5 (Nb-24Ti-18Si-5Al-5Ge [13]), the lattice parameter of the Nbss in the alloy ZF6 respectively decreased by about 0.40% and 0.55% in the as cast condition, and by about 0.28% and 0.73% in the heat treated condition (Table 4). The contraction of the lattice of Nbss individually by Cr and Al was discussed in [13,15]. The data for the alloy ZF6 would thus suggest that the synergy of Ge with Al and Cr led to further contraction of the Nbss lattice. The increase of the lattice parameter of the Nbss in ZF6-HT was attributed to the reduction in the concentrations of Ti, Si, Ge and Al.
The addition of Hf to the Nbss was reported to increase the lattice parameter owing to the larger atomic radius of Hf compared with that of Nb [32,33]. In this work the lattice parameter of the Nbss in the alloy ZF9 was 0.12% higher than that in the alloy ZF6 in the as cast and heat-treated conditions. The increase of the Nbss lattice parameter in ZF9-HT, compared with the as cast condition, was attributed to the reduction of the concentrations of all solute elements.
4.3. Comparison with High Entropy Alloys
Some Nb-silicide based alloys, some bcc Nb solid solutions in Nb-silicide based alloys and some of the eutectics with bcc Nbss + βNb5Si3 in Nb-silicide based alloys meet the “accepted” definition of High Entropy Alloys (HEAs) [3]. According to this definition, which asserts that HEAs have principal elements with the concentration of each element being between 35 and 5 at.% [34], the alloy ZF9 is a HEA. However, the alloy ZF6 does not comply with this description of HEAs. More specifically, the alloy ZF9 is a refractory metal (RM) based bcc solid solution + intermetallics HEA or a RM complex concentrated alloy (CCA). The parameters ΔHchem, ΔSmix, VEC, δ, Δχ and Ω have been considered for solid solution(s) and solid solution(s) + intermetallic(s) HEAs [34] and Nb-silicide based alloys [3,35,36]. The data in Table 10 shows that the above parameters of the alloys ZF6 and ZF9 do not differ significantly, even though only one of them (ZF9) meets the “criterion” for HEAs. The data in Table 10 shows that the solid solutions of both alloys also do not comply with the above definition of HEAs. The aforementioned parameters of both alloys and their solid solutions are in the ranges for Nb-silicide based alloys [35] and their solid solutions [36].
Research on HEAs has indicated ranges for the above parameters for bcc solid solution(s) and bcc solid solution(s) + intermetallic(s) HEAs. Both alloys of this study have ΔHchem more negative than bcc solid solution + intermetallic HEAs, their parameters ΔSmix and δ are in the range of bcc solid solution + intermetallic HEAs, and the parameters VEC and Ω are smaller than those of bcc solid solution + intermetallic HEAs [35]. The bcc solid solutions in the alloys ZF6 and ZF9 (a) have ΔHchem and ΔSmix, δ and Ω in the range of RM based bcc solid solution HEAs [37], (b) their Ω values fall in the lower range of Ω values for the RM based bcc solid solution HEAs [37] and (c) their parameters VEC, δ, Ω, Δχ and ΔH are in the range of bcc solid solution HEAs [38,39,40].
The density of RM HEAs (or RM CCAs) is in the range 5.59 g/cm3 (for bcc AlNbTiV) to 13.75 g/cm3 (for bcc MoNbTaW) [34]. The majority (74%) of the twenty-three RM HEAs reported in [34] have densities higher than those of the alloys ZF6 and ZF9. More specifically, only the NbTiV2Zr (bcc, 6.38 g/cm3) and CrNbTiVZr (bcc + Laves, 6.52 g/cm3) HEAs have densities lower than the alloy ZF6 and the latter alloys and the NbTiVZr (bcc, 6.5 g/cm3), CrNbTiZr (bcc + Laves, 6.7 g/cm3) and AlNb1.5Ta0.5Ti1.5Zr0.5 (bcc, 6.88 g/cm3) HEAs have densities lower than the alloy ZF9.
The hardness of RM bcc HEAs or CCAs is in the range 306 HV (NbTiV2Zr, bcc) to 591 HV (AlMo0.5NbTa0.5TiZr, bcc + B2) [34]. The hardness of the Nbss in ZF6-HT was higher than the aforementioned range and higher than that of the bcc solid solution RM based HEAs AlNb1.5Ta0.5Ti1.5Zr0.5, Al0.4Hf0.6NbTaTiZr, and Al0.3NbTa0.8Ti1.4V0.2Zr1.3 reported in [37].
4.4. Hardness
The hardness of the alloy ZF6 was higher by 11.9% and 8.4% compared with the alloy ZF4 (Nb-24Ti-18Si-5Al-5Ge [13]), and lower by 3.6% and 8.2% compared with the alloy ZF5 (Nb-24Ti-18Si-5Cr-5Ge [15]) in the as cast and heat treated conditions, respectively. The alloy ZF6 exhibited good retention of its hardness after the heat treatment at 1400 °C, as was the case for the alloys ZF4 and ZF5. The hardness data for these three alloys would suggest that in the synergy of Ge with Al and Cr the latter is the key element. Compared with the alloy ZF6, the addition of Hf in the alloy ZF9 resulted to a reduction of hardness by 4.6% and 8.8% in the as cast and heat-treated conditions, respectively. The alloy ZF9 exhibited good retention of its hardness after the heat treatment as the hardness was lower by 2.7% than that of ZF9-AC.
The synergy of Cr and Al in the alloy ZF6 cancelled out the negative effect of Al on the hardness of Nbss [13,15] and would suggest that the synergy of Cr and Ge is key to strengthening the Nbss. The hardness of Nb5Si3 in the alloy ZF6 was almost the same as in ZF4 [13] in both the as cast and heat-treated conditions, and lower than that in the alloy ZF5 [15]. This would suggest that in the synergy of Al and Cr with Ge the Al “controls” the hardness of Nb5Si3. The hardness of Nb5Si3 in ZF9 was lower in both the as cast and heat-treated conditions compared with ZF6. This would suggest that the synergy of Hf with Al, Cr and Ge has a softening effect on Nb5Si3. The hardness of Nb5Si3 in ZF9-HT was the same as that of unalloyed Nb5Si3.
The application of the rule of mixtures (ROM) to calculate the strength of composites assumes the matrix of the composite to be unaffected by the reinforcement. The hardness of ZF6-HT calculated using ROM is 1423 HV and the measured value was 854 HV (Table 5). In the Ti free alloys ZF1 (Nb-18Si-5Ge) and ZF2 (Nb-18Si-10Ge) with microstructures consisting of Nbss and Nb5Si3, the same as ZF6-HT, best agreement with the experimental value was given by a Pythagorean type addition rule [9]. If we assume that the Pythagorean rule [41] applies in the case of ZF6-HT a correction of 0.652 would be necessary to match the two values. This correction is essentially the same with the average correction of 0.638 for all alternative addition rules of calculating HV [9,42].
The hardness of the alloys ZF1-HT15 and ZF2-HT15 respectively was 812 HV and 819 HV and the microhardness of Nb5Si3 in the two alloys was 1532 and 1526 HV, respectively [9]. In other words, the hardness values of these alloys and their Nb5Si3 silicides were not significantly different than those of the alloy ZF6-HT. Why the Pythagorean rule addition did not work in the case ZF6-HT? The alloys ZF6 and ZF2 essentially were intermetallic matrix composites, ZF6 is different from ZF2 (see below) and ZF1 is a metal matrix composite. We would like to suggest that the difference is attributed to the microstructures of the three alloys and in particular the constraint effects on hardness.
The strength of in-situ composites is strongly affected by the size, shape and distribution of the matrix and reinforcement phase(s). The presence of sharp corners in the latter, which can act as stress concentrators, must be taken into account in composite strengthening [43]. The constraint imposed by the brittle intermetallic phase on the ductile matrix can contribute significantly to the composite strength. Research on composites has considered different strengthening mechanisms which either independently or simultaneously can be responsible for the strength of a composite. The proposed mechanisms include (a) strengthening due to constrained plastic flow in the ductile matrix owing to the presence of brittle intermetallics [44] and (b) cavitation at the interfaces and the matrix in the high stressed regions near sharp corners in the reinforcement [45].
The microstructure of the as cast alloy ZF6 had a very high (>0.8) volume fraction of strongly faceted large Nb5Si3 grains with thinner layers of Nbss and Nbss + Nb5Si3 eutectic confined in between the Nb5Si3 grains (Figure 2b). After the heat treatment the prior eutectic was not observed in between the large silicide grains. The as cast alloys ZF1 and ZF2 had microstructures consisting of primary Nb5Si3 and Nbss + Nb5Si3 eutectic. The vol.% of primary Nb5Si3 was slightly more than double in the alloy ZF2 [9]. In both alloys the primary Nb5Si3 was faceted. The ZF1-HT15 had Nb5Si3 with fine prior eutectic in between Nb5Si3 grains (constraint different from ZF6-HT), the ZF2-HT15 had similar microstructure with ZF1-HT5 but with higher vol.% of Nb5Si3 and less fine prior eutectic between the non-facetted Nb5Si3 grains (constraint different from ZF6-HT).
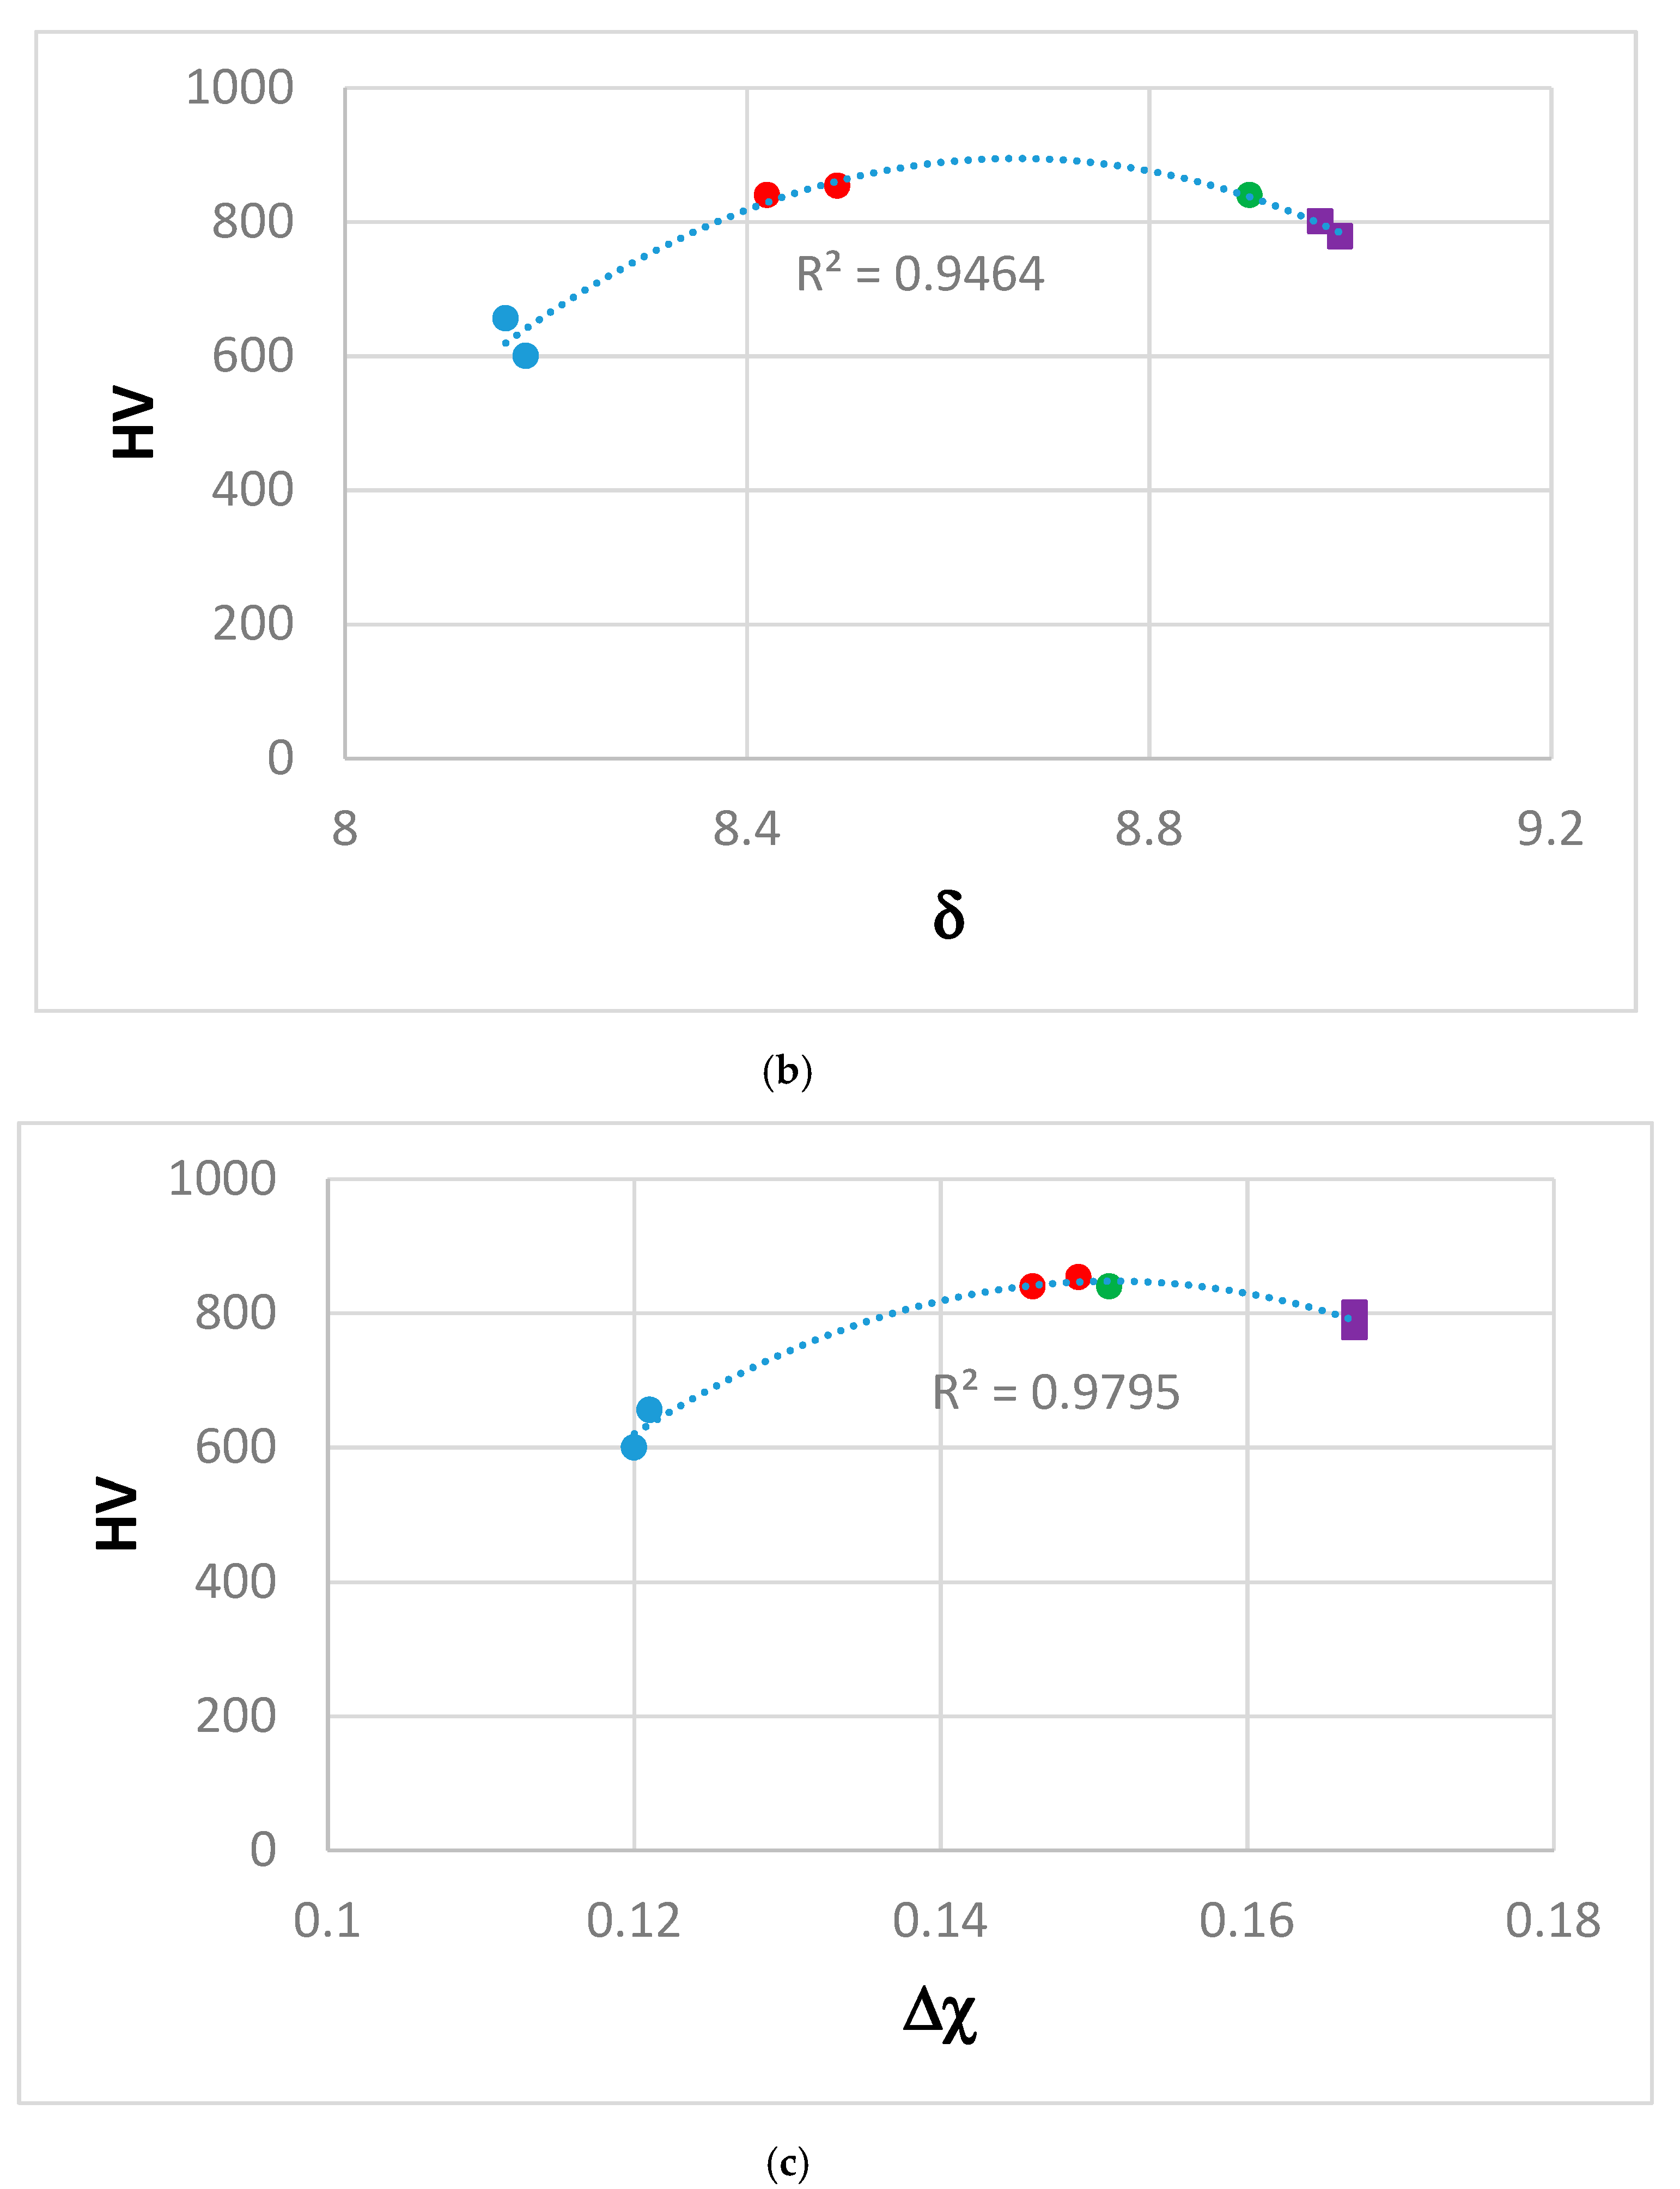
The alloying behaviour of Nb-silicide based alloys and of the phases that can be present in their microstructures, and properties of the alloys and their phases can be studied using the parameters VEC, δ and Δχ [3,4,8,35,36]. In Figure 8 we show how the hardness of the alloys KZ5 (Nb-24Ti-18Si-5Al-5Cr), JN1 (Nb-24Ti-18Si-5Al-5Cr-5Hf [46]), ZF6 and ZF9 varies with the alloy parameters VEC, δ and Δχ. Data for the alloys KZ5 and JN1 has been included in order to show how the additions of Hf and/or Ge to the “basis” alloy KZ5 affect hardness. The Nb5Si3 was facetted in the alloys KZ5, JN1 and ZF6. The Hf-rich Nb5Si3 in ZF9 was also faceted (Figure 5b). The hardness increased as the alloy VEC value decreased and the values of the alloy parameters δ and Δχ increased. The alloy KZ5 had 48–55 vol.% Nbss and 45-52 vol.% Nb5Si3 [12], the alloy JN1 had 42 vol.% Nbss and 58 vol.% Nb5Si3 [46] and the alloy ZF6-HT had 17.3 vol.% Nbss and 82.7 vol.% Nb5Si3. Constraint effects on hardness owing to the faceting of Nb5Si3 apply to all alloys. The hardness increased as the vol.% of Nb5Si3 increased compared with the alloy KZ5. All the alloys fall on the same curve with high R2 values in all cases in the HV versus VEC, δ and Δχ plots in Figure 8. Remarkably, the alloy ZF9 falls in the same curve with the alloys KZ5, JN1 and ZF6 even though only its Hf-rich Nb5Si3 was facetted. The alloy ZF9 also had a higher vol.% of Nb5Si3.
5. Conclusions
In this work we studied the effects of the synergy of Ti, Ge, Cr, Al and Hf additions on the microstructure and hardness of the as cast and heat-treated alloys Nb-24Ti-18Si-5Al-5Cr-Ge (ZF6) and Nb-24Ti-18Si-5Al-5Cr-5Ge-5Hf (ZF9). We also compared these alloys with RM bcc solid solution + intermetallic HEAs. The partitioning of Al, Cr, Ge, Hf and Ti between the phases that were present in the microstructures contributed to the macrosegregation of Si, Ti, Cr and Al in both alloys. Alloying with Hf reduced but did not eliminate the macrosegregation of Si. Chromium was the key element in the macrosegregation of Ti. The microstructures of the cast alloys consisted of the bcc Nbss, Nb5Si3 silicide and C14-NbCr2 Laves phase and the βNb5Si3 was the primary phase. The Nbss + βNb5Si3 eutectic was formed only in ZF6. The microstructures of the heat-treated alloys consisted of the Nbss, Nb5Si3 phases. The transformation of βNb5Si3 to αNb5Si3 was not completed after 100 h at 1400 °C. Contamination of the alloys by oxygen during heat treatment led to the formation of Ti and Hf oxides respectively in ZF6 and ZF9. Alloying with Hf decreased the hardness of the alloy ZF9. The hardness of the Nb5Si3 silicide decreased to that of the unalloyed silicide after 100 h at 1400 °C in the alloy ZF9.
Author Contributions
Experimental work, Z.L., Formal analysis of data, Z.L., P.T., Writing-original draft preparation, Z.L., Writing-final submission, review and editing Z.L., P.T., Supervision, P.T.
Funding
The research was supported by the University of Sheffield, Rolls-Royce Plc and the EPSRC (EP/H500405/1, EP/L026678/1).
Acknowledgments
The support of this work by the University of Sheffield, Rolls-Royce Plc and EPSRC (EP/H500405/1, EP/L026678/1) is gratefully acknowledged.
Conflicts of Interest
The authors declare no conflict of interest
Appendix A

Table A1.
Nominal compositions (at.%) of alloys that are referred to in this paper
| Alloy Code | Nominal Composition (at.%) | Reference |
|---|---|---|
| KZ3 | Nb-24Ti-18Si | [12] |
| KZ4 | Nb-24Ti-18Si-5Cr | [12] |
| KZ7 | Nb-24Ti-18Si-5Al | [12] |
| KZ5 | Nb-24Ti-18Si-5Al-5Cr | [12] |
| ZF1 | Nb-18Si-5Ge | [9] |
| ZF2 | Nb-18Si-10Ge | [9] |
| ZF3 | Nb-24Ti-18Si-5Ge | [18] |
| ZF7 | Nb-18Si-5Cr-5Ge | [15] |
| ZF4 | Nb-24Ti-18Si-5Cr-5Ge | [15] |
| ZF8 | Nb-18Si-5Al-5Ge | [13] |
| ZF5 | Nb-24Ti-18Si-5Al-5Ge | [13] |
References
- Zhao, J.C.; Westbrook, J.H. Ultrahigh-temperature materials for jet engines. MRS Bull. 2003, 28, 622–627. [Google Scholar] [CrossRef]
- Balsone, S.J.; Bewlay, B.P.; Jackson, M.R.; Subramanian, P.R.; Zhao, J.C.; Chatterjee, A.; Heffernan, T.M. Materials beyond superalloys-exploiting high temperature composites. In Proceedings of the International Symposium on Structural Intermetallics, Jackson Hole, WY, USA, 23–27 September 2001; pp. 99–108. [Google Scholar]
- Tsakiropoulos, P. On Nb silicide based alloys: Alloy design and selection. Materials 2018, 11, 844. [Google Scholar] [CrossRef] [PubMed]
- Tsakiropoulos, P. Alloying and hardness of eutectics with Nbss and Nb5Si3 in Nb-silicide based alloys. Materials 2018, 11, 592. [Google Scholar] [CrossRef] [PubMed]
- Jackson, M.R.; Bewlay, B.P.; Zhao, J.C. Niobium silicide based composites resistant to high temperature oxidation. U.S. Patent 6,913,655 B2, 5 July 2005. [Google Scholar]
- Begley, R.T. Columbium alloy development at Westinghouse. In Evolution of Refractory Metals and Alloys; Dalder, E.N.C., Grobenstein, T., Olsen, C.S., Eds.; TMS: Warrendale, PA, USA, 1994; pp. 29–48. [Google Scholar]
- Chan, K.S. Alloying effects on fracture mechanisms in Nb-based intermetallic in-situ composites. Mater. Sci. Eng. 2002, A329, 513–522. [Google Scholar] [CrossRef]
- Tsakiropoulos, P. On the alloying and properties of tetragonal Nb5Si3 in Nb-silicide based alloys. Materials 2018, 11, 69. [Google Scholar] [CrossRef] [PubMed]
- Li, Z.F.; Tsakiropoulos, P. Study of the effect of Ge addition on the microstructure of Nb-18Si in situ composites. Intermetallics 2010, 18, 1072–1078. [Google Scholar]
- Chan, K.S.; Davison, D.L. Improving the fracture toughness of constituent phases and Nb-based in-situ composites by a computational alloy design approach. Metall. Mater. Trans. 2003, 34A, 1833–1849. [Google Scholar] [CrossRef]
- Zhang, L.; Wu, J. Ti5Si3 and Ti5Si3-based alloys: Alloying behaviour, microstructure and mechanical property evaluation. Acta Metall. 1998, 46, 3535–3546. [Google Scholar]
- Zelenitsas, K.; Tsakiropoulos, P. Study of the role of Al and Cr additions in the microstructure of Nb-Ti-Si in situ composites. Intermetallics 2005, 13, 1079–1095. [Google Scholar] [CrossRef]
- Li, Z.F.; Tsakiropoulos, P. The microstructure of Nb-18Si-5Ge-5Al and Nb-24Ti-18Si-5Ge-5Al in situ composites. J. Alloy. Compd. 2013, 550, 553–560. [Google Scholar] [CrossRef]
- Cretegny, L.; Bewlay, B.P.; Ritter, A.M.; Jackson, M.R. The effects of substitutional additions on tensile behaviour of Nb-siliicde based composites. Mater. Res. Soc. Symp. Proc. 2005, 842, S2.10.1–S2.10.6. [Google Scholar]
- Li, Z.F.; Tsakiropoulos, P. Study of the effects of Cr and Ti additions in the microstructure of Nb-18Si-5Ge based in situ composites. Intermetallics 2012, 26, 18–25. [Google Scholar] [CrossRef]
- Tsakiropoulos, P. On the macrosegregation of silicon in niobium silicide based alloys. Intermetallics 2014, 55, 95–101. [Google Scholar] [CrossRef]
- Li, X.J.; Chen, H.F.; Sha, J.B.; Zhang, H. The effects of melting technologies on the microstructure and properties of Nb-16Si-22Ti-2Al-2Hf-17Cr alloy. Mater. Sci. Eng. 2010, A527, 6140–6152. [Google Scholar] [CrossRef]
- Li, Z.F.; Tsakiropoulos, P. Study of the effect of Ti and Ge in the microstructure of Nb-24Ti-18Si-5Ge in situ composite. Intermetallics 2011, 19, 1291–1297. [Google Scholar] [CrossRef]
- Beckermann, C. Modelling of macrosegregation: Application and future needs. Int. Mater. Rev. 2002, 47, 243–261. [Google Scholar] [CrossRef]
- Schlesinger, M.E.; Gokhale, A.B.; Abbaschian, R. The Nb-Si (Niobium-Silicon) System. J. Phase Equilib. 1993, 14, 502–509. [Google Scholar] [CrossRef]
- Okamoto, H. Desk Handbook: Phase Diagrams for Binary Alloys, 2nd ed.; ASM International: Metals Park, Ohio, OH, USA, 2000. [Google Scholar]
- Bewlay, B.P.; Jackson, M.R.; Gigliotti, M.F.X. Niobium silicide high temperature in situ composites. In Intermetallic compounds: Principles and practice, vol. 3; Fleisher, R.L., Westbrook, J.H., Eds.; John Wiley: New York, NY, USA, 2001; pp. 541–560, chapter 26. [Google Scholar]
- Hu, Y.L.; Zhang, L.; Shuman, D.; Huey, B.D.; Aindow, M. Atomic site occupancies and mechanical response of the eutectic C14 and A15 phases in a quinternary Nb-Mo-Cr-Al-Si alloy. Scripta Mater. 2009, 60, 309–312. [Google Scholar] [CrossRef]
- Goldschmidt, H.J.; Brand, J.A. The constitution of chromium-niobium-silicon system. J. Less Common Met. 1961, 3, 34–43. [Google Scholar] [CrossRef]
- Hunt, C.R.; Raman, A. Alloy chemistry of SIGMA-BETA-U-related phases. PT. 1. Extension of μ and occurrence of μ prime-phases in the ternary systems Nb-Ta-X-Al (X equals Fe, Co, Ni, Cu, Cr, Mo). Z. Metallkd. 1968, 59, 701–707. [Google Scholar]
- Geng, J.; Tsakiropoulos, P.; Shao, G. The effects of Ti and Mo additions on the microstructure of Nb-silicide based in situ composites. Intermetallics 2006, 14, 227–235. [Google Scholar] [CrossRef]
- Kotula, P.G.; Carter, C.B.; Chen, K.C.; Thoma, D.J.; Chu, F.; Mitchell, T.E. Defects and site occupancies Nb-Cr-Ti C15 Laves phase alloys. Scripta Mater. 1998, 39, 619–623. [Google Scholar] [CrossRef]
- Fujita, M.; Kaneno, Y.; Takasugi, T. Phase field and room-temperature mechanical properties of C15 Laves phase in Nb-Hf-Cr and Nb-Ta-Cr alloy systems. J. Alloy. Compd. 2006, 424, 283–288. [Google Scholar] [CrossRef]
- Geng, J.; Tsakiropoulos, P.; Shao, G. A study of the effects of Hf and Sn additions on the microstructure of Nbss/Nb5Si3 based in situ composites. Intermetallics 2007, 15, 69–76. [Google Scholar] [CrossRef]
- Grammenos, I.; Tsakiropoulos, P. Study of the role of Al, Cr and Ti additions in the microstructure of Nb-18Si-5Hf base alloys. Intermetallics 2010, 18, 242–253. [Google Scholar] [CrossRef]
- Gale, W.F.; Totemeier, T. Smithells Metals Reference Book; Oxford-Butterworth-Heinemann: Oxford, UK, 2013. [Google Scholar]
- Kim, J.H.; Tabaru, T.; Sakamoto, M.; Hanada, S. Mechanical properties and fracture behaviour of an Nbss /Nb5Si3 in-situ composite modified by Mo and Hf alloying. Mater. Sci. Eng. A 2004, 372, 137–144. [Google Scholar] [CrossRef]
- Prokoshkin, D.A.; Vasileva, E.V. Alloys of Niobium; Israel Programme for Scientific Translations: Jerusalem, Israel, 1965; p. 127. [Google Scholar]
- Miracle, D.B.; Senkov, O.N. A critical review of high entropy alloys and related concepts. Acta Mater. 2016, 122, 1–64. [Google Scholar] [CrossRef]
- Tsakiropoulos, P. On Nb silicide based alloys; Part II. J. Alloy. Compd. 2018, 748, 569–576. [Google Scholar] [CrossRef]
- Tsakiropoulos, P. On the Nb silicide based alloys: Part I—The bcc Nb solid solution. J. Alloy. Compd. 2017, 708, 961–971. [Google Scholar] [CrossRef]
- Senkov, O.N.; Woodward, C.; Miracle, D.B. Microstructure and properties of Aluminium-containing refractory high-entropy alloys. JOM 2014, 66, 2030–2042. [Google Scholar] [CrossRef]
- Yang, X.; Chen, S.Y.; Cotton, J.D.; Zhang, Y. Erratum to: Phase stability of low density, multi-principal component alloys containing Al, Mg and Li. JOM 2014, 66, 2009–2020. [Google Scholar] [CrossRef]
- Liu, W.H.; Wu, Y.; He, J.Y.; Zhang, Y.; Liu, C.T. The phase competition and stability of high-entropy alloys. JOM 2014, 66, 1973–1983. [Google Scholar] [CrossRef]
- Wang, Z.J.; Guo, S.; Liu, C.T. Phase selection in high-entropy alloys: From non-equilibrium to equilibrium. JOM 2014, 66, 1966–1972. [Google Scholar] [CrossRef]
- Koppenaal, T.J.; Kuhlmann-Wilsdorf, D. The effect of pre-stressing on the strength of neutron-irradiated copper single crystals. Appl. Phys. Lett. 1964, 4, 59. [Google Scholar] [CrossRef]
- Zacharis, E.; Utton, C.; Tsakiropoulos, P. A study of the effects of Hf and Sn on the microstructure, hardness and oxidation of Nb-18Si silicide based alloys without Ti addition. Materials 2018, 11, 2447. [Google Scholar] [CrossRef] [PubMed]
- Christman, T.; Needleman, A.; Nutt, S.; Suresh, S. On microstructural evolution and micromechanical modelling of deformation of a whisker reinforced metal matrix composite. Mater. Sci. Eng. 1989, 107A, 49. [Google Scholar] [CrossRef]
- Drucker, D.C. Engineering and Continuum Aspects of High Strength Materials in High Strength Materials; John Wiley: New York, NY, USA, 1965; pp. 795–833. [Google Scholar]
- Nutt, S.R.; Needleman, A. Void nucleation at fibre ends in Al-SiC composites. Scripta Metallurgica 1987, 21, 705–710. [Google Scholar] [CrossRef]
- Nelson, J.; Ghadyani, M.; Utton, C.; Tsakiropoulos, P. A study of the effect of Al, Cr, Hf and Ti additions on the microstructure and oxidation of Nb-24Ti-18Si silicide based alloys. Materials 2018, 11, 1579. [Google Scholar] [CrossRef]
Figure 1.
X-ray diffractograms of the as cast and heat treated (1400 °C/100 h) alloy ZF6.

Figure 2.
Typical backscatter electron images of the cross section of alloy ZF6: (a–c) top, bulk and bottom areas of the as cast alloy ZF6-AC; (d) the bulk of the heat-treated alloy ZF6-HT (1400 °C/100 h).
Figure 2.
Typical backscatter electron images of the cross section of alloy ZF6: (a–c) top, bulk and bottom areas of the as cast alloy ZF6-AC; (d) the bulk of the heat-treated alloy ZF6-HT (1400 °C/100 h).
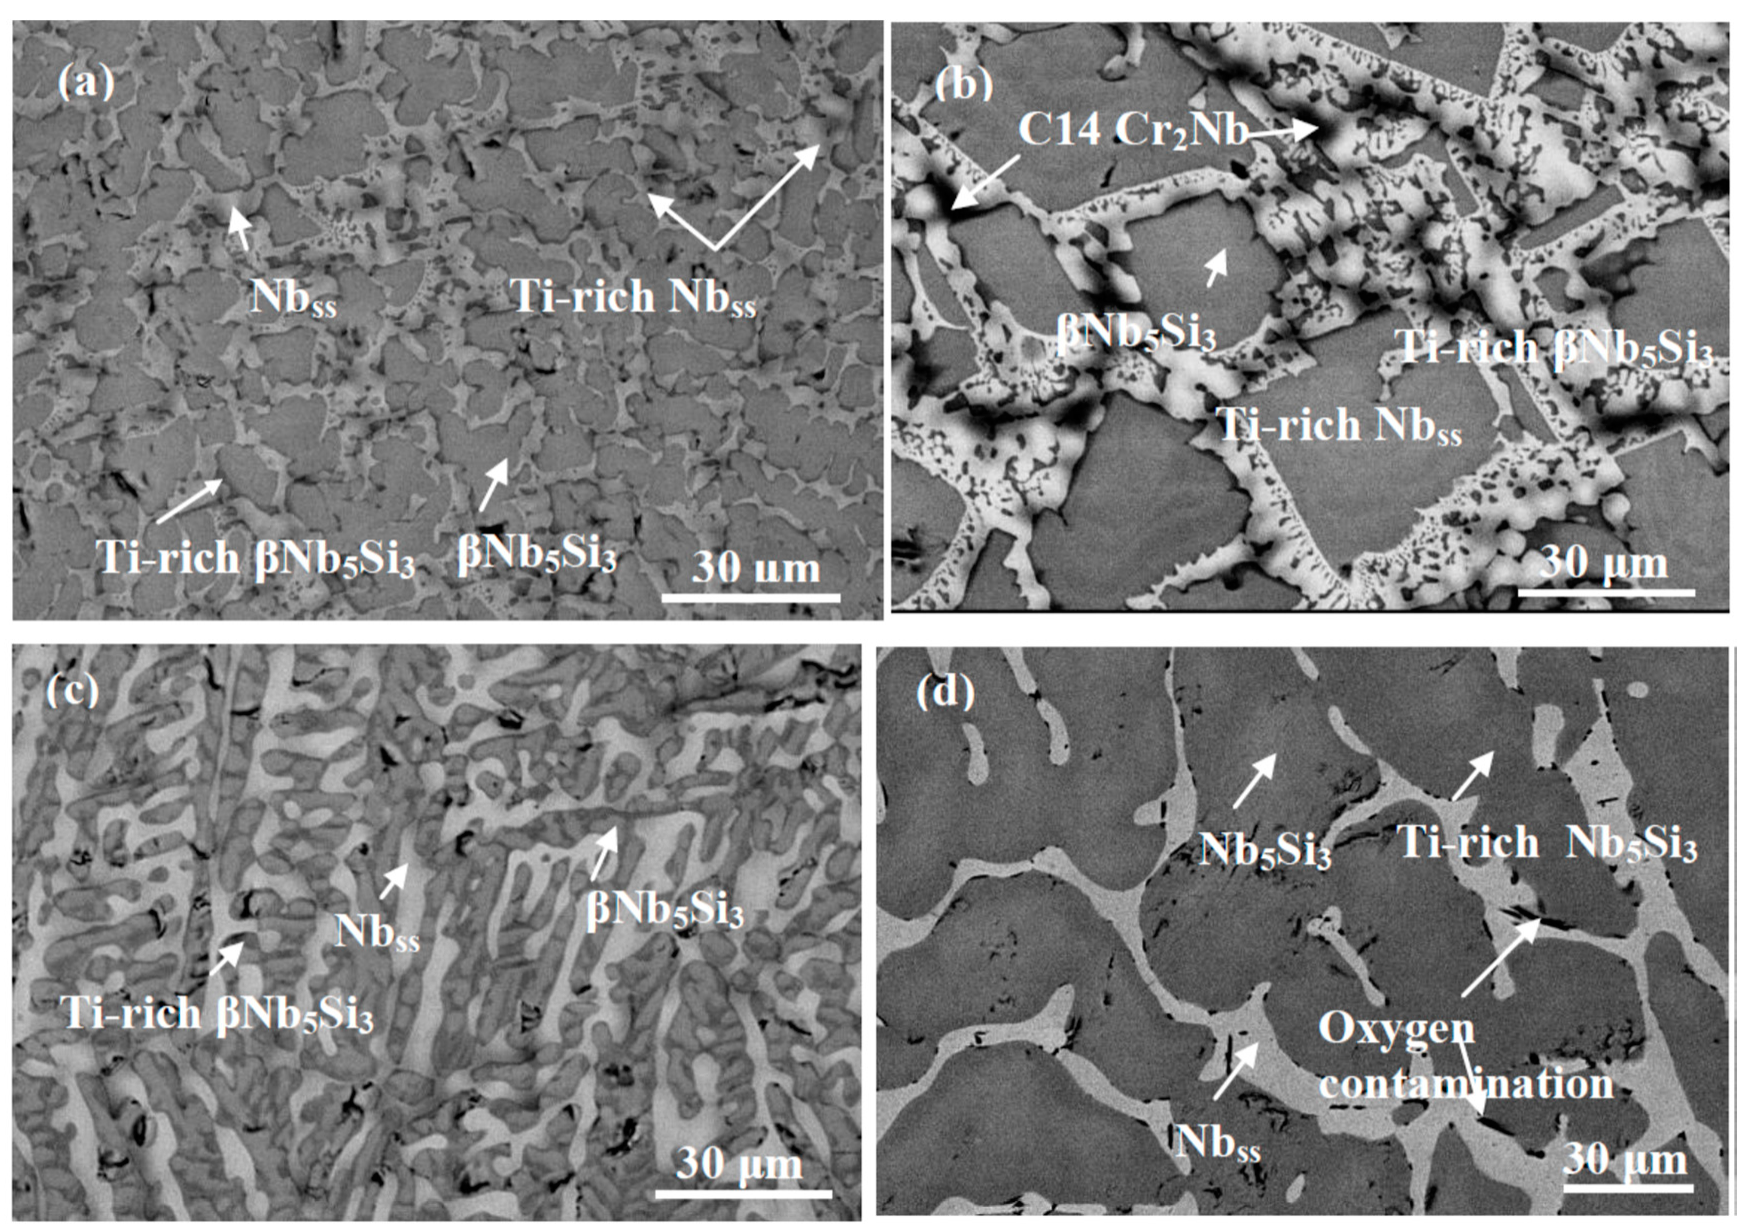
Figure 3.
EPMA/Wavelength Dispersive spectroscopy (WDS) X-ray maps from the centre of the cross section of ZF6-HT (1400 °C/100 h) showing oxygen contamination at the edges of some of Nbss grains.
Figure 3.
EPMA/Wavelength Dispersive spectroscopy (WDS) X-ray maps from the centre of the cross section of ZF6-HT (1400 °C/100 h) showing oxygen contamination at the edges of some of Nbss grains.

Figure 4.
X-ray diffractograms of the as cast (AC) and heat treated (HT) (1400 °C/100 h) alloy ZF9.

Figure 5.
Typical backscatter electron images of the alloy ZF9: (a–c) top, bulk and bottom areas of the as cast alloy ZF9-AC; (d) the bulk area and (e) the top area of the heat-treated alloy ZF9-HT (1400 °C/100 h). In (e) the phase exhibiting white contrast is HfO2.
Figure 5.
Typical backscatter electron images of the alloy ZF9: (a–c) top, bulk and bottom areas of the as cast alloy ZF9-AC; (d) the bulk area and (e) the top area of the heat-treated alloy ZF9-HT (1400 °C/100 h). In (e) the phase exhibiting white contrast is HfO2.

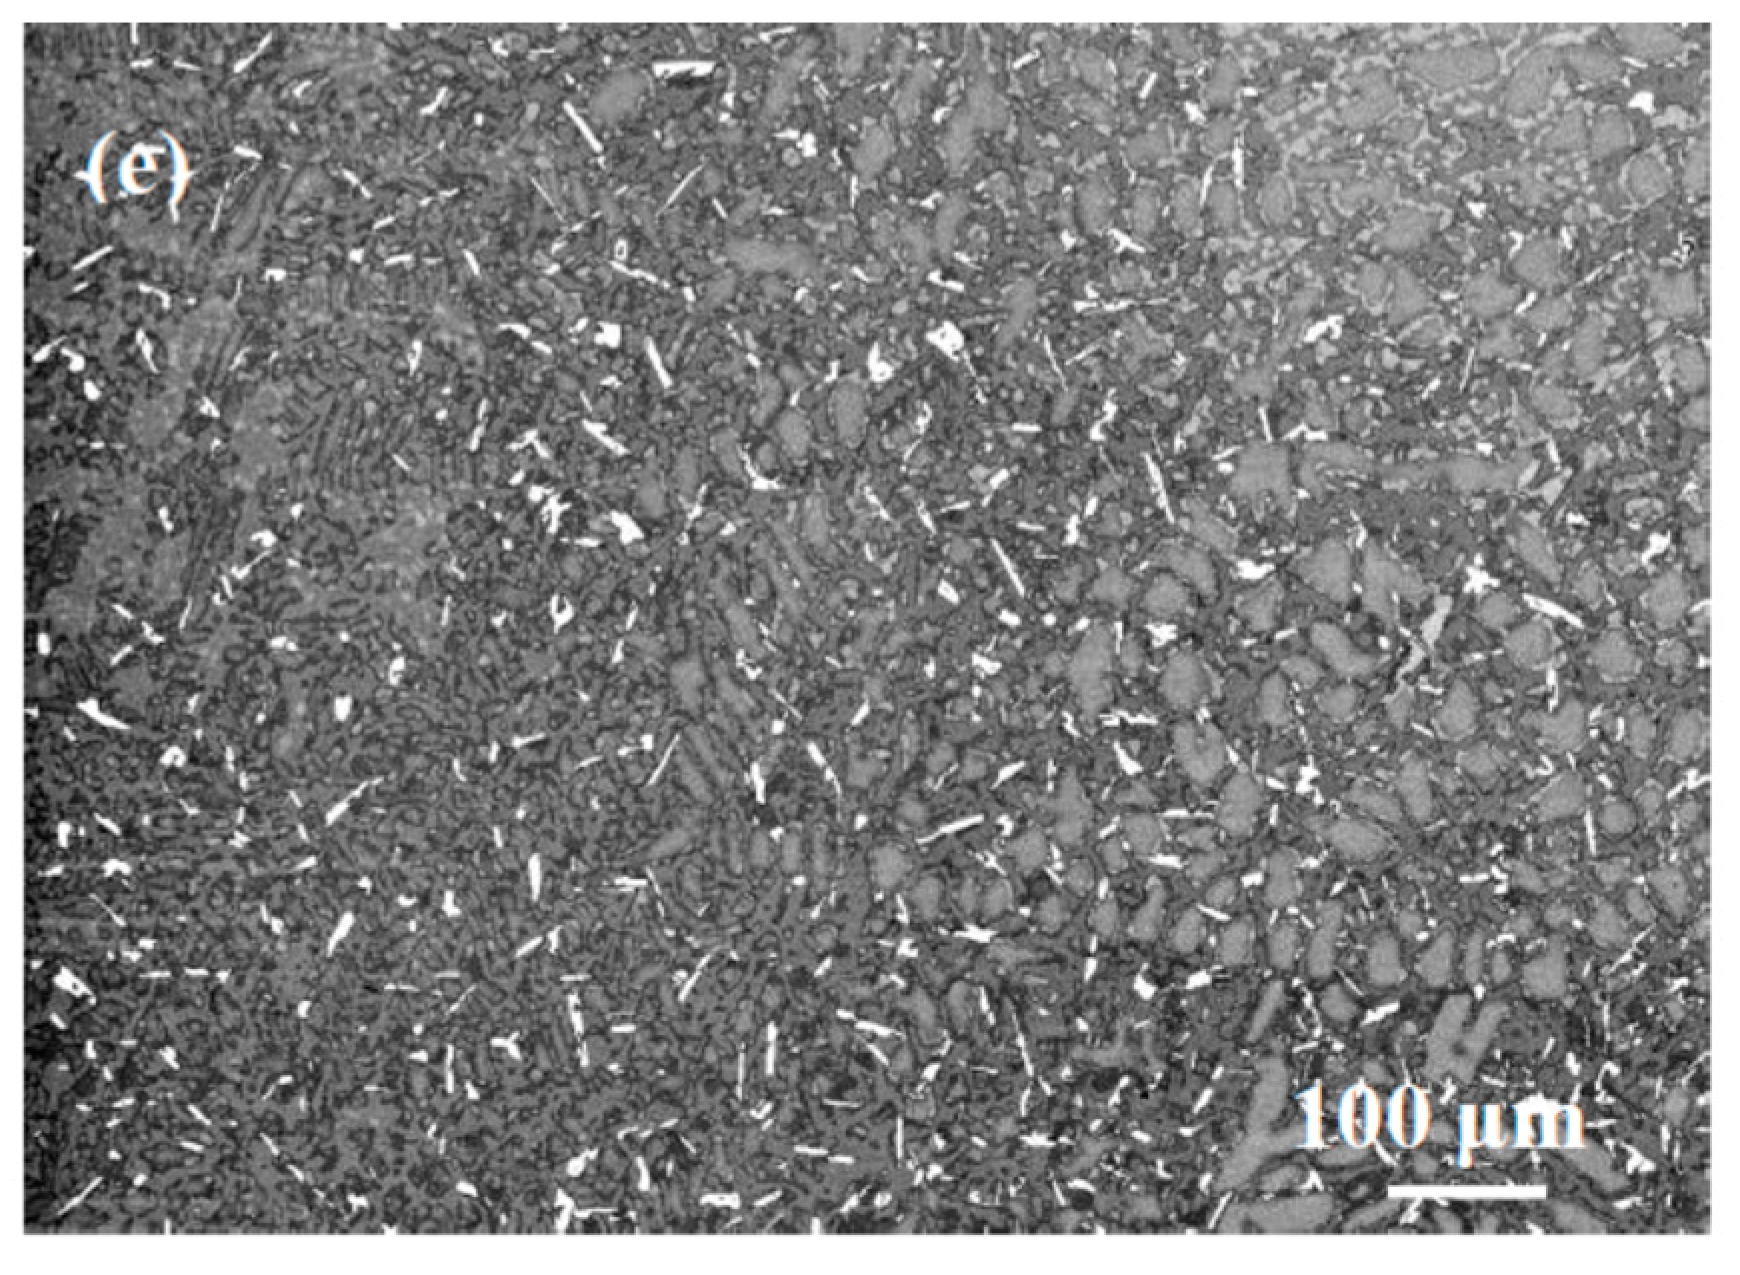
Figure 6.
Schematic diagram showing the dependence of the macrosegregation of element X (vertical axis) on the alloying elements in specific phases in Nb silicide-based alloys. The ranges of X values are given in Table 6 and Table 7. Chemical analysis data for the Nbss + Nb5Si3 eutectic in Ge containing Nb silicide based alloys is given in the Table 8 and Table 9. The chemical analysis data for specific phases in Nb silicide based alloys can be found in the references given in Table 6, Table 7, Table 8 and Table 9. The thick line shows (a) how the Si macrosegregation varies with (Si + Ge)eutectic (range 11.8 to 17.7, nose ZF6), (Si/Al)Nb5Si3 (range 4.8 to 9.5, nose ZF9), (Si/Cr)Nb5Si3 (range 16.6 to 24, nose ZF6), (Si/Al)Nbss (range 0.21 to 0.49, nose ZF6), (TM/SM)Nbss (range 2.7 to 3.8, nose ZF5), (TM/SM)Ti rich Nbss (range 3.4 to 5.6, nose ZF5), (Si/Cr)Nbss (range 0.1 to 0.28, nose ZF9) and (Ti/Cr)Nbss (range 2.1 to 3.6, nose ZF9), (b) how the Ti macrosegregation varies with (Si/Cr)Nb5Si3 (range 16.6 to 24, nose ZF6) and (Si/Al)Ti rich Nb5Si3 (range 4.4 to 8.7, nose ZF6), (Ti/Cr)Nb5Si3 (range 14.9 to 17.5, nose ZF4) and (Ti/Cr)Ti rich Nb5Si3 (range 9.8 to 30, nose ZF4) and (c) how the Cr macrosegregation varies with (Si/Cr)Nbss (range 0.1 to 0.28, nose ZF9). X = Si, Ti, Cr and TM = Ti + Cr + Hf, SM = Si + Ge + Al. The dashed line shows (d) how the macrosegregation of Si varies with (Si/Al)Ti rich Nb5Si3 (range 4.3 to 8.7) and (Si + Al + Ge)eutectic (range 18.1 to 22.6) and (e) how the Ti macrosegregation varies with (Si/Al)Nb5Si3 (range 4.8 to 9.5) and (Si/Al)Nbss (range 0.21 to 0.33), X = Si, Ti.

Figure 7.
Schematic diagram showing the dependence of the macrosegregation of element X (vertical axis) on alloying elements in specific phases in Nb silicide-based alloys. The ranges of X values are given in Table 6 and Table 7. The chemical analysis data for specific phases in Nb silicide-based alloys can be found in the references given in the Table 6, Table 7, Table 8 and Table 9. The thick line shows (a) how the Si macrosegregation varies with ([Si + Ge]/Cr)Laves (range 2.3 to 4.4, nose ZF6), (TM/[Si + Ge])Nbss (range 6.8 to 18.9, nose ZF9), (Ti/Cr)Nb5Si3 (range 12.7 to 17.5, nose ZF9), (Ti/Cr)Ti rich Nb5Si3 (range 9.8 to 30, nose ZF9), (TM/SM)Nb5Si3 (range 0.5 to 0.8, nose ZF9), (TM/SM)Ti rich Nb5Si3 (range 0.6 to 1, nose ZF9) and (TM/[Si + Ge])Nb5Si3 (range 0.6 to 0.9, nose ZF9) (b) how the Ti macrosegregation varies with (Si/Cr)Nbss (range 0.1 to 0.3, nose ZF4) and (Ti/Cr)Nbss (range 2.1 to 3.6, nose ZF4) and (c) how the Cr macrosegregation varies with (Si/Cr)Nb5Si3 (range 16.6 to 20.2, nose ZF9). X = Si, Ti, Cr, TM = Ti + Cr + Hf and SM = Si + Ge + Al. The dashed line shows (d) how the macrosegregation of Si varies with ([Si + Ge + Al]/Cr)Laves (range 1.4 to 5.5) and (TM/([Si + Ge])Ti rich Nbss (range 9 to 13.2) and (e) how the Ti macrosegregation varies with (Ti/Cr)Ti rich Nbss (range 2.1 to 2.6). X = Si, Ti and TM = Ti + Cr + Hf.

Figure 8.
Vickers hardness (HV) versus VEC (a) or δ (b) or Δχ (c) of the alloys KZ5 = Nb-24Ti-18Si-5Al-5Cr [12] (blue), JN1 = Nb-24Ti-18Si-5Al-5Cr-5Hf [46] (green), ZF6 (red) and ZF9 (purple).
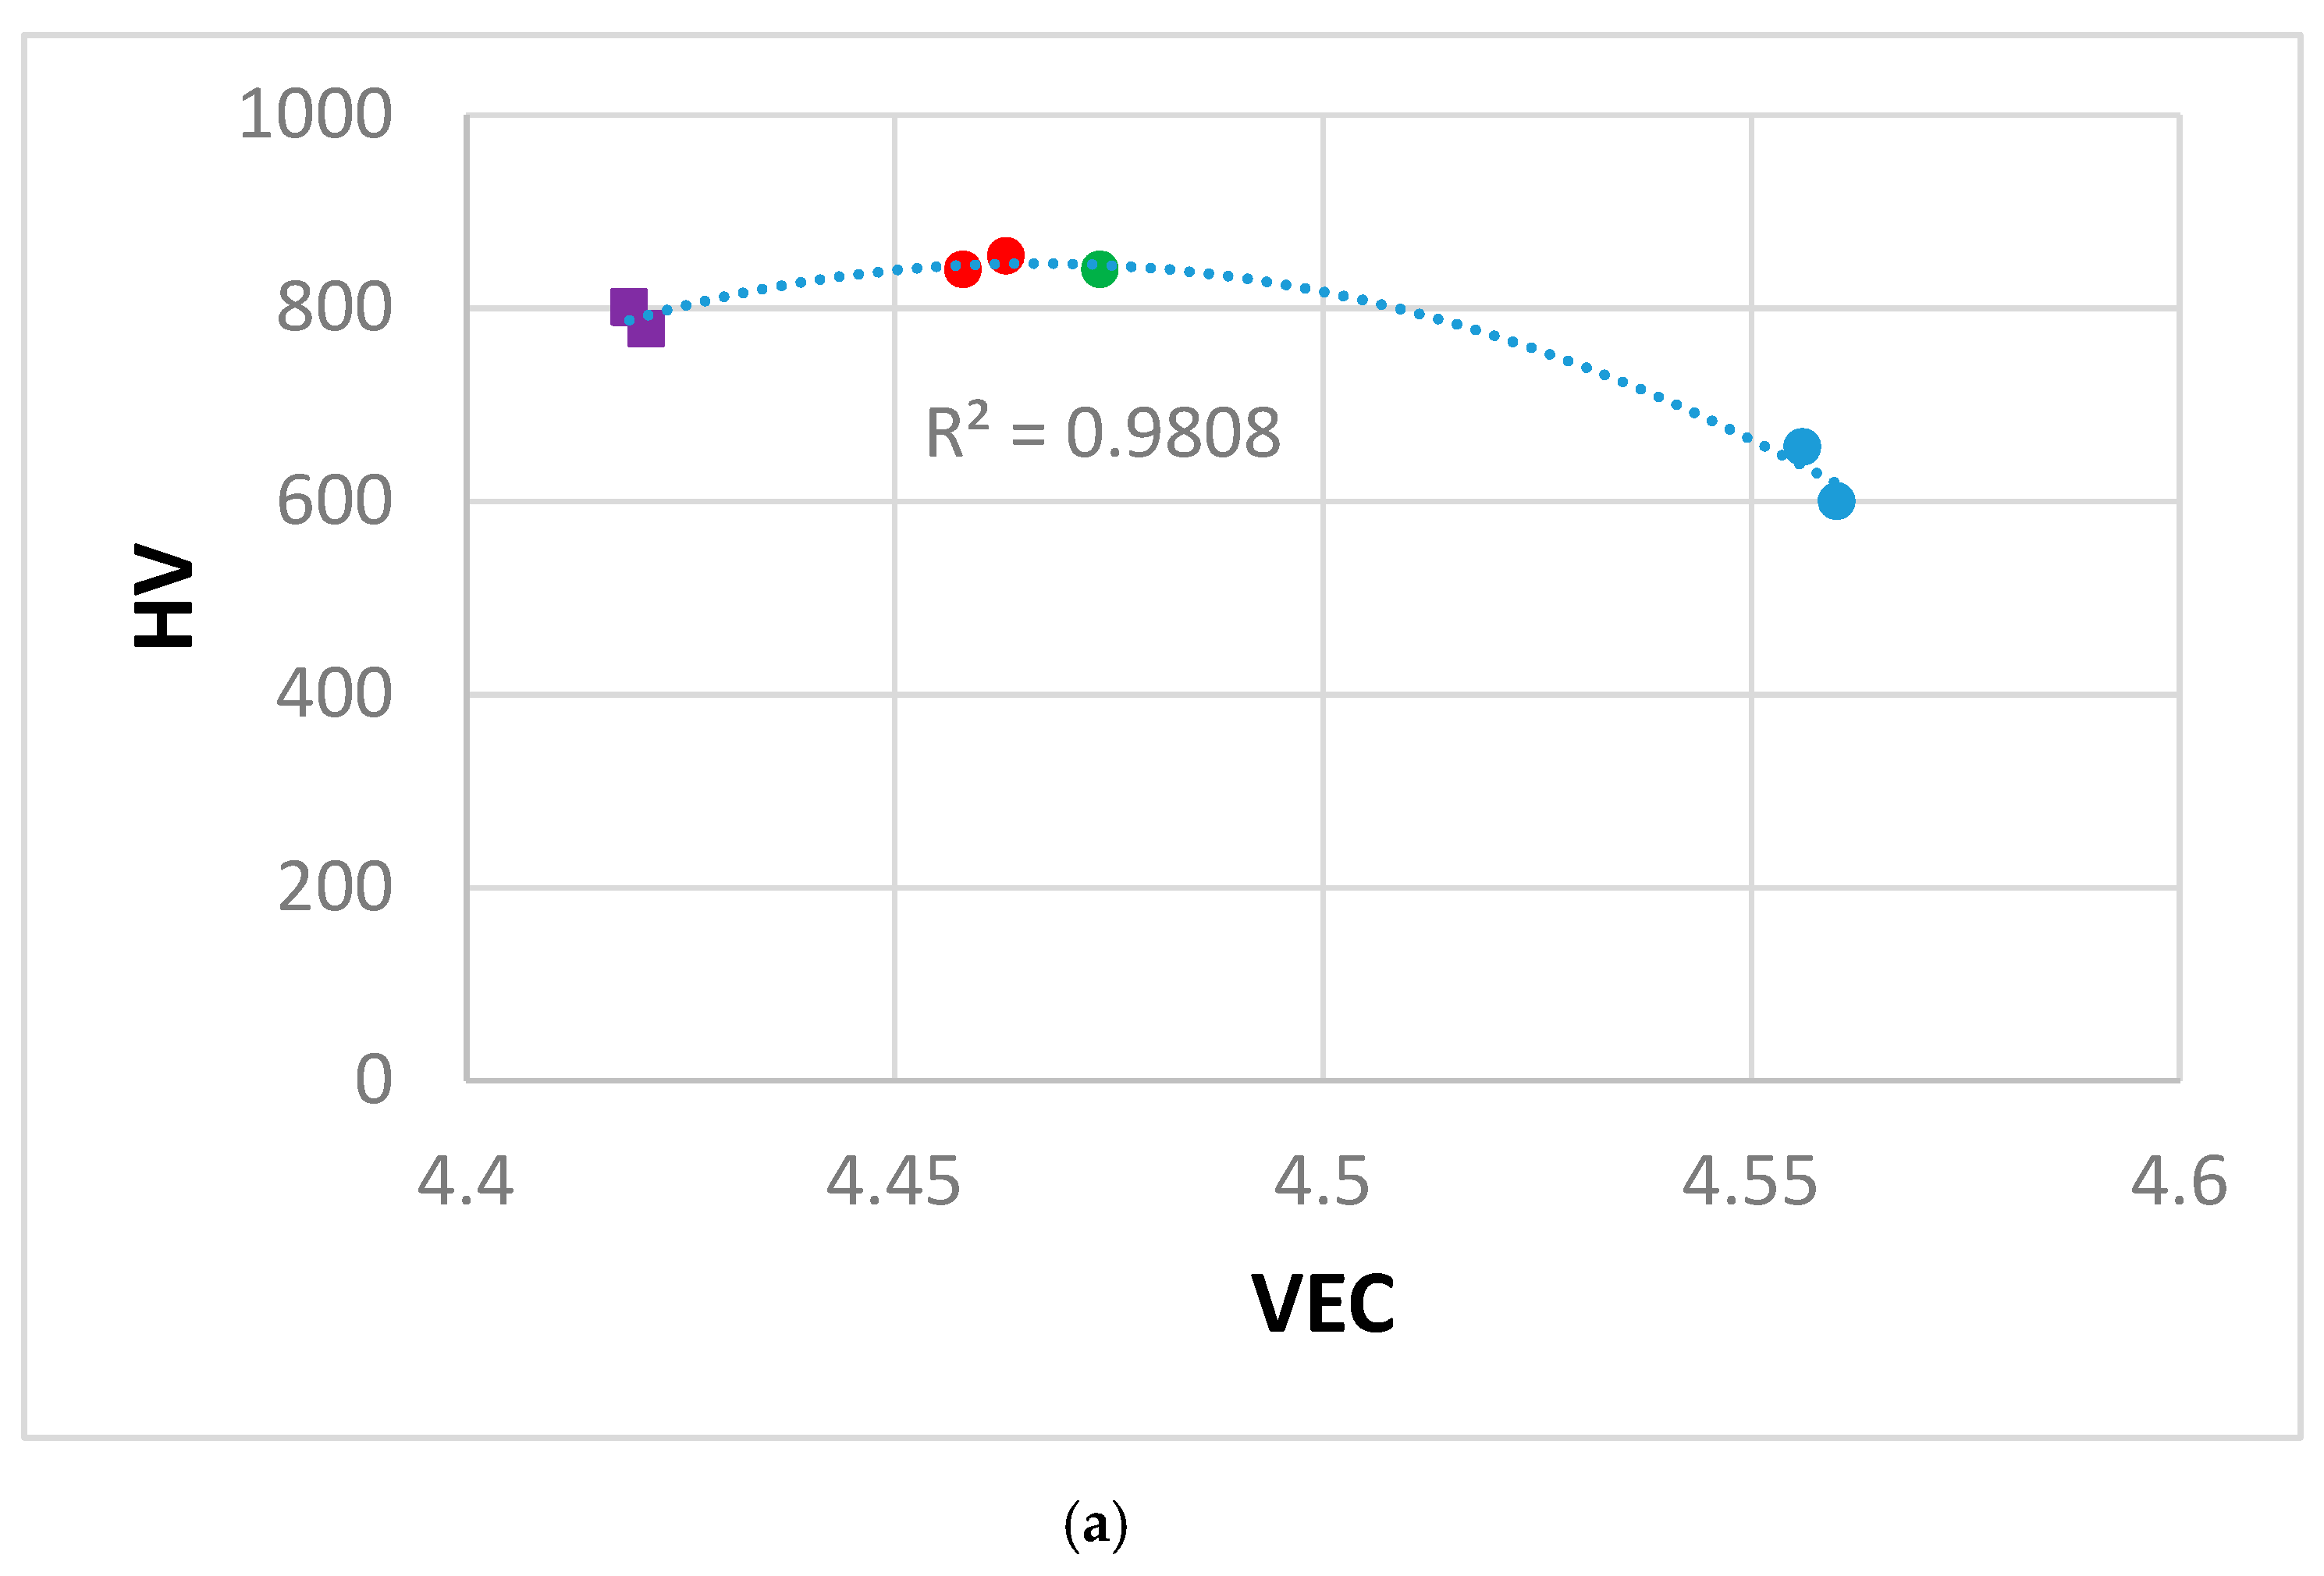

Table 1.
Density and % areas of Nbss in as cast (AC) and heat treated (HT) alloys Nb-24Ti-18Si-5Ge-5Cr-5Al (ZF6) and Nb-24Ti-18Si-5Ge-5Cr-5Al-5Hf (ZF9).
Table 1.
Density and % areas of Nbss in as cast (AC) and heat treated (HT) alloys Nb-24Ti-18Si-5Ge-5Cr-5Al (ZF6) and Nb-24Ti-18Si-5Ge-5Cr-5Al-5Hf (ZF9).
| Alloy | Density (g/cm3) | % Area | ||
|---|---|---|---|---|
| Top | Bulk | Bottom | ||
| ZF6-AC | 6.54 ± 0.01 | 22.4 ± 1.8 | 17.1 ± 3.7 | 29.2 ± 2.8 |
| ZF6-HT | - | - | 17.3 ± 3.5 | - |
| ZF9-AC | 6.96 ± 0.02 | - | - | - |
| ZF9-HT | - | - | - | - |
Table 2.
Chemical analysis data (at.%) of as cast (AC) and heat treated (HT) alloy ZF6.
| Area/Phase | Nb | Ti | Si | Ge | Cr | Al |
|---|---|---|---|---|---|---|
| ZF6-AC | - | - | - | - | - | - |
| Top* | 41.6 ± 0.4 | 26.2 ± 0.1 | 16.1 ± 0.1 | 4.9 ± 0.1 | 5.4 ± 0.2 | 5.8 ± 0.6 |
| 41.4–42.0 | 26.1–26.2 | 16.0–16.1 | 4.8–5.0 | 5.2–5.5 | 5.3–6.2 | |
| Bulk* | 41.9 ± 1.0 | 24.9 ± 0.8 | 18.0 ± 1.9 | 5.1 ± 0.3 | 4.5 ± 1.0 | 5.6 ± 1.1 |
| 40.9–43.3 | 23.9–26.0 | 16.1–20.1 | 4.9–5.6 | 3.5–5.6 | 4.1–6.6 | |
| Bottom* | 41.1 ± 0.4 | 26.1 ± 0.4 | 16.3 ± 0.4 | 5.4 ± 0.1 | 5.2 ± 0.2 | 6.1 ± 0.5 |
| 40.7–41.6 | 25.5–26.3 | 15.8–16.6 | 5.3–5.5 | 5.0–5.4 | 5.9–6.7 | |
| Nbss | 52.3 ± 1.6 | 27.9 ± 0.7 | 2.1 ± 0.2 | 1.7 ± 0.3 | 9.2 ± 1.1 | 6.8 ± 0.4 |
| 50.2–53.6 | 27.0–28.8 | 2.0–2.4 | 1.4–2.2 | 8.0–10.6 | 6.6–7.3 | |
| Ti-rich Nbss | 45.4 ± 3.1 | 31.3 ± 1.4 | 1.8 ± 0.4 | 1.6 ± 0.3 | 12.9 ± 1.2 | 7.0 ± 0.3 |
| 42.0–48.7 | 29.9–32.7 | 1.3–2.1 | 1.3–1.9 | 11.5–14.4 | 6.7–7.7 | |
| βNb5Si3 | 42.4 ± 1.1 | 22.1 ± 0.9 | 23.2 ± 1.3 | 7.3 ± 0.4 | 1.4 ± 0.2 | 3.6 ± 1.0 |
| 41.3–43.9 | 20.9–23.0 | 22.1–24.8 | 6.9–7.9 | 1.1–1.5 | 2.3–4.8 | |
| Ti-rich βNb5Si3 | 34.1 ± 0.4 | 29.5 ± 0.3 | 20.9 ± 1.4 | 8.4 ± 0.4 | 2.4 ± 0.4 | 4.7 ± 0.7 |
| 33.8–34.5 | 29.1–29.7 | 19.3–27.1 | 8.1–8.9 | 2.1–2.8 | 4.1–5.4 | |
| C14-Cr2Nb+ | 18.4 | 24.8 | 6.2 | 1.2 | 46.3 | 3.1 |
| Eutectic | 45.5 ± 1.2 | 28.4 ± 0.6 | 8.1 ± 1.5 | 3.7 ± 0.5 | 8.0 ± 1.1 | 6.3 ± 0.4 |
| 44.2–46.9 | 27.7–29.0 | 5.8–9.0 | 3.2–4.3 | 6.6–9.3 | 6.0–6.8 | |
| ZF6-HT* (1400 °C/100 h) | 43.1 ± 1.0 | 24.3 ± 1.2 | 17.4 ± 0.8 | 5.8 ± 0.2 | 4.2 ± 0.3 | 5.2 ± 0.8 |
| 41.9–44.6 | 23.0–25.9 | 16.4–18.7 | 5.5–6.2 | 4.0–4.7 | 4.1–6.1 | |
| Nbss | 52.6 ± 0.5 | 26.9 ± 0.3 | 0.9 ± 0.5 | 1.0 ± 0.2 | 12.3 ± 0.2 | 6.3 ± 0.4 |
| 52.1–53.0 | 26.4–27.2 | 0–1.2 | 0.8–1.2 | 11.9–12.4 | 5.7–6.7 | |
| Nb5Si3 | 42.2 ± 0.9 | 21.7 ± 0.9 | 23.1 ± 1.2 | 7.4 ± 0.5 | 1.8 ± 0.4 | 3.8 ± 0.6 |
| 41.4–43.4 | 20.5–22.6 | 21.7–24.4 | 7.0–8.1 | 1.5–2.3 | 3.1–4.3 | |
| Ti-rich Nb5Si3 | 37.6 ± 1.1 | 26.1 ± 1.1 | 21.0 ± 0.3 | 7.8 ± 0.2 | 2.7 ± 0.1 | 4.8 ± 0.3 |
| 35.9–39.1 | 25.0–27.9 | 20.8–21.6 | 7.6–8.0 | 2.5–2.8 | 4.6–5.2 |
+ This was the average of three analyses; * large area analysis.
Table 3.
Chemical analysis data (at.%) of as cast (AC) and heat treated (HT) alloy ZF9.
| Area/Phase | Nb | Ti | Si | Ge | Cr | Al | Hf |
|---|---|---|---|---|---|---|---|
| ZF9-AC | - | - | - | - | - | - | - |
| Top* | 35.6 ± 0.1 | 27.3 ± 0.2 | 16.0 ± 0.6 | 5.3 ± 0.2 | 5.9 ± 0.3 | 4.4 ± 0.3 | 5.5 ± 0.1 |
| 35.7–35.9 | 27.0–27.5 | 15.3–16.5 | 5.0–5.4 | 5.5–6.1 | 4.1–4.7 | 5.5–5.6 | |
| Bulk* | 36.7 ± 0.4 | 24.8 ± 0.6 | 17.6 ± 0.8 | 5.1 ± 0.2 | 4.6 ± 0.2 | 5.8 ± 0.4 | 5.4 ± 0.2 |
| 36.3–37.3 | 24.1–25.5 | 16.4–18.4 | 4.9–5.4 | 4.3–4.9 | 5.2–6.1 | 5.2–5.6 | |
| Bottom* | 35.3 ± 0.1 | 27.1 ± 0.2 | 15.5 ± 0.1 | 5.5 ± 0.5 | 6.2 ± 0.3 | 5.0 ± 0.2 | 5.4 ± 0.2 |
| 35.2–35.4 | 27.0–27.3 | 15.4–15.6 | 5.1–6.0 | 5.9–6.4 | 4.9–5.2 | 5.2–5.5 | |
| Nbss | 40.4 ± 3.4 | 31.5 ± 2.3 | 1.6 ± 0.2 | 1.0 ± 0.2 | 15.0 ± 1.2 | 7.8 ± 0.3 | 2.7 ± 0.2 |
| 35.5–44.4 | 29.1–35.1 | 1.5–1.8 | 0.7–1.1 | 13.4–16.1 | 7.5–8.4 | 2.5–3.0 | |
| βNb5Si3 | 37.2 ± 0.2 | 21.0 ± 0.3 | 24.2 ± 0.5 | 6.6 ± 0.1 | 1.2 ± 0.1 | 5.0 ± 0.4 | 4.8 ± 0.1 |
| 36.8–37.3 | 20.6–21.2 | 23.8–25.1 | 6.5–6.8 | 1.2–1.3 | 4.4–5.5 | 4.7–4.9 | |
| Hf-rich Nb5Si3 | 30.9 ± 0.7 | 24.0 ± 0.3 | 24.5 ± 0.6 | 7.0 ± 0.3 | 0.8 ± 0.2 | 3.8 ± 0.6 | 9.0 ± 0.2 |
| 29.9–31.8 | 23.6–24.2 | 23.7–25.1 | 6.6–7.4 | 0.5–0.9 | 3.3–4.8 | 8.8–9.2 | |
| Cr2Nb+ | 20.5 | 19.7 | 5.6 | 1.3 | 43.7 | 4 | 5.2 |
| ZF9-HT* | 38.0 ± 2.0 | 24.2 ± 1.5 | 17.1 ± 1.3 | 5.2 ± 0.2 | 4.8 ± 0.6 | 5.5 ± 0.8 | 5.2 ± 0.2 |
| 36.4–40.2 | 22.8–25.7 | 15.8–18.4 | 5.0–5.4 | 4.1–5.3 | 4.9–6.4 | 5.0–5.4 | |
| Nbss | 56.6 ± 3.3 | 25.3 ± 1.2 | 0.7 ± 0.5 | 0.6 ± 0.6 | 11.8 ± 0.8 | 3.8 ± 1.2 | 1.2 ± 0.1 |
| 56.8–59.8 | 24.3–26.7 | 0.0–1.4 | 0.0–1.2 | 10.6–12.6 | 2.4–5.4 | 1.1–1.3 | |
| Nb5Si3 | 37.0 ± 0.6 | 21.2 ± 0.4 | 24.8 ± 0.5 | 6.7 ± 0.3 | 2.3 ± 0.3 | 3.2 ± 0.4 | 4.8 ± 0.2 |
| 36.4–37.9 | 20.6–21.7 | 24.2–25.2 | 6.3–7.2 | 2.0–2.7 | 2.7–3.4 | 4.5–4.9 | |
| Hf-rich Nb5Si3 | 30.2 ± 1.2 | 24.3 ± 0.9 | 25.4 ± 0.6 | 7.0 ± 0.2 | 1.0 ± 0.3 | 3.3 ± 0.5 | 8.8 ± 0.1 |
| 29.0–31.3 | 23.6–25.3 | 25.0–26.1 | 6.8–7.2 | 0.7–1.3 | 2.7–3.6 | 8.8–8.9 |
+ This was the average data of three measurements, * large area analysis.
Table 4.
Lattice parameter (Å) of the Nbss in the alloys ZF6 and ZF9.
| Alloy | ZF6-AC | ZF6-HT | ZF9-AC | ZF9-HT |
|---|---|---|---|---|
| Parameter | 3.252 | 3.260 | 3.256 | 3.264 |
Table 5.
Vickers hardness (HV) of the as cast and heat-treated alloys ZF6 and ZF9.
| Alloy | Hardness | Microhardness | |
|---|---|---|---|
| Nbss | Nb5Si3 | ||
| ZF6-AC | 840 ± 34 | —+ | 1644 ± 89 |
| ZF6-HT | 854 ± 31 | 691 ± 37 | 1576 ± 60 |
| ZF9-AC | 801 ± 37 | —+ | 1495 ± 88 |
| ZF9-HT | 779 ± 11 | —+ | 1391 ± 21 |
+ Not measured owing to the small size of the Nbss in the alloy.
Table 6.
Synergistic effect of alloying elements on macrosegregation of Si in as cast Nb-18Si silicide-based alloys.
Table 6.
Synergistic effect of alloying elements on macrosegregation of Si in as cast Nb-18Si silicide-based alloys.
| Elements in Synergy | Alloy Code* & Reference | CmaxSi–CminSi | Macrosegregation |
|---|---|---|---|
| Ti + Cr + Ge | ZF4 [15] | 5.3 |  |
| Ti + Cr + Al + Ge | ZF6 | 4.3 | |
| Ti + Ge | ZF3 [18] | 3.2 | |
| Ti + Cr + Al + Ge + Hf | ZF9 | 3.1 | |
| Ti + Al + Ge | ZF5 [13] | 2.9 | |
| Al + Ge | ZF8 [13] | 2.5 | |
| Ti + Al | KZ7 [12] | 2.3 | |
| Ge | ZF1 [9] | 2.0 | |
| Ti + Cr | KZ4 [12] | 1.9 | |
| Ti | KZ3 [12] | 1.6 | |
| Cr + Ge | ZF7 [15] | 1.5 | |
| Ti + Cr + Al | KZ5 [12] | 1.3 |
* see Appendix A.
Table 7.
Effect of alloying on macrosegregation of Al, Cr and Ti in as cast Nb-18Si silicide-based alloys.
Table 7.
Effect of alloying on macrosegregation of Al, Cr and Ti in as cast Nb-18Si silicide-based alloys.
| Alloying Additions | Alloy Code* & Reference | Cmaxi–Cmini (i = Ti, Cr, Al) | ||
|---|---|---|---|---|
| Ti | Cr | Al | ||
| Ti + Ge + Cr + Al + Hf | ZF9 | 3.4 | 2.1 | 2 |
| Ti + Ge + Cr | ZF4 [15] | 3.3 | 2.2 | - |
| Ti + Ge + Cr + Al | ZF6 | 2.4 | 2.1 | 2.6 |
| Ti + Al | KZ7 [12] | 2.3 | - | - |
| Ti + Cr + Al | KZ5 [12] | 1.4 | - | - |
| Ti + Ge | ZF3 [18] | 1.4 | - | - |
| Ti + Cr | KZ4 [12] | 1.4 | 1.8 | - |
| Ti | KZ3 [12] | 3.1 | - | - |
* see Appendix A.
Table 8.
Concentration of Si + Ge + Al in the Nbss + βNb5Si3 eutectic in the as cast alloys ZF5, ZF6 and ZF8.
Table 8.
Concentration of Si + Ge + Al in the Nbss + βNb5Si3 eutectic in the as cast alloys ZF5, ZF6 and ZF8.
| Alloy Code | Nominal Composition (at.%) | Si + Ge +Al in The Eutectic (at.%) |  |
| ZF8-AC [13] | Nb-18Si-5Ge-5Al | 22.6 | |
| ZF5-AC [13] | Nb-24Ti-18Si-5Ge-5Al | 18.8 | |
| ZF6-AC | Nb-24Ti-18Si-5Ge-5Cr-5Al | 18.1 |
Table 9.
Concentration of Si + Ge in the Nbss + βNb5Si3 eutectic in as cast ZF series alloys.
| Alloy Code & Reference | Nominal Composition (at.%) | Si + Ge in The Eutectic (at.%) |  |
| ZF1-AC [9] | Nb-18Si-5Ge | 17.7 | |
| ZF2-AC [9] | Nb-18Si-10Ge | 17.6 | |
| ZF8-AC [13] | Nb-18Si-5Ge-5Al | 16.3 | |
| ZF7-AC [15] | Nb-18Si-5Ge-5Cr | 15.2 | |
| ZF4-AC [15] | Nb-24Ti-18Si-5Ge-5Cr | 14.8 | |
| ZF5-AC [13] | Nb-24Ti-18Si-5Ge-5Al | 12.6 | |
| ZF6-AC | Nb-24Ti-18Si-5Ge-5Cr-5Al | 11.8 |
Table 10.
The parameters ΔHchem, ΔSmix, VEC, δ, Δχ and Ω of the alloys ZF6 and ZF9 and their solid solutions in the as cast (AC) and heat treated (HT) conditions. For calculation of parameters see [35,36]. Note that the symbol Q was used instead of Ω in [36].
| Condition | Alloy | Nbss | Parameter | |||||
|---|---|---|---|---|---|---|---|---|
| - | - | - | ΔHchem (Kj·mol−1) | ΔSmix (J·mol−1·K) | VEC | δ | Δχ | Ω |
| AC | ZF6 | Nbss Ti-rich Nbss | −39.4 | 12.31 | 4.458 | 8.42 | 0.146 | 0.672 |
| −12.87 | 10.38 | 4.639 | 5.12 | 0.078 | 1.855 | |||
| −13 | 10.9 | 4.642 | 5.52 | 0.077 | 1.888 | |||
| HT | ZF6 | Nbss | −40.4 | 12.16 | 4.463 | 8.49 | 0.149 | 0.650 |
| −9.7 | 10.07 | 4.709 | 5.02 | 0.063 | 2.411 | |||
| AC | ZF9 | Nbss | −40.09 | 13.65 | 4.419 | 8.97 | 0.167 | 0.730 |
| −12.29 | 11.83 | 4.626 | 5.95 | 0.084 | 2.146 | |||
| HT | ZF9 | Nbss | −40.73 | 13.52 | 4.421 | 8.99 | 0.167 | 0.714 |
| −6.87 | 9.68 | 4.764 | 4.96 | 0.063 | 3.367 | |||
© 2019 by the authors. Licensee MDPI, Basel, Switzerland. This article is an open access article distributed under the terms and conditions of the Creative Commons Attribution (CC BY) license (http://creativecommons.org/licenses/by/4.0/).
Share and Cite
MDPI and ACS Style
Li, Z.; Tsakiropoulos, P. On The Microstructures and Hardness of The Nb-24Ti-18Si-5Al-5Cr-5Ge and Nb-24Ti-18Si-5Al-5Cr-5Ge-5Hf (at.%) Silicide Based Alloys. Materials 2019, 12, 2655. https://doi.org/10.3390/ma12172655
AMA Style
Li Z, Tsakiropoulos P. On The Microstructures and Hardness of The Nb-24Ti-18Si-5Al-5Cr-5Ge and Nb-24Ti-18Si-5Al-5Cr-5Ge-5Hf (at.%) Silicide Based Alloys. Materials. 2019; 12(17):2655. https://doi.org/10.3390/ma12172655
Chicago/Turabian StyleLi, Zifu, and Panos Tsakiropoulos. 2019. "On The Microstructures and Hardness of The Nb-24Ti-18Si-5Al-5Cr-5Ge and Nb-24Ti-18Si-5Al-5Cr-5Ge-5Hf (at.%) Silicide Based Alloys" Materials 12, no. 17: 2655. https://doi.org/10.3390/ma12172655
Note that from the first issue of 2016, this journal uses article numbers instead of page numbers. See further details here.