Article

Enhanced Multiferroic Properties of YFeO3 by Doping with Bi3+

by
Omar Rosales-González
1,
Félix Sánchez-De Jesús
1,
Fernando Pedro-García
1,
Claudia Alicia Cortés-Escobedo
2,
Màrius Ramírez-Cardona
1 and
Ana María Bolarín-Miró
1,*
1
Área Académica de Ciencias de la Tierra y Materiales, Universidad Autónoma del Estado de Hidalgo Mineral de la Reforma, Hidalgo 42184, Mexico
2
Instituto Politécnico Nacional, Centro de Investigación e Innovación Tecnológica, Ciudad de Mexico 02250, Mexico
*
Author to whom correspondence should be addressed.
Materials 2019, 12(13), 2054; https://doi.org/10.3390/ma12132054
Submission received: 31 May 2019 / Revised: 20 June 2019 / Accepted: 25 June 2019 / Published: 26 June 2019
(This article belongs to the Special Issue Advances in Multiferroics)

Abstract

:
Tthe present work studied the cationic substitution of Y3+ by Bi3+ on the crystal structure of orthorhombic YFeO3 and its effect over magnetic, dielectric and electric properties of multiferroic yttrium orthoferrite. Stoichiometric mixtures of Y2O3, Fe2O3 and Bi2O3 were mixed and milled for 5 h using a ball to powder weight ratio of 10:1 by high-energy ball milling. The obtained powders were pressed at 1500 MPa and sintered at 700 °C for 2 h. The test samples were characterized at room temperature by X-ray diffraction (XRD), vibrating sample magnetometer (VSM), scanning electron microscope (SEM), energy dispersive X-ray spectroscopy (EDS) and impedance spectroscopy (IS). The X-ray diffraction patterns disclosed a maximum solubility of 30 % mol. of Bi3+ into the orthorhombic YFeO3. For higher concentrations, a transformation from orthorhombic to garnet structure was produced, obtaining partially Y3Fe5O12 phase. The substitution of Bi3+ in Y3+ sites promoted a distortion into the orthorhombic structure and modified Fe-O-Fe angles and octahedral tilt. In addition, it promoted a ferromagnetic (FM) order, which was attributed to both the crystal distortion and Dzyaloshinskii-Moriya interaction. For doped samples, an increase in real permittivity values was observed, and reduced with the increase of frequency. This in good agreement with the Maxwell-Wagner effect.

1. Introduction

Multiferroic materials are those that exhibit at least two of three ferroic orders: Ferroelectricity, ferromagnetism, and ferroelasticity [1]. Multiferroic that combines ferromagnetic and ferroelectric behaviors, also known as magnetoelectric multiferroic, is quite rare compared to other multiferroic materials., However, there has been considerable scientific interest for its potential applications in electronic systems, especially in storage devices for recording and reading information [2,3,4]. However, there are still many design challenges for multiferroics materials, highlighting that this behavior is exhibited only at low temperature [5]. Bismuth ferrite (BiFeO3) is the first generation of multiferroic materials that combine in a single phase ferroelectric and antiferromagnetic behavior at room temperature [6,7]. Furthermore, it presents many issues due to the formation of secondary phases that provide a high leakage current [8,9]. The second generation of multiferroic materials is composed by perovskites with the general formula RFeO3 where R = Y, Ho, Lu, Er or Sc. [10] YFeO3 is a second-generation multiferroic material. This material crystallizes in two polymorphic forms: (i) Orthorhombic perovskite-type structure; and (ii) hexagonal structure. The orthorhombic YFeO3 or yttrium orthoferrite, having distorted the perovskite structure, crystallizes in the centrosymmetric space group Pnma, with lattice parameters a = 5.5946 Å, b = 7.6040 Å, and c = 5.2790 Å. The centrosymmetric nature of this material is responsible for ferroelectric and weak ferromagnetic behaviors at room temperature. It presents a magnetic transition at the Neel temperature of ~640 K [11,12]. Magnetic ordering is related to three types of magnetic interactions in atoms bonds: Y-Y, Y-Fe and Fe-Fe where Fe-O-Fe super-exchange interaction is the main source of the weak ferromagnetic behavior as well as the canting of magnetic moments of Fe3+ due to the Dzyaloshinskii-Moriya (DM) interaction [10,13]. Further, centrosymmetric structures are not ferroelectric in nature, however distortions in the structure can modify it [14]. For YFeO3 materials, Pnma centrosymmetric structure induces polarization arising from canted antiferromagnetic ordering and structure distortion [15,16]. This indicates that multiferroic property of this material is associated with Fe-spins which induces electric polarization, partial substitution or doping with different ions in A or B sites (Y3+ and Fe3+ sites) which are an advantageous method to modify and sometimes enhance the multiferroic properties of YFeO3 [17,18]. Many works have been focused on the doping of one of both atomic positions reporting interesting results in multiferroic properties. Jacobs et al. reported increased electrical conductivity with the partial substitution of Ca2+ for Y3+ into YFeO3 crystal structure, which was attributed to the compensation of charge Ca2+ that produced a hole localization on Fe site [19]. The substitution on A-sites with magnetic ion Gd3+ enhanced the magnetic behavior mainly due to the new Gd-Gd, Gd-Fe interactions, structural distortions and microstrain induced in the YFeO3 crystal structure [20,21]. Similar behavior was observed for the doping of Er3+ substituting Y3+ at low concentrations. Nevertheless, when Er3+ content increased, the weak ferromagnetic behavior was lost and acquired paramagnetic properties [22]. A dielectric properties study on YFeO3, concerning to B site substitution of Fe3+ with Mn3+, showed a reduction in relative permittivity and three dielectric relaxations in the function of temperature. Further, the results showed the important role of oxygen vacancies toward the dielectric relaxation process [3,17]. Madolappa et al. [11] reported an increased coercive field of YFeO3 related with the use of Ti4+ as a doping ion. They demonstrated that the dielectric relaxation process corresponded to the non-Debye type. Additionally, Ti4+ promoted a long-range conductivity process. Regarding the above, R3+-Fe interactions demonstrated an intimal relation with the magnetic and dielectric properties of the orthorhombic YFeO3. Therefore, it is possible to modulate ferromagnetic and ferroelectric properties with the addition of rare earth cations with a different ionic size other than the Y3+ ionic ratio. It is expected that Bi3+ would enhance the ferroelectric behavior, in a similar way that occurs in BiFeO3, but avoiding the formation of secondary phases and increasing the FeO6 octahedron tilting, providing a ferromagnetic behavior.
This work reports a systematical study of the partial substitution of Y3+ by Bi3+ to modulate the ferromagnetic and dielectric properties of orthorhombic YFeO3. The nature of the origin of ferromagnetic and dielectric properties has not been clearly explained yet, therefore it is important to evaluate individually the magnetic and the dielectric behaviors as indicators for its prospective application as multiferroic material.

2. Materials and Methods

Stoichiometric mixtures of precursor oxides: Iron oxide (Fe2O3, Sigma-Aldrich, St. Louis, MO, USA, 99.9% purity), yttrium oxide (Y2O3, Sigma-Aldrich, St. Louis, MO, USA, 99.9% purity) and bismuth oxide (Bi2O3, Sigma-Aldrich, St. Louis, MO, USA, 99.9% purity) were mixed following to Equation (1):
( 1 x ) Y 2 O 3   +   Fe 2 O 3   +   x   Bi 2 O 3   2 Y 1 x Bi x FeO 3
A total of 5 g of starting mixture was loaded along with steel balls of 1.27 cm of diameter in a cylindrical steel vial (50 cm3) (steel/steel, S/S) at room temperature in an air atmosphere and milled for 5 h, using a shaker mixer mill (SPEX model 8000D, SPEX® SamplePrep, Metuchen, NJ, USA). The milled powders were uniaxially pressed into cylindrical test pieces at 1500 MPa. The test pieces were annealed in an air atmosphere at 700 °C for 2 h. The structural characterization of all the products was made using an X-ray diffractometer Bruker D-8 (Bruker Corporation, Billerica, MA, USA) with Cu radiation (λ = 1.541874 Å) in the 2-theta range from 20 to 60 degrees. Refined lattice parameters, crystallite sizes, phase quantification (wt. %) and microstrain (µε), were determined by Rietveld analysis using free-software, Material Analysis Using Diffraction (MAUD, Version 2.26, Trento, Italy)), for all synthesized samples. This method considers all the collected information in a diffraction pattern and uses a least-squares approach to refine the theoretical line profile until it matches the measured profile [23]. Starting crystallographic data were obtained from the Inorganic Crystal Structure Database (ICSD). The grain morphologies and porosity of sintered pellets were analyzed using a JEOL JSM-6300 scanning electron microscope (JEOL, Akishima, Tokio, Japan) working at an accelerating voltage of 15 kV. Energy-dispersive X-ray spectroscopy (EDS) microanalysis (EDAX, Mahwah, NJ, USA) was used to determine the elemental composition in SEM micrographs. Magnetization studies were carried out at room temperature using a vibrating sample magnetometer (VSM) model MicroSense EV7 (Microsense LLC, Lowell, MA, USA), with a maximum field of ±18 kOe. The Curie temperature was determinated by means of a temperature scan test under a magnetic field of 10 kOe and it was taken as the intersection point with the temperature axis of the tangent to the magnetization curve with the most negative slope. Impedance spectroscopy was performed using a LCR meter Model HIOKI Hi-TESTER, 3532-50 (HIOKI, Nagano, Japan) at room temperature, in a frequency range from 102 to 5 × 10⁶ Hz. Previously, both sides of test pieces were coated with an Au-Pt alloy through the sputter coating process.

3. Results and Discussions

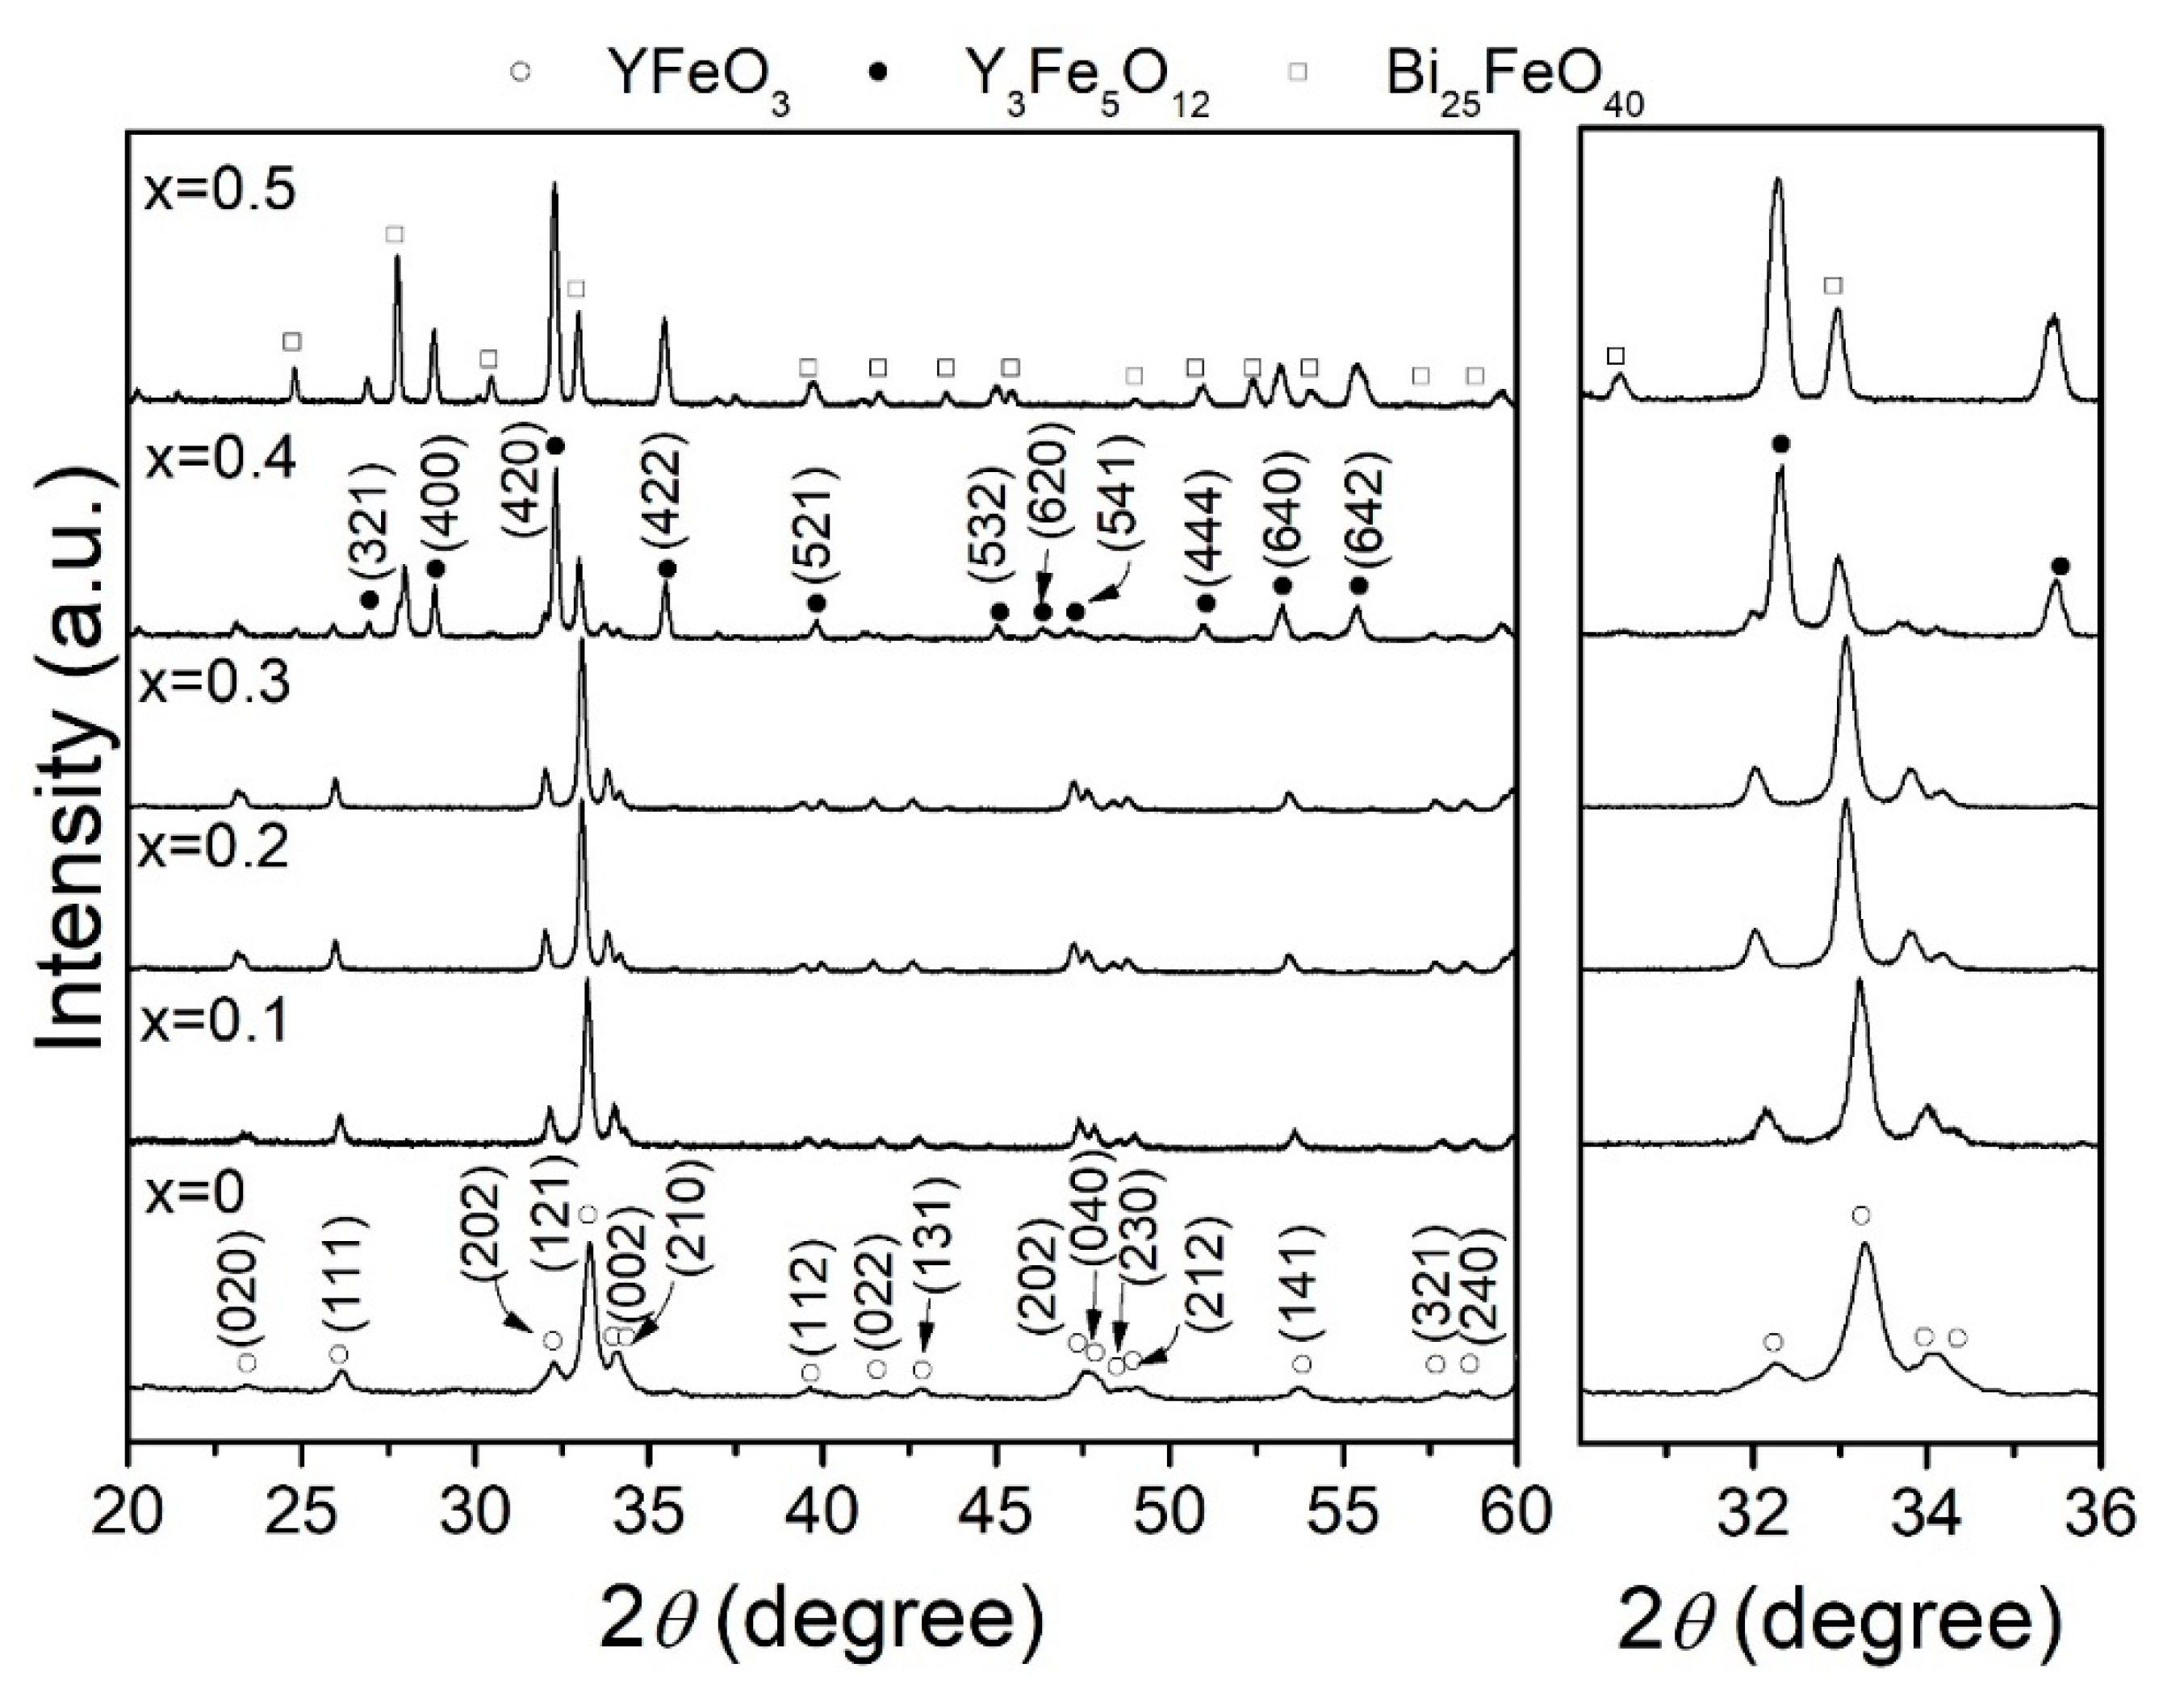
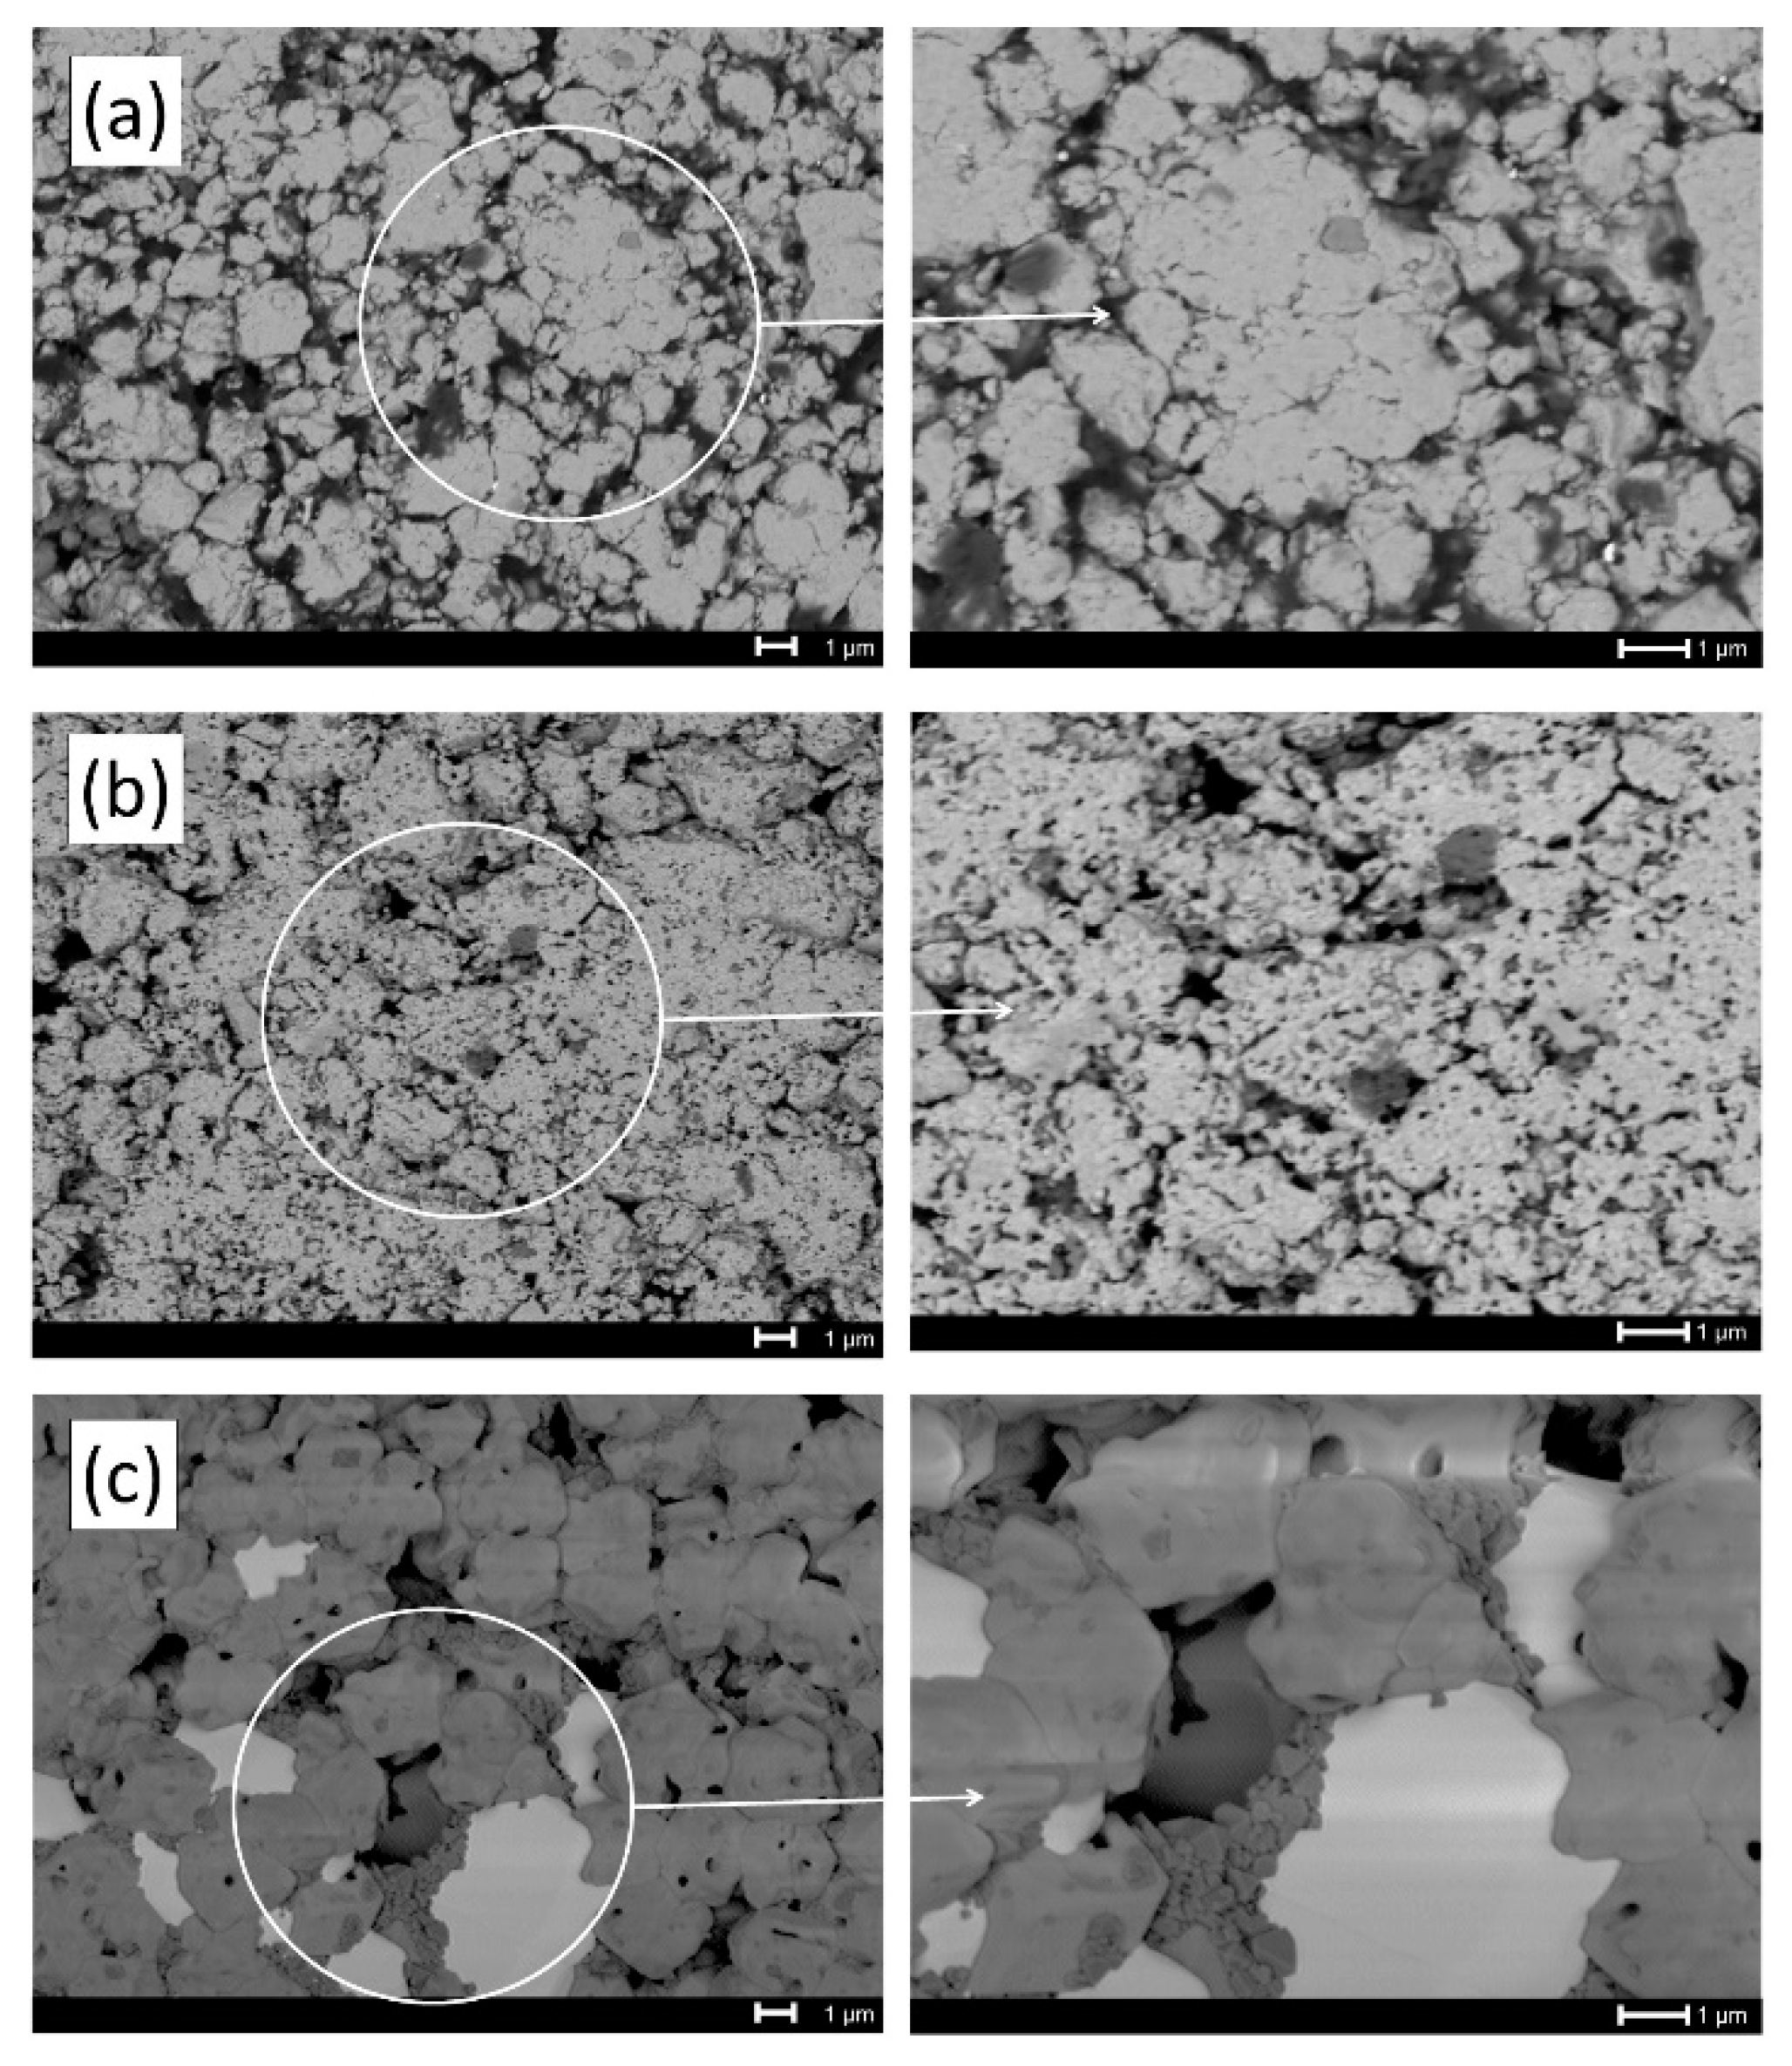
3.1. Structural Characterization

Figure 1 shows the X-ray diffraction (XRD) patterns for different stoichiometric mixtures of Y2O3, Fe2O3 and Bi2O3, milled for 5 h, pressed at 1500 MPa and sintered at 700 °C for 2 h in order to obtain Y1−xBixFeO3 test pieces (Δx = 0.1, 0 ≤ x ≤ 0.5). As can be observed in Figure 1, the X-ray diffraction pattern belonging to the un-doped Y1−xBixFeO3 sample (x = 0), the formation of orthorhombic YFeO3 (YFeO3, ICSD #80865, Pnma) can be confirmed by the presence of its diffraction peaks. After doping with low contents of bismuth (x ≤ 0.3), two gradual phenomena could be observed. The decreased peak diffraction broadened in relation with the increased amounts of Bi3+ concentration, and shifted toward to low angles of the diffraction peaks, as shown on the right of Figure 1. It is a consequence of Y3+ substitution by the Bi3+ into the yttrium orthoferrite crystal structure which increased their lattice parameters due to their larger size radii ion. By increasing the bismuth concentration (x ≥ 0.4), new diffraction peaks belonging to yttrium iron garnet (YIG, Y3Fe5O12, ICSD #60167, Ia3d) appeared, and it was accompanied with sillenite (Bi25FeO40, ICSD #68627, I-23) as a secondary phase.
The phase transformation or decomposition of yttrium orthoferrite was completed for x = 0.5, and it was induced due to the YFeO3 orthorhombic phase which was an intermetallic compound, with a stoichiometric composition. Therefore, it just introduced small amounts of dopants. In the studied compositions, a maximum amount of 0.3 mol. of bismuth can be introduced into the yttrium position of the orthorhombic crystal structure (solubility), in good agreement with Van Hook’s phase diagram [24,25]. In general, it was observed that a decrement in broadening peak reflections with the increment of doped level (x), was associated with modifications in the crystallite size and microstrain.
Rietveld refinements were carried out to study the evolution of the cell parameters, crystallite size, microstrain, and phase quantification as the Bi3+ concentration (x) was increased. The results are presented in Table 1. Through phase quantification, it possibly confirmed that samples with low Bi3+ concentrations (x ≤ 0.3) were mainly composed of pure orthorhombic YFeO3. However, when the bismuth was higher than 0.4, the amount of orthorhombic YFeO3 decreased until 15.97 wt. %, with an increment of the yttrium iron garnet (YIG or Y3Fe5O12) approximately 73.67 in wt. %, and 10.36 wt. % of Bi25FeO40. Moreover, for x = 0.5 sample, a complete phase transition to the garnet structure was confirmed, though Bi25FeO40 (13.32 wt. %) as a secondary phase was still present. In reference with refined parameters, it can be observed that the lattice parameters increased systematically, while the microstrain decreased as bismuth content increased. This can be attributed to the substitution of Y3+ with smaller ionic radii (0.90 Å) by a larger ionic radii cation Bi3+ (1.03 Å) [26]. Also, the microstrain can be correlated with the increased crystallite size and hence with the grain growth which promoted the liberation of internal stress of the crystal structure. These results explain the diminution of the broadening of peaks with the bismuth content, observed qualitatively in the XRD patterns shown in Figure 1. In the particular composition of x = 0.4, the polymorphic transition from orthorhombic YFeO3 to garnet Y3Fe5O12 produced a diminution in microstrain, independently to crystallite size. It was attributed to the preference of Bi3+ to form Bi25FeO40; rather than introduce into the crystal structure to obtain Bi doped YFeO3. The refinement parameters exhibited a good adjustment, as the low values of Rwp and χ2 have shown.
Geometrical stability of a perovskite-type phase can be explained by the Goldschmidt tolerance factor (t) [27]. This parameter correlates the symmetry system directly with properties in perovskite-type materials. The tolerance factor value is commonly in the range from 0.80 to 1.10 for perovskites, and especially, for orthorhombic structures which take values in the range of 0.8 to 1 [28]. The Goldschmidt tolerance factor (t) was calculated using the Equation (2) where rBi and rY corresponded to the ionic ratio of Bi3+ and Y3+ in 6 coordination while rFe and rO corresponded to Fe and O ions. The data were obtained from the Shannon ionic radii [26]. The results are presented in Table 2.
t   =   ( ( 1 x ) r Y   +   x   r Bi ) + r O 2 ( r Fe + r O )
In orthorhombic YFeO3 crystal structure, Fe3+ ions were surrounded by six O2− which placed an octahedral (FeO6) where O2− ions were located at the corner and shared between two octahedral structures providing two kinds Fe-O-Fe super-exchange bonds. Therefore, there were two bond angles (θ1 and θ2 for Fe-O1-Fe and Fe-O2-Fe, respectively). A geometrical relation between θ1 and θ2 angles and octahedral tilts (φ1 and φ2) were predicted for yttrium orthoferrite using O’Keefe geometrical approximations [29] (Equations (3) and (4)) giving values of angle tilt which is a way to determinate a distortion of the octahedral structure.
θ 1 = cos 1 | 2     5 cos 2 φ 1 2   + cos 2 φ 1 |
θ 2 = cos 1 | 1 4 cos 2 φ 2 3 |
Magnetic and ferroelectric properties in orthoferrites are strongly dependent of the octahedral tilts of FeO6, as well as the Fe-O-Fe bond angle, that are important parameters to know. Crystallographic data obtained from Rietveld analysis were represented in Vesta (Visualization for Electronics and Structural Analysis) software [30], in order to determine bond angles θ1 and θ2 of bismuth doped YFeO3 (Y1−xBixFeO3), to calculate the octahedral tilts using Equation (3) and Equation (4). It is important to note that it only can be applied for samples with the orthorhombic crystal structure, that is, samples doped with x equal/lower than 0.3—in this range of doping level, the phase is orthoferrite. The results are presented in Table 2. As can be observed in the calculated data from the XRD patterns, atomic positions of oxygen changed when bismuth content increased. This displacement of oxygen atoms originated a change in two super-exchange bonds angles (i.e., θ1 and θ2) and, consequently, octahedron tilts can be observed from φ1 and φ2 angles.
Backscattered electrons micrographs of Y1−xBixFeO3 doped at (a) x = 0, (b) x = 0.3 and (c) x = 0.5 sintered at 700 °C are showed in Figure 2. For sample x = 0 (Figure 2a), it was observed that grain size was approximately ~2 µm. This sample showed two regions with different color tonality associated to materials with different electron density, indicating the presence of two different phases. EDS analysis was carried out on both regions, founding the elements related to phases YFeO3 and Fe2O3 for white grains and small gray grains, respectively. The absence of Fe2O3 diffraction peaks in XDR analysis can be explained because their content is under the detection limit of the equipment employed. When x = 0.3 (Figure 2b), larger grain size was observed. This sample showed less porosity and minor porosity size. Also, still present the same phases as an un-doping sample where yttrium orthoferrite (white area) was a majoritarian phase with low quantities of hematite (grey areas). As well as the previous samples, for the sample with x = 0.5 (Figure 2c), only two phases can be observed. Nevertheless, EDS analysis indicated that in this case, the dark-grey regions corresponded to YIG phase and the white one corresponded to sillenite. An increase in grain size was observed in comparison with sample x = 0.3, and the porosity was reduced.

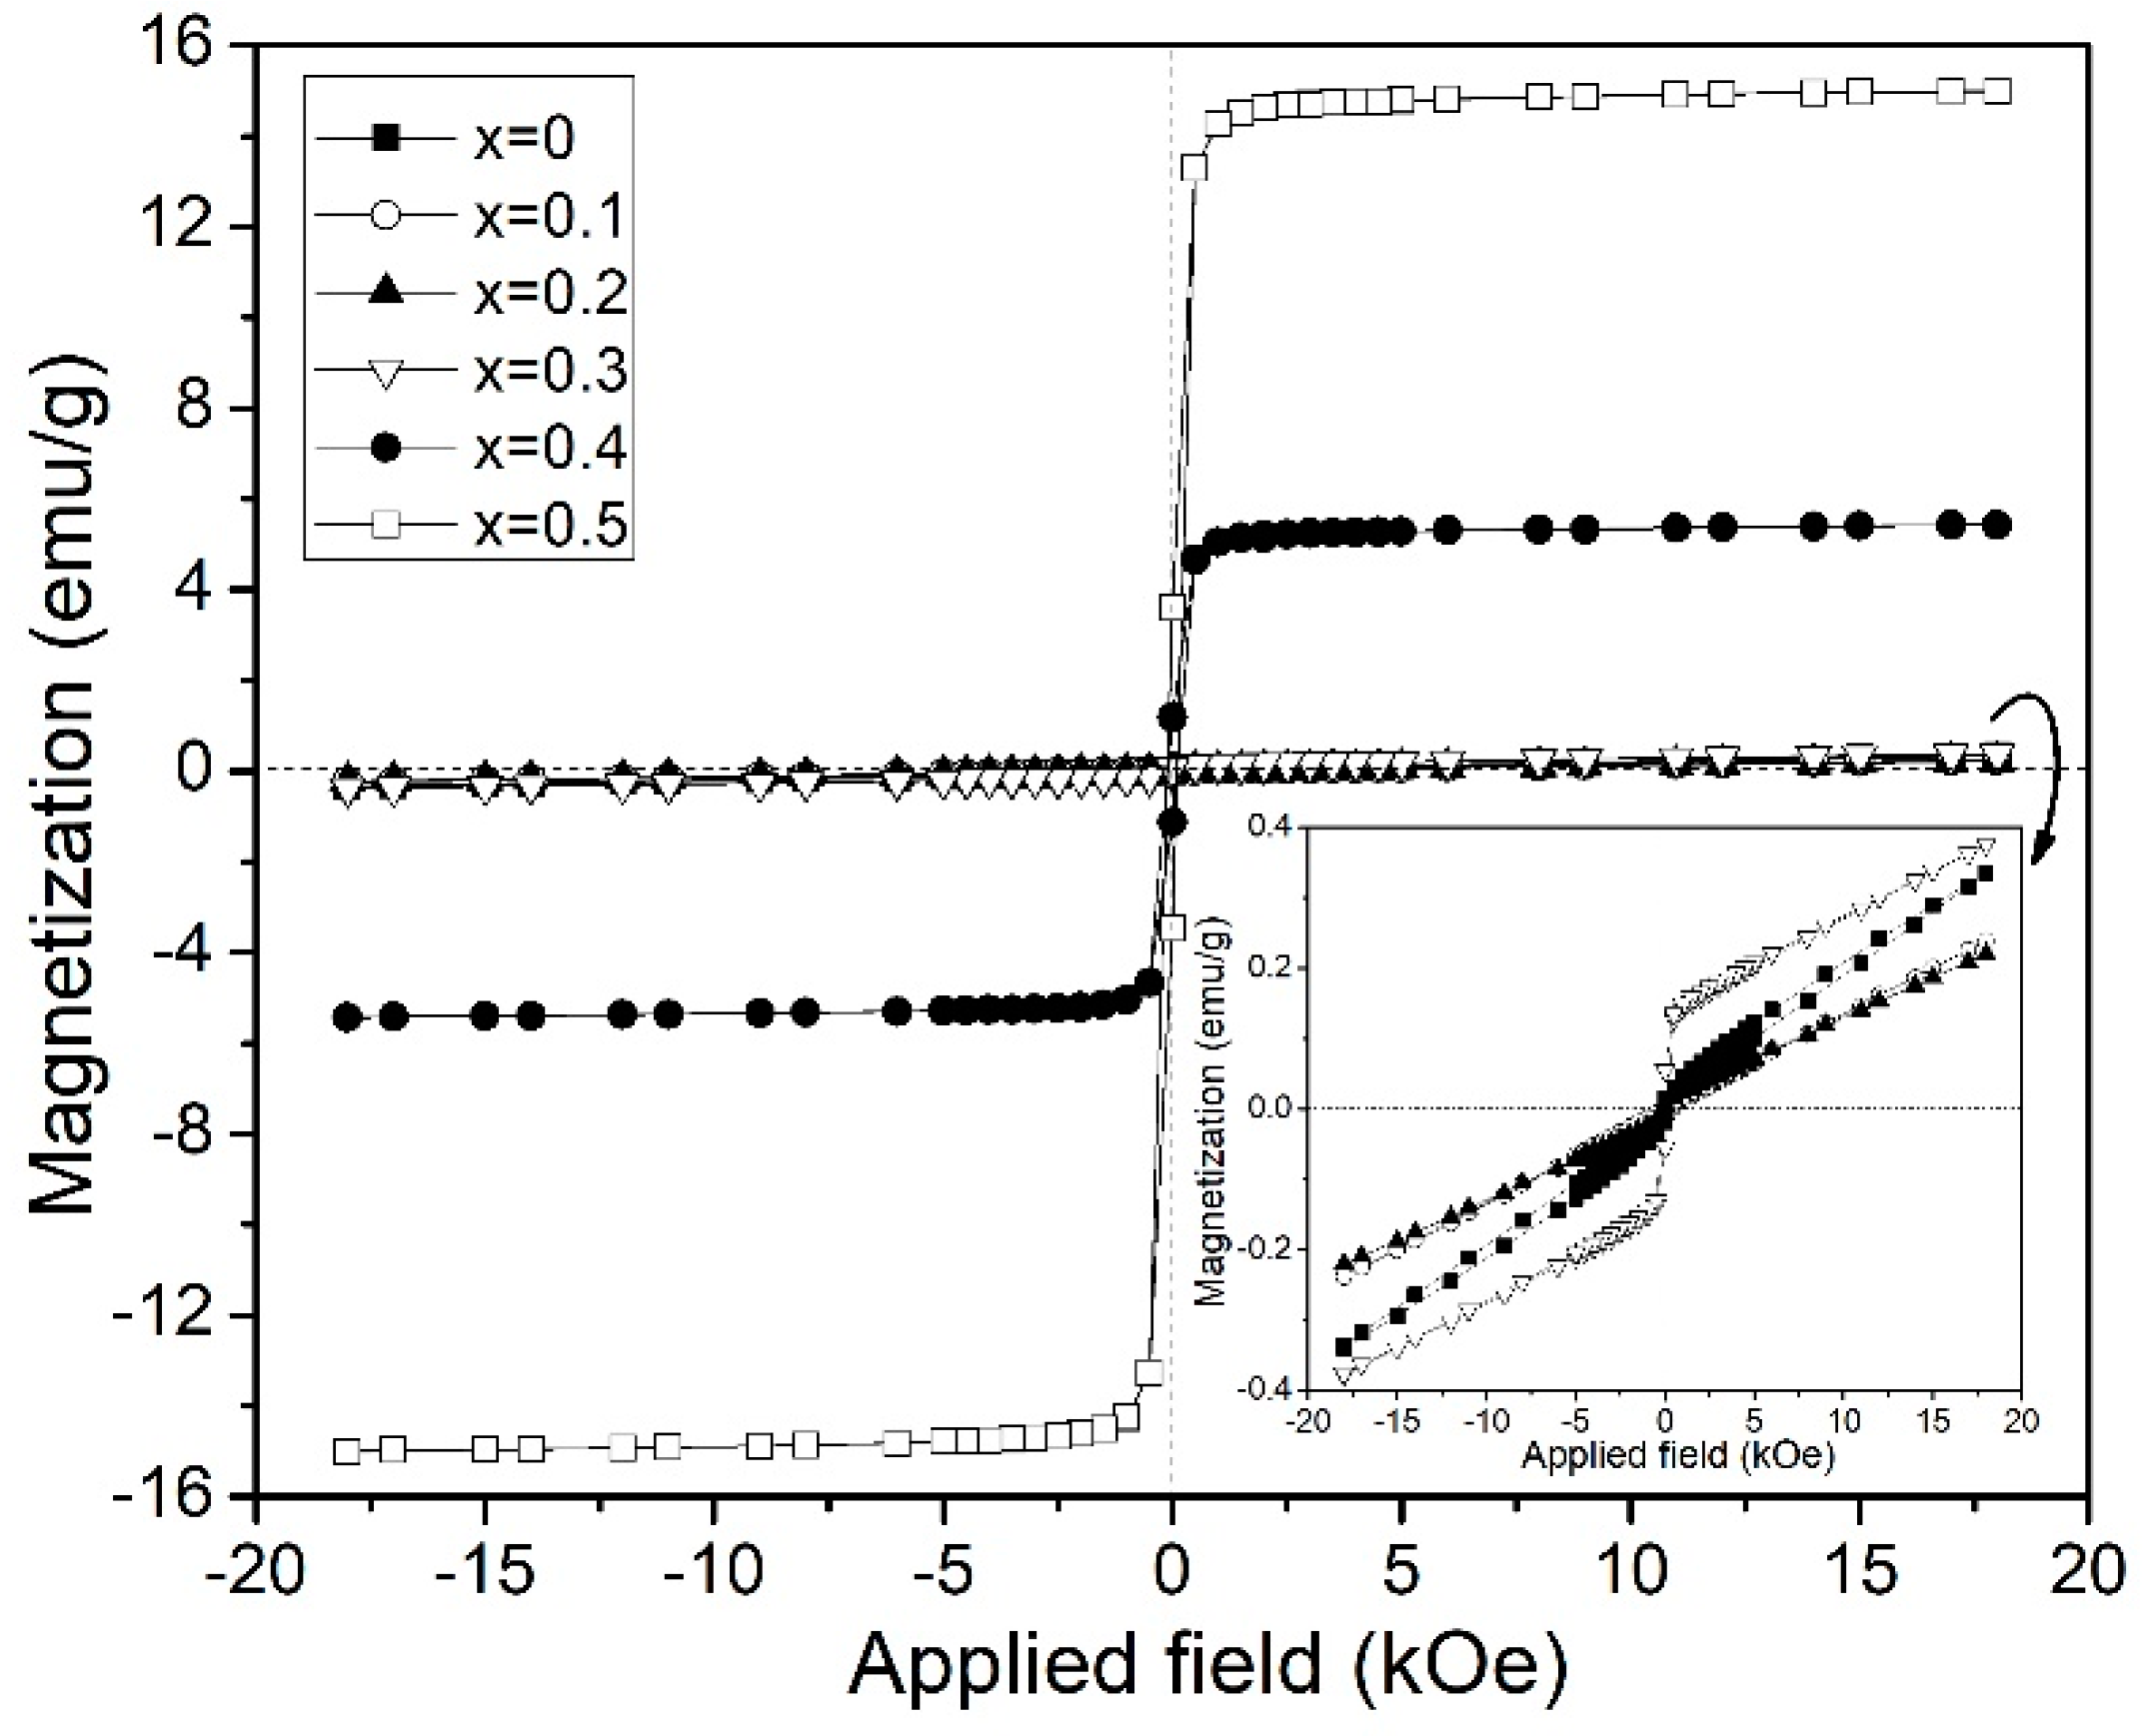
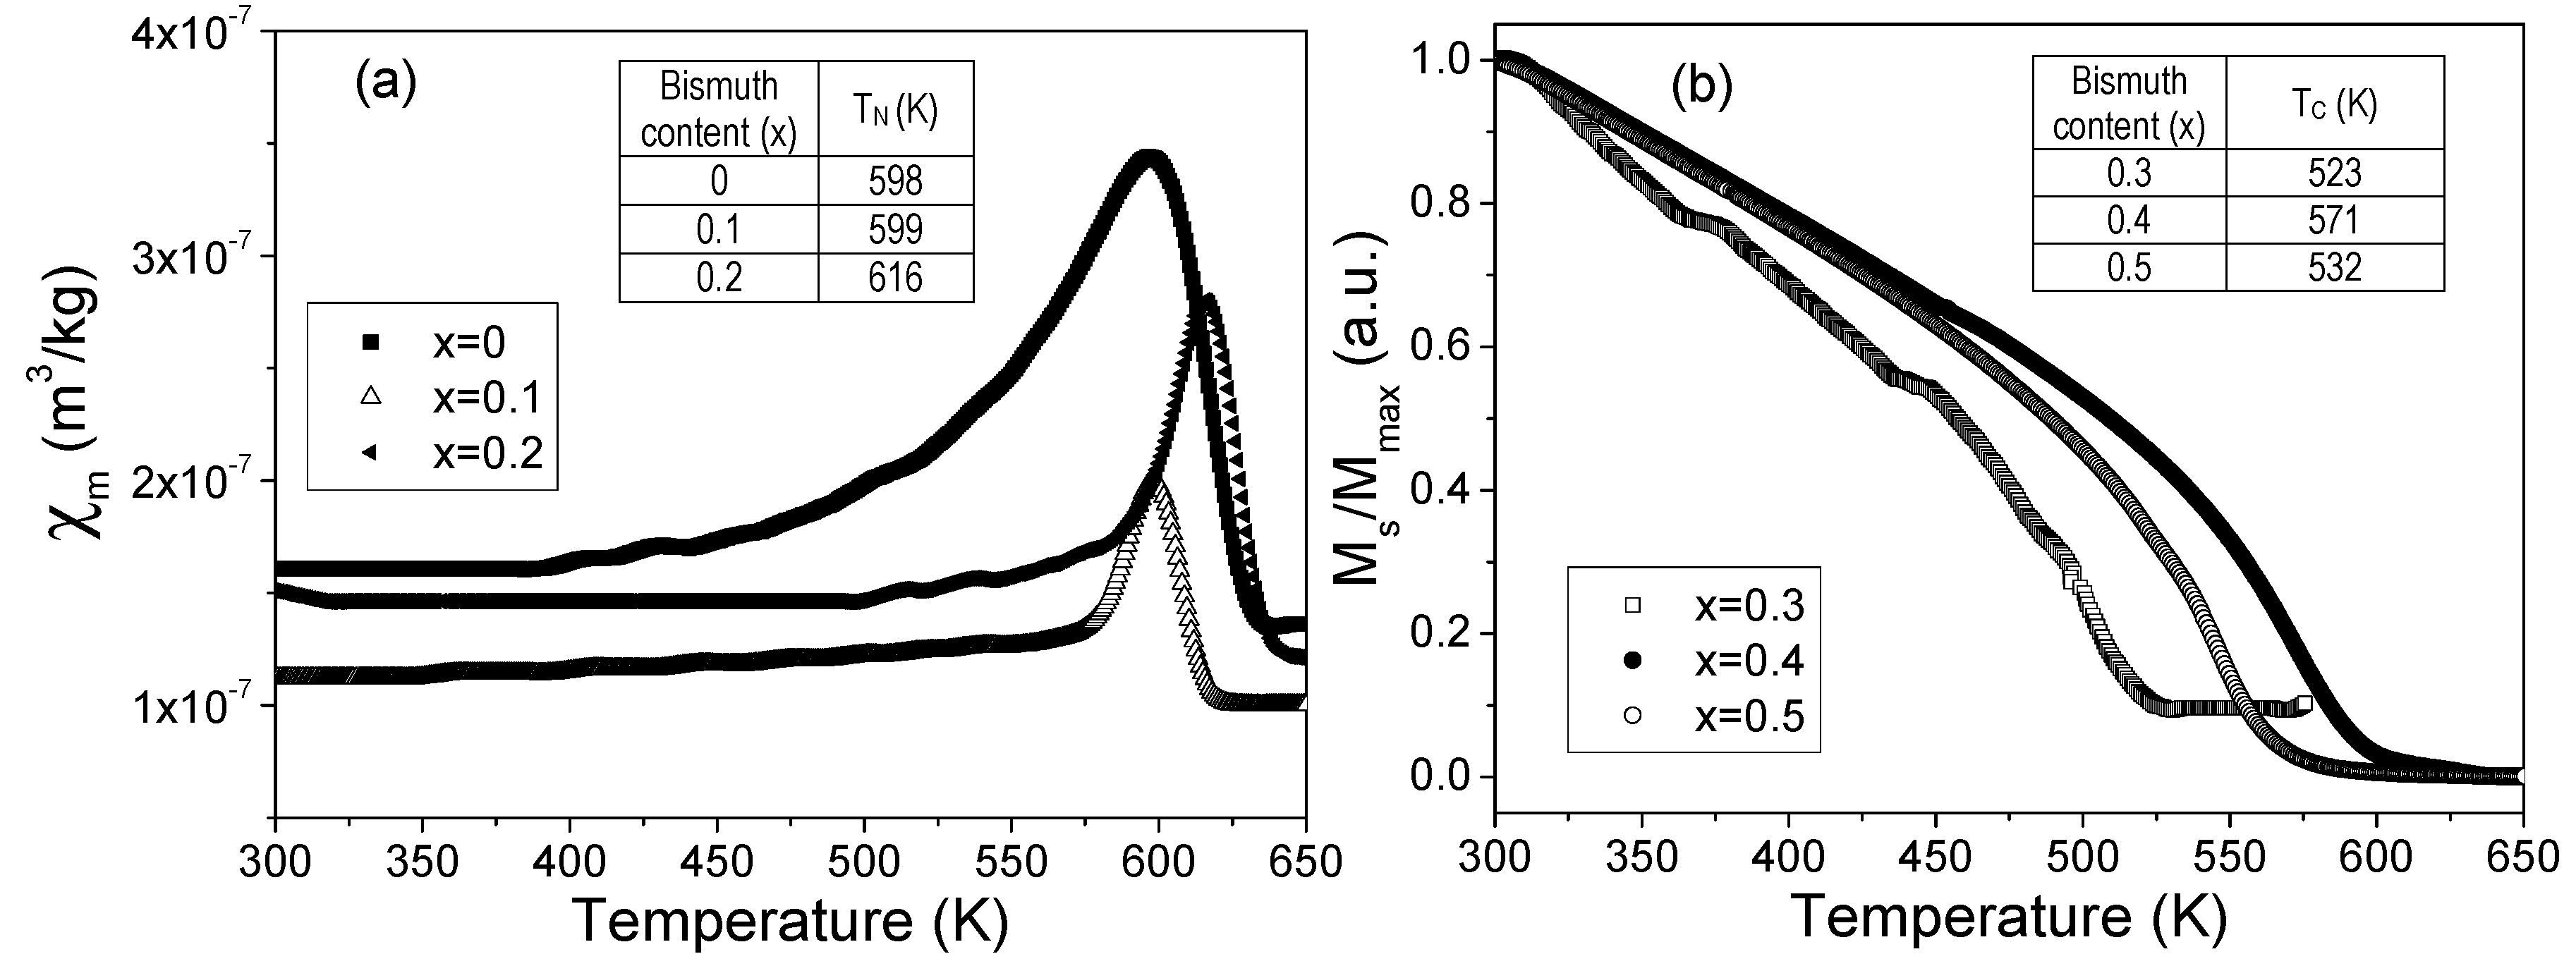
3.2. Magnetic Behavior

Figure 3 shows the magnetic hysteresis loops of the different stoichiometric mixtures of Y2O3, Fe2O3 and Bi2O3 to obtain Y1−xBixFeO3 varying x, from 0 to 0.5. As can be observed, the un-doped YFeO3 (x = 0) mostly showed an antiferromagnetic (AF) G-type order, that is, for each Fe3+ with a spin-up, the nearest Fe3+ neighbor possessed a spin-down. However, a weak ferromagnetic behavior can be observed for the un-doped sample, which was attributed to the presence of small amounts of Fe2O3., It was not detected by XRD analysis (under the limit of detection). Similar AF behavior was observed for samples doped with low Bi3+ contents (x ≤ 0.2), concluding that the substitution of Y3+ by Bi3+ cations did not promote important structural distortions which could modify the magnetic interactions. However, at low bismuth levels, it can be observed that a decrease of the specific magnetization at 18 kOe, with the increase of bismuth content, adscribed to the structure distortion resulting in the modification in Fe-O-Fe bond angle and octahedral tilt [13,20]. For x = 0.3 sample, an interesting modulation of magnetic order by the replacement of the diamagnetic cation Y3+ by the diamagnetic Bi3+ was observed. It can be correlated with the increase in structure distortion, due to the different ionic radii and tilt angle, together whith the effect of the Dzlayoshinski-Moriya interaction [31], providing a net magnetic moment. The inset in Figure 3 presented a hysteresis loops magnification for doping concentrations from x = 0 (un-doped) to 0.3.
Further, in Figure 3, it was observed that a ferrimagnetic behavior with a low coercive field for x = 0.4, was attributed to the mixed magnetic orders of Y3Fe5O12, Bi25FeO40 and YFeO3. In addition, the increased specific magnetization at 18 kOe for x = 0.5 sample was correlated to the increased amount of the Y3Fe5O12 phase. In particular, the magnetic order of Y3Fe5O12 (YIG) prevailed in the magnetic hysteresis loops for x = 0.4 and x = 0.5 samples, due to its phase which was majoritarian in weight percent. However, specific magnetization at 18 kOe was lower as compared to pure Y3Fe5O12. Lower magnetic values can be explained due to Bi3+ cations which were into the Y3Fe5O12 crystal structure. Y3Fe5O12 has a cubic crystal structure with eight formula units and three sub-lattices, each one of these three sub-lattices are occupied by Y3+, and two Fe3+ cations; for 24c, 16a and 24d sites according to the Wyckoff notation [32,33]. Bi3+ cations promoted the formation of a new magnetic sub-lattice, which in turn caused a decrease in the magnetic order. Remanent magnetization slightly varied according to the Y3Fe5O12 content, from 0.06 to 3.24 emu/g for x = 0.3 and x = 0.5, respectively. However, the magnetic susceptively decreased as the bismuth content increased (from x = 0 to x = 0.3), and adscribed to the crystal distortion. The magnetic parameters obtained from magnetic hysteresis loops are summarized in Table 3.
Finally, Figure 4 shows the effect of Bi3+ in the transition temperatures, Curie (FM to PM) and Néel (AF to PM), for the Y1−xBixFeO3 samples. As can be appreciated, a ferromagnetic to paramagnetic transitions were observed for 0.3 ≤ x ≤ 0.5 samples, while an antiferromagnetic to paramagnetic transitions were observed for 0 ≤ x ≤ 0.2 samples. The Néel temperature (Figure 4a) for un-doped samples was approximately 598 K, in good agreement with previous reports for this material [31]. For doped samples, the correlation between the increase of Bi3+ concentration and the increase in transition temperatures can be observed, in good agreement with Das et al. [34] and Yuan et al. [20]. This fact is attributed to the modification in the Fe-O-Fe bond angle shown in Table 2. Similar behavior was reported by Treves et al. [35] who proposed a link between average Fe3+-O2−-Fe3+ superexchange interaction with magnetic transition temperature, varying the temperature from 740 K to 623 K for LaFeO3 and LuFeO3, respectively.
Y3Fe5O12 has a Curie temperature approximately 553K [36], but some authors reported different values, adscribed to the presence of doping cations into the YIG structure, as Baños et al [37], who attributed this modifcation to a new magnetic interaction when Y3+ is substituted by Nd3+. The obtained Curie temperatures for x = 0.4 and 0.5 samples were in the range from 520 K to 571 K, around the value for pure Y3Fe5O12, the variations which have been attributed to the introduction of Bi3+ in the crystal structure and, the presence of secondary phases, as observed in the XRD patterns.

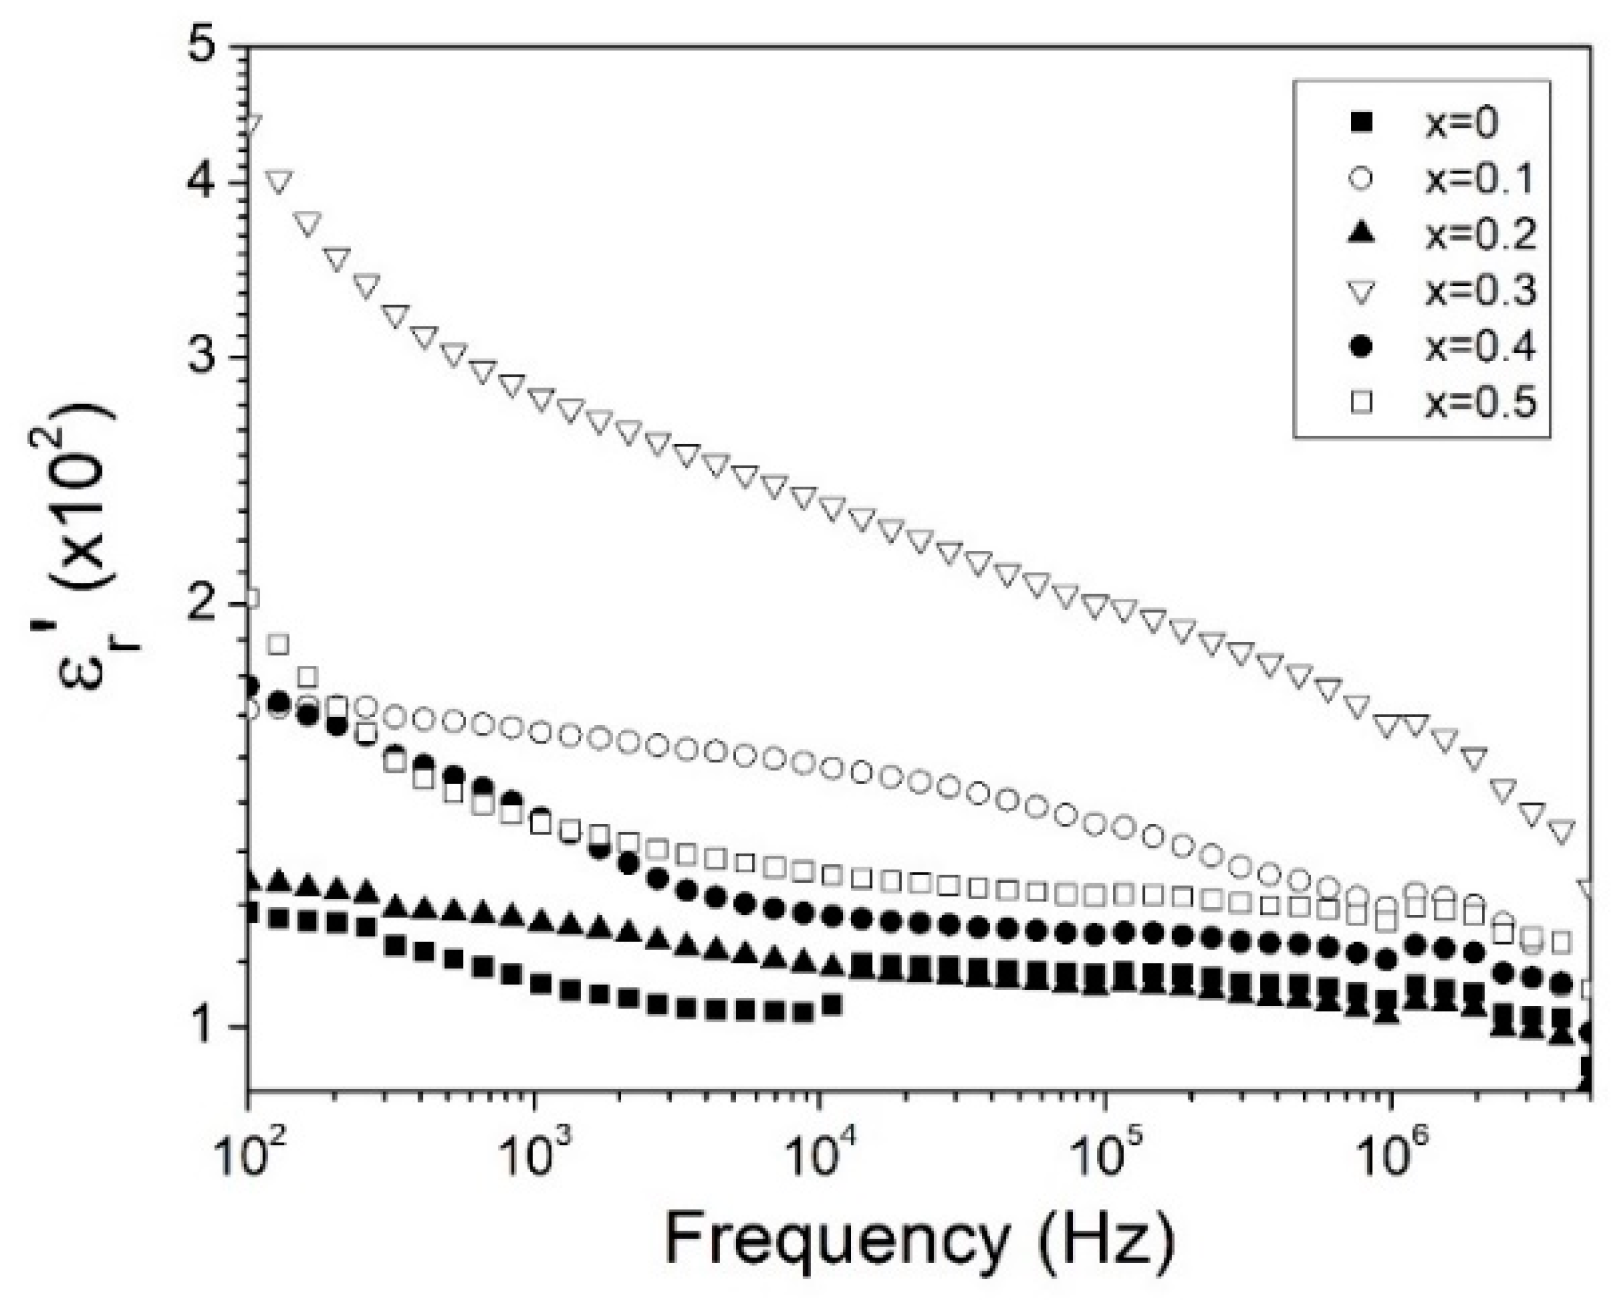
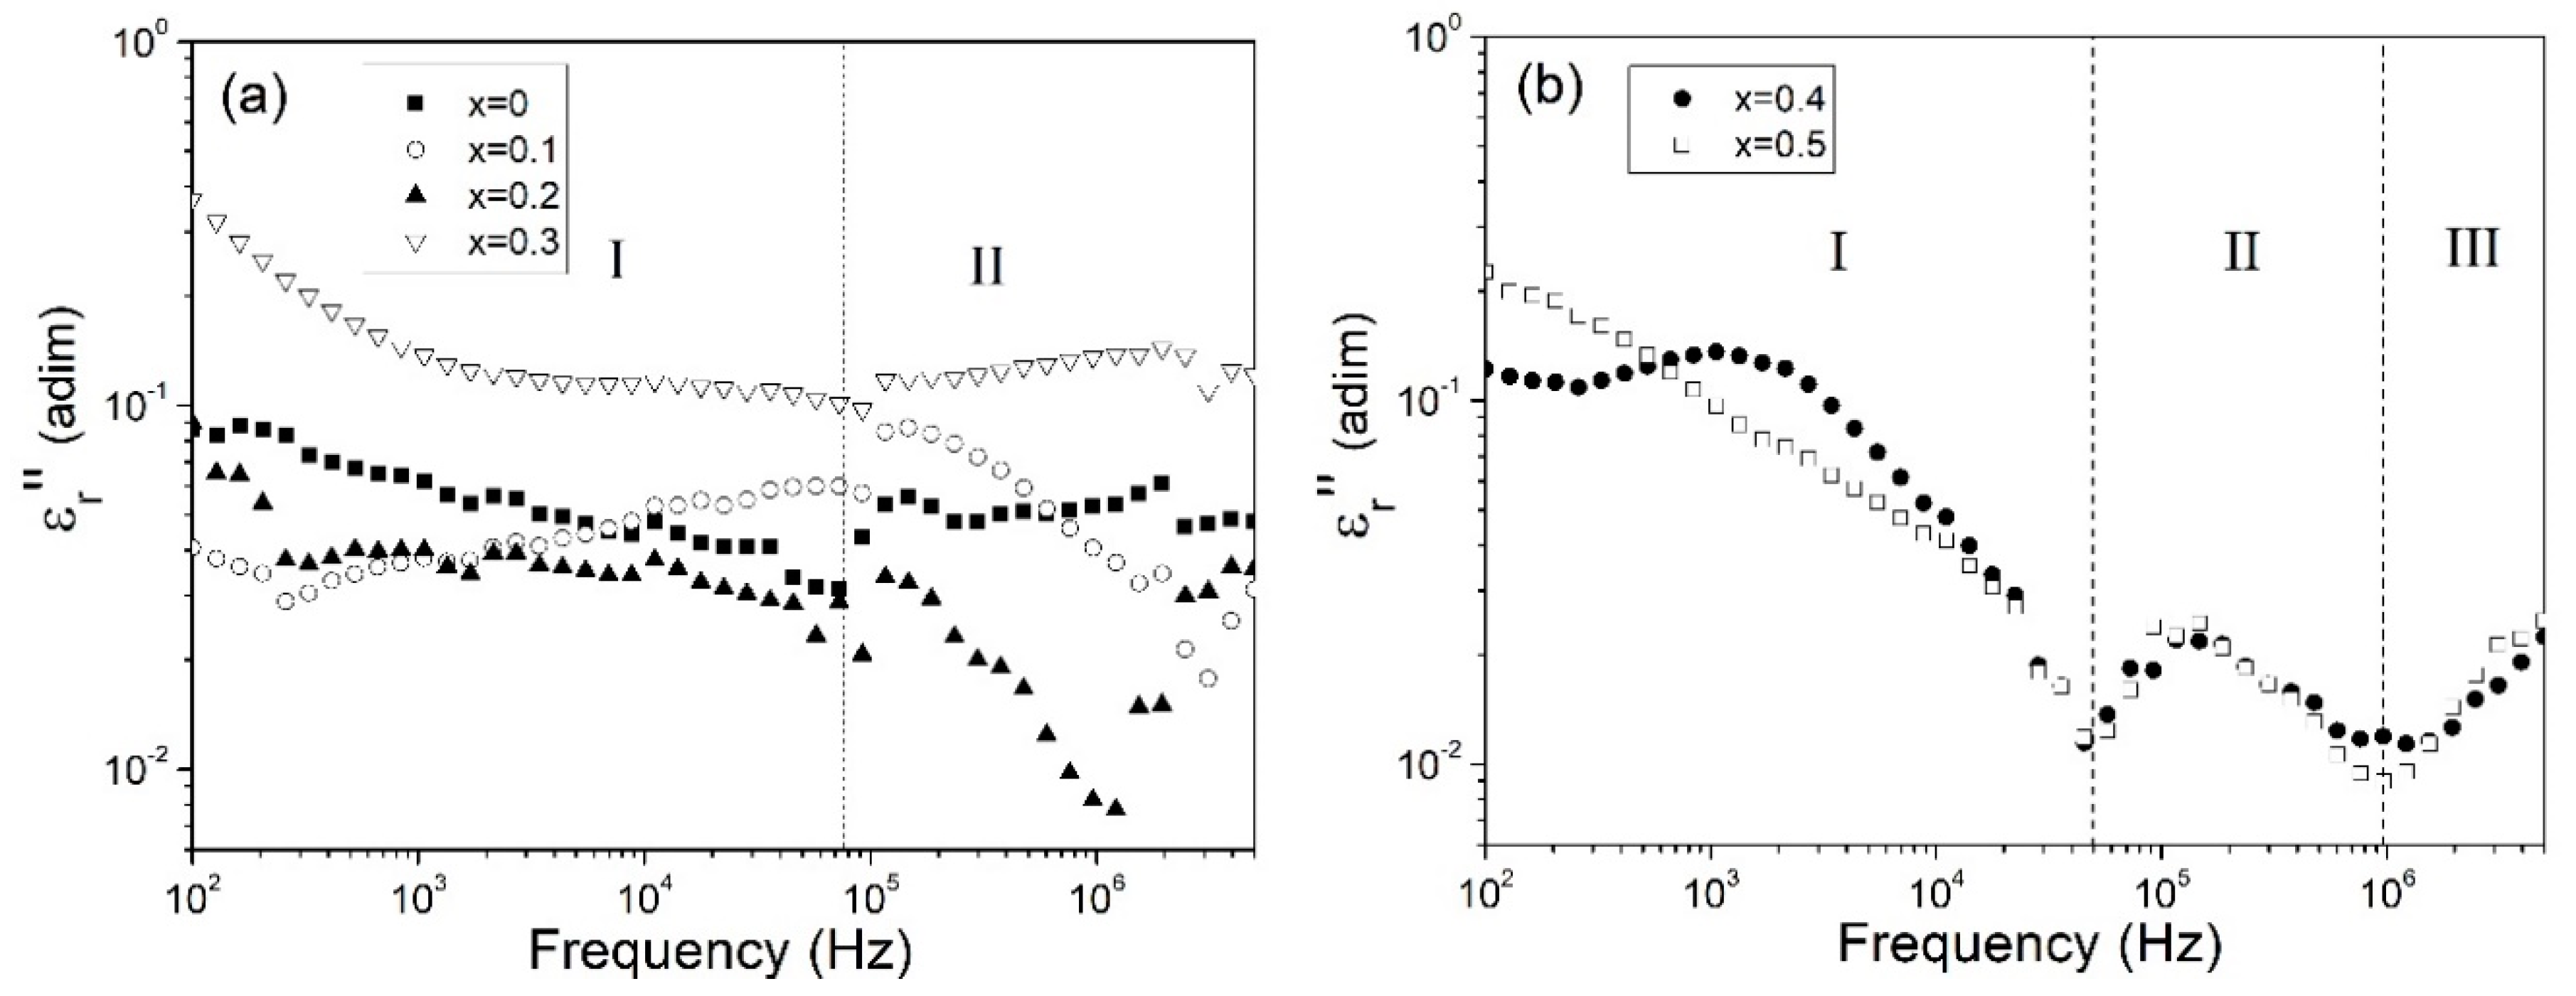
3.3. Dielectric Behavior

Impedance spectroscopy was used as an analytical tool to determine dielectric and electric properties of Bi3+ doped YFeO3. The frequency response for ferroelectric or dielectric materials usually is expressed in terms of relative complex permittivity (εr*), which is composed for real (εr’) and imaginary (εr″) part, as observed from the relationship εr*= εr’ − jεr″ where j = 1 . ε’ and ε″ are correlated to polarization and energy losses of the system respectively [38]. Both real and imaginary relative permittivity parts can be calculated from impedance spectroscopy with the relation presented in Equations (5) and (6) [3]:
ε r = Z ω C 0 ( Z 2 + Z 2 )
where ω is angular frequency and C0 is the geometrical capacitance of the samples. The results of the real part of relative permittivity as a function of frequency are presented in Figure 5. For all samples, values of the real part of relative permittivity were in the range of ~4 × 10² to ~1 × 10² and tended to decrease with the increase of frequency. This can be attributed to space charge polarization produced by grain boundaries, and porosity, ascribed to the conformation process, which is in good agreement with the Maxwell-Wagner effect which predicts that at frequencies below 100 kHz, the principal contribution to the relative permittivity are charge accumulators like grain boundaries, defects and vacancies [39]. When the frequency is above the Maxwell-Wagner effect, it can be proposed that the dipoles responsible of polarization are not able to follow the oscillations of the field, thus an energy dissipation can be produced as evidenced by the reduction in εr’ values [3,4]. The bismuth doped samples with x = 0.1 and 0.3 presented higher values of εr’ than the un-doped sample (x = 0), while for x = 0.2 sample, the values were close to the un-doped sample. This increment may be explained by the increase in oxygen vacancies propitiated by Bi3+ cation in the samples. Oxygen vacancies are common as an inherent defect produced by heat treatment or doping in perovskite oxide structures [3,40].
This dielectric behaviors are very similar to those in the giant relative permittivity materials such as Ba(Fe1/2Nb1/2)O3, Sr(Fe1/2Nb1/2)O3, and Cu3CaTi4O12, however, relative permittivity is several orders lower than the giant relative permittivity materials. The samples with x = 0.4 and x = 0.5 showed a reduction in εr’ values, in comparison with x = 0.3 sample, that can be correlated to the presence of Y3Fe5O12 and Bi25FeO40 as secondary phases.
The frequency dependence of the imaginary part of the complex relative permittivity (εr’’) for doping samples in the ranges of 0 ≤ x ≤ 0.3 and 0.4 ≤ x ≤ 0.5 are shown in Figure 6a and b, respectively. For all samples εr’’ showed a clear dependence with the frequency, having values which ranged from 3 × 10⁻¹ to 8 × 10⁻³ for low and high frequencies respectively. For samples in the range 0 ≤ x ≤ 0.3, two regions can be observed; the first region at frequencies lower than 7 × 10⁴ Hz and the second one over the mentioned frequency. These regions are attributed to the two relaxations, as low temperature dielectric relaxation (LTDR) and high temperature dielectric relaxation (HTDR), following Hunpratub nomenclature for BiFeO3 [41], which can be observed at room temperature. On the one hand, the low temperature dielectric relaxation in YFeO3 ceramics originated from the electronic ferroelectricity by taking the possible mixed valence structure Fe2+/Fe3+ into account. On the other hand, the high temperature dielectric in YFeO3 ceramics has been related to the point defects, such as oxygen vacancies and the coexistence of Fe2+ and Fe3+, which have been generally formed during sintering in air. In the same way for samples in 0 ≤ x ≤ 0.3 range, the relaxation observed in the second region was more evident when bismuth concentration was increasing.
For samples with Bi3+ doping concentrations above 0.4, three zones can be recognized for εr’’, the first (I) at frequencies lower than 4 × 10⁴ Hz, the second (II) from 4 × 10⁴ to 1 × 10⁶ Hz, and the last one (III), at frequencies from 1 × 10⁶ to 5 × 10⁶ Hz. Each of these zones corresponded to a relaxation process. These relaxations showed an increase in comparison with samples with lower bismuth which may be attributed to the presence of secondary phases, especially bismuth. As can be observed, the bismuth concentration directly correlated to changes in the relaxation process in all samples. It has been demonstrated that doping produces the appearance of new dielectric relaxation that can be associated at oxygen vacancies [11,17]. Liberated electrons from oxygen vacancies can be taken by Fe3+ ions and change their oxidation state to Fe2+ ions [42]. The hopping of the electrons through the Fe2+-O2−-Fe3+ bond chains, which is equivalent to the dipole reorientation under ac fields, can also give rise to the dielectric relaxation in Y1−xBixFeO3 samples.

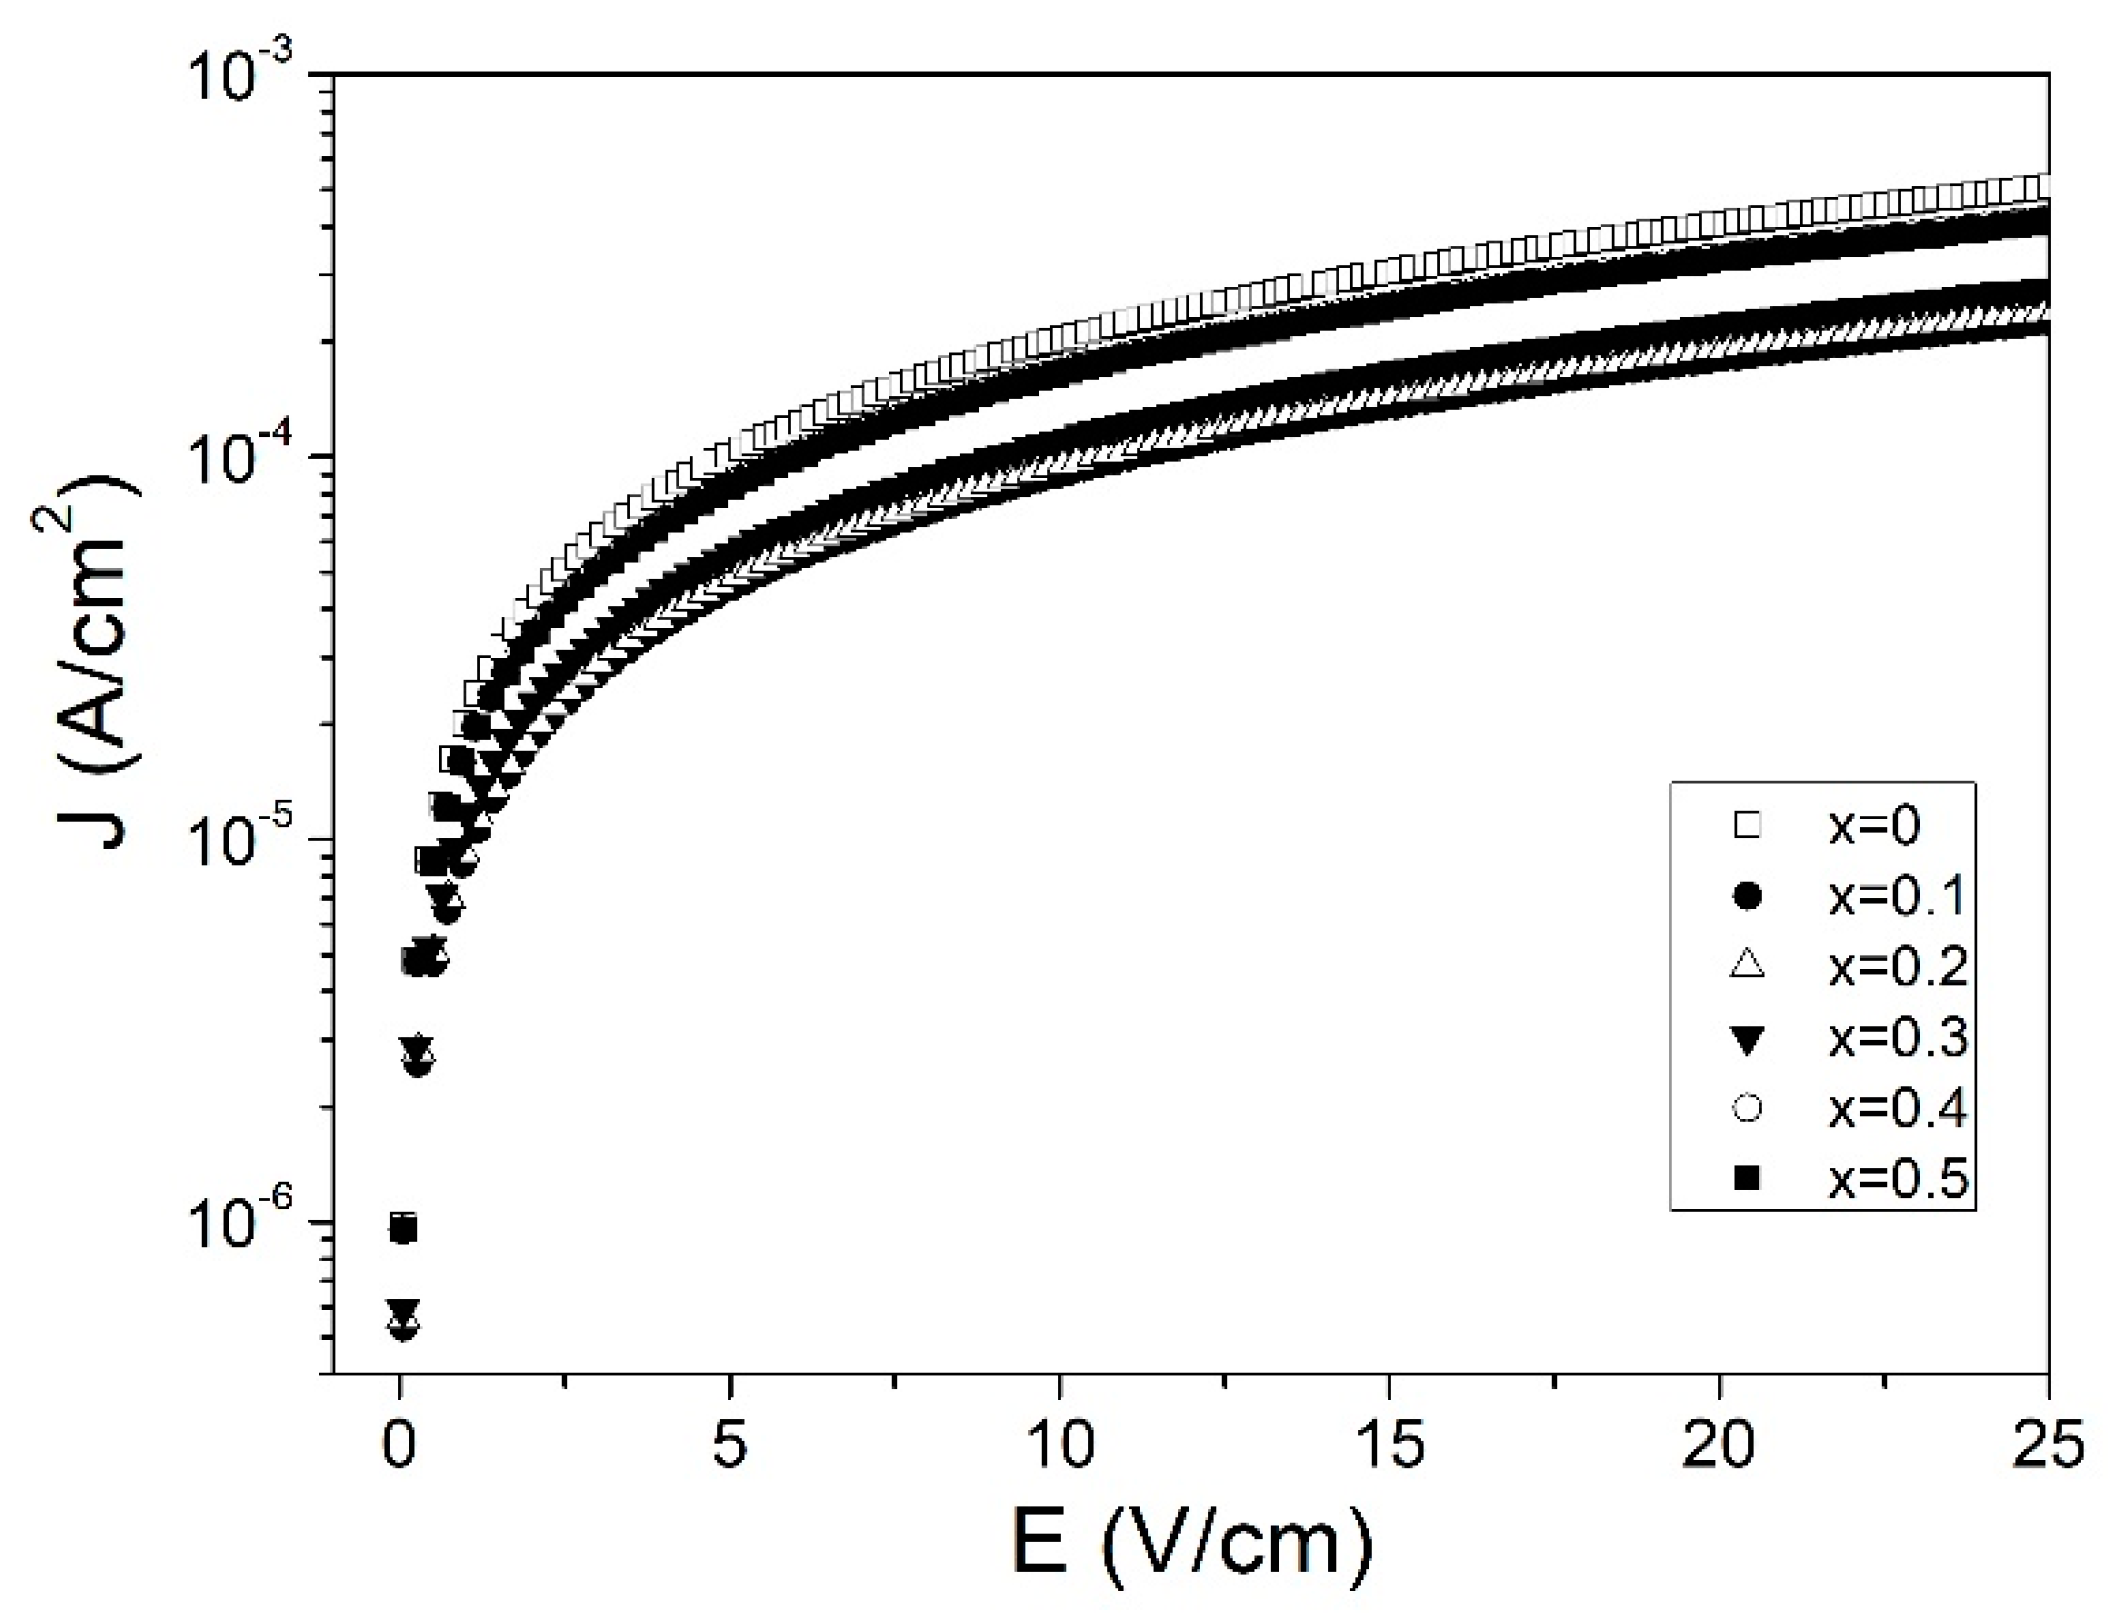
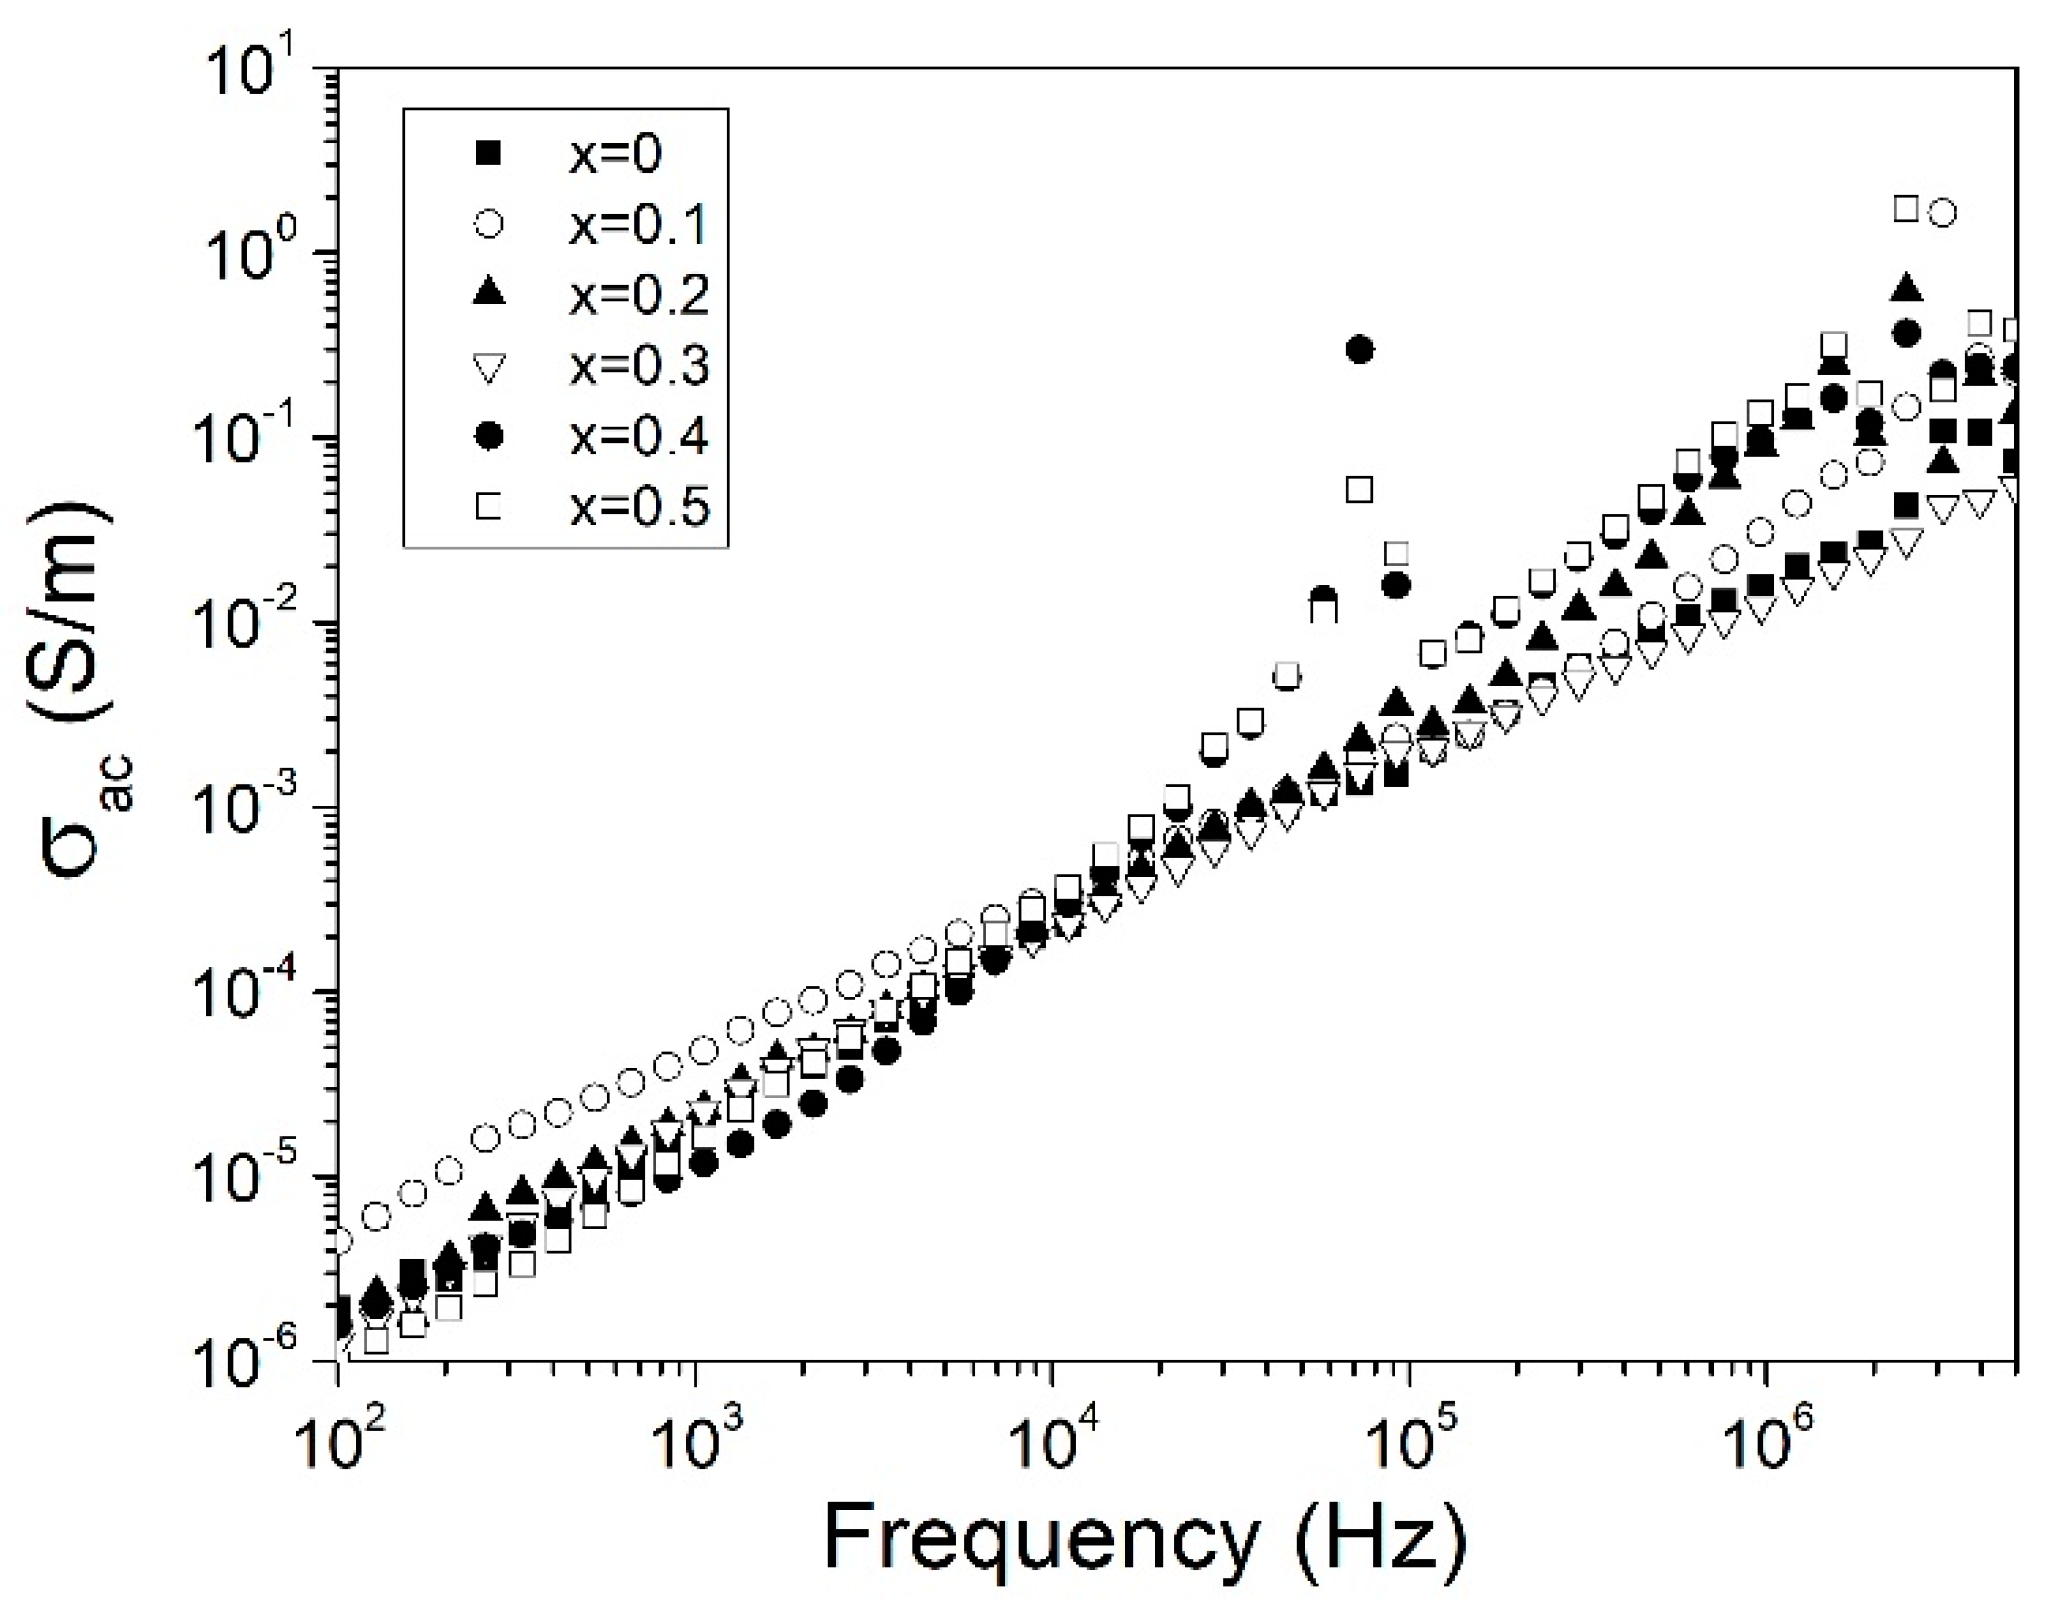
3.4. Conductivity and Leakage Current

In order to determine the effect of alternating current conductivity (σac) in dielectric properties at room temperature of selected samples, σac was calculated employing the relation shown in Equation (7):
σ a c = Z Z 2 + Z 2 d A
where Z’ and Z″ correspond to the real and imaginary part of complex impedance, A is the cross-sectional area and d is the thickness of the sample. Frequency dependence of σac is presented in Figure 7. For all doping concentrations, the σac increased as the frequency was augmented. The increased conductivity can be attributed to the transition from electronic to ionic conduction [39]. Similar behavior has been reported for other ferrites, where grain boundaries acted like insulators between grains reducing electron mobility [43,44]. The increased frequency reduced the effect of grain boundaries, which increased the conductivity. Also, the conductivity increased when the bismuth doping concentration increased. This behavior can be attributed to an increase in oxygen vacancies, besides the grain size. Oxygen vacancies can be produced in many ways as sintering at high temperatures or, destabilization in the structure. Changes in the crystal structure, especially referred to the Fe-O bond, produced oxygen vacancies which caused an increase in Fe2+ and in consequence, an increase in hopping charge carriers and conductivity [45]. Additionally to oxygen vacancies, increased grains size propitiated a reduction of grain boundaries in the doped samples, and then reduced physical barriers that inhibited electron mobility, which increased the conductivity. Finally, as can be seen in Figure 7, the alternating current conductivity (σac), for all evaluated samples, were in the range of the semiconductor materials from ~1 × 10⁻⁶ to ~4 × 10⁻¹ S/cm, for 102 and 5 × 10⁶ Hz, respectively.
Leakage current dependence as a function of applied voltage of positive bias was measured for the selected samples. Figure 8 presents the leakage current density (J) versus electric field (E) for Bi3+ doped samples at different concentrations, 0 ≤ x ≤ 0.5. For all the samples, the behavior of current density showed a very sharp slope at low field values followed by a less steep slope, which was not able to reach saturation due to the limitation of the applied field from the LCR meter. The leakage current in ceramics samples has been affected by factors as microstructure, vacancy oxygen, and grain size and their boundaries as they provided conduction pathways [46,47]. Lubomirsky found that contact produced by the contact between grains of very different sizes lead to exchanging between them, known as heterosize charging [48]. Reddy et al. reported that leakage current was affected by non-uniform grain structures and porous structures, which were the product of heterosize charging [49]. Bismuth doping reduced the leakage current, in comparison with the un-doped sample, which showed the lowest value for x = 0.1. The leakage current reduction can be correlated to increased crystallinity and reduced porosity as has been observed previously in XRD and SEM respectively. As can be observed from the SEM micrographs, Bi3+ reduced porosity and increased grain size providing a more homogeneous structure which reduced the leakage current by a reduction in heterosize charging. Hasan et al. and Das et al. have reported that the substitution of a smaller cation for a larger one produced a reduction in movable charge density and reduced the leakage current [7,34]. Similar behavior may have occurred when the Y3+ cation was substituted for a larger Bi3+ cation, which reduced movable charges in comparison with the un-doped sample. In addition, the increased leakage current density when bismuth contained > 0.3 may be attributed to the coexistence of multiple phases which produced an increment of heterosize charging due to the coexistence of different grains morphologies and grain boundaries.

4. Conclusions

Ceramic samples Y1−xBixFeO3 at doping concentrations 0 ≤ x ≤ 0.5, were synthesized by means of high-energy ball milling followed by pressing and sintered at 700 °C. Their magnetic and dielectric properties were evaluated. The Bi3+ doping concentrations, below x = 0.3, affected the lattice parameters but did not produce crystal structure transitions, keeping the orthorhombic structure of yttrium orthoferrite. An increase in the octahedral angle tilt was observed when the addition of Bi3+ was increased, providing a path for change for both magnetic and dielectric behavior. A weak magnetic moment was found for sample with x = 0.3 which was attributed to both the crystal distortion and the Dzyaloshinskii-Moriya interaction. For doping concentrations of Bi3+ higher than x = 0.3, crystal structure transformations were produced from yttrium orthoferrite to Y3Fe5O12 and Bi25FeO40. The samples mainly composed with YIG possessed a significant ferromagnetic order, but with saturation magnetization, the amount lowered due to the paramagnetic contribution of sillenite as a secondary phase. The dielectric behavior presented great similitude with the giant dielectric constant material. However, the magnitude order was lower than these materials. In order to understand this phenomenon, it is necessary to undertake an investigation in relation to temperature and dielectric behavior. The Bi3+ and sintering process promoted the formation of oxygen vacancies and increased conductivity. The Bi3+ reduced the leakage current of yttrium orthoferrite due to an increase in grain, crystallite size and a reduction in porosity.

Author Contributions

O.R.-G., F.S.-D.J. and A.M.B.-M. contributed equally to this article. In this work, O.R.-G., F.S.-D.J. and A.M.B.-M. designed the experiments, produced the materials, performed the SEM, LCR and VSM characterizations and wrote the manuscript. C.A.C.-E., F.P.-G. and M.R.-C. performed the evaluation of XRD patterns. The manuscript was corrected and improved by all authors.

Funding

This research received no external funding.

Acknowledgments

The authors thank the Center of Nanosciences and Micro and Nanotechnology, as well as CIITEC of the National Polytechnic Institute; in particular, we thank Hugo Martinez Gutiérrez for the morphological characterization and Mariana Alvarez Torres for the XRD characterization.

Conflicts of Interest

The authors declare no conflicts of interest.

References

  1. Spaldin, N.A. Multiferroics: Past, present, and future. MRS Bull. 2017, 42, 385–390. [Google Scholar] [CrossRef] [Green Version]
  2. Chen, F.; Zhang, Z.; Wang, X.; Ouyang, J.; Feng, Z.; Su, Z.; Chen, Y.; Harris, V.G. Room temperature magnetoelectric effect of YFeO3 –Y3Fe5O12 ferrite composites. J. Alloy. Compd. 2016, 656, 465–469. [Google Scholar] [CrossRef]
  3. Deka, B.; Ravi, S.; Perumal, A.; Pamu, D. Effect of Mn doping on magnetic and dielectric properties of YFeO3. Ceram. Int. 2017, 43, 1323–1334. [Google Scholar] [CrossRef]
  4. Stoeffler, D.; Chaker, Z. First principles study of the electronic structure and magnetic properties of YFeO3 oxide. J. Magn. Magn. Mater. 2017, 442, 255–264. [Google Scholar] [CrossRef]
  5. Zhang, M.; Yasui, S.; Katayama, T.; Rao, B.N.; Wen, H.; Pan, X.; Tang, M.; Ai, F.; Itoh, M. Epitaxial Growth of Orthorhombic GaFeO3 Thin Films on SrTiO3 (111) Substrates by Simple Sol-Gel Method. Materials 2019, 12, 254. [Google Scholar] [CrossRef] [PubMed]
  6. Pedro-García, F.; Sánchez-De Jesús, F.; Cortés-Escobedo, C.; Barba-Pingarrón, A.; Bolarín-Miró, A. Mechanically assisted synthesis of multiferroic BiFeO3: Effect of synthesis parameters. J. Alloy. Compd. 2017, 711, 77–84. [Google Scholar] [CrossRef]
  7. Hasan, M.; Hakim, M.A.; Basith, M.A.; Hossain, M.S.; Ahmmad, B.; Zubair, M.A.; Hussain, A.; Islam, M.F. Size dependent magnetic and electrical properties of Ba-doped nanocrystalline BiFeO3. AIP Adv. 2016, 6, 35314. [Google Scholar] [CrossRef]
  8. Kao, M.C.; Chen, H.Z.; Young, S.L.; Chen, K.H.; Chiang, J.L.; Shi, J. Bin Structural, electrical, magnetic and resistive switching properties of the Multiferroic/Ferroelectric bilayer thin films. Materials 2017, 10, 1327. [Google Scholar] [CrossRef]
  9. Pedro-García, F.; Bolarín-Miró, A.M.; Sánchez-De Jesús, F.; Cortés-Escobedo, C.A.; Valdez-Nava, Z.; Torres-Villaseñor, G. Stabilization of α-BiFeO3 structure by Sr2+ and its effect on multiferroic properties. Ceram. Int. 2018, 44, 8087–8093. [Google Scholar] [CrossRef]
  10. Wang, M.; Wang, T.; Song, S.-H.; Ravi, M.; Liu, R.-C.; Ji, S.-S. Effect of calcination temperature on structural, magnetic and optical properties of multiferroic YFeO3 nanopowders synthesized by a low temperature solid-state reaction. Ceram. Int. 2017, 43, 10270–10276. [Google Scholar] [CrossRef]
  11. Madolappa, S.; Ponraj, B.; Bhimireddi, R.; Varma, K.B.R. Enhanced magnetic and dielectric properties of Ti-doped YFeO3 ceramics. J. Am. Ceram. Soc. 2017, 100, 2641–2650. [Google Scholar] [CrossRef]
  12. Wang, M.; Wang, T.; Song, S.; Tan, M. Structure-Controllable Synthesis of Multiferroic YFeO3 Nanopowders and Their Optical and Magnetic Properties. Materials 2017, 10, 626. [Google Scholar] [CrossRef] [PubMed]
  13. Song, H.; Jiang, G. Effects of Nd, Er Doping on the Structure and Magnetic Properties of YFeO3. J. Supercond. Nov. Magn. 2017, 31, 2511–2517. [Google Scholar] [CrossRef]
  14. Tan, Q.; Wang, Q.; Liu, Y. Magnetic Properties and Spontaneous Polarization of La-, Mn- and N-Doped Tetragonal BiFeO3: A First-Principles Study. Materials 2018, 11, 985. [Google Scholar] [CrossRef] [PubMed]
  15. Shang, M.; Zhang, C.; Zhang, T.; Yuan, L.; Ge, L. The multiferroic perovskite YFeO3. Appl. Phys. Lett. 2013, 102, 062903. [Google Scholar] [CrossRef]
  16. Chowdhury, U.; Goswami, S.; Bhattacharya, D.; Ghosh, J.; Basu, S.; Neogi, S. Room temperature multiferroicity in orthorhombic LuFeO3. Appl. Phys. Lett. 2014, 105, 052911. [Google Scholar] [CrossRef]
  17. Zhang, C.; Wang, X.; Wang, Z.; Yan, H.; Li, H.; Li, L. Dielectric relaxation, electric modulus and ac conductivity of Mn-doped YFeO3. Ceram. Int. 2016, 42, 19461–19465. [Google Scholar] [CrossRef]
  18. Das, I.; Chanda, S.; Dutta, A.; Banerjee, S.; Sinha, T. Dielectric relaxation of Y1−xRxFeO3 (R=Dy, Er, x=0, 0.5). J. Alloy. Compd. 2013, 571, 56–62. [Google Scholar] [CrossRef]
  19. Jacob, K.T.; Rajitha, G.; Dasgupta, N. Electrical conductivity of Ca-doped YFeO3. Indian J. Eng. Mater. Sci. 2012, 19, 47–53. [Google Scholar]
  20. Yuan, X.; Sun, Y.; Xu, M. Effect of Gd substitution on the structure and magnetic properties of YFeO3 ceramics. J. Solid State Chem. 2012, 196, 362–366. [Google Scholar] [CrossRef]
  21. Bolarín-Miró, A.; Sánchez-De Jesús, F.; Cortés-Escobedo, C.; Valenzuela, R.; Ammar, S. Structure and magnetic properties of GdxY1−xFeO3 obtained by mechanosynthesis. J. Alloy. Compd. 2014, 586, S90–S94. [Google Scholar] [CrossRef]
  22. Cheng, M.; Jiang, G.; Yang, W.; Duan, L.; Peng, W.; Chen, J.; Wang, X. Study of Y1-xErxFeO3 (0<x<1) powder synthesized by sol–gel method and their magnetic properties. J. Magn. Magn. Mater. 2016, 417, 87–91. [Google Scholar]
  23. Lutterotti, L.; Matthies, S.; Wenk, H.-R.; Schultz, A.S.; Richardson, J.W. Combined texture and structure analysis of deformed limestone from time-of-flight neutron diffraction spectra. J. Appl. Phys. 1997, 81, 594–600. [Google Scholar] [CrossRef]
  24. Van Hook, H.J. Phase Relations in the System Fe2O3-Fe3O4-YFeO3 in Air. J. Am. Ceram. Soc. 1961, 44, 208–214. [Google Scholar] [CrossRef]
  25. Van Hook, H.J. Phase Relations in the Ternary System Fe2O3-FeO-YFeO3. J. Am. Ceram. Soc. 1962, 45, 162–165. [Google Scholar] [CrossRef]
  26. Shannon, R.D. Revised effective ionic radii and systematic studies of interatomic distances in halides and chalcogenides. Acta Crystallogr. Sect. A Cryst. Phys. Diffr. Theor. Gen. Crystallogr. 1976, 32, 751–767. [Google Scholar] [CrossRef]
  27. Moure, C.; Pena, O. Recent advances in perovskites: Processing and properties. Prog. Solid State Chem. 2015, 43, 123–148. [Google Scholar] [CrossRef]
  28. Nagashio, K.; Kuribayashi, K. Metastable Phase Formation from an Undercooled Rare-Earth Orthoferrite Melt. J. Am. Ceram. Soc. 2002, 85, 2550–2556. [Google Scholar] [CrossRef]
  29. O’Keeffe, M.; Hyde, B.G. Some structures topologically related to cubic perovskite (E21), ReO3 (D09) and Cu3Au (L12). Acta Crystallogr. Sect. B Struct. Crystallogr. Cryst. Chem. 1977, 33, 3802–3813. [Google Scholar] [CrossRef]
  30. Momma, K.; Izumi, F. VESTA 3 for three-dimensional visualization of crystal, volumetric and morphology data. J. Appl. Crystallogr. 2011, 44, 1272–1276. [Google Scholar] [CrossRef]
  31. Rosales-González, O.; Jesús, F.S.-D.; Cortés-Escobedo, C.; Bolarín-Miró, A. Crystal structure and multiferroic behavior of perovskite YFeO3. Ceram. Int. 2018, 44, 15298–15303. [Google Scholar] [CrossRef]
  32. Baños-López, E.; Cortés-Escobedo, C.; Jesús, F.S.-D.; Barba-Pingarrón, A.; Bolarín-Miró, A. Crystal structure and magnetic properties of cerium-doped YIG: Effect of doping concentration and annealing temperature. J. Alloy. Compd. 2018, 730, 127–134. [Google Scholar] [CrossRef]
  33. Anupama, A.; Kumar, R.; Choudhary, H.K.; Sahoo, B. Synthesis of coral-shaped yttrium-aluminium-iron garnets by solution-combustion method. Ceram. Int. 2018, 44, 3024–3031. [Google Scholar] [CrossRef]
  34. Das, R.; Mandal, K. Magnetic, ferroelectric and magnetoelectric properties of Ba-doped BiFeO3. J. Magn. Magn. Mater. 2012, 324, 1913–1918. [Google Scholar] [CrossRef]
  35. Treves, D.; Eibschütz, M.; Coppens, P. Dependence of superexchange interaction on Fe3+-O2−-Fe3+ linkage angle. Phys. Lett. 1965, 18, 216–217. [Google Scholar] [CrossRef]
  36. Mallmann, E.J.J.; Sombra, A.S.B.; Goes, J.C.; Fechine, P.B.A. Yttrium Iron Garnet: Properties and Applications Review. Solid State Phenom. 2013, 202, 65–96. [Google Scholar] [CrossRef]
  37. Baños, E.; Sánchez-De Jesús, F.; Cortés, C.A.; Bolarin-Miró, A.M. Enhancement in Curie Temperature of Yttrium Iron Garnet by Doping with Neodymium. Materials 2018, 11, 1652. [Google Scholar] [Green Version]
  38. Elissalde, C.; Ravez, J. Ferroelectric ceramics: defects and dielectric relaxations. J. Mater. Chem. 2001, 11, 1957–1967. [Google Scholar] [CrossRef]
  39. Betancourt-Cantera, L.; Bolarín-Miró, A.M.; Cortés-Escobedo, C.; Hernández-Cruz, L.; Sánchez-De Jesús, F. Structural transitions and multiferroic properties of high Ni-doped BiFeO3. J. Magn. Magn. Mater. 2018, 456, 381–389. [Google Scholar] [CrossRef]
  40. Jabbarzare, S.; Abdellahi, M.; Ghayour, H.; Chami, A.; Hejazian, S. Mechanochemically assisted synthesis of yttrium ferrite ceramic and its visible light photocatalytic and magnetic properties. J. Alloy. Compd. 2016, 688, 1125–1130. [Google Scholar] [CrossRef]
  41. Hunpratub, S.; Thongbai, P.; Yamwong, T.; Yimnirun, R.; Maensiri, S. Dielectric relaxations and dielectric response in multiferroic BiFeO3 ceramics. Appl. Phys. Lett. 2009, 94, 062904. [Google Scholar] [CrossRef]
  42. Raut, S.; Babu, P.D.; Sharma, R.K.; Pattanayak, R.; Panigrahi, S. Grain boundary-dominated electrical conduction and anomalous optical-phonon behaviour near the Neel temperature in YFeO3 ceramics. J. Appl. Phys. 2018, 123, 174101. [Google Scholar] [CrossRef]
  43. Ahmad, T.; Lone, I.H.; Ansari, S.; Ahmed, J.; Ahamad, T.; AlShehri, S.M. Multifunctional properties and applications of yttrium ferrite nanoparticles prepared by citrate precursor route. Mater. Des. 2017, 126, 331–338. [Google Scholar] [CrossRef]
  44. Zahi, S.; Daud, A.; Hashim, M. A comparative study of nickel–zinc ferrites by sol–gel route and solid-state reaction. Mater. Chem. Phys. 2007, 106, 452–456. [Google Scholar] [CrossRef]
  45. Aakansha; Deka, B.; Ravi, S.; Pamu, D. Impedance spectroscopy and ac conductivity mechanism in Sm doped Yttrium Iron Garnet. Ceram. Int. 2017, 43, 10468–10477. [Google Scholar] [CrossRef]
  46. Hussain, S.; Hasanain, S.; Jaffari, G.H.; Shah, S.I. Thickness dependent magnetic and ferroelectric properties of LaNiO3 buffered BiFeO3 thin films. Curr. Appl. Phys. 2015, 15, 194–200. [Google Scholar] [CrossRef]
  47. Reddy, V.R.; Kothari, D.; Upadhyay, S.K.; Gupta, A.; Chauhan, N.; Awasthi, A. Reduced leakage current of multiferroic BiFeO3 ceramics with microwave synthesis. Ceram. Int. 2014, 40, 4247–4250. [Google Scholar] [CrossRef]
  48. Lubomirsky, I.; Fleig, J.; Maier, J. Modeling of space-charge effects in nanocrystalline ceramics: The influence of geometry. J. Appl. Phys. 2007, 92, 6819. [Google Scholar] [CrossRef]
  49. Reddy, S.S.K.; Raju, N.; Reddy, C.G.; Reddy, P.Y.; Reddy, K.R.; Gupta, S.; Reddy, V.R. Study of Mn doped multiferroic DyFeO3 ceramics. Ceram. Int. 2017, 43, 6148–6155. [Google Scholar] [CrossRef]
Figure 1. XRD patterns of samples of mixtures of Y2O3, Fe2O3 and Bi2O3 milled for 5 h and sintered at 700 °C for obtaining Y1−xBixFeO3 (0 ≤ x ≤ 0.5, Δx = 0.1).
Materials 12 02054 g001
Figure 2. Scanning electron micrographs of samples: (a) x = 0, (b) x = 0.3 and (c) x = 0.5 annealed at 700 °C.
Materials 12 02054 g002
Figure 3. Magnetic hysteresis loops at room temperature of Y1−xBixFeO3 (0 ≤ x ≤ 0.5 ∆x = 0.1) sintered at 700 °C samples. The inset shows a magnification of hysteresis for 0 ≤ x ≤ 0.3 samples.
Materials 12 02054 g003
Figure 4. (a) Temperature dependence of magnetic susceptibility and, (b) magnetization of Y1−xBixFeO3 (0 ≤ x ≤ 0.5, Δx = 0.1) pressed and sinteredat 700 °C.
Materials 12 02054 g004
Figure 5. The real part of the complex relative permittivity (εr’) at room temperature as a function of frequency of Bi3+ doped YFeO3 for 0 ≤ x ≤ 0.5, ∆x = 0.1, of pressed and sintered samples at 700 °C.
Materials 12 02054 g005
Figure 6. The imaginary part of the complex relative permittivity (ε’’) at room temperature as function of frequency of Y1−xBixFeO3 in the range of (a) 0 ≤ x ≤ 0.3 and (b) 0.4 ≤ x ≤ 0.5, of pressed and sintered samples at 700 °C.
Materials 12 02054 g006
Figure 7. Alternating current conductivity (σAC) at room temperature of Y1−xBixFeO3 varying x from 0 to 0.5, of pellets sintered at 700 °C.
Materials 12 02054 g007
Figure 8. The leakage current density as function of electric field at room temperature of Y1−xBixFeO3 with 0 ≤ x ≤ 0.5 samples sintered at 700 °C.
Materials 12 02054 g008
Table 1. Rietveld analysis of the XRD patterns to Y1−xBixFeO3 pellets of all compositions.
Level Doped (x)Phase Space Group% PhaseLattice Parameters (Å)Crystallite Size (Å)µε (×10−4)χ2Rwp
abc
0YFeO3
Pnma
100 ± 0.72305.2683 ± 0.00055.5510 ± 0.00047.5764 ± 0.0005911.11 ± 56.5841.41 ± 0.0001 1.0312.04
0.1YFeO3
Pnma
100 ± 0.66925.2714 ± 0.00045.5664 ± 0.00047.5845 ± 0.0005929.39 ± 31.4616.24 ± 0.00061.1617.49
0.2YFeO3
Pnma
100 ± 0.52425.2974 ± 0.00025.5854 ± 0.00027.6224 ± 0.00031270.91 ± 31.2511.77 ± 0.00011.2016.34
0.3YFeO3
Pnma
100 ± 0.96145.3117 ± 0.00025.5879 ± 0.00037.6411 ± 0.00041492.36 ± 55.6110.27 ± 0.00041.2316.81
0.4YFeO3
Pnma
15.97 ± 0.34325.3139 ± 0.00105.5944 ± 0.00107.6461 ± 0.0009952.63 ± 22.877.23 ± 0.00021.2424.59
Y3Fe5O12
I-a3d
73.67 ± 0.215612.3835 ± 0.0003--1819.16 ± 126.788.68 ± 0.0008
Bi25FeO40
I-23
10.36 ± 0.522110.0856 ± 0.0014--999.91 ± 257.0429.35 ± 0.0003
0.5Y3Fe5O12
I-a3d
86.68 ± 0.326412.3931 ± 0.0003--2768.51 ± 293.7113.64 ± 0.00041.2725.25
Bi25FeO40
I-23
13.32 ± 0.567810.1573 ± 0.0003--1625.94 ± 107.134.59 ± 0.0001
Table 2. Atomic positions (x, y and z), Fe-O-Fe bond angles (θ1 and θ2), tilt angles (φ1 and φ2) and tolerance factor of YFeO3 phase of samples sintered at 700 °C.
Bismuth Content (x)Elem.Occ.Atomic PositionsBond Angle (Degree)Tilt Angle (Degree)
xyzθ1θ2φ1φ2t (adim)
0Y10.06399 ± 0.00040.2500 ± 0.0000−0.0174 ± 0.0007155.16 ± 0.10142.12 ± 0.8015.09523.4240.834
Fe10.00000.00000.5000
O110.4861 ± 0.00260.2500 ± 0.00000.0779 ± 0.0028
O21−0.2975 ± 0.0022−0.0701 ± 0.00170.2986 ± 0.0027
0.1Y0.90.0625 ± 0.00050.2500 ± 0.0000−0.0118 ± 0.0010152.51 ± 0.10139.29 ± 0.8016.66725.2150.839
Bi0.10.0625 ± 0.00050.2500 ± 0.0000−0.0118 ± 0.0010
Fe10.00000.00000.5000
O110.4792 ± 0.00350.2500 ± 0.00000.0852 ± 0.0036
O21−0.2967 ± 0.0029−0.0815 ± 0.00180.2951 ± 0.0029
0.2Y0.80.0587 ± 0.00040.2500 ± 0.0000−0.0102 ± 0.0007149.71 ± 0.10138.54 ± 0.8018.34025.6910.843
Bi0.20.0587 ± 0.00040.2500 ± 0.0000−0.0102 ± 0.0007
Fe10.00000.00000.5000
O110.4735 ± 0.00240.2500 ± 0.00000.09329 ± 0.0024
O21−0.2983 ± 0.0023−0.0813 ± 0.00140.2973 ± 0.0023
0.3Y0.70.0538 ± 0.00040.2500 ± 0.0000−0.0062 ± 0.0007149.13 ± 0.10136.63 ± 0.8018.68326.9070.848
Bi0.30.0538 ± 0.00040.2500 ± 0.0000−0.0062 ± 0.0007
Fe10.0000 ± 0.00000.0000 ± 0.00000.5000 ± 0.0000
O110.4743 ± 0.00250.2500 ± 0.00000.0955 ± 0.0023
O21−0.2935 ± 0.0024−0.0914 ± 0.00130.2881 ± 0.0024
Table 3. Specific magnetization (Ms), mass magnetic susceptibility (χm), remanent magnetization (Mr) and coercive field (Hc) for Bi doped YFeO3.
Bi3+ Doping Concentration (x)Ms at 18 kOe (emu/g)Mr (emu/g)Hc (Oe)χm (×10−7 m3/kg)
00.340.02-710-2.34
0.10.21--1.66
0.20.22--1.54
0.30.380.06495-
0.44.421.18251-
0.514.723.24202-

