Proposal of Characterization Procedure of Metal–Graphite Interface Strength in Compacted Graphite Iron

 ,
,
Abstract
:
1. Introduction
2. Materials and Methods
3. Results
4. Discussion
5. Conclusions
Author Contributions
Funding
Acknowledgments
Conflicts of Interest
Abbreviations
| CGI | compacted graphite iron |
| CG | compacted graphite |
| SI | spheroidal graphite |
| AC | as cast |
| HT | heat treated |
| TMF | thermomechanical fatigue |
| FE | finite element |
| M–G | metal–graphite |
| ε | strain |
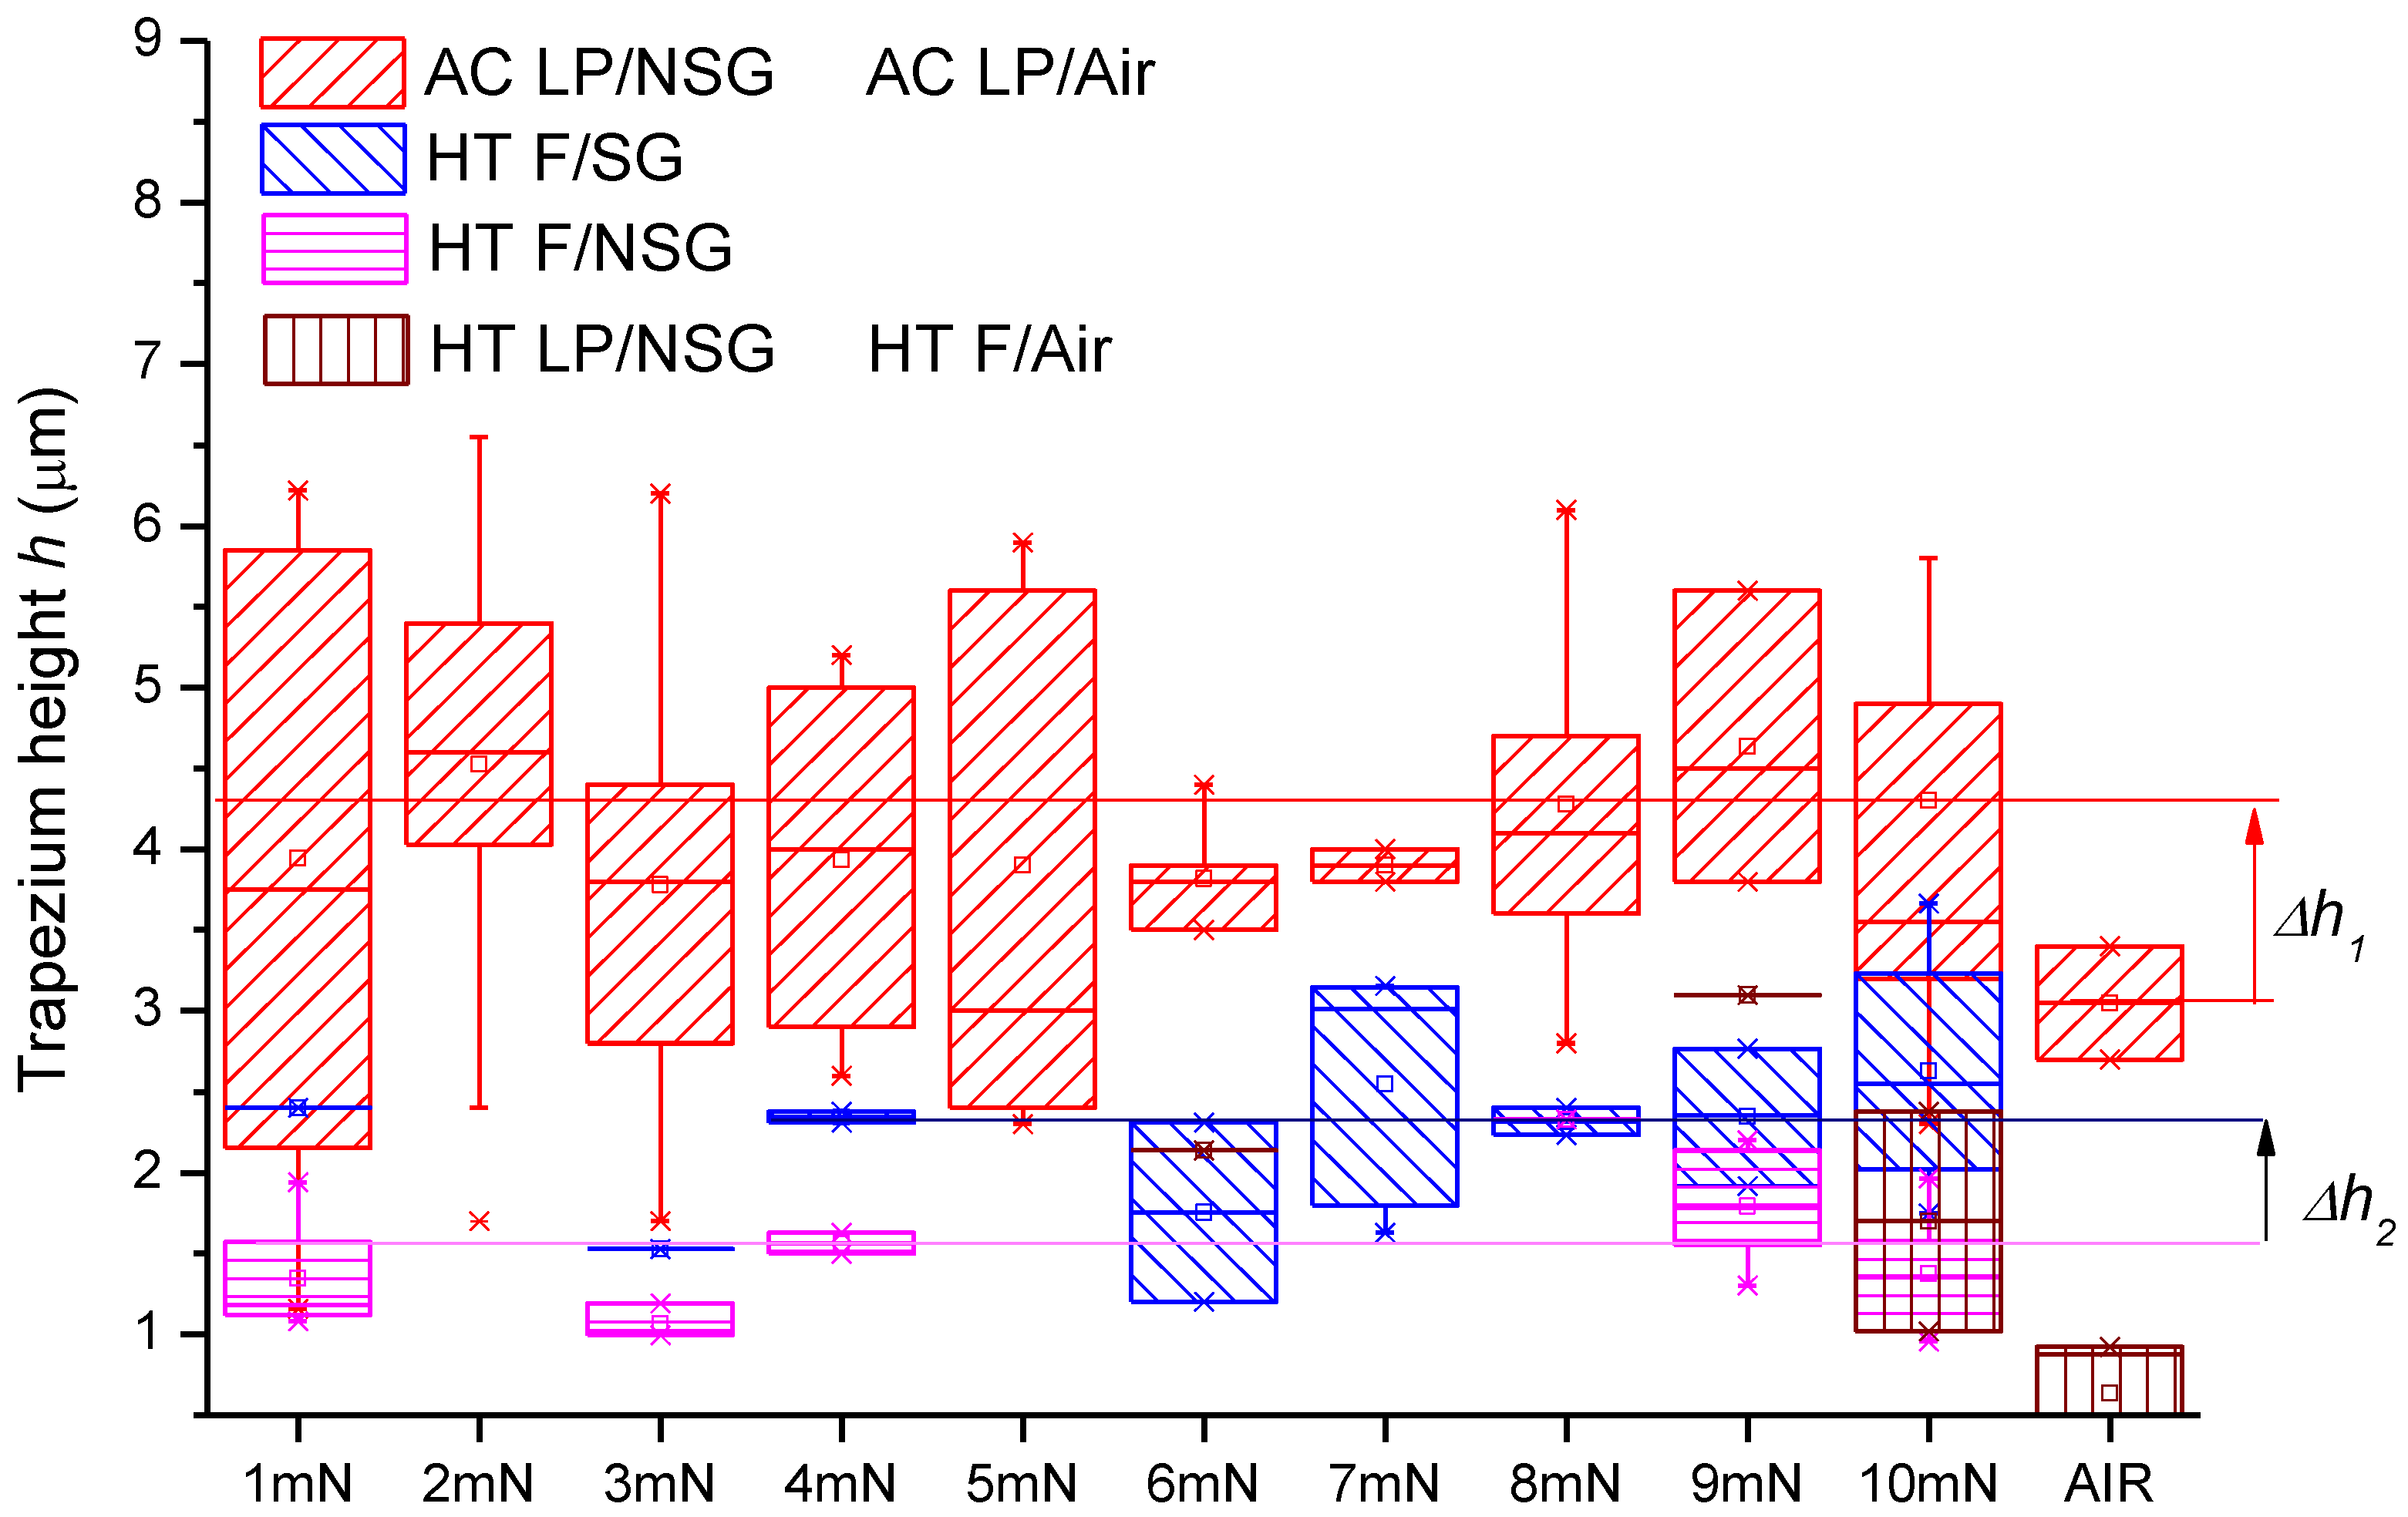
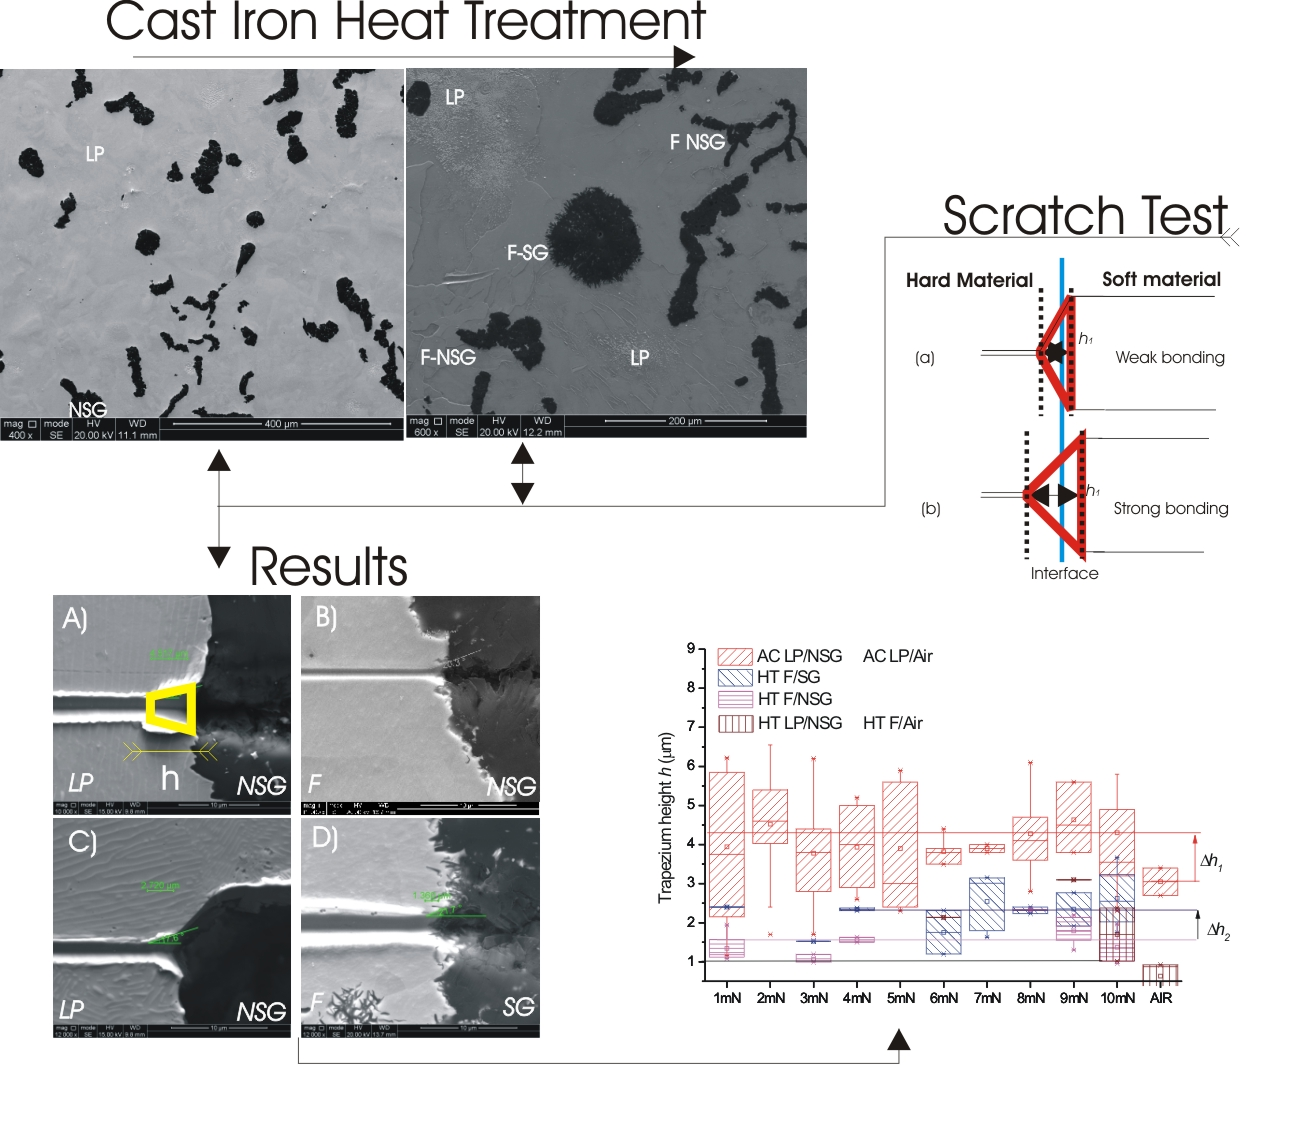
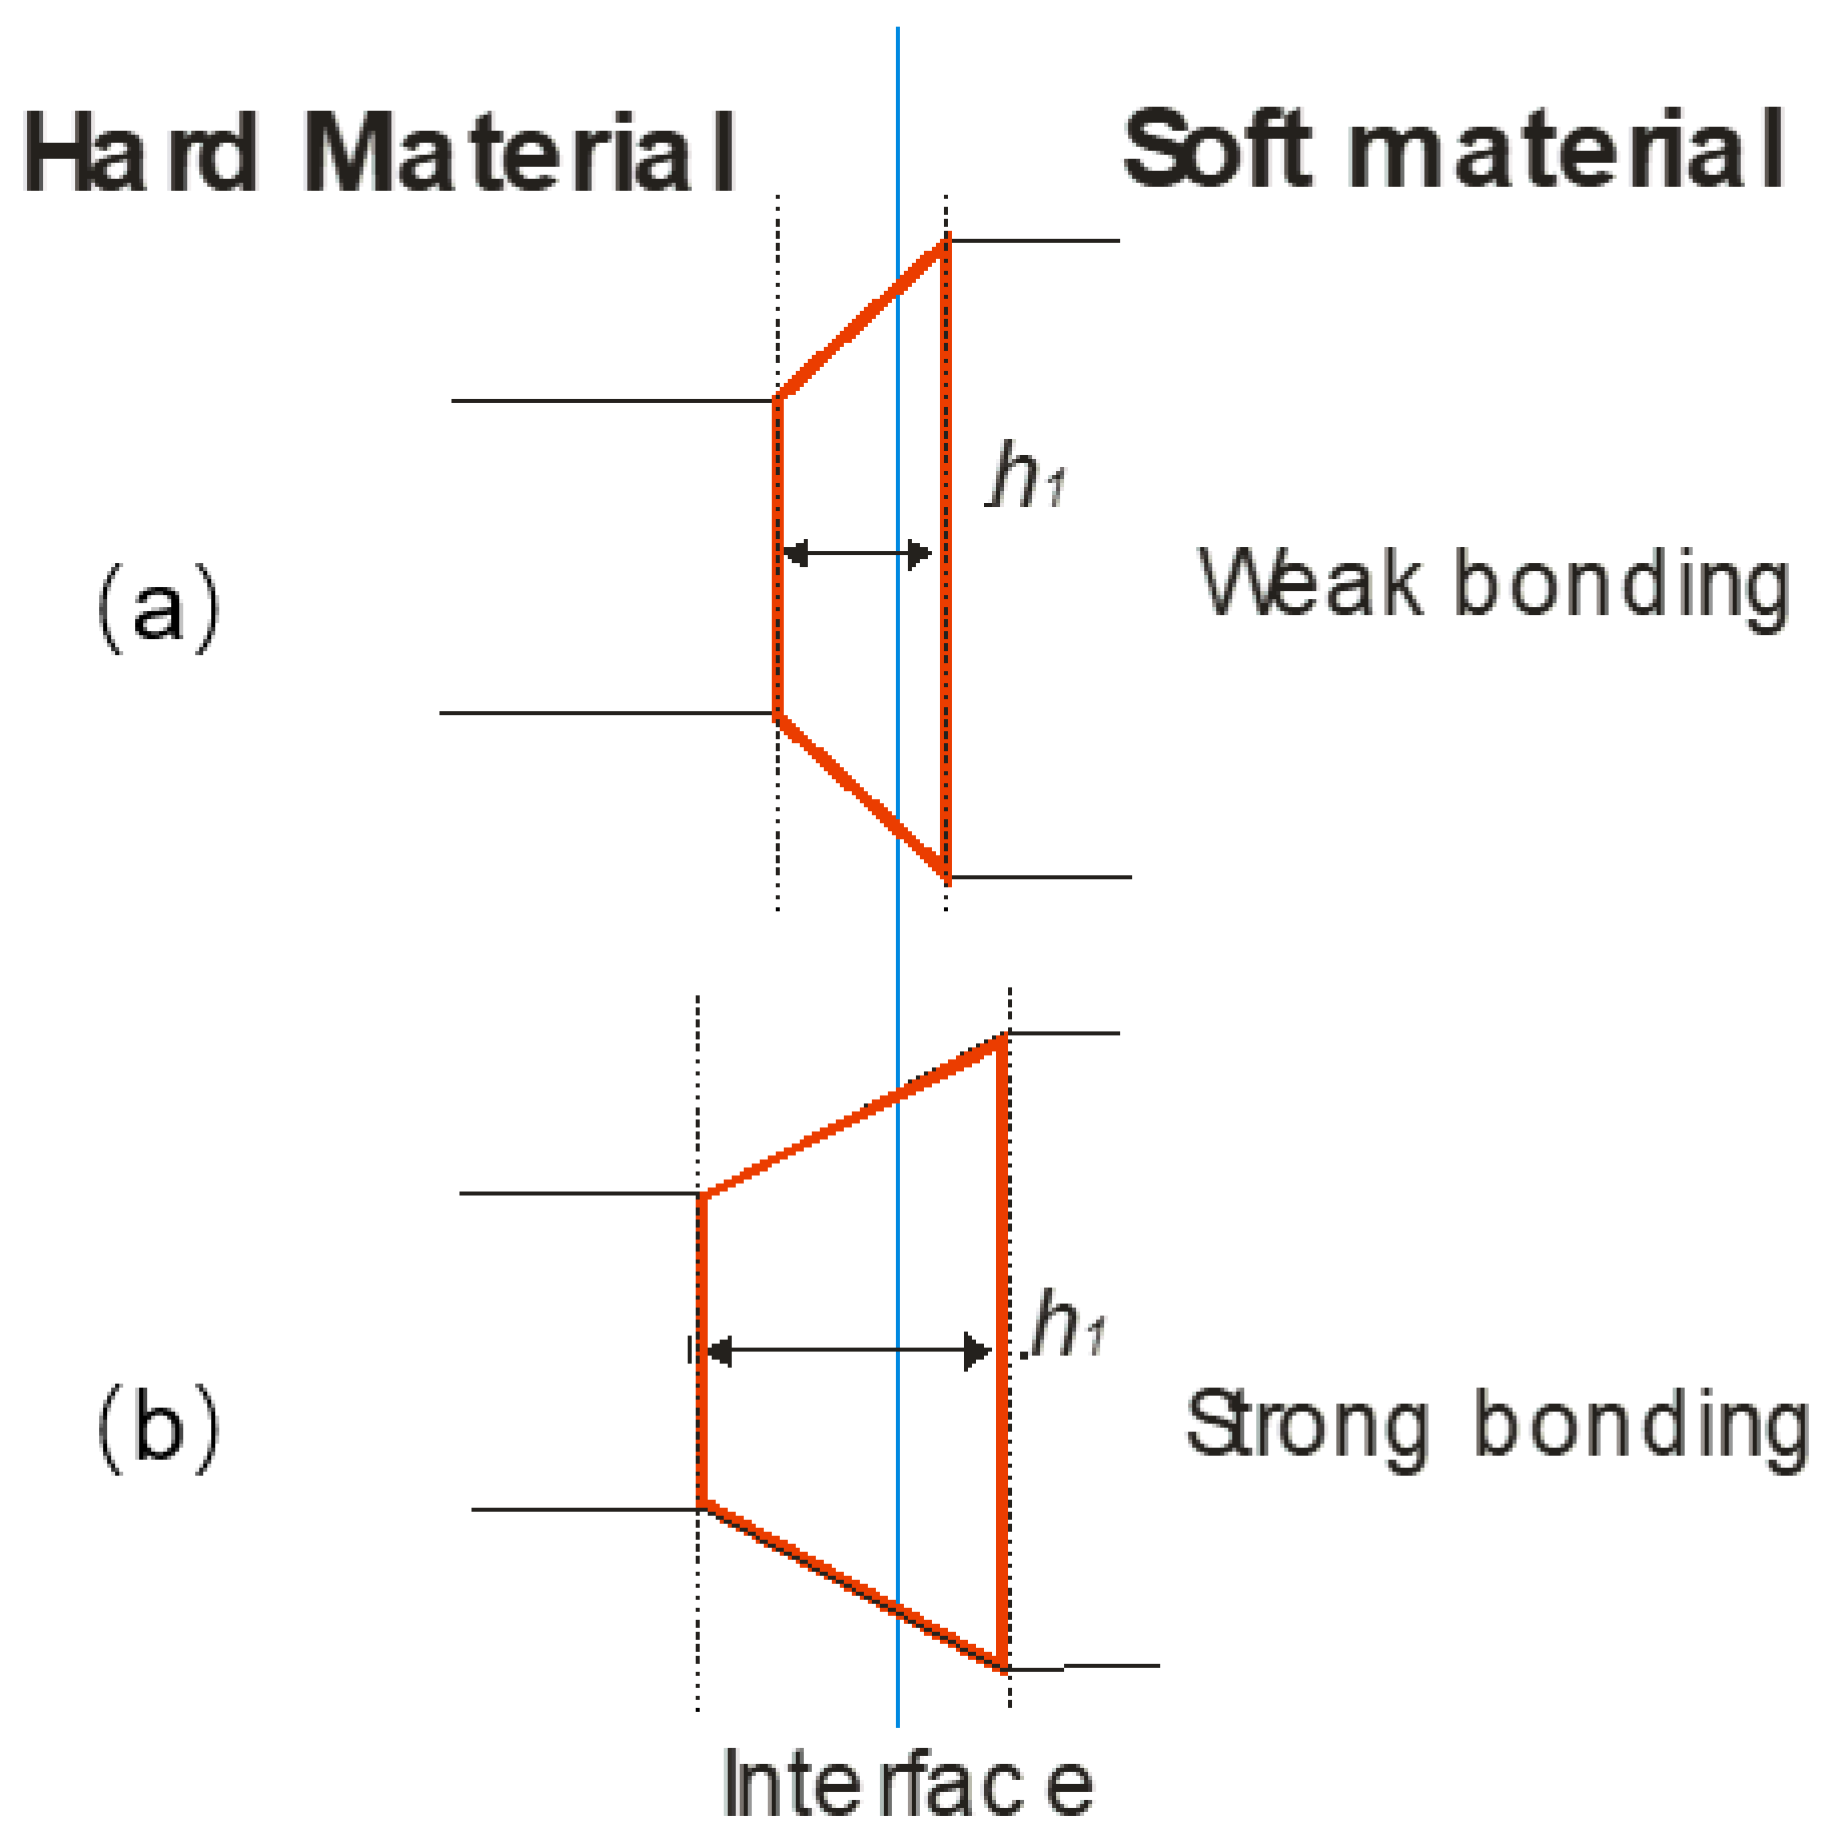
| h | trapezium height |
| ΔH | difference in materials‘ hardness |
| σc | critical stress normal to the M–G interface |
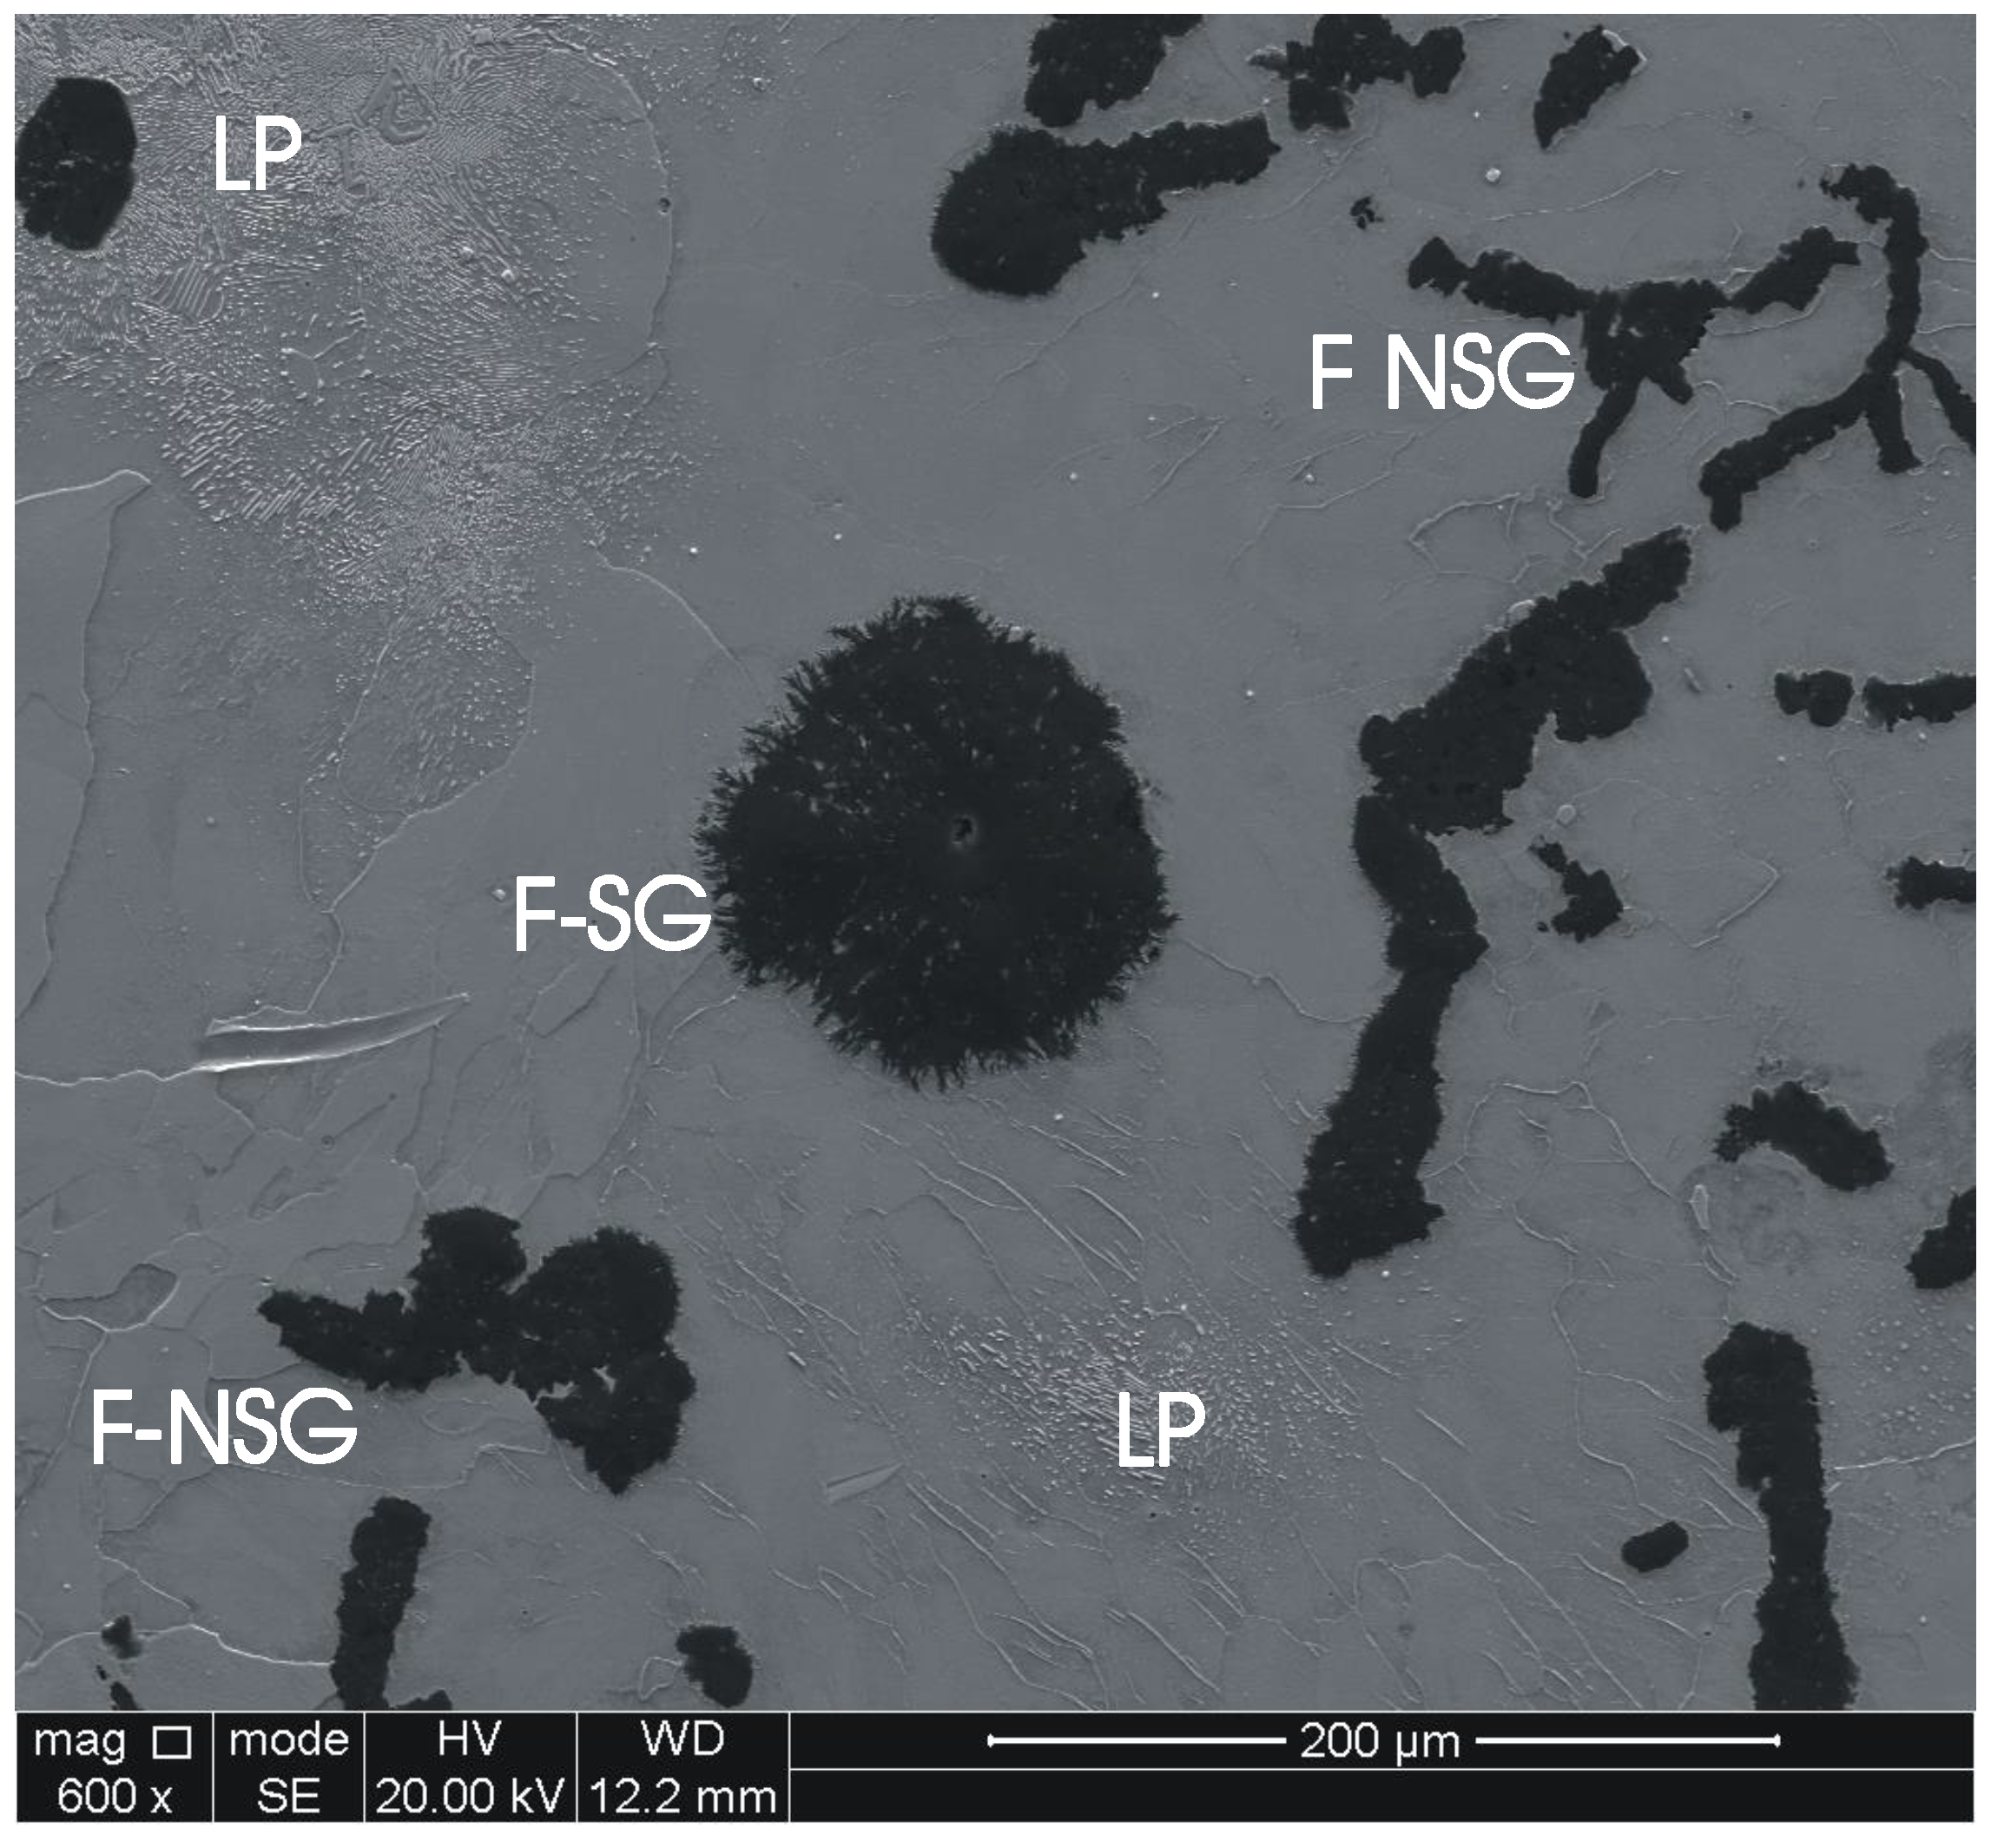
| LP | lamellar pearlite |
| SG | spiky graphite |
| NSG | non-spiky graphite |
| F | ferrite |
| STDEV | standard deviation |
References
- Ghodrat, S. Thermo-Mechanical Fatigue of Compacted Graphite Iron in Diesel Engine Components. Ph.D. Dissertation, Delft University of Technology, Delft, The Netherlands, 2013. [Google Scholar]
- Li, J.; Wang, P.; Cui, X.; Li, K.; Yi, R. Gray cast iron cylinder head thermal mechanical fatigue analysis. In Proceedings of the Fisita 2012 World Automotive Congress; Springer: Berlin, Germany, 2013; pp. 243–257. [Google Scholar]
- Metzger, M.; Nieweg, B.; Schweizer, C.; Seifert, T. Lifetime prediction of cast iron materials under combined thermomechanical fatigue and high cycle fatigue loading using a mechanism-based model. Int. J. Fatigue 2013, 53, 58–66. [Google Scholar] [CrossRef]
- Metzger, M.; Seifert, T. A mechanism-based model for LCF/HCF and TMF/HCF life prediction: Multiaxial formulation, finite-element implementation and application to cast iron. Tech. Mech. 2012, 32, 435–445. [Google Scholar]
- Gocmez, T.; Awarke, A.; Pischinger, S. A new low cycle fatigue criterion for isothermal and out-of-phase thermomechanical loading. Int. J. Fatigue 2010, 32, 769–779. [Google Scholar] [CrossRef]
- Zieher, F.; Langmayr, F.; Ennemoser, A.; Jelatancev, A.; Hager, G.; Wieser, K. Advanced thermal mechanical fatigue life simulation of cylinder heads. In Proceedings of the Abaqus User Conference, Boston, MA, USA, 25–27 May 2004; pp. 789–805. [Google Scholar]
- Mohammed, W.M.; Ng, E.; Elbestawi, M.A. Modeling the effect of compacted graphite iron microstructure on cutting forces and tool wear. CIRP J. Manuf. Sci. Technol. 2012, 5, 87–101. [Google Scholar] [CrossRef]
- Hellström, P.; Olander, K. Analysis and Modeling of Properties of Compacted Graphite Iron on a Microstructural Level. Master’s Thesis, Chalmers University of Technology, Göteborg, Sweden, 2012. [Google Scholar]
- He, Z.R.; Lin, G.X.; Ji, S. A new understanding on the relation among microstructure micro interfacial mechanical behaviours and macro mechanical properties in cast iron. Mater. Sci. Eng. A 1997, 234, 161–164. [Google Scholar] [CrossRef]
- Lundberg, M.L.M.; Calmunger, M.; Peng, R.L. In-situ sem/ebsd study of deformation and fracture behaviour of flake cast iron. In Proceedings of the 13th International Conference on Fracture, Beijing, China, 16–21 June 2013. [Google Scholar]
- Ghodrat, S.; Kestens, L.A. Microstructural dependence of tensile and fatigue properties of compacted graphite iron in diesel engine components. Steel Res. Int. 2016, 86, 8. [Google Scholar] [CrossRef]
- Nakamura, R.; Iwabuchi, A. Role of graphite in cast iron on tribological behavior in nano-scratch test. J. Adv. Mech. Des. Syst. Manuf. 2012, 6, 10. [Google Scholar] [CrossRef]
- Waudby, R.; Andersson, P.; Holmberg, K. Low-Speed sliding tests with nodular cast iron in contact with steel wire and a diamond tip. Tribol. Int. 2013, 65, 171–176. [Google Scholar] [CrossRef]
- Li, J.; Beres, W. Three-Dimensional finite element modelling of the scratch test for a tin coated titanium alloy substrate. Wear 2006, 260, 1232–1242. [Google Scholar] [CrossRef]
- Leroch, S.; Varga, M.; Eder, S.J.; Vernes, A.; Ripoll, M.R.; Ganzenmüller, G. Smooth particle hydrodynamics simulation of damage induced by a spherical indenter scratching a viscoplastic material. Int. J. Solids Struct. 2016, 81, 188–202. [Google Scholar] [CrossRef]
- Elwasli, F.; Zemzemi, F.; Mkaddem, A.; Mzali, S.; Mezlini, S. A 3d multi-scratch test model for characterizing material removal regimes in 5083-al alloy. Mater. Des. 2015, 87, 352–362. [Google Scholar]
- Vencl, A.; Arostegui, S.; Favaro, G.; Zivic, F.; Mrdak, M.; Mitrović, S.; Popovic, V. Evaluation of adhesion/cohesion bond strength of the thick plasma spray coatings by scratch testing on coatings cross-sections. Tribol. Int. 2011, 44, 1281–1288. [Google Scholar] [CrossRef]
- Bianchi, L.; Leger, A.C.; Vardelle, M.; Vardelle, A.; Fauchais, P. Splat formation and cooling of plasma-sprayed zirconia. Thin Solid Films 1997, 305, 35–47. [Google Scholar] [CrossRef]
- Lin, J.-S.; Zhou, Y. Can scratch tests give fracture toughness? Eng. Fract. Mech. 2013, 109, 161–168. [Google Scholar] [CrossRef]
- Erickson, L.C.; Westergård, R.; Wiklund, U.; Axen, N.; Hawthorne, H.M.; Hogmark, S. Cohesion in plasma-sprayed coatings—A comparison between evaluation methods. Wear 1998, 214, 30–37. [Google Scholar] [CrossRef]
- Akono, A.-T.; Ulm, F.-J. Scratch test model for the determination of fracture toughness. Eng. Fract. Mech. 2011, 78, 334–342. [Google Scholar] [CrossRef]
- Hossain, M.M.; Xiao, S.; Sue, H.-J.; Kotaki, M. Scratch behavior of multilayer polymeric coating systems. Mater. Des. 2017, 128, 143–149. [Google Scholar] [CrossRef]
- Varga, M.; Leroch, S.; Rojacz, H.; Ripoll, M.R. Study of wear mechanisms at high temperature scratch testing. Wear 2017, 388–389, 112–118. [Google Scholar] [CrossRef]
- Hu, H.; Zhao, S.; Sun, G.; Zhong, Y.; You, B. Evaluation of scratch resistance of functionalized graphene oxide/polysiloxane nanocomposite coatings. Prog. Org. Coat. 2018, 117, 118–129. [Google Scholar] [CrossRef]
- Lin, J.-S.; Zhou, Y. Rebuttal: Shallow wide groove scratch tests do not give fracture toughness. Eng. Fract. Mech. 2015, 133, 211–222. [Google Scholar] [CrossRef]
- Nohava, J.; Bonferroni, B.; Bolelli, G.; Lusvarghi, L. Interesting aspects of indentation and scratch methods for characterization of thermally-sprayed coatings. Surf. Coat. Technol. 2010, 205, 1127–1131. [Google Scholar] [CrossRef]
- Wang, Y.Y.; Li, C.J.; Ohmori, A. Influence of substrate roughness on the bonding mechanisms of high velocity oxy-fuel sprayed coatings. Thin Solid Films 2005, 485, 141–147. [Google Scholar] [CrossRef]
- Kim, W.-S.; Yun, I.-H.; Lee, J.-J.; Jung, H.-T. Evaluation of mechanical interlock effect on adhesion strength of polymer–Metal interfaces using micro-patterned surface topography. Int. J. Adhes. Adhes. 2010, 30, 408–417. [Google Scholar] [CrossRef]
- Mousa, S.; Kim, G.-Y. Experimental study on warm roll bonding of metal/polymer/metal multilayer composites. J. Mater. Process. Technol. 2015, 222, 84–90. [Google Scholar] [CrossRef]
- Ghodrat, S.; Janssen, M.; Kestens, L.A.; Sietsma, J. Volume expansion of compacted graphite iron induced by pearlite decomposition and the effect of oxidation at elevated temperature. Oxid. Met. 2013, 80, 161–176. [Google Scholar] [CrossRef]
- Smallman, R.E.; Bishop, R.J. Structural phases: Their formation and transitions. In Modern Physical Metallurgy and Materials Engineering, 6th ed.; Butterworth-Heinemann: Oxford, UK, 1999; Chapter 3; pp. 42–83. [Google Scholar]
- Monchoux, J.P.; Verdu, C.; Thollet, G.; Fougères, R.; Reynaud, A. Morphological changes of graphite spheroids during heat treatment of ductile cast irons. Acta Mater. 2001, 49, 4355–4362. [Google Scholar] [CrossRef]
- Theuwissen, K.; Lacaze, J.; Laffont, L. Structure of graphite precipitates in cast iron. Carbon 2016, 96, 1120–1128. [Google Scholar] [CrossRef] [Green Version]
- Theuwissen, K.; Lacaze, J.; Véron, M.; Laffont, L. Nano-Scale orientation mapping of graphite in cast irons. Mater. Charact. 2014, 95, 187–191. [Google Scholar] [CrossRef] [Green Version]


| Dimension | Size | |
|---|---|---|
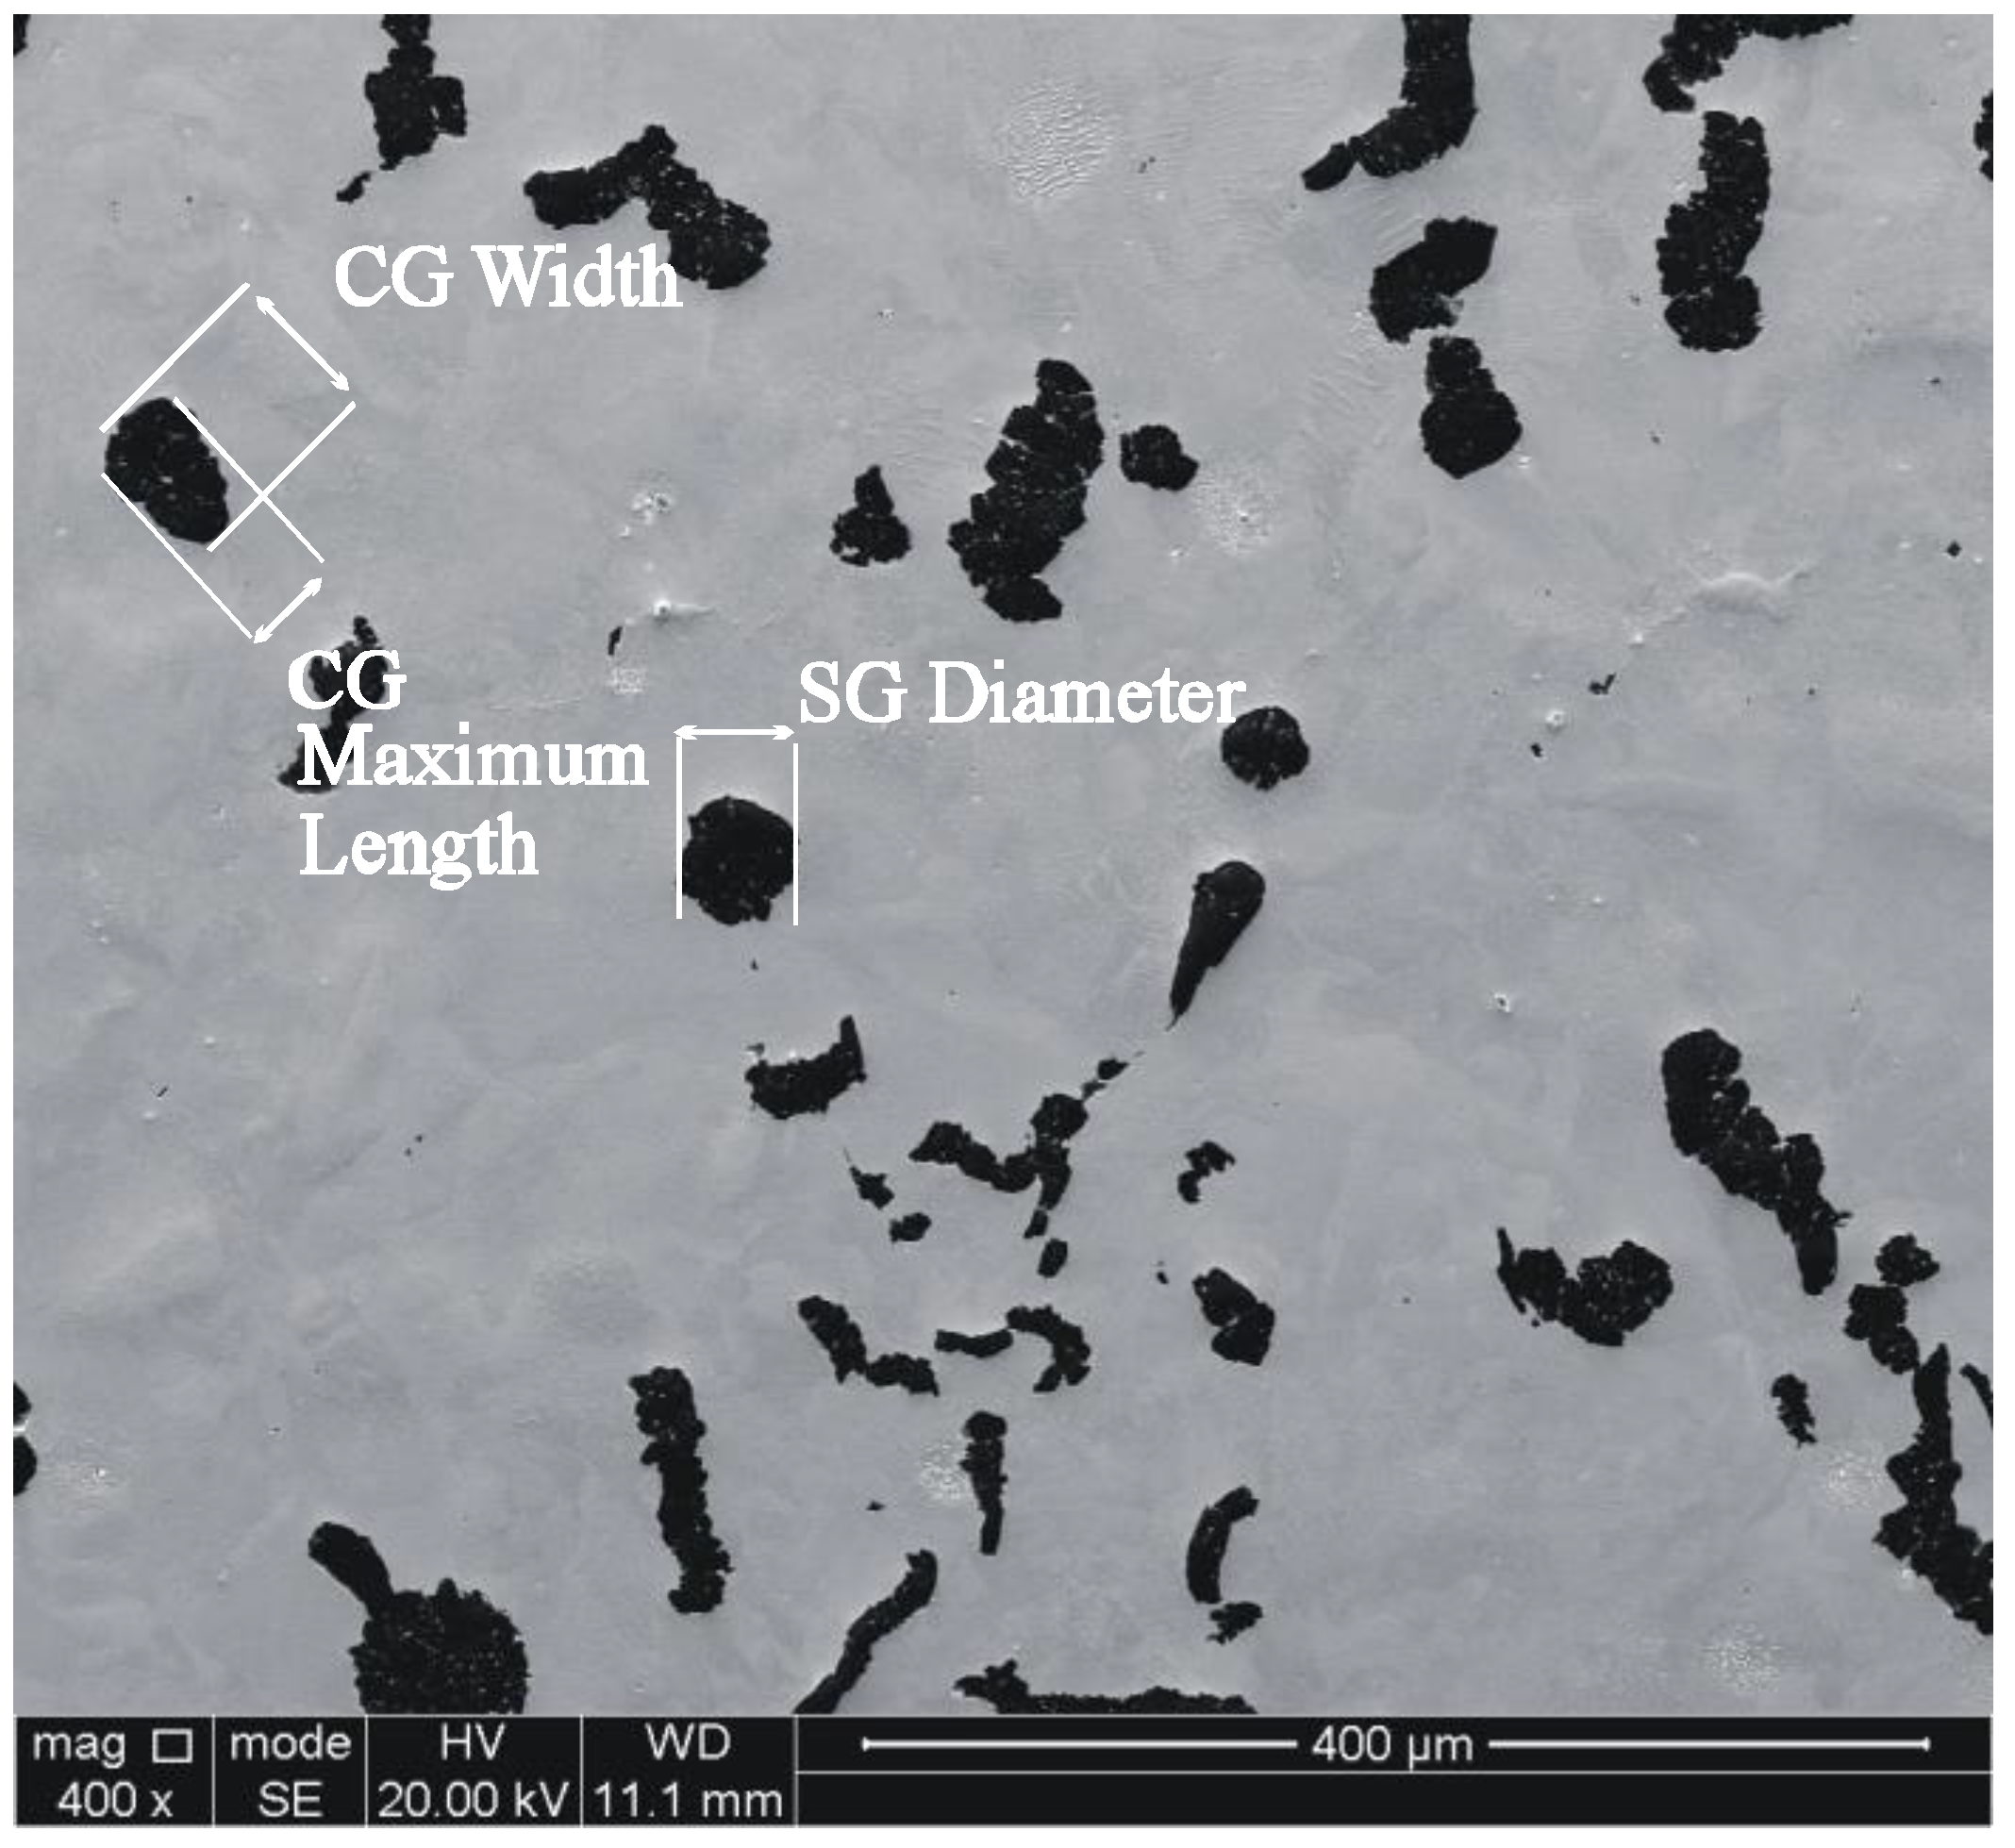
| CG width | 4.14 μm (±2.01) | |
| CG maximum length | 45 μm (±25) | |
| CG aspect ratio | 3.01 μm (±2.1) | |
| SG diameter | 18 μm (±5) | |
| SG nodularity (area fraction of nodular graphite particles) | 15.6% | |
| wt % | Si | Cr | Mn | Ti | Cu | Mg | C |
|---|---|---|---|---|---|---|---|
| AC | 1.25 (0.33) | 0.09 (0.05) | 0.45 (0.13) | 0.07 (0.01) | 0.9 (0.22) | 0.08 (0.09) | - |
| HT LP | 0.95 (0.13) | 0.14 (0.18) | 0.73 (0.19) | 0.07 (0.05) | 0.39 (0.12) | 0.08 (0.05) | - |
| HT F | 1.65 (0.13) | 0.09 (0.01) | 0.35 (0.01) | 0.04 (0.008) | 1.2 (0.87) | 0.08 (0.06) | - |
| Ref [1] | 1.9–2.2 | <0.1 | 0.15–0.4 | <0.015 | 0.75–0.95 | 0.004–0.01 | 3.6–3.9 |
| Phase | HT | AC | |
|---|---|---|---|
| LP | F | LP | |
| h (μm) ΔH (HVN) | h (μm) ΔH (HVN) | h (μm) ΔH (HVN) | |
| SG | - | 2.13 (0.8) 103 (3.8) | - |
| NSG | 2.15 (0.7) 204 (4.5) | 1.5 (0.5) 103 (6.4) | 4.14 (1.4) 226 (7.2) |
| Air | - | 0.911 (0.01) 133 (2.7) | 3.05 (0.35) 256 (5.5) |
© 2018 by the authors. Licensee MDPI, Basel, Switzerland. This article is an open access article distributed under the terms and conditions of the Creative Commons Attribution (CC BY) license (http://creativecommons.org/licenses/by/4.0/).
Share and Cite
Lopez-Covaleda, E.A.; Ghodrat, S.; Kestens, L.A.I.; Sacre, C.-H.; Pardoen, T. Proposal of Characterization Procedure of Metal–Graphite Interface Strength in Compacted Graphite Iron. Materials 2018, 11, 1159. https://doi.org/10.3390/ma11071159
Lopez-Covaleda EA, Ghodrat S, Kestens LAI, Sacre C-H, Pardoen T. Proposal of Characterization Procedure of Metal–Graphite Interface Strength in Compacted Graphite Iron. Materials. 2018; 11(7):1159. https://doi.org/10.3390/ma11071159
Chicago/Turabian StyleLopez-Covaleda, Edwin A., Sepideh Ghodrat, Leo A.I. Kestens, Charles-Henry Sacre, and Thomas Pardoen. 2018. "Proposal of Characterization Procedure of Metal–Graphite Interface Strength in Compacted Graphite Iron" Materials 11, no. 7: 1159. https://doi.org/10.3390/ma11071159