Fatigue Performance of Different Thickness Structure Combinations of Hot Mix Asphalt and Cement Emulsified Asphalt Mixtures

Abstract
:1. Introduction
1.1. Background
1.2. Objectives
2. Experimental
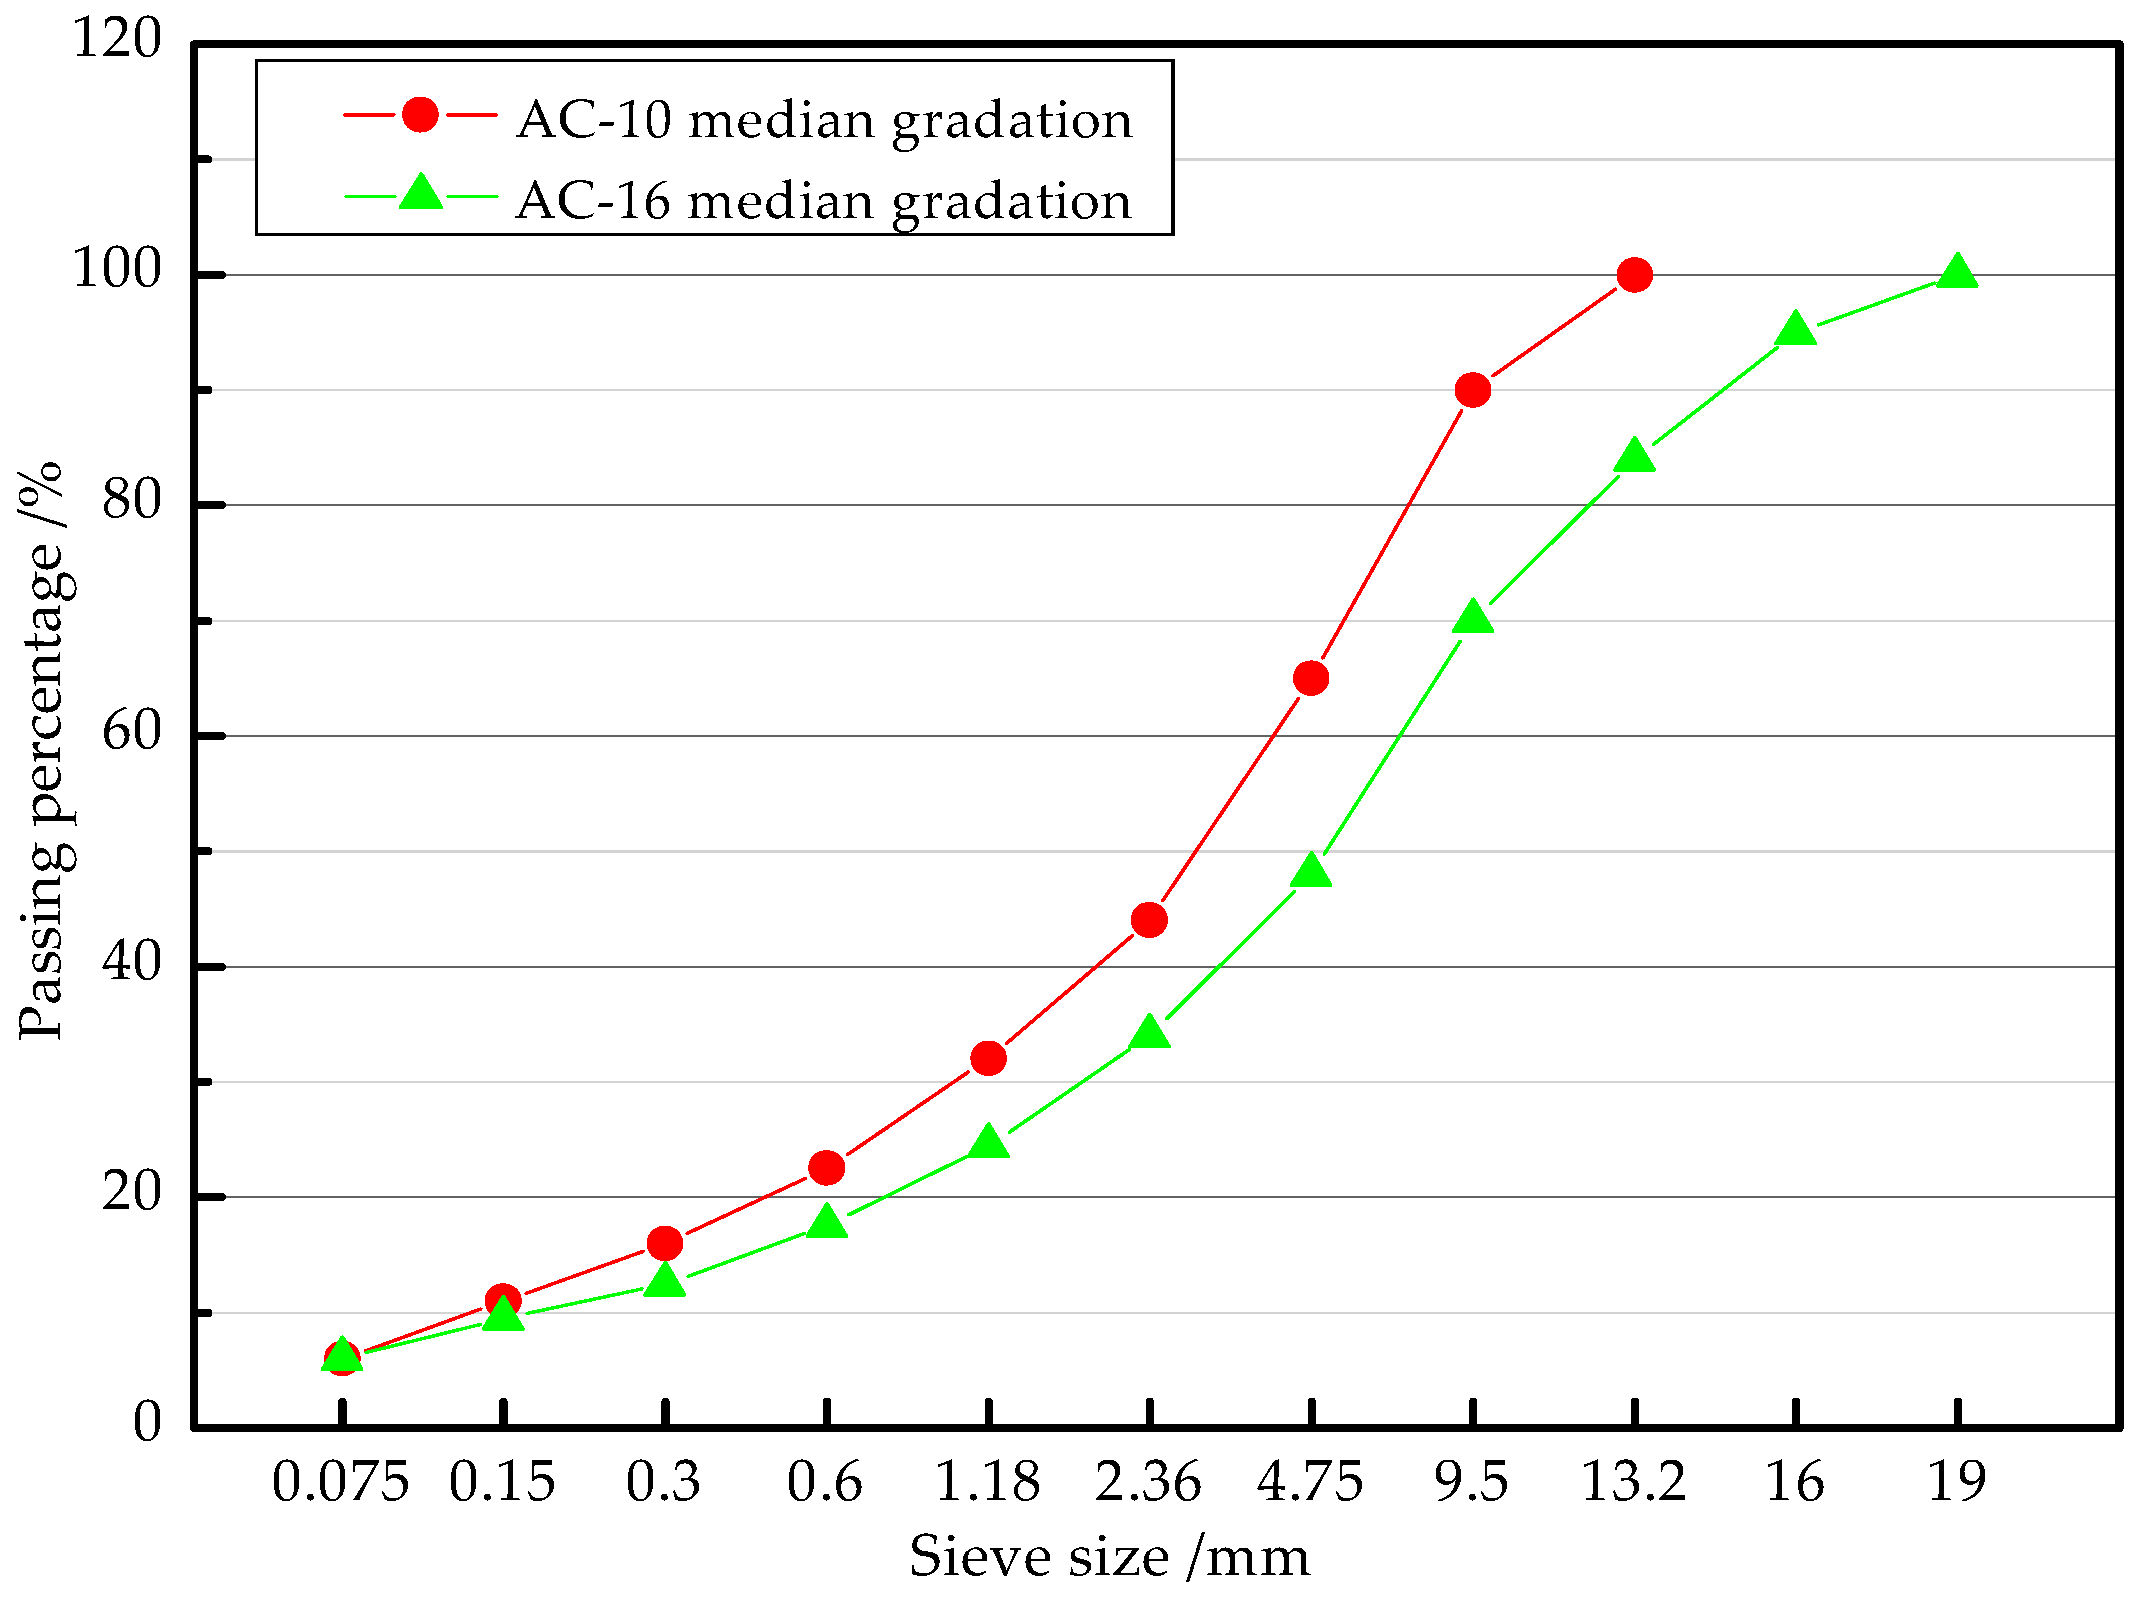
2.1. Raw Materials
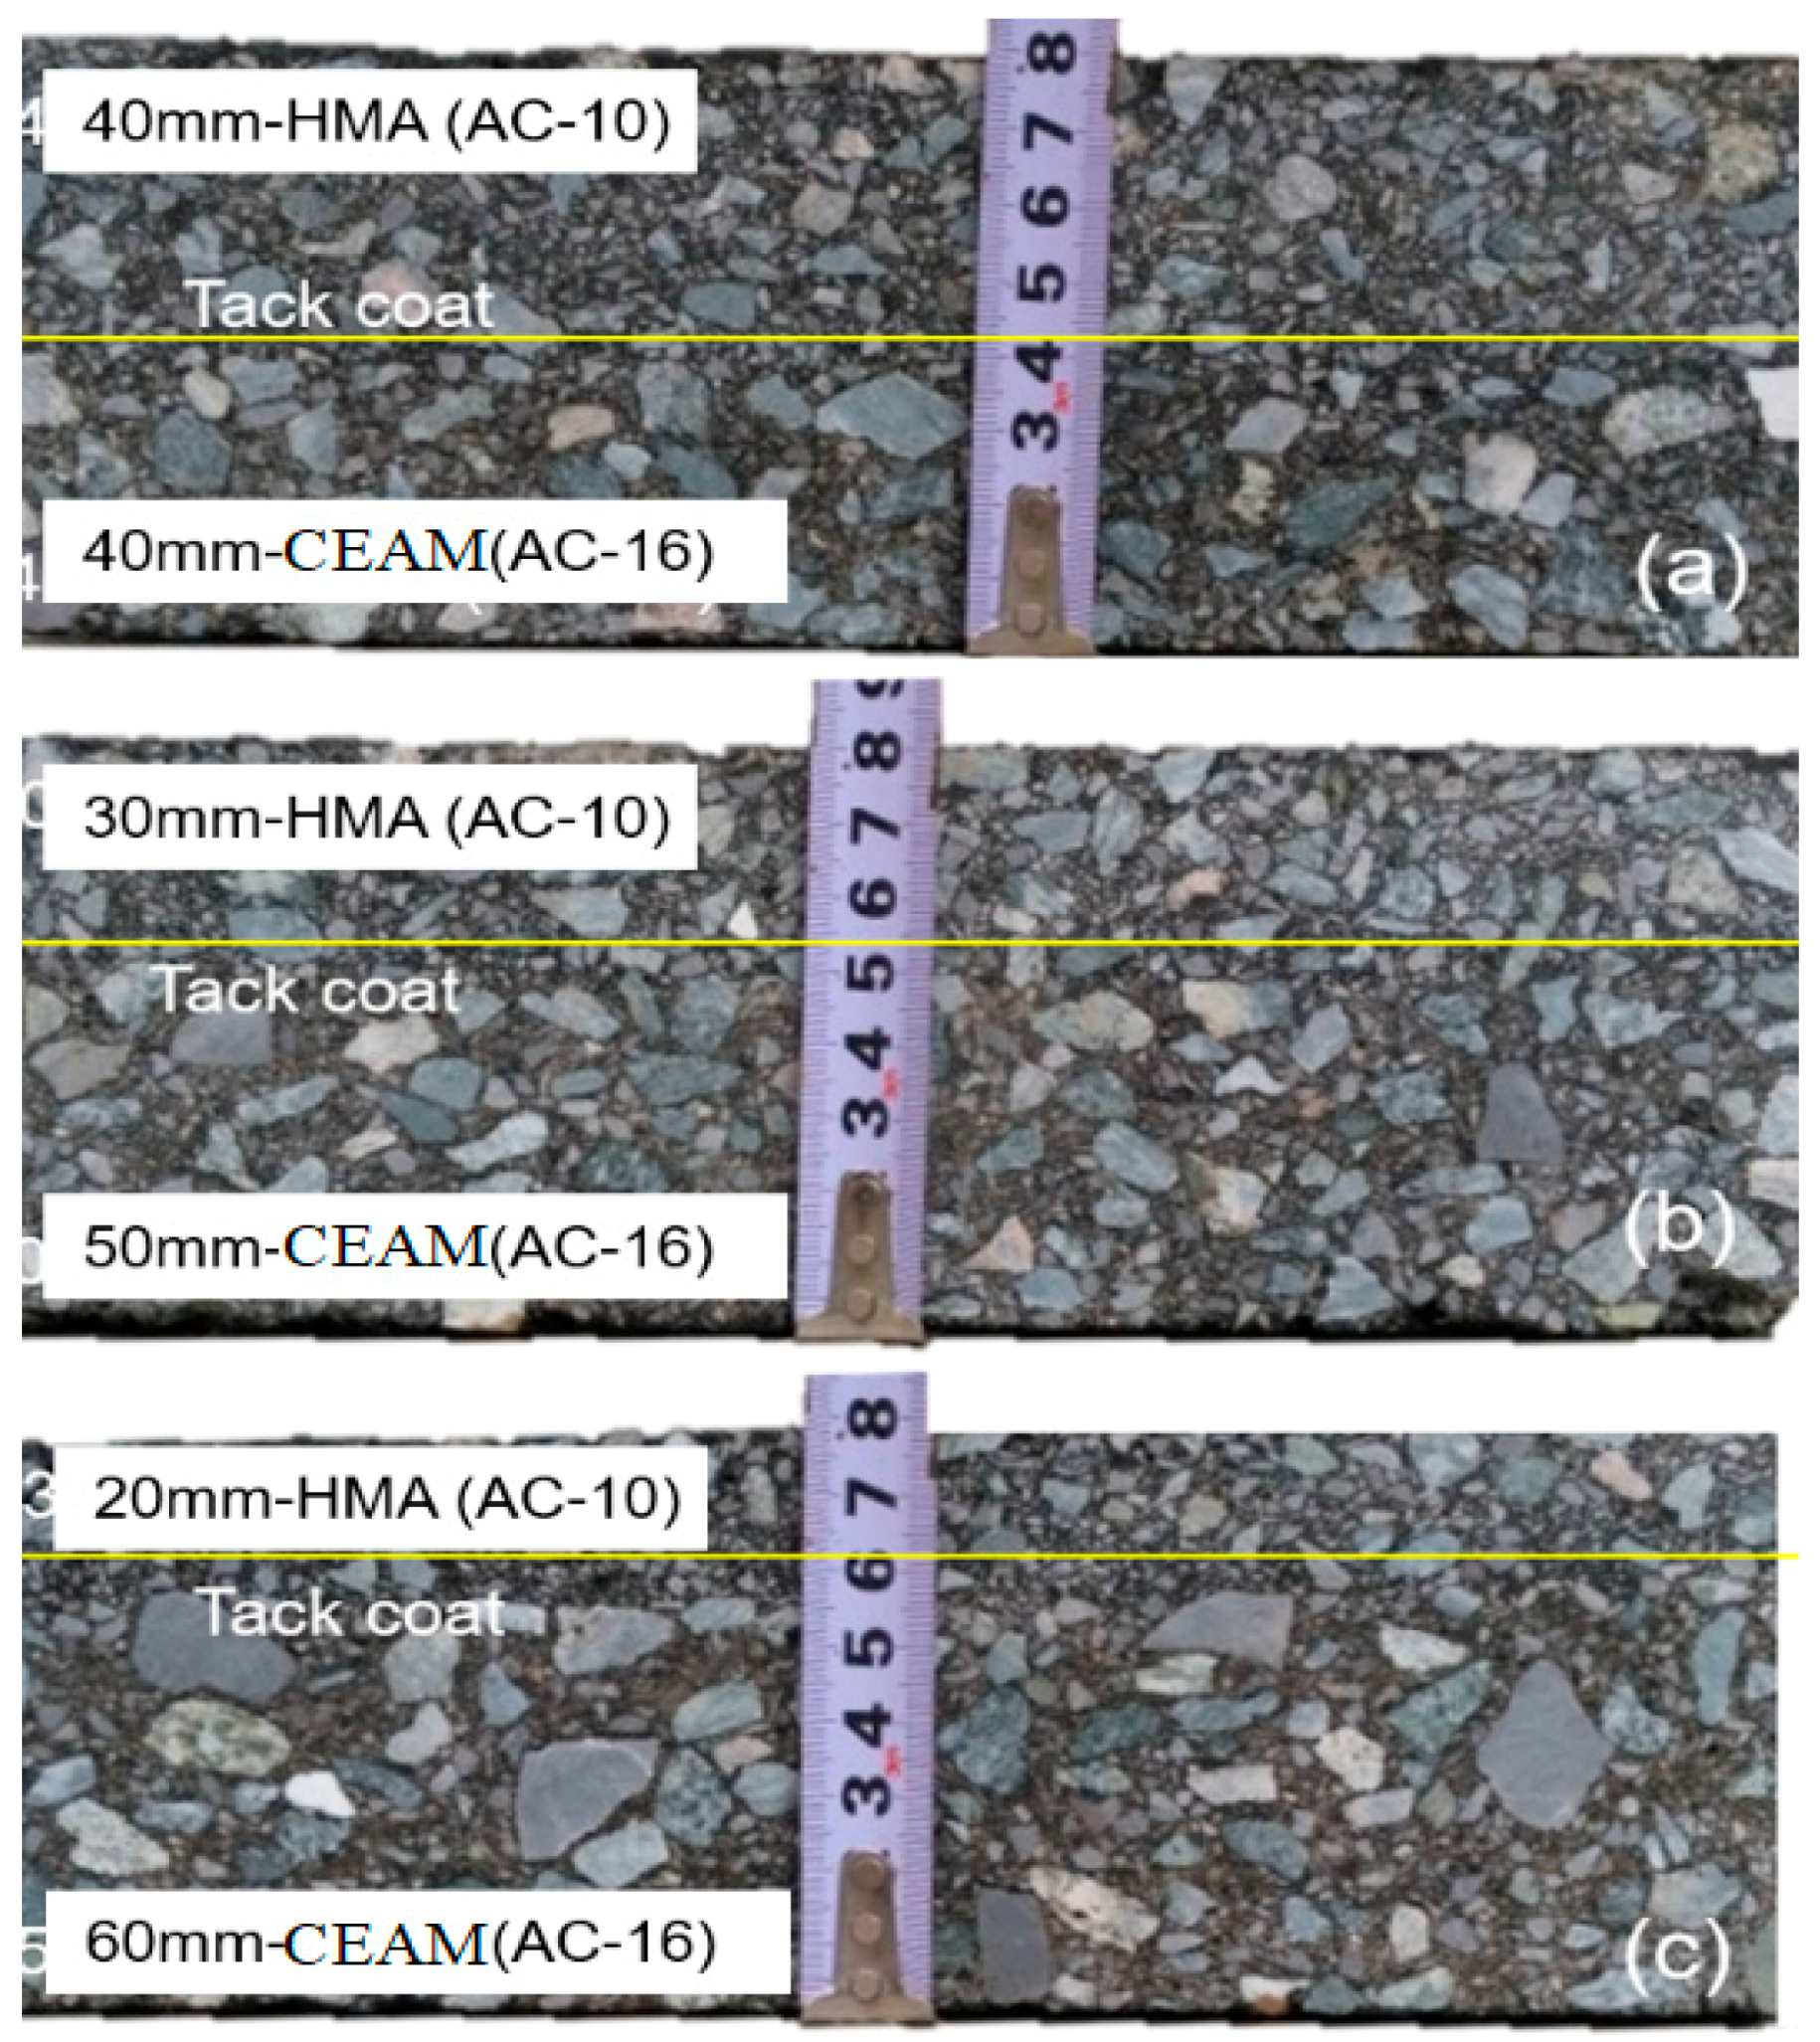
2.2. Preparation of the Specimens
2.3. Test Methods
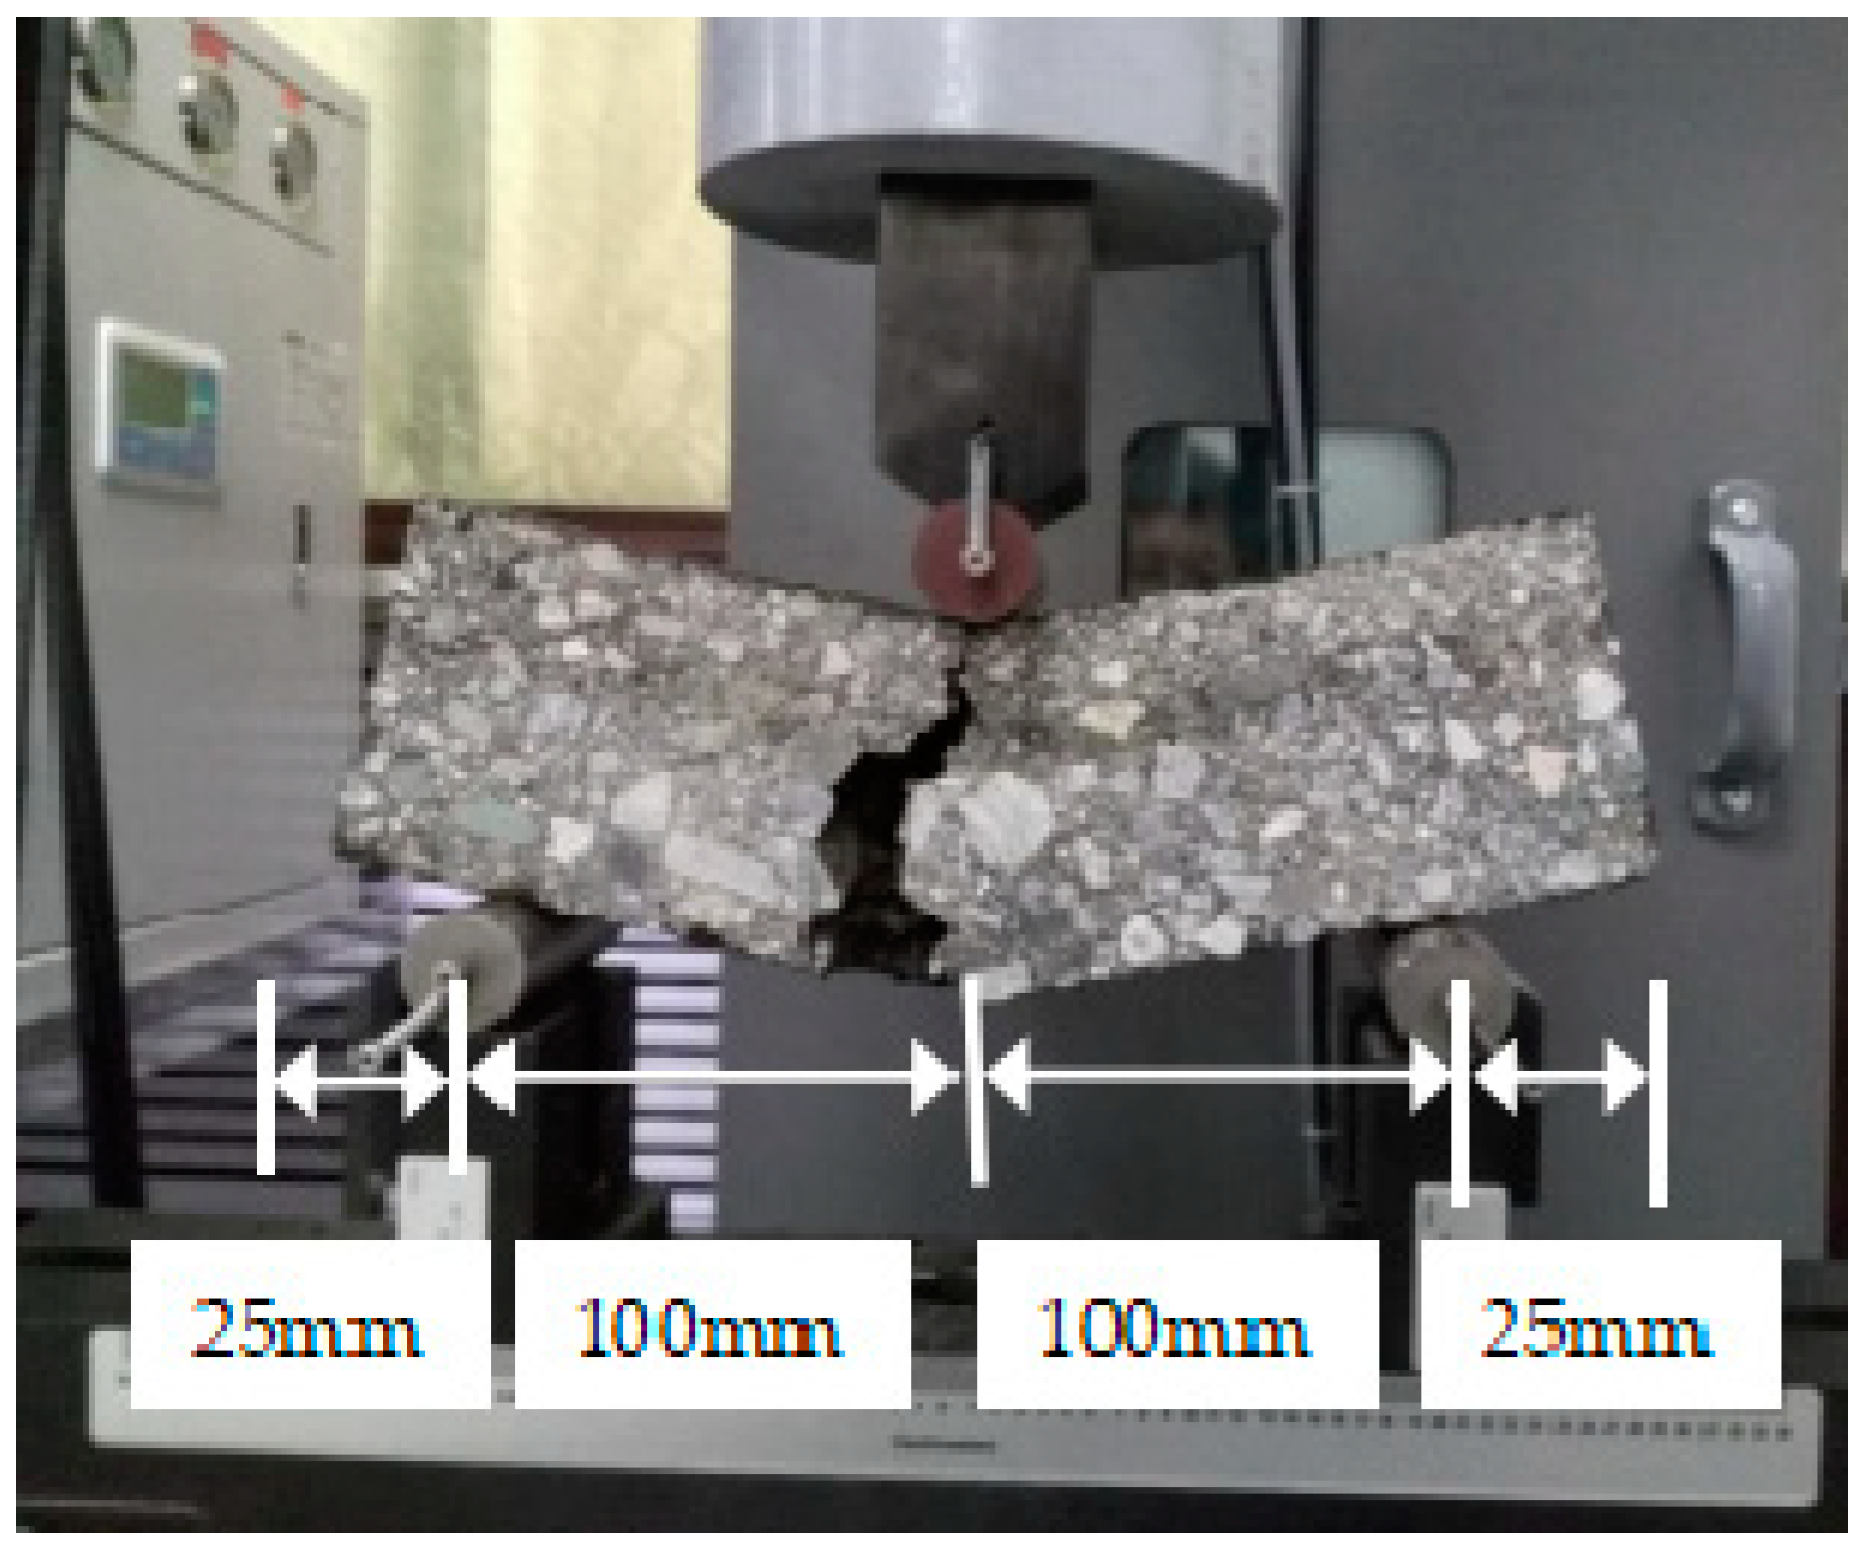
2.3.1. Flexural Tensile Strength Test
2.3.2. Fatigue Test
2.3.3. X-ray CT Scanning
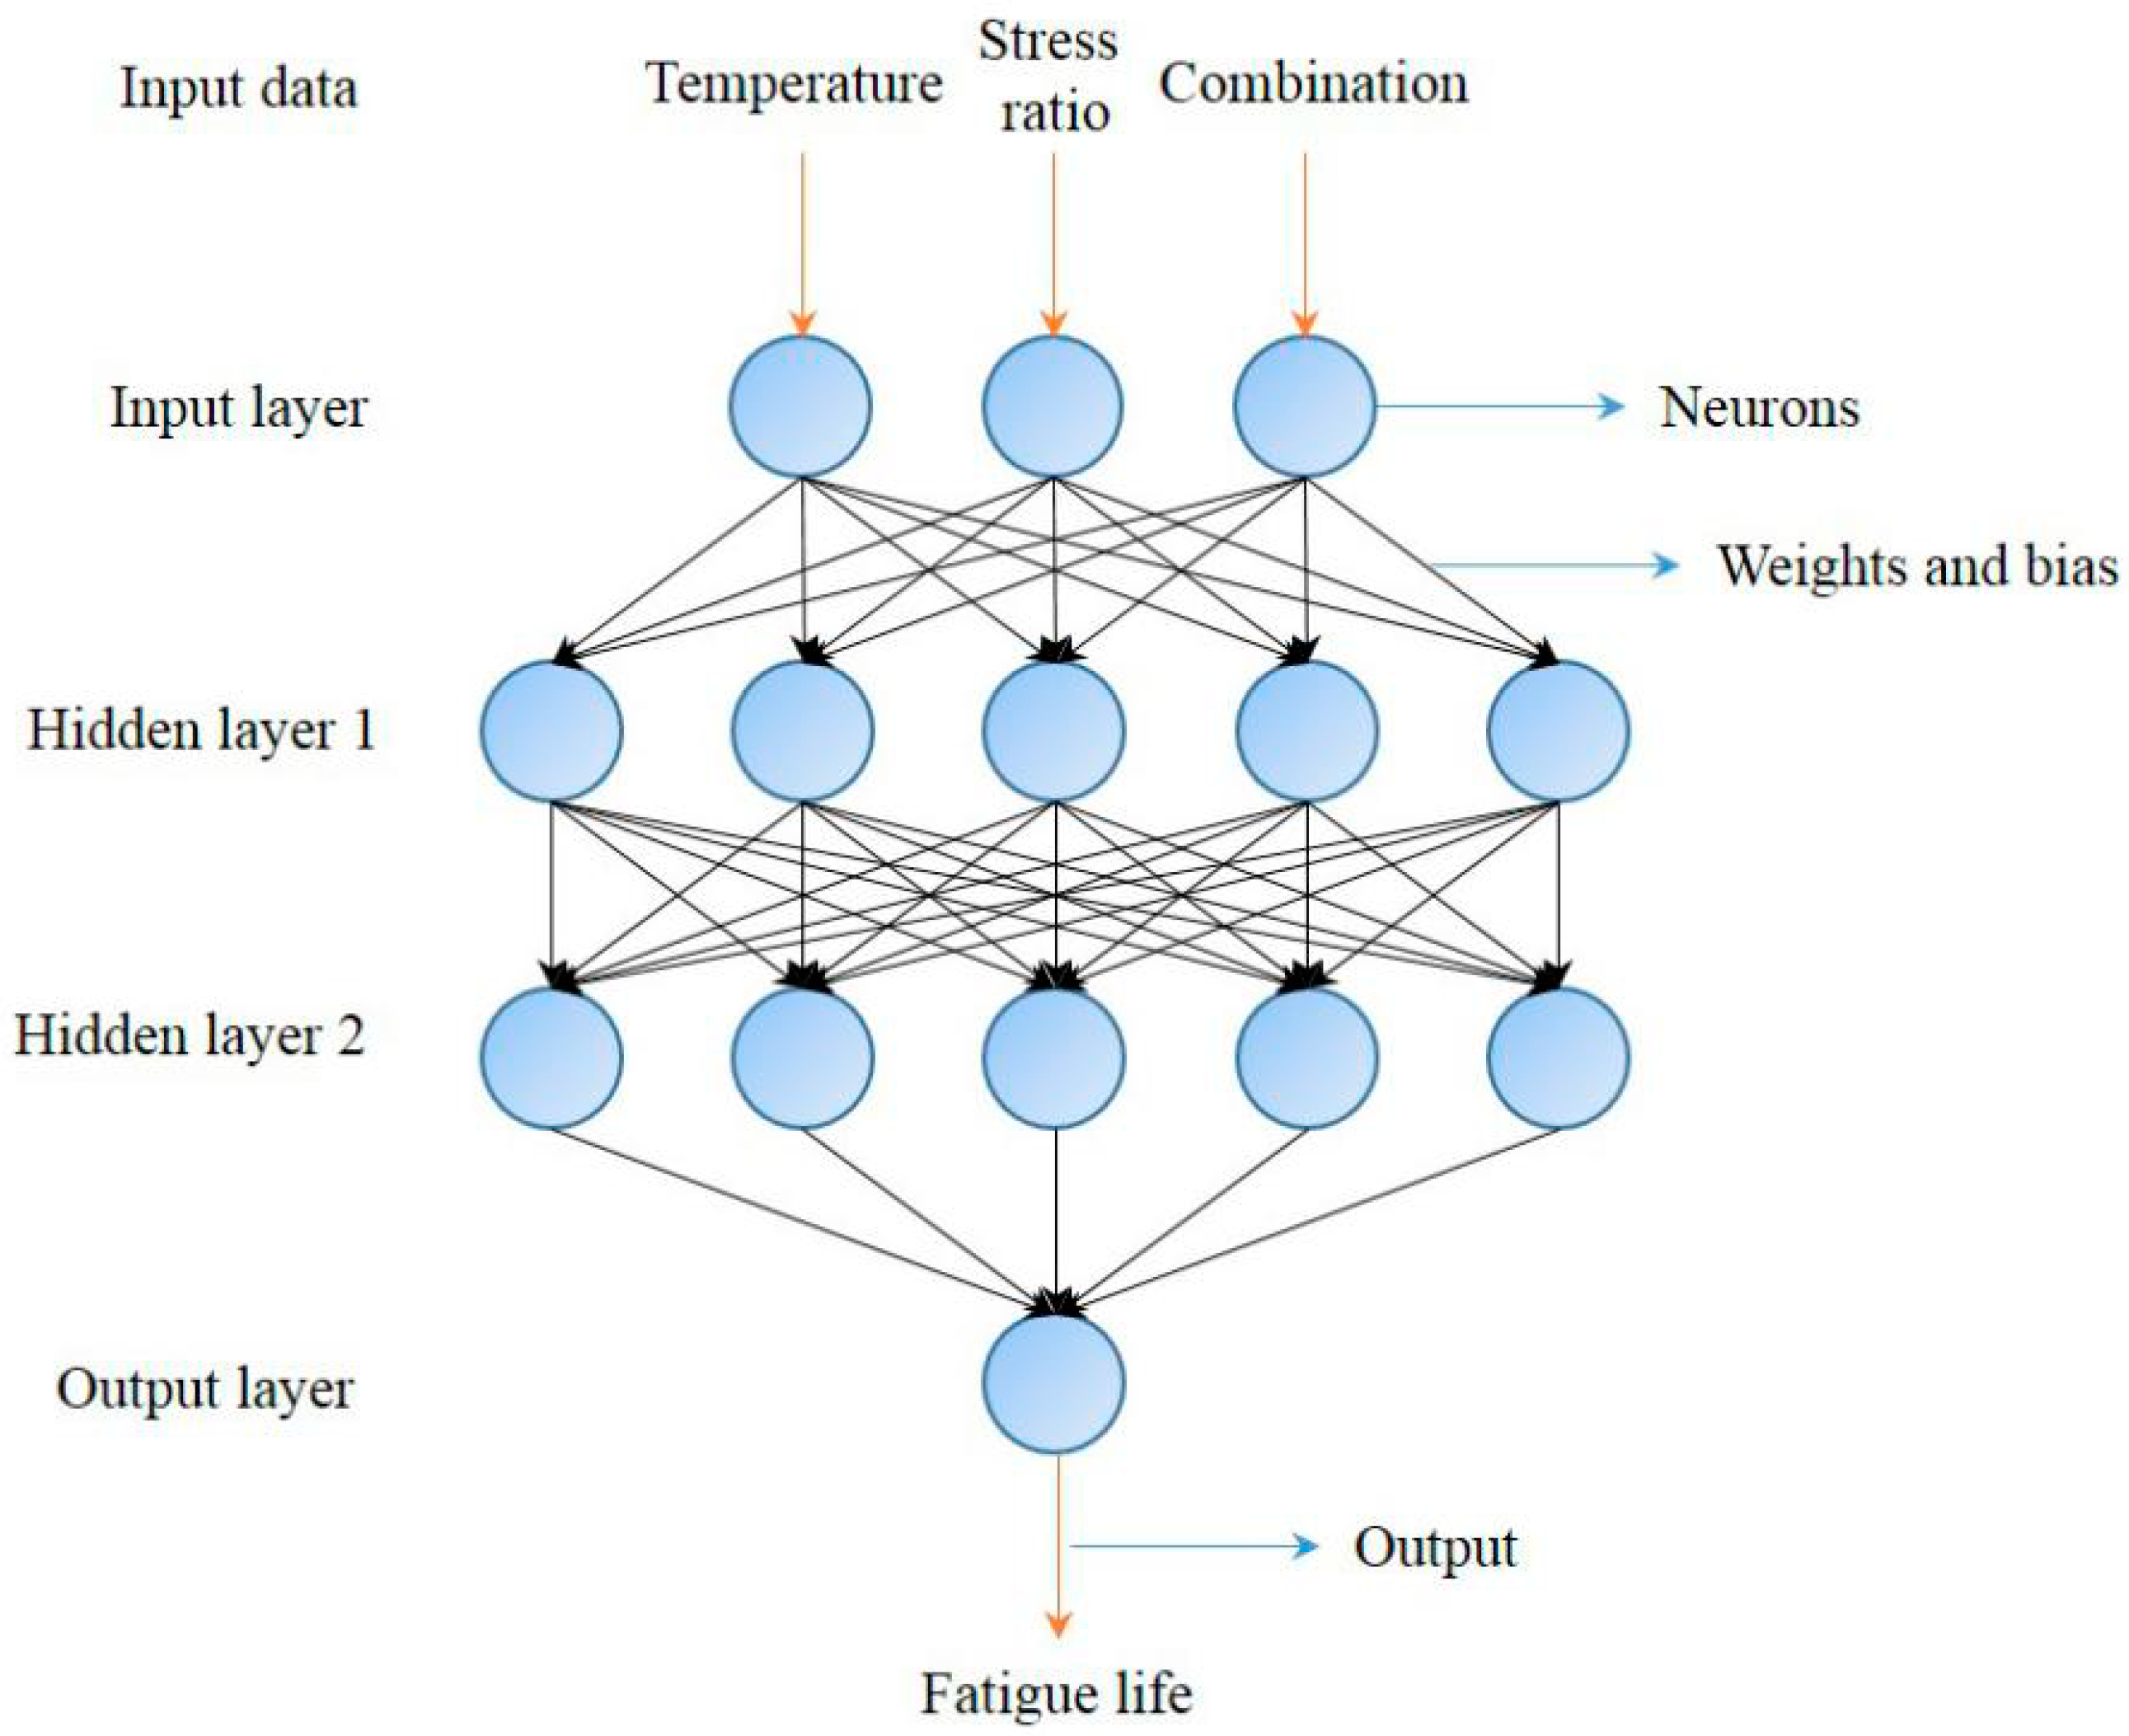
2.3.4. Fatigue Life Prediction of the Combinations Based on ANN
3. Results and Discussion
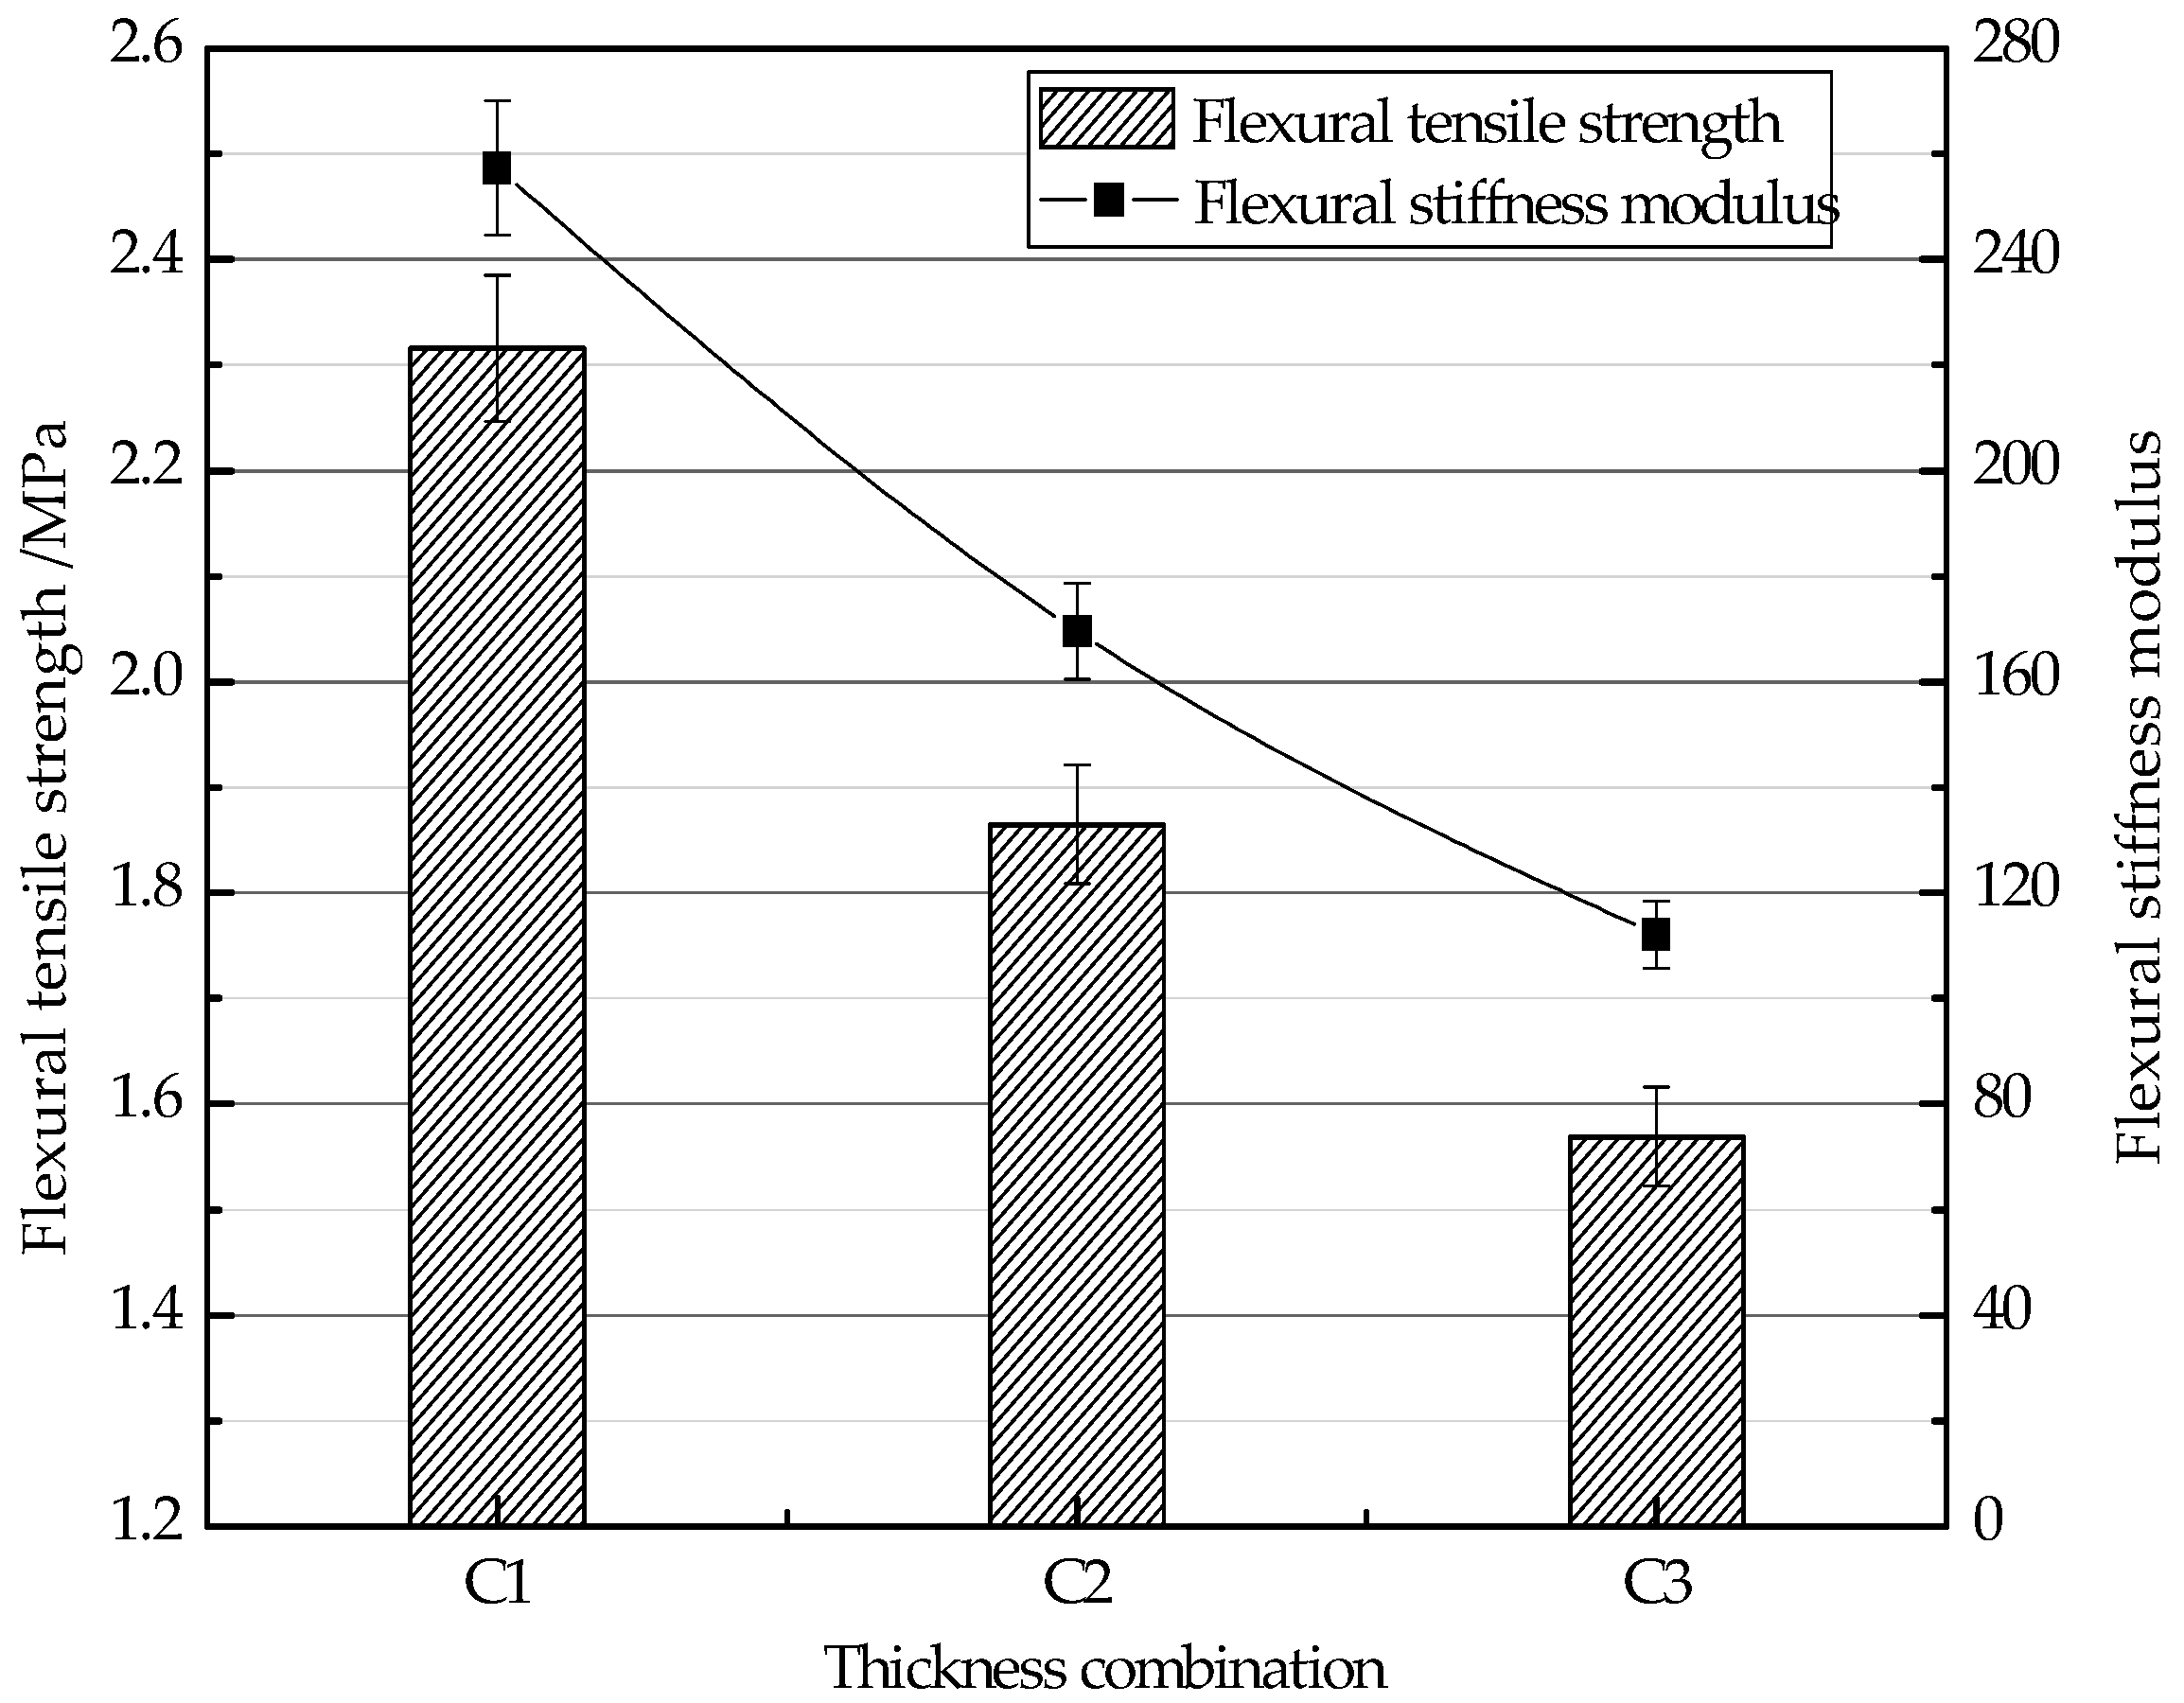
3.1. Results of Flexural Tensile Strength Test
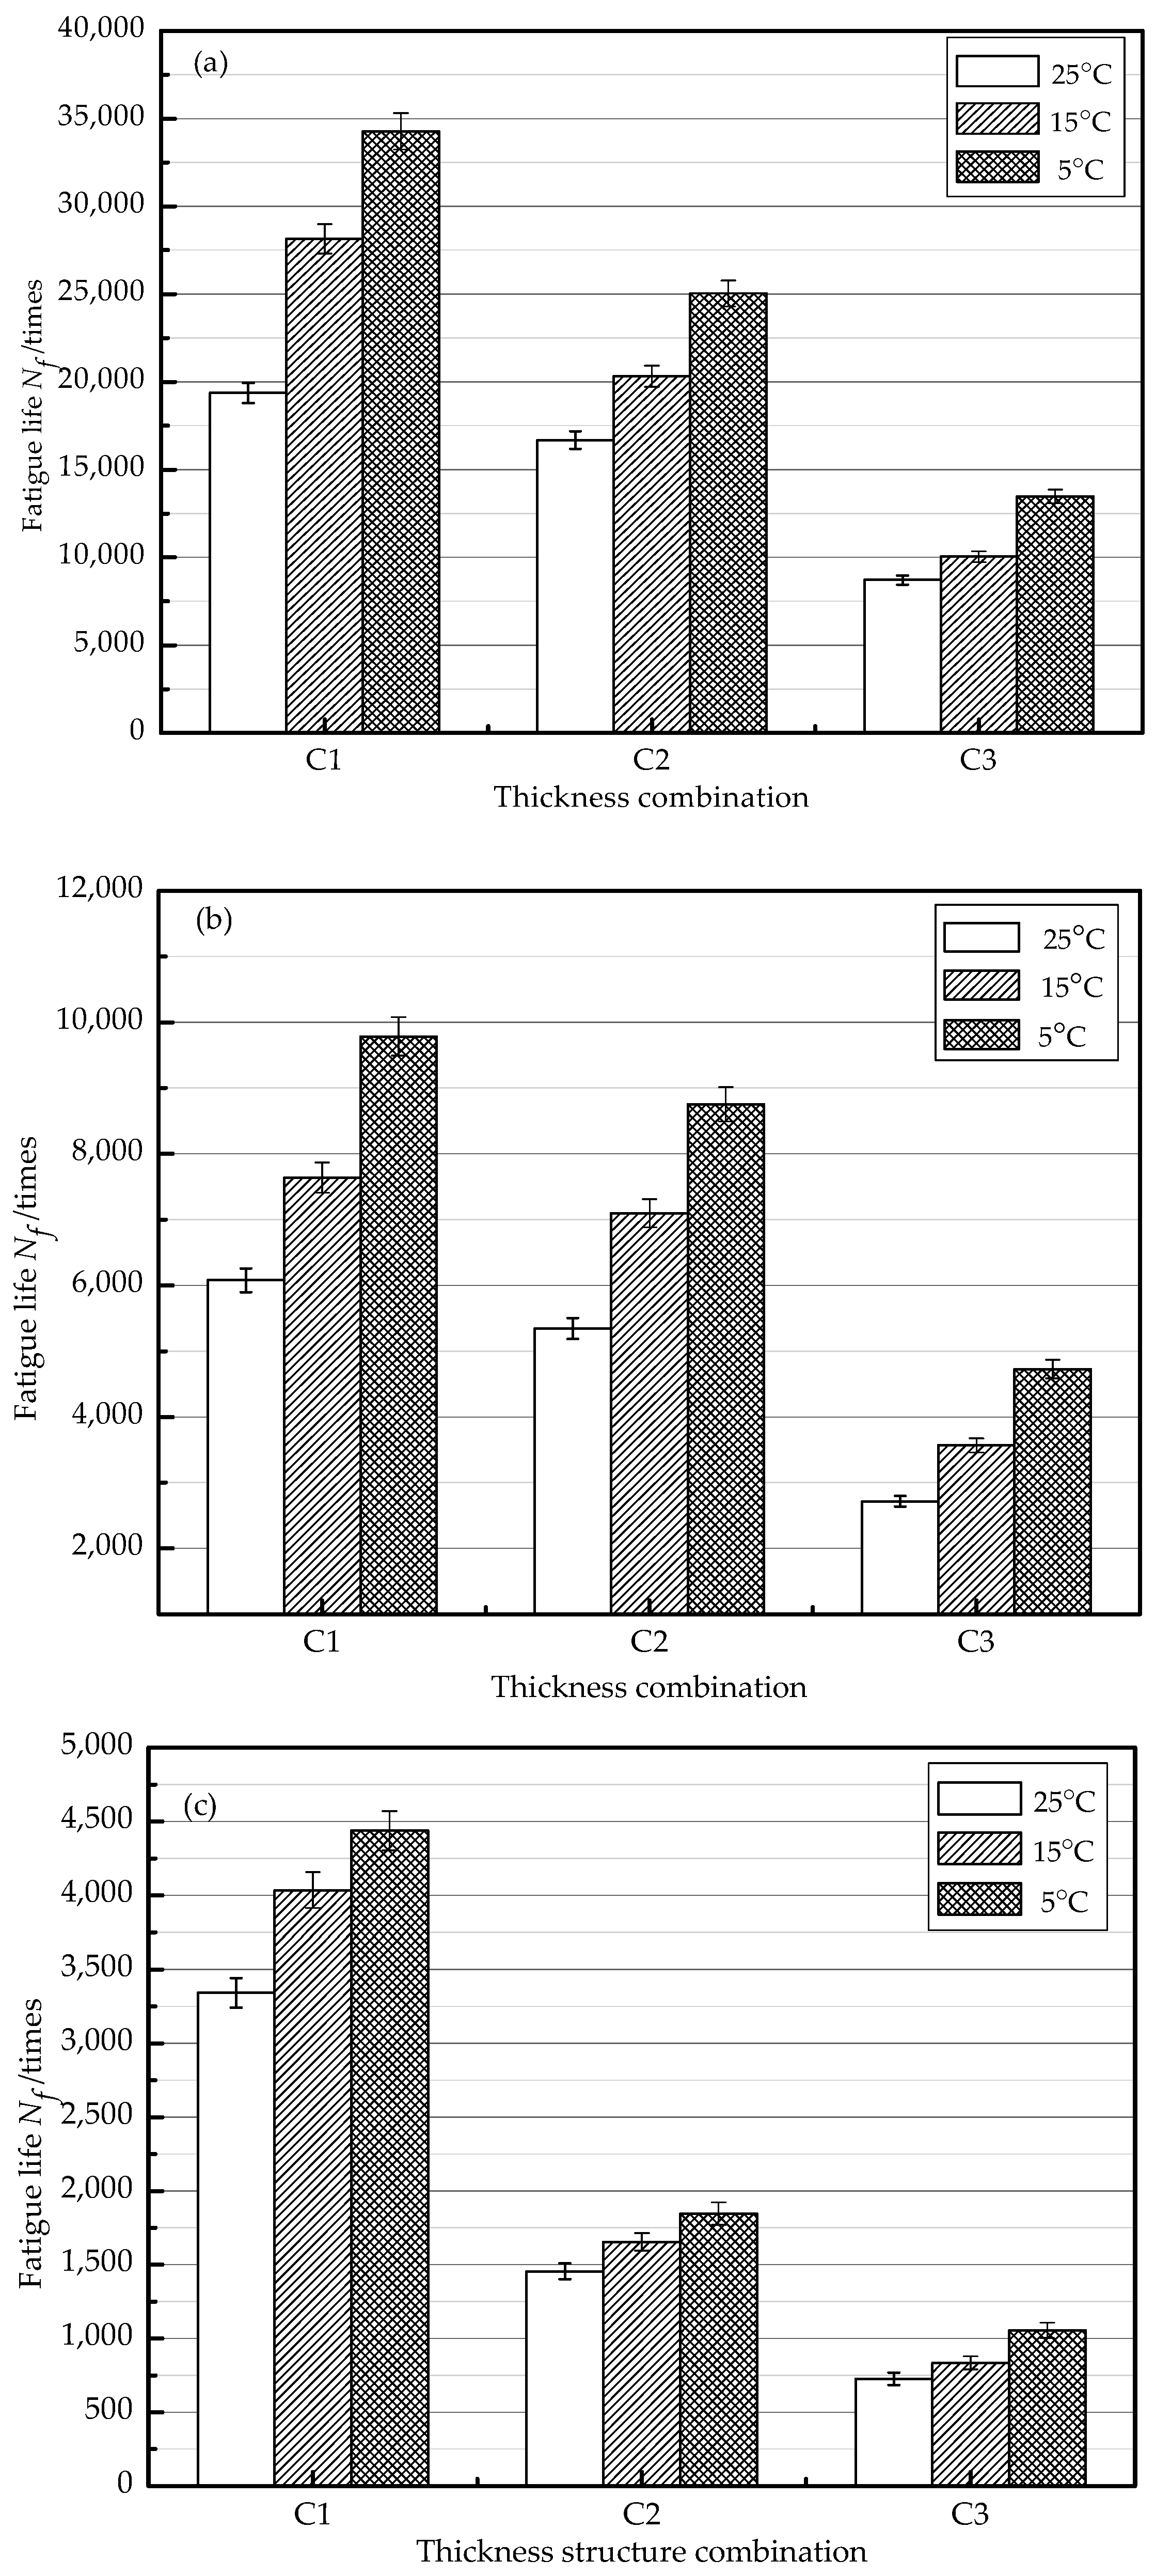
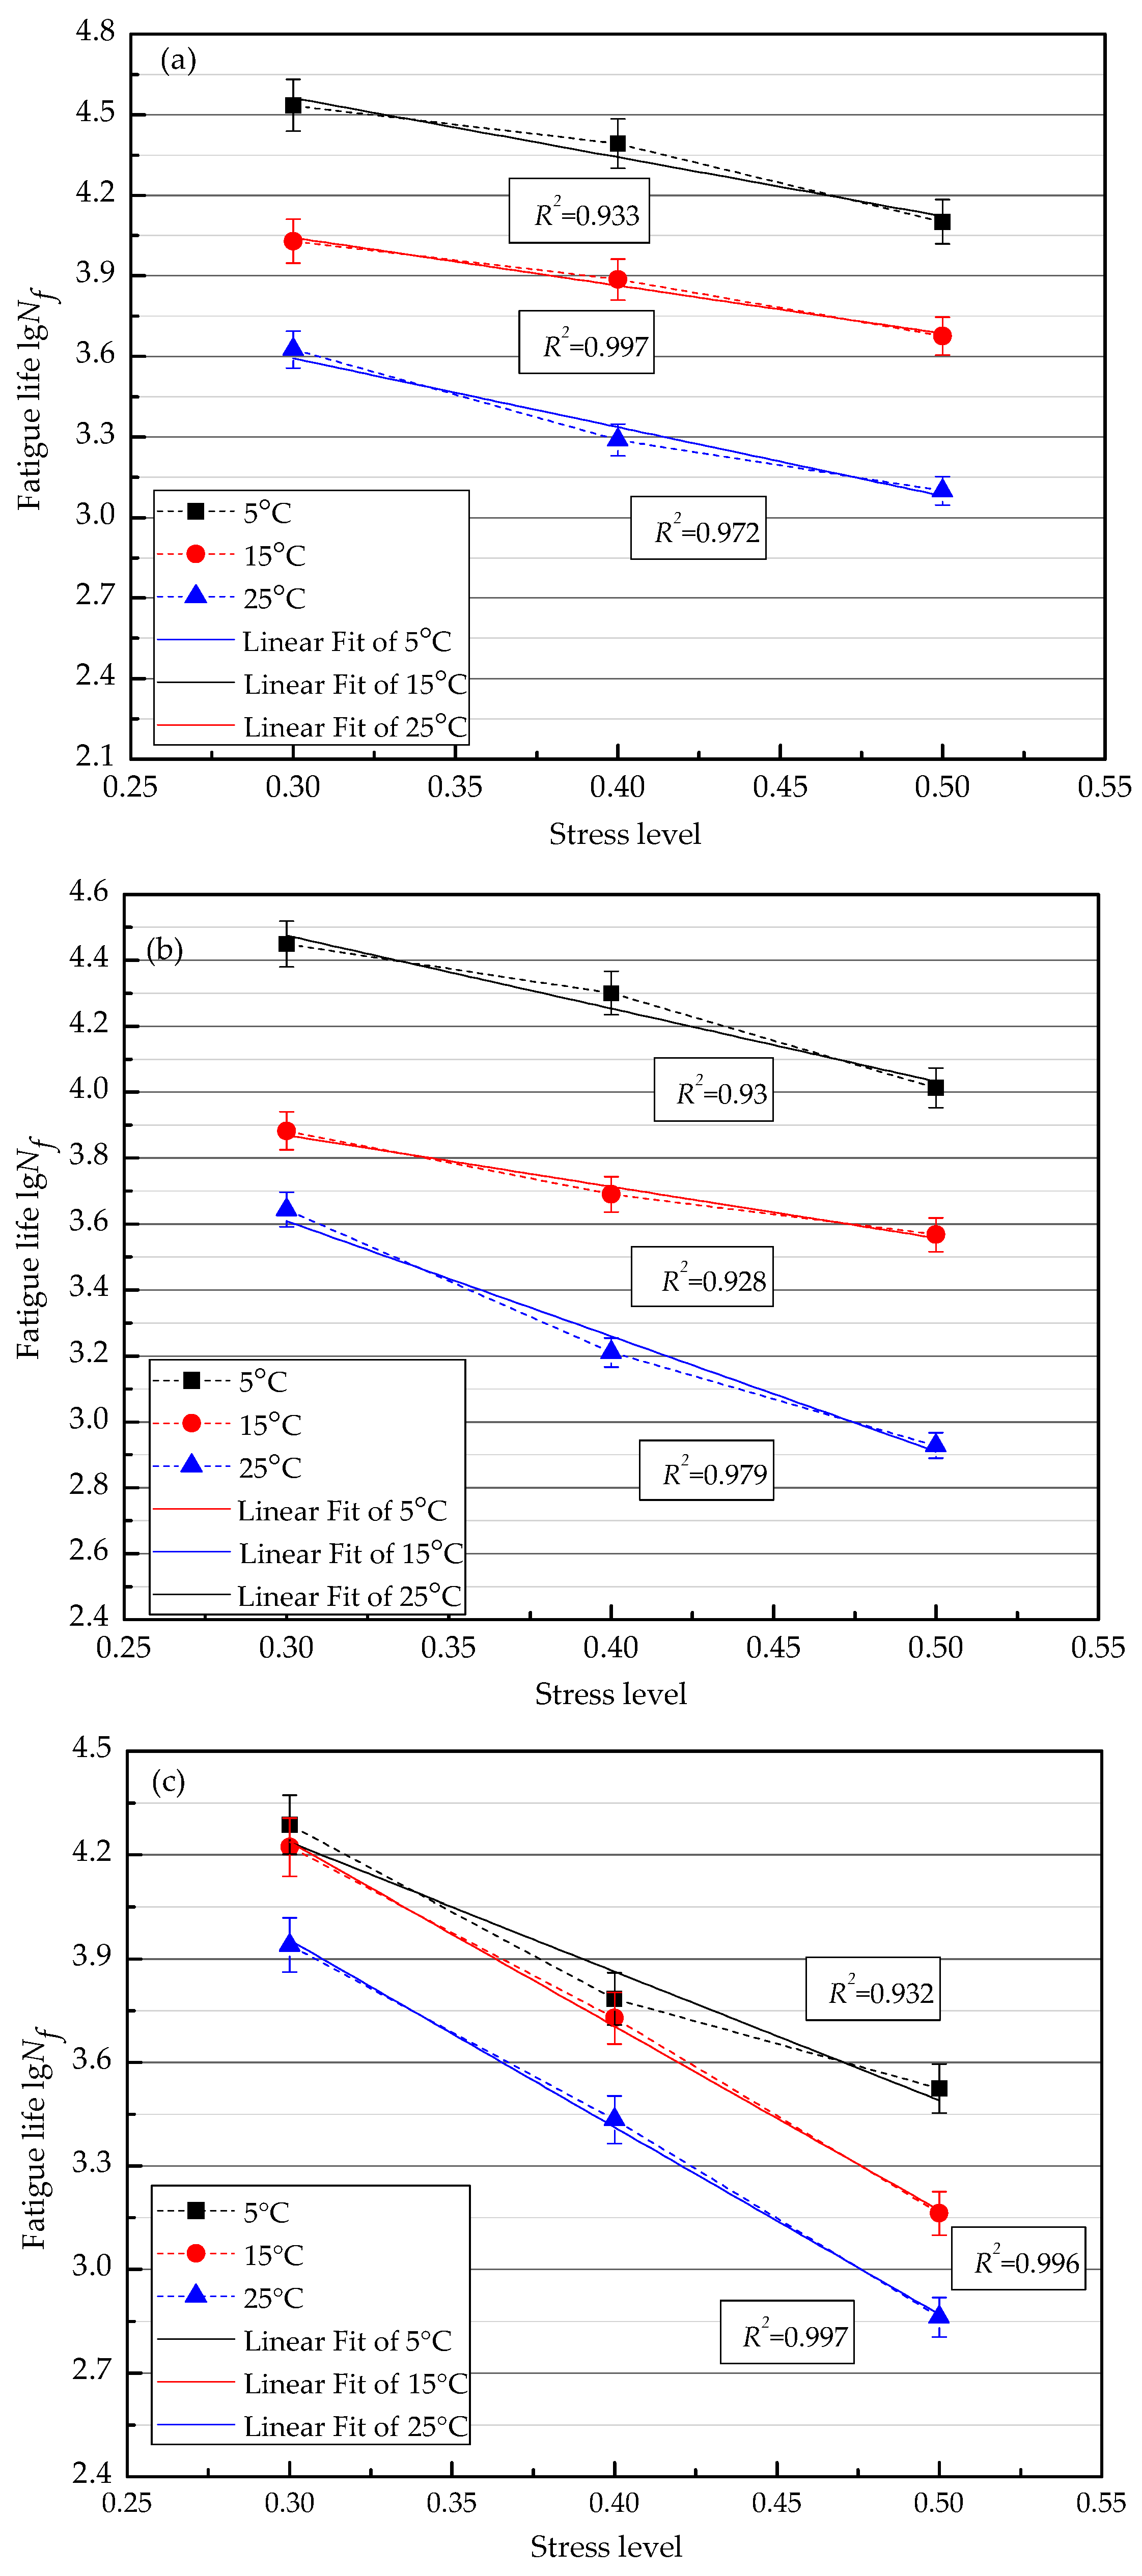
3.2. Effects of Test Temperature on Fatigue Performance
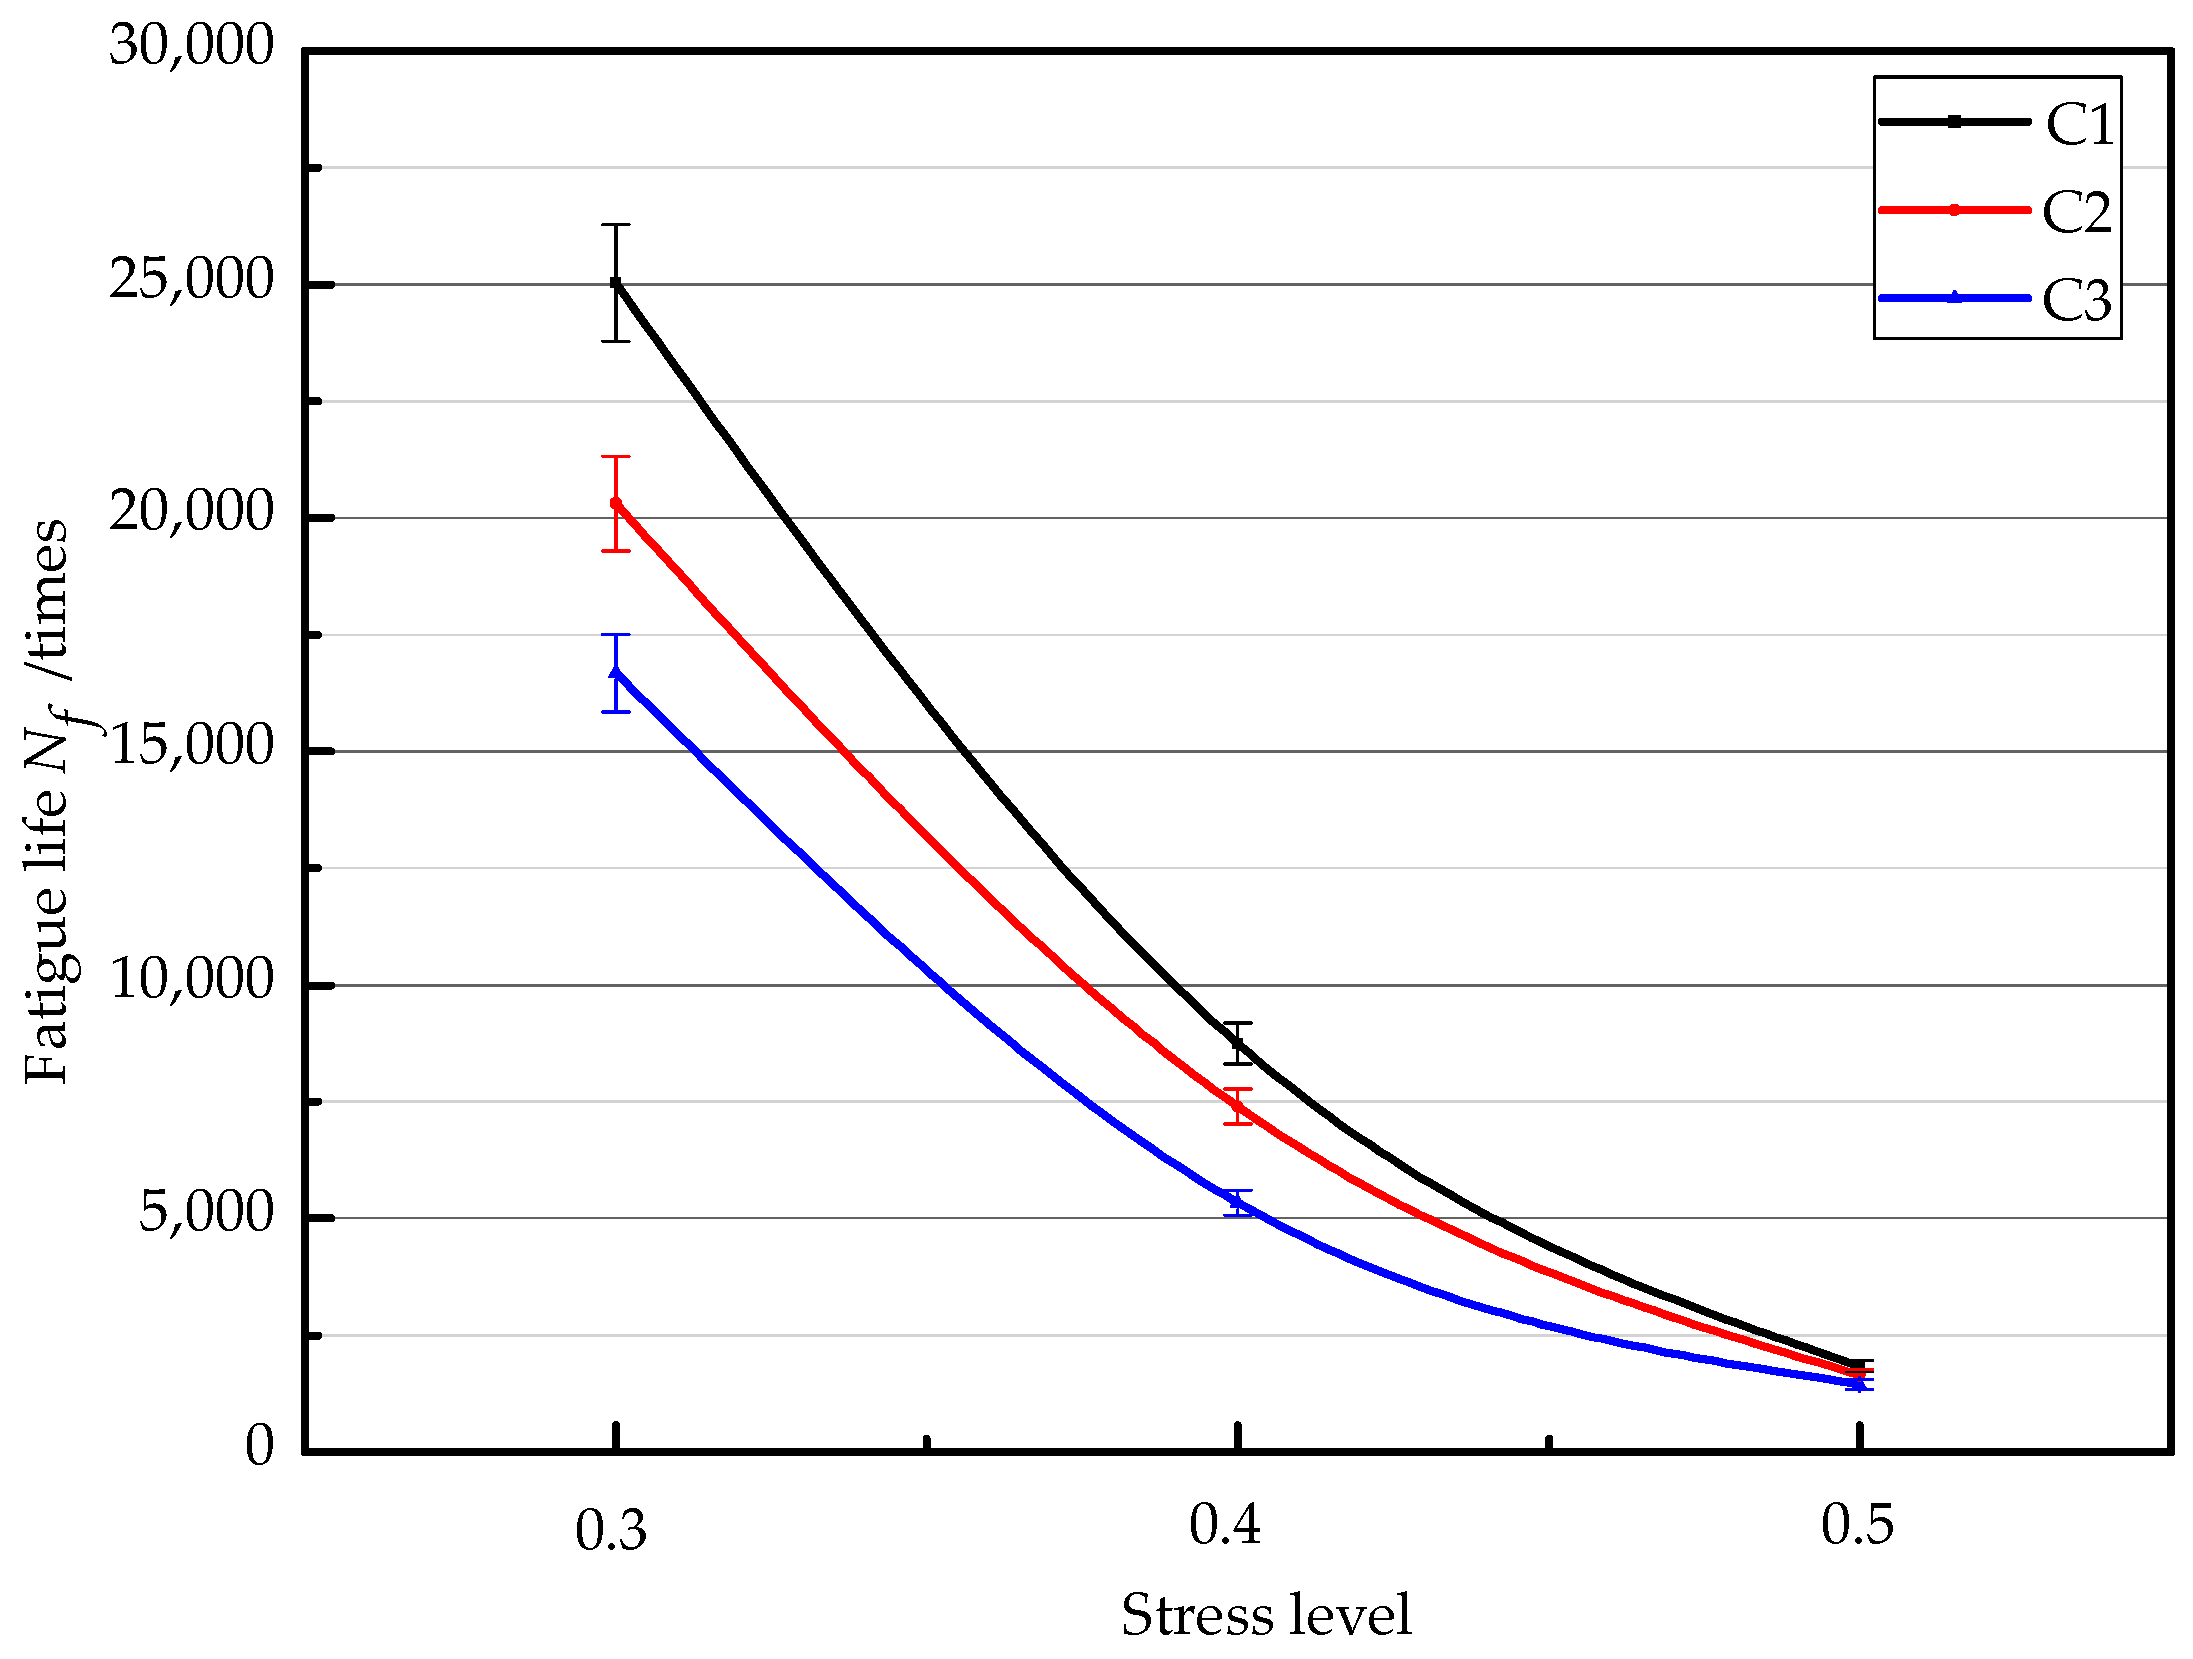
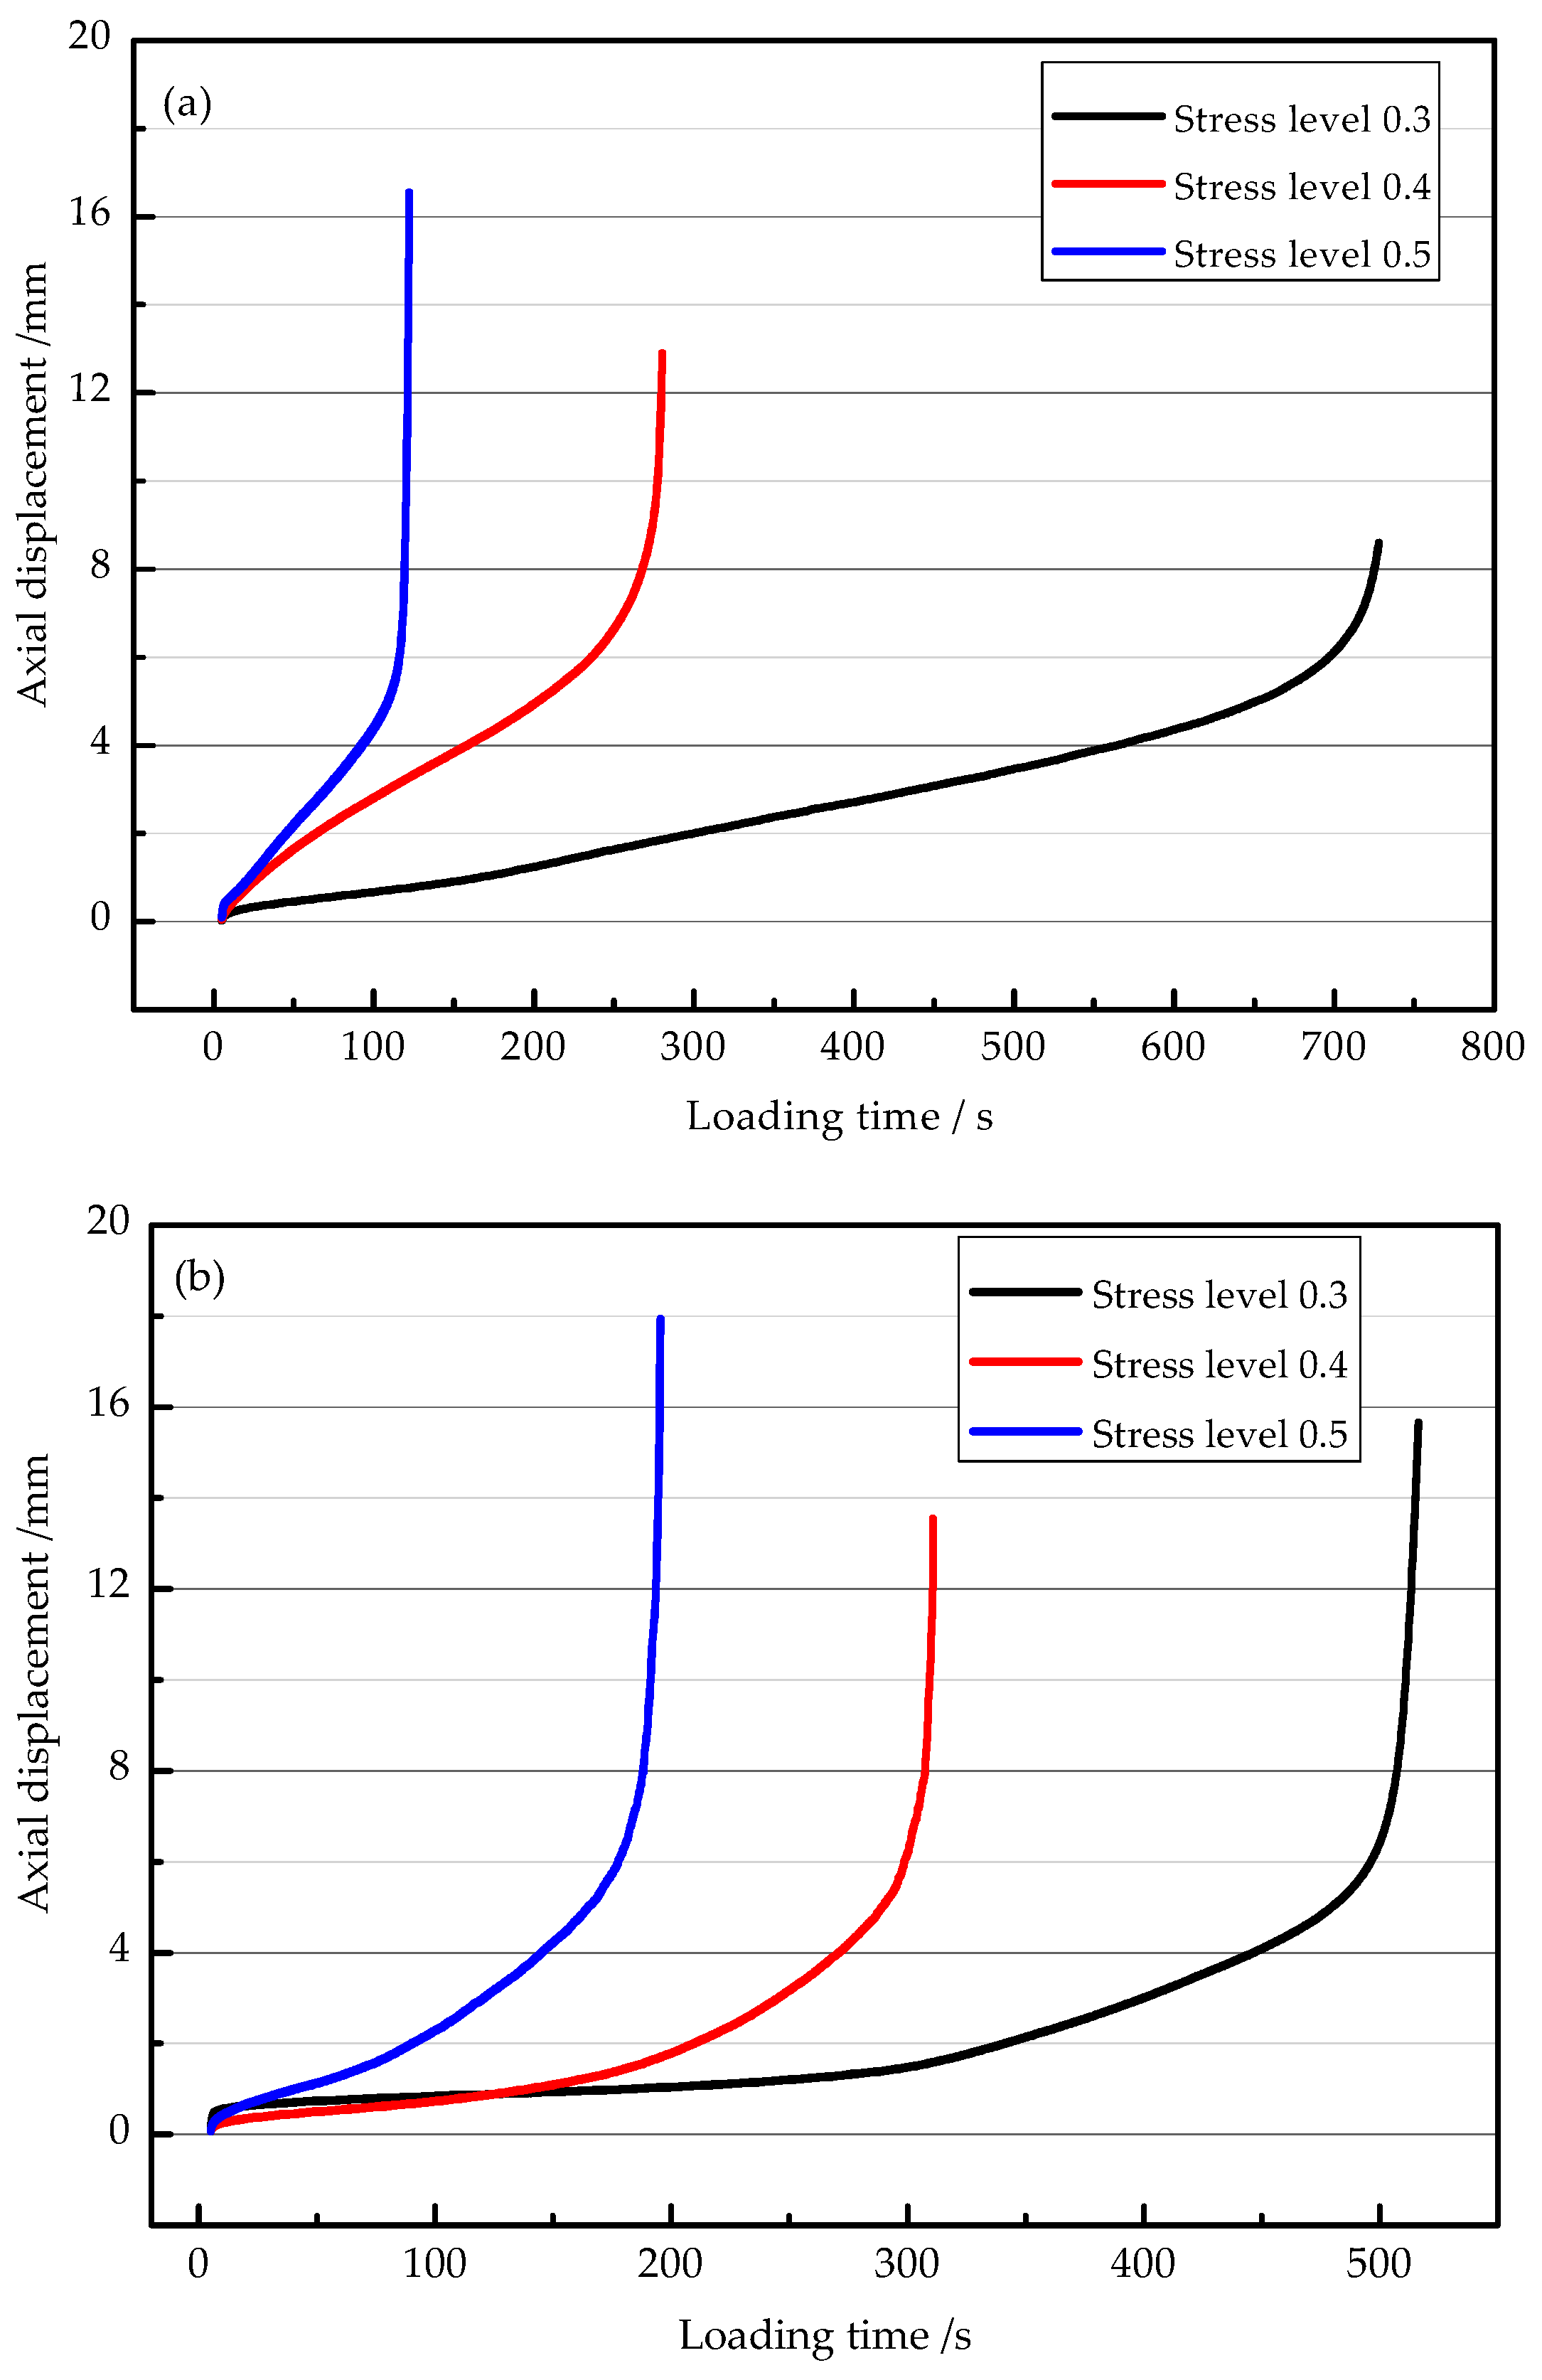
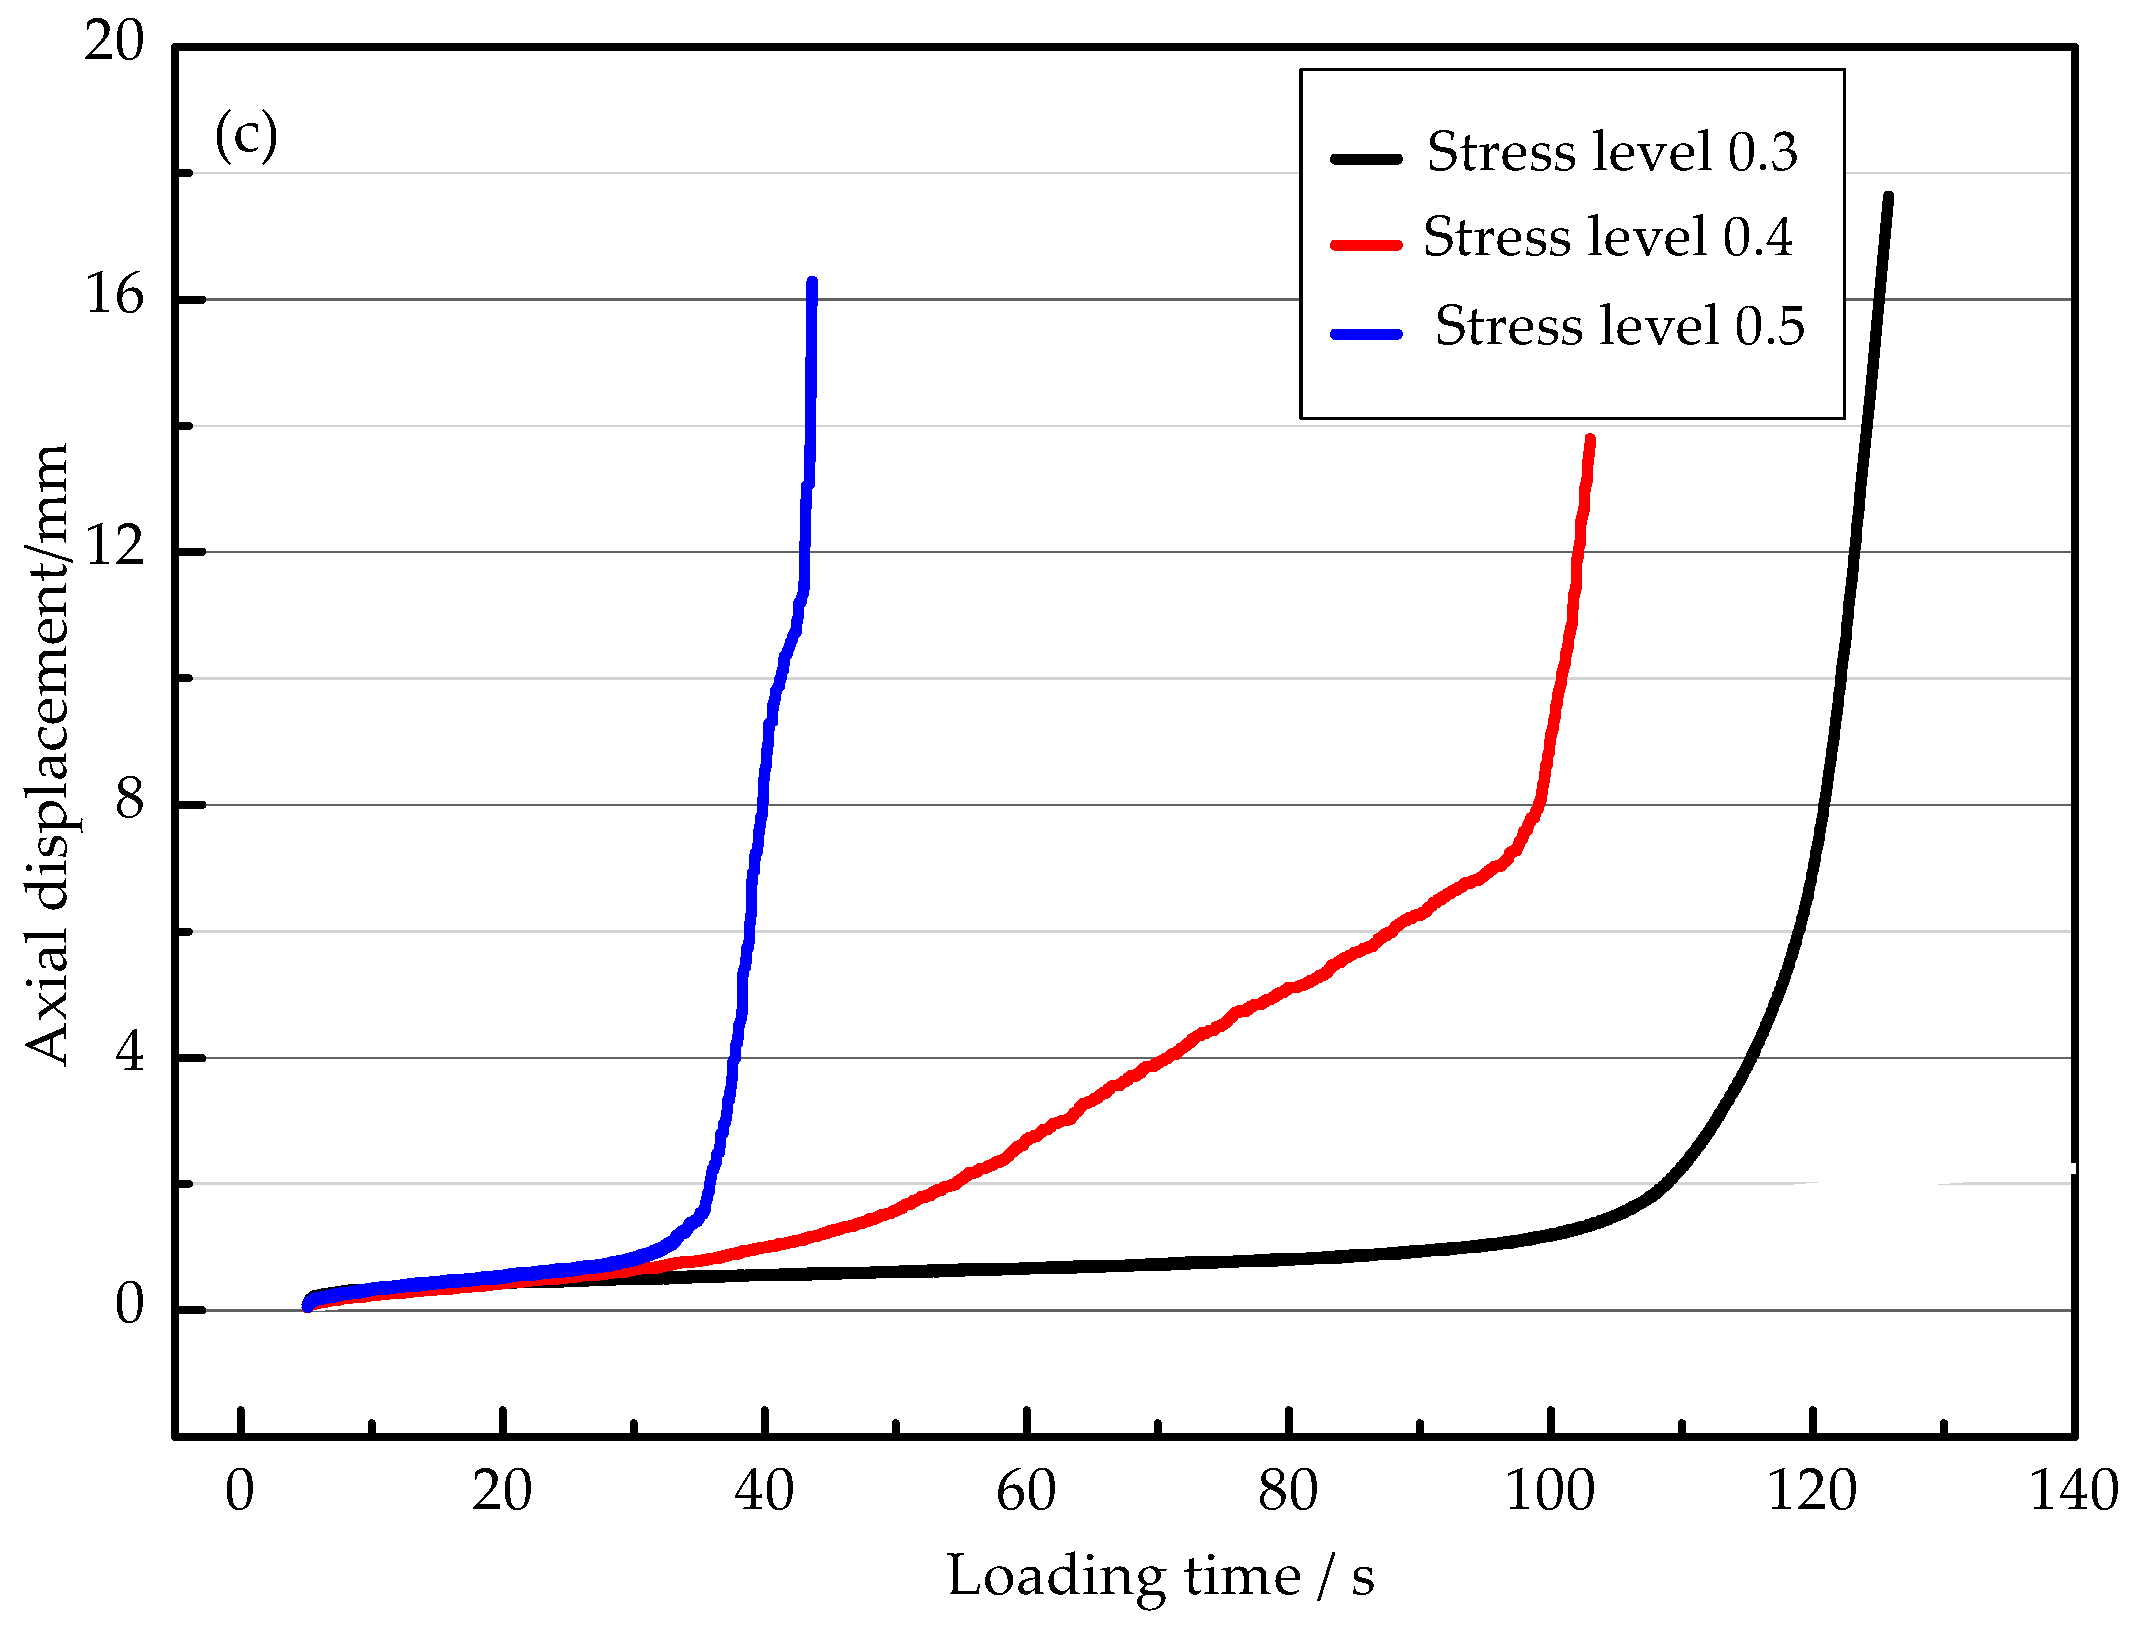
3.3. Effect of Stress Level on Fatigue Performance
3.4. Establishment of Fatigue Equation
3.5. Effects of Void Ratios on Fatigue Performance
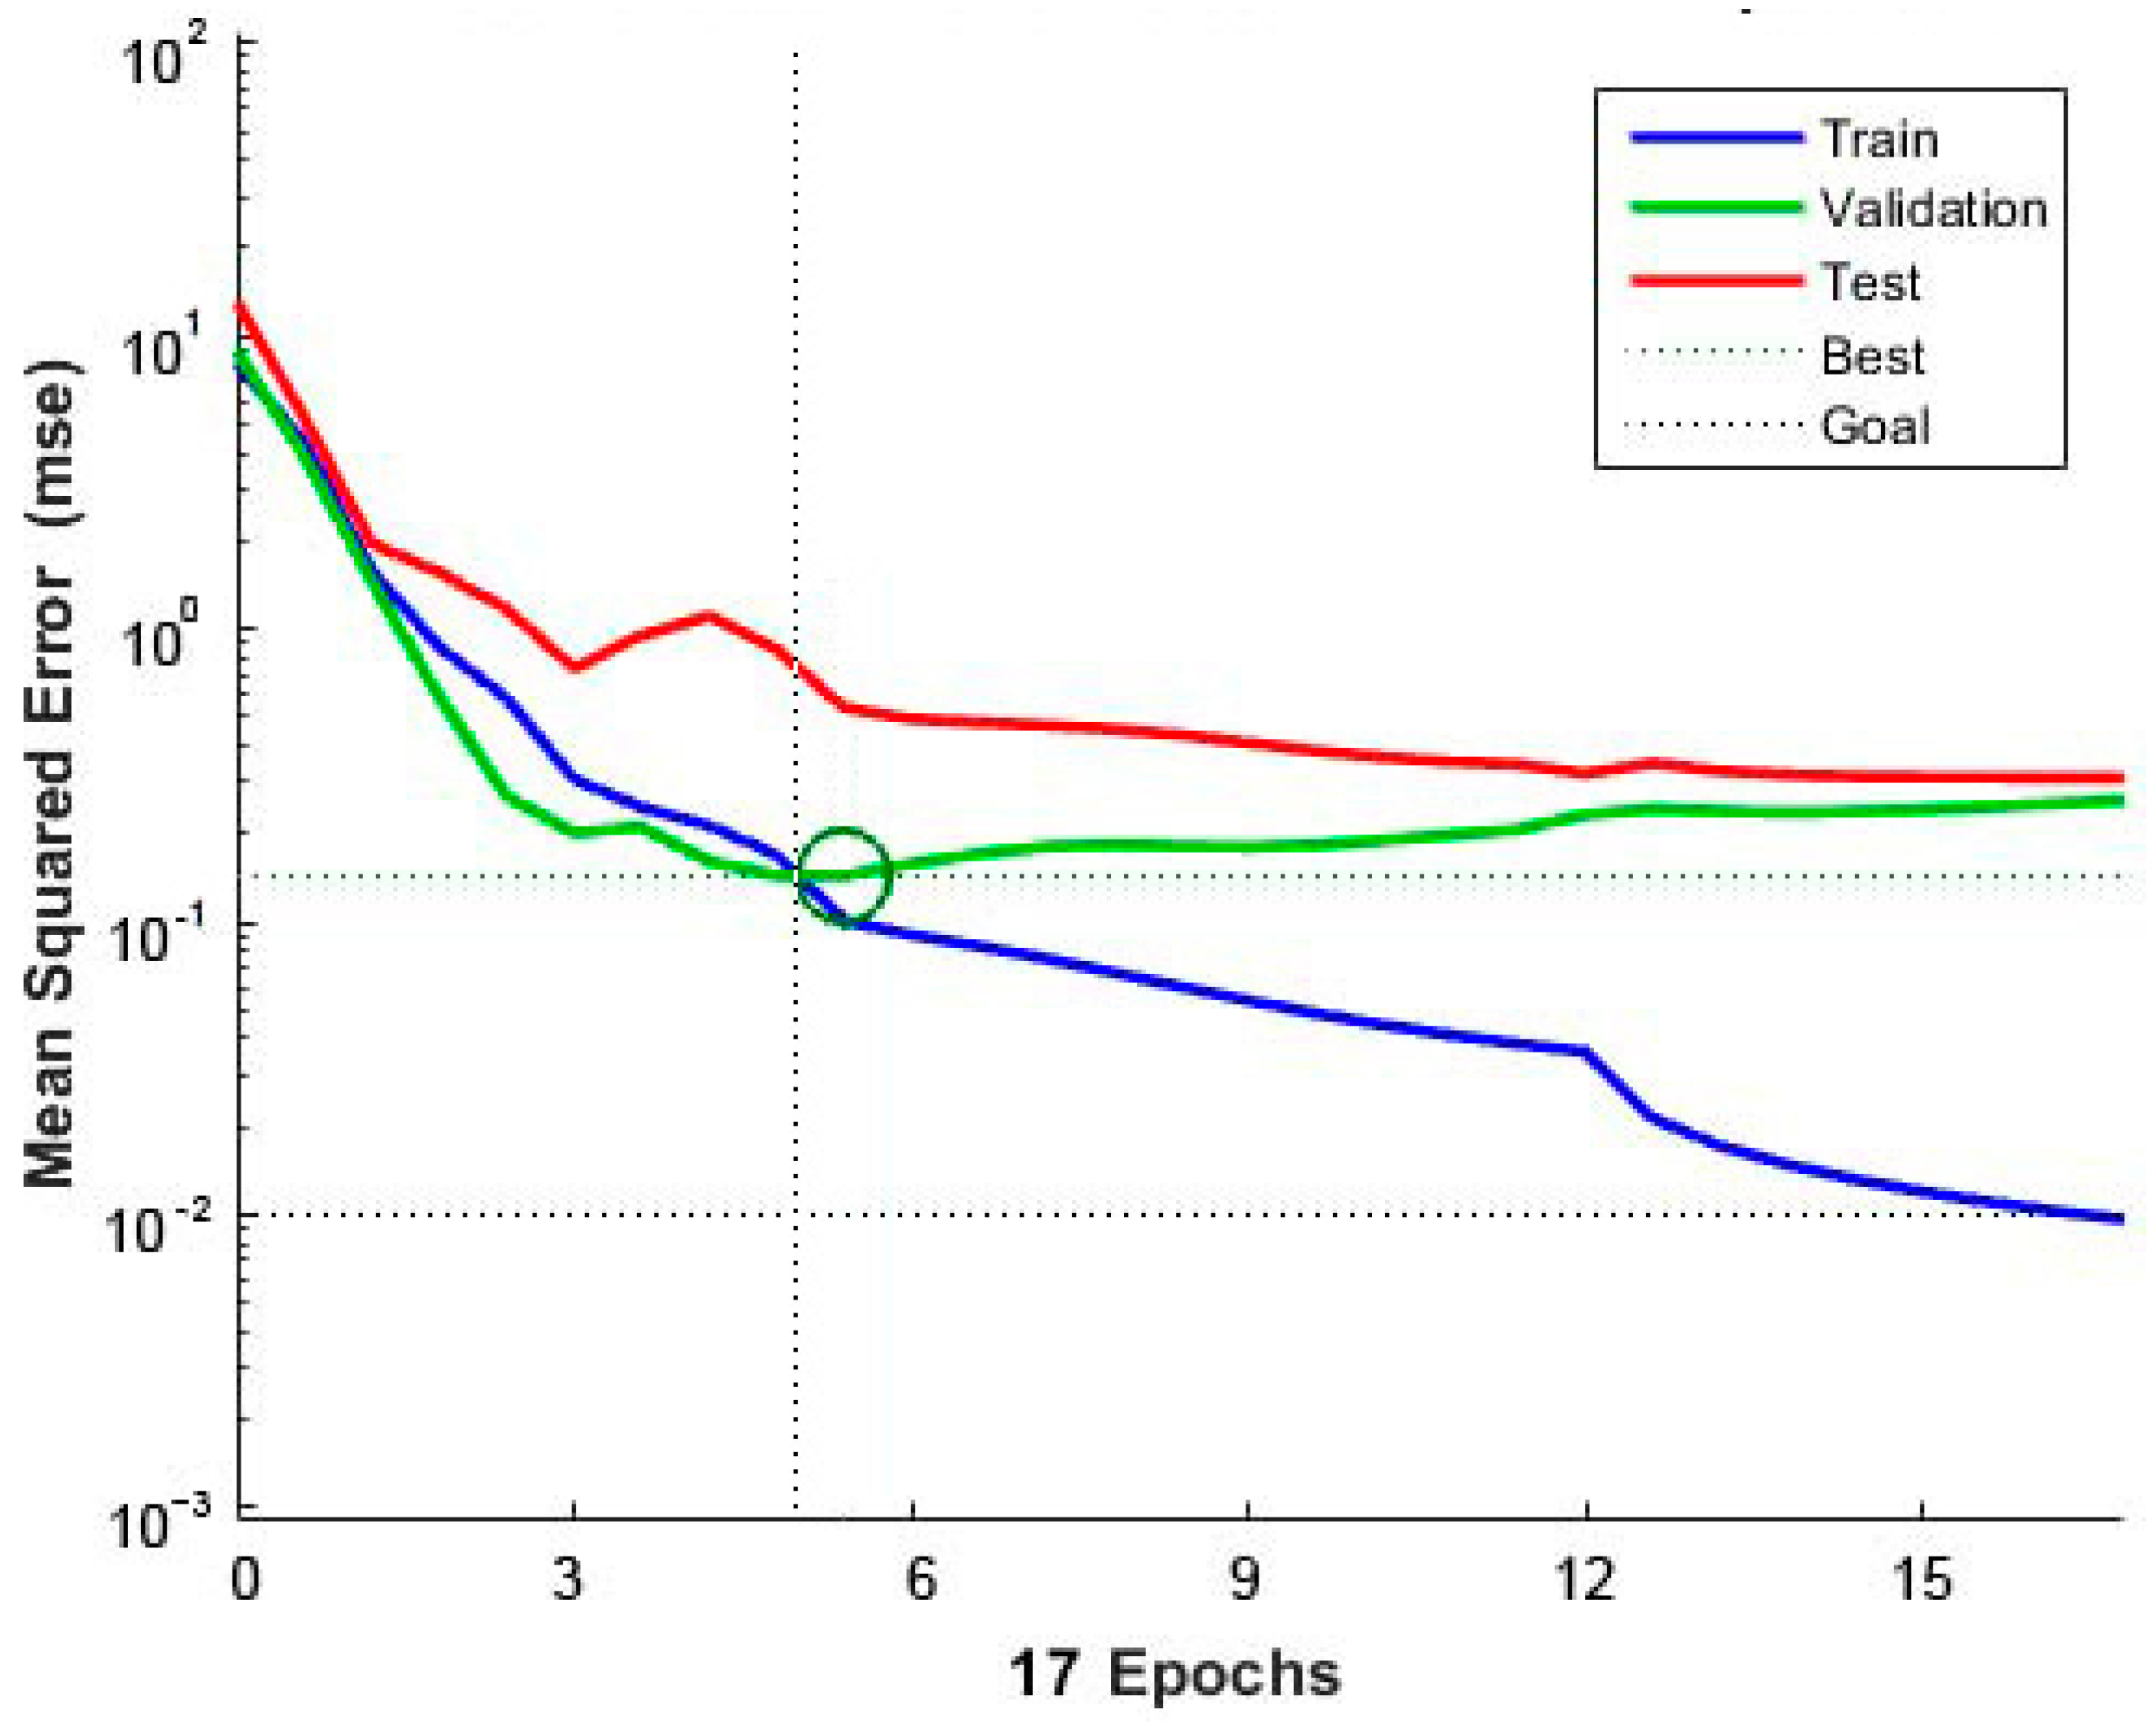
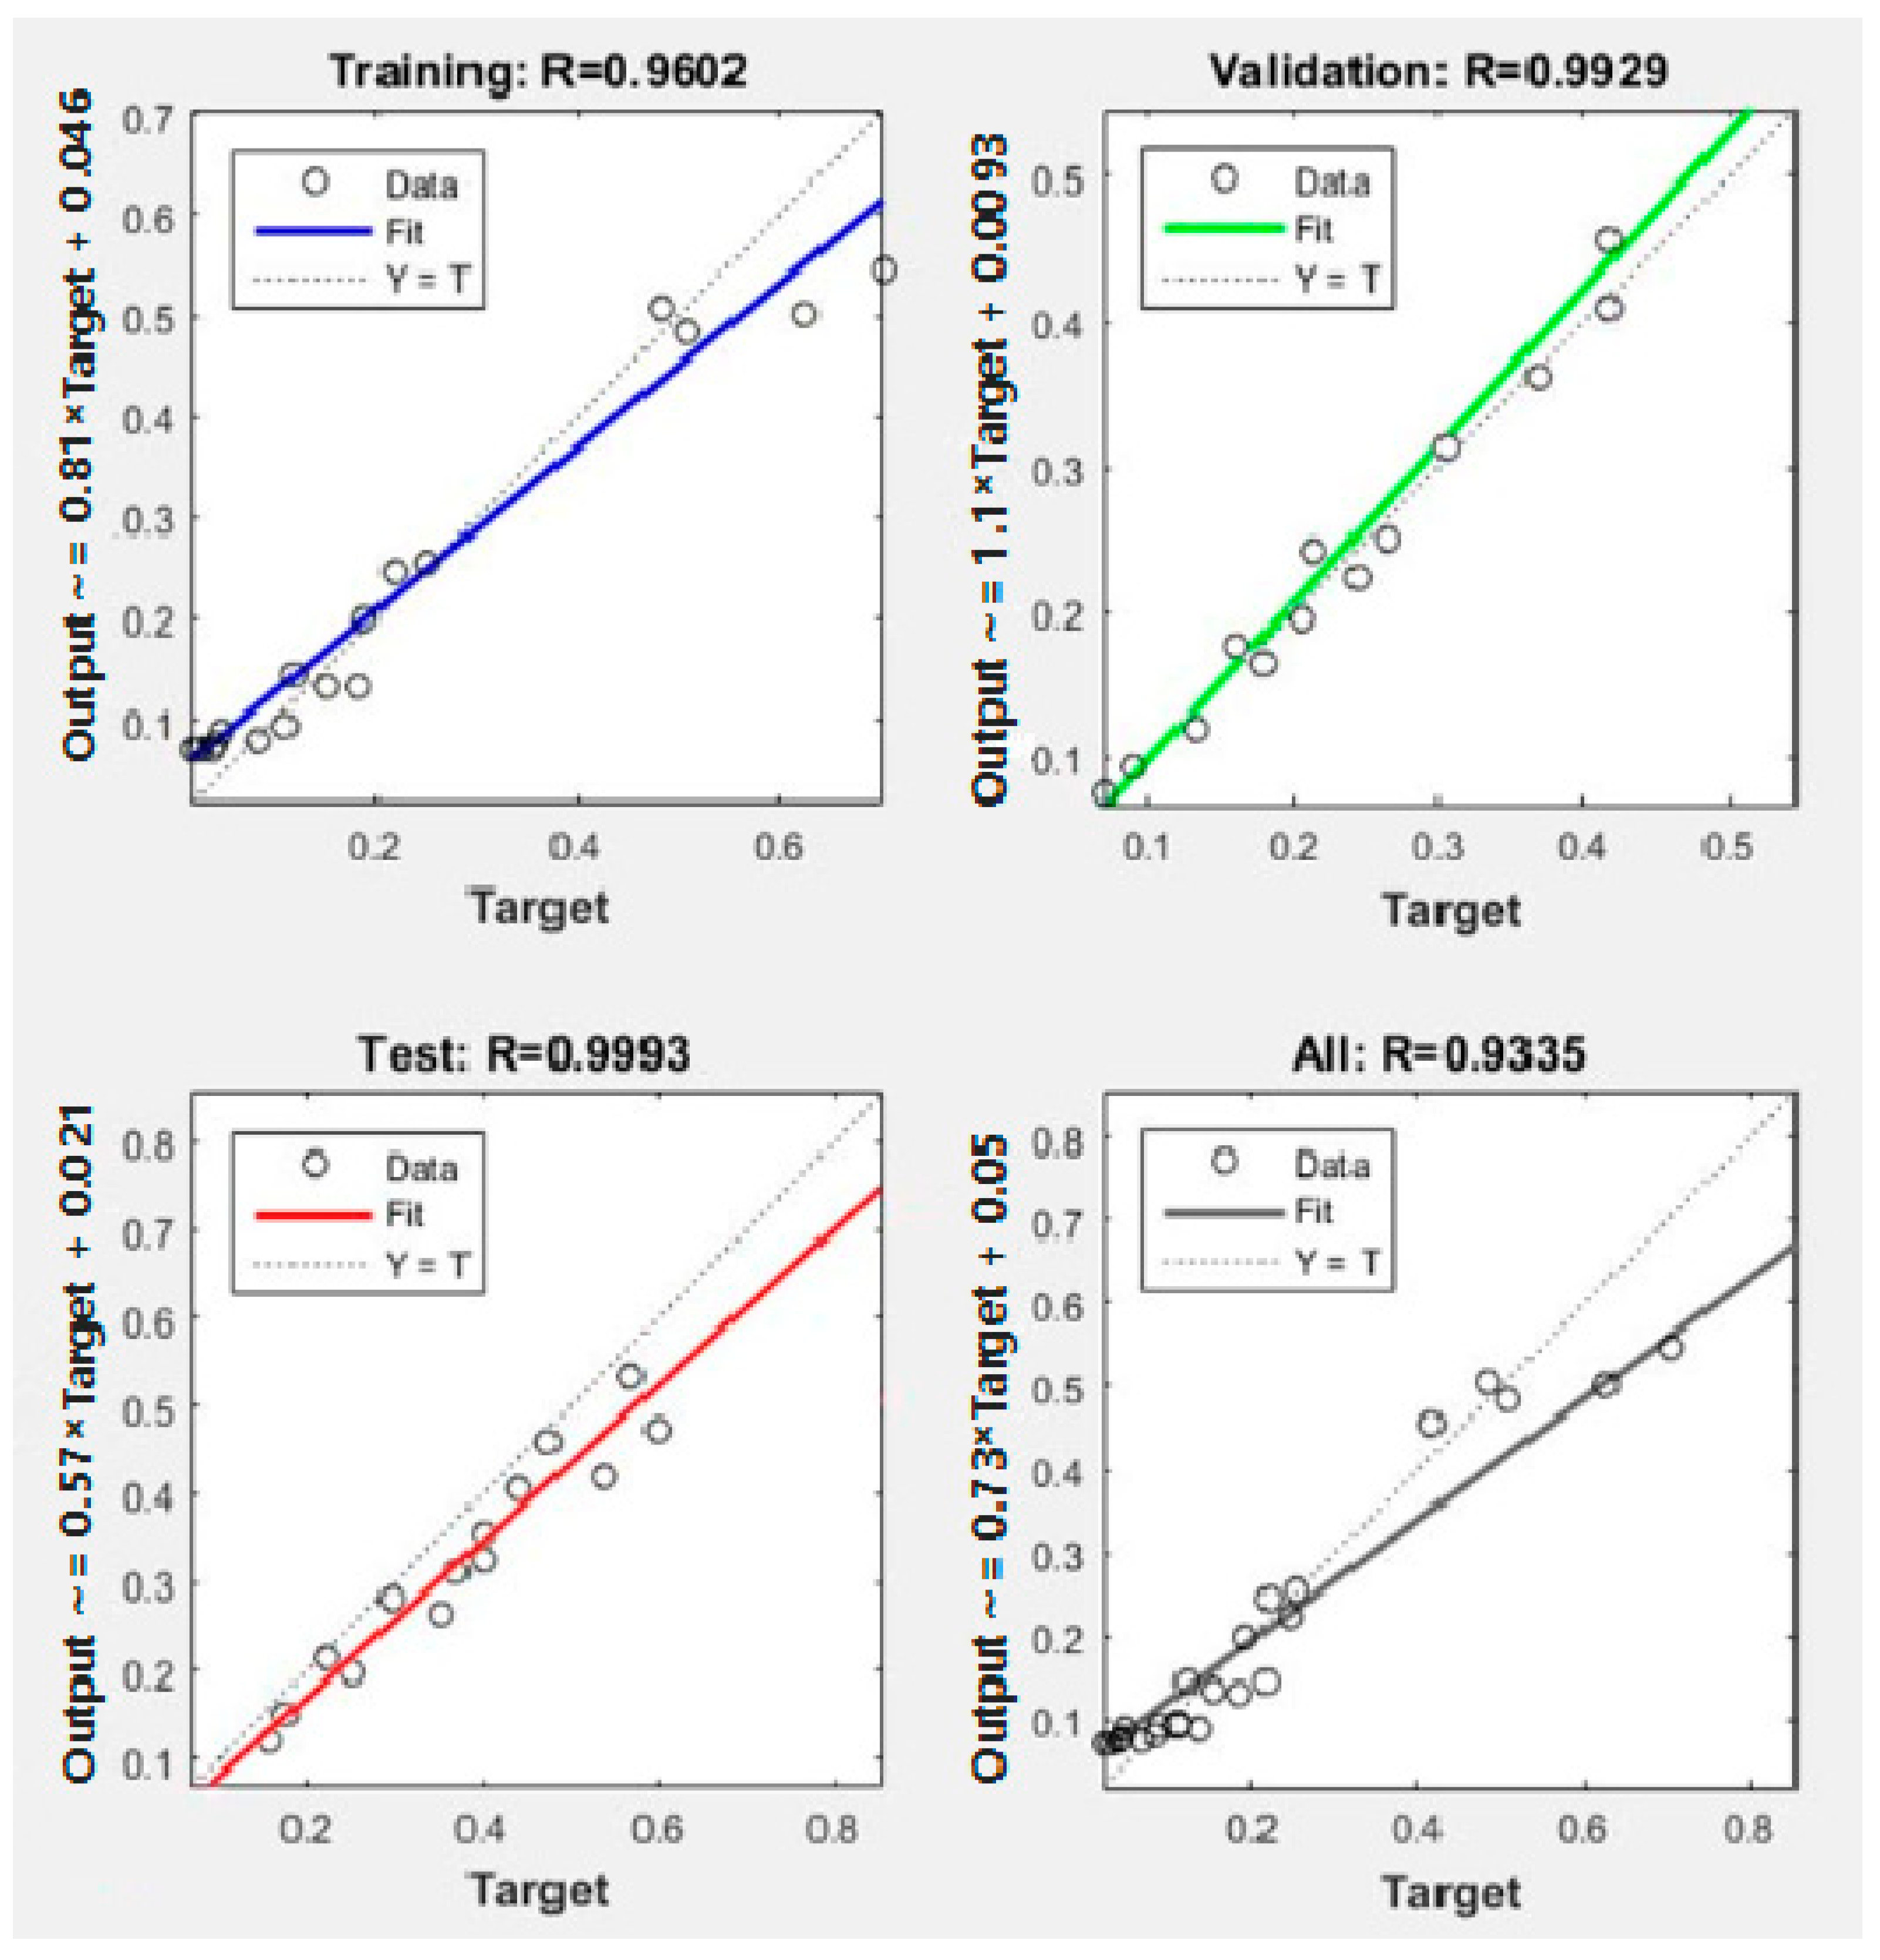
3.6. Fatigue Life Prediction of Different Combinations Based on ANN
4. Conclusions and Recommendation
- (1)
- With the decrease of the CEAM layer thickness, the flexural tensile strength and the maximum load of the combinations increase linearly. The fatigue life of the different thickness combinations decreases with the increase of the stress level and increases with the decrease of the test temperature.
- (2)
- The effect comparison between the stress level and the temperature shows that the 40 mm (HMA) + 40 mm (CEAM) thickness structure combination possesses the best fatigue performance. Under the controlled stress mode, the stiffness of CEAM decreases with the decrease of the temperature; and the fatigue life can be increased with the decrease of the CEAM thickness.
- (3)
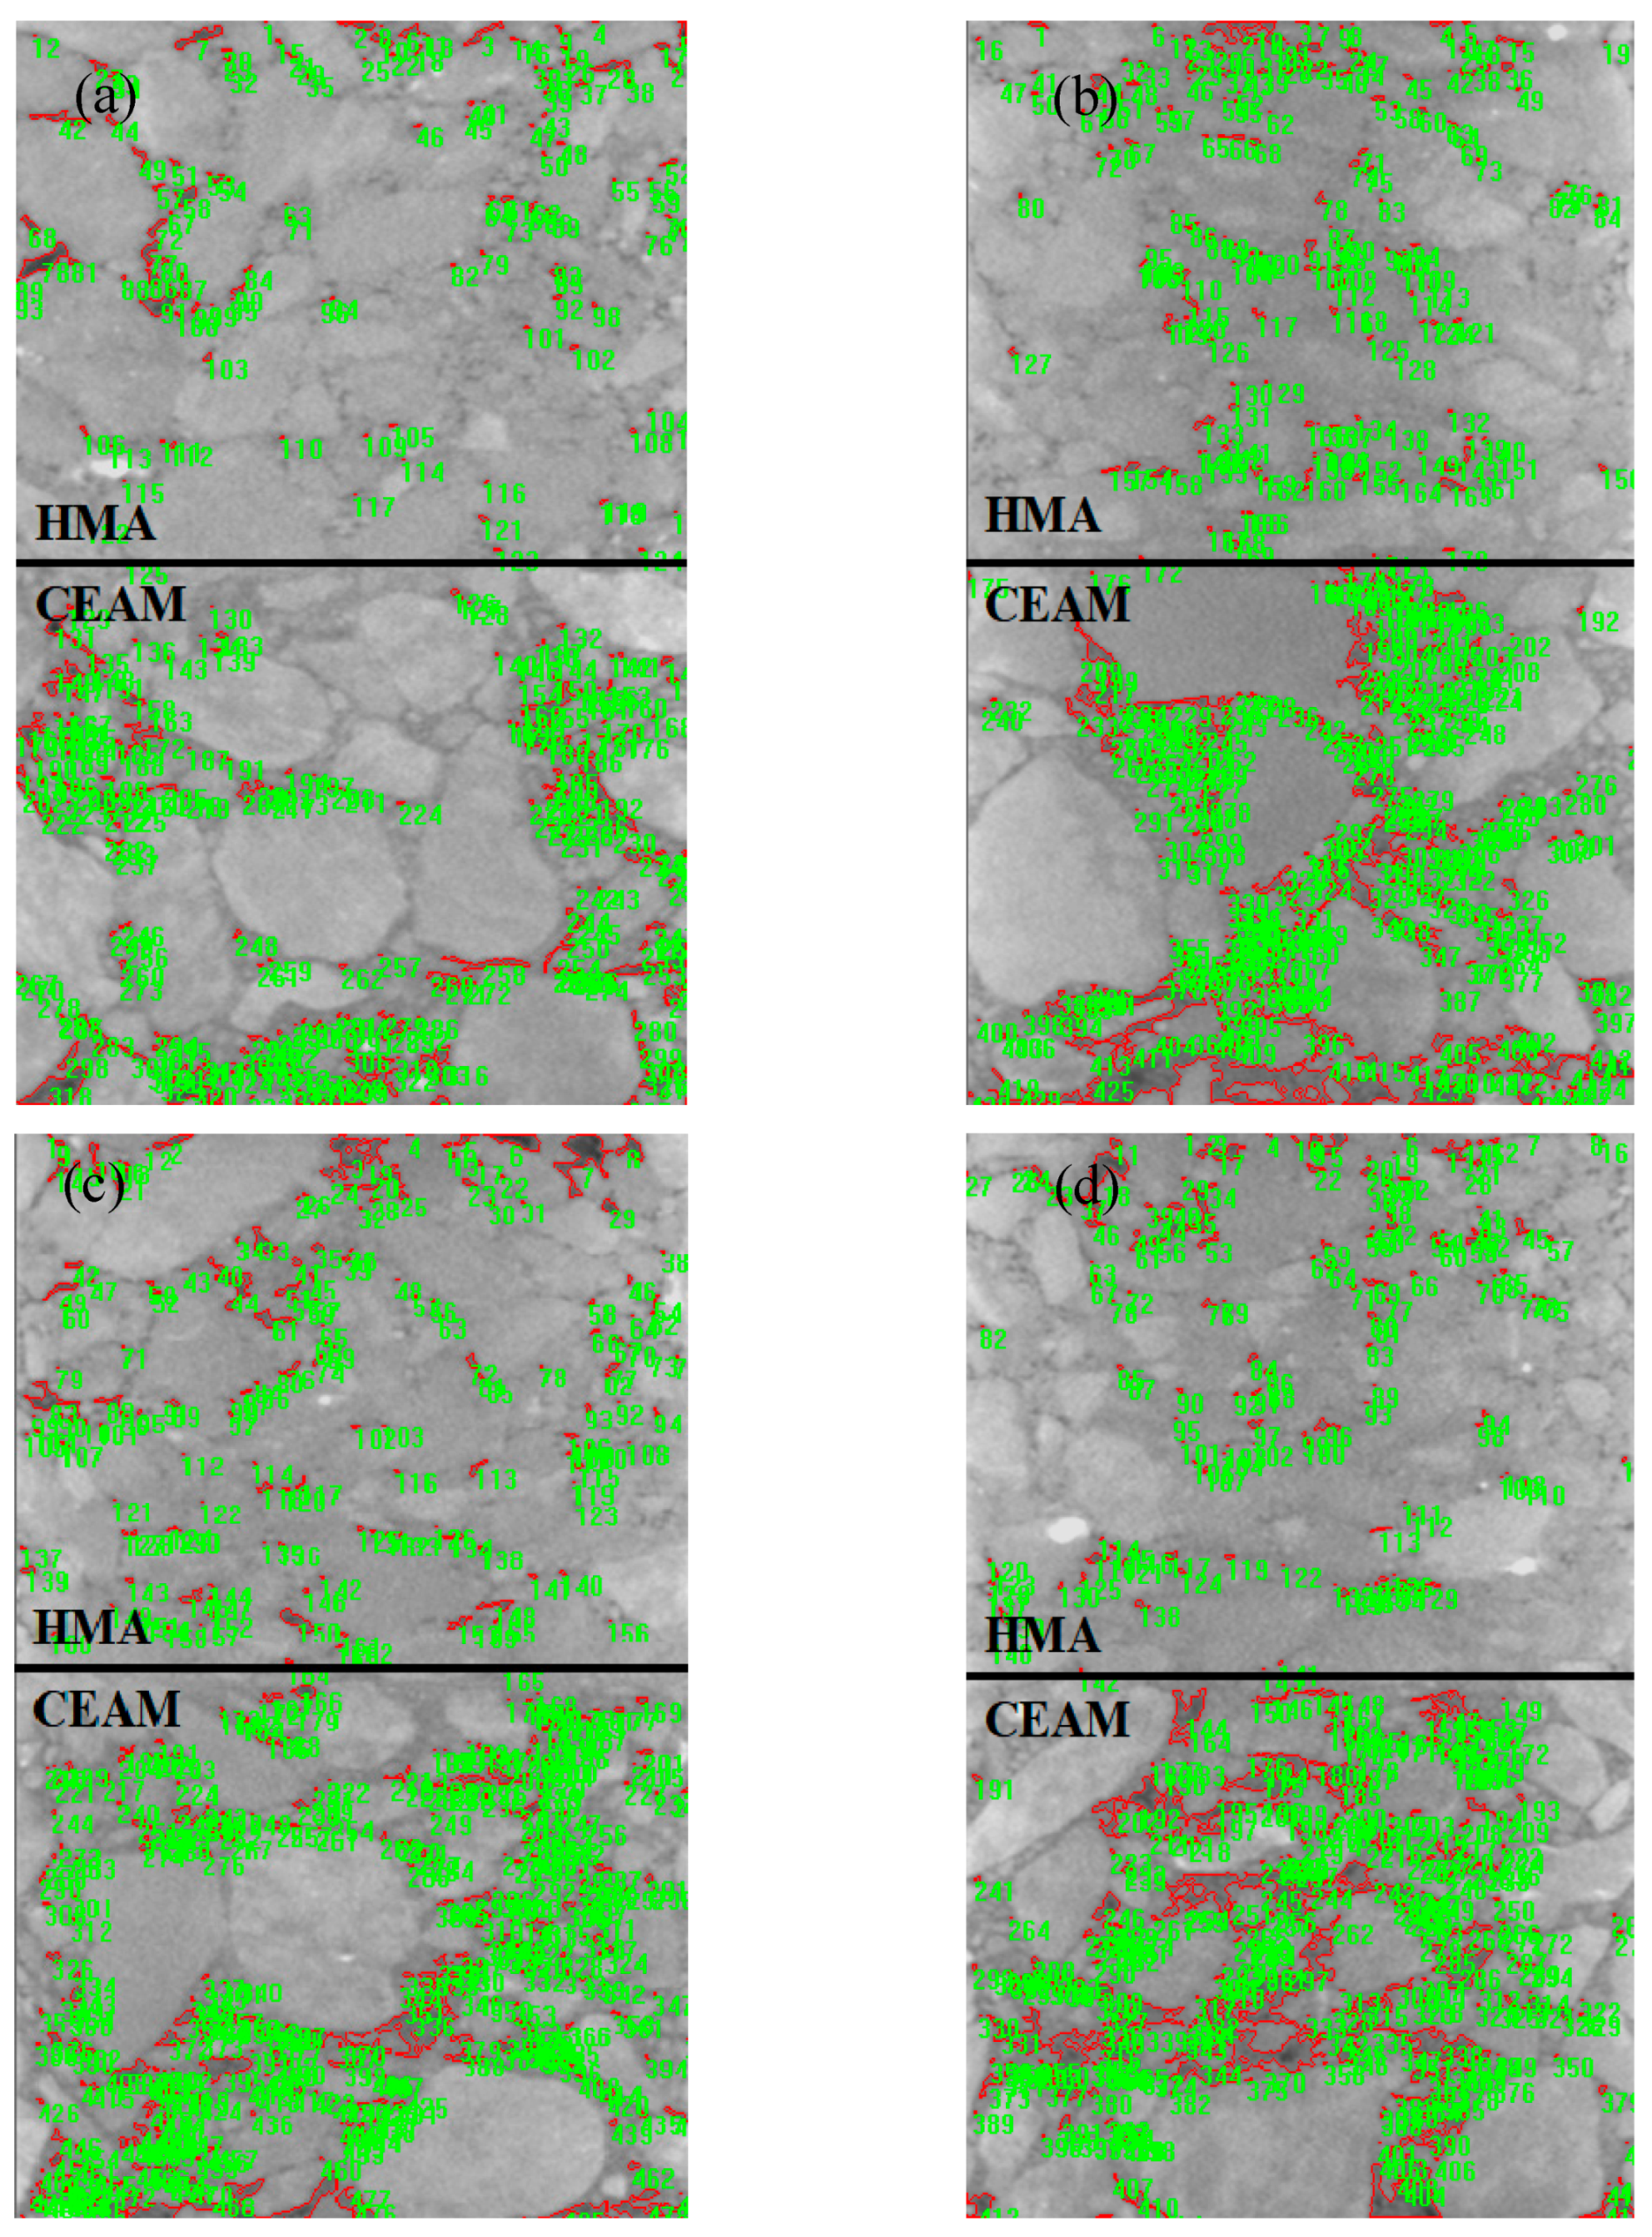
- The results of the X-ray CT test show that the air void of CEAM is greater than that of HMA; and the air voids are mainly distributed at the CEAM layer of the specimens. The air voids of the combinations increase with the increase of the CEAM thickness, which can result in the decrease of fatigue life of the combinations. Therefore, the CEAM layer thickness should be rationally selected in the design of asphalt pavement structure.
- (4)
- The ANN was established to predict the fatigue life of the combinations. It is approximately equal to the experimental results. Therefore, the outputs of the ANN can be used to predict the fatigue life of different structures under different service conditions, in consideration of the different thickness combinations. Of course, the properties of the asphalt mixture can also influence the fatigue results, and they should be considered in the input layer of the neural network. Therefore, the properties of the mixture itself as the parameters of the ANN are recommended to consider in future research.
- (5)
- Although CEAM is widely used in asphalt pavement for its environmental virtues, it can influence the fatigue performance of asphalt pavements as to its void characteristics. It is recommended to use HMA and CEAM combinations and to consider their rational thickness structure combination in CEAM asphalt pavement design.
Author Contributions
Funding
Acknowledgments
Conflicts of Interest
References
- Zhang, Y.; Kong, X.; Hou, S. Study on the rheological properties of fresh cement asphalt paste. Constr. Build. Mater. 2012, 27, 534–544. [Google Scholar] [CrossRef]
- Wang, F.; Liu, Y.; Zhang, Y. Experimental study on the stability of asphalt emulsion for CA mortar by laser diffraction technique. Constr. Build. Mater. 2012, 28, 117–121. [Google Scholar] [CrossRef]
- Wang, Z.; Shu, X.; Rutherford, T.; Huang, B.; Clarke, D. Effects of asphalt emulsion on properties of fresh cement emulsified asphalt mortar. Constr. Build. Mater. 2015, 75, 25–30. [Google Scholar] [CrossRef]
- Moreno-Navarro, F.; Rubio-Gámez, M.C. A review of fatigue damage in bituminous mixtures: Understanding the phenomenon from a new perspective. Constr. Build. Mater. 2016, 113, 927–938. [Google Scholar] [CrossRef]
- Li, L.; Yuan, K.; Wang, T. Study on the fatigue characteristic of mixtures treated by foamed asphalt. J. Build. Mater. 2010, 13, 687–690. [Google Scholar]
- Ghazi, Al.; Kevin, S.; Walaa, M. Fatigue performance: Asphalt binder versus mixture versus full-scale pavements. Can. J. Transp. 2009, 2, 131–163. [Google Scholar]
- Wang, D.; Wang, P.; Wei, X. Fatigue performance and influence factor for cold recycling mixture with emulsified asphalt. J. Beijing Univ. Technol. 2016, 42, 541–546. [Google Scholar]
- Cory, S.; Ali, M.; Lee, H.; Tang, S.; Williams, C.; Schram, S. Effects of high reclaimed asphalt-pavement content on the binder grade, fatigue performance, fractionation process, and mix design. J. Mater. Civ. Eng. 2017, 29. [Google Scholar] [CrossRef]
- Chiara, R.; Cannone, F.A.; Massimo, L.; Wistubab, M. Back-calculation method for determining the maximum RAP content in stone matrix asphalt mixtures with good fatigue performance based on asphalt mortar tests. Constr. Build. Mater. 2016, 118, 364–372. [Google Scholar]
- Jiang, W.; Sha, A.; Pei, J. Study on the fatigue characteristic of porous asphalt concrete. J. Build. Mater. 2012, 15, 513–517. [Google Scholar]
- Chen, J.; Huang, X. Research on influence of distribution characteristics of aggregate on fatigue performance of asphalt mixture. J. Build. Mater. 2009, 12, 442–447. [Google Scholar]
- Wu, S.; Muhunthan, B.; Wen, H. Investigation of effectiveness of prediction of fatigue life for hot mix asphalt blended with recycled concrete aggregate using monotonic fracture testing. Constr. Build. Mater. 2017, 131, 50–56. [Google Scholar] [CrossRef]
- Gao, S.; Zhu, H.; Tang, B. Summary of study on influence factors of fatigue performance of asphalt mixture. Pet. Asph. 2008, 22, 1–6. [Google Scholar]
- Sun, Z.; Yang, G.; Yu, B.; Zhang, M. Study on the fatigue performance of asphalt mixtures for interface layer and underlying surface. J. Shenyang Jianzhu Univ. 2011, 27, 1093–1098. [Google Scholar]
- Delson, B.; Tadeu, L.R.; Laura, M. Research on fatigue cracking growth parameters in asphaltic mixtures using computed tomography. Nucl. Instrum. Methods Phys. Res. 2004, 213, 498–502. [Google Scholar]
- Wasage, T.; Statsna, J.; Zanzotto, L. Repeated loading and unloading tests of asphalt binders and mixes. Road Mater. Pavement Des. 2010, 11, 725–744. [Google Scholar] [CrossRef]
- Deng, S.; Han, X.; Qin, X.; Huang, S. Subsurface crack propagation under rolling contact fatigue in bearing ring. Sci. China Technol. Sci. 2013, 56, 2422–2432. [Google Scholar] [CrossRef]
- Abdulhaq, A.; Abedali, H. Fatigue evaluation of Iraqi asphalt binders based on the dissipated energy and viscoelastic continuum damage (VECD) approaches. J. Civ. Eng. Constr. Technol. 2015, 6, 27–50. [Google Scholar]
- Mahmoud, A.; Reza, S.M.; Massi, A.; Khavandi, K.A. Investigation of fatigue life of asphalt mixtures based on the initial dissipated energy approach. Liq. Fuels Technol. 2017, 35, 107–112. [Google Scholar]
- JTG F40-2017. Technical Specifications for Construction of Highway Asphalt Pavements; China Communications Press: Beijing, China, 2017. [Google Scholar]
- JTG E42-2015. Test Methods of Aggregate for Highway Engineering; China Communications Press: Beijing, China, 2015. [Google Scholar]
- JTG D50-2017. Specifications for Design of Highway Asphalt Pavement; China Communications Press: Beijing, China, 2017. [Google Scholar]
- JTG E20-2011. Standard Test Methods of Bitumen and Bituminous Mixtures for Highway Engineering; China Communications Press: Beijing, China, 2011. [Google Scholar]
- Tong, Z.; Gao, J.; Han, Z.; Wang, Z. Recognition of asphalt pavement crack length using deep convolutional neural networks. Road Mater. Pavement Des. 2018, 19, 1334–1349. [Google Scholar] [CrossRef]
- Lv, S.; Liu, C.; Chen, D.; Zheng, J.; You, Z.; You, L. Normalization of fatigue characteristics for asphalt mixtures under different stress states. Constr. Build. Mater. 2018, 177, 33–42. [Google Scholar] [CrossRef]
- Wang, H.; Zhang, R.; Chen, Y.; Fang, J. Study on microstructure of rubberized recycled hot mix asphalt based X-ray CT technology. Constr. Build. Mater. 2016, 121, 177–184. [Google Scholar] [CrossRef]
- Al-Khateeb, G.G.; Ghuzlan, K.A. The combined effect of loading frequency, temperature, and stress level on the fatigue life of asphalt paving mixtures using the IDT test configuration. Int. J. Fatigue 2014, 59, 254–261. [Google Scholar] [CrossRef]
- Ma, T.; Zhang, Y.; Zhang, D.; Ye, Q. Influences by air voids on fatigue life of asphalt mixture based on discrete element method. Constr. Build. Mater. 2016, 126, 785–799. [Google Scholar] [CrossRef]


| Properties | Unit | Specification [20] | Test Results |
|---|---|---|---|
| Penetration (25 °C, 5 s, 100 g) | 0.1 mm | 60–80 | 72 |
| Softening point (Ring-and-ball method) | °C | ≥46 | 52.3 |
| Ductility at 15 °C | cm | ≥40 | 51 |
| Solubility | % | ≥99.5 | 99.71 |
| Density at 15 °C | g/cm3 | Measured | 1.036 |
| Wax content (distillation method) | % | ≤2.2 | 1.7 |
| Flash Point (COC) | °C | ≥260 | 305 |
| Fineness/(%, 80 μm) | Water Consumption of Normal Consistency/% | Stability (Boiled Method) | Setting Time/min | Compressive Strength/MPa | Flexural Strength/MPa | |||
|---|---|---|---|---|---|---|---|---|
| Initial | Final | 3 d | 28 d | 3 d | 28 d | |||
| 2.4 | 23.2 | qualified | 143 | 201 | 28.7 | 52.5 | 6.2 | 9.3 |
| Properties | Unit | Specification [20] | Test Results | |
|---|---|---|---|---|
| Particle charge type | - | Cationic | Cationic | |
| The remaining percentage on 1.18 mm sieve | % | ≤0.1 | 0.03 | |
| Wrap ratio with coarse aggregate | - | ≥2/3 | >2/3 | |
| Evaporation residue | Residue content | % | 63 | ≥55 |
| Penetration (5 s, 100 g, 25 °C) | 0.1 mm | 75 | 50–300 | |
| Ductility (15 °C) | cm | 47 | ≥40 | |
| Storage stability at room temperature | 1 d | % | 0.63 | ≤1 |
| 7 d | % | 3.24 | ≤5 | |
| Properties | Unit | Specification [21] | Test Results |
|---|---|---|---|
| Apparent density | g/cm3 | ≥2.50 | 2.805 |
| Crushing value | % | ≤20 | 13.2 |
| Wear loss in Los Angeles | % | ≤24 | 18.3 |
| Properties | Unit | Specification [21] | Test Results | |
|---|---|---|---|---|
| Apparent density | g/cm3 | ≥2.50 | 2.826 | |
| Moisture content | % | ≤1 | 0.45 | |
| Particle size | <0.6 mm | % | 100 | 100 |
| <0.15 mm | 90–100 | 98.6 | ||
| <0.075 mm | 75–100 | 83.7 | ||
| Appearance | - | No lumps | No lumps | |
| Hydrophilic coefficient | - | <1 | 0.6 | |
| Properties | Unit | Test Results |
|---|---|---|
| Optimum asphalt content | % | 4.6 |
| Marshall stability | kN | 12.2 |
| Flow value | mm | 3.28 |
| Dynamic stability | times/mm | 942 |
| Residual stability | % | 87 |
| Properties | Unit | Test Results |
|---|---|---|
| Emulsified bitumen content | % | 8.0 |
| Cement content | % | 2.0 |
| Marshall stability | kN | 10.3 |
| Flow value | mm | 3.23 |
| Dynamic stability | times/mm | 1088 |
| Residual stability | % | 83 |
| Parameters | Results |
|---|---|
| Maximum tube voltage | 225 kV |
| Maximum tube current | 3.0 mA (D)/1.0 mA (T); 320 W (D)/64 W (T) |
| Operation mode | Cone beam scanning and digital imaging |
| Magnification | 200 times (D)/100 times (T) |
| Specimen size | Length: 50 mm–100 mm; Width: 50 mm; Height: 80 mm |
| Pixel size | 1024 × 1024 (200 × 200 µm2) |
| Filter combination | Al: 1 mm; Cu: 1 mm; Fe: 0.5 mm; Sn: 0.5 mm |
| Dimension precision | <5 µm |
| Combinations | Temperature (°C) | Regression | |
|---|---|---|---|
| C1 (40 mm + 40 mm) | 5 | 0.934 | |
| 15 | 0.997 | ||
| 25 | 0.972 | ||
| C2 (30 mm + 50 mm) | 5 | 0.932 | |
| 15 | 0.928 | ||
| 25 | 0.979 | ||
| C3 (20 mm + 60 mm) | 5 | 0.95 | |
| 15 | 0.992 | ||
| 25 | 0.997 |
| Different Depths of the Specimens/mm | Air Voids of the Mixtures/% | |
|---|---|---|
| HMA | CEAM | |
| 50 | 1.9 | 7.7 |
| 100 | 2.4 | 8.5 |
| 150 | 2.6 | 8.6 |
| 200 | 2.2 | 8.3 |
| Temperature (×40)/°C | Stress Level | Fatigue Life of C1 (×40,000) Nf/Times | Fatigue Life of C2 (×40,000) Nf/Times | Fatigue Life of C3 (×40,000) Nf/Times | |||||
|---|---|---|---|---|---|---|---|---|---|
| Test Data | Prediction | Test Data | Prediction | Test Data | Prediction | ||||
| 0.125 | 0.20 | 0.878 | 0.766 | 0.560 | |||||
| 0.25 | 0.862 | 0.762 | 0.551 | ||||||
| 0.30 | 0.857 | 0.849 | 0.704 | 0.702 | 0.484 | 0.479 | |||
| 0.35 | 0.450 | 0.444 | 0.383 | ||||||
| 0.40 | 0.219 | 0.226 | 0.191 | 0.196 | 0.152 | 0.148 | |||
| 0.45 | 0.120 | 0.106 | 0.097 | ||||||
| 0.50 | 0.124 | 0.093 | 0.111 | 0.092 | 0.084 | 0.091 | |||
| 0.375 | 0.20 | 0.705 | 0.628 | 0.553 | |||||
| 0.25 | 0.664 | 0.516 | 0.478 | ||||||
| 0.30 | 0.626 | 0.615 | 0.508 | 0.513 | 0.417 | 0.416 | |||
| 0.35 | 0.441 | 0.304 | 0.290 | ||||||
| 0.40 | 0.245 | 0.234 | 0.185 | 0.179 | 0.134 | 0.142 | |||
| 0.45 | 0.111 | 0.087 | 0.074 | ||||||
| 0.50 | 0.046 | 0.043 | 0.041 | 0.043 | 0.036 | 0.040 | |||
| 0.625 | 0.20 | 0.500 | 0.458 | 0.350 | |||||
| 0.25 | 0.493 | 0.386 | 0.283 | ||||||
| 0.30 | 0.337 | 0.343 | 0.251 | 0.254 | 0.218 | 0.236 | |||
| 0.35 | 0.378 | 0.145 | 0.117 | ||||||
| 0.40 | 0.118 | 0.144 | 0.089 | 0.093 | 0.068 | 0.074 | |||
| 0.45 | 0.082 | 0.071 | 0.061 | ||||||
| 0.50 | 0.026 | 0.024 | 0.021 | 0.018 | 0.018 | 0.010 | |||
© 2018 by the authors. Licensee MDPI, Basel, Switzerland. This article is an open access article distributed under the terms and conditions of the Creative Commons Attribution (CC BY) license (http://creativecommons.org/licenses/by/4.0/).
Share and Cite
Wang, Z.; Cai, L.; Wang, X.; Xu, C.; Yang, B.; Xiao, J. Fatigue Performance of Different Thickness Structure Combinations of Hot Mix Asphalt and Cement Emulsified Asphalt Mixtures. Materials 2018, 11, 1145. https://doi.org/10.3390/ma11071145
Wang Z, Cai L, Wang X, Xu C, Yang B, Xiao J. Fatigue Performance of Different Thickness Structure Combinations of Hot Mix Asphalt and Cement Emulsified Asphalt Mixtures. Materials. 2018; 11(7):1145. https://doi.org/10.3390/ma11071145
Chicago/Turabian StyleWang, Zhenjun, Linlin Cai, Xiaofeng Wang, Chuang Xu, Bo Yang, and Jingjing Xiao. 2018. "Fatigue Performance of Different Thickness Structure Combinations of Hot Mix Asphalt and Cement Emulsified Asphalt Mixtures" Materials 11, no. 7: 1145. https://doi.org/10.3390/ma11071145