Electromechanical Response of High-Performance Fiber-Reinforced Cementitious Composites Containing Milled Glass Fibers under Tension

Department of Civil and Environmental Engineering, Sejong University, 209, Neungdong-ro, Gwangjin-gu, Seoul 05006, Korea
*
Author to whom correspondence should be addressed.
Materials 2018, 11(7), 1115; https://doi.org/10.3390/ma11071115
Submission received: 23 May 2018
/
Revised: 21 June 2018
/
Accepted: 28 June 2018
/
Published: 29 June 2018
(This article belongs to the Special Issue Electronic Skin and Its Strain Sensing Application)
Abstract
:The self-damage sensing capacity of high-performance fiber-reinforced cementitious composites (HPFRCCs) that blended long- (1 vol %) and medium-length (1 vol %) smooth steel fibers was considerably improved by adding milled glass fibers (MGFs) with a low electrical conductivity to a mortar matrix. The addition of MGFs (5 wt %) significantly increased the electrical resistivity of the mortar matrix from 45.9 to 110.3 kΩ·cm (140%) and consequently improved the self-damage sensing capacity (i.e., the reduction in the electrical resistivity during the tensile strain-hardening response) from 17.27 to 25.56 kΩ·cm (48%). Furthermore, the addition of MGFs improved the equivalent bond strength of the steel fibers on the basis of the higher pullout energy owing to the accumulated cementitious material particles attached to the surfaces of steel fibers.
1. Introduction
Structural health monitoring (SHM) has played a very important role in protecting human lives and the assets of human society from the catastrophic structural collapses associated with the early deterioration of construction materials. At present, SHM mostly utilizes attached and/or embedded sensors; however, their durability is extremely low, especially compared with the long-term service lives of buildings or civil infrastructure, and their sensing area is very limited [1,2].
To overcome these limitations of the sensors used in present SHM systems, much research on the development of smart construction materials with self-sensing capacity has been conducted during the last two decades [3,4,5], although the electromechanical response of cement-based composites under flexure was first reported by Wittmann [6] in 1973.
In order to develop the self-sensing capacity by utilizing the electromechanical response of cement-based composites under various loading conditions, much research has focused on enhancing the electrical conductivity of such composites by adding functional fillers, e.g., carbon fibers, carbon nanofibers, carbon nanotubes, carbon black, and graphite [3,7,8,9,10]. Cement-based composites containing carbon materials have demonstrated an excellent self-strain or -damage sensing capacity and produced superior mechanical properties including a high strength and toughness [11,12,13,14,15,16,17,18,19,20,21,22,23]. The gauge factor (approximately 60) of continuous carbon fiber-reinforced cement composites (CFRCs) is 30 times greater than that (approximately 2) of conventional strain gages [24]. Furthermore, cement-based composites containing short carbon fibers have produced much higher gauge factors (up to 700) under compressive, tensile, and flexural loads [25]. Cement-based composites containing nanomaterials, e.g., carbon nanotubes and carbon nanofibers, have also demonstrated a high self-strain or -damage sensing capacity [4,14,15,19,20,21,22,26,27,28,29,30,31,32], even though achieving a uniform distribution of nanomaterials within cement-based composites remains quite challenging [33]. The distribution of nanomaterials could be enhanced by using surfactants, sonicators, and/or mechanical mixing procedures [10,12,15,22,27,30,34,35,36]. However, the self-sensing capacity of cement-based composites containing carbon materials is still limited within their elastic region owing to their brittle failure [34,37,38].
Steel fiber-reinforced cement composites (SFRCs) have also demonstrated self-sensing capacity under various loading conditions owing to the high electrical conductivity of the steel fibers [39,40,41,42,43,44]. The gauge factors of SFRCs under compression and tension were reported to be approximately 200 and 4560, respectively, while those of CFRCs were 350 and 90, respectively [39,45]. Recently, several studies [41,42,43,44] have reported the self-damage sensing capacity under tension of high-performance fiber-reinforced cementitious composites (HPFRCCs) containing steel fibers. The volume content and geometry of steel fibers significantly influenced the self-damage sensing capacity [41,42]. Kim et al. [44] also demonstrated that the self-sensing capacity could be enhanced by applying ultra-high-performance concrete (UHPC) with a high electrical resistivity owing to the very low water:cement ratio and densified microstructure. However, UHPCs are very expensive in comparison to normal concrete or SFRCs [46]. Thus, it is necessary to develop the self-sensing HPFRCCs at a lower cost by utilizing relatively economical materials.
This study aims to further enhance the self-damage sensing capacity of HPFRCCs, using relatively low-cost methods, by adding milled glass fibers (MGFs) to the mortar matrix. The addition of MGFs, which have a low electrical conductivity, is expected to increase the electrical resistivity of the mortar matrix, consequently resulting in a more pronounced reduction in the electrical resistivity when inducing crack formation in matrices. The specific objectives are: (1) to achieve a uniform distribution of MGFs in a mortar matrix, (2) to find the optimal amounts of MGFs for maximizing the self-damage sensing capacity of HPFRCCs, and (3) to characterize the electromechanical response of HPFRCCs containing MGFs.
2. Electromechanical Response of HPFRCCs under Tension
HPFRCCs are typically characterized by unique strain-hardening behavior under direct tension, accompanied by the formation of multiple micro-cracks, as shown in Figure 1. HPFRCCs have demonstrated a much higher strength, ductility, and energy absorption capacity compared with normal concrete or SFRCs. Moreover, the self-damage sensing capacity of HPFRCCs (see Figure 1) can be described as follows: As the tensile strain (ε) increases from 0 at Point A to εcc at Point B, the tensile stress (σ) of HPFRCCs linearly increases from 0 to σcc, whereas the electrical resistivity (ρ) decreases from the initial electrical resistivity (ρ0) at Point A to that at the occurrence of the first crack (ρcc) at Point B. The reduction in the electrical resistivity until Point B is represented as Δρ1 (Figure 1). During the strain-hardening following the occurrence of the first crack in Range C, as the tensile strain increases from εcc at Point B to εpc at Point D, the tensile stress further increases from σcc to σpc, whereas the composite electrical resistivity of the HPFRCCs shows a notable decrease from ρcc to ρpc. The reduction in the electrical resistivity during strain-hardening in Range C is represented by Δρ2 (Figure 1). The total reduction in the electrical resistivity is represented by Δρ.
The electrical resistance of a composite (R) comprises that of both the non-cracked (Rc) and cracked (Rf) parts of the composite [41,42,44], as described in Equation (1) and illustrated in Figure 1. As the number of micro-cracks (ncr) increases during strain-hardening (Range C in Figure 1), Rc would decrease along with the decreasing total length of the non-cracked part (shown in Figure 1), whereas Rf would increase along with the increasing length of the cracked parts of the composites under tension (ΔLdebond). As Rf is much lower than Rc, the electrical resistance (R) of the specimen within the gauge length consequently decreases as the number of multiple micro-cracks increases.
Here, Ac is the cross-sectional area of the composite, ρc is the electrical resistivity of the composite, Af is the area of the steel fibers, ρf is the electrical resistivity of a steel fiber, and Vf is the volume content of steel fibers.
The reduction in the electrical resistance (ΔR) due to matrix cracking until the post-cracking point can be calculated using Equation (2), since the electrical resistivity of the steel fibers in Rf is much lower than that in Rc, as given by Equation (1) [43,44]:
As can be seen in Equation (2) and Figure 2, to further increase the self-damage sensing capacity of HPFRCCs under tension, the value of ρc should by further increased, in this case by adding MGFs. Thus, in this study, we added MGFs, which have very low electrical conductivity, to the mortar matrix in order to further enhance the electrical resistivity of the composite (ρc).
3. Experimental Program
Figure 3 shows the experimental program designed to investigate the electromechanical response of MGF-containing HPFRCCs under tension. As shown in Table 1, the amount of MGFs varied from 0 to 10 wt % of cement in the matrix composition. The compressive strength (f’ck) and electrical resistivity (ρm) of the mortar matrices, in Table 1, with an optimal amount of superplasticizer, were averaged at least from three specimens. Corresponding to the amount of MGFs added, the amount of superplasticizer was adjusted to facilitate a uniform distribution of MGFs in the matrix by preventing segregation while maintaining a suitable workability. The slump and slump flow of the mortar mixture were also measured. Then, the electromechanical response of the MGF-containing HPFRCCs under tension was investigated by measuring the direct current (DC) electrical resistance of the specimens during direct tensile tests. Single-fiber pullout tests and field-emission scanning electron microscopy (FE-SEM, Model S-4700; Hitachi, Tokyo, Chiyoda-ku, Japan) were utilized to investigate how the addition of MGFs affected the interfacial bond characteristics of steel fibers embedded in mortar matrices.
3.1. Materials and Specimen Preparation
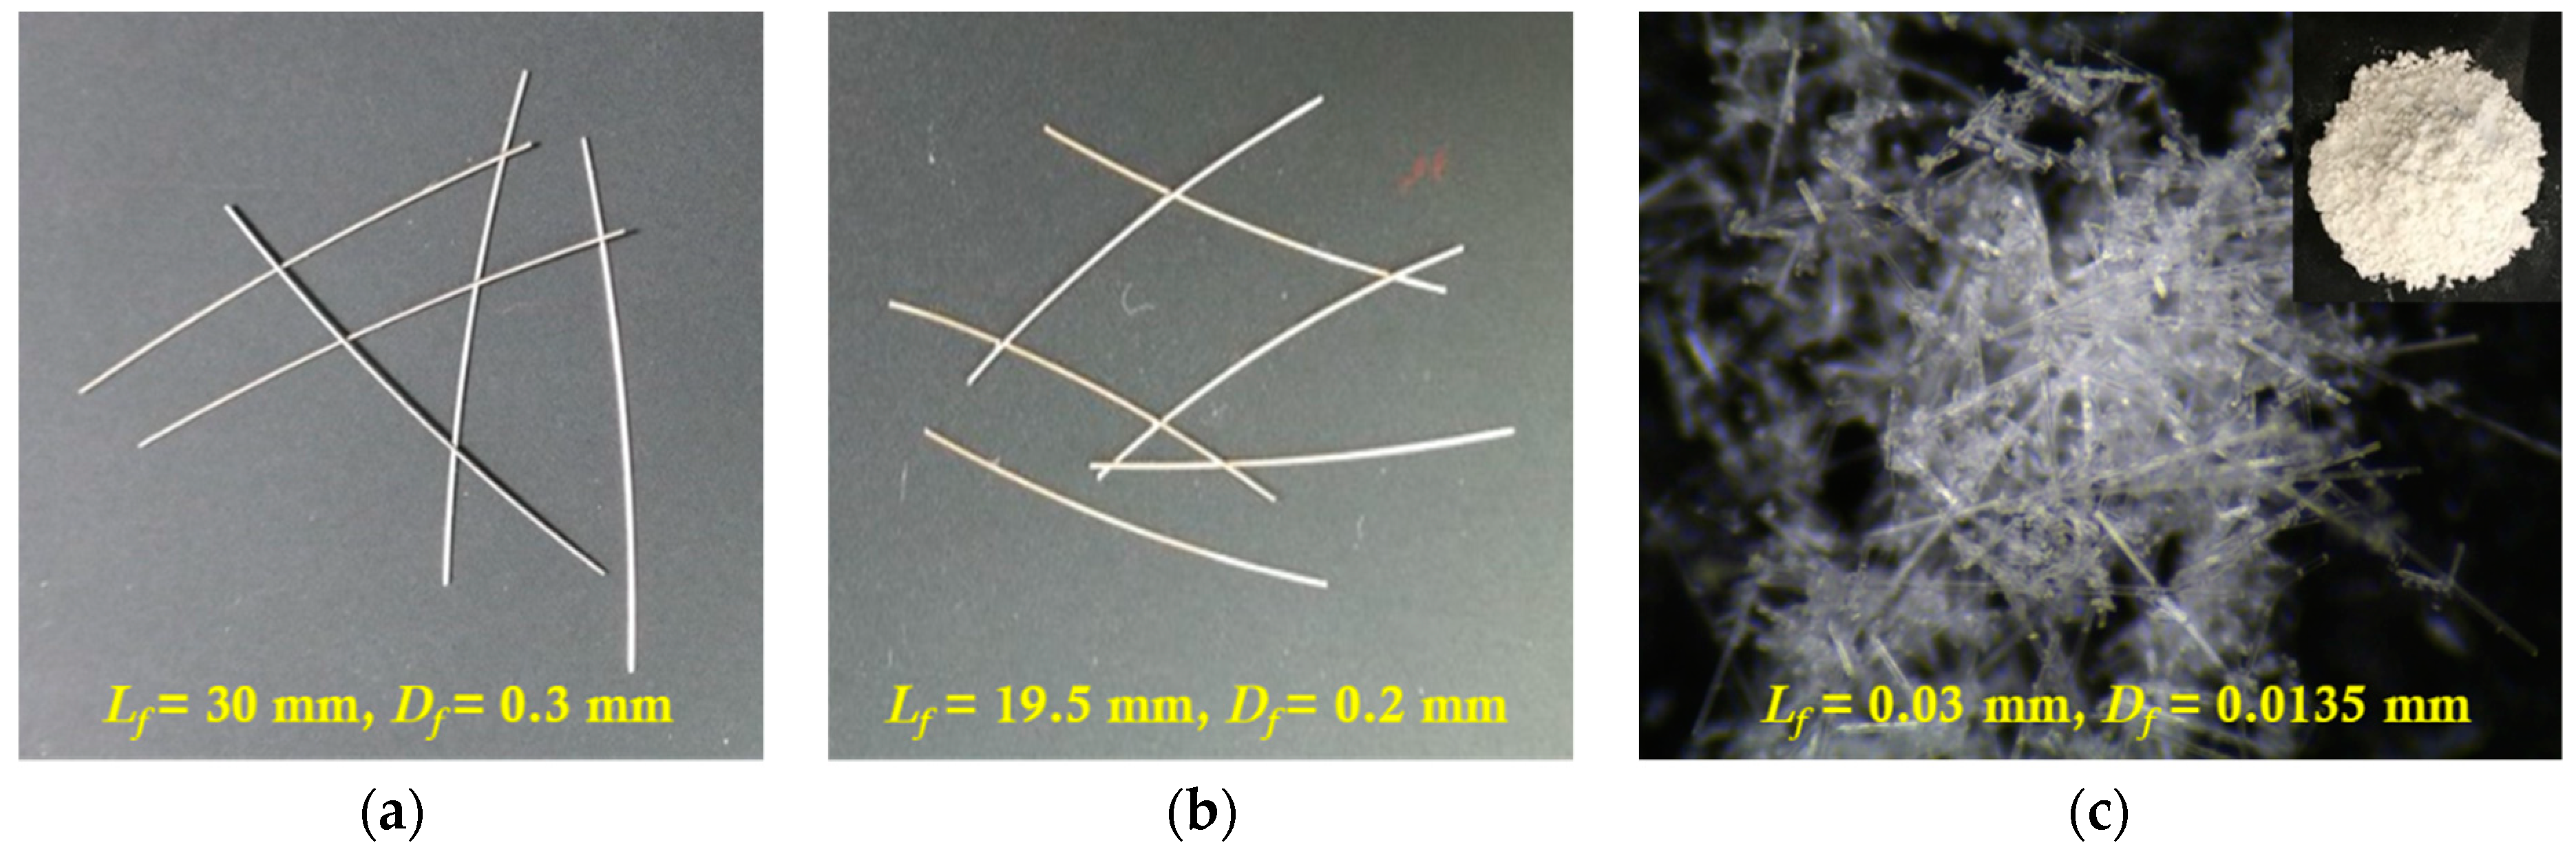
Table 2 provides the physical properties of the fibers used in the experiments, while Table 3 lists the chemical components of MGFs. The length and diameter of the long smooth fibers are 30 and 0.3 mm, respectively, while those of the medium-length smooth steel fibers are 19.5 and 0.2 mm, respectively (Figure 4a,b). The MGFs have an average length and diameter of 0.3 and 0.0135 mm, respectively, as shown in Figure 4c. The average grain diameter of silica sand is 0.43 mm, while the superplasticizer contains 25% solid content.
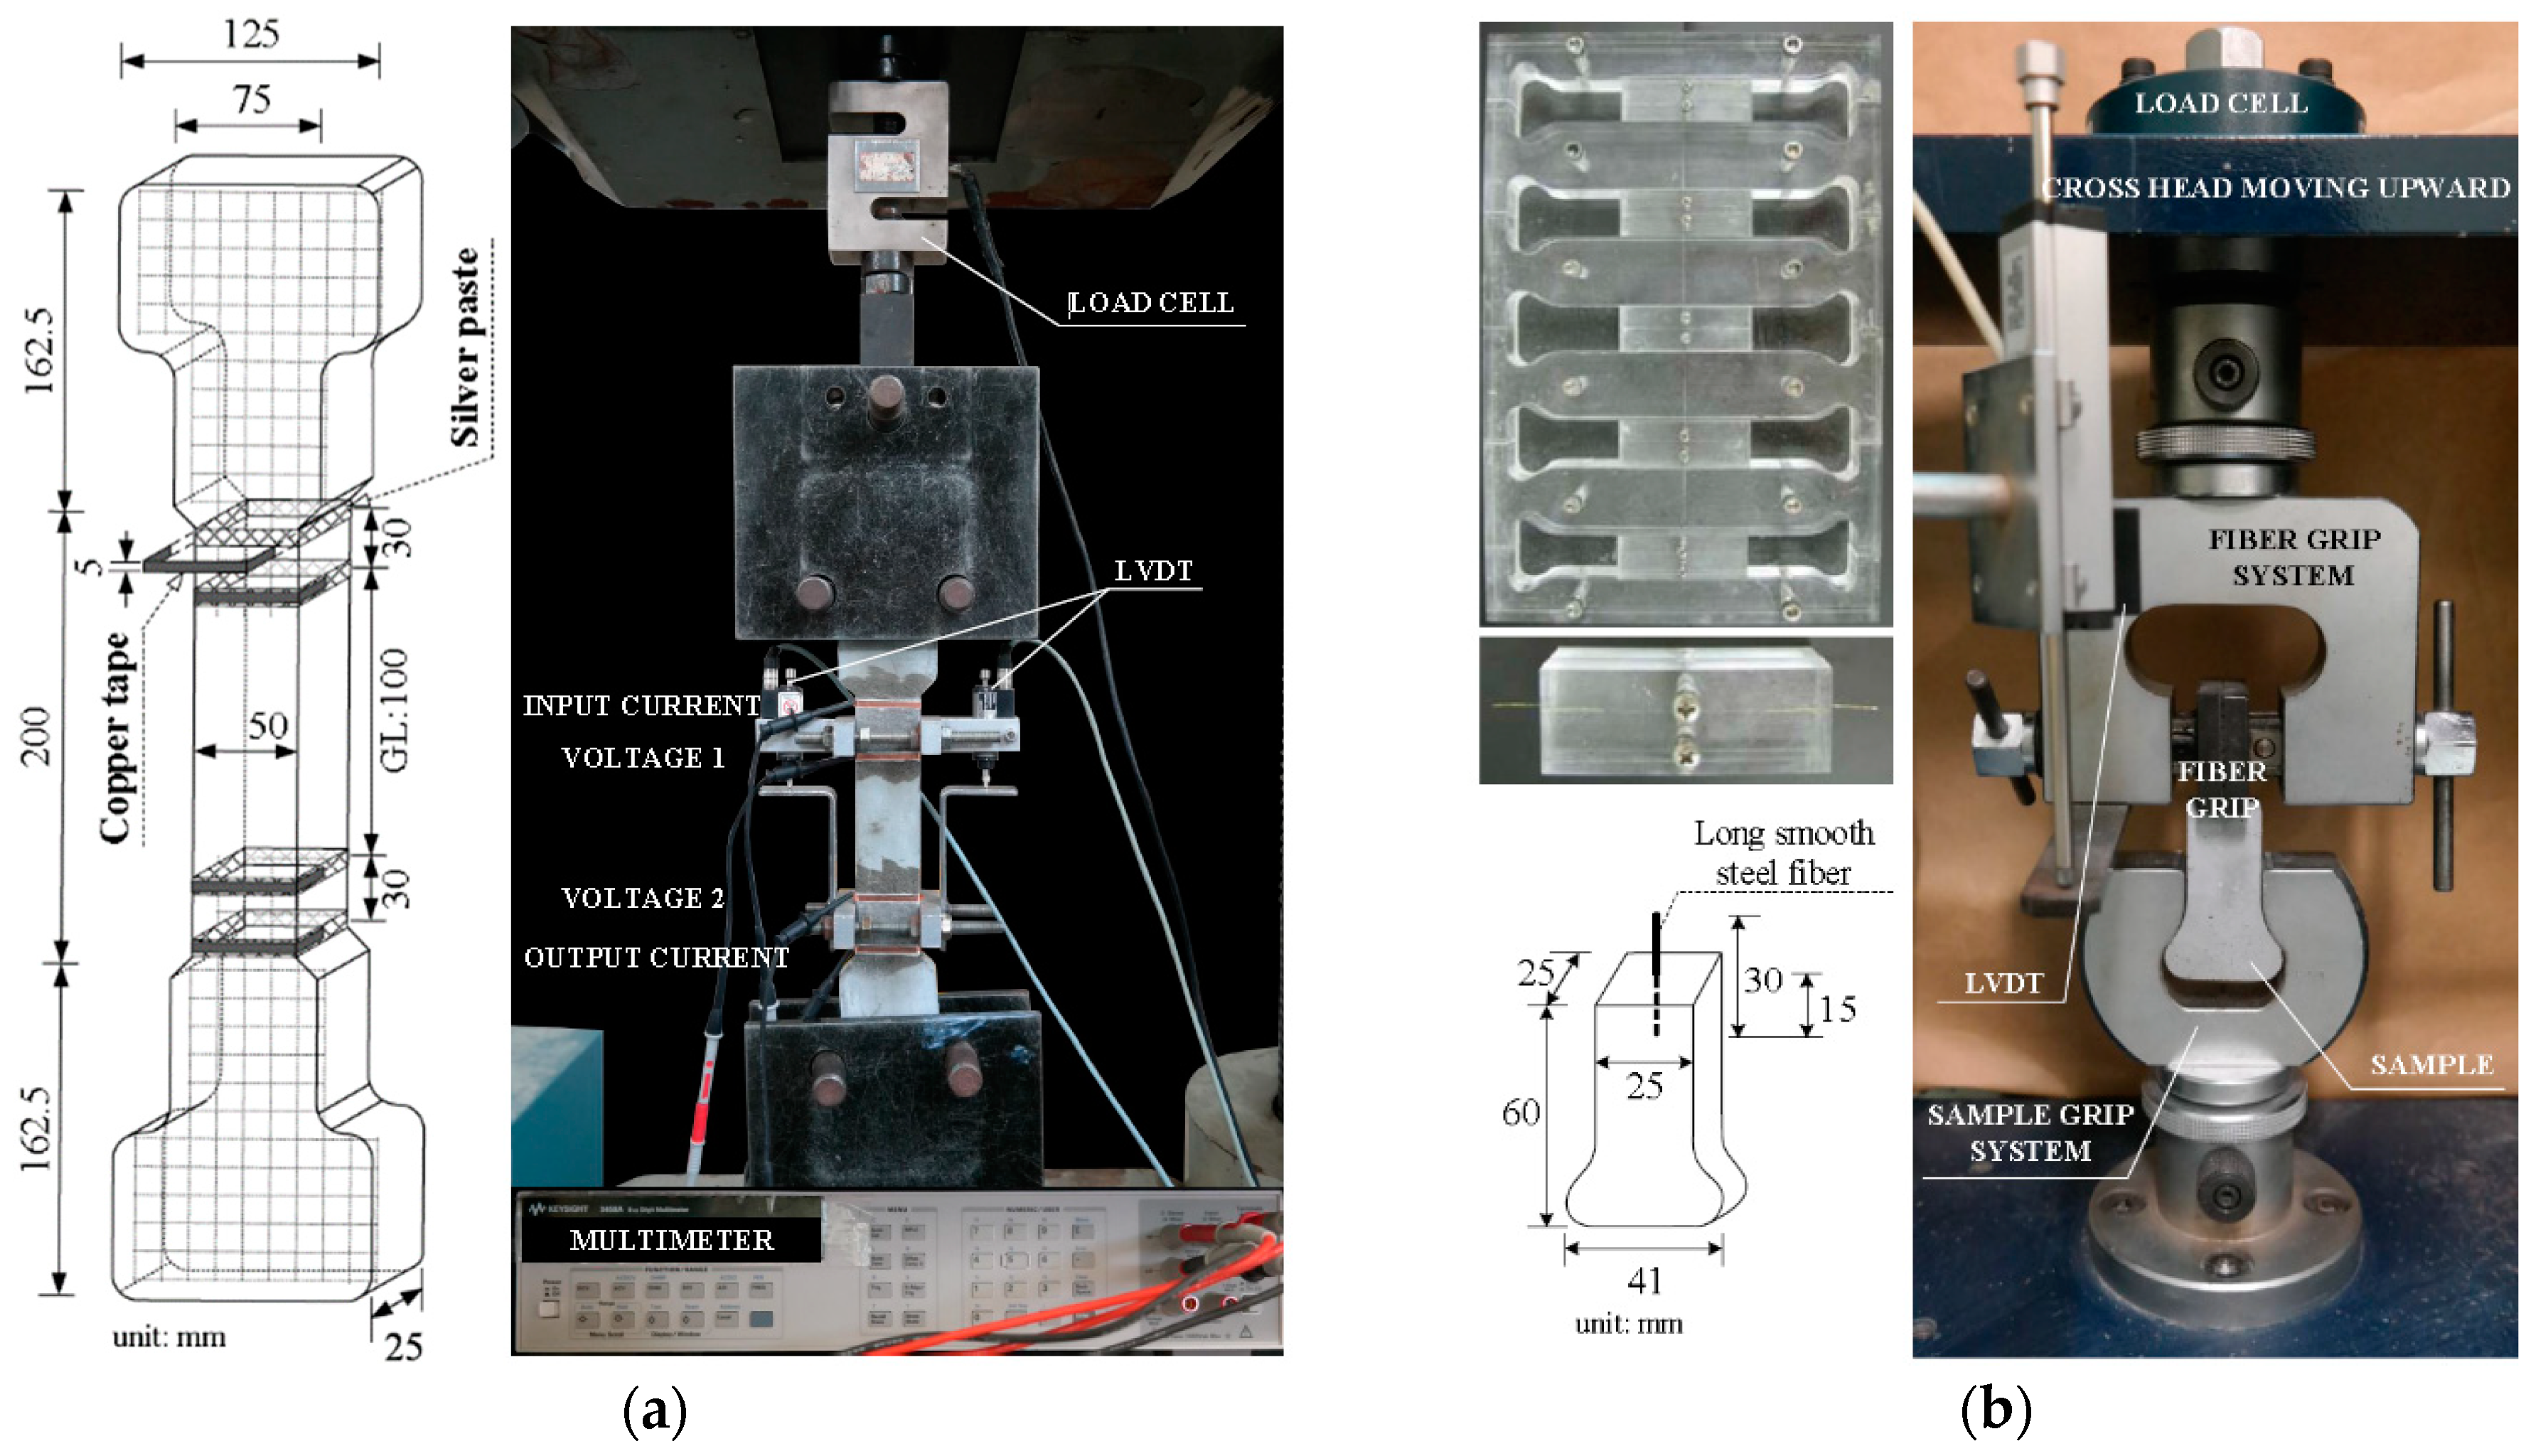
A Hobart-type laboratory mixer (capacity: 20 L) was used to mix the mortar. Cement, silica sand, and fly ash were first dry-mixed for 3 min and 30 s. Then, MGFs were added to the experimental mortar mixtures and dry-mixed for a further 3 min to ensure their uniform distribution. Water was added to the mixture and mixed for a further 4 min. A superplasticizer was added to the mixture and then stirred for 7 min. For direct tensile specimens, medium smooth steel fibers (1 vol %) were added first; then, long smooth steel fibers (1 vol %) were carefully distributed within the mortar mixture by hand. Two layers of steel wire mesh were reinforced at both ends of the tensile specimens to prevent failure outside the gauge length, as shown in Figure 5a. When the mortar mixture containing MGFs and steel fibers showed a suitable workability, it was poured into molds to produce tensile specimens. At least three specimens were prepared for each series.
For single-fiber pullout specimens, a fiber was first installed in a fiber-holding device to maintain a consistent embedment length (15 mm) and inclination angle (90°) of the fiber, as seen in Figure 5b. The mortar mixtures containing MGFs were then poured into molds to produce samples for single-fiber pullout tests. After casting, all specimens were covered with plastic sheets and placed in a laboratory at room temperature (25 °C) and 60% relative humidity for one day prior to demolding. After demolding, the specimens were water-cured at 24 °C for 14 days. Finally, following the direct tensile tests, samples with a diameter of 24 mm were extracted from both ends of the tensile specimens for FE-SEM analysis and underwent epoxy cold-mounting with a specimen diameter of 30 mm, followed by grinding and polishing (as previously described in Reference [47]). After grinding and polishing, the surfaces of the specimens for FE-SEM analysis were coated with platinum.
To measure the electrical resistivity of the tensile specimens, after curing, a layer of silver paste was applied to the surface of the specimen; then, copper tape, as the electrodes, was attached to the silver paste (see Figure 5a). The distance between the two outer electrodes for the input current (50 μA) was 160 mm, whereas that between the two inner electrodes for voltage measurement was 100 mm, as shown in Figure 5a. Each series comprised at least three specimens, which were stored in a chamber at a constant temperature (25 °C) and relative humidity (60%) prior to testing.
3.2. Test Setup and Procedure
The slump flow and slump of the mortar and HPFRCCs containing MGFs were measured in accordance with the respective Korean Industrial Standards, KS F 2594 and KS F 2402. After placing the slump cone horizontally on a flat plate, the cone was filled with the mortar mixture or HPFRCCs containing MGFs. After 30 s, the slump flow was measured as the diameter of the mixture, while the slump was measured as the reduced height of the mixture.
A universal test machine (UTM) with a 300-tonf capacity was used for direct tensile tests, while a UTM with a 500-kgf capacity was used for single-fiber pullout tests. During the tests, the loading speed and data frequency was maintained at 1 mm/min and 5 Hz, respectively. During the tensile tests, the applied load was obtained from a load cell (capacity: 5 tons) located on the top of the specimen, as shown in Figure 5a. The tensile elongation of the specimens was measured by two linear variable differential transformers (LVDTs), while their electrical resistivity was measured using an electrical multimeter (Model 3458A; Keysight, Santa Rosa, CA, USA). Prior to tensioning the specimens, the electrical resistivity was stabilized for at least 20 min to minimize the effects of electrical polarization. During the tensile tests, the temperature and humidity in the laboratory were 9.8 ± 6.9 °C and 30.5% ± 1%, respectively. After direct tensile tests, the equivalent number of multiple micro-cracks of all specimens was calculated by measuring the length of all micro-cracks, which was determined in this study by using Vernier calipers and dividing the total length of micro-cracks by the width of the specimen (50 mm). The length of the micro-crack would be more efficiently calculated by using image analysis techniques later [48,49]. During the single-fiber pullout tests, the pullout load was obtained from the load cell attached to the top of the cross-head, while the slip was measured from the LVDT, as shown in Figure 5b.
FE-SEM (model SU8010; Hitachi, Tokyo, Japan) was used to investigate the microstructures of HPFRCCs containing MGFs (accelerating voltage: 15 kV; image resolution: 1.0 nm). After coating with platinum, the three samples for FE-SEM analysis were stored in a vacuum chamber prior to capturing the images. The interfacial transition zone (ITZ) and pore images were obtained by FE-SEM; and width of the ITZ (between the steel fiber and mortar matrix) and pore sizes were measured in FE-SEM software from at least four different locations per sample.
4. Results
The suitable amounts of superplasticizer for the uniform distribution of MGFs and steel fibers were first determined based on the slump and slump flow tests. The electrical resistance of HPFRCCs is greatly influenced by the distribution of electrically conductive fillers or fibers [15,27,29,31]; thus, the suitable slump flow and slump of HPFRCCs should be carefully determined for the uniform distribution of fillers and fibers because the distribution of fibers is dependent upon the workability of SFRCs [50]. Moreover, the HPFRCC slump was greatly influenced by the accumulation of fibers, whereas the slump flow was more affected by the viscosity and flowability of the matrix and by the distribution of fibers.
Also, the electromechanical response of HPFRCCs was investigated to evaluate the self-sensing capacity of HPFRCCs under tension. The electrical resistivity (ρ) can be calculated from the measured electrical resistance (R) by using Equation (3). ρ is a material property, whereas R is affected by the cross-sectional area and the distance between the electrodes.
Here, A is the cross-sectional area of the specimen (cm2) and L is the distance between the two inner electrodes (cm).
As can be seen in the following equations, all of the mechanical parameters, including σpc, εpc, ncr, and wcr, of HPFRCCs are the functions of τeq [51]:
where λ is the product of several coefficients related to the type of fiber, L is the gauge length of the specimen (=100 mm), η is a factor between 1 and 2 for the crack spacing, σm is the tensile strength of the matrix, α2 is a factor describing the fiber distribution, Ppc is the applied force at the post-cracking point, and Ef is the elastic modulus of a fiber.
Thus, single-fiber pullout tests were performed to investigate the reason for the higher ncr of HPFRCCs containing MGFs (M0.00 and M0.10) compared with the M0.00 series. The equivalent bond strength (τeq) can be calculated using Equation (8).
Here, df is the fiber diameter, Lf is the fiber length, and PW is the pullout energy, i.e., the area under the curve describing the pullout load versus the slip.
4.1. Slump Flow for Uniform Distribution of Both MGFs and Steel Fibers
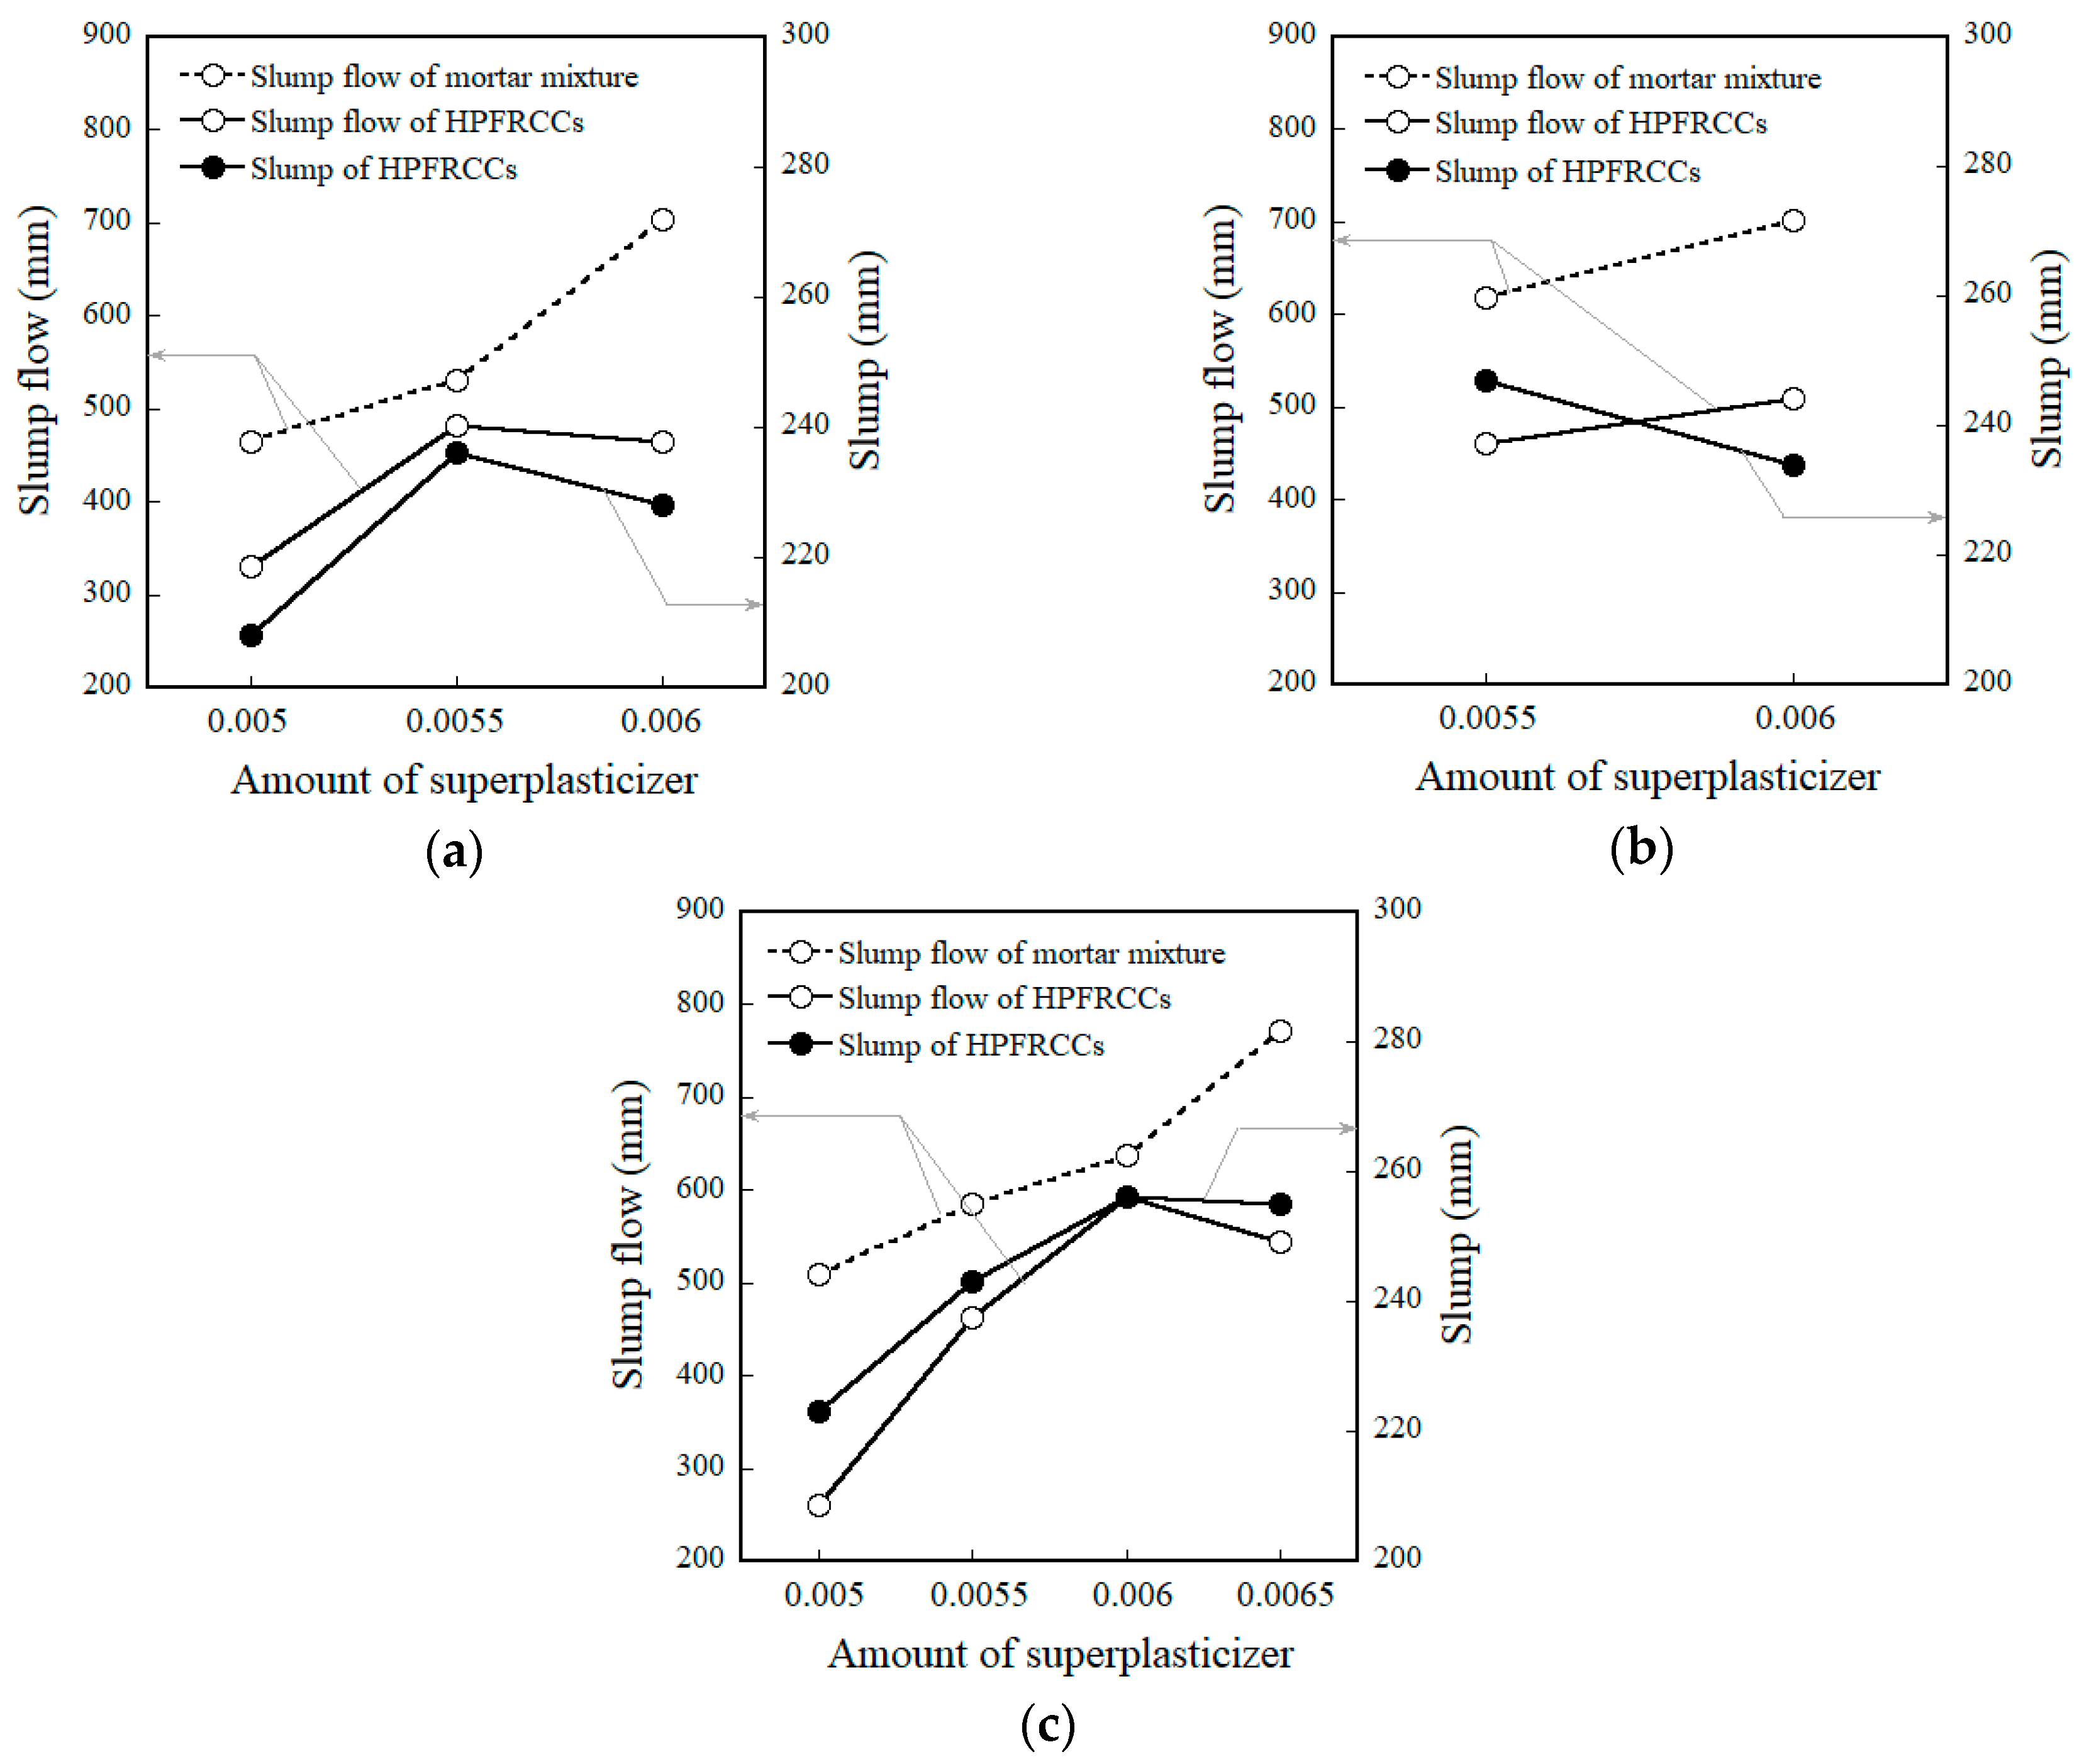
Figure 6 shows the slump flow and slump of the mortar and HPFRCCs, as the amount of superplasticizer increased from 0.005 to 0.0065, corresponding to the amount of MGFs. Figure 6a–c show those for mortar and HPFRCCs containing 0, 5, and 10 wt % MGFs. In Figure 6, the solid lines represent the slump flow and slump of HPFRCCs containing steel fibers, whereas the dotted lines represent the slump flow of the mortar mixture without steel fibers. As the amount of superplasticizer ranged from 0.005 to 0.0065, the slump flow of the mortar mixtures containing only MGFs (except steel fibers) linearly increased regardless of the amount of MGFs. The slump flows of mortar mixtures (M0.00 and M0.05) were measured as 704 and 701 mm, respectively, with a super-plasticizer content of 0.006, reaching a maximum of 772 mm in sample M0.10 containing a superplasticizer content of 0.0065. However, the slump flow and slump of the mortar mixtures containing both MGFs and steel fibers (i.e., HPFRCCs) showed a different tendency. The slump flow and slump of HPFRCCs for M0.00 and M0.10 showed a threshold response to amounts of superplasticizer of 0.0055 and 0.006, respectively. At amounts of superplasticizer greater than these thresholds, the slump flow then decreased for the M0.00 (from 482 to 465 mm) and M0.10 (from 593 to 544 mm) series. The slump also decreased after the superplasticizer thresholds were exceeded for the M0.00 and M0.10 samples. On the other hand, the optimal amount of superplasticizer in M0.05 was determined to be 0.055 because a greater amount (0.006) of superplasticizer resulted in significant fiber accumulation. Thus, the amounts of superplasticizer for a uniform distribution of both MGFs and steel fibers in the mortar matrix were determined to be 0.0055, 0.0055, and 0.006 for the M0.00, M0.05, and M0.10 series, respectively, by considering both the slump flow and slump test results.
4.2. Influence of MGFs on the Electromechanical Response of HPFRCCs under Tension
Figure 7 shows the electromechanical responses of HPFRCCs according to amount of MGFs under direct tension corresponding to differing amounts of MGFs. Figure 7a–c show the results for the M0.00, M0.05, and M0.10 series, respectively. Table 4 and Table 5 summarize the tensile and electromechanical parameters of HPFRCCs containing MGFs. The tensile parameters include the first-cracking strain (εcc), the first-cracking strength (σcc), the post-cracking strain (εpc), the post-cracking strength (σpc), and the equivalent number of micro-cracks (ncr) within the gauge length. The electromechanical parameters include the electrical resistivity at the initial (ρ0), first-cracking (ρcc), and post-cracking points (ρpc). The reduction (Δρ1) in the electrical resistivity between the starting point and the first-cracking point and that (Δρ2) between the first- and post-cracking points are also summarized in Table 5. The total reduction in the electrical resistivity (Δρ) and the normalized reduction in the electrical resistivity per crack (Δρ/ncr) are also summarized in Table 5.
The addition of MGFs to HPFRCCs produced slightly higher σpc and εpc than that for HPFRCCs without MGFs (as seen in Figure 7), until the amount of MGFs reached 5 wt %. At the addition of 5 wt % MGFs, σpc increased from 12.2 to 12.5 MPa while εpc increased from 0.68 to 0.72%. However, the addition of 10 wt % MGFs to HPFRCCs clearly reduced σpc (10.7 MPa) and εpc (0.69%). Moreover, the HPFRCCs containing 5 wt % MGFs also clearly produced a higher ncr and a higher ρ0:ncr was 17.7, 26.2, and 18.3, while ρ0 was 25.41, 63.11, and 47.15 kΩ·cm for the M0.00, M0.05, and M0.10 series, respectively.
The addition of MGFs produced a notably larger reduction in the electrical resistivity of the HPFRCCs; ∆ρ was measured as 17.27, 25.56, and 10.62 kΩ·cm for the M0.00, M0.05, and M0.10 series, respectively. Moreover, the addition of MGFs also produced a distinctly greater reduction in the electrical resistivity in both the elastic and plastic ranges (∆ρ1 and ∆ρ2); ∆ρ1 was 2.10, 2.81, and 3.12 kΩ·cm, while ∆ρ2 was 15.17, 22.75, and 7.51 kΩ·cm for the M0.00, M0.05, and M0.10 series, respectively. The larger ∆ρ2 results from the larger ncr generated during the strain-hardening response, as shown in Figure 8. The addition of MGFs also produced a larger ncr; the average ncr of HPFRCCs was calculated as 17.7, 26.2, and 18.3 for the M0.00, M0.05, and M0.10 series, respectively. Moreover, ∆ρ/ncr was 1.12 kΩ·cm for the M0.05 series, which was greater than the reductions observed for the M0.00 and M0.10 series (0.94 and 0.59 kΩ·cm, respectively). Thus, the addition of 5 wt % MGFs to the mixture notably improved the self-damage sensing capacity of HPFRCCs by increasing ∆ρ/ncr.
4.3. Influence of MGFs on the Pullout Resistance of Steel Fibers Embedded in Mortar
Figure 9 shows the pullout load (stress) versus slip curves of steel fibers embedded in mortar mixtures containing different amounts of MGFs. The addition of MGFs to the mortar had notable effects on the single-fiber pullout behavior. To quantify how the addition of MGFs influenced the interfacial bond characteristics of steel fibers embedded in mortar, the equivalent bond strengths (τeq) were evaluated and summarized (see Table 6).
The τeq of the M0.00, M0.05, and M0.10 series was 1.66, 2.12, and 1.98 MPa, respectively. The M0.05 series produced the largest τeq, which was strongly correlated with the average crack spacing [52]. The higher τeq of steel fibers embedded in the mortar mixture containing MGFs eventually enhanced the self-damage sensing capacity of HPFRCCs by increasing the number of multiple micro-cracks.
5. Discussion
The results of slump flow and slump tests were found to be important, especially for evaluating the uniform distribution of electrical fillers within the mortar mixture, as this gives materials significantly different electrical resistivities. The amount of superplasticizer required to ensure a uniform distribution of steel fibers in the mixture should be modified according to the amount of MGFs. HPFRCCs showed clearly different electromechanical responses according to the amount of MGFs. Among the mortars and HPFRCCs containing MGFs, the electrical resistivity (ρm and ρ0) was the highest for the M0.05 series (containing 5 wt %), as seen in Figure 2. The higher electrical resistivity of the M0.05 series compared to those of the other series (M0.00 and M0.10), despite containing only half of the content of electrically nonconductive MGFs of the M0.10 series, requires further clarification. Monfore [53] and Teomete [54] reported that the electrical resistivity of a cement-based matrix decreased as the pore size increased since the electrical resistivity of the matrix was greatly influenced by the effective ions within the pores. Thus, by using FE-SEM in this study, we also investigated the pore size in relation to the amount of MGFs (see Figure 10 and Table 7). The average pore sizes were measured as 288.0, 148.3, and 200.3 μm for the M0.00, M0.05, and M0.10 series, respectively. The M0.05 series—with the highest electrical resistivity (ρm and ρ0)—was found to have the smallest pore size (see Figure 11). It has been reported that the pore size influences the electrical properties of cement-based materials [55], even though the distribution of electrically conductive or nonconductive fillers in the mixture is critical for their electrical and/or mechanical properties [15,22,27,30].
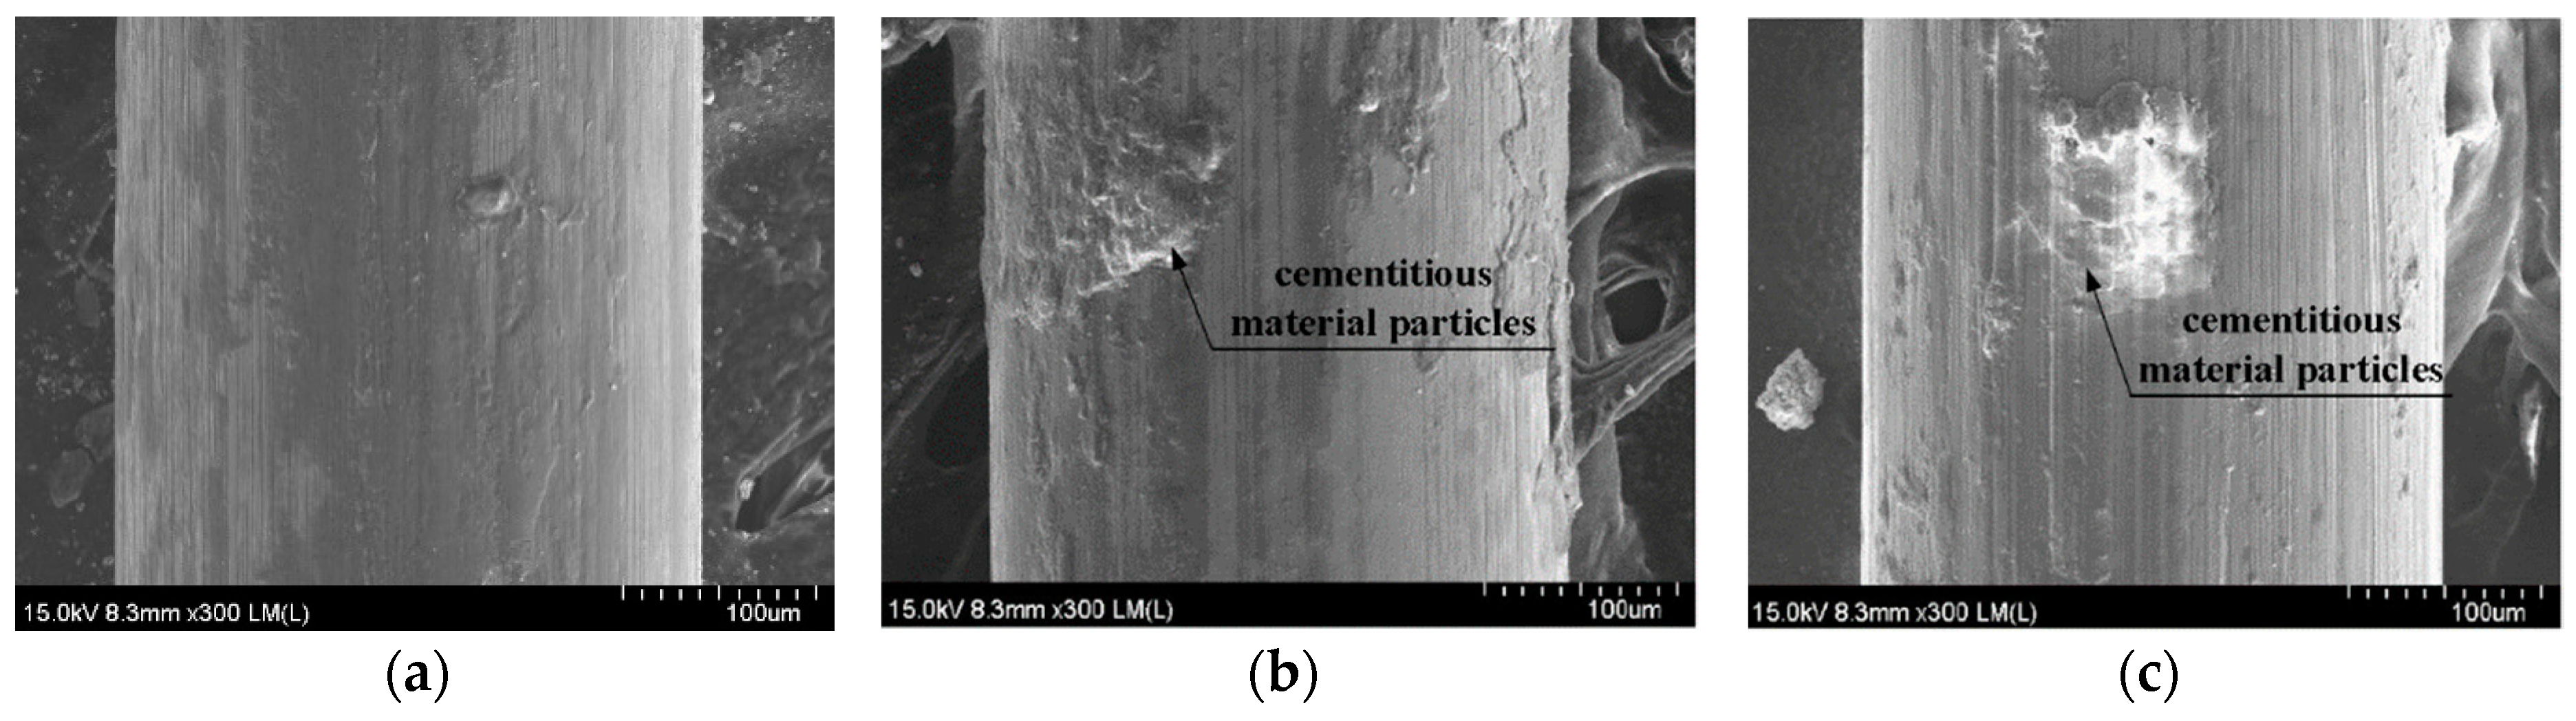
It is well-known that the interfacial bond resistance between a steel fiber and the mortar is strongly dependent upon the properties of the interfacial transition zone (ITZ), including its width, local stiffness, and porosity. Bentur et al. [56] also reported that the ITZ between the fiber and mortar matrix has a significant effect on the interfacial bond strength. Thus, we also measured the width of the ITZ (WITZ) and correlated this with the maximum pullout load (Pmax) corresponding to the amount of MGFs (see Figure 12). As the amount of MGFs increased from 0 to 10 wt %, Pmax decreased from 41.93 to 24.35 N, whereas WITZ increased from 294 to 752 nm. Kong et al. [57] reported that an increased glass fiber content decreased the calcium-silicate-hydrate (C-S-H) gel, leading to a reduced WITZ. Moreover, there is a noticeable difference—especially at the end of the fiber pullout curves—according to the addition of MGFs, as can be seen in Figure 9. The pullout load of the M0.00 series showed a continuous decrease after the peak point and then slightly increased at the end of the curve. However, for both the M0.05 and M0.10 series, the pullout load significantly increased again at the end of the curve. As seen in Figure 13, both of the M0.05 and M0.10 series contained many more cementitious material particles attached to the surfaces of steel fibers after fiber pullout than did the M0.00 series. Moreover, the M0.05 series also showed many more such cementitious material particles than the M0.10 series. During fiber pullout, interfacial failure occurred at the interface between the fiber and the matrix in the M0.00 series; however, in both the M0.05 and M0.10 series, failure would have occurred at the matrix rather than at the interface. The cementitious material particles attached to the surfaces of steel fibers accumulated at the interfacial tunnel during fiber pullout; consequently, the pullout load significantly increased at the end of the curves. Thus, the M0.05 series produced the highest τeq, which is correlated with the direct tensile response of HPFRCCs. Furthermore, as can be seen in Figure 1, unlike ordinary SFRCs, in which the electrical resistivity showed a slight increase after post-cracking due to the absence of further matrix cracking, the electrical resistivity of HPFRCCs slightly declined even after post-cracking because the cementitious materials were gradually removed from the surface of the steel fibers owing to failure at the matrix rather than at the interface.
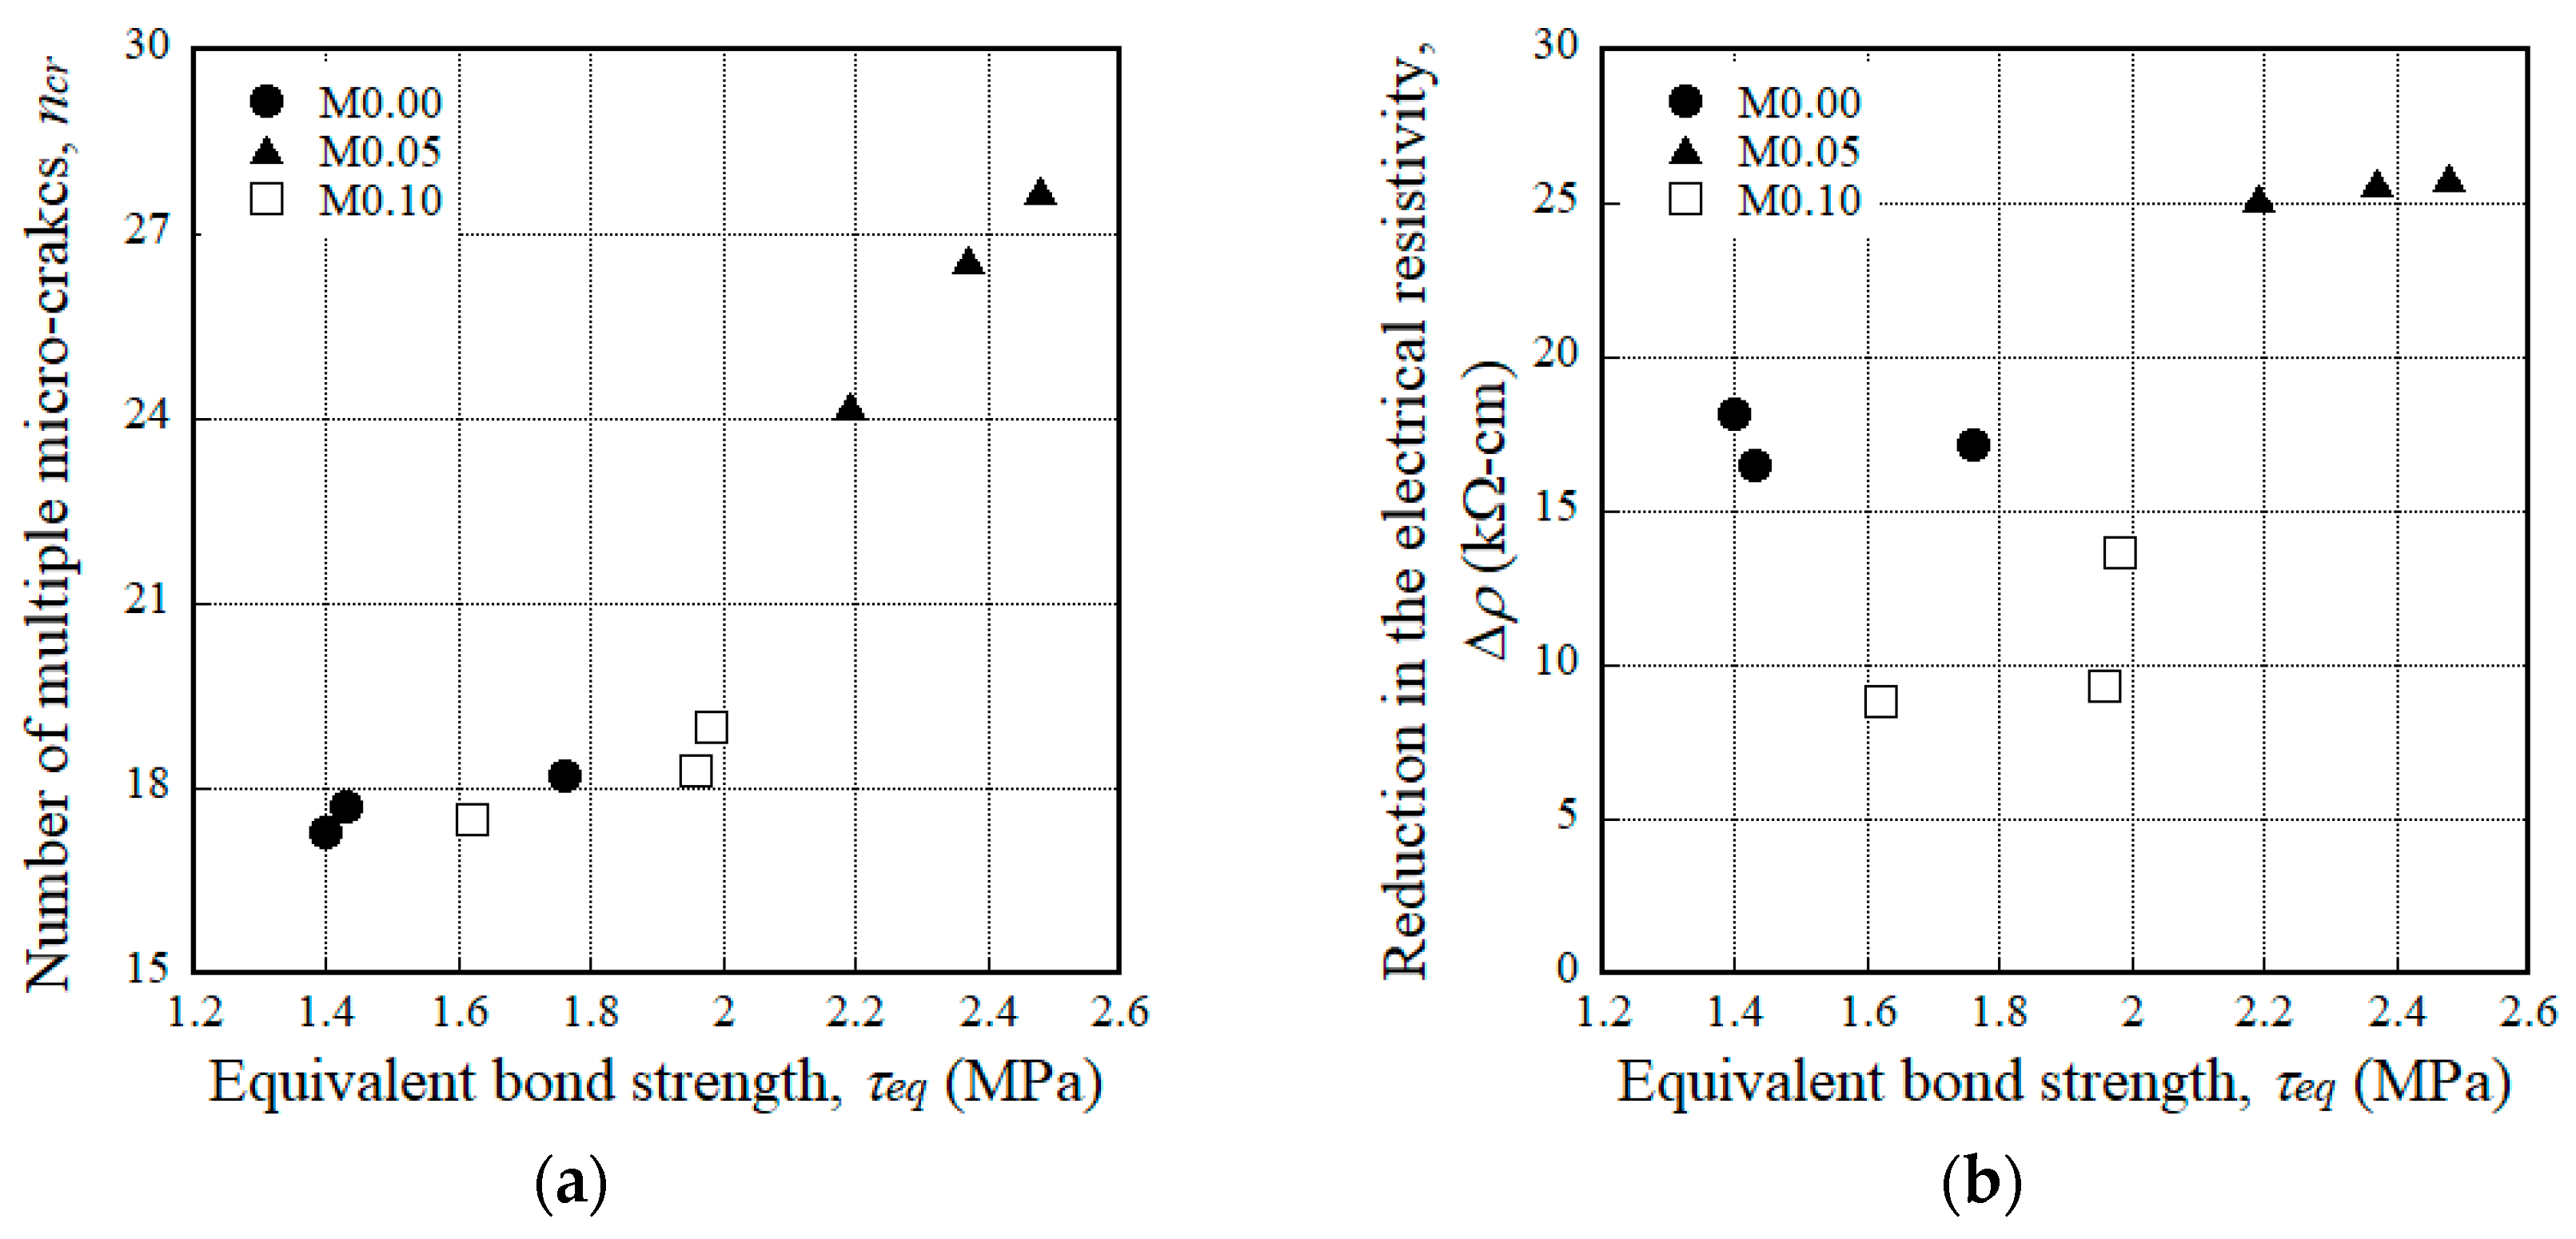
The mechanical parameters (σpc, εpc, ncr) and width of the cracks (wcr) of HPFRCCs are the functions of τeq, as described in Equations (4)–(7). Moreover, the reduction in the electrical resistance of HPFRCCs during the tensile strain-hardening response is affected by ncr, as described in Equation (2). As τeq increased, both σpc and ncr of the HPFRCCs increased. Since the M0.05 series produced the largest τeq (2.12 MPa) in the single-fiber pullout tests, the addition of 5 wt % MGFs to HPFRCCs consequently generated the highest ncr (26.2) under tension, as seen in Figure 14a. Consequently, the M0.05 series produced the largest reduction in the electrical resistivity (Δρ), as seen in Figure 14b.
6. Conclusions
The electromechanical response of HPFRCCs containing MGFs was investigated for the development of a smart construction material with a high self-sensing capacity and low cost. The addition of 5 wt % MGFs to HPFRCCs notably increased the mechanical resistance and self-sensing capacity of HPFRCCs. The following conclusions are drawn from the experimental results:
- The addition of MGFs to cement-based composites reduced the size of pores, which is closely related to the electrical resistivity of the composites; the electrical resistivity was the greatest for HPFRCCs containing 5 wt % MGFs.
- The maximum pullout load (Pmax) of steel fibers with a 15-mm embedment length decreased from 41.93 to 24.35 N as the amount of MGFs increased from 0 to 10 wt %, because the width of the ITZ (WITZ) increased from 294 to 752 μm.
- However, the equivalent bond strength (τeq) of steel fibers, which is closely correlated with the tensile response (especially the number of multiple cracks) of HPFRCCs, increased from 1.53 to 2.35 MPa as the amount of MGFs increased from 0 to 5 wt % owing to the greater accumulation of cementitious material particles attached to the surfaces of steel fibers at the interfacial tunnel.
- The reduction in the electrical resistivity (∆ρ) of HPFRCCs during the strain-hardening response under tension was the greatest with the addition of 5 wt % MGFs to the matrix; this was attributed to the increased electrical resistivity of the mortar matrix due to the generation of a greater number of multiple micro-cracks.
- HPFRCCs containing 5 wt % MGFs generated the largest reduction in the electrical resistivity per crack (∆ρ/ncr) of 1.12 kΩ·cm, i.e., the greatest self-damage sensing capacity.
Author Contributions
M.K.K. and D.J.K. conceived, designed, and wrote the manuscript; M.K.K. performed experiments.
Funding
This research was supported by a grant (17CTAP-C114934-02) from the infrastructure and transportation technology promotion research program funded by the Ministry of Land, Infrastructure, and Transport of the Korean government.
Acknowledgments
This research was supported by a grant (17CTAP-C114934-02) from the infrastructure and transportation technology promotion research program funded by the Ministry of Land, Infrastructure, and Transport of the Korean government.
Conflicts of Interest
The authors declare no conflict of interest.
References
- Teomete, E.; Kocyigit, O.I. Tensile strain sensitivity of steel fiber reinforced cement matrix composites tested by split tensile test. Constr. Build. Mater. 2013, 47, 962–968. [Google Scholar] [CrossRef]
- D’Alessandro, A.; Ubertini, F.; Materazzi, A.L. Self-sensing concrete nanocomposites for smart structures. Int. J. Civ. Environ. Eng. 2016, 10, 576–581. [Google Scholar]
- Han, B.; Yu, X.; Ou, J. Self-Sensing Concrete in Smart Structures; Butterworth-Heinemann, Elsevier: Oxford, UK, 2014. [Google Scholar]
- Gupta, S.; Gonzalez, J.G.; Loh, K. Self-sensing concrete enabled by nano-engineered cement-aggregate interfaces. Struct. Health Monit. 2017, 16, 309–323. [Google Scholar] [CrossRef]
- Hoheneder, J.; Flores-Vivian, I.; Lin, Z.; Zilberman, P.; Sobolev, K. The performance of stress-sensing smart fiber reinforced composites in moist and sodium chloride environments. Compos. Part B 2015, 73, 89–95. [Google Scholar] [CrossRef]
- Wittmann, F.H. Observation of and electromechanical effect of hardened cement paste. Cem. Concr. Res. 1973, 3, 601–605. [Google Scholar] [CrossRef]
- Chu, H.Y.; Chen, J.K. The experimental study on the correlation of resistivity and damage for conductive concrete. Cem. Concr. Compos. 2016, 67, 12–19. [Google Scholar] [CrossRef]
- Rana, S.; Subramani, P.; Fangueiro, R.; Correia, A.G. A review on smart self-sensing composite materials for civil engineering applications. AIMS Mater. Sci. 2016, 3, 357–379. [Google Scholar] [CrossRef]
- Xie, P.; Gu, P.; Beaudoin, J.J. Electrical percolation phenomena in cement composites containing conductive fibres. J. Mater. Sci. 1996, 31, 4093–4097. [Google Scholar] [CrossRef]
- Wen, S.; Chung, D.D.L. Electrical polarization in carbon fiber-reinforced cement. Cem. Concr. Res. 2001, 31, 141–147. [Google Scholar] [CrossRef]
- Toutanji, H.A.; El-Korchi, T.; Katz, R.N. Strength and reliability of carbon-fiber-reinforced cement composites. Cem. Concr. Compos. 1994, 16, 15–21. [Google Scholar] [CrossRef]
- Chen, P.-W.; Chung, D.D.L. Concrete reinforced with up to 0.2 vol% of short carbon fibres. Composites 1993, 24, 33–52. [Google Scholar] [CrossRef]
- Chen, P.-W.; Chung, D.D.L. Low-drying-shrinkage concrete containing carbon fibers. Compos. Part B 1996, 27, 269–274. [Google Scholar] [CrossRef]
- Li, G.Y.; Wang, P.M.; Zhao, X. Pressure-sensitive properties and microstructure of carbon nanotube reinforced cement composites. Cem. Concr. Compos. 2007, 29, 377–382. [Google Scholar] [CrossRef]
- Konsta-Gdoutos, M.S.; Metaxa, Z.S.; Shah, S.P. Highly dispersed carbon nanotube reinforced cement based materials. Cem. Concr. Res. 2010, 40, 1052–1059. [Google Scholar] [CrossRef]
- Nochaiya, T.; Chaipanich, A. Behavior of multi-walled carbon nanotubes on the porosity and microstructure of cement-based-materials. Appl. Surf. Sci. 2011, 257, 1941–1945. [Google Scholar] [CrossRef]
- Al-Rub, R.K.; Ashour, A.I.; Tyson, B.M. On the aspect ratio effect of multi-walled carbon nanotube reinforcements on the mechanical properties of cementitious nanocomposites. Constr. Build. Mater. 2012, 35, 647–655. [Google Scholar] [CrossRef]
- Hu, Y.; Luo, D.; Li, P.; Li, Q.; Sun, G. Fracture toughness enhancement of cement paste with multi-walled carbon nanotubes. Constr. Build. Mater. 2014, 70, 332–338. [Google Scholar] [CrossRef]
- Danoglidis, P.A.; Konsta-Gdoutos, M.S.; Gdoutos, E.E.; Shah, S.P. Strength, energy absorption capability and self-sensing properties of multifunctional carbon nanotube reinforced mortars. Constr. Build. Mater. 2016, 120, 265–274. [Google Scholar] [CrossRef]
- Sanchez, F.; Ince, C. Microstructure and macroscopic properties of hybrid carbon nanofiber/silica fume cement composites. Compos. Sci. Technol. 2009, 69, 1310–1318. [Google Scholar] [CrossRef]
- Hardy, D.K.; Fadden, M.F.; Khattak, M.J.; Khattab, A. Development and characterization of self-sensing CNF HPFRCC. Mater. Struct. 2016, 49, 5327–5342. [Google Scholar] [CrossRef]
- Wang, H.; Gao, X.; Wang, R. The influence of rheological parameters of cement paste on the dispersion of carbon nanofibers and self-sensing performance. Constr. Build. Mater. 2017, 134, 673–683. [Google Scholar] [CrossRef]
- Han, B.; Zhang, L.; Zhang, C.; Wang, Y.; Yu, X.; Ou, J. Reinforcement effect and mechanism of carbon fibers to mechanical and electrically conductive properties of cement-based materials. Constr. Build. Mater. 2016, 125, 479–489. [Google Scholar] [CrossRef]
- Wen, S.; Chung, D.D.L. Piezoresistivity in continuous carbon fiber cement-matrix composite. Cem. Concr. Res. 1999, 29, 445–449. [Google Scholar] [CrossRef]
- Chung, D.D.L. Electrically conductive cement-based materials. Adv. Cem. Res. 2004, 16, 167–176. [Google Scholar] [CrossRef]
- Garcia-Macias, E.; D’Alessandro, A.; Castro-Triguero, R.; Perez-Mira, D.; Ubertini, F. Micromechanics modeling of the uniaxial strain-sensing property of carbon nanotube cement-matrix composites for SHM applications. Compos. Struct. 2017, 163, 195–215. [Google Scholar] [CrossRef]
- D’Alessandro, A.; Rallini, M.; Ubertini, F.; Materazzi, A.L.; Kenny, J.M. Investigations on scalable fabrication procedures for self-sensing carbon nanotube cement-matrix composites for SHM applications. Cem. Concr. Compos. 2016, 65, 200–213. [Google Scholar] [CrossRef]
- Metaxa, Z.S.; Pasiou, E.D.; Dakanali, I.; Stavrakas, I.; Triantis, D.; Kourkoulis, S.K. Carbon nanotube reinforced mortar as a sensor to monitor the structural integrity of restored marble epistyles under shear. Procedia Strct. Integr. 2016, 2, 2833–2840. [Google Scholar] [CrossRef]
- Loh, K.J.; Gonzalez, J. Cementitious composites engineered with embedded carbon nanotube thin films for enhanced sensing performance. J. Phys. Conf. Ser. 2015, 628, 012042. [Google Scholar] [CrossRef]
- Sasmal, S.; Ravivarman, N.; Sindu, B.S. Synthesis, characterization and performance of piezo-resistive cementitious nanocomposites. Cem. Concr. Compos. 2017, 75, 10–21. [Google Scholar] [CrossRef]
- Konsta-Gdoutos, M.S.; Aza, C.A. Self sensing carbon nanotube (CNT) and nanofiber (CNF) cementitious composites for real time damage assessment in smart structures. Cem. Concr. Compos. 2014, 53, 162–169. [Google Scholar] [CrossRef]
- Pisello, A.L.; D’Alessandro, A.; Sambuco, S.; Rallini, M.; Uberini, F.; Asdrubli, F.; Materazzi, A.L.; Cotana, F. Multipurpose experimental characterization of smart nanocomposite cement-based materials for thermal-energy efficiency and strain-sensing capability. Sol. Energy Mater. Sol. Cells 2017, 161, 77–88. [Google Scholar] [CrossRef]
- Al-Dahawi, A.; Sarwaty, M.H.; Ozturk, O.; Yildirim, G.; Akin, A.; Sahmaran, M.; Lachemi, M. Electrical percolation threshold of cementitious composites possessing self-sensing functionality incorporating different carbon-based materials. Smart Mater. Struct. 2016, 25, 105005. [Google Scholar] [CrossRef]
- Chung, D.D.L. Carbon materials for structural self-sensing, electromagnetic shielding and thermal interfacing. Carbon 2012, 50, 3342–3353. [Google Scholar] [CrossRef]
- Wen, S.; Chung, D.D.L. Uniaxial compression in carbon fiber-reinforced cement, sensed by electrical resistivity measurement in longitudinal and transverse directions. Cem. Concr. Res. 2001, 31, 297–301. [Google Scholar] [CrossRef]
- Wen, S.; Chung, D.D.L. Effect of stress on the electric polarization in cement. Cem. Concr. Res. 2001, 31, 291–295. [Google Scholar] [CrossRef]
- Al-Dahawi, A.; Yildirim, G.; Ozturk, O.; Sahmaran, M. Assessment of self-sensing capability of engineered cementitious composites within the elastic and plastic ranges of cyclic flexural loading. Constr. Build. Mater. 2017, 145, 1–10. [Google Scholar] [CrossRef]
- Muto, N.; Yanagida, H.; Nakatsuji, T.; Sugita, M.; Ohtsuka, Y.; Arai, Y. Design of intelligent materials with self-diagnosing function for preventing fatal fracture. Smart Mater. Struct. 1992, 1, 324–329. [Google Scholar] [CrossRef]
- Chung, D.D.L. Piezoresistive cement-based materials for strain sensing. J. Intell. Mater. Syst. Struct. 2002, 13, 599–609. [Google Scholar] [CrossRef]
- Teomete, E. Transverse strain sensitivity of steel fiber reinforced cement composites tested by compression and split tensile tests. Constr. Build. Mater. 2014, 55, 136–145. [Google Scholar] [CrossRef]
- Song, J.; Nguyen, D.L.; Manathamsombat, C.; Kim, D.J. Effect of fiber volume content on electromechanical behavior of strain-hardening steel-fiber-reinforced cementitious composites. J. Compos. Mater. 2015, 49, 3621–3634. [Google Scholar] [CrossRef]
- Nguyen, D.L.; Song, J.; Manathamsombat, C.; Kim, D.J. Comparative electromechanical damage-sensing behaviors of six strain-hardening steel fiber-reinforced cementitious composites under direct tension. Compos. Part B Eng. 2015, 69, 159–168. [Google Scholar] [CrossRef]
- Kim, D.J.; Kim, M.K. The Damage Self-Sensing Response of Ultra-High-Performance Fiber-Reinforced Concrete in Tension. In Proceedings of the 3rd International Conference on Smart Materials and Structures, Orlando, FL, USA, 20–22 March 2017. [Google Scholar]
- Kim, M.K.; Kim, D.J.; An, Y.-K. Electro-mechanical self-sensing response of ultra-high-performance fiber-reinforced concrete in tension. Compos. Part B Eng. 2018, 134, 254–264. [Google Scholar] [CrossRef]
- Wen, S.; Chung, D.D.L. A comparative study of steel- and carbon-fibre cement as piezoresistive strain sensors. Adv. Cem. Res. 2003, 15, 119–128. [Google Scholar] [CrossRef]
- Joe, C.D. Cost and Ecological Feasibility of Using Ultra-High Performance Concrete in Highway Bridge Piers. Ph.D. Thesis, University of Nevada, Reno, NV, USA, 2016. [Google Scholar]
- Kim, J.J.; Kim, D.J.; Kang, S.T.; Lee, J.H. Influence of sand to coarse aggregate ratio on the interfacial bond strength of steel fibers in concrete for nuclear power plant. Nucl. Eng. Des. 2012, 252, 1–10. [Google Scholar] [CrossRef]
- Szelag, M. The influence of Metakaolinite on the Development of Thermal Cracks in a Cement Matrix. Materials 2018, 11, 520. [Google Scholar] [CrossRef] [PubMed]
- Li, L.; Wang, Q.; Zhang, G.; Shi, L.; Dong, J.; Jia, P. A method of detecting the cracks of concrete undergo high-temperature. Constr. Build. Mater. 2018, 162, 345–358. [Google Scholar] [CrossRef]
- Figueiredo, A.D.D.; Ceccato, M.R. Workability analysis of steel fiber reinforced concrete using slump and Ve-Be test. Mater. Res. 2015, 18, 1284–1290. [Google Scholar] [CrossRef]
- Naaman, A.E. High Performance Fiber Reinforced Cement Composites. In Proceedings of the IABSE Symposium on Concrete Structures for the Future, Paris, France, 23–25 September 1987; pp. 371–376. [Google Scholar]
- Kim, D.J.; El-Tawil, S.; Naaman, A.E. Correlation between Single Fiber Pullout Behavior and Tensile Response of FRC Composites with High Strength Steel Fiber. In Proceedings of the Rilem International Workshop on High Performance Fiber Reinforced Cement Composites—HPFRCC5, Mainz, Germany, 10–13 July 2007; Reinhardt, H.W., Naaman, A.E., Eds.; RILEM Publications: Cachan, France, 2007; pp. 67–76. [Google Scholar]
- Monfore, G.E. The Electrical Resistivity of Concrete. J. PCA Res. Dev. Lab. 1968, 10, 35–48. [Google Scholar]
- Teomete, E. The effect of temperature and moisture on electrical resistance, strain sensitivity and crack sensitivity of steel fiber reinforced smart cement composite. Smart Mater. Struct. 2016, 25, 75024–75033. [Google Scholar] [CrossRef]
- El-Enein, S.A.A.; Kotkata, M.F.; Hanna, G.B.; Saad, M.; El Razek, M.M.A. Electrical conductivity of concrete containing silica fume. Cem. Concr. Res. 1995, 25, 1615–1620. [Google Scholar] [CrossRef]
- Bentur, A.; Alexander, M.G. A review of the work of the RILEM TC159-ETC: Engineering of the interfacial transition zone in cementitious composites. Mater. Struct. 2000, 33, 82–87. [Google Scholar] [CrossRef]
- Kong, Y.; Wang, P.; Liu, S.; Zhao, G.; Peng, Y. SEM analysis of the interfacial transition zone between cement-glass powder paste and aggregate of mortar under microwave curing. Materials 2016, 9, 733. [Google Scholar] [CrossRef] [PubMed]
Figure 1.
Typical electromechanical response of high-performance fiber-reinforced cementitious composites (HPFRCCs) under tension.
Figure 1.
Typical electromechanical response of high-performance fiber-reinforced cementitious composites (HPFRCCs) under tension.
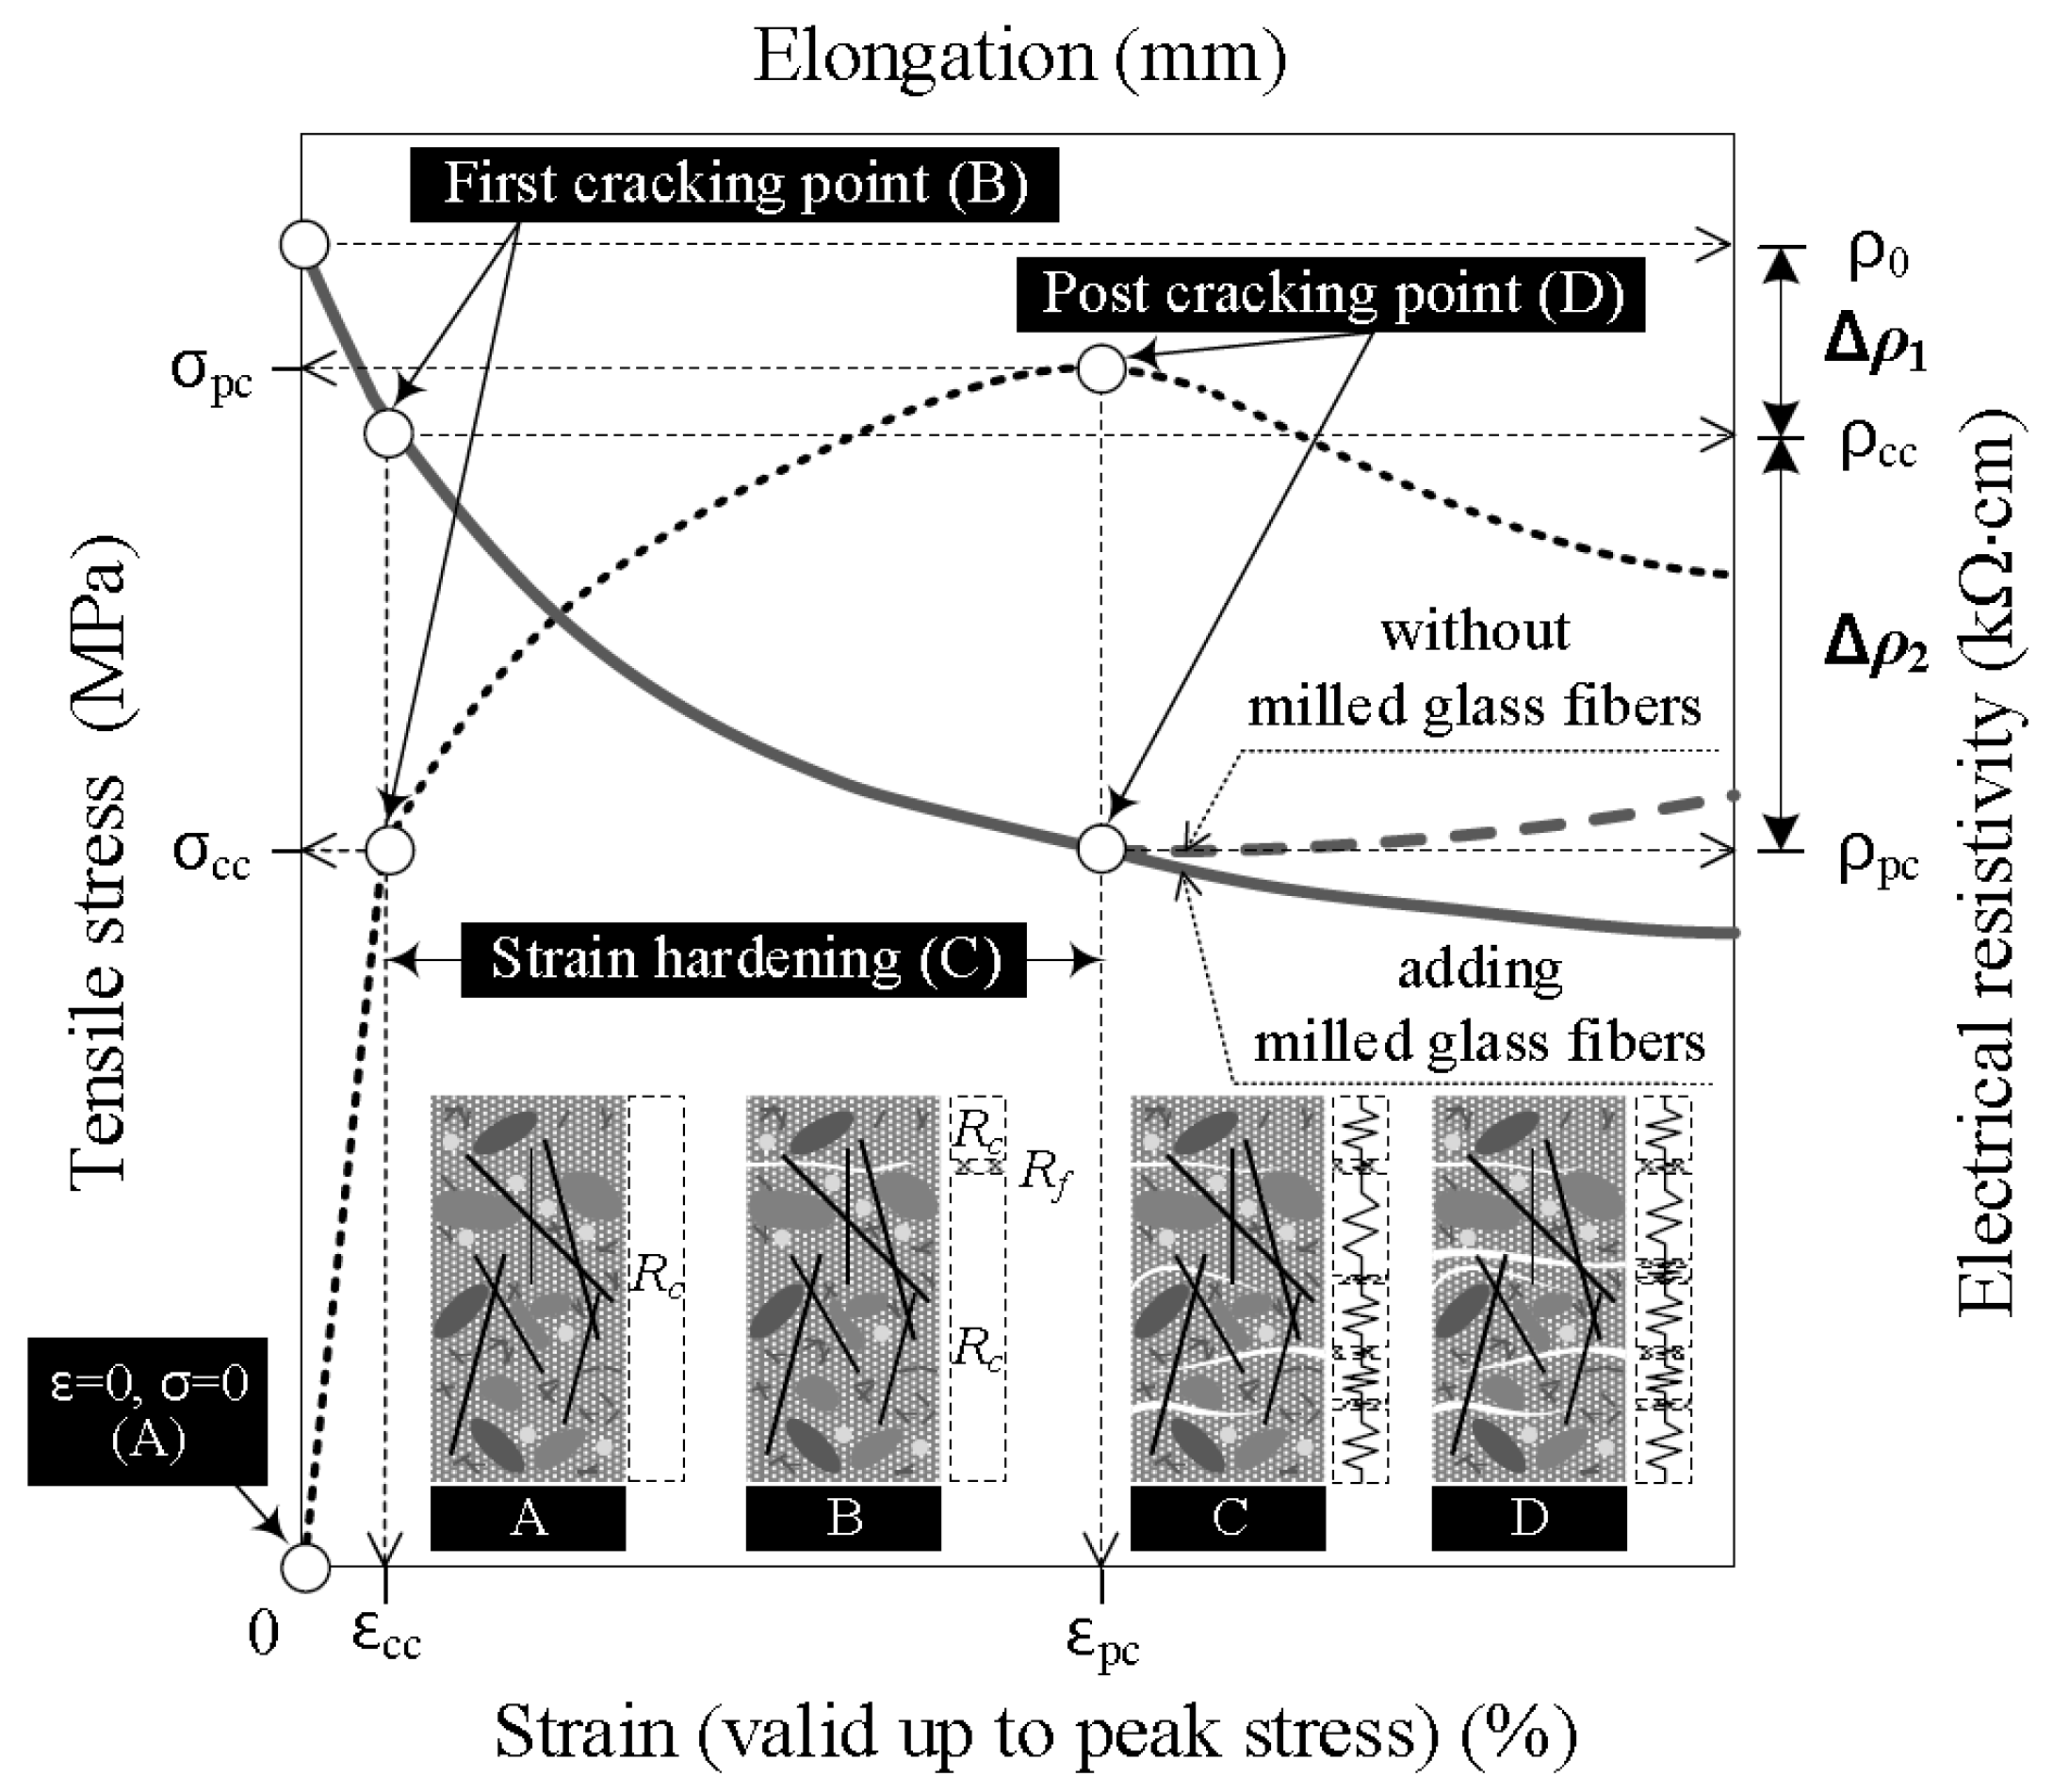
Figure 2.
Schematic of HPFRCCs under tension.
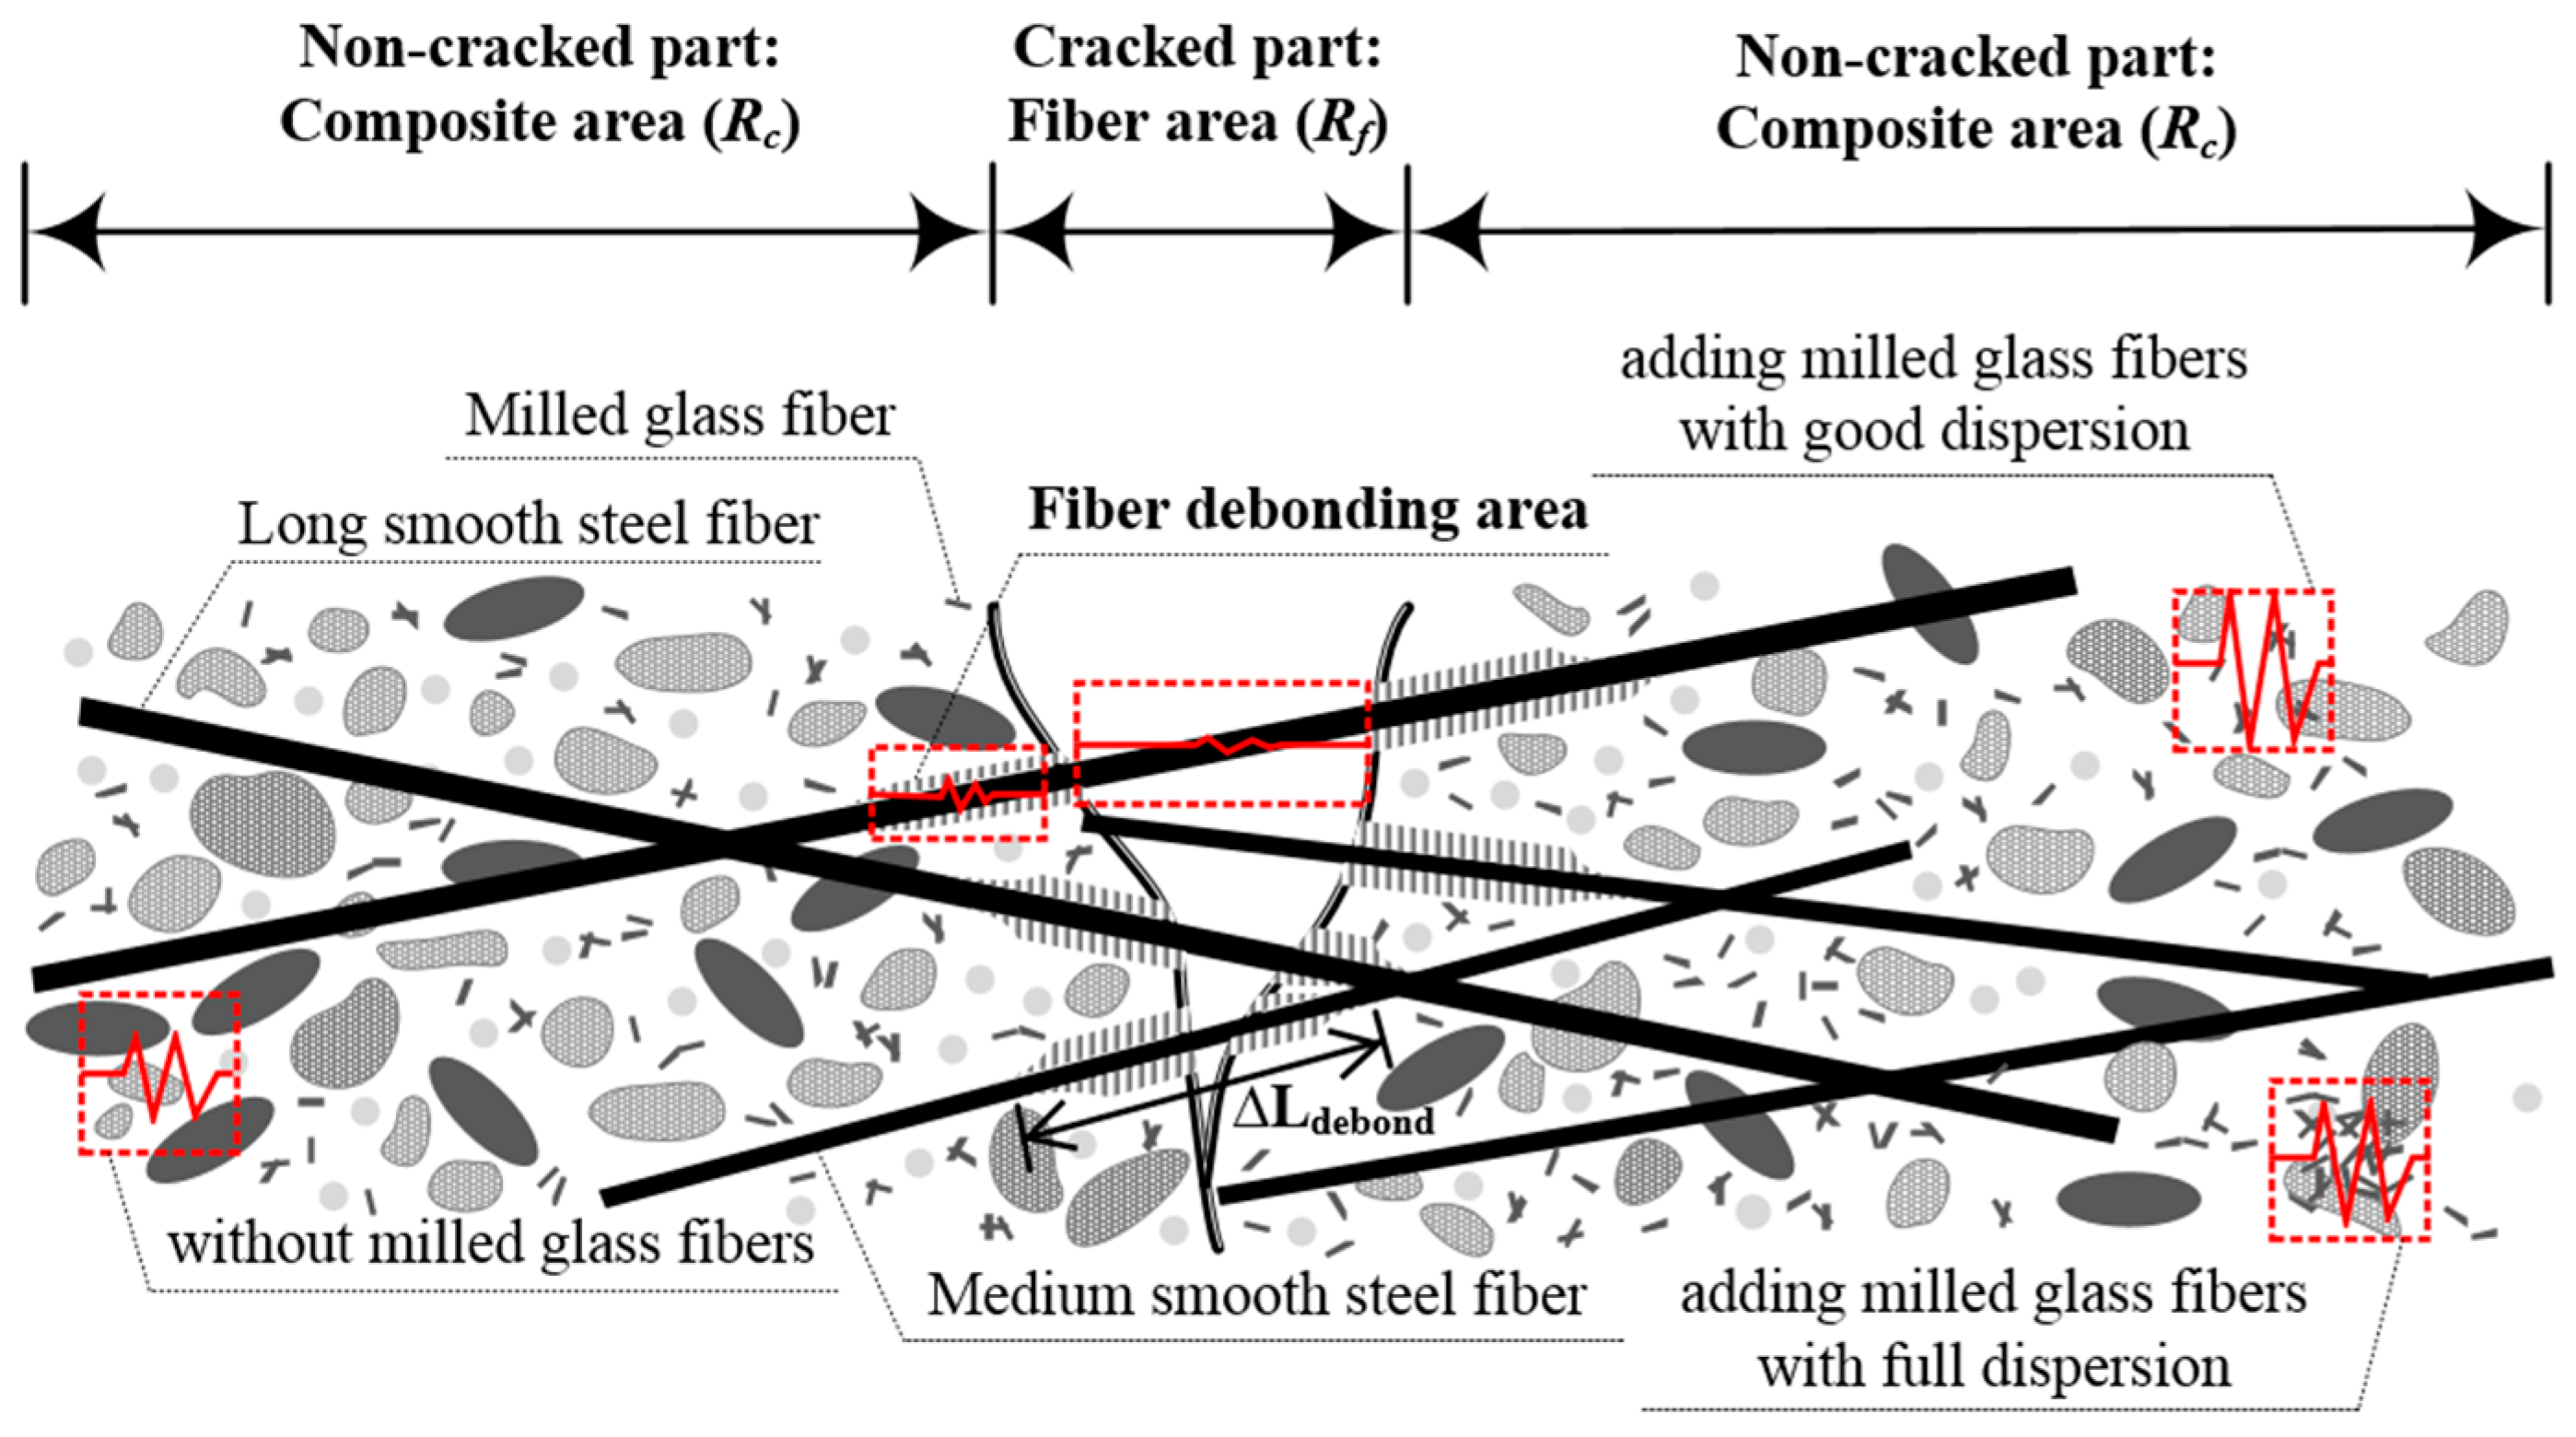
Figure 3.
Experimental program.
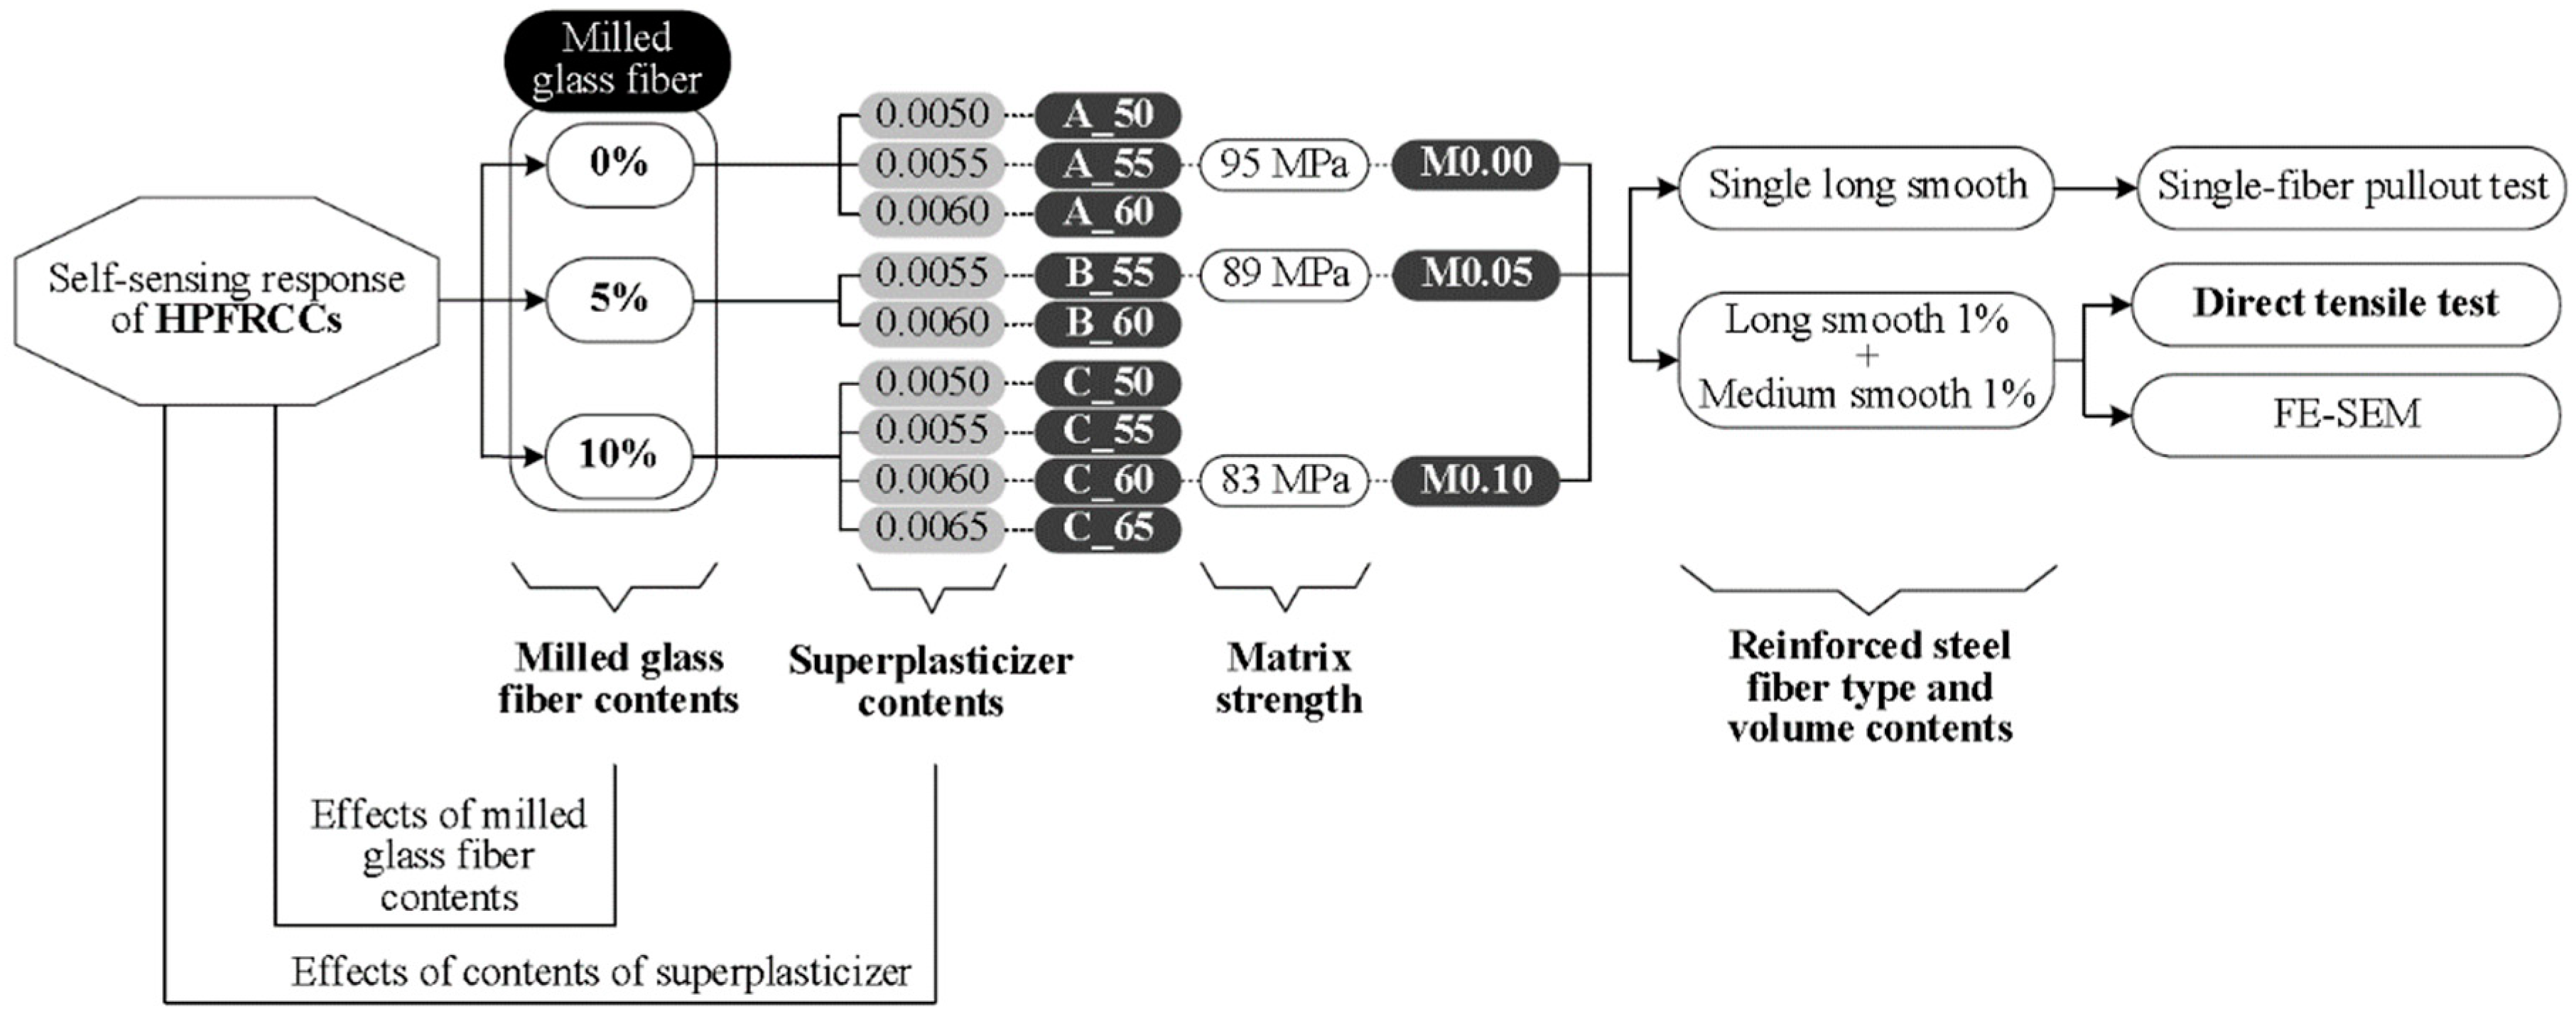
Figure 4.
Geometries of the fibers: (a) long smooth-, (b) medium smooth-steel fibers, and (c) MGFs.

Figure 5.
Geometries of the specimens and the test setups: (a) direct tensile test and (b) single-fiber pullout test.
Figure 5.
Geometries of the specimens and the test setups: (a) direct tensile test and (b) single-fiber pullout test.

Figure 6.
Effects of adding MGFs on the flowability of mortar and HPFRCCs: (a) M0.00, (b) M0.05, and (c) M0.10.
Figure 6.
Effects of adding MGFs on the flowability of mortar and HPFRCCs: (a) M0.00, (b) M0.05, and (c) M0.10.

Figure 7.
Electromechanical responses of HPFRCCs containing MGFs under tension: (a) M0.00, (b) M0.05, and (c) M0.10.
Figure 7.
Electromechanical responses of HPFRCCs containing MGFs under tension: (a) M0.00, (b) M0.05, and (c) M0.10.
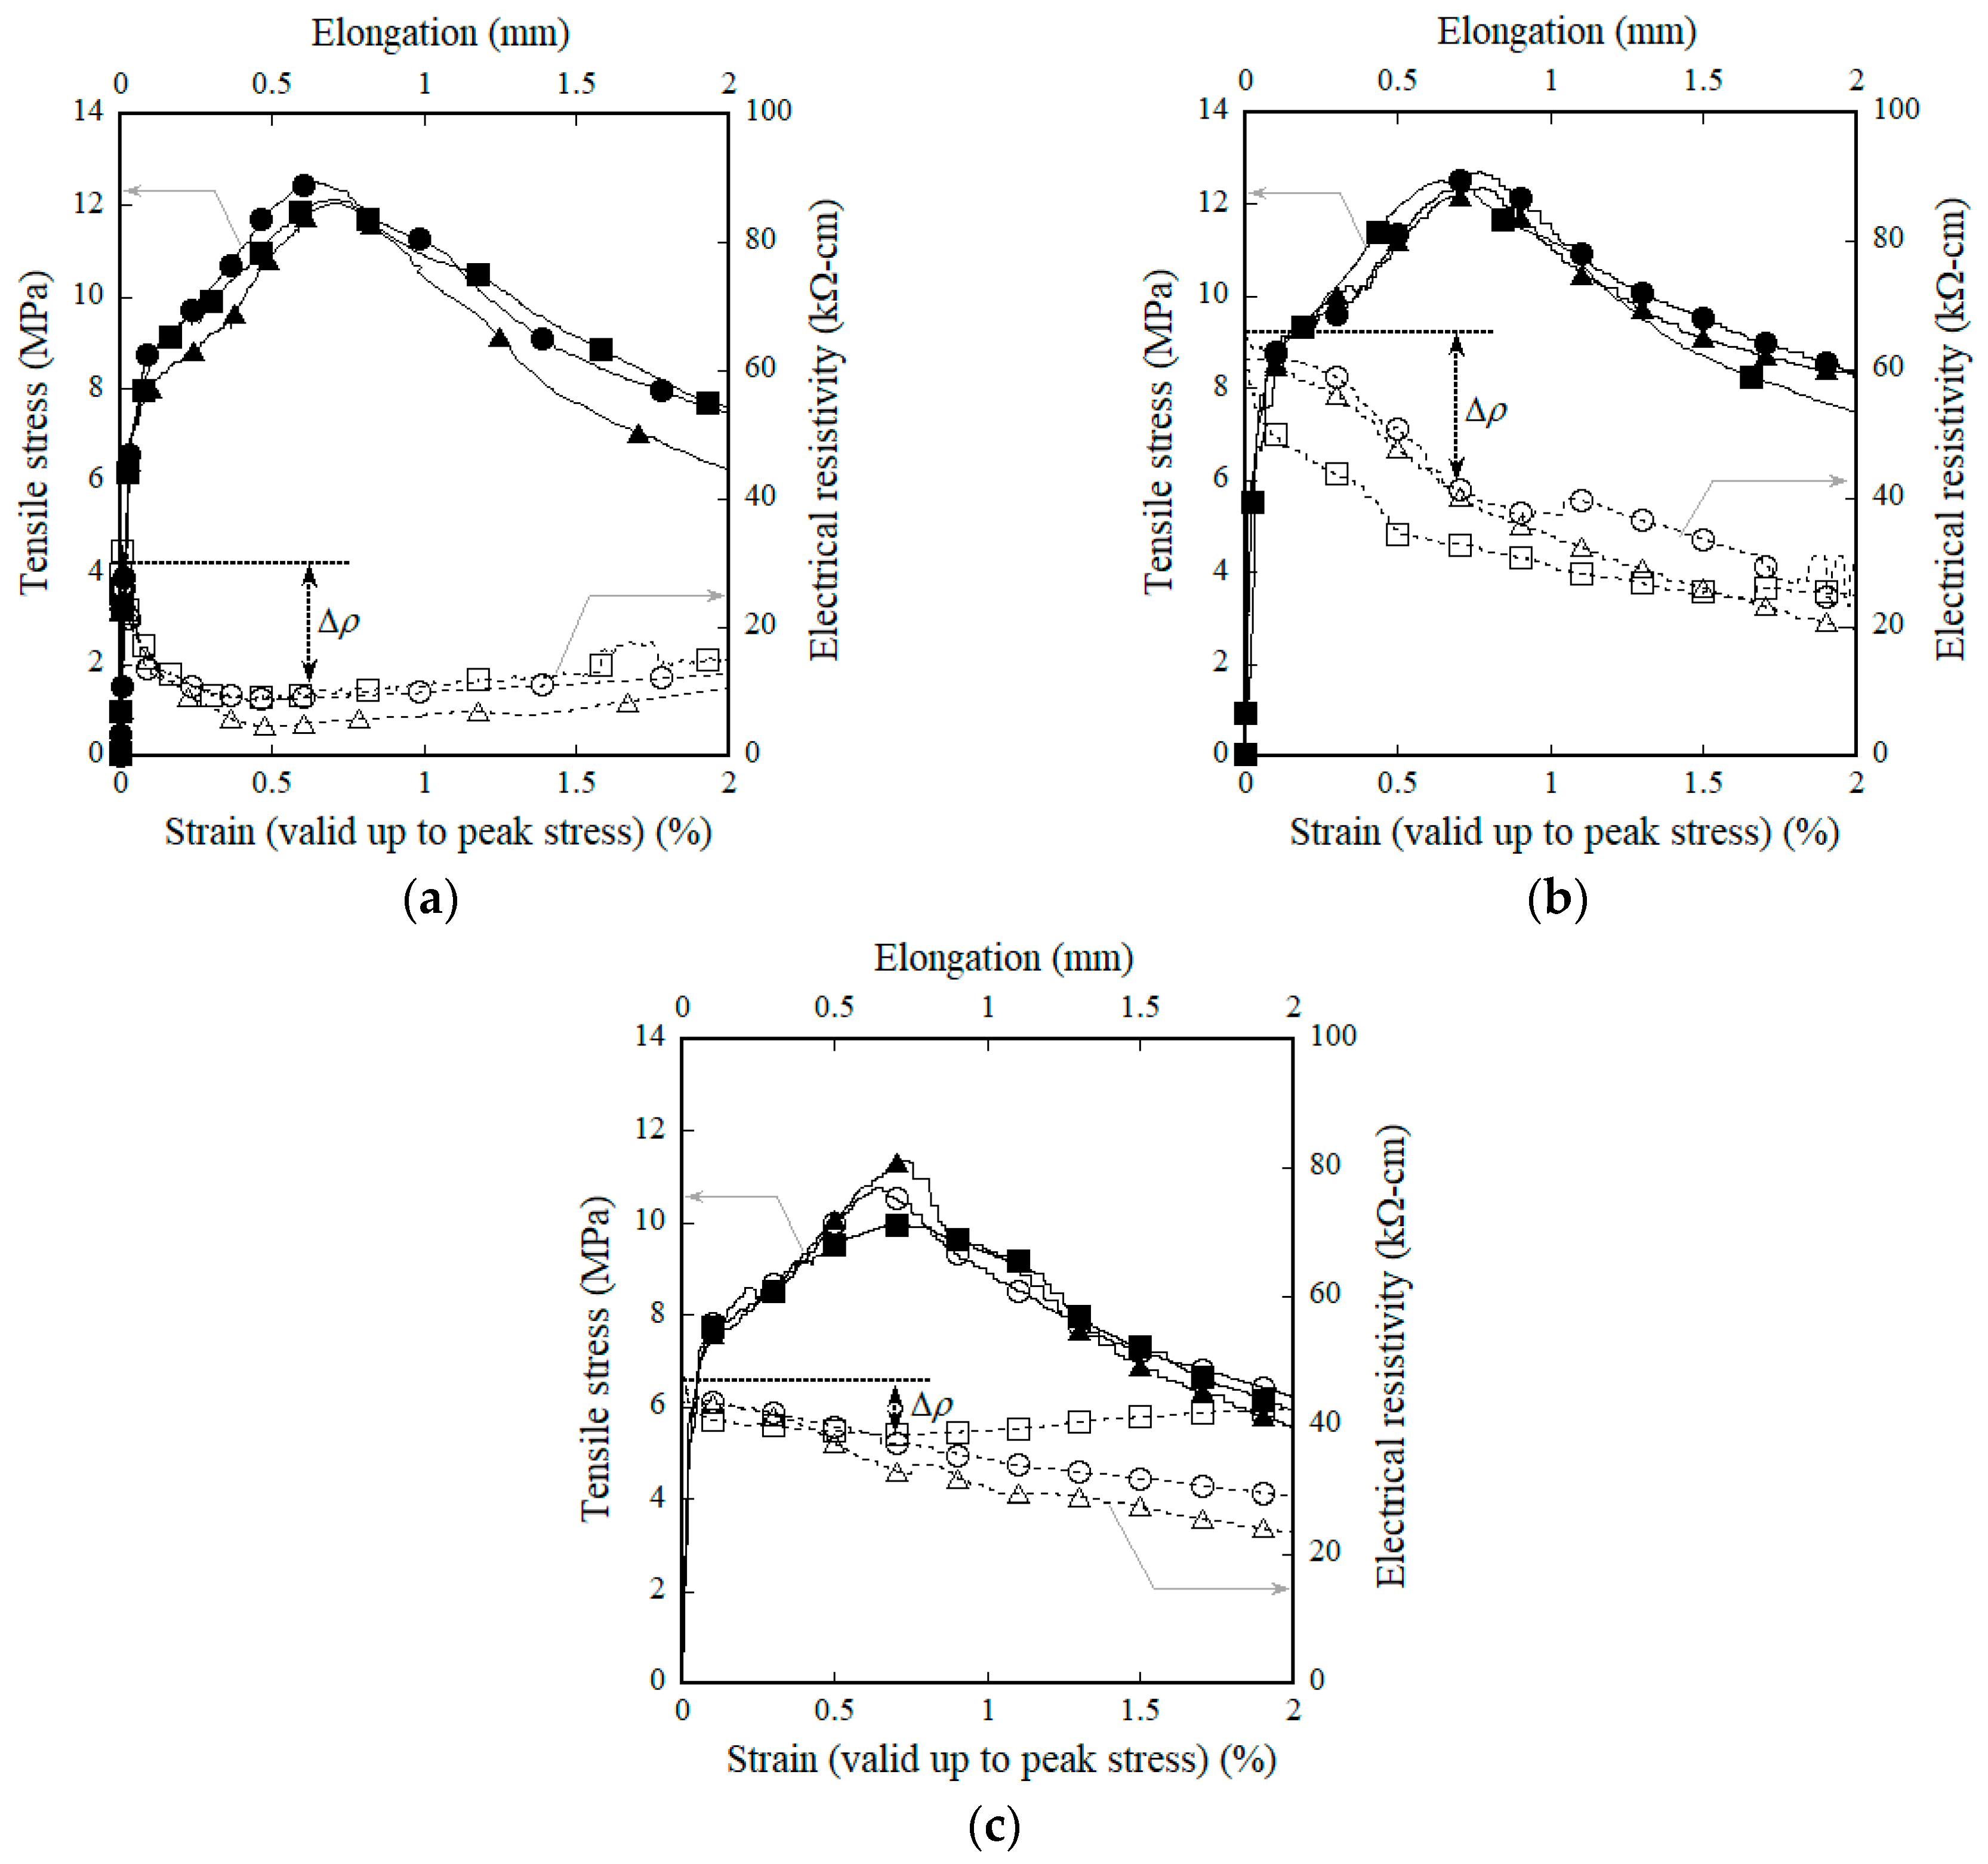
Figure 8.
Effects of adding MGFs on the multiple cracking response of HPFRCCs: (a) M0.00, (b) M0.05, and (c) M0.10.
Figure 8.
Effects of adding MGFs on the multiple cracking response of HPFRCCs: (a) M0.00, (b) M0.05, and (c) M0.10.
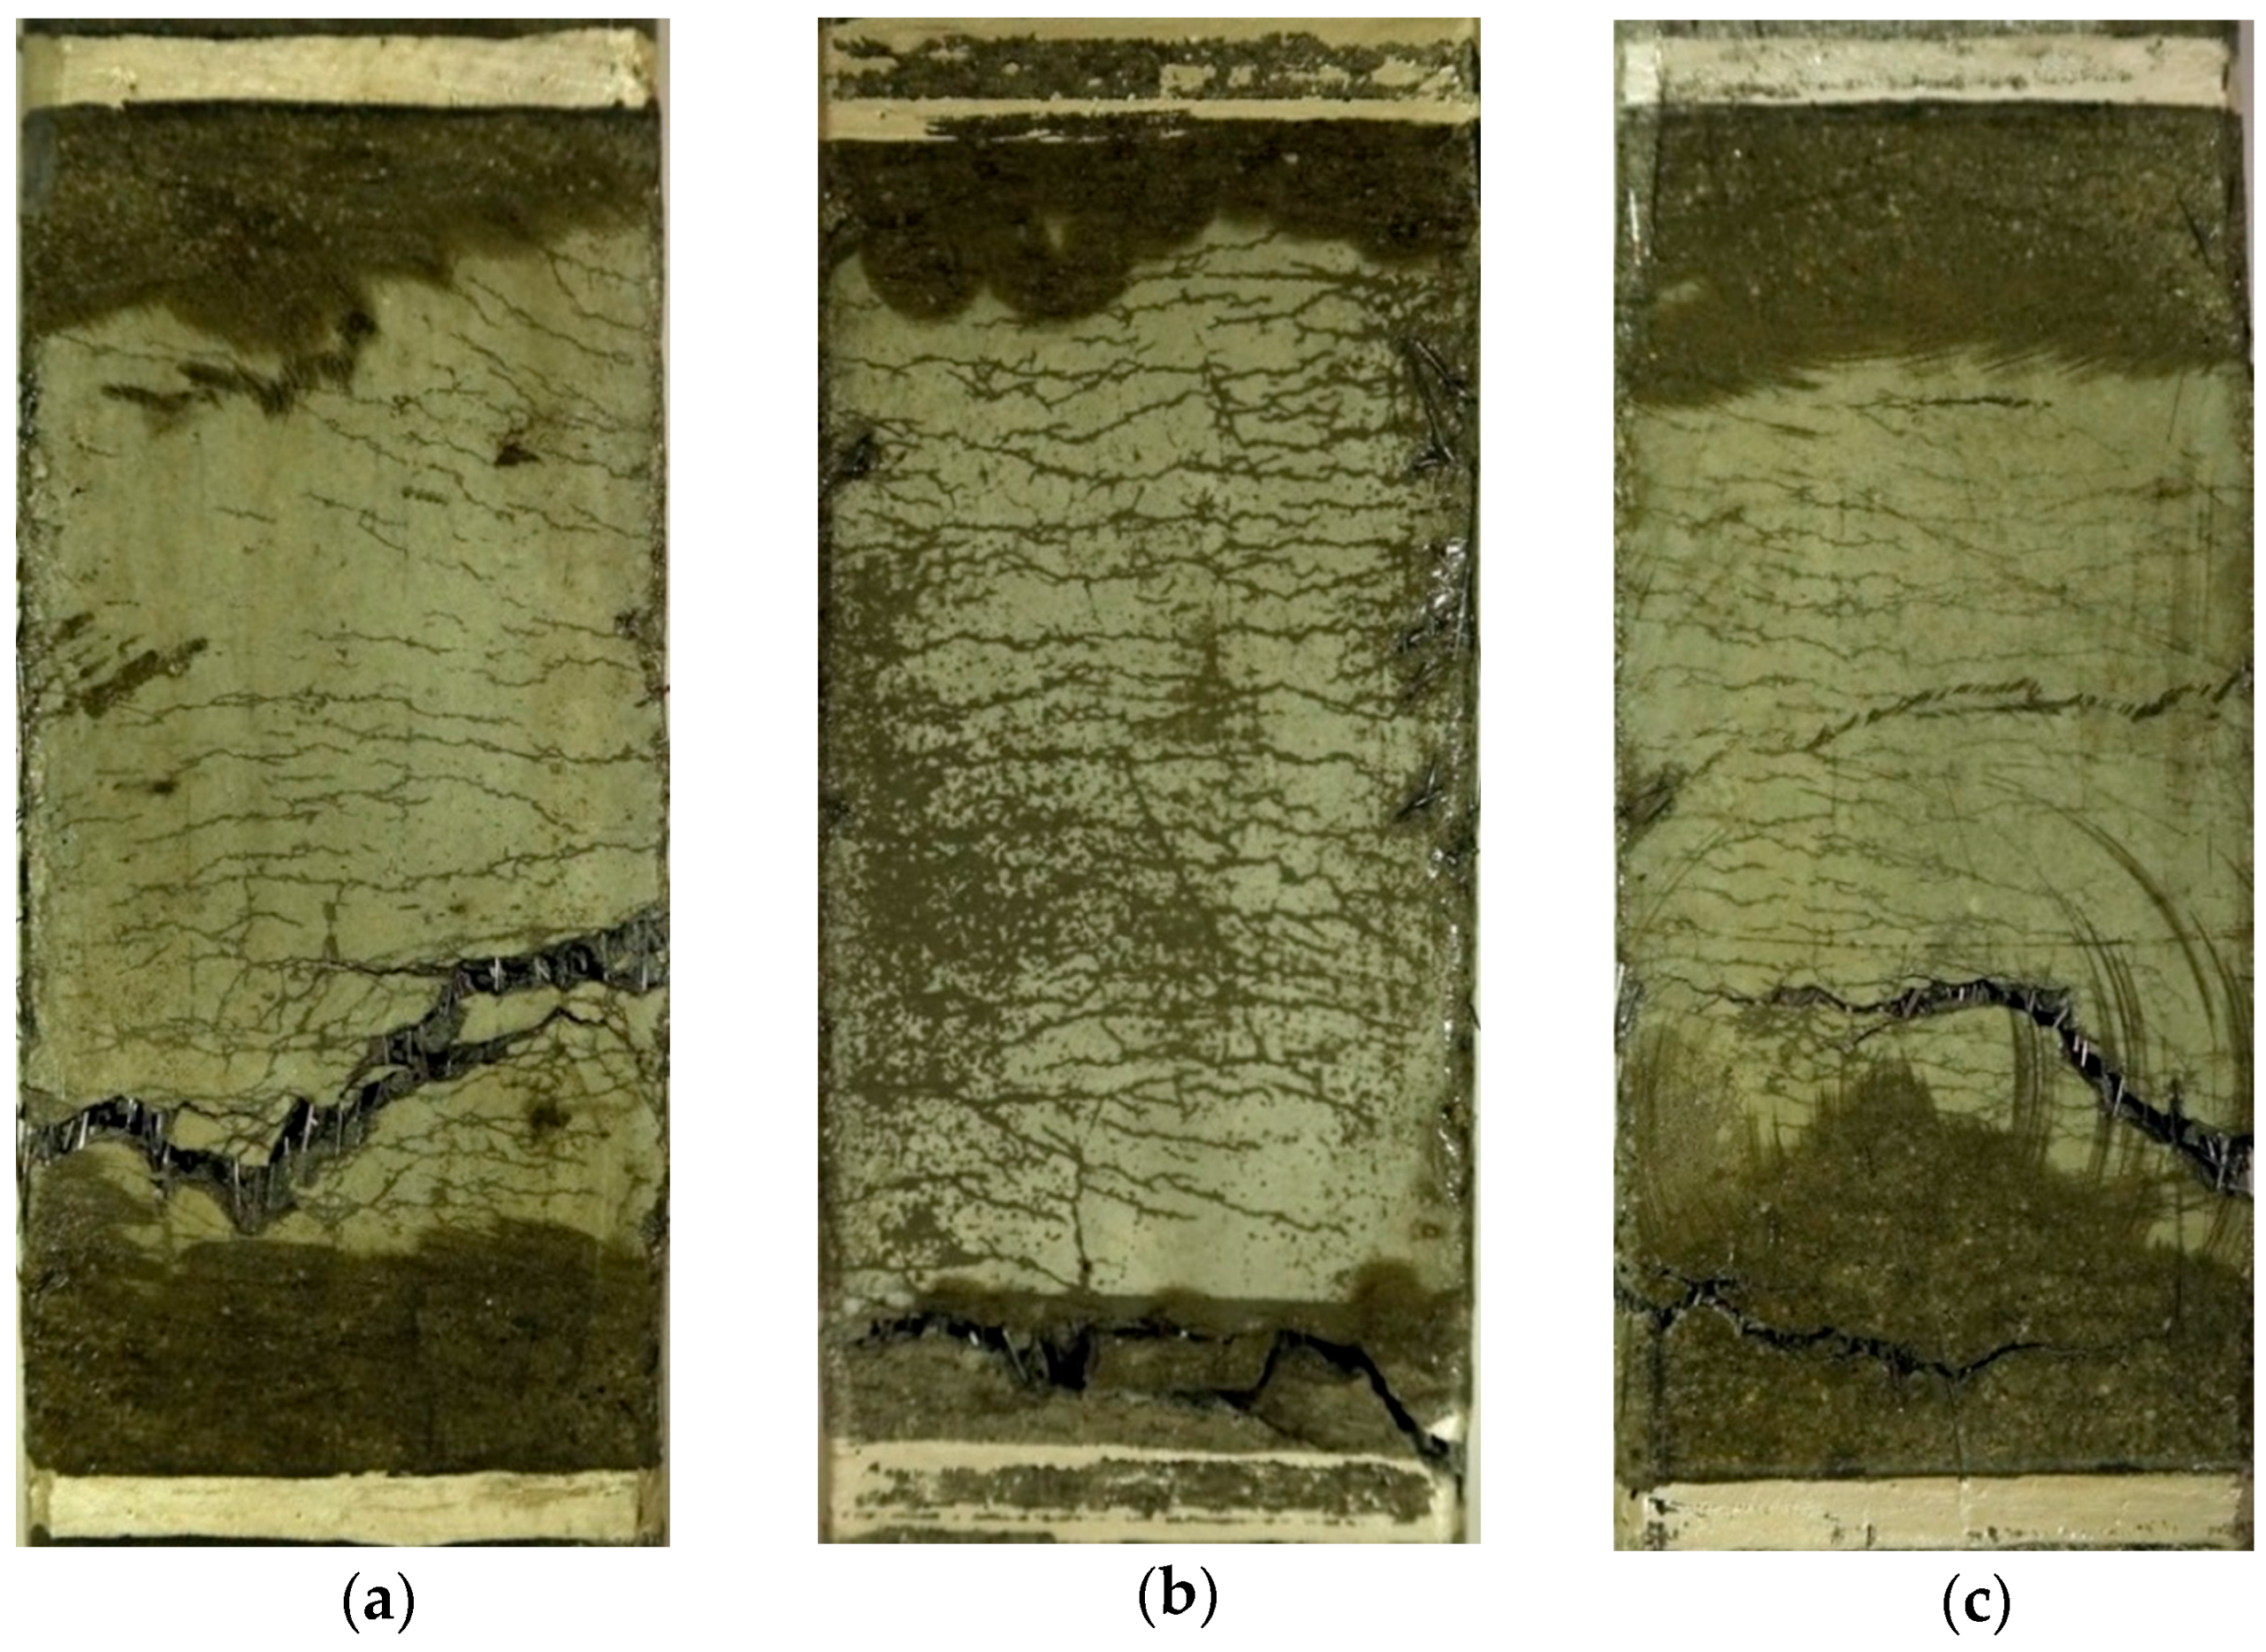
Figure 9.
Pullout load (stress) versus slip response of steel fibers embedded in a mortar mixture containing MGFs: (a) M0.00, (b) M0.05, and (c) M0.10.
Figure 9.
Pullout load (stress) versus slip response of steel fibers embedded in a mortar mixture containing MGFs: (a) M0.00, (b) M0.05, and (c) M0.10.
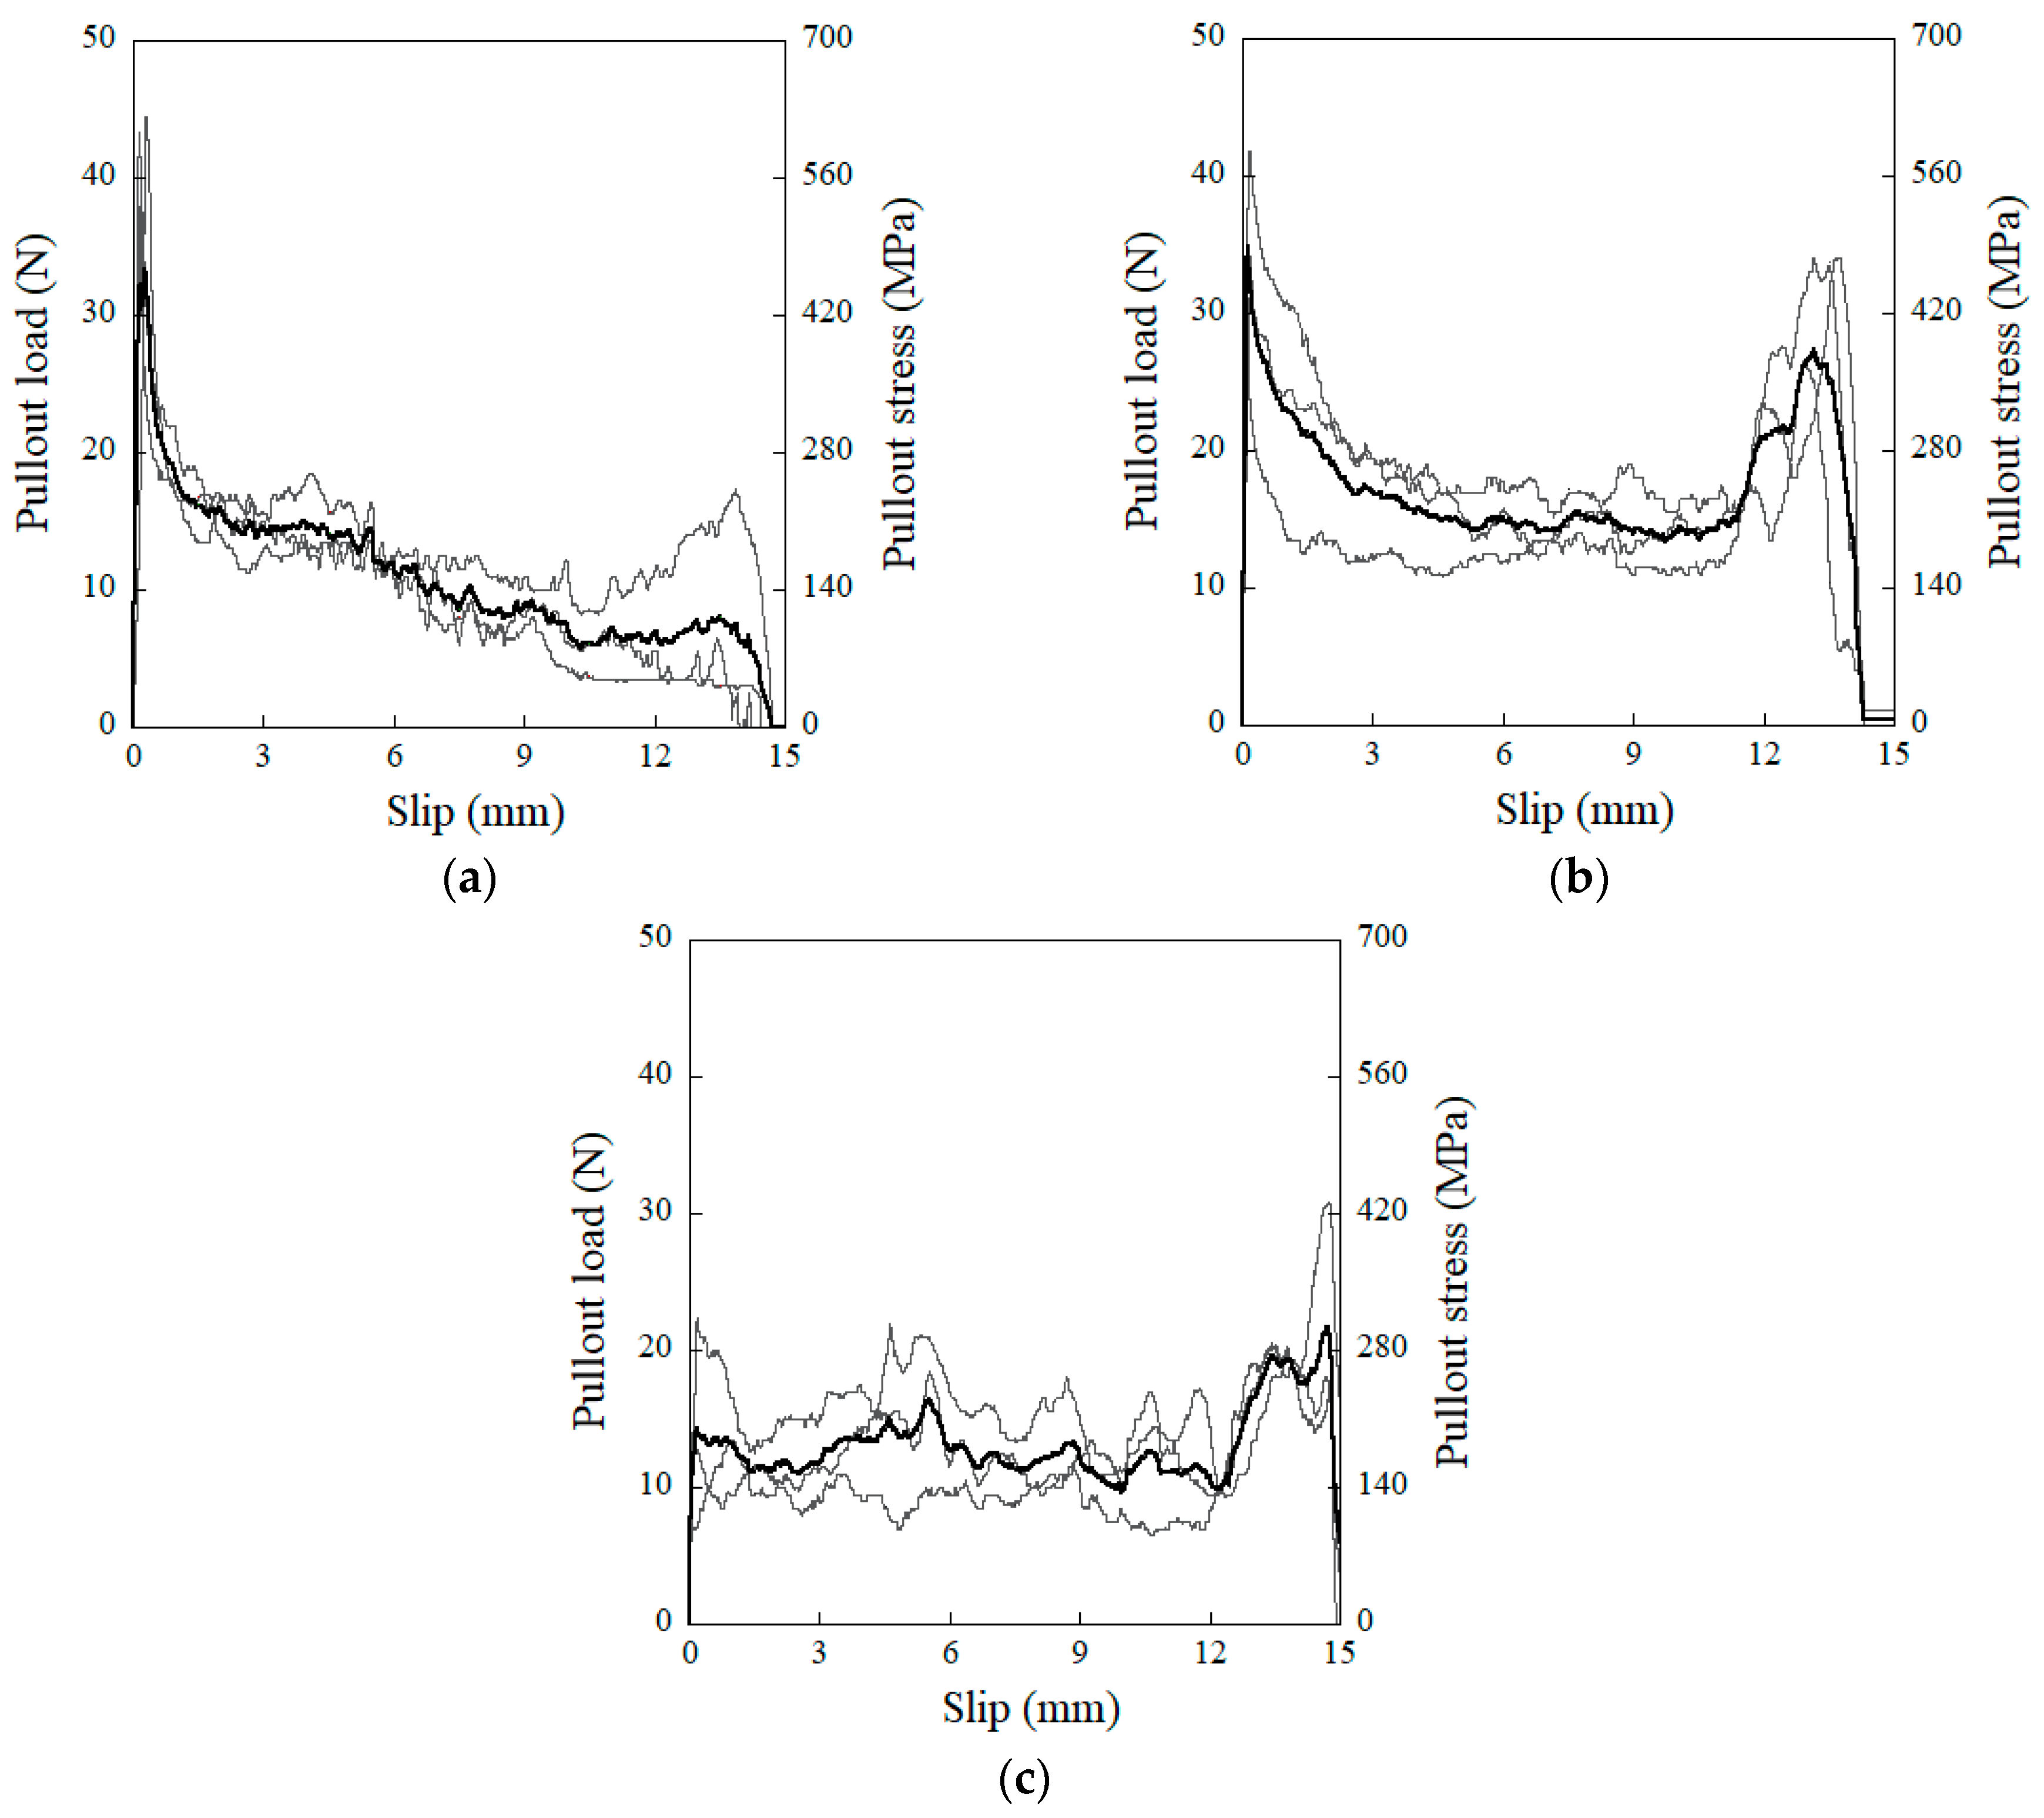
Figure 10.
Pores in a mortar mixture containing MGFs: (a) M0.00, (b) M0.05, and (c) M0.10.
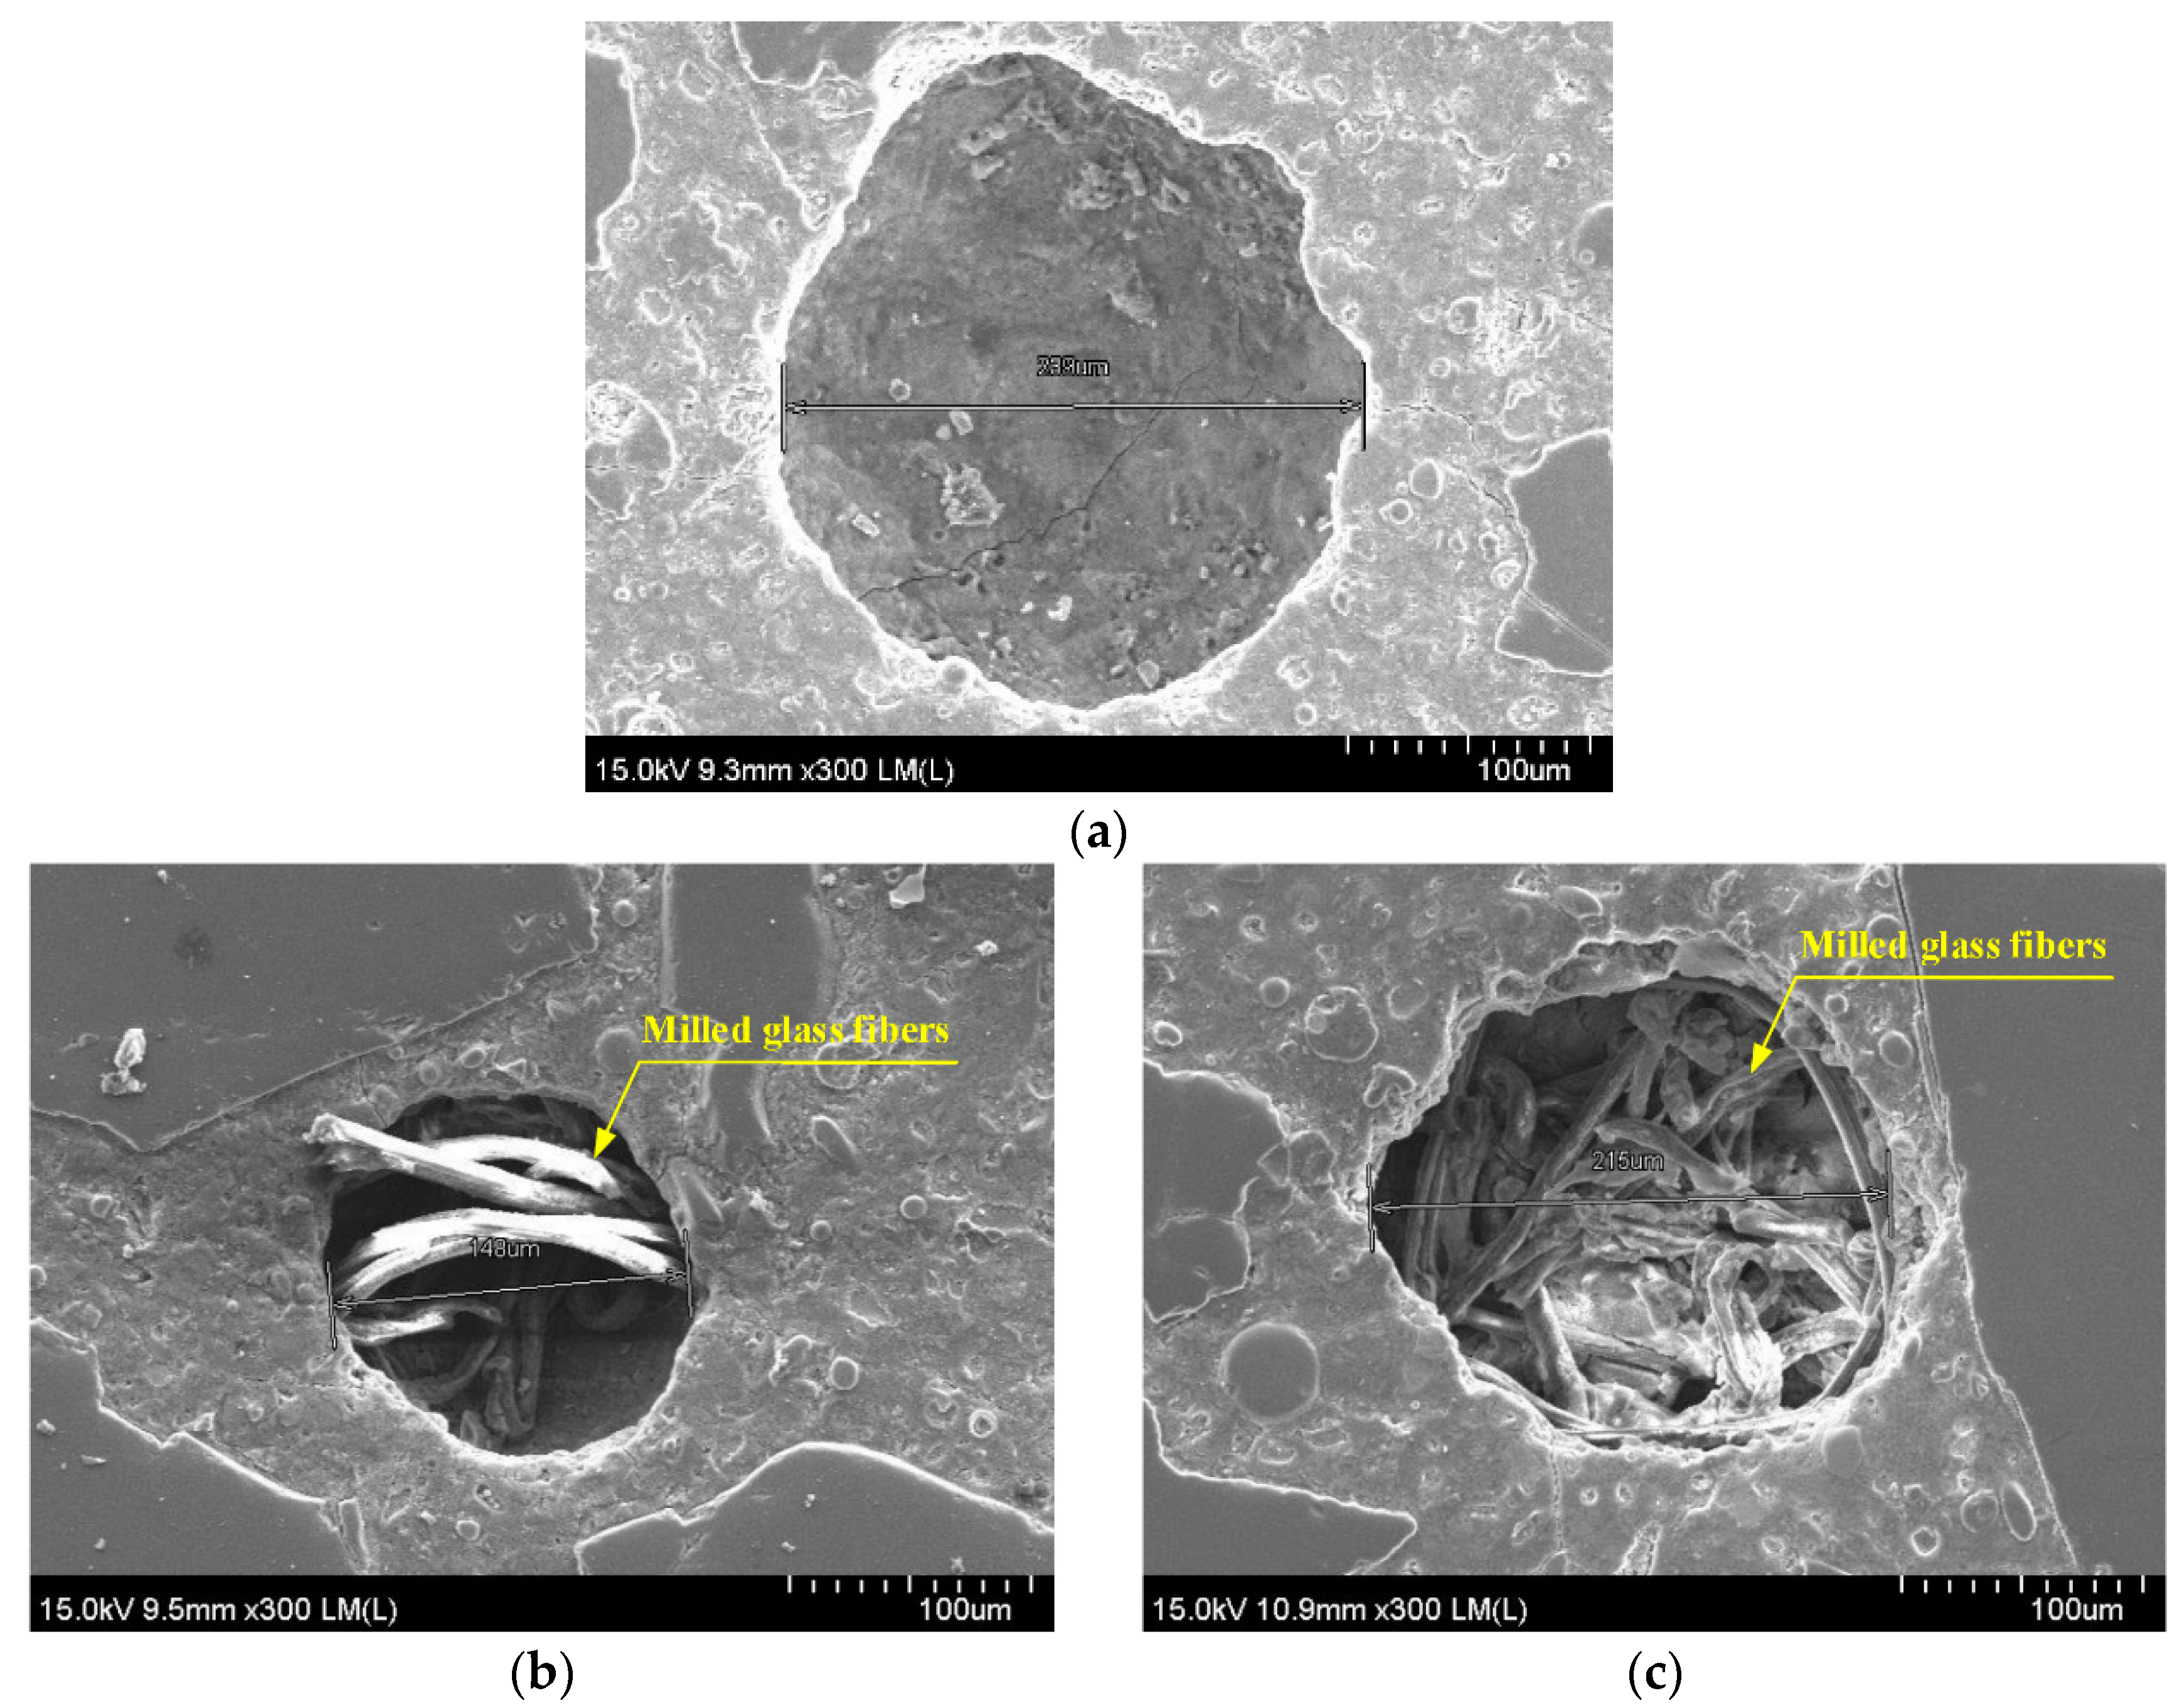
Figure 11.
Correlation between the pore size and the electrical resistivity of the mortar matrix.

Figure 12.
Effect of the width of the ITZ on the maximum pullout load.
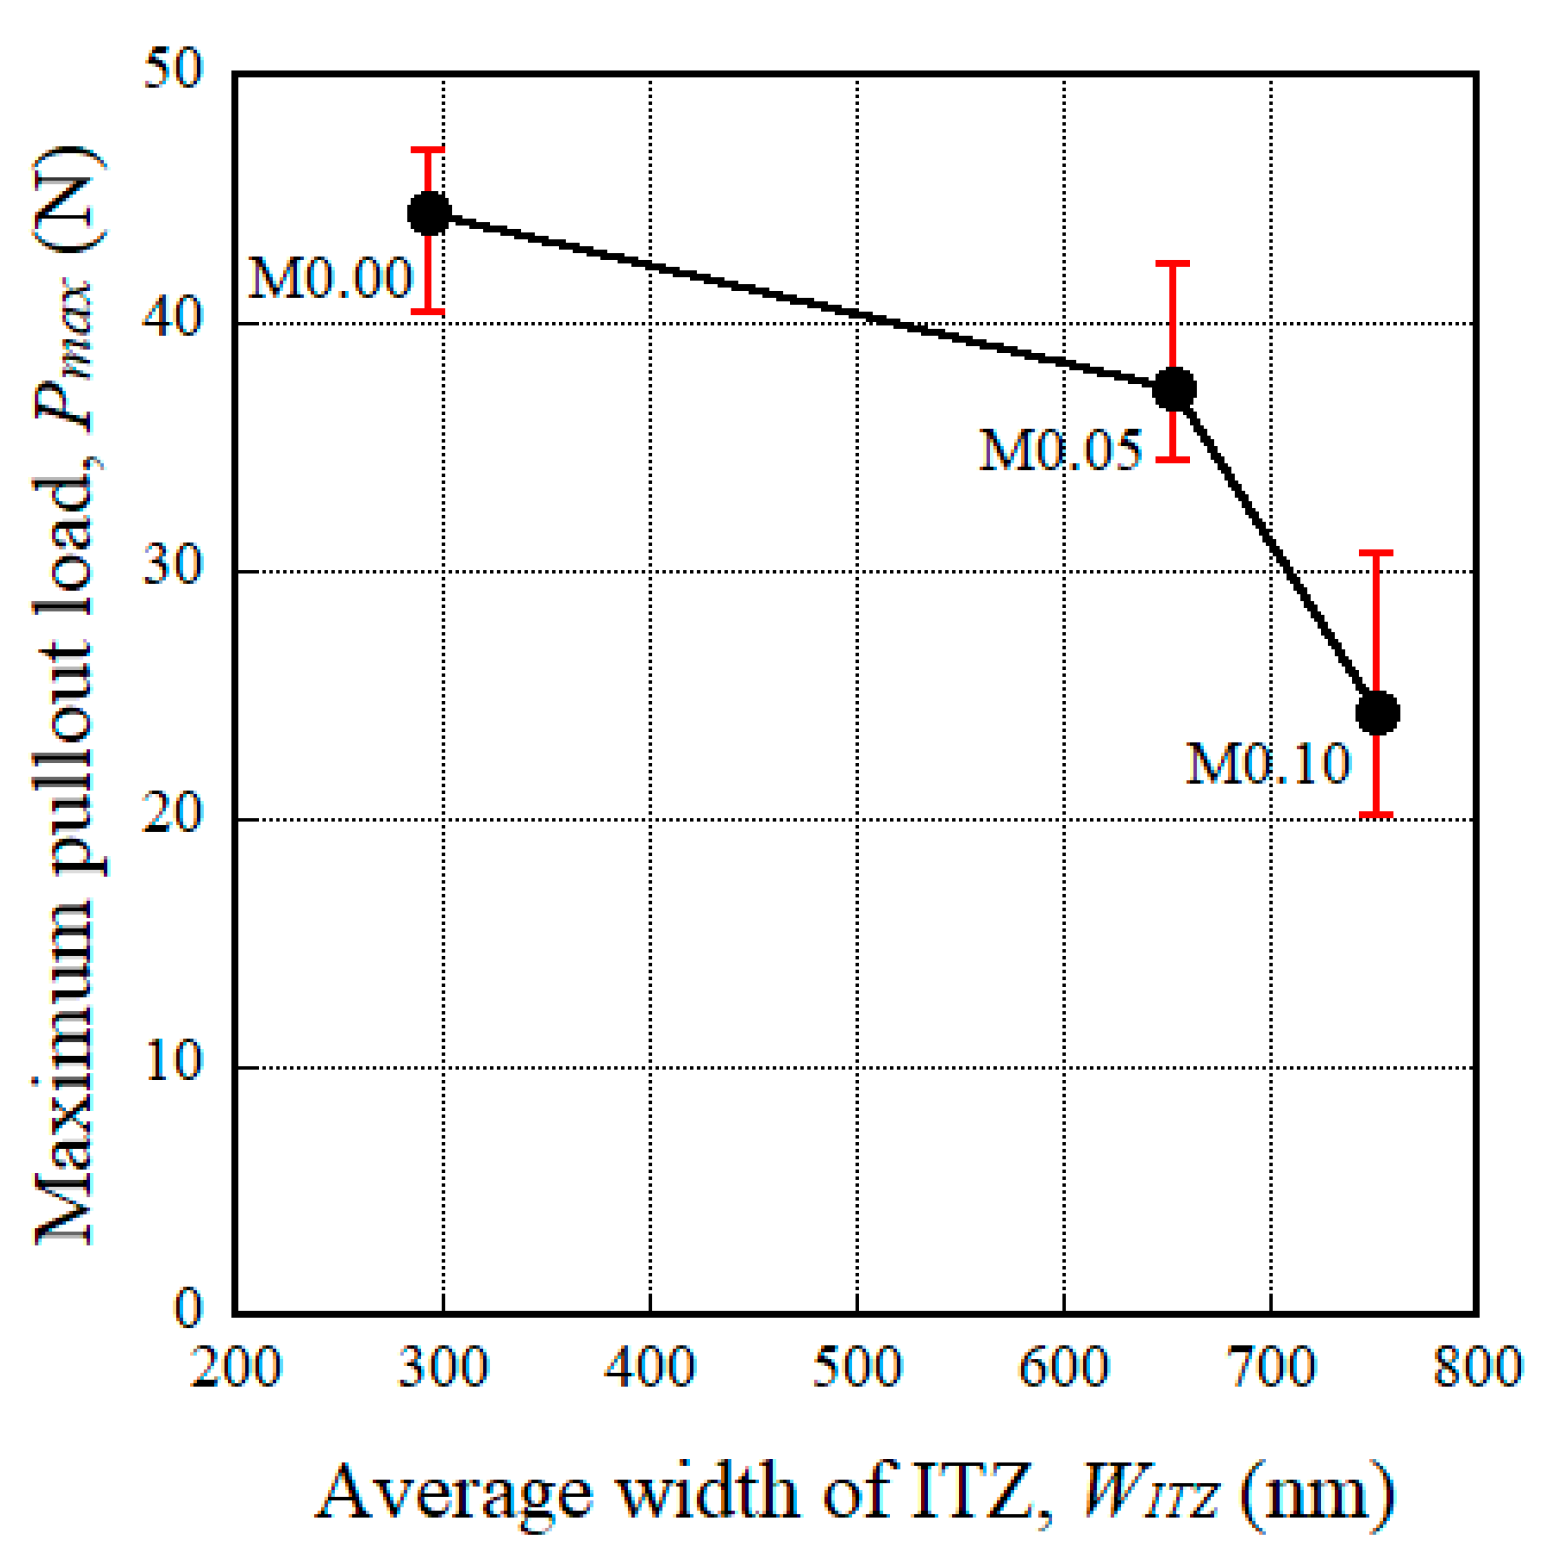
Figure 13.
Field-emission scanning electron microscopy (FE-SEM) images of steel fiber surfaces after pullout: (a) M0.00, (b) M0.05, and (c) M0.10.
Figure 13.
Field-emission scanning electron microscopy (FE-SEM) images of steel fiber surfaces after pullout: (a) M0.00, (b) M0.05, and (c) M0.10.

Figure 14.
Effects of the equivalent bond strength on (a) the number of multiple micro-cracks and (b) the reduction in the electrical resistivity.
Figure 14.
Effects of the equivalent bond strength on (a) the number of multiple micro-cracks and (b) the reduction in the electrical resistivity.


Table 1.
Matrix composition by weight ratio and properties.
| Series | Cement (Type III) | Milled Glass Fiber | Silica Sand | Fly Ash | Superplasticizer † | Water | f’ck (MPa) | ρm (kΩ·cm) |
|---|---|---|---|---|---|---|---|---|
| M0.00 | 1.0 | 0.00 | 1.0 | 0.15 | 0.005–0.006 (0.0055) | 0.35 | 95 | 45.9 |
| M0.05 | 0.95 | 0.05 | 0.0055–0.006 (0.0055) | 89 | 110.3 | |||
| M0.10 | 0.90 | 0.10 | 0.005–0.0065 (0.006) | 83 | 75.8 |
† The solid content of superplasticizer is 25%.
Table 2.
Properties of fibers.
| Fiber Type | Length, lf (mm) | Diameter, df (mm) | Density (g/cm3) | Tensile Strength (MPa) | Elastic Modulus (GPa) | Aspect Ratio, lf/df |
|---|---|---|---|---|---|---|
| Long smooth steel fiber | 30 | 0.3 | 7.90 | 2447 | 200 | 100 |
| Medium smooth steel fiber | 19.5 | 0.2 | 7.90 | 2942 | 200 | 97.5 |
| Milled glass fiber | 0.3 | 0.0135 | 0.58 | 3367 | 0.76 | 22.2 |
Table 3.
Chemical components of milled glass fibers (MGFs).
| Chemical Composition | Content (wt %) |
|---|---|
| Silicon dioxide (SiO2) | 54 |
| Calcium oxide (CaO) | 17 |
| Aluminum oxide (Al2O3) | 13 |
| Boron oxide (B2O3) | 6 |
| Magnesium oxide (MgO) | 6 |
| Sodium oxide (Na2O) | 1 |
| Fluorine (F2) | 0.75 |
| Fluorine oxide (F2O3) | 0.75 |
| Titanium oxide (TiO2) | 0.75 |
| Strontium oxide (SrO) | 0.75 |
Table 4.
Tensile parameters of HPFRCCs containing MGFs.
| Notation | No. | Tensile Strain (%) | Tensile Stress (MPa) | Equivalent Number of Cracks, ncr | ||
|---|---|---|---|---|---|---|
| εcc | εpc | σcc | σpc | |||
| M0.00 | SP1 | 0.024 | 0.64 | 5.6 | 12.5 | 17.7 |
| SP2 | 0.025 | 0.70 | 5.6 | 12.1 | 17.3 | |
| SP3 | 0.025 | 0.70 | 5.5 | 12.1 | 18.2 | |
| Aver.a | 0.025 | 0.68 | 5.6 | 12.2 | 17.7 | |
| STD b | 0.00 | 0.03 | 0.05 | 0.19 | 0.37 | |
| M0.05 | SP1 | 0.030 | 0.76 | 6.1 | 12.7 | 27.7 |
| SP2 | 0.027 | 0.64 | 5.8 | 12.5 | 24.2 | |
| SP3 | 0.028 | 0.77 | 6.2 | 12.4 | 26.6 | |
| Aver. | 0.028 | 0.72 | 6.0 | 12.5 | 26.2 | |
| STD | 0.00 | 0.06 | 0.17 | 0.12 | 1.46 | |
| M0.10 | SP1 | 0.020 | 0.64 | 5.7 | 10.8 | 18.3 |
| SP2 | 0.019 | 0.70 | 4.9 | 10.0 | 17.5 | |
| SP3 | 0.029 | 0.73 | 5.4 | 11.4 | 19.0 | |
| Aver. | 0.023 | 0.69 | 5.3 | 10.7 | 18.3 | |
| STD | 0.00 | 0.04 | 0.33 | 0.57 | 0.61 | |
a Aver.: average value; b STD: standard deviation.
Table 5.
Electromechanical parameters of HPFRCCs containing MGFs.
| Notation | No. | Electrical Resistivity (kΩ·cm) | Reduction in the Electrical Resistivity (kΩ·cm) | Δρ/ncr(kΩ·cm) | ||||
|---|---|---|---|---|---|---|---|---|
| ρ0 | ρcc | ρpc | Δρ | Δρ1 | Δρ2 | |||
| M0.00 | SP1 | 26.25 | 24.13 | 9.12 | 17.13 | 2.12 | 15.01 | 0.94 |
| SP2 | 26.30 | 23.72 | 9.83 | 16.47 | 2.59 | 13.89 | 0.93 | |
| SP3 | 23.67 | 22.08 | 5.47 | 18.20 | 1.58 | 16.61 | 0.95 | |
| Aver. | 25.41 | 23.31 | 8.14 | 17.27 | 2.10 | 15.17 | 0.94 | |
| STD | 1.23 | 0.89 | 1.91 | 0.71 | 0.41 | 1.12 | 0.01 | |
| M0.05 | SP1 | 65.04 | 63.45 | 39.86 | 25.18 | 1.59 | 23.60 | 0.91 |
| SP2 | 60.06 | 55.65 | 34.39 | 25.67 | 4.41 | 21.26 | 1.06 | |
| SP3 | 64.23 | 61.80 | 38.41 | 25.83 | 2.43 | 23.40 | 1.39 | |
| Aver. | 63.11 | 60.30 | 37.55 | 25.56 | 2.81 | 22.75 | 1.12 | |
| STD | 2.18 | 3.36 | 2.31 | 0.28 | 1.18 | 1.06 | 0.20 | |
| M0.10 | SP1 | 47.01 | 44.70 | 38.22 | 8.80 | 2.31 | 6.49 | 0.50 |
| SP2 | 48.02 | 43.73 | 38.66 | 9.36 | 4.29 | 5.07 | 0.54 | |
| SP3 | 46.40 | 43.66 | 32.69 | 13.71 | 2.75 | 10.96 | 0.72 | |
| Aver. | 47.14 | 44.03 | 36.52 | 10.62 | 3.12 | 7.51 | 0.59 | |
| STD | 0.67 | 0.47 | 2.72 | 2.19 | 0.85 | 2.51 | 0.10 | |
Table 6.
Pullout parameters of steel fibers embedded in a mortar mixture containing MGFs.
| Notation | No. | Maximum Pullout Load, Pmax (N) | Equivalent Bond Strength, τeq (MPa) | Pullout Energy, PW (N·mm) |
|---|---|---|---|---|
| M0.00 | SP1 | 44.50 | 1.40 | 148.54 |
| SP2 | 37.95 | 1.76 | 186.25 | |
| SP3 | 43.35 | 1.43 | 151.93 | |
| Aver. | 41.93 | 1.53 | 162.24 | |
| STD | 2.86 | 0.16 | 17.03 | |
| M0.05 | SP1 | 41.85 | 2.48 | 262.82 |
| SP2 | 34.55 | 2.37 | 251.59 | |
| SP3 | 34.00 | 2.19 | 232.07 | |
| Aver. | 36.80 | 2.35 | 248.83 | |
| STD | 3.58 | 0.12 | 12.70 | |
| M0.10 | SP1 | 30.80 | 1.96 | 207.93 |
| SP2 | 20.25 | 1.62 | 171.45 | |
| SP3 | 22.00 | 1.98 | 209.42 | |
| Aver. | 24.35 | 1.85 | 196.27 | |
| STD | 4.62 | 0.17 | 17.56 |
Table 7.
Pore sizes and widths of the interfacial transition zone (ITZ).
| Notation | Position No. | Pore Size, Dpore (μm) | Width of the ITZ, WITZ (nm) |
|---|---|---|---|
| M0.00 | Pos.1 | 395 | 239 |
| Pos.2 | 247 | 222 | |
| Pos.3 | 336 | 337 | |
| Pos.4 | 174 | 376 | |
| Aver. | 288 | 294 | |
| STD | 84 | 65 | |
| M0.05 | Pos.1 | 138 | 379 |
| Pos.2 | 148 | 912 | |
| Pos.3 | 169 | 595 | |
| Pos.4 | 138 | 731 | |
| Aver. | 148 | 654 | |
| STD | 13 | 195 | |
| M0.10 | Pos.1 | 215 | 397 |
| Pos.2 | 204 | 171 | |
| Pos.3 | 195 | 1180 | |
| Pos.4 | 187 | 1260 | |
| Aver. | 200 | 752 | |
| STD | 10 | 476 |
© 2018 by the authors. Licensee MDPI, Basel, Switzerland. This article is an open access article distributed under the terms and conditions of the Creative Commons Attribution (CC BY) license (http://creativecommons.org/licenses/by/4.0/).
Share and Cite
MDPI and ACS Style
Kim, M.K.; Kim, D.J. Electromechanical Response of High-Performance Fiber-Reinforced Cementitious Composites Containing Milled Glass Fibers under Tension. Materials 2018, 11, 1115. https://doi.org/10.3390/ma11071115
AMA Style
Kim MK, Kim DJ. Electromechanical Response of High-Performance Fiber-Reinforced Cementitious Composites Containing Milled Glass Fibers under Tension. Materials. 2018; 11(7):1115. https://doi.org/10.3390/ma11071115
Chicago/Turabian StyleKim, Min Kyoung, and Dong Joo Kim. 2018. "Electromechanical Response of High-Performance Fiber-Reinforced Cementitious Composites Containing Milled Glass Fibers under Tension" Materials 11, no. 7: 1115. https://doi.org/10.3390/ma11071115
Note that from the first issue of 2016, this journal uses article numbers instead of page numbers. See further details here.