Microstructure and Properties of Thermal Electrode Material Si3N4–MoSi2 Composite Ceramics

1
School of Mechanical and Ocean Engineering, Huaihai Institute of Technology, Lianyungang 222005, China
2
Marine Resources Development Institute of Jiangsu, Lianyungang 222001, China
*
Author to whom correspondence should be addressed.
Materials 2018, 11(6), 986; https://doi.org/10.3390/ma11060986
Submission received: 11 May 2018
/
Revised: 5 June 2018
/
Accepted: 9 June 2018
/
Published: 11 June 2018
Abstract
:With good high temperature and corrosive resistance performance, ceramic based composites can be used as promising materials to replace metal thermocouple materials. In this study, Si3N4–MoSi2 composites were prepared via hot pressing technology. X-ray diffraction (XRD), optical microscopy (OM), and scanning electron microscopy (SEM) were used to analyze the microstructure of the composites. The mechanical properties and electrical conductivity were tested. The results showed that the composites were composed of β-Si3N4, MoSi2, a small amount of Mo5Si3, and an amorphous glassy phase. The MoSi2 phase was evenly distributed in the matrix. The percolation network was formed with increasing MoSi2 content. The strength of the composites reached its maximum value when the MoSi2 content reached a critical point. The electrical conductivity behaved like a typical percolation phenomenon. The percolation threshold was about 30% to 45%.
1. Introduction
The thermocouple is the most widely used temperature testing device in many industrial areas [1,2,3]. To realize accurate temperature testing in a high temperature and corrosive environment, a corrosive and high temperature resistance tube has to be used to protect the metallic thermocouple material [4,5,6,7,8]. However, the application of the protection tube will reduce the stability and accuracy of the thermocouples due to the change of thermo-electrical potential resulting from the variation of the physical status of the metal electrode materials.
With increasing requirements from metallurgy, chemical, and aerospace engineering, the stable properties of thermocouple materials, which can be used in high temperature and corrosive environments, is still a big challenge in materials science, especially when they are used in molten salt electrolysis as the temperature testing device. Apart from the temperature range, the testing accuracy is another important factor that needs to be considered. As a result, a traditional metallic thermocouple is not able to satisfy the requirements when they are exposed to the above-mentioned working environments. Based on this condition, ceramic based composites, which have good high temperature and corrosive resistance performance, have been used as candidate materials to replace metallic thermocouple materials [9,10,11,12,13].
Disordered ceramic composites are composed of at least two types of ceramics, which combines the advantages of each component. Previous studies have demonstrated that Si3N4–MoSi2 composites have good mechanical, anti-oxidation, and corrosive resistance performances [14,15,16,17,18]. As a result, they are able to be used as candidate materials to fabricate thermocouple electrode materials. In this study, the mechanical and electrical properties and microstructure of Si3N4–MoSi2 composites were tested and analyzed to shed light on their potential application as new high temperature and corrosive resistance thermocouple materials.
2. Experimental
The Si3N4 powders were provided by Shinuorui Co. Ltd., Fuzhou, China and the MoSi2 powder was provided by Yantai Torch Special High Temperature Ceramics Co. Ltd., Yantai, China. The chemical contents are listed in Table 1, and the microstructures are depicted in Figure 1. All materials were used as received without further purification.
As can be seen from the chemical contents and microstructures, the purity of the α-Si3N4 was higher than 92% with an average size of 1 μm. The purity of La2O3, and MoSi2 was higher than 99% with size of 10 μm, and the purity of Y2O3 was higher than 99% with an average size of 15 μm, as shown in Table 1.
As listed in Table 2, the contents of MoSi2 were 30 wt %, 45 wt %, and 60 wt %, with 5 wt % of La2O3, 5 wt % of Y2O3 and the rest of Si3N4. Before the hot pressing process, the powders were ball-milled in dehydrated ethyl alcohol for 10 h, and subsequently dried in a vacuum furnace at 100 °C. After drying, the temperature was raised to 1750 °C with a heating rate of 30 °C/min, followed by hot pressing with 25 MPa and a 60 min soak in a graphite mold. The furnace chamber was purged with 0.5 atm of argon gas from the start of the hot pressing procedure. The relative densities of the prepared samples were tested according to the Archimedes method. The flexural strengths were tested through a three point bending method in a universal testing machine (Instron-5569, Instron, Norwood, CO, USA). The size of the samples were 3 × 4 × 36 mm3, and the flexural strength were calculated according to the following equation:
where F is the fracture loading; L is the space between the two points; and b and h are the width and thickness of the samples, respectively. The loading rate was 0.5 mm/min. The final results were the arithmetic average value of three samples. Before testing, the surfaces of the samples were polished to avoid stress concentration.
Thermal shock resistance is one of the most important properties of ceramic materials. It reflects the fracture resistance of a material with exposure to sharp temperature change conditions. In general, the thermal shock resistance can be characterized by the strength remaining rate after thermal shock testing, expressed as [19]:
where ηrem is the flexural strength remaining rate; σT is the flexural strength of the material experienced n time thermal shocking at temperature T; and σ0 is the original flexural strength. The samples for the remaining strength tests were air cooled at various temperatures 10 times. The final results were the arithmetic average value of three samples.
The phase structures were determined by X-ray diffraction pattern (XRD) on a Rigaku D/max-rA X-ray diffractometer with Cu Kα radiation (λ = 1.5406 Å) (Rigaku Corporation, Tokyo, Japan). The surface morphologies of the samples were observed by scanning electron microscopy with energy dispersive spectroscopy (SEM/EDS), performed on a Hitachi S-4700 scanning electron microscope (Hitachi Corporation, Tokyo, Japan). After that, the cross sectional optical microscopy was observed on Zeiss-MC80-DX (Zeiss, Oberkochen, Germany).
3. Results and Discussion
3.1. XRD Results and Optical Microstructure
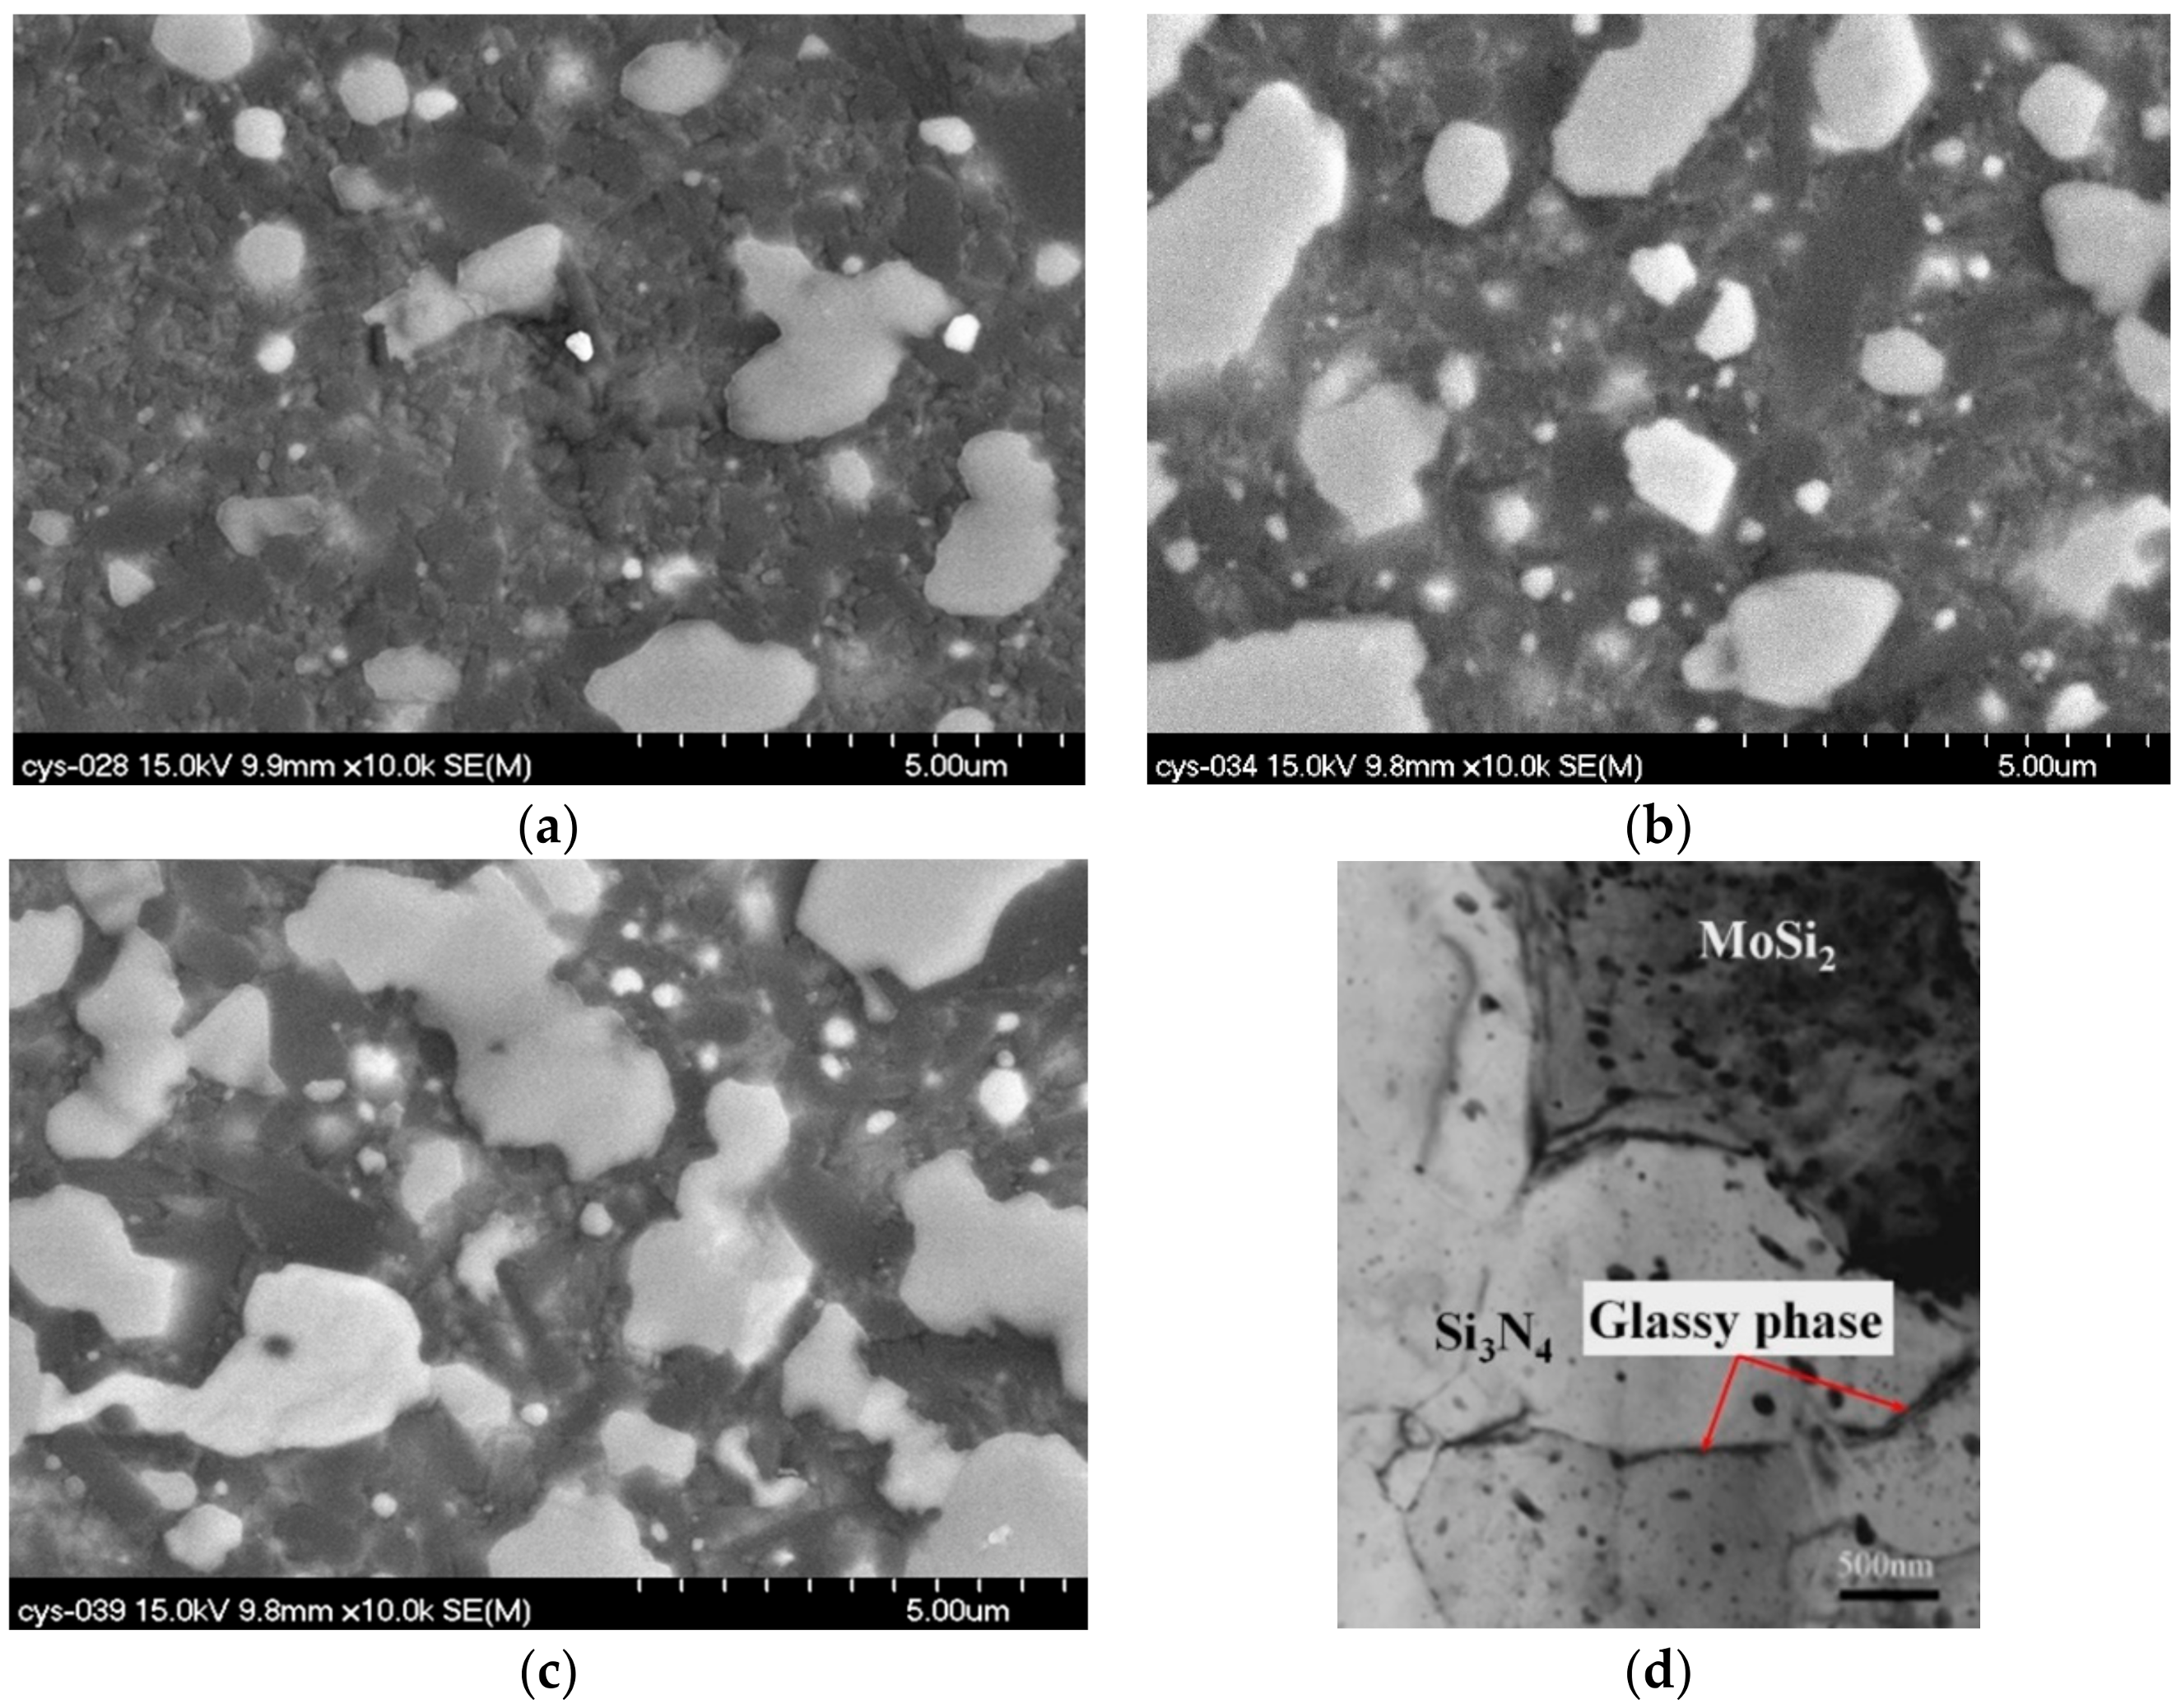
Figure 2 shows the XRD pattern of the Si3N4–MoSi2 composites. As demonstrated in this figure, the composites after hot compressing were mainly composed of the β-Si3N4 and MoSi2 phase. Neither Y nor La compounds were detected. Based on this result, it can be claimed that during the hot pressing process, the original α-Si3N4 changed to β-Si3N4, the sintering additives, Y2O3 and La2O3, reacted with the Si and O2 content and formed an amorphous glassy phase. In addition, small amounts of the Mo5Si3 phase could also be detected.
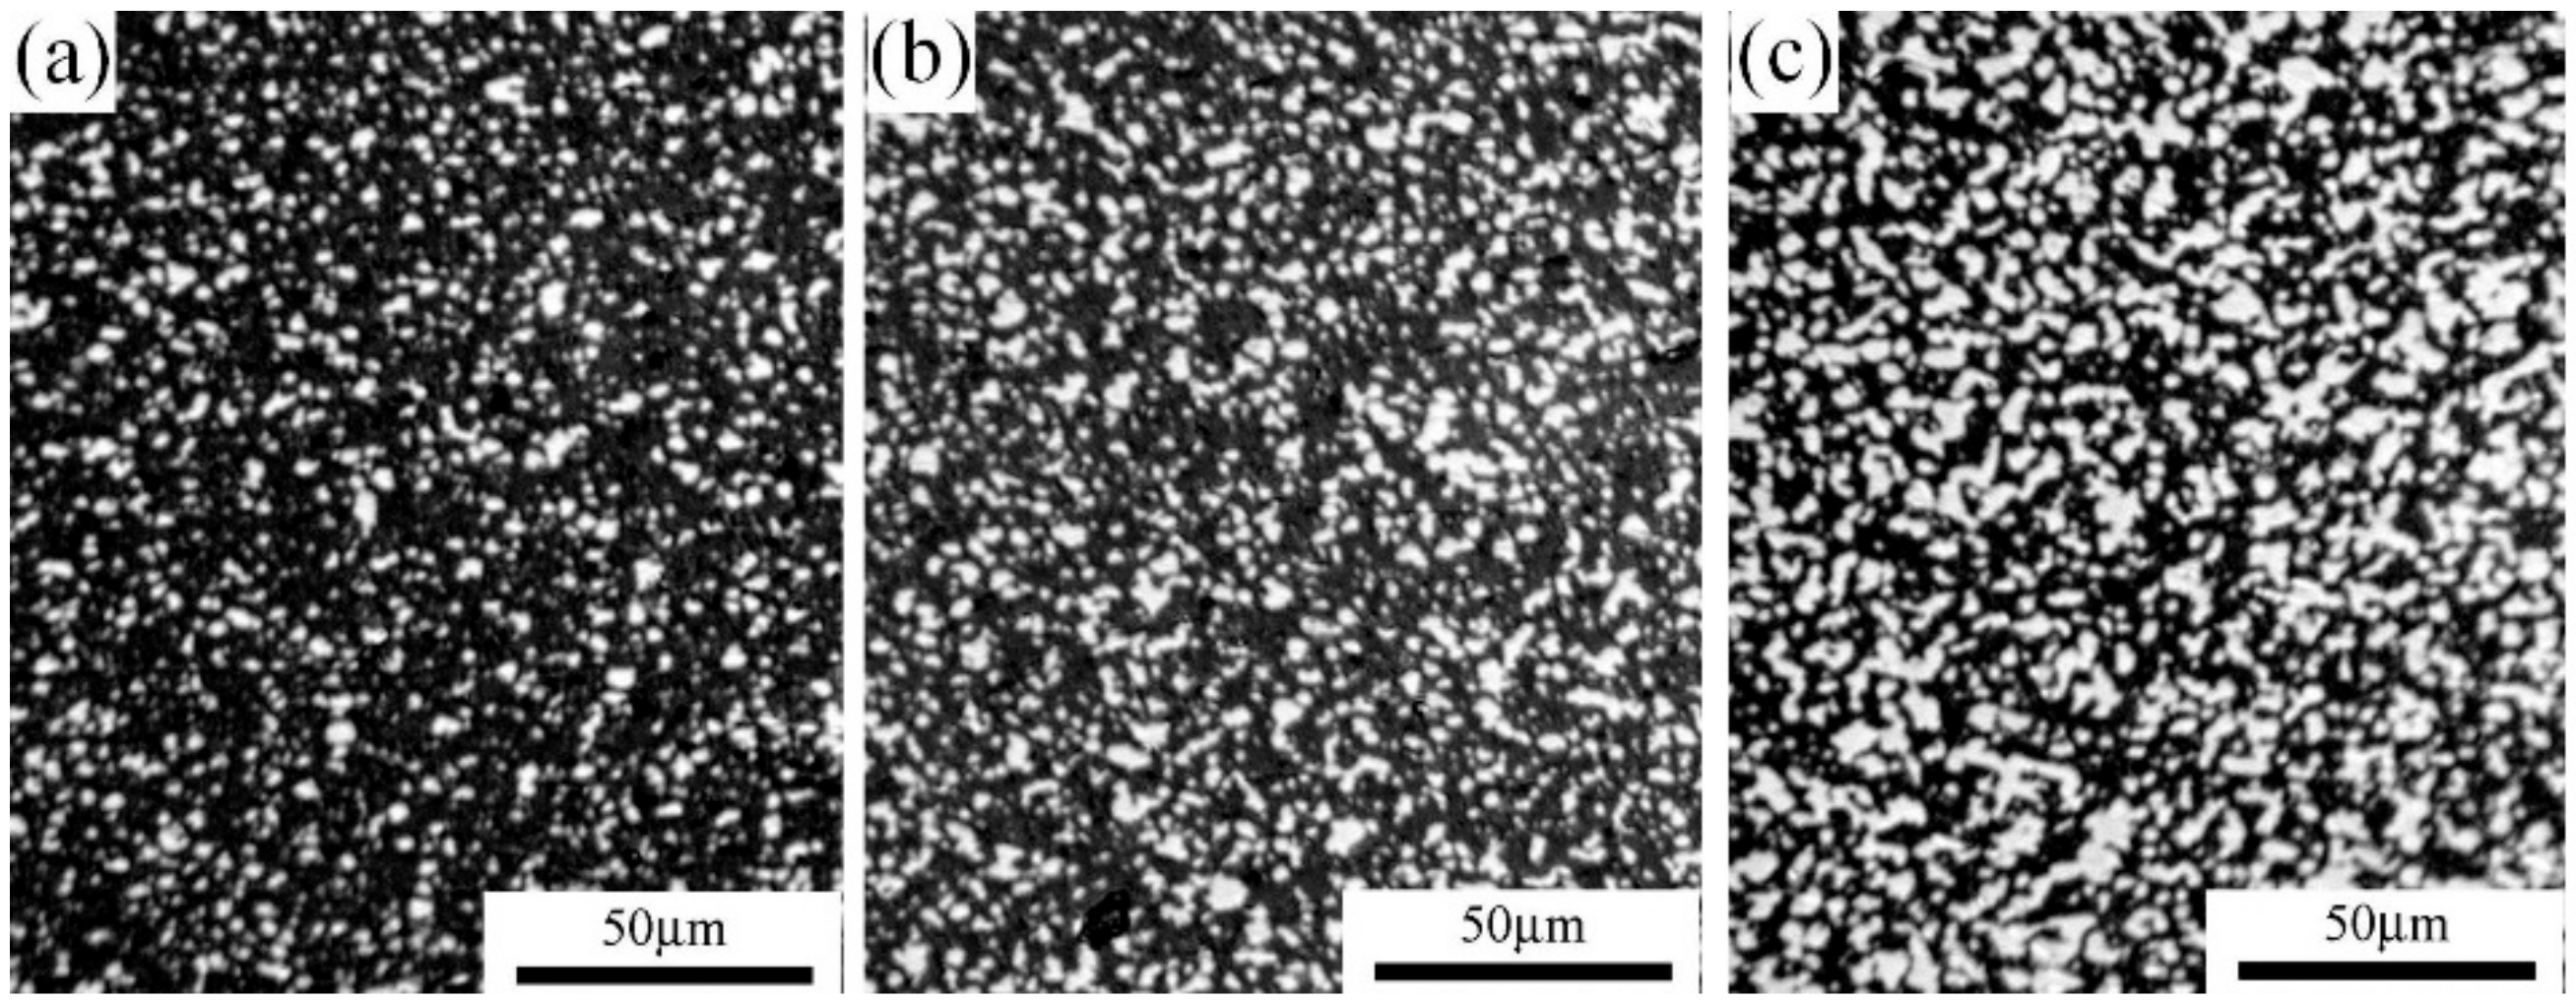
The densities of the prepared samples are shown in Figure 3. As demonstrated in this figure, the densities of Si3N4-30 wt % MoSi2, Si3N4-45 wt % MoSi2, and Si3N4-60 wt % MoSi2 were 4.66 g/cm3, 4.31 g/cm3, and 3.99 g/cm3, respectively. After calculation, the relative densities of the samples were 93.5%, 94.9%, and 95.7%. As can be seen from these results, the samples were all well sintered with a relatively low porosity of less than 6.5%. Previous studies have demonstrated that the densification of Si3N4–MoSi2 composites is still a challenge without sintering additives [20,21,22,23]. It was found that with the addition of Y and La, the densification could be significantly improved [24,25]. Figure 4 and Figure 5 show the optical microscopy, backscattering SEM (BSE), and transmission electron microscopy (TEM) images of Si3N4-30 wt % MoSi2, Si3N4-45 wt % MoSi2, and Si3N4-60 wt % MoSi2, respectively. In the OM and BSE, the white areas are the MoSi2 phase and the dark areas are the Si3N4 phase. As can be seen in these figures, these two phases were evenly distributed, and the interfaces between the two components were clear and smooth. Little microcracks could be observed. The size of the Si3N4 was about 3–8 μm, and the size of the MoSi2 was about 3–5 μm with a uniaxial shape. In addition, the size of the Si3N4 slightly reduced with the increasing weight contents of MoSi2.
3.2. Flexural Strength
Figure 6 shows the flexural strengths of the Si3N4–MoSi2 composites. As illustrated in this figure, the flexural strength of the composites reached 942 MPa, which was higher than that of the pure Si3N4 (781 MPa), when the filling content of MoSi2 reached 30 wt %. However, the flexural strength started to decrease with increasing MoSi2 content over 30 wt %. The flexural strength decreased to 535 MPa when the MoSi2 content reached 60 wt %.
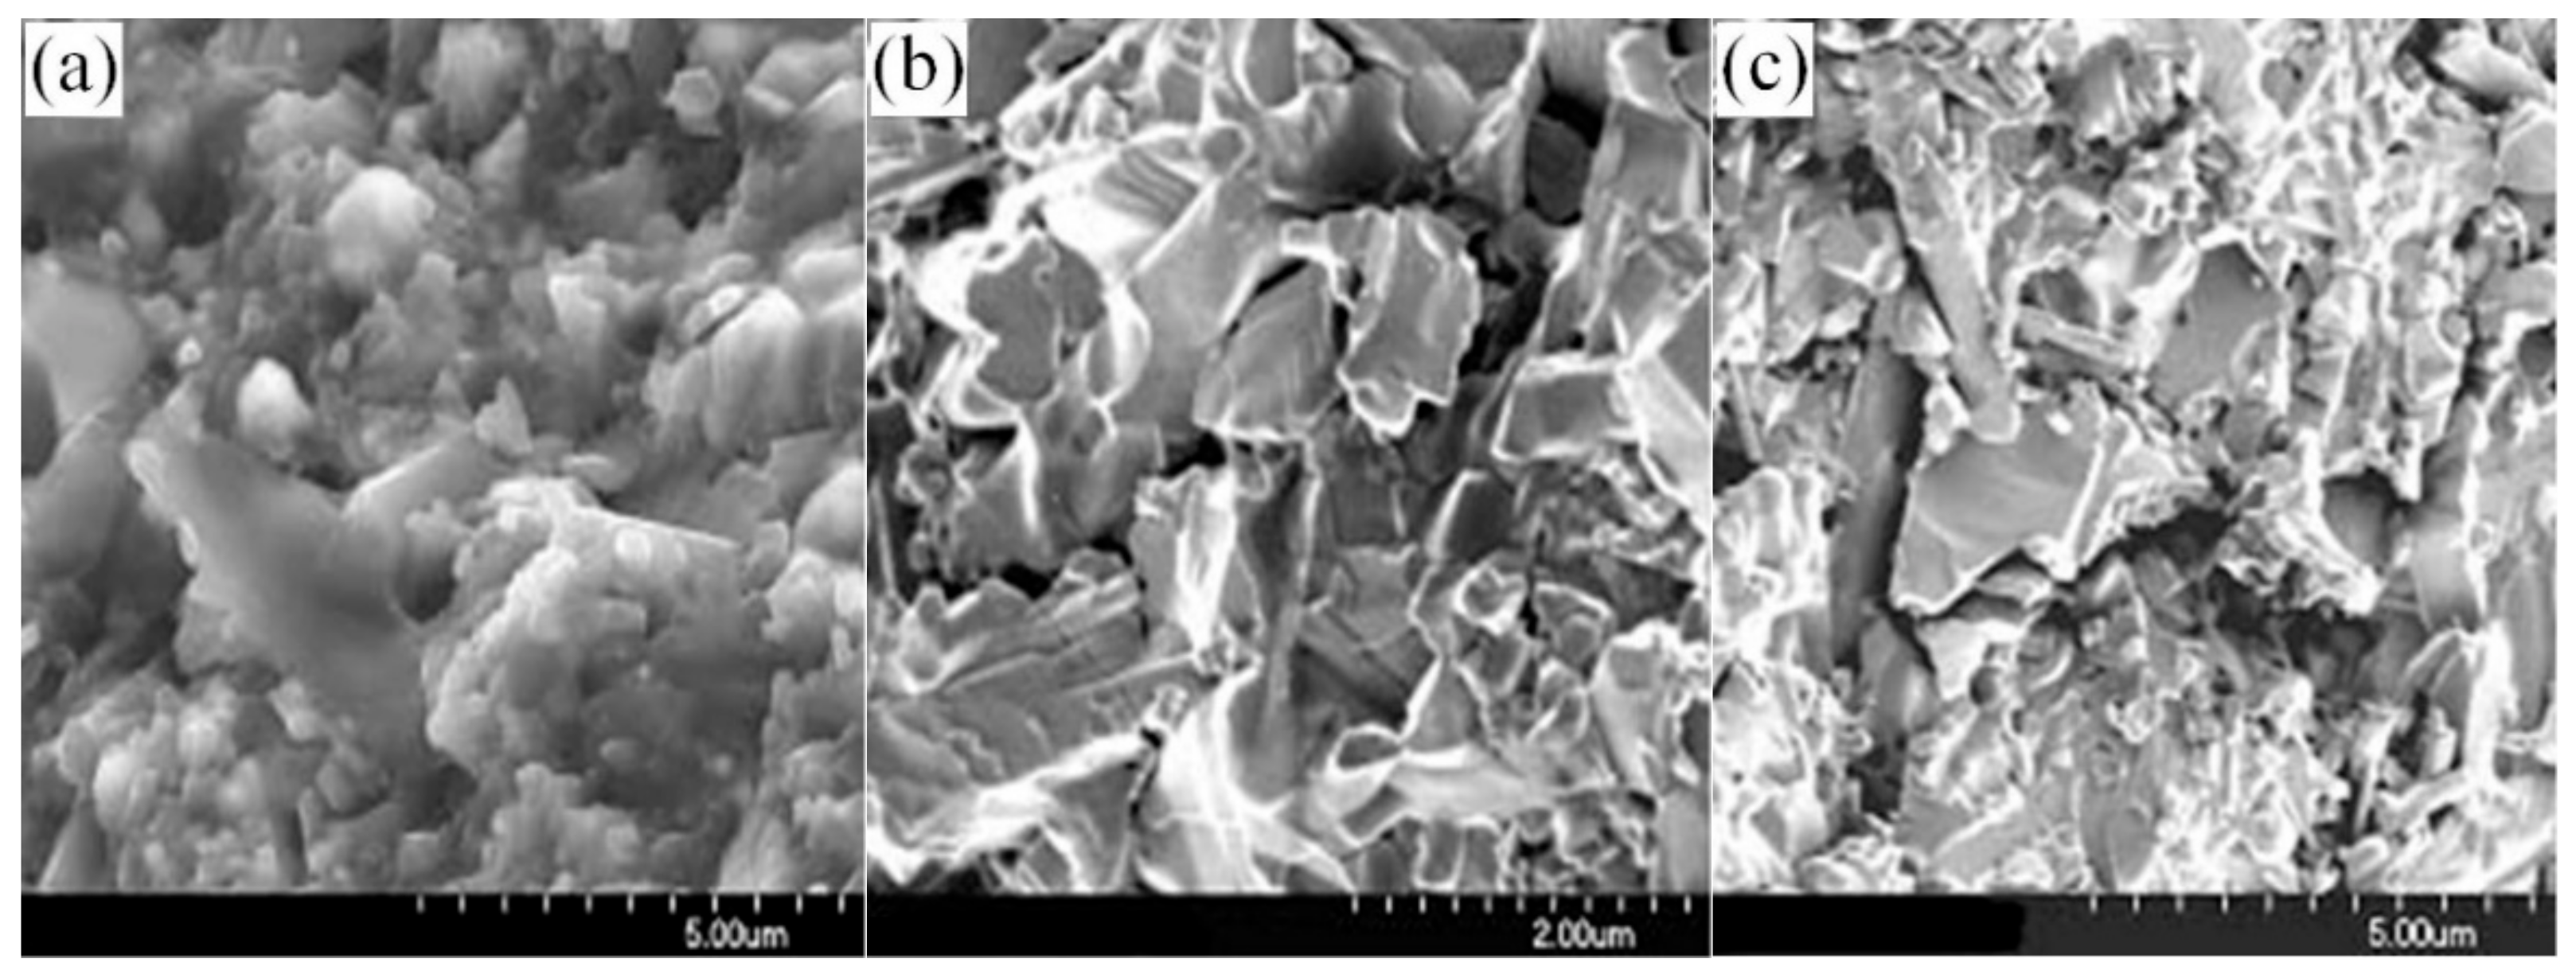
Figure 7 shows the SEM morphology of the Si3N4–MoSi2 composites. As demonstrated in this figure, the fracture of the composites was a typical inter-granular fracture. The grains of the Si3N4 were rod shaped and the grains of MoSi2 were equiaxial. In sample #1, the grain size of MoSi2 was relatively small with a size of about 3–5 μm. With an increase of MoSi2 content, the grain size of MoSi2 kept increasing slightly, and small amounts of randomly distributed rod shaped Si3N4 crystals were observed among the MoSi2 crystals. It can be concluded that with the addition of MoSi2, the flexural strength of the composites will start to decrease when the content of MoSi2 is higher than a critical value due to the increase of porosity and residual stresses.
3.3. Thermal Shock Resistance
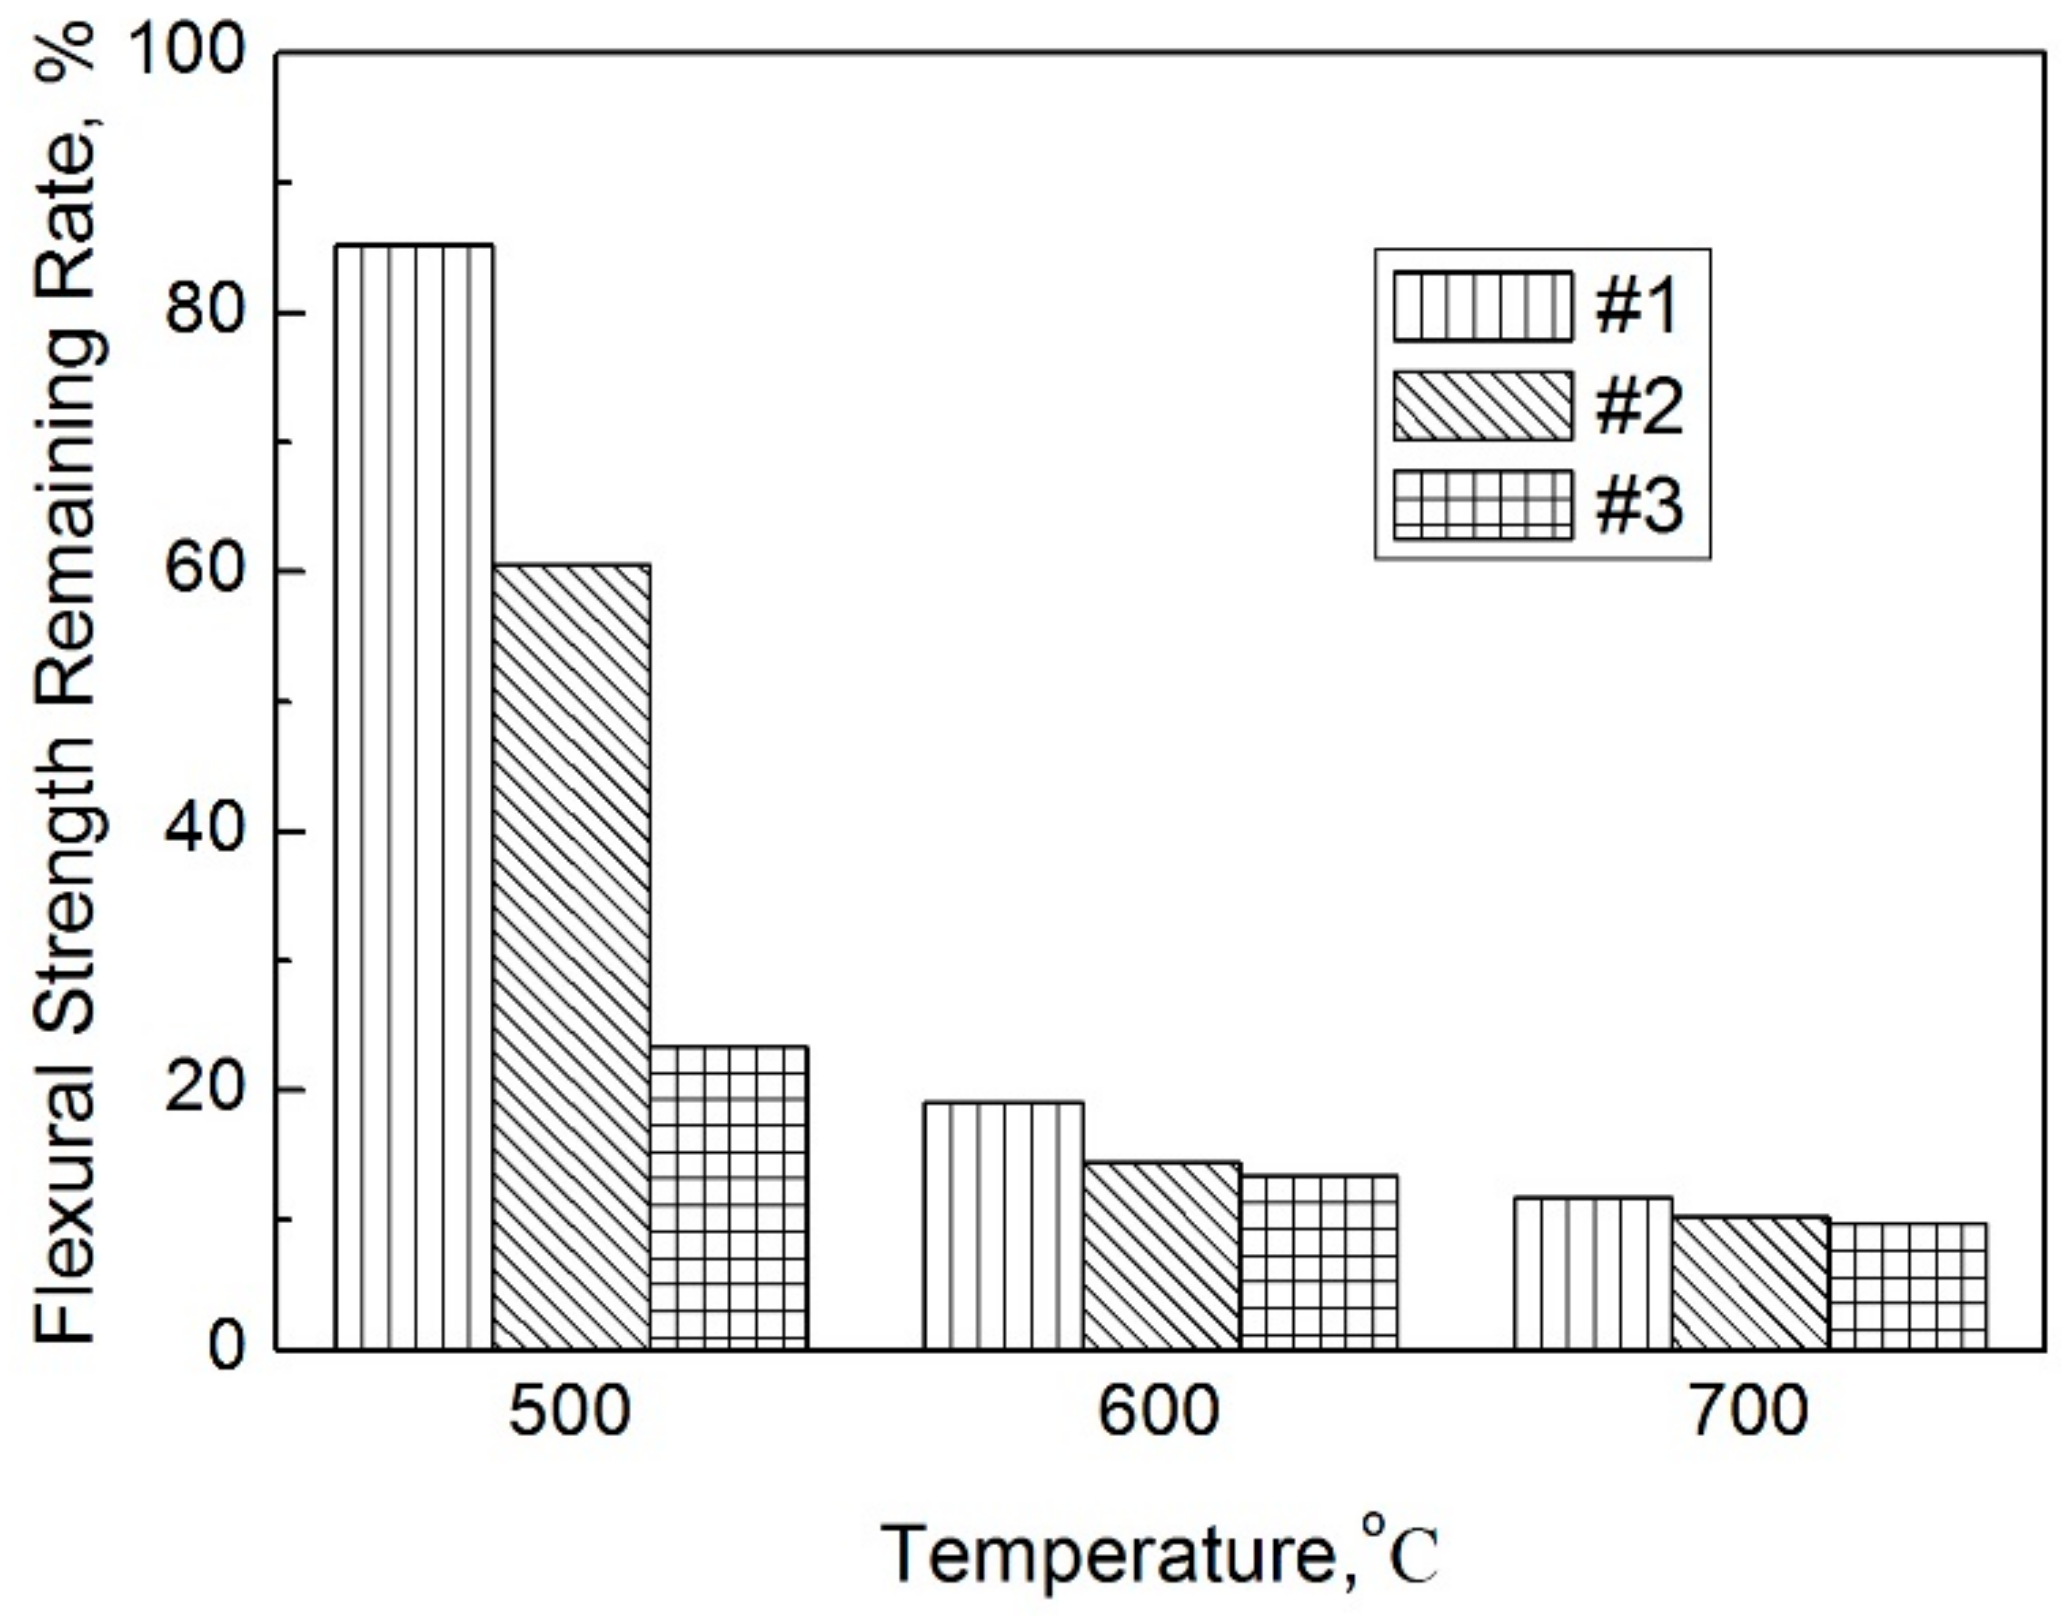
Figure 8 presents the flexural strength remaining rate of the Si3N4–MoSi2 composites at temperatures of 500 °C, 600 °C, and 700 °C after thermal shock testing 10 times. As demonstrated in this figure, the flexural strength remaining rates were 85.2%, 60.5%, and 23.4% corresponding to samples #1, #2, and #3, respectively, when the thermal shock temperature was 500 °C. When the thermal shock testing temperature increased to 600 °C and 700 °C, the flexural strength remaining rate was lower than 20%.
Figure 9 shows the SEM microstructure of the fracture surface of sample #1. As demonstrated in this figure, microcracks could be clearly observed when compared with the samples without thermal shock experience. In addition, the quantity and size of the microcracks increased with increasing thermal shock testing temperatures, which resulted from the internal stresses due to the thermal expansion mismatch. As a result, the flexural strengths decreased with the increasing internal stress and thermal mismatch of the two main constituents.
3.4. Electrical Conductivity
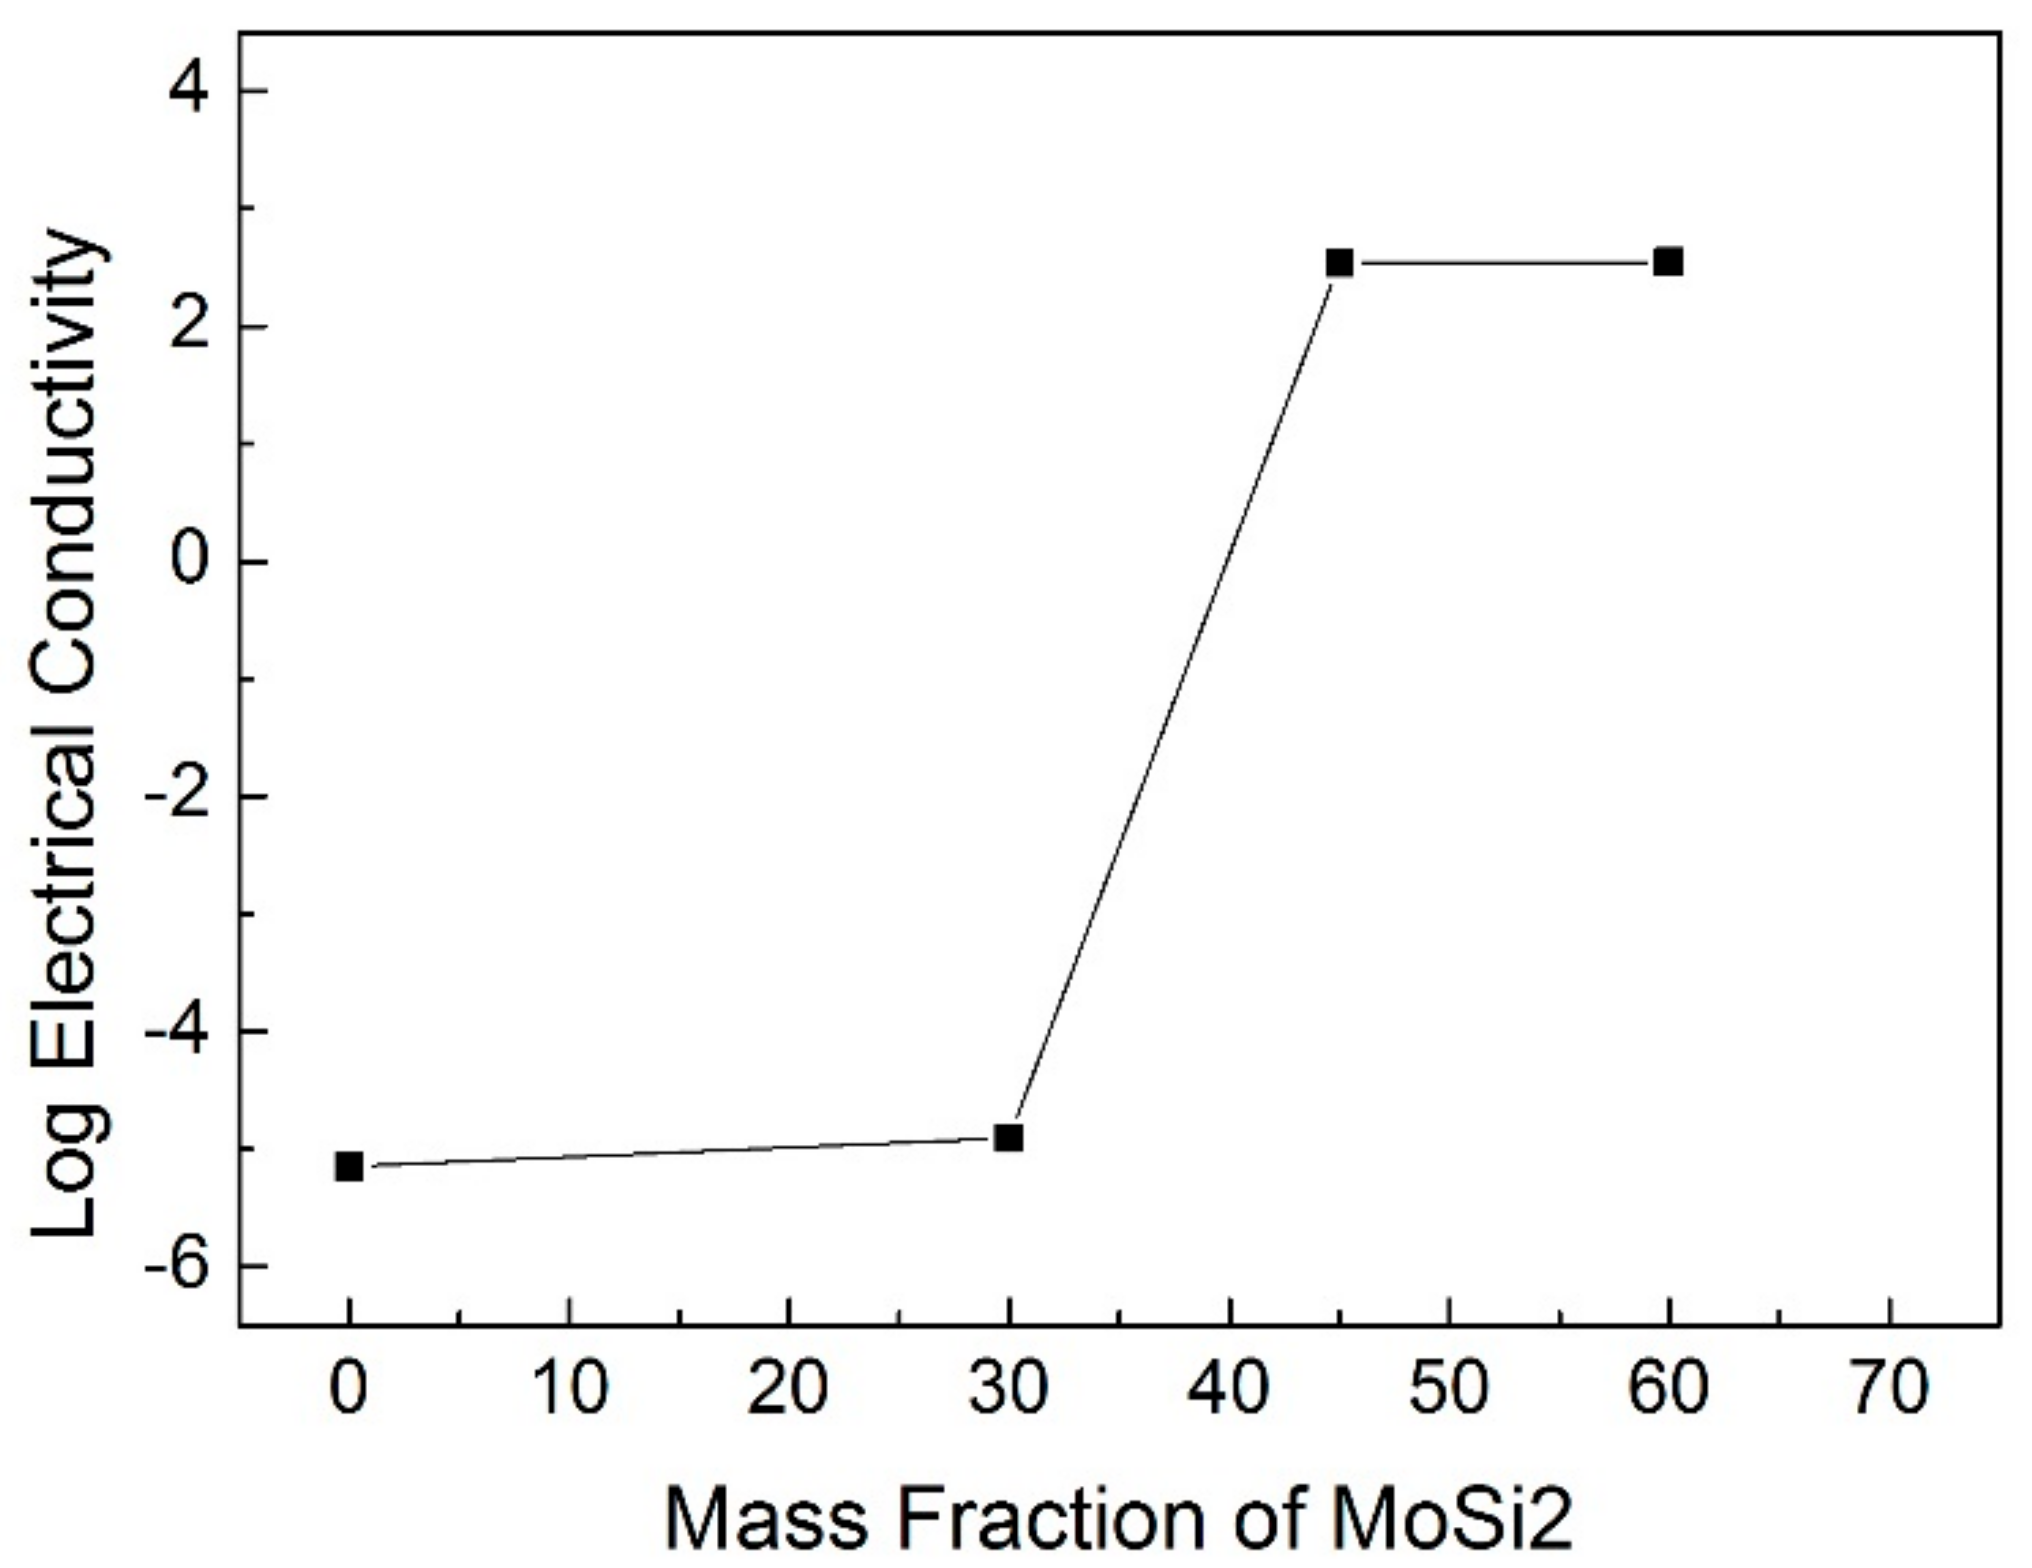
Figure 10 illustrates the electrical conductivity of the Si3N4–MoSi2 composites as a function of filling content of MoSi2. As shown in this figure, the addition of the MoSi2 could considerably increase the electrical conductivity of the composites. When the content of MoSi2 reached 30 wt %, the electrical conductivity was 1.25 × 10⁻⁵ Ω−1·m−1; when the content increased to 45 wt %, the electrical conductivity increased seven orders of magnitude and reached 3.45 × 10² Ω−1·m−1. After this value, the electrical conductivity increasing rate became flat. This phenomenon can be explained by the percolation theory [13]. Before the percolation threshold, which means that the content of MoSi2 is relatively low, the MoSi2 is randomly distributed in the matrix, but no percolation network can be formed. Under this condition, the electrical conductivity is mainly determined by the matrix material, and shows low electrical conductivity. When the MoSi2 content increased above the percolation threshold, the percolation network of MoSi2 formed, and as a result, the electrical conductivity was mainly contributed by the MoSi2 phase rather than the matrix, thus showing high electrical conductivity. In this study, it can be claimed that the percolation threshold is located between 30 wt % to 45 wt %.
4. Conclusions
In summary, this study successfully prepared Si3N4–MoSi2 composites with hot pressing technology. The main constituents of the hot pressed Si3N4–MoSi2 composites were β-Si3N4 and MoSi2, and a small amount of the Mo5Si3 phase and glassy phase containing La and Y. The SEM morphology of the Si3N4–MoSi2 composites demonstrated that the fracture of the composites was a typical inter-granular fracture. The grains of the Si3N4 were rod shaped and the grains of MoSi2 were equiaxial. The strength of the Si3N4–MoSi2 composites decreased with increasing MoSi2 content. The flexural strength remaining rate of the Si3N4–MoSi2 composites at temperatures of 500 °C, 600 °C, and 700 °C after thermal shocking testing 10 times demonstrated that the flexural strength rates were 85.2%, 60.5%, and 23.4% corresponding to Si3N4-30 wt % MoSi2, Si3N4-45 wt % MoSi2, and Si3N4-60 wt % MoSi2, respectively, when the thermal shock temperature was 500 °C. When the thermal shock testing temperatures increased to 600 °C and 700 °C, the flexural strength remaining rates were lower than 20%.
Author Contributions
L.F. and X.Y. prepared the majority of the manuscript and formatted the references. L.F. provided the main inputs of the manuscript structure and the electrical properties analysis section. P.G. contributed other sections of the properties’ analysis. Y.H. provided the microstructure analysis section, the applications section and gave some valuable suggestions on the future studies.
Funding
This work was financially supported by the Natural Science Foundation of the Higher Education Institutions of Jiangsu Province (16KJB430003), the 333 Research Project of Jiangsu Province (BRA2016294), the Lianyungang Scientific Plan–Industrial Program (CG1614), the Lianyungang Scientific Plan–Joint Project of Industry–Academia–Research (CXY1522), the Natural Science Research Project of Huaihai Institute of Technology (Z2017001), and the Six Talent Peaks Program of Jiangsu Province (2013-ZBZZ-032).
Conflicts of Interest
The authors declare no conflict of interest.
References
- Kerlin, T.W. Practical Thermocouple Thermometry; Instrument Society of America: Research Triangle Park, NC, USA, 1999. [Google Scholar]
- Hunold, K. Thermocouple for High Temperatures. Adv. Mater. Process. 1986, 2, 4–5. [Google Scholar]
- Farrell, D.M.; Parmar, J.; Robbins, B.J. The Development of Ceramic-Based Thermocouples for Application in Gas Turbines. In Proceedings of the Turbo Expo 2001: ASME Turbo Expo 2001, New Orleans, LA, USA, 4–7 June 2001; pp. 1–5. [Google Scholar]
- Klein, R.; Medri, V.; Desmaison-Brut, M.; Bellosi, A.; Desmaison, J. Influence of Additives Content on the High Temperature Oxidation of Silicon Nitride based Composites. J. Eur. Ceram. Soc. 2003, 23, 603–611. [Google Scholar] [CrossRef]
- Taguchi, S.P.; Ribeiro, S. Silicon Nitride Oxidation Behaviour at 1000 and 1200 °C. J. Mater. Process. Technol. 2004, 147, 336–342. [Google Scholar] [CrossRef]
- Cook, J.; Khan, A.; Lee, E.; Mahapatra, M. Oxidation of MoSi2-based Composites. Mater. Sci. Eng. A 1992, 155, 183–198. [Google Scholar] [CrossRef]
- Berztiss, D.; Cerchiara, R.R. Oxidation of MoSi2 and Comparison with Other Silicide Materials. Mater. Sci. Eng. A 1992, 155, 165–181. [Google Scholar] [CrossRef]
- Tan, W.; Lin, X.P.; Ma, J.T.; Zhang, B.Q. Study on the Conductive Property of Si3N4-MoSi2 Composite Ceramics. Rare Met. Mater. Eng. 2011, 40, 196–198. [Google Scholar]
- Huang, Y.; Lin, J.; Zhang, H. Effect of Si3N4 Content on Microstructures and Antioxidant Properties of MoSi2/Si3N4 Composite Coatings on Mo Substrate. Ceram. Int. 2015, 41, 13903–13907. [Google Scholar] [CrossRef]
- Zhang, H.; Lv, J.; Wu, Y.; Gu, S.; Huang, Y.; Chen, Y. Oxidation Behavior of (Mo, W) Si2–Si3N4 Composite Coating on Molybdenum Substrate at 1600 °C. Ceram. Int. 2015, 41, 14890–14895. [Google Scholar] [CrossRef]
- Petrovic, J.J. Toughening Strategies for MoSi2-Based High Temperature Structural Silicides. Intermetallics 2000, 8, 1175–1182. [Google Scholar] [CrossRef]
- Petrovic, J.J.; Pena, M.I.; Kung, H.H. Fabrication and Microstructures of MoSi2 Reinforced-Si3N4 Matrix Composites. J. Am. Ceram. Soc. 1997, 80, 1111–1116. [Google Scholar] [CrossRef]
- Kirkpatrick, S. Percolation and Conduction. Rev. Mod. Phys. 1973, 45, 574–588. [Google Scholar] [CrossRef]
- Balat, M.; Czerniak, M.; Berjoan, R. Oxidation of Silicon Nitride under Standard Air or Microwave-Excited Air at High Temperature and Low Pressure. J. Mater. Sci. 1997, 32, 1187–1193. [Google Scholar] [CrossRef]
- Sheehan, J.E. Passive and Active Oxidation of Hot-pressed Silicon Nitride Materials with Two Magnesia Contents. J. Am. Ceram. Soc. 1982, 65, C111–C113. [Google Scholar] [CrossRef]
- Hebsur, M.G. Development and Characterization of SiC(f)/MoSi2-Si3N4(p) Hybrid Composites. Mater. Sci. Eng. A 1999, 216, 24–37. [Google Scholar] [CrossRef]
- Sadananda, K.; Feng, C.R.; Mitra, R.; Deevi, S.C. Creep and Fatigue Properties of High Temperature Silicides and Their Composites. Mater. Sci. Eng. A 1999, 216, 223–238. [Google Scholar] [CrossRef]
- Petrovic, J.J.; Pena, M.I.; Reimnis, I.E.; Sandlin, M.S.; Conzone, S.D.; Kung, H.H.; Butt, D.P. Mechanical Behavior of MoSi2 Reinforced-Si3N4 Matrix Composites. J. Am. Ceram. Soc. 1997, 80, 3070–3076. [Google Scholar] [CrossRef]
- Xie, N.; Shao, W.Z.; Zhen, L.; Feng, L.C. Mechanical and Physical Properties of Cu2O−xCu Cermet. In Mechanical Properties and Performance of Engineering Ceramics II: Ceramic Engineering and Science Proceedings; John Wiley & Sons: Hoboken, NJ, USA, 2007; Volume 27, pp. 423–434. [Google Scholar]
- Bundschuh, K.; Schüze, M.; Müller, C.; Greil, P.; Heider, W. Selection of Materials for Use at Temperatures Above 1500 °C in Oxidizing Atmospheres. J. Eur. Ceram. Soc. 1998, 18, 2389–2391. [Google Scholar] [CrossRef]
- Natesan, K.; Deevi, S.C. Oxidation Behavior of Molybdenum Silicides and Their Composites. Intermetallics 2000, 8, 1147–1158. [Google Scholar] [CrossRef]
- Kao, M.Y. Properties of Silicon Nitride-Molybdenum Disilicide Particulate Ceramic Composites. J. Am. Ceram. Soc. 1993, 76, 2879–2883. [Google Scholar] [CrossRef]
- Klemm, H.; Tangermann, K.; Schubert, C.; Hermel, W. Influence of Molybdenum Silicide Additions on High-Temperature Oxidation Resistance of Silicon Nitride Materials. J. Am. Ceram. Soc. 1996, 79, 2429–2435. [Google Scholar] [CrossRef]
- Schutze, K.B.M. Materials for Temperatures above 1500 °C in Oxidizing Atmospheres Part I: Basic Considerations on Materials Selection. Mater. Corros. 2001, 52, 204–212. [Google Scholar]
- Monteverde, F.; Bellosi, A. High Oxidation Resistance of Hot Pressed Silicon Nitride Containing Yttria and Lanthania. J. Eur. Ceram. Soc. 1998, 18, 2313–2321. [Google Scholar] [CrossRef]
Figure 1.
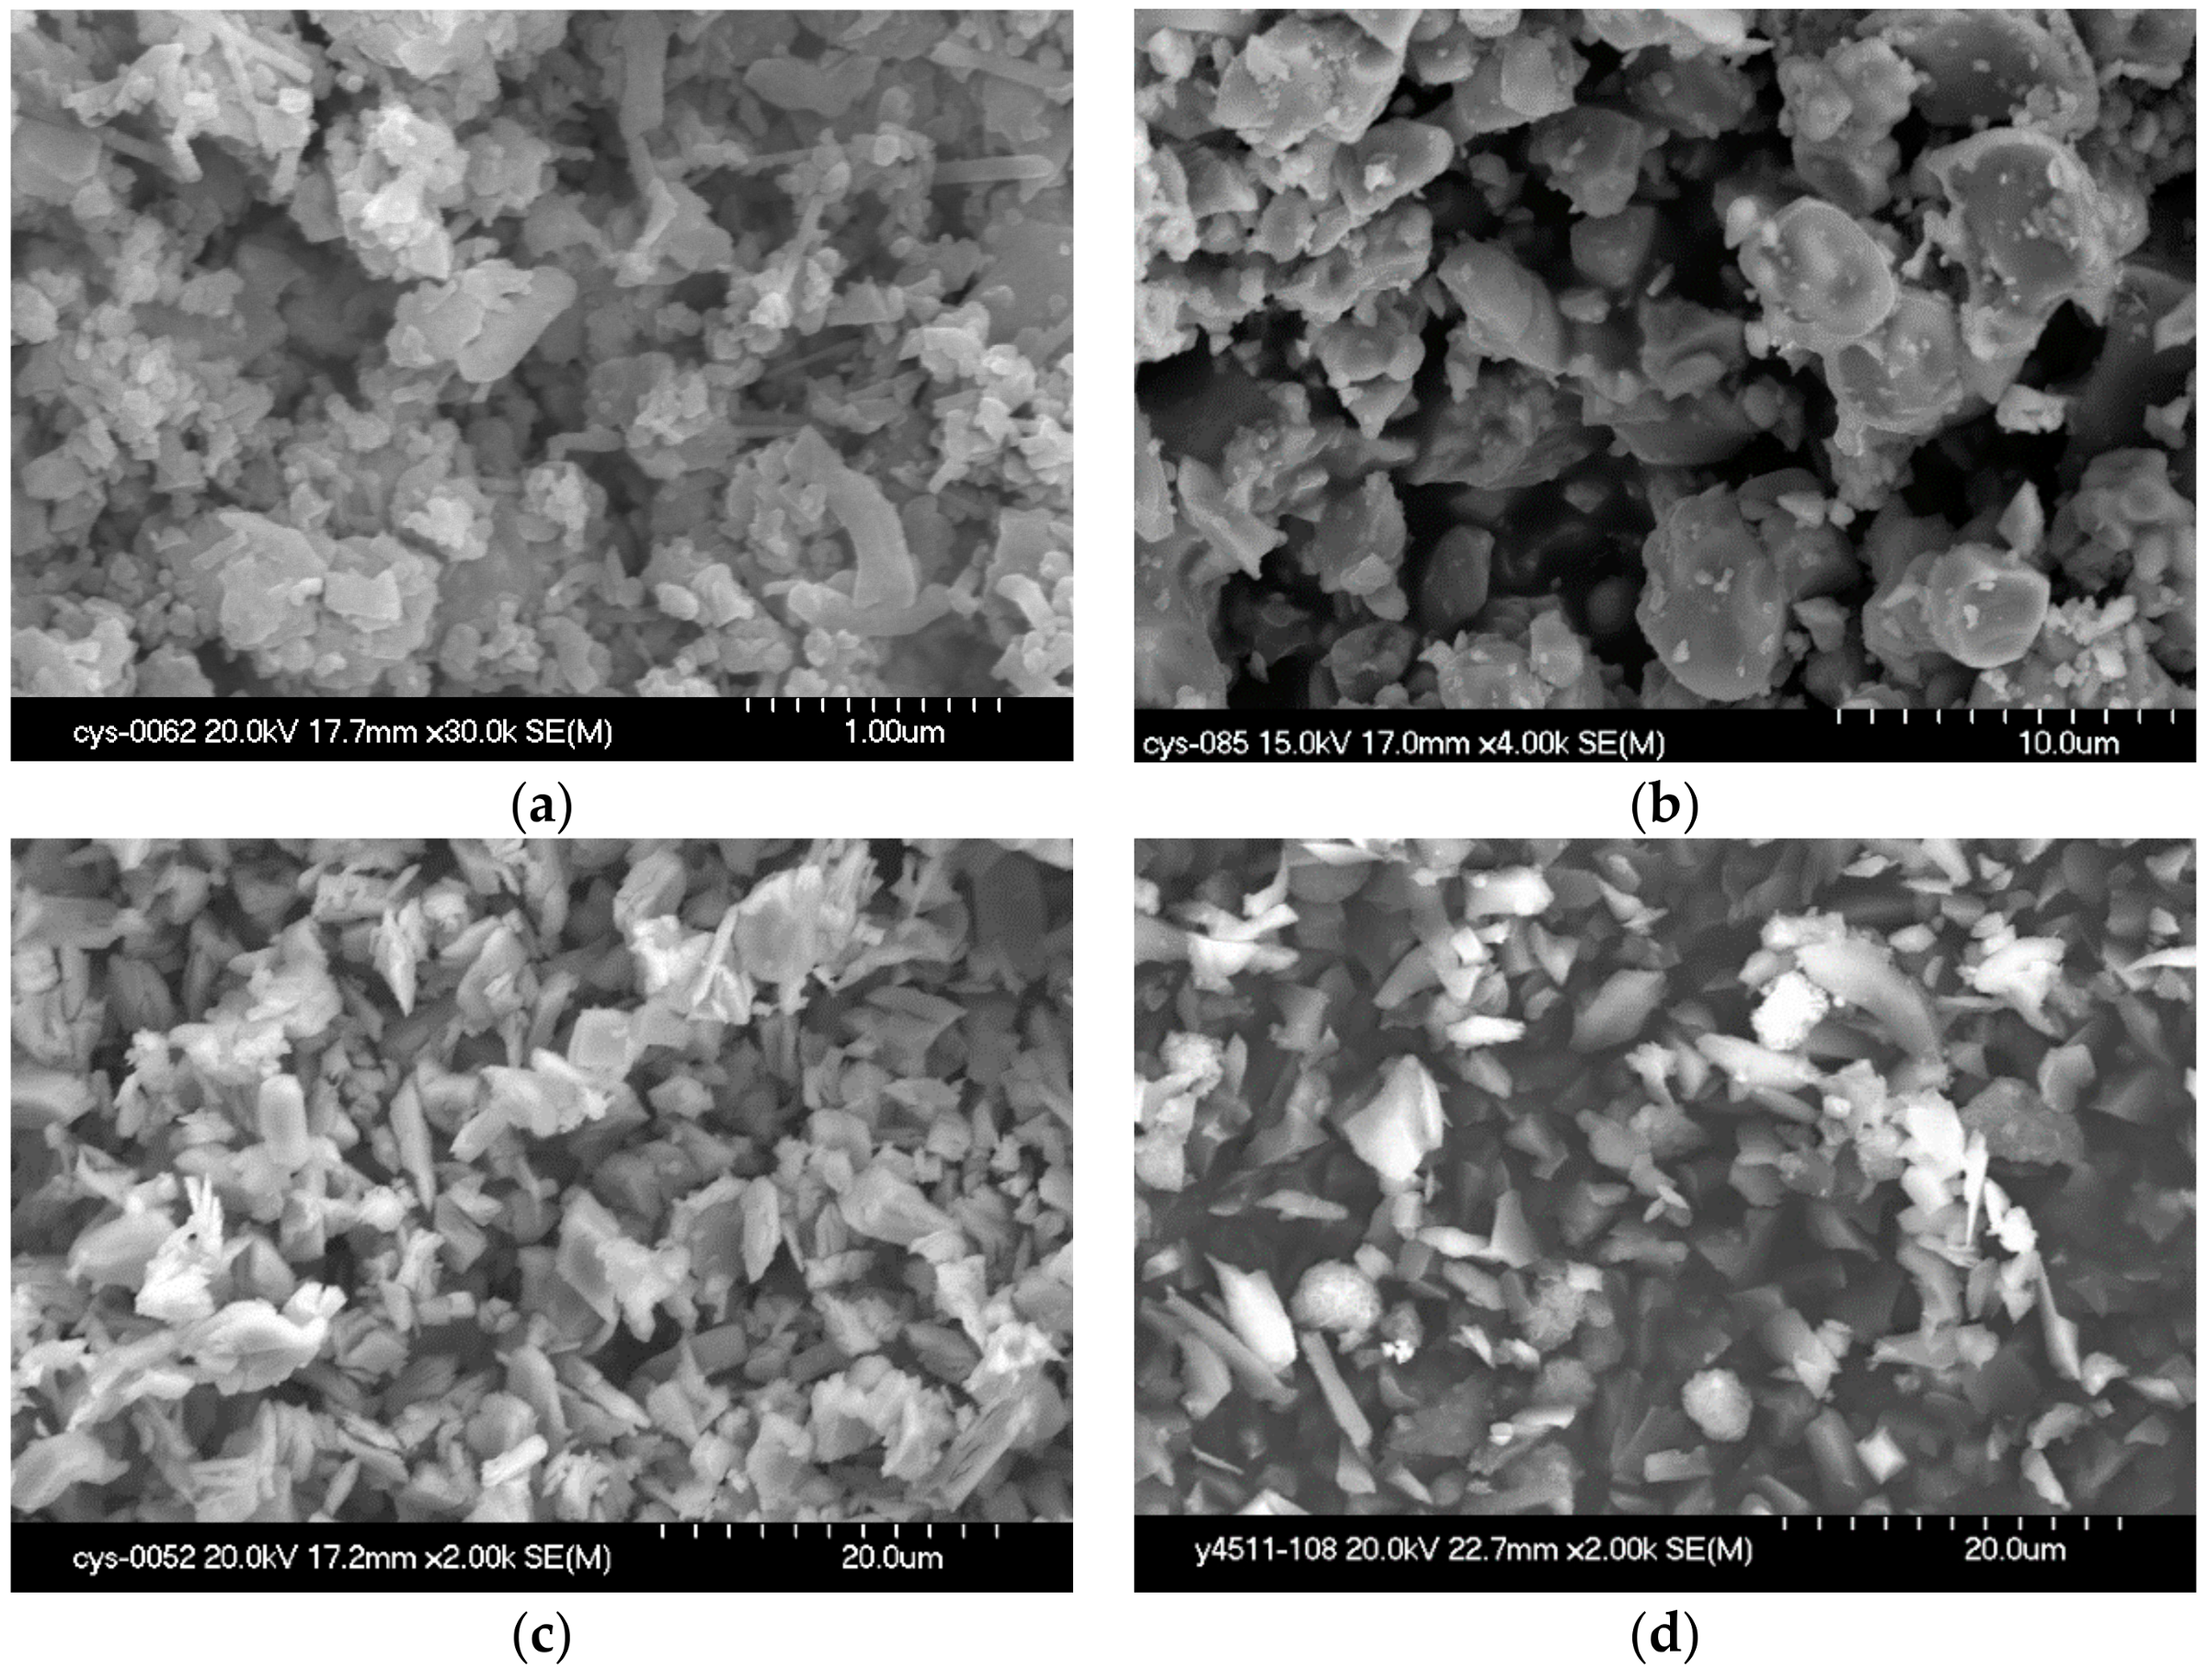
The SEM morphologies of the original powders. (a) α-Si3N4; (b) MoSi2; (c) Y2O3; (d) La2O3.
Figure 1.
The SEM morphologies of the original powders. (a) α-Si3N4; (b) MoSi2; (c) Y2O3; (d) La2O3.
Figure 2.
XRD pattern of the Si3N4–MoSi2 composites.
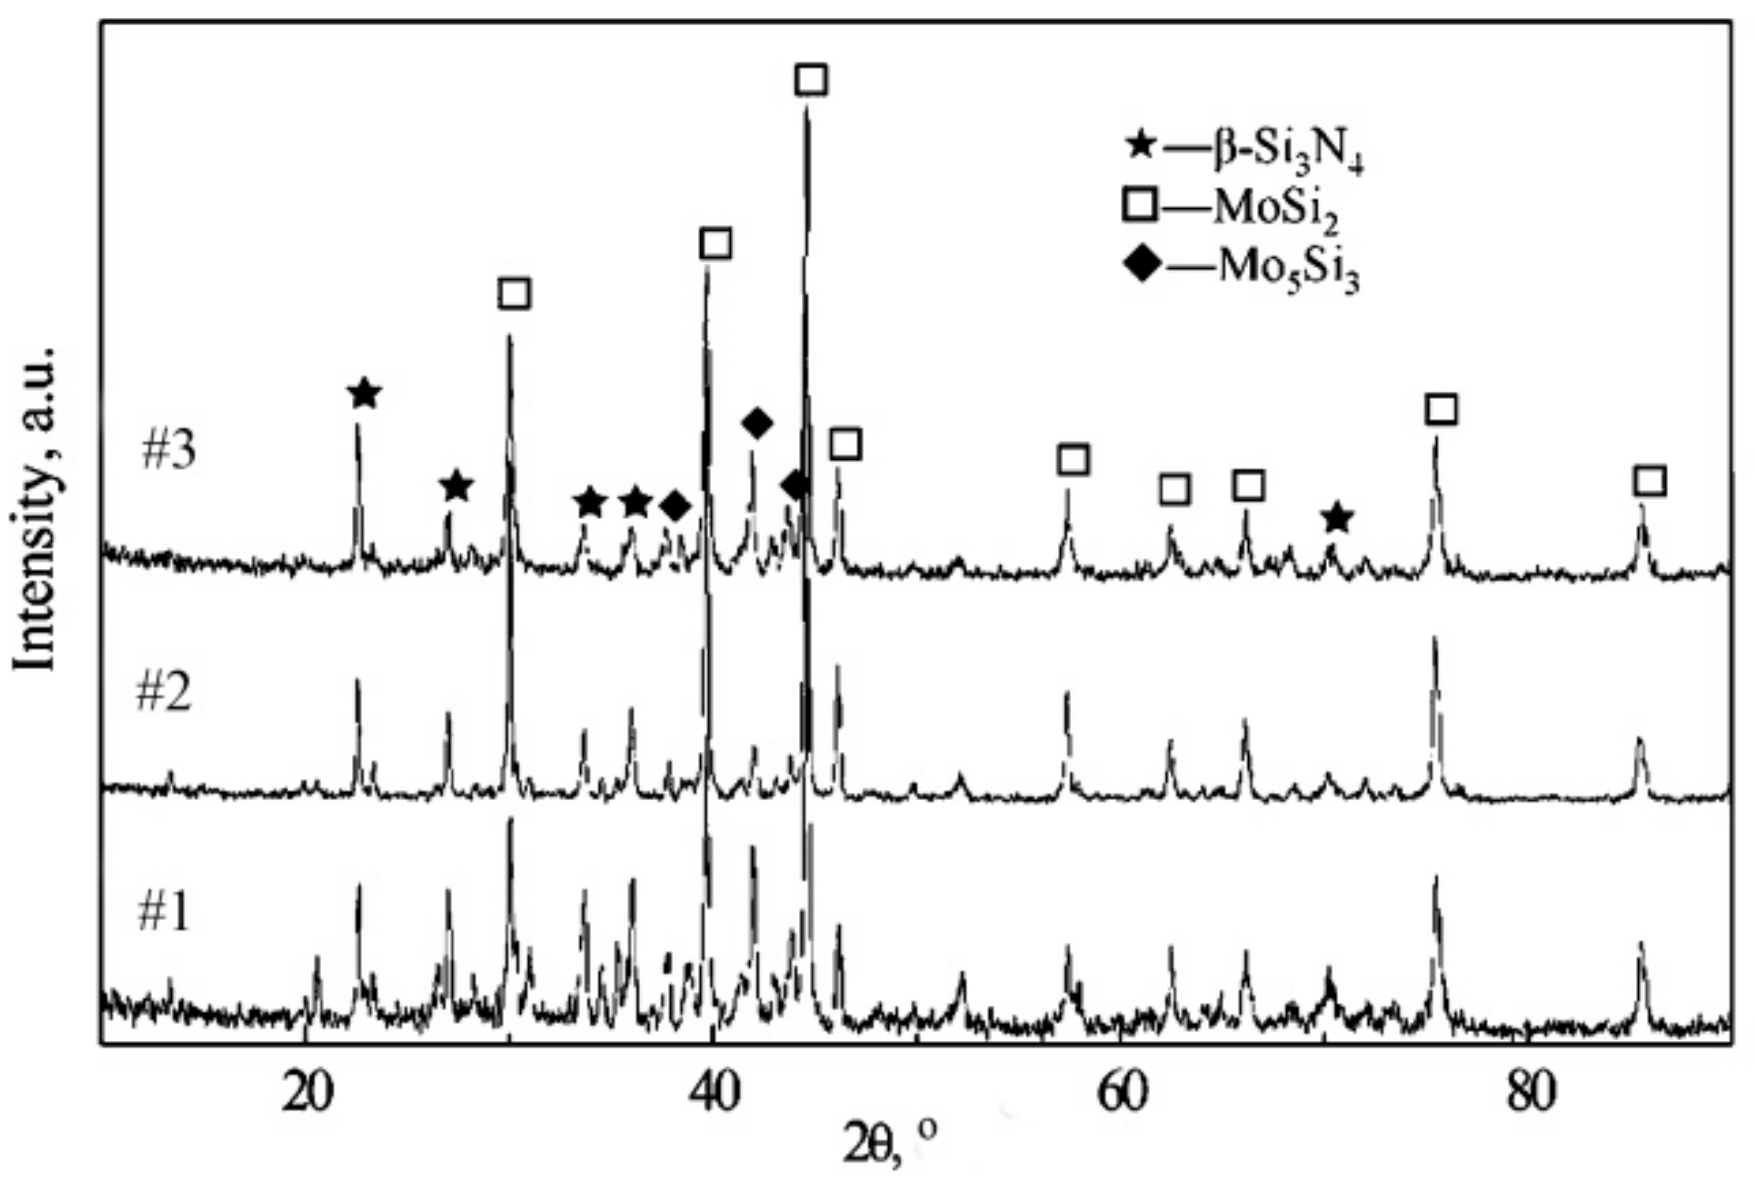
Figure 3.
Relative density of the Si3N4–MoSi2 composites.
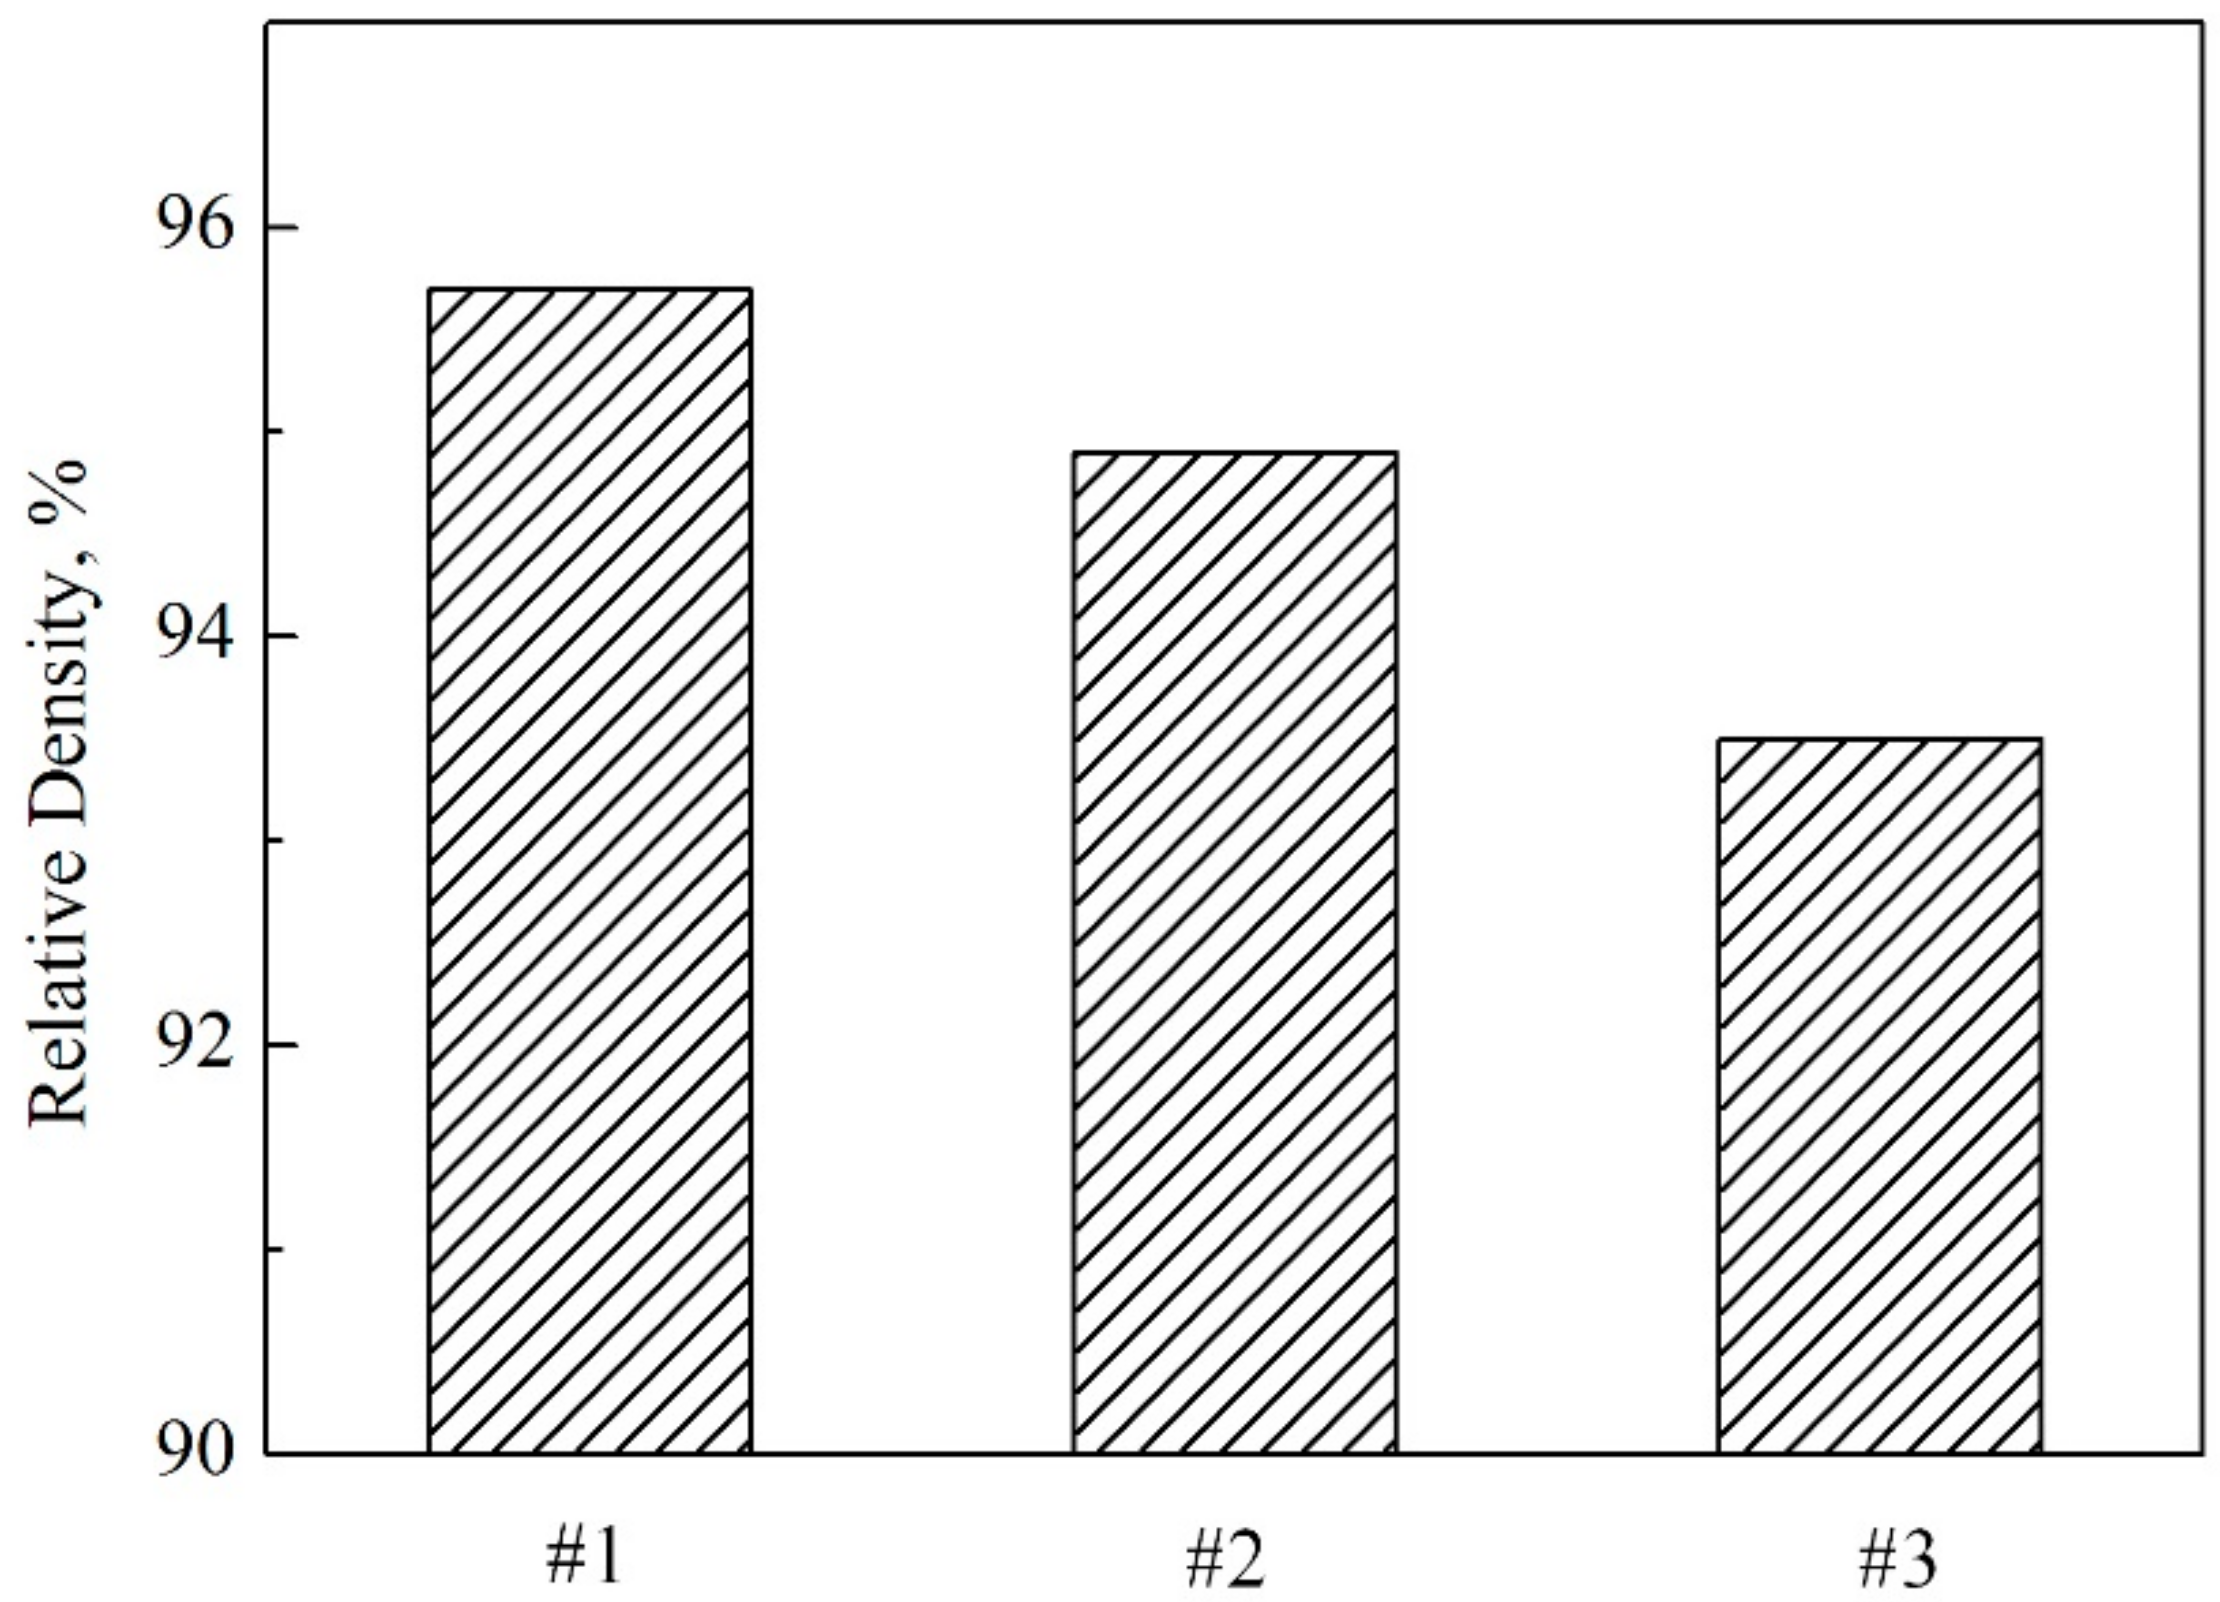
Figure 4.
Optical microstructure of the Si3N4–MoSi2 composites of (a) Si3N4-30 wt % MoSi2, (b) Si3N4-45 wt % MoSi2, and (c) Si3N4-60 wt % MoSi2.
Figure 4.
Optical microstructure of the Si3N4–MoSi2 composites of (a) Si3N4-30 wt % MoSi2, (b) Si3N4-45 wt % MoSi2, and (c) Si3N4-60 wt % MoSi2.
Figure 5.
High magnification backscattering SEM of the Si3N4-MoSi2 composites (a) Si3N4-30 wt % MoSi2; (b) Si3N4-45 wt % MoSi2; (c) Si3N4-60 wt % MoSi2, and (d) TEM image.
Figure 5.
High magnification backscattering SEM of the Si3N4-MoSi2 composites (a) Si3N4-30 wt % MoSi2; (b) Si3N4-45 wt % MoSi2; (c) Si3N4-60 wt % MoSi2, and (d) TEM image.

Figure 6.
Flexural strengths of the Si3N4-MoSi2 composites.
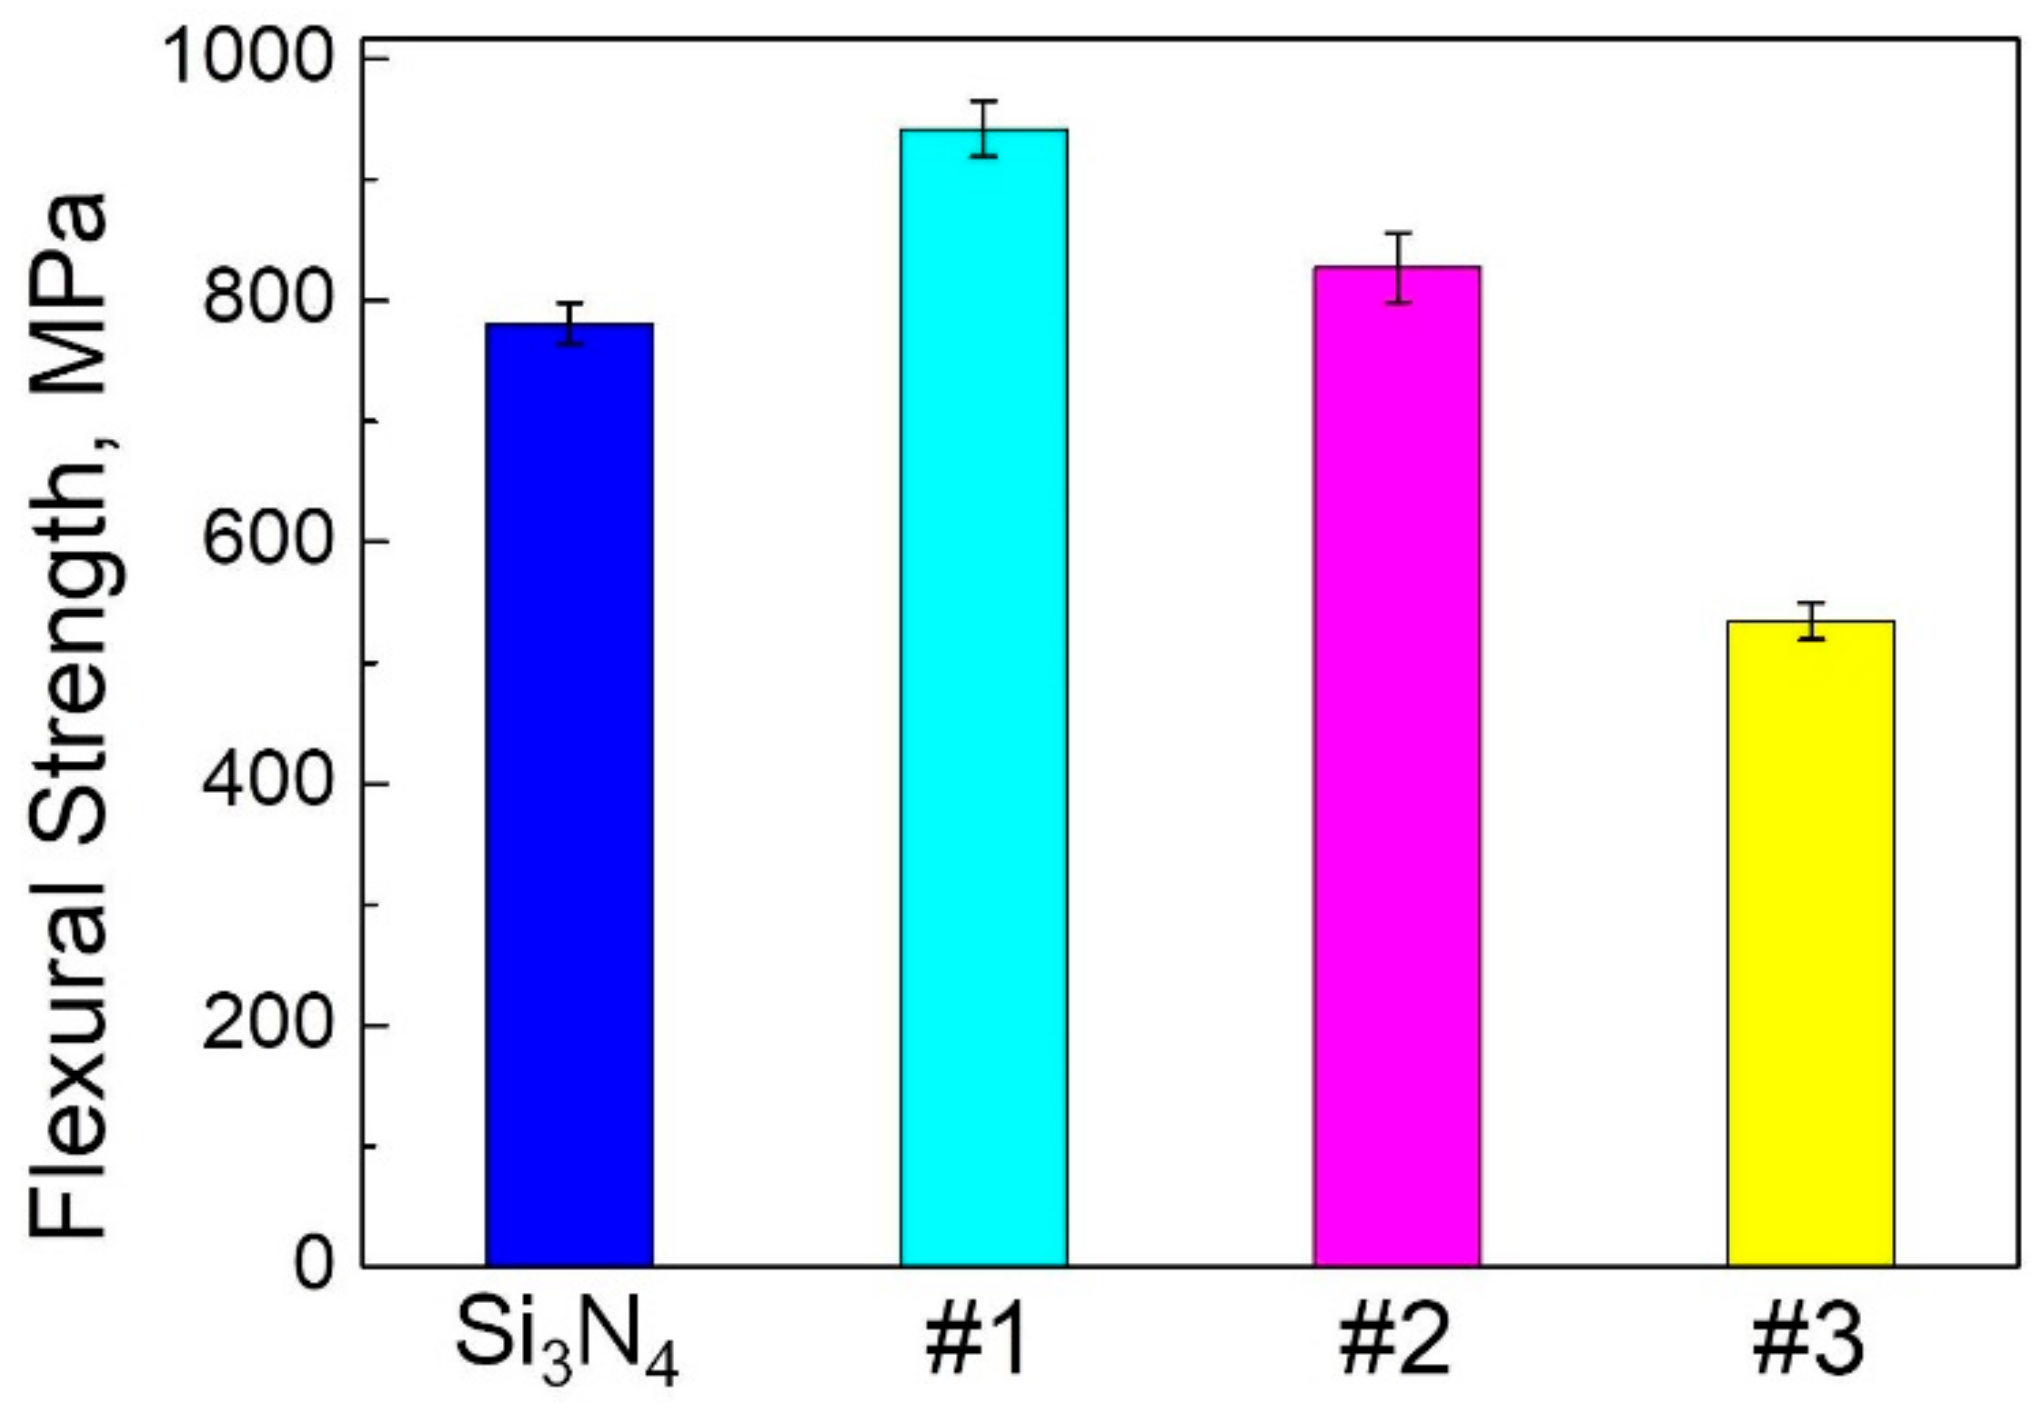
Figure 7.
SEM microstructure of the fracture surfaces of Si3N4–MoSi2 composites of sample (a) Si3N4-30 wt % MoSi2; (b) Si3N4-45 wt % MoSi2; (c) Si3N4-60 wt % MoSi2.
Figure 7.
SEM microstructure of the fracture surfaces of Si3N4–MoSi2 composites of sample (a) Si3N4-30 wt % MoSi2; (b) Si3N4-45 wt % MoSi2; (c) Si3N4-60 wt % MoSi2.
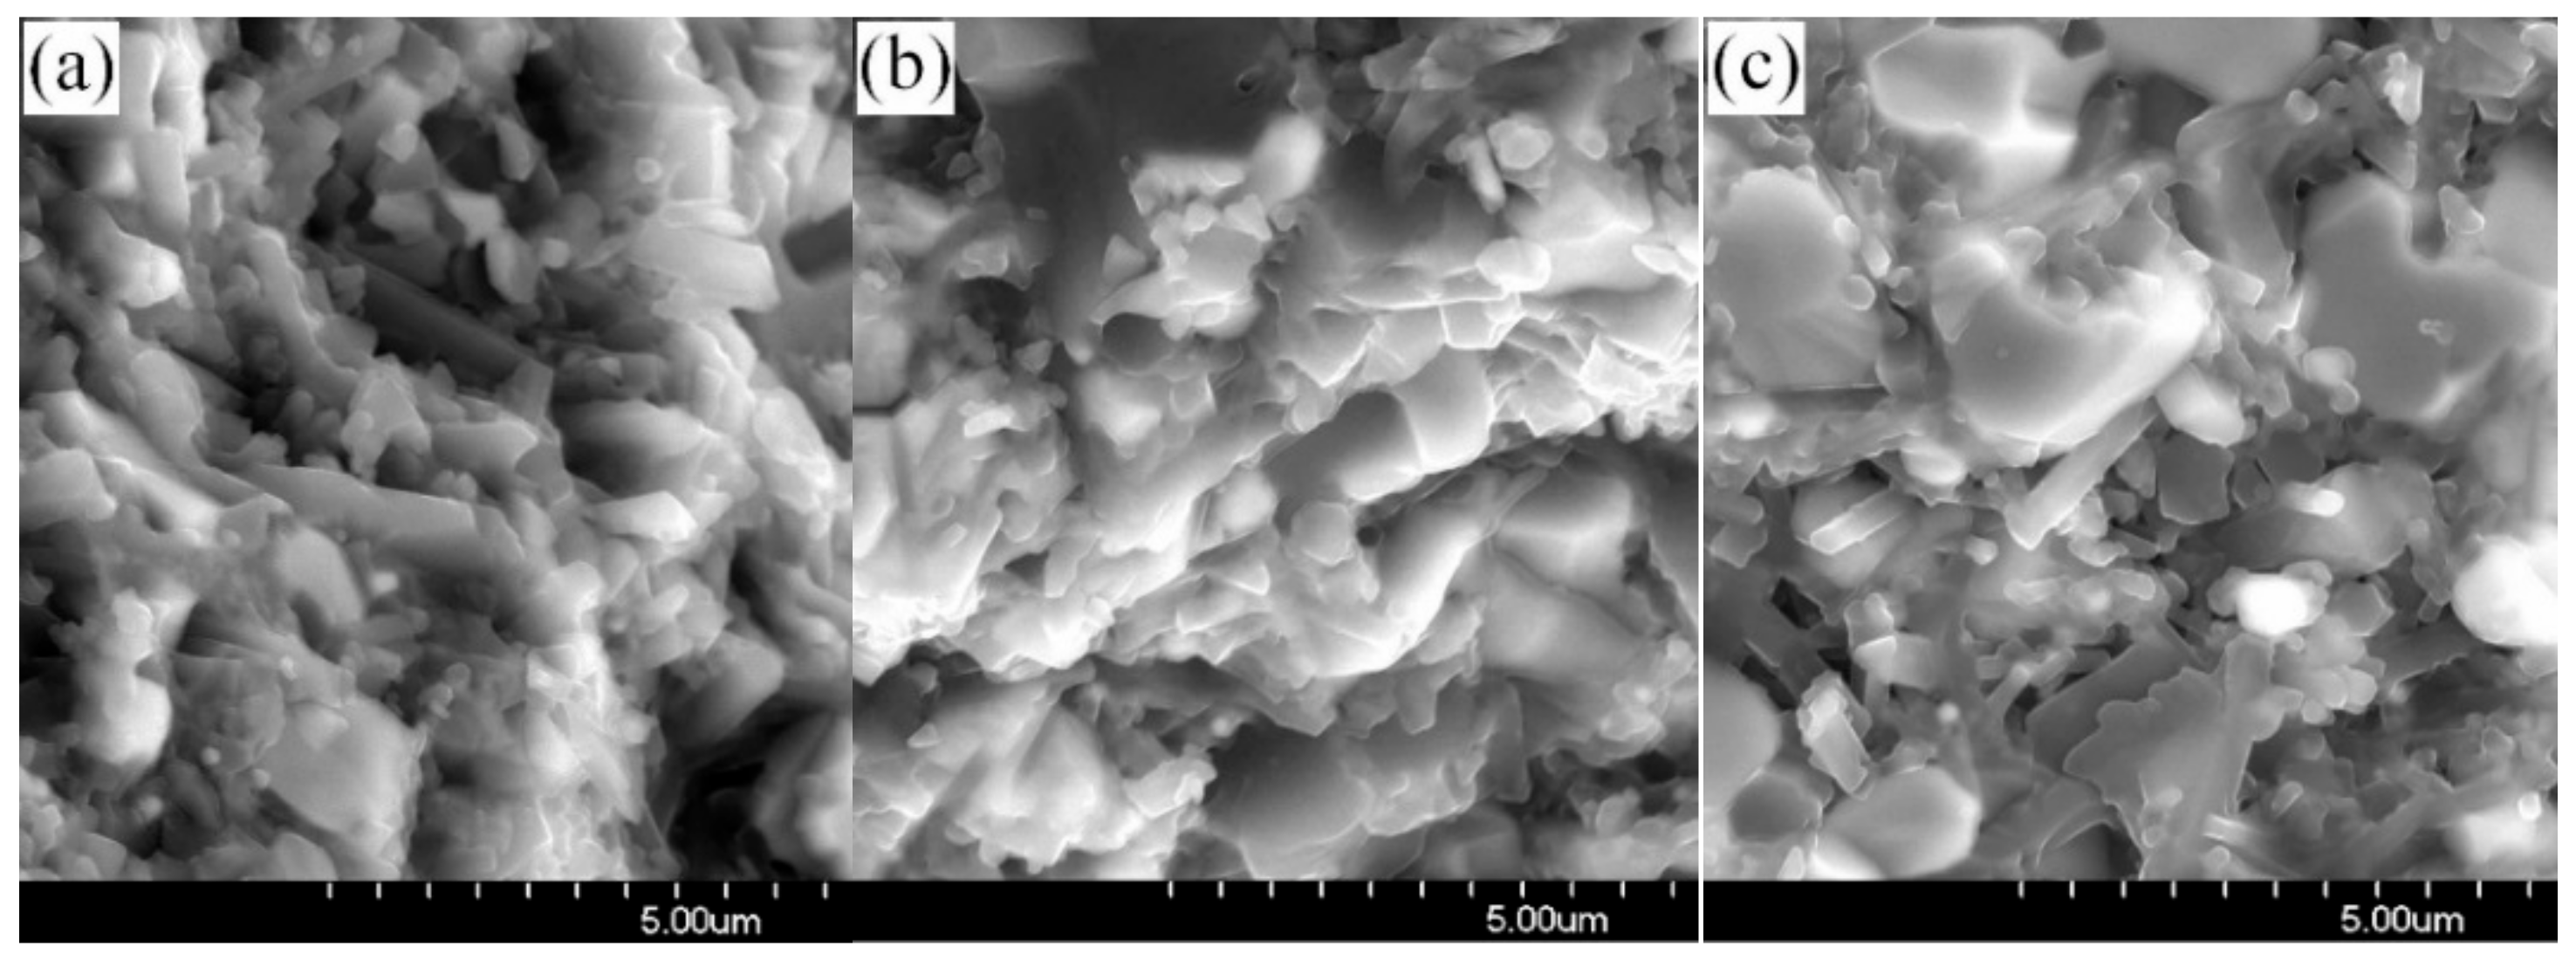
Figure 8.
Flexural strength remaining rate of the Si3N4–MoSi2 composites at various temperatures.

Figure 9.
SEM microstructure of the fracture surfaces of the Si3N4–MoSi2 composite samples. (a) Before thermal shock, (b) thermal shock at 500 °C, and (c) thermal shock at 600 °C.
Figure 9.
SEM microstructure of the fracture surfaces of the Si3N4–MoSi2 composite samples. (a) Before thermal shock, (b) thermal shock at 500 °C, and (c) thermal shock at 600 °C.

Figure 10.
Electrical conductivity of the Si3N4–MoSi2 composites as a function of MoSi2 mass fraction.
Figure 10.
Electrical conductivity of the Si3N4–MoSi2 composites as a function of MoSi2 mass fraction.

Table 1.
Chemical contents of the original powders.
| α Phase-Si3N4/wt % | MoSi2/wt % | La2O3/wt % | Y2O3/wt % | ||||
|---|---|---|---|---|---|---|---|
| purity | >92 | purity | >99 | purity | >99 | purity | >99 |
| N | >38.5 | Si | >36.5 | REO | >94.5 | REO | >94.5 |
| O | <1.5 | O | <0.85 | CaO | <0.15 | CaO | <0.15 |
| C | <0.1 | Fe | <0.09 | Fe2O3 | <0.10 | Fe2O3 | <0.10 |
| Fe | <200 ppm | C | <0.01 | CeO2 | <0.05 | CeO2 | <0.05 |
Table 2.
Constituents of samples.
| No. | Si3N4/wt % | MoSi2/wt % | La2O3/wt % | Y2O3/wt % |
|---|---|---|---|---|
| #1 | 60 | 30 | 5 | 5 |
| #2 | 45 | 45 | 5 | 5 |
| #3 | 30 | 60 | 5 | 5 |
© 2018 by the authors. Licensee MDPI, Basel, Switzerland. This article is an open access article distributed under the terms and conditions of the Creative Commons Attribution (CC BY) license (http://creativecommons.org/licenses/by/4.0/).
Share and Cite
MDPI and ACS Style
Feng, L.; Guan, P.; Yu, X.; He, Y. Microstructure and Properties of Thermal Electrode Material Si3N4–MoSi2 Composite Ceramics. Materials 2018, 11, 986. https://doi.org/10.3390/ma11060986
AMA Style
Feng L, Guan P, Yu X, He Y. Microstructure and Properties of Thermal Electrode Material Si3N4–MoSi2 Composite Ceramics. Materials. 2018; 11(6):986. https://doi.org/10.3390/ma11060986
Chicago/Turabian StyleFeng, Lichao, Pengfei Guan, Xuemei Yu, and Yiqiang He. 2018. "Microstructure and Properties of Thermal Electrode Material Si3N4–MoSi2 Composite Ceramics" Materials 11, no. 6: 986. https://doi.org/10.3390/ma11060986
Note that from the first issue of 2016, this journal uses article numbers instead of page numbers. See further details here.