The Corrosion Behavior of AZ91D Magnesium Alloy in Simulated Haze Aqueous Solution
by
Liying Cui
1,2, 
Zhiyong Liu
1,2,*,
Peng Hu
3,
Jiamin Shao
1,2,
Xiaogang Li
1,2,4,
Cuiwei Du
1,2,4 and
Bin Jiang
5 1
Corrosion and Protection Center, University of Science and Technology Beijing, Beijing 100083, China
2
Key Laboratory for Corrosion and Protection (MOE), University of Science and Technology Beijing, Beijing 100083, China
3
Key Laboratory of Environment Fracture Ministry of Education, University of Science and Technology Beijing, Beijing 100083, China
4
State Key Laboratory for Advanced Metals and Materials, University of Science and Technology Beijing, Beijing 100083, China
5
College of Materials Science and Engineering, Chongqing University, Chongqing 400030, China
*
Author to whom correspondence should be addressed.
Materials 2018, 11(6), 970; https://doi.org/10.3390/ma11060970
Submission received: 8 May 2018
/
Revised: 21 May 2018
/
Accepted: 6 June 2018
/
Published: 8 June 2018
Abstract
:The corrosion process of AZ91D magnesium alloy in simulated haze aqueous solution has been studied by electrochemical measurements, immersion tests and morphology characterization. Results show that AZ91D was corroded heavily in simulated haze aqueous solution due to the loose and breakable product film on the surface providing little corrosion barrier. The effect of different ions was investigated. It was found that both and played an important role in the corrosion process. helped to form passive film to protect the matrix, yet consumed OH−, resulting in the absence of Mg(OH)2 and serious corrosion. Meanwhile, and Cl− had influence on pitting corrosion. Magnesium aluminum oxide and MgAl2(SO4)4·22H2O instead of Mg(OH)2 were the dominate products, which is different from the former study. Corrosion rate changed with time, especially in the first 3 h. A two-stage corrosion mechanism is proposed after considering both the corrosion process and the influence of ions.
1. Introduction
Magnesium and its alloys are attractive in aerospace, automotive and electro-communication fields due to their abundant reserves and advantageous properties, such as excellent cast ability, high strength-to-weight radio and high damping capacity [1]. All these have made magnesium alloys promising metallic materials, however, the unwise use of magnesium in wet environments gives rise to its poor corrosion reputation [2]. Numerous methods, for instance, coating [3,4,5,6,7,8,9], heat treatments [10], and elements addition [11,12,13], have been used to improve the corrosion resistance of magnesium alloys. A number of studies have been undertaken to explain the corrosion behavior of magnesium. When exposed to the air, a thin and imperfect passive film will be formed on the surface. It is generally accepted that the protective film is a dense layer of MgO and Mg(OH)2 mixture [14,15,16], and the film is susceptible to localized breakdown. Magnesium will form a product hydroxide/oxide film when exposed to aqueous environments [17]. Santamaria et al. [18] found an ultra-thin MgO inner layer and a Mg(OH)2 external layer for pure magnesium after immersion in NaCl solution. Generally, the hydroxide corrosion product film on the surface of AZ91D magnesium alloy is much less stable compared with the passive film formed on the surface of aluminum and stainless steel [19]. A key step in the propagation of the corrosion is the breakage of the film [20], and tiny cracks formed on the surface expose the bare matrix to the solution to accelerate the corrosion process. Among all these corrosion types, localized corrosion, especially pitting corrosion, is the most common corrosion form of magnesium alloys. These theories are almost carried out in neutral/alkaline NaCl solution.
Nowadays, haze, as a kind of air pollution around the world, occurs when the concentration of pollutants and temperature reach a critical condition. Haze usually takes place in winter, especially January. However, pollutants exist in the air all year around. Except for the high concentration of particulate matter (PM) with an aerodynamic diameter smaller than 2.5 μm (PM2.5), the high relative humidity (80–90%) is also a significant feature of haze because the liquid membrane contains some water-soluble ions (, , , Cl−) [21] which can pose a great threat to the corrosion of magnesium. AZ91D, which is widely used nowadays, is a two-phase alloy that consists of α-matrix and β-phase, and many studies support that the β-phase can be a corrosion barrier, despite the galvanic coupling [11,22,23,24]. The corrosion behavior of metal is influenced by the environment greatly [25,26,27]. Previous studies are usually carried out in NaCl or NaSO4 solutions, and the corrosion performance of AZ91D in haze affected environment remains ill-defined. However, the four main kinds of water-soluble ions in haze may have an impact on the corrosion process. As a result, it is of great significance to pay attention to the corrosion behavior of AZ91D in haze circumstance in case of sudden failure in actual production and life.
The aim of this work was to study the corrosion behavior of AZ91D in simulated HA solution. The influence of immersion time and four main water-soluble ions towards corrosion was monitored by electrochemical tests, hydrogen collection, scanning electron microscopy (SEM), confocal laser scanning microscope (CLSM), energy dispersive X-ray spectroscopy (EDX) and X-ray diffraction (XRD).
2. Experimental Methods
2.1. Samples and Solution
The material studied was an as-cast AZ91D magnesium alloy. Its chemical composition is given in Table 1. Specimens with the dimension of 10 × 10 × 2 mm3 were prepared prior to the experiment. Samples for electrochemical measurements were mounted using epoxy resin with a 10 × 10 mm2 surface exposed as the working area. All exposed surface was mechanically grounded with SiC papers from 60 to 2000 grid, cleaned with acetone, distilled water and dried with cold compressed air. The microstructure of AZ91D was examined by SEM after polishing by silk polishing cloth with ethanol, washing with distilled water, drying with warm flowing air and etching in 5 vol.% nital solution.
The simulated haze aqueous solution (HA solution) used for immersion tests and electrochemical measurements was prepared according to literature [21], which suggested that the ratio of the four water-soluble ions in haze was :::Cl− = 5:4:1:2. To stimulate HA solution and accelerate the corrosion process, the solution was set to be consisted of 0.05 M Na2SO4, 0.04 M NaNO3, 0.01 M NH4Cl and 0.01 M NaCl.
2.2. Electrochemical Measurements
Electrochemical measurements were performed by a VersaSTAT3 electrochemical workstation (AMETEK, Berwyn, PA, USA) with a conventional three-electrode set-up, using the samples mentioned above as working electrode, a platinum sheet as counter electrode and a saturated calomel electrode (SCE) as reference electrode. Open-circuit potential (OCP) of the specimens was monitored until it was stable with the potential changing less than 10 mV within 10 min. Electrochemical impedance spectroscopy (EIS) tests were conducted at different immersion times. The frequency ranged for EIS measurement is from 100 kHz to 10 mHz with 10 points/decade and the sinusoidal potential signal was 10 mV with respect to OCP. Potentiodynamic polarization curves were performed at a potential scanning rate of 0.5 mV/s. In this study, all potentials were measured and given with respect to SCE.
2.3. Morphology Observations
After immersion tests, AZ91D samples were observed by CLSM (KEYENCE, Osaka, Japan) and SEM (FEI, Hillsboro, America) equipped with EDX (AMETEK, Berwyn, PA, USA) to study the morphology and evolution of corrosion products formed on the surface. Meanwhile, the composition of the corrosion product was identified by XRD, using an automatic powder diffractometer (Rigaku, Tokyo, Japan) with monochromatic Cu Kα radiation.
3. Results
3.1. The Corrosion Process of AZ91D
3.1.1. Microstructural Characterization
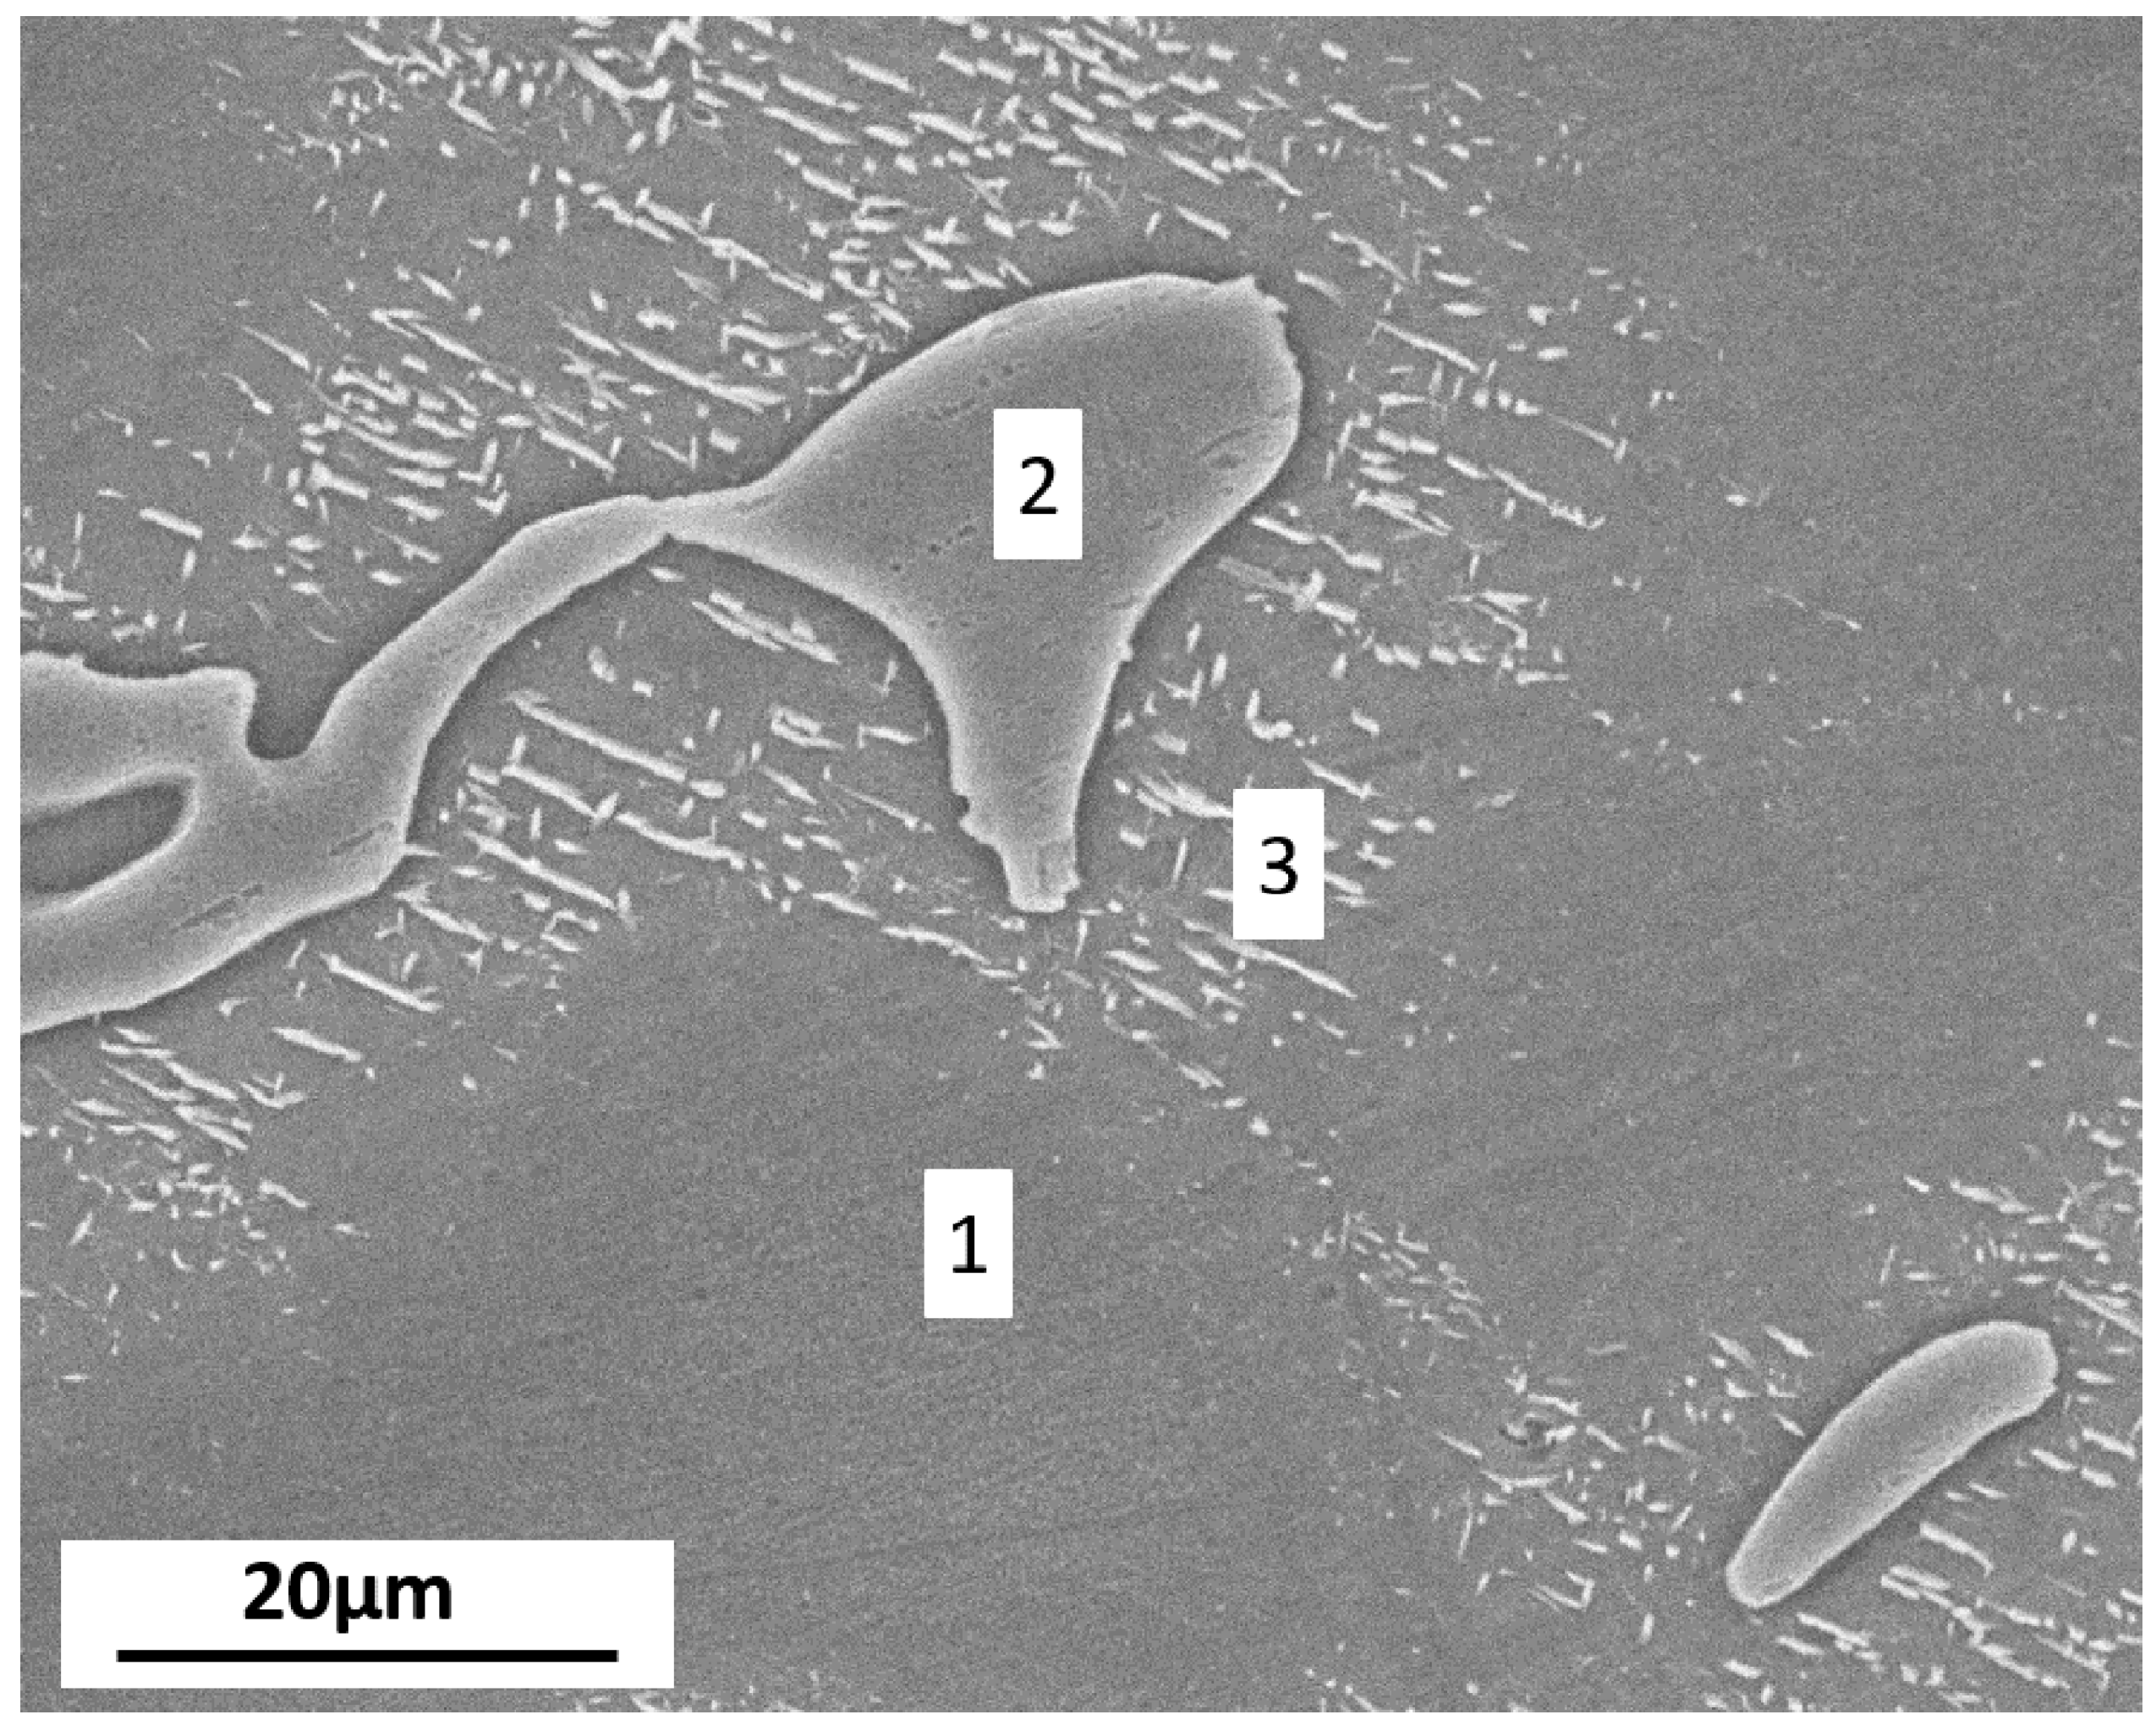
In Figure 1, the microstructure of AZ91D alloy is presented. It shows that AZ91D is a two-phase alloy, consisting of α-matrix (marked (1) in Figure 1) and β-phase (marked (2) in Figure 1). The fine lamellar (α + β) micro-constituents are marked (3) in Figure 1, with white regions representing β-phase. The large β articles are interconnected and form a fine network throughout the microstructure. Further, the element composition of regions 1 and 2 measured by EDX is presented in Table 2.
3.1.2. Electrochemical Measurements
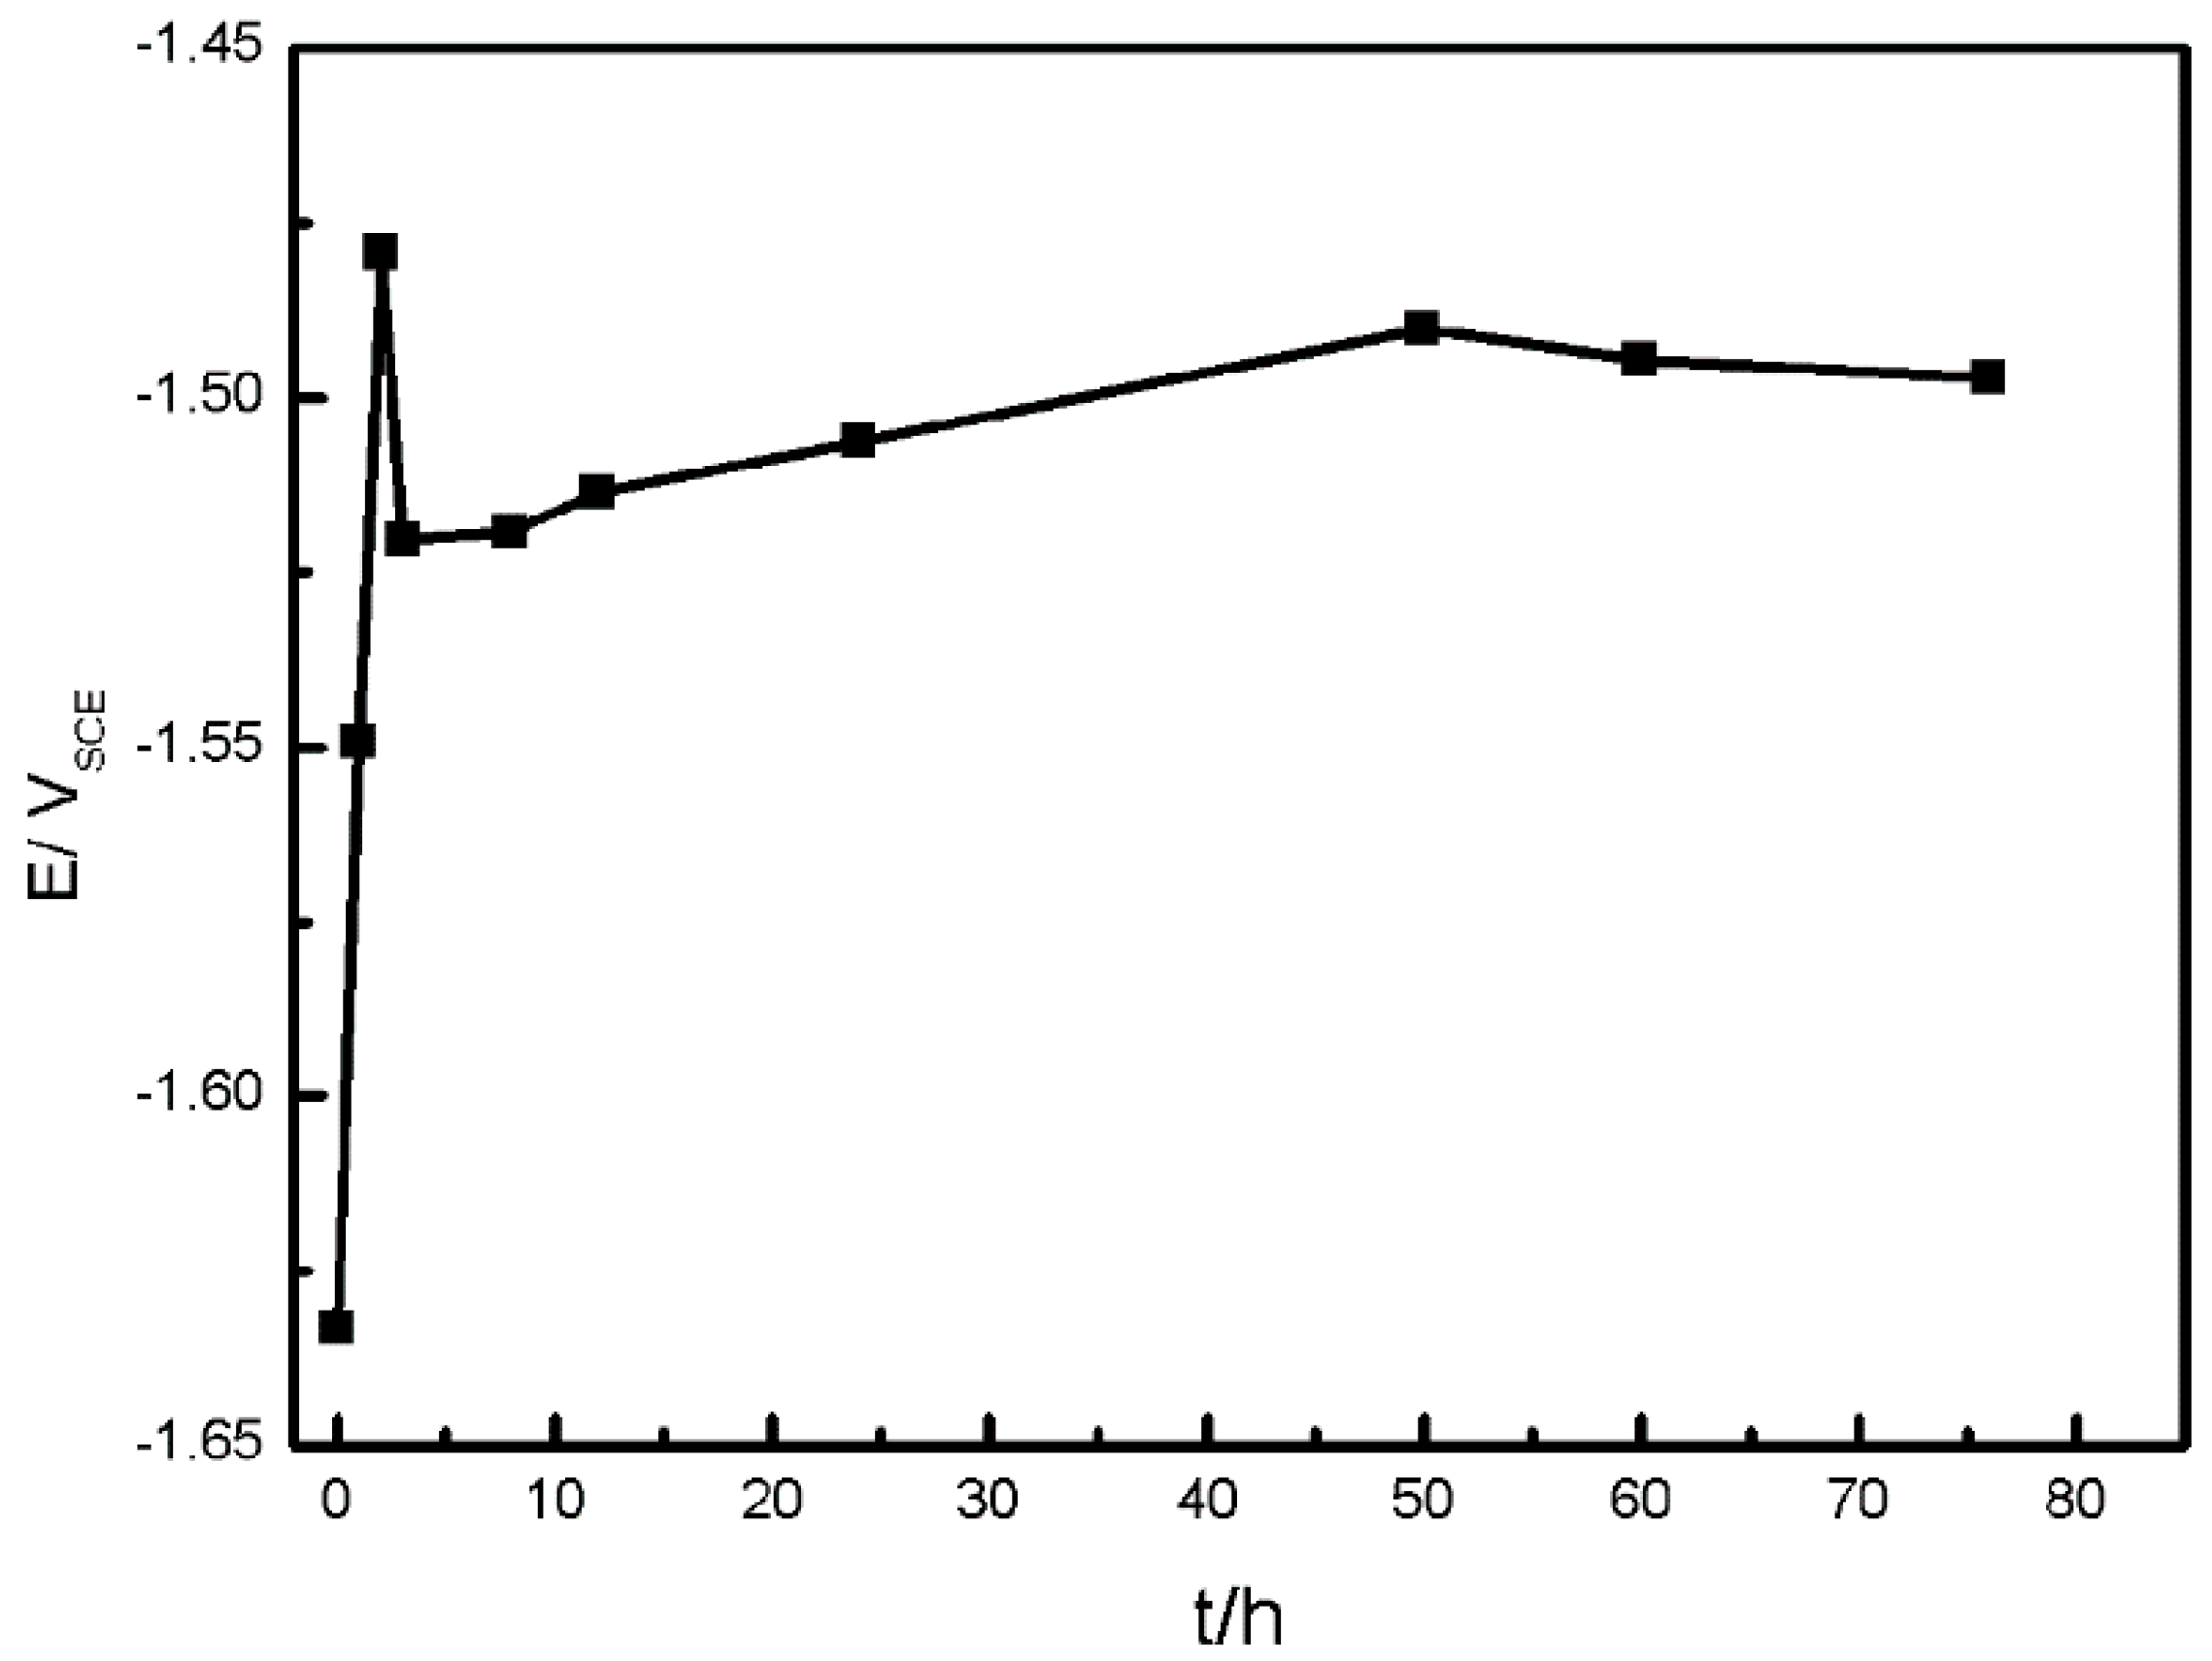
The variation of OCP during the immersion time presents the chemical stability of working electrode, through which we can infer the corrosion process of samples. Figure 2 presents the OCP during immersion tests in simulated HA solution for 76 h.
As shown in Figure 2, the OCP of AZ91D is affected by immersion time, especially in the first three hours. The original potential is −1.63 V and after the sample is immersed in simulated HA solution for 3 h, the OCP approaches to −1.48 V, raised by 0.15 V, suggesting the formation of slightly protective corrosion film on the surface. However, the OCP drops suddenly after 3 h immersion, and then increases slowly as the immersion time increased, which is likely due to the breakage of protective film and the development of pitting.
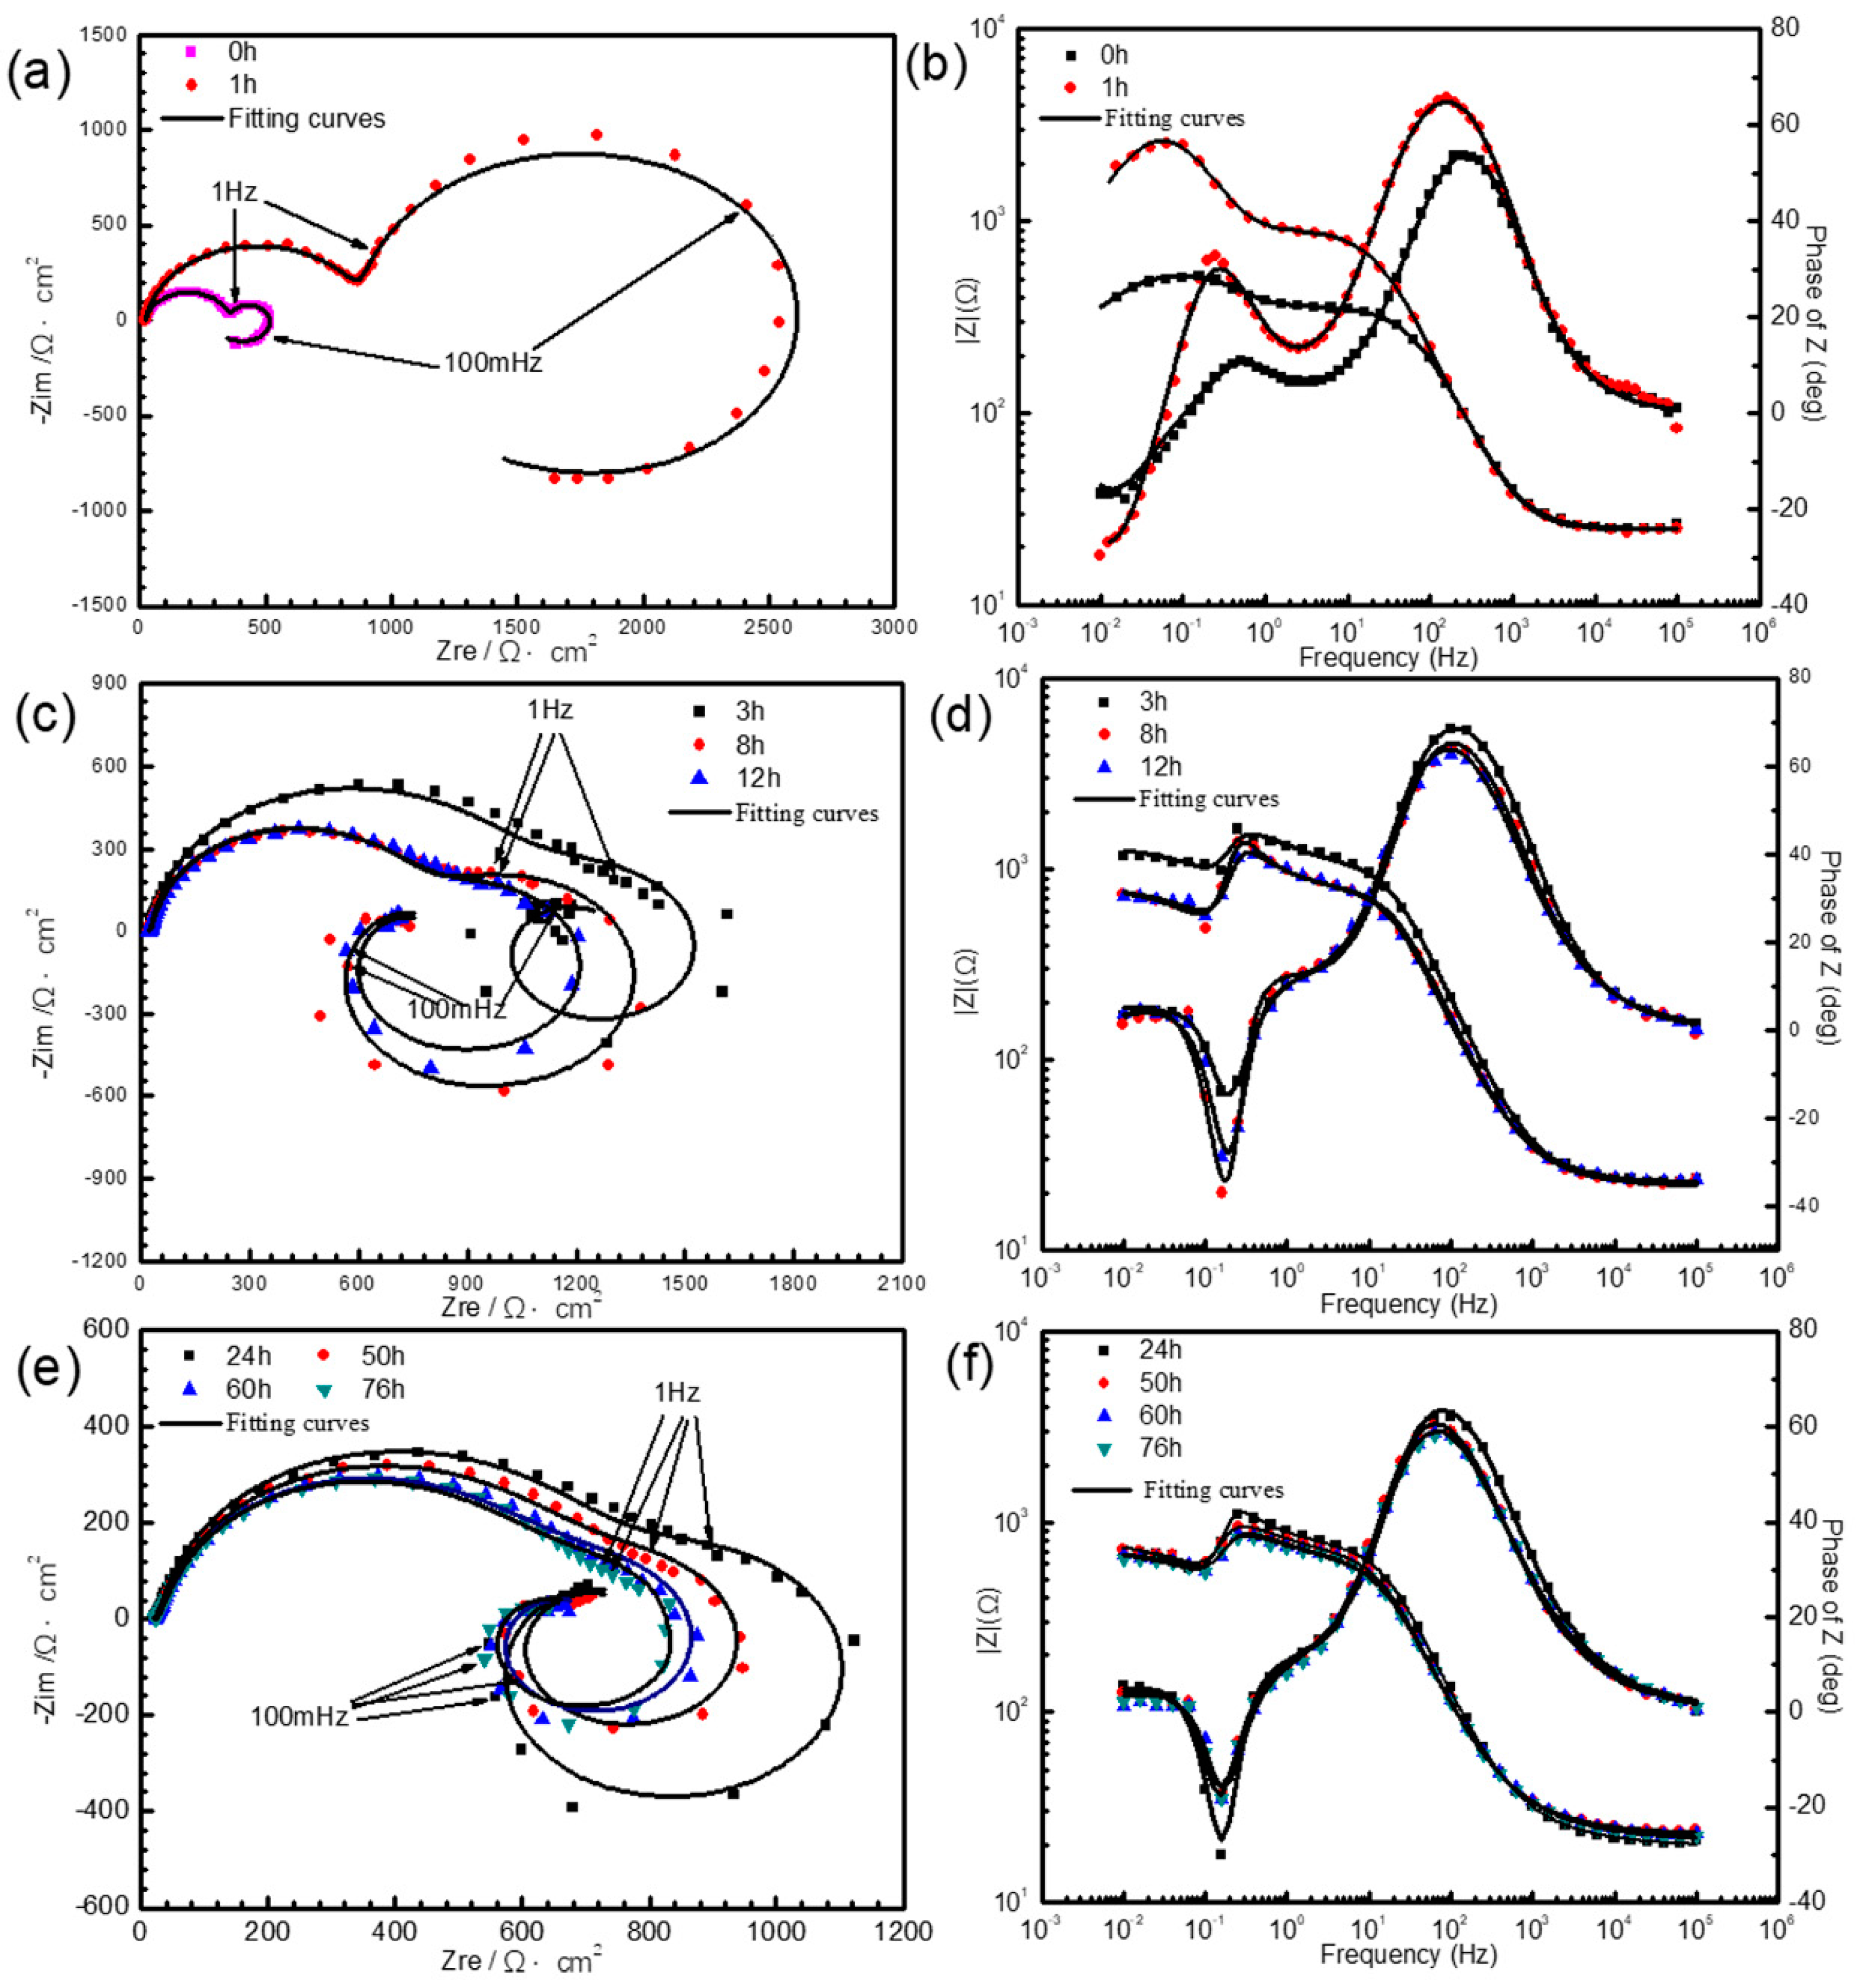
After immersion in simulated HA solution for various times up to 76 h, Nyquist and Bode diagrams of AZ91D sample are depicted in Figure 3, exhibiting various electrochemical characteristics.
As can be seen from Figure 3a, when the immersion time is less than 3 h, the Nyquist plots are characterized by two well-defined capacitive loops: one capacitive loop is at high frequencies and the other is at medium frequencies. In addition, there is also an inductive loop at low frequencies. Both the high frequencies and medium frequencies capacitive loop increase over the immersion time. In the meantime, the medium frequencies loop grows much faster than the high frequencies one.
As shown in Figure 3c,e, when the immersion time reaches 3 h, the fourth constant time is emerged: a new capacitive loop in the low frequencies range. Meanwhile, the medium frequencies capacitive loop decreases evidently. With the further increase of immersion time, the high frequencies and medium frequencies capacitive loop and medium frequencies inductive loop all degenerate, while the low frequencies capacitive loop changes a little.
These results are similar to those reported by Chen [30] et al. It has been suggested that the high frequencies capacitive loop is attributed to the charge transfer resistance and double capacitance at the mental/solution interface. They proposed that the capacitive loop in the medium frequencies range is induced by film effect in the corrosion process, which referred to the formation of Mg(OH)2 and MgAl2(OH)8·H2O, meanwhile the capacitive loop in the low frequencies range could be attribute to localized corrosion and the formation of MgAl2(SO4)4. However, in this study Mg(OH)2 and MgAl2(OH)8·H2O could not be detected due to , which will be described below, so we speculate that the film effect resulting in capacitive loop in the medium frequencies range may refer to the formation of MgO, one of the main products in this article. The low frequencies inductive loop is produced by the metastable Mg+ concentration [30,31].
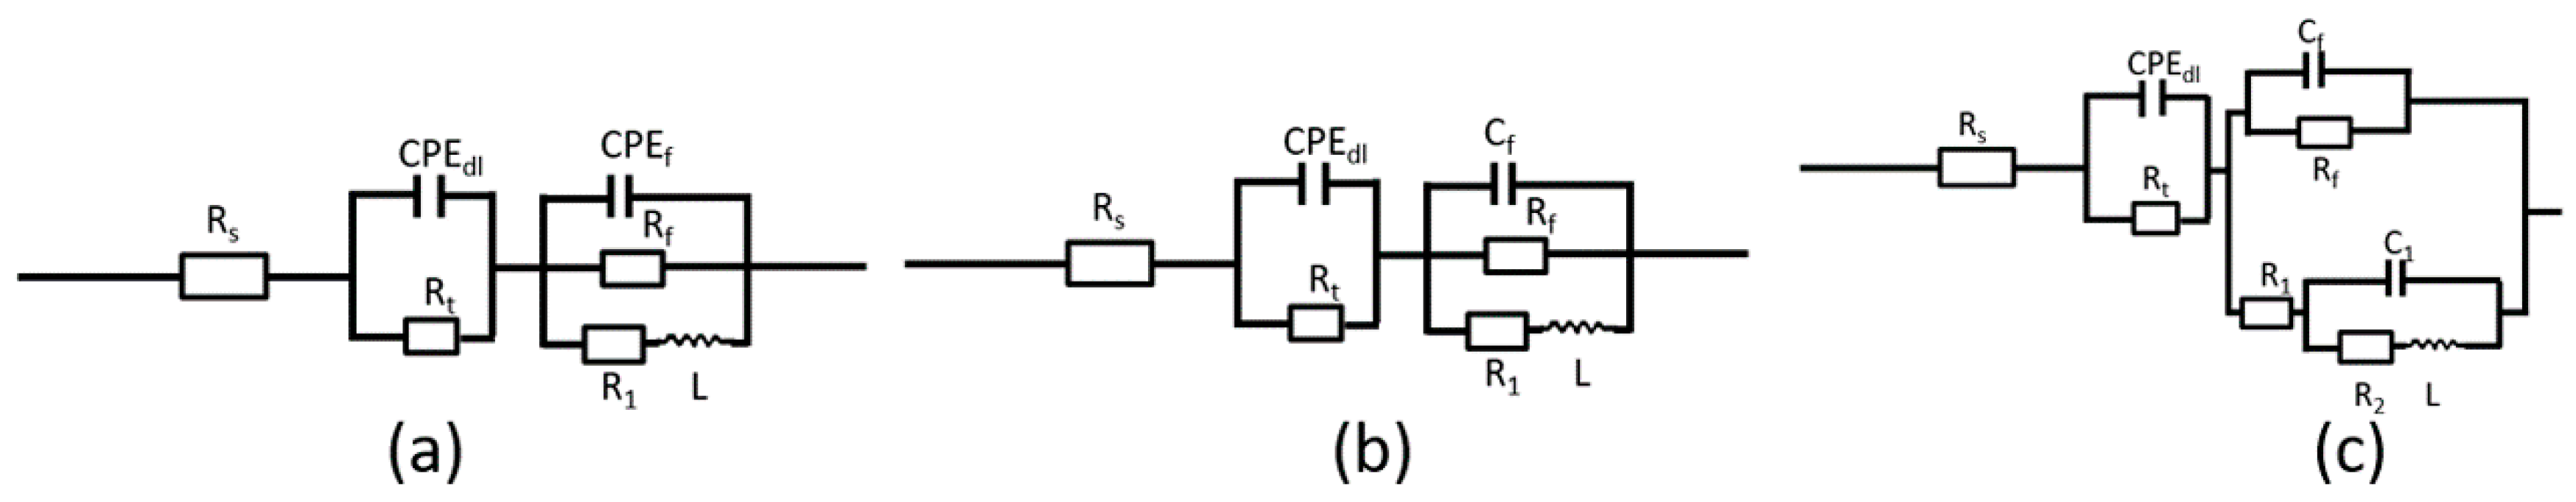
In order to better understand the electrochemical processes of the AZ91D in the HA environment, the equivalent circuits were introduced as shown in Figure 4. When the sample was just immersed in the simulated HA solution, the equivalent circuit could be attained (Model A): a solution resistance Rs, a charge transfer resistance Rt, in parallel with the double layer constant phase element CPEdl, film resistance Rf, in parallel with film constant phase element CPEf, and the inductance L induced by metastable Mg+ ions in series with a charge transfer resistance R1; When the immersion time was 1 h, the equivalent circuit could be obtained (Model B): CPEf is altered to Cf, indicating the film effect became relatively stable; when the immersion time was more than 3 h, the equivalent circuit could also be obtained (Model C): C1 is assigned to the layer where localized corrosion occurred, and R2 is the MgAl2(SO4)4 film resistance, and the other parameters are consistent with those in Model B. It can be seen from Figure 3 that the equivalent circuits fit the experimental data well, implying that equivalent circuits in Figure 4 are suitable.
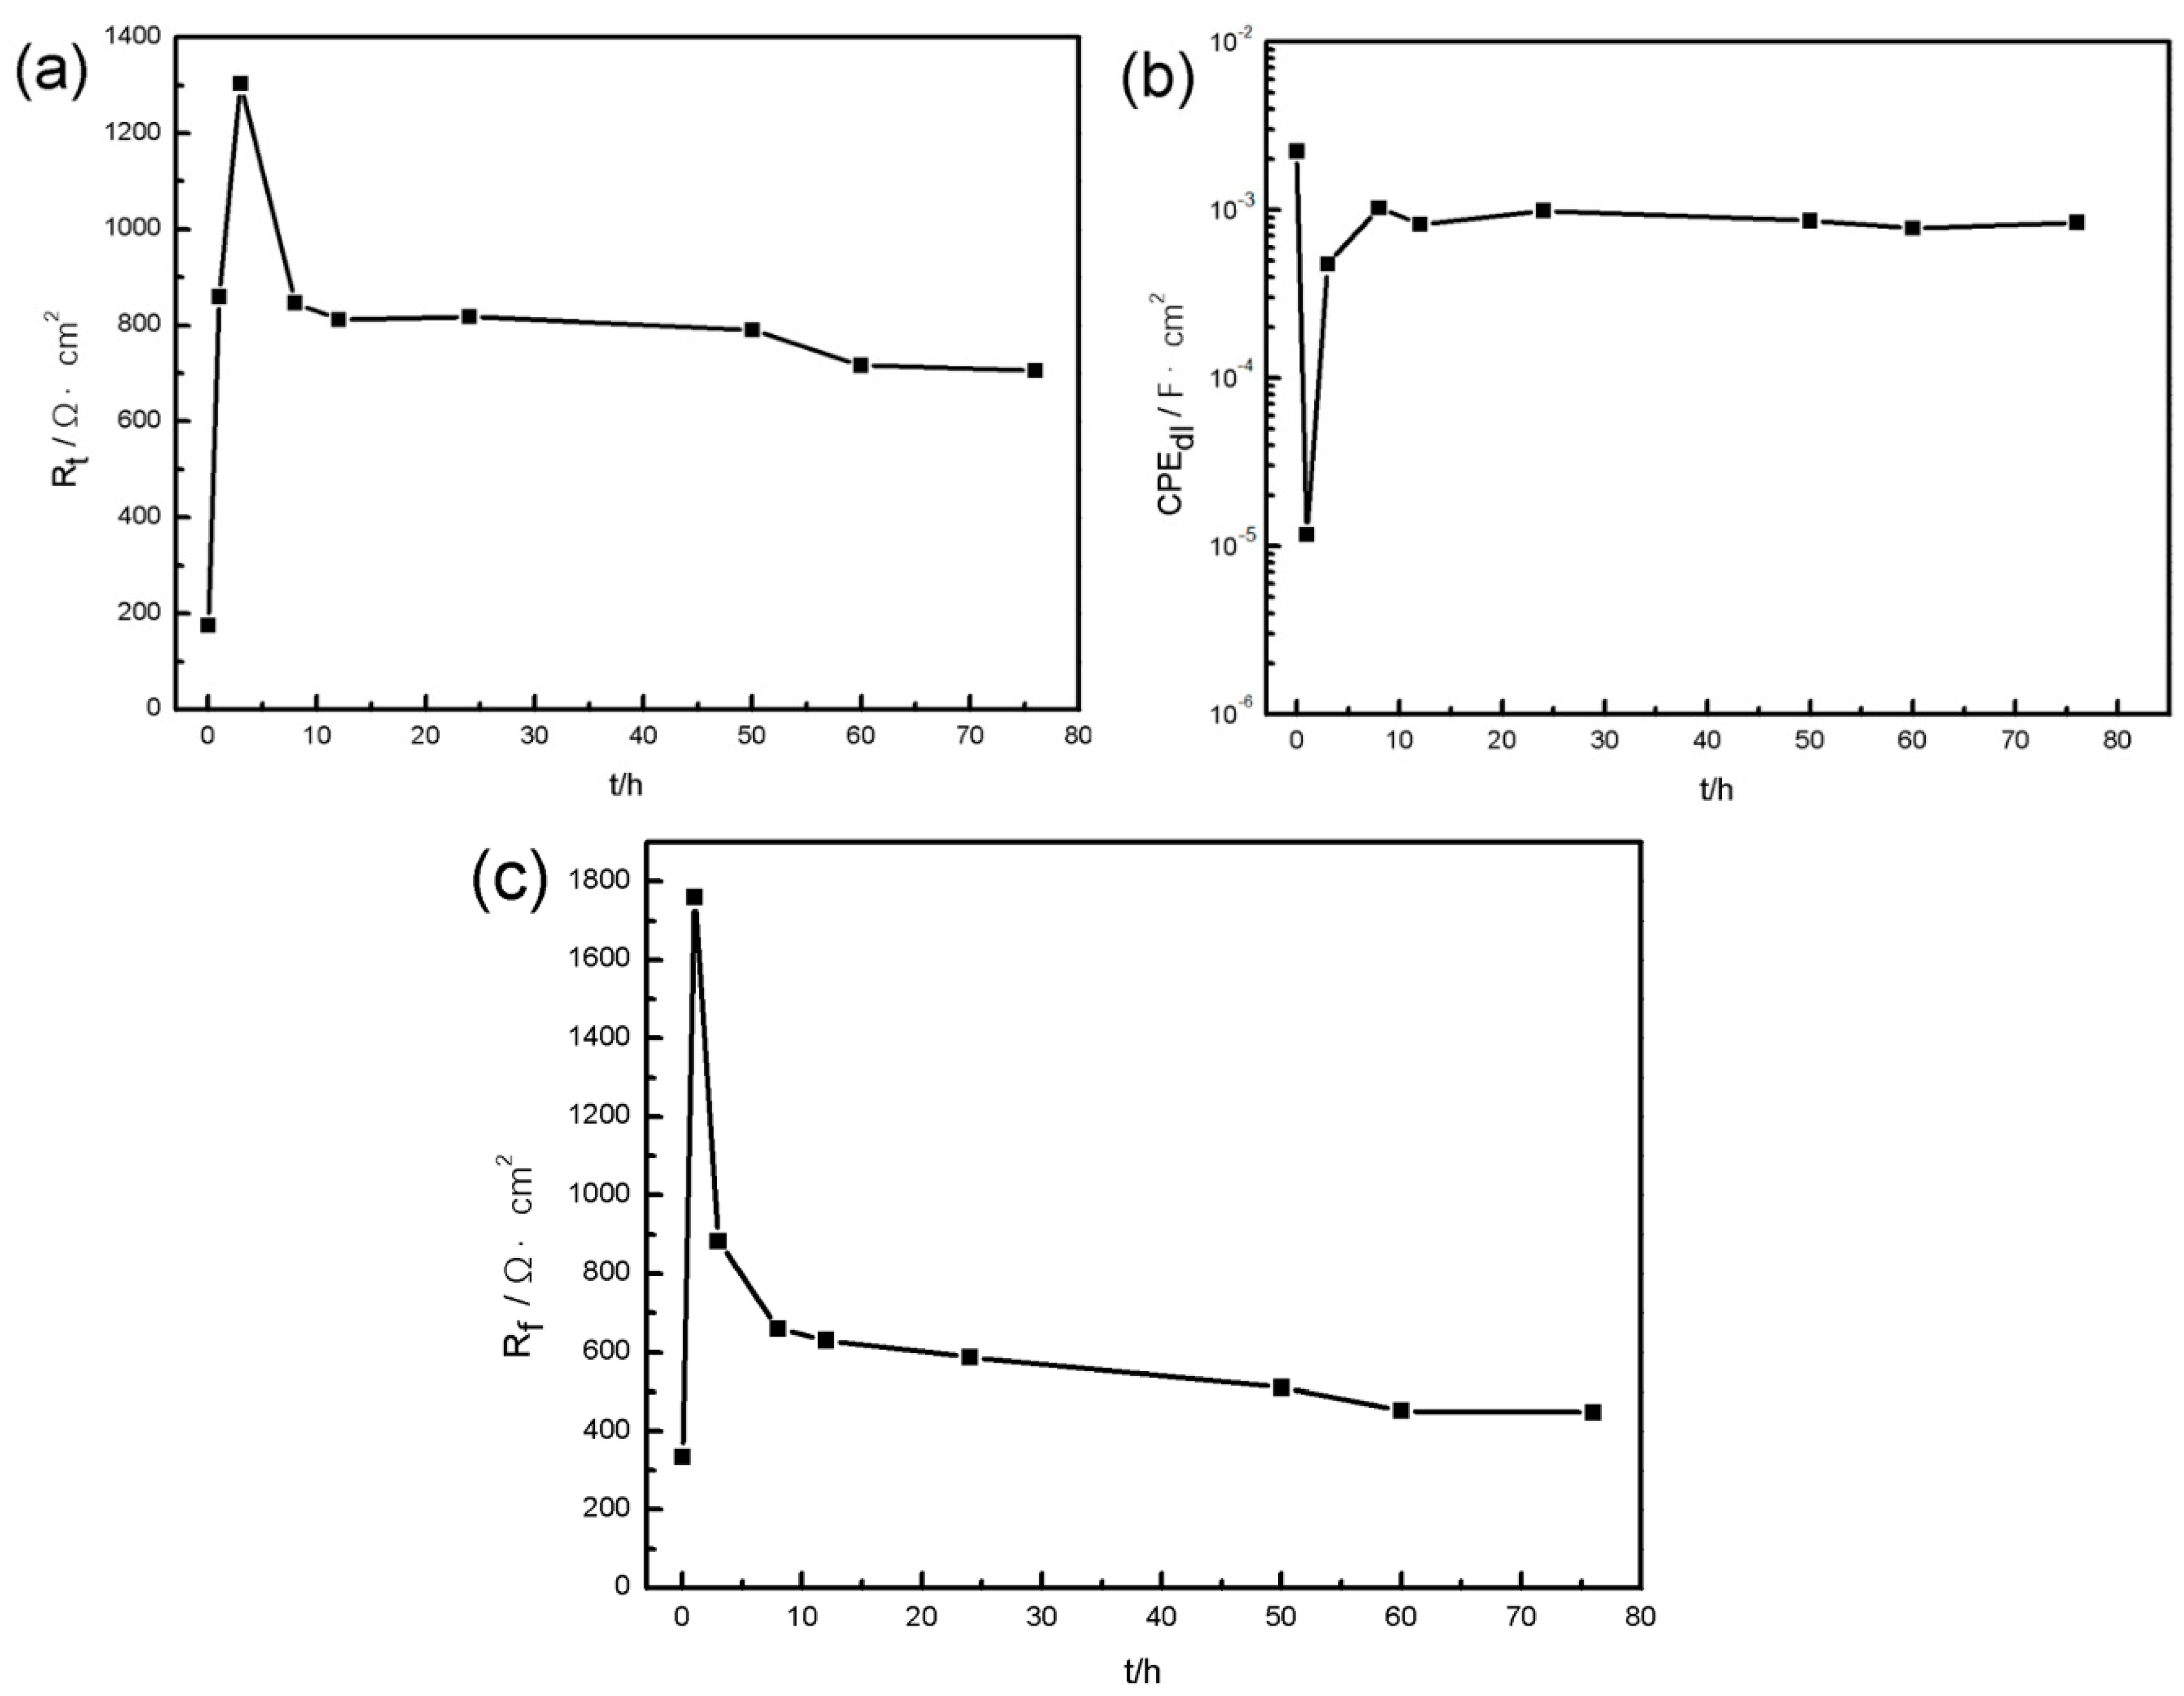
Figure 5 shows the EIS fitting results including Rt (Figure 5a), CPEdl (Figure 5b), and Rf (Figure 5c). It can be found that Rt of the specimen first increases with immersion time, but after immersion for 3 h, the value of Rt begins to decrease and maintains a lower level, simultaneously, Rf shows the same variation tendency. However, CPEdl represents an opposite performance. It indicates that an effective barrier appeared during the initial stage of corrosion, then the protective film was broken and localized corrosion developed, coinciding with the OCP result.
3.1.3. Hydrogen Collection
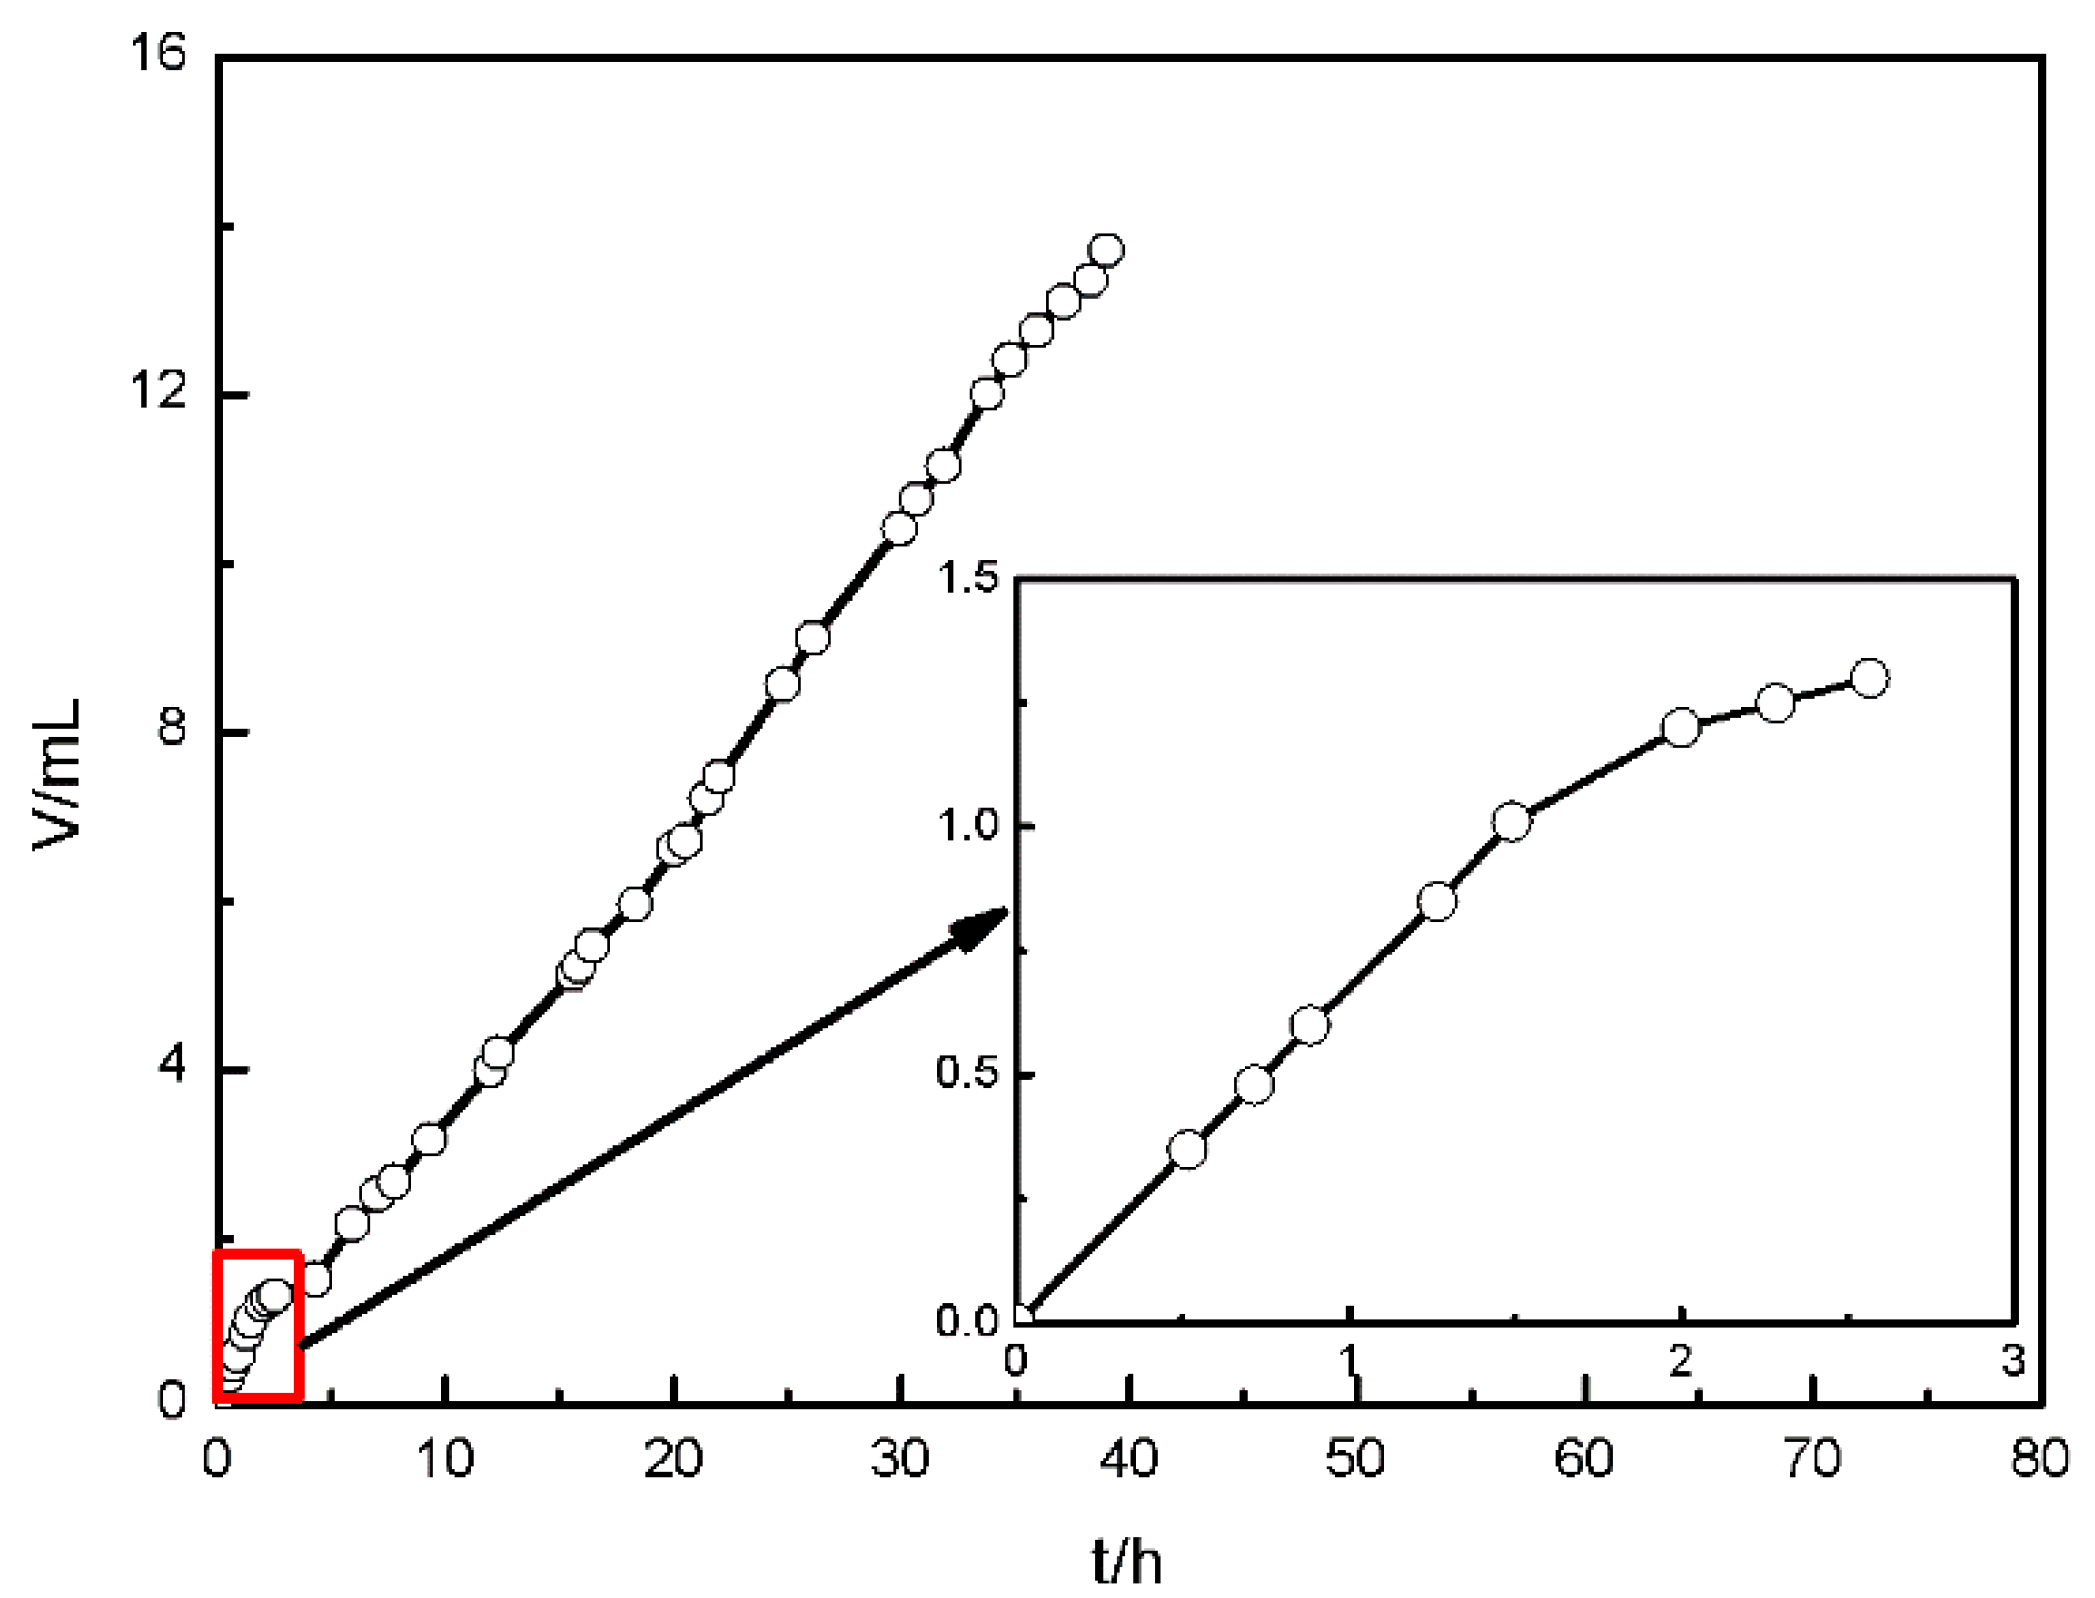
The corrosion rate of sample can be evaluated by the volume of the hydrogen collected in situ [32]. Figure 6 shows the volume of hydrogen generated by AZ91D immersed in simulated solution. In the first 1.5 h, the volume of hydrogen has a rapid growth, suggesting that the corrosion rate was fast. During 1.5–2.5 h, the volume increases slowly, indicating that the corrosion rate slowed down. After that, the volume of hydrogen extends a certain value per unit time, implying that the corrosion rate kept stable. This is in good agreement with the results obtained from OCP and EIS measurements.
3.1.4. Surface Appearance of AZ91D Immersed for Various Time
In order to have a further investigation on the corrosion process, samples were immersed in simulated HA solution for different time (1.5, 3, 8, 48 h). After immersion, the surface product and morphology were observed through SEM equipped with EDX and CLSM.
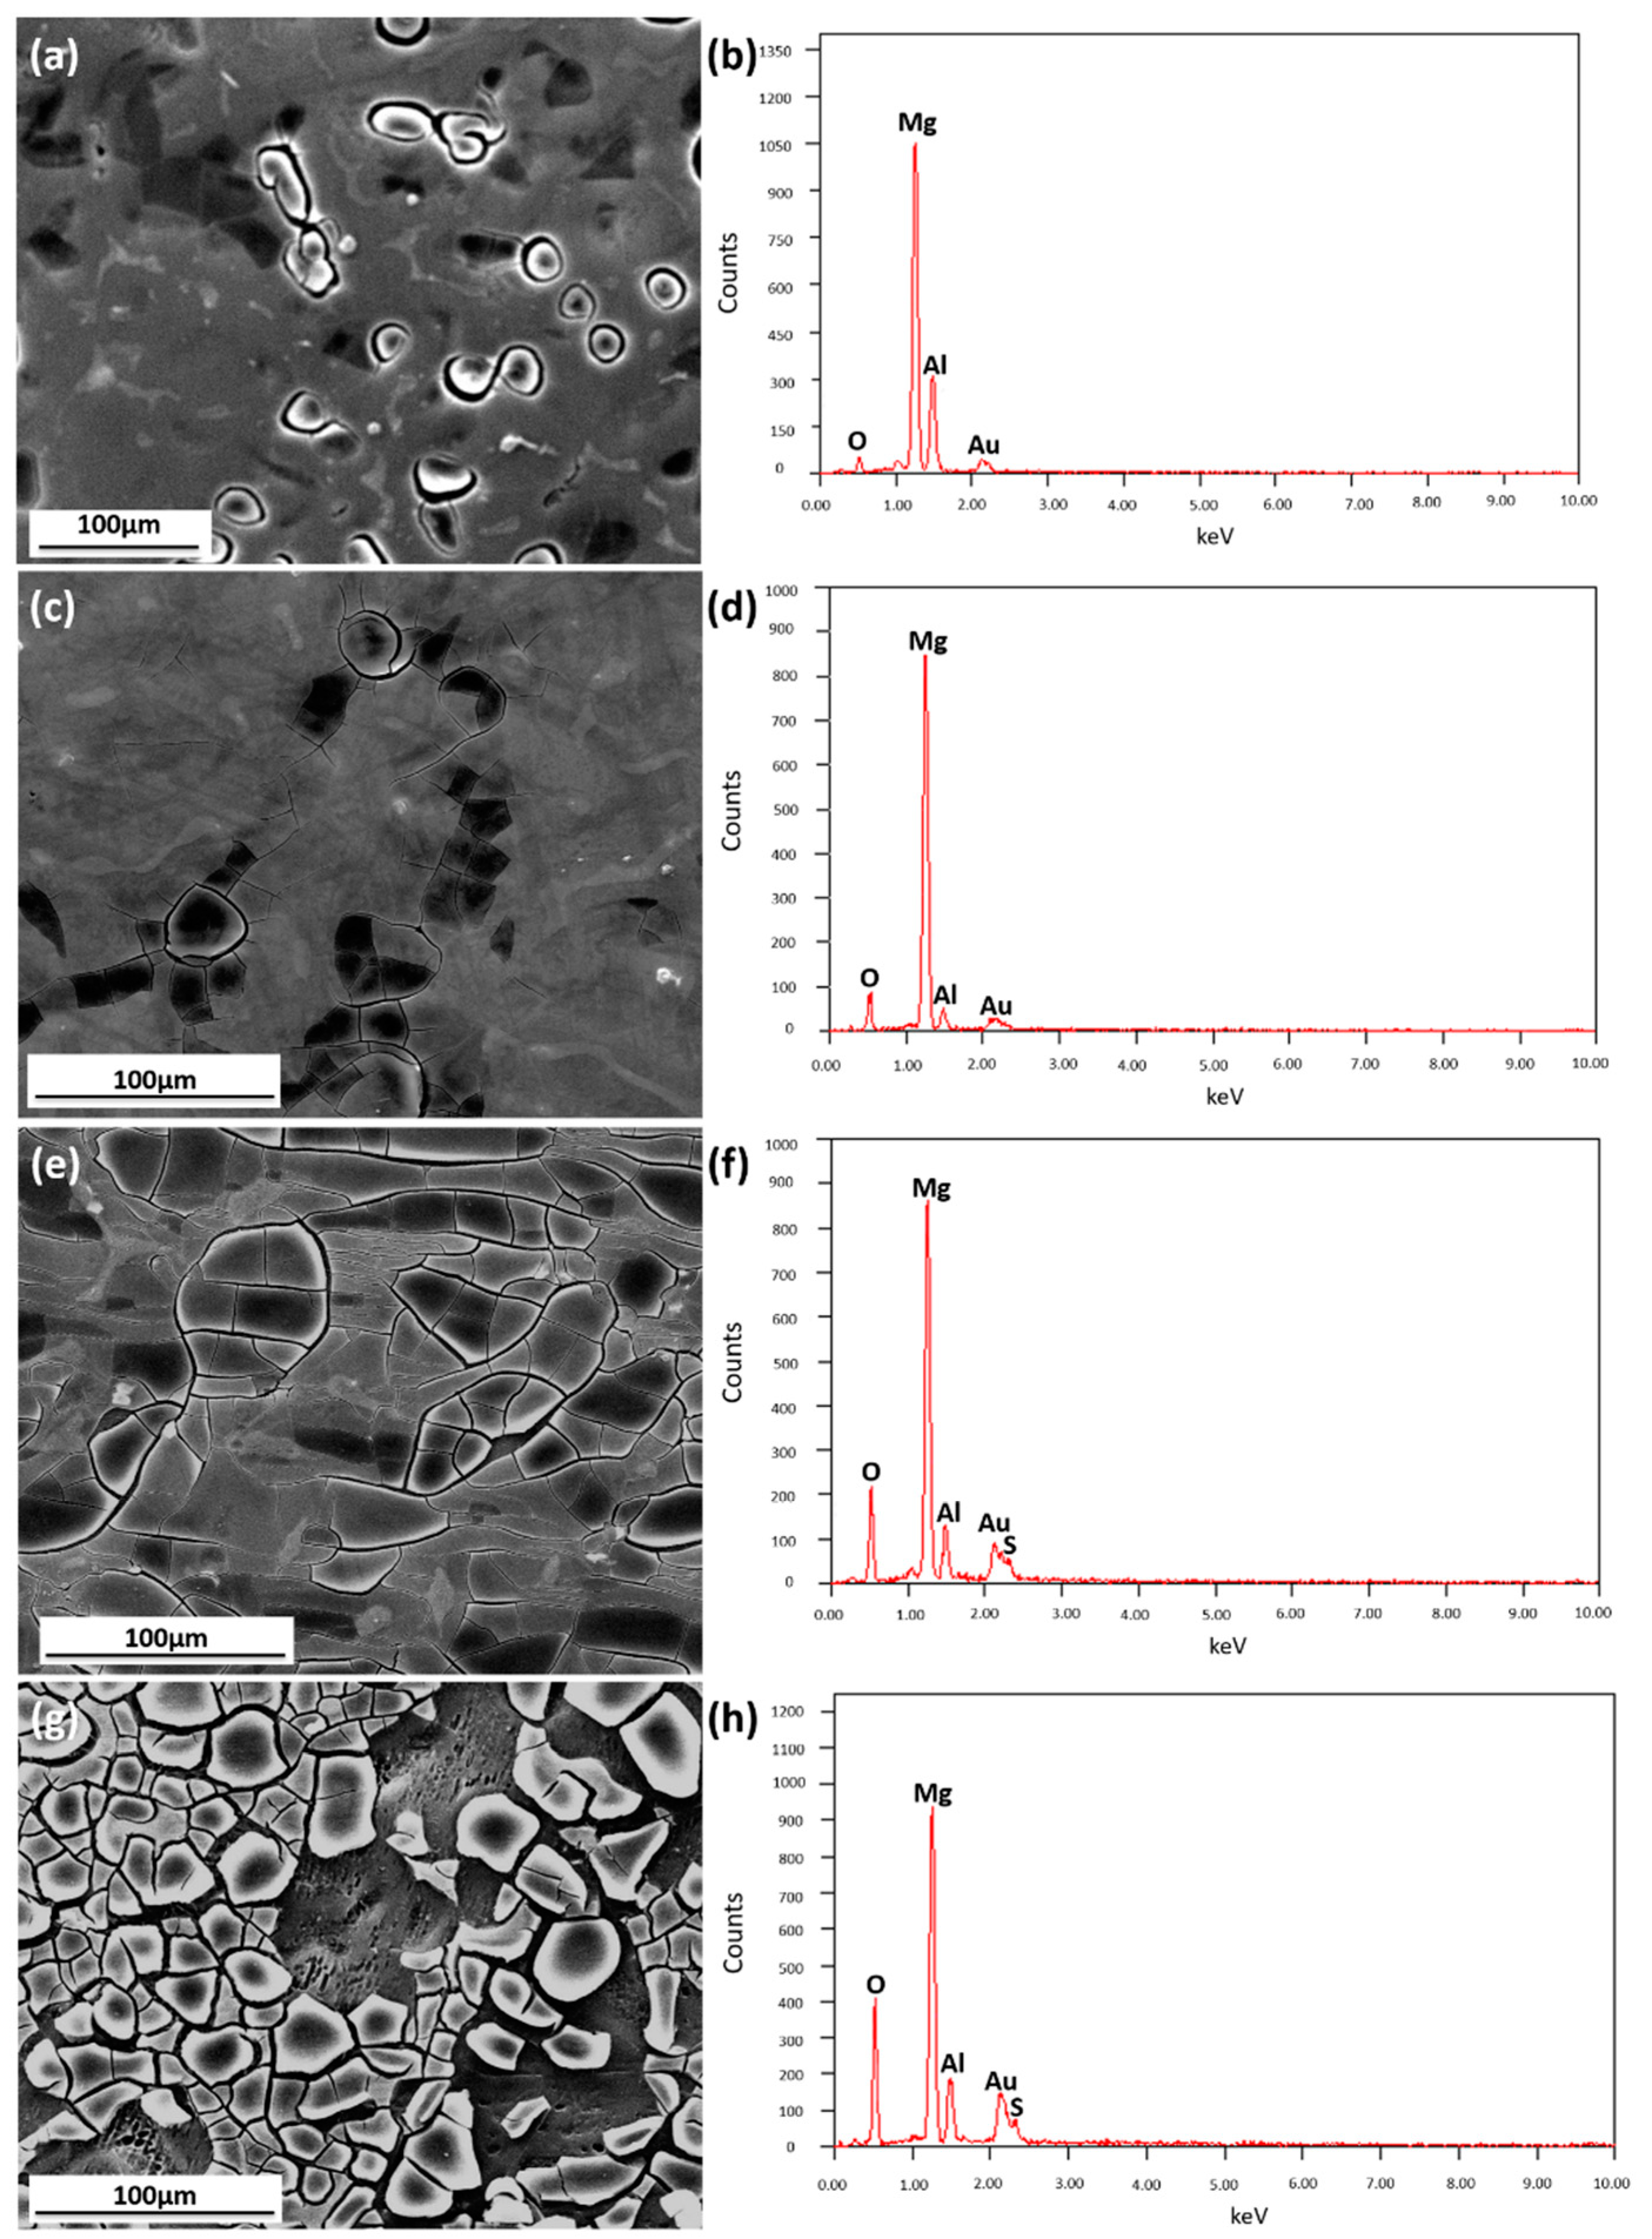
Figure 7 displays the SEM surface morphology and the corresponding EDX of AZ91D immersed in simulated HA solution for 1.5, 3, 8 and 48 h. In Figure 7a, there is a few small pitting points, and the surface is almost flat, even β-phase can be recognized on the surface. Figure 7b indicates a low O/Mg ratio. As time increases, small pitting points grow up and product film forms on the surface. Figure 7c shows that the product film ruptures and localized corrosion begins to deteriorate, and the signal ratio of O/Mg increases. After 8 h of immersion, the surface is seriously damaged (Figure 7e), and the signal peak of S appears evidently (Figure 7f). Figure 7g suggests that AZ91D surface is terribly damaged after being immersed for 48 h. The EDX measurement shows that the signal ratio of O/Mg increases over time, and Al content is almost unchanged. That is likely because the grains have corroded away, leaving a fine network structure consisting of higher aluminum content.
Figure 8 shows the cross-section of corrosion layer formed on AZ91D alloy after immersion for 48 h. It reveals a discontinuous and cracked corrosion film of about 10 μm, and O enrichment is found in the corrosion layer, meanwhile Al has nearly the same content between the bulk material and corrosion layer, which is in good agreement with Figure 7.
Figure 9 shows the surface morphology of samples immersed for different time, after rust removal in 1000 mL deionized water containing 200 g CrO3, 10 g AgNO3, and 20 g Ba(NO3)2. At the first 1.5 h, the pit depth on the AZ91D magnesium alloy surface in the medium was about 5 μm, with a surface diameter of less than 3 μm. It depicts that the corrosion was initiated from pitting corrosion. Both pit depth and surface diameter on specimen surface tended to grow with the increase of immersion time. These images reveal that small pits united and therefore big pits formed finally.
3.2. The Influence of Ions
3.2.1. Surface Appearance of AZ91D Immersed in Various Solutions
Simulated HA solution contains four kinds of water-soluble ions, to explore the influence of each ion towards AZ91D, immersion test was carried out. Samples were immersed in five types of solutions for 11 days. The original composition of simulated HA solution is mentioned in Section 2.1, and the four other solutions were respectively lack of , , and Cl−.
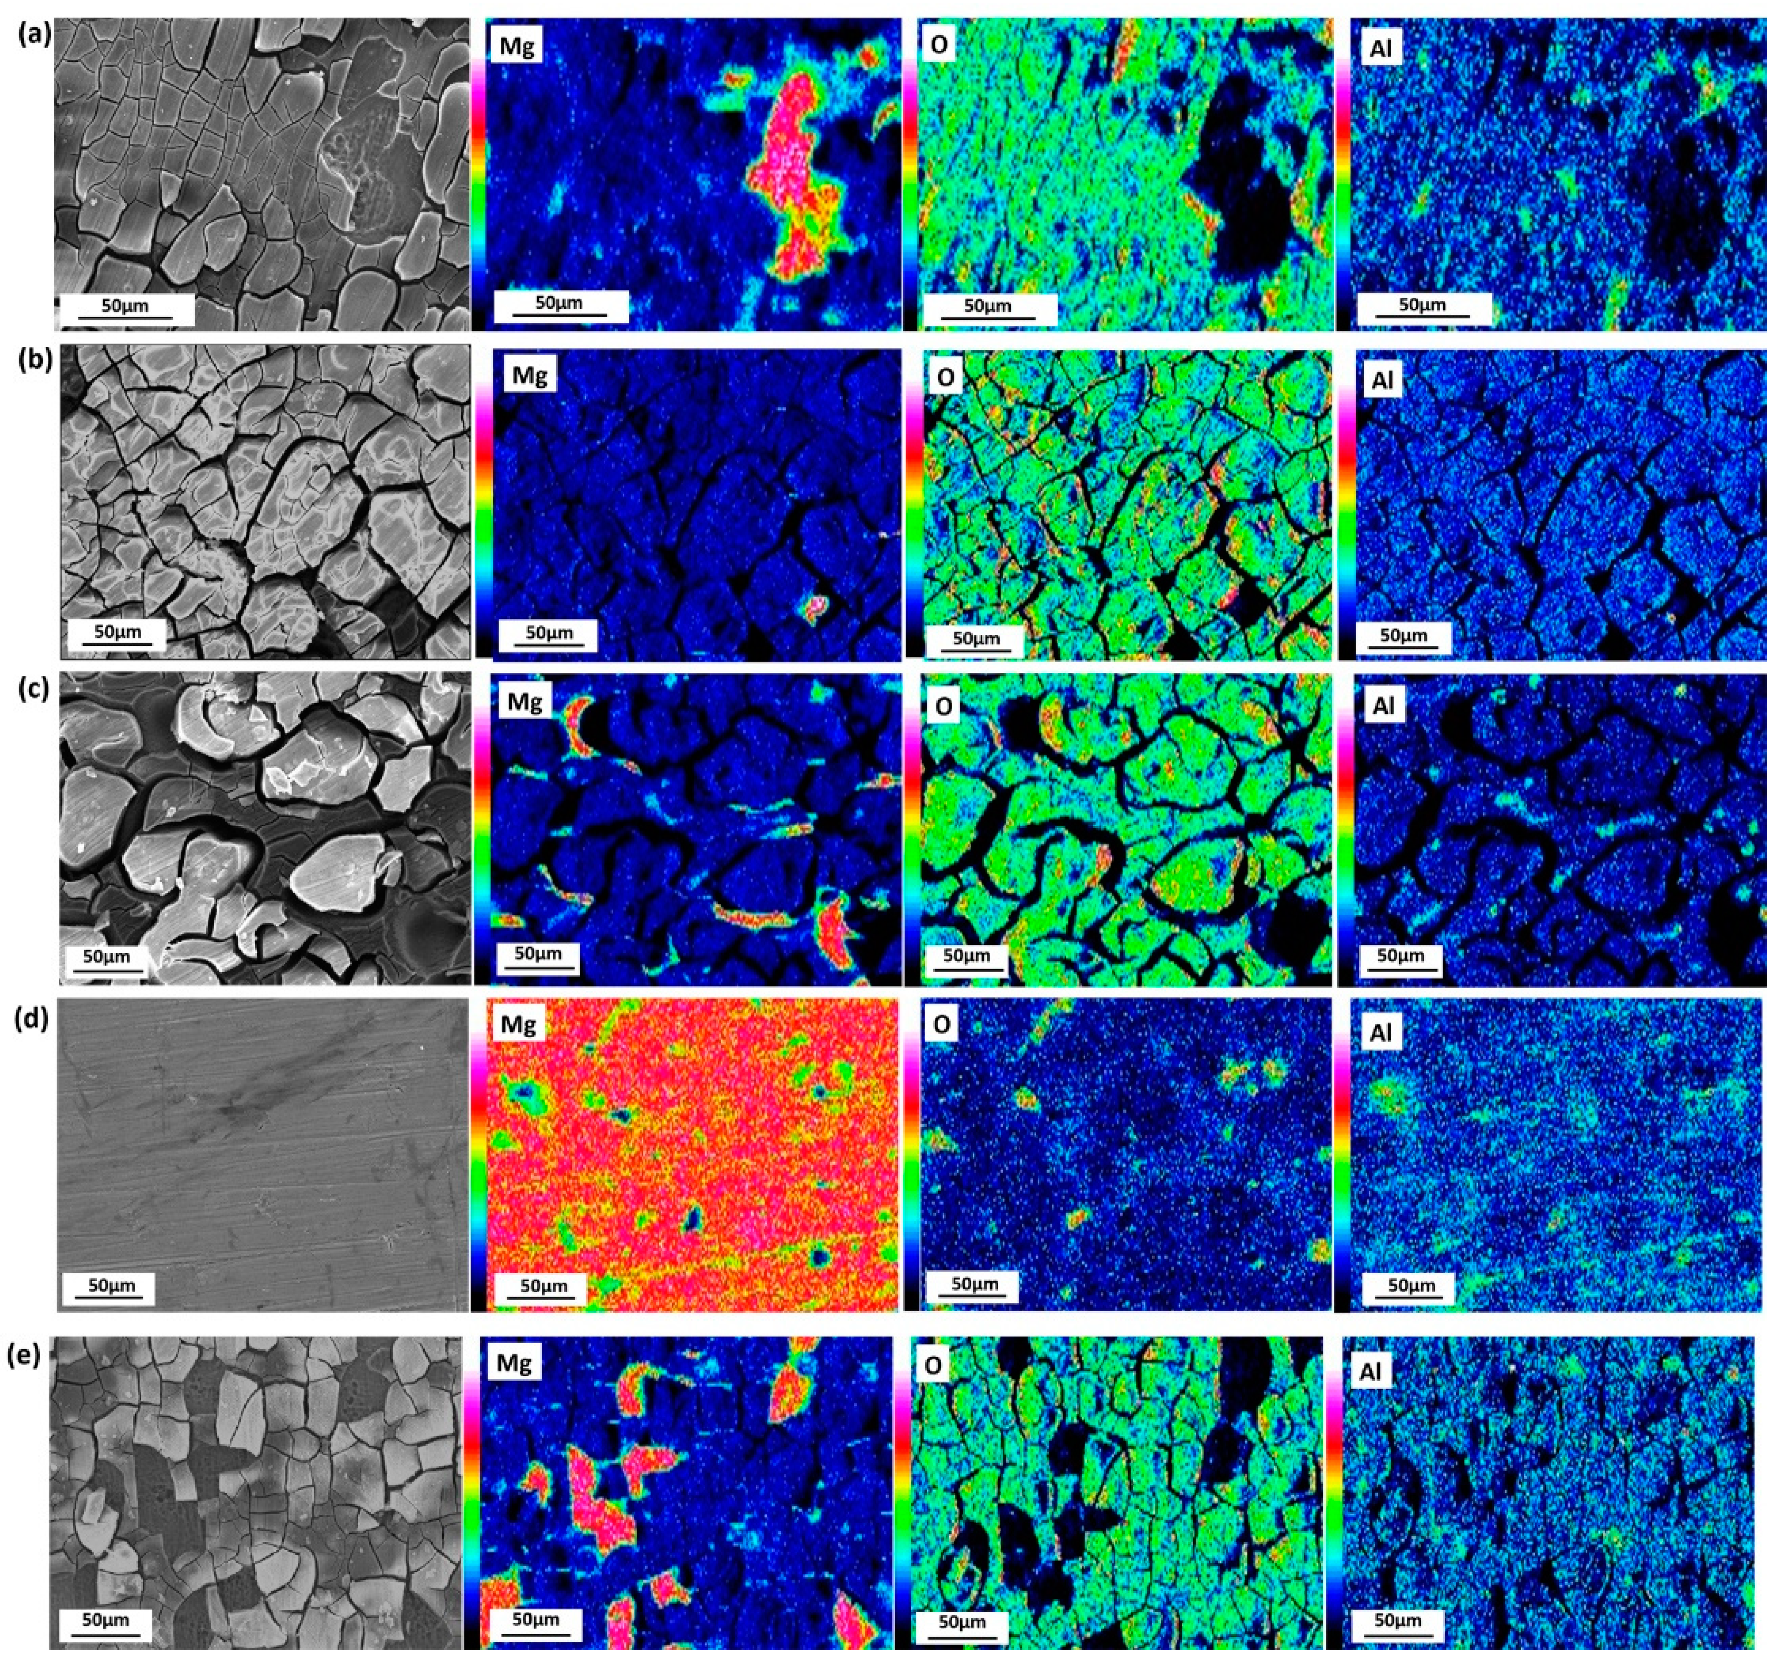
The SEM micrographs and corresponding EDX maps of the surface of the tested samples are shown in Figure 10. After 11 days immersion, the product film ruptures terribly, even slips off the bulk, and the bare Mg matrix is exposed, as shown in Figure 10a. As Figure 10b discloses, when lacking , the film is broken evenly, but barely comes off the matrix. As can be seen from Figure 10c, when is absent, localized corrosion is severe, Al enrichment is found in the remaining bulk. Figure 10d shows that the surface of sample is damaged slightly when short of . As Figure 10e reveals, Cl− does not show much influence towards corrosion, because the surface appearance is like that shown in Figure 10a.
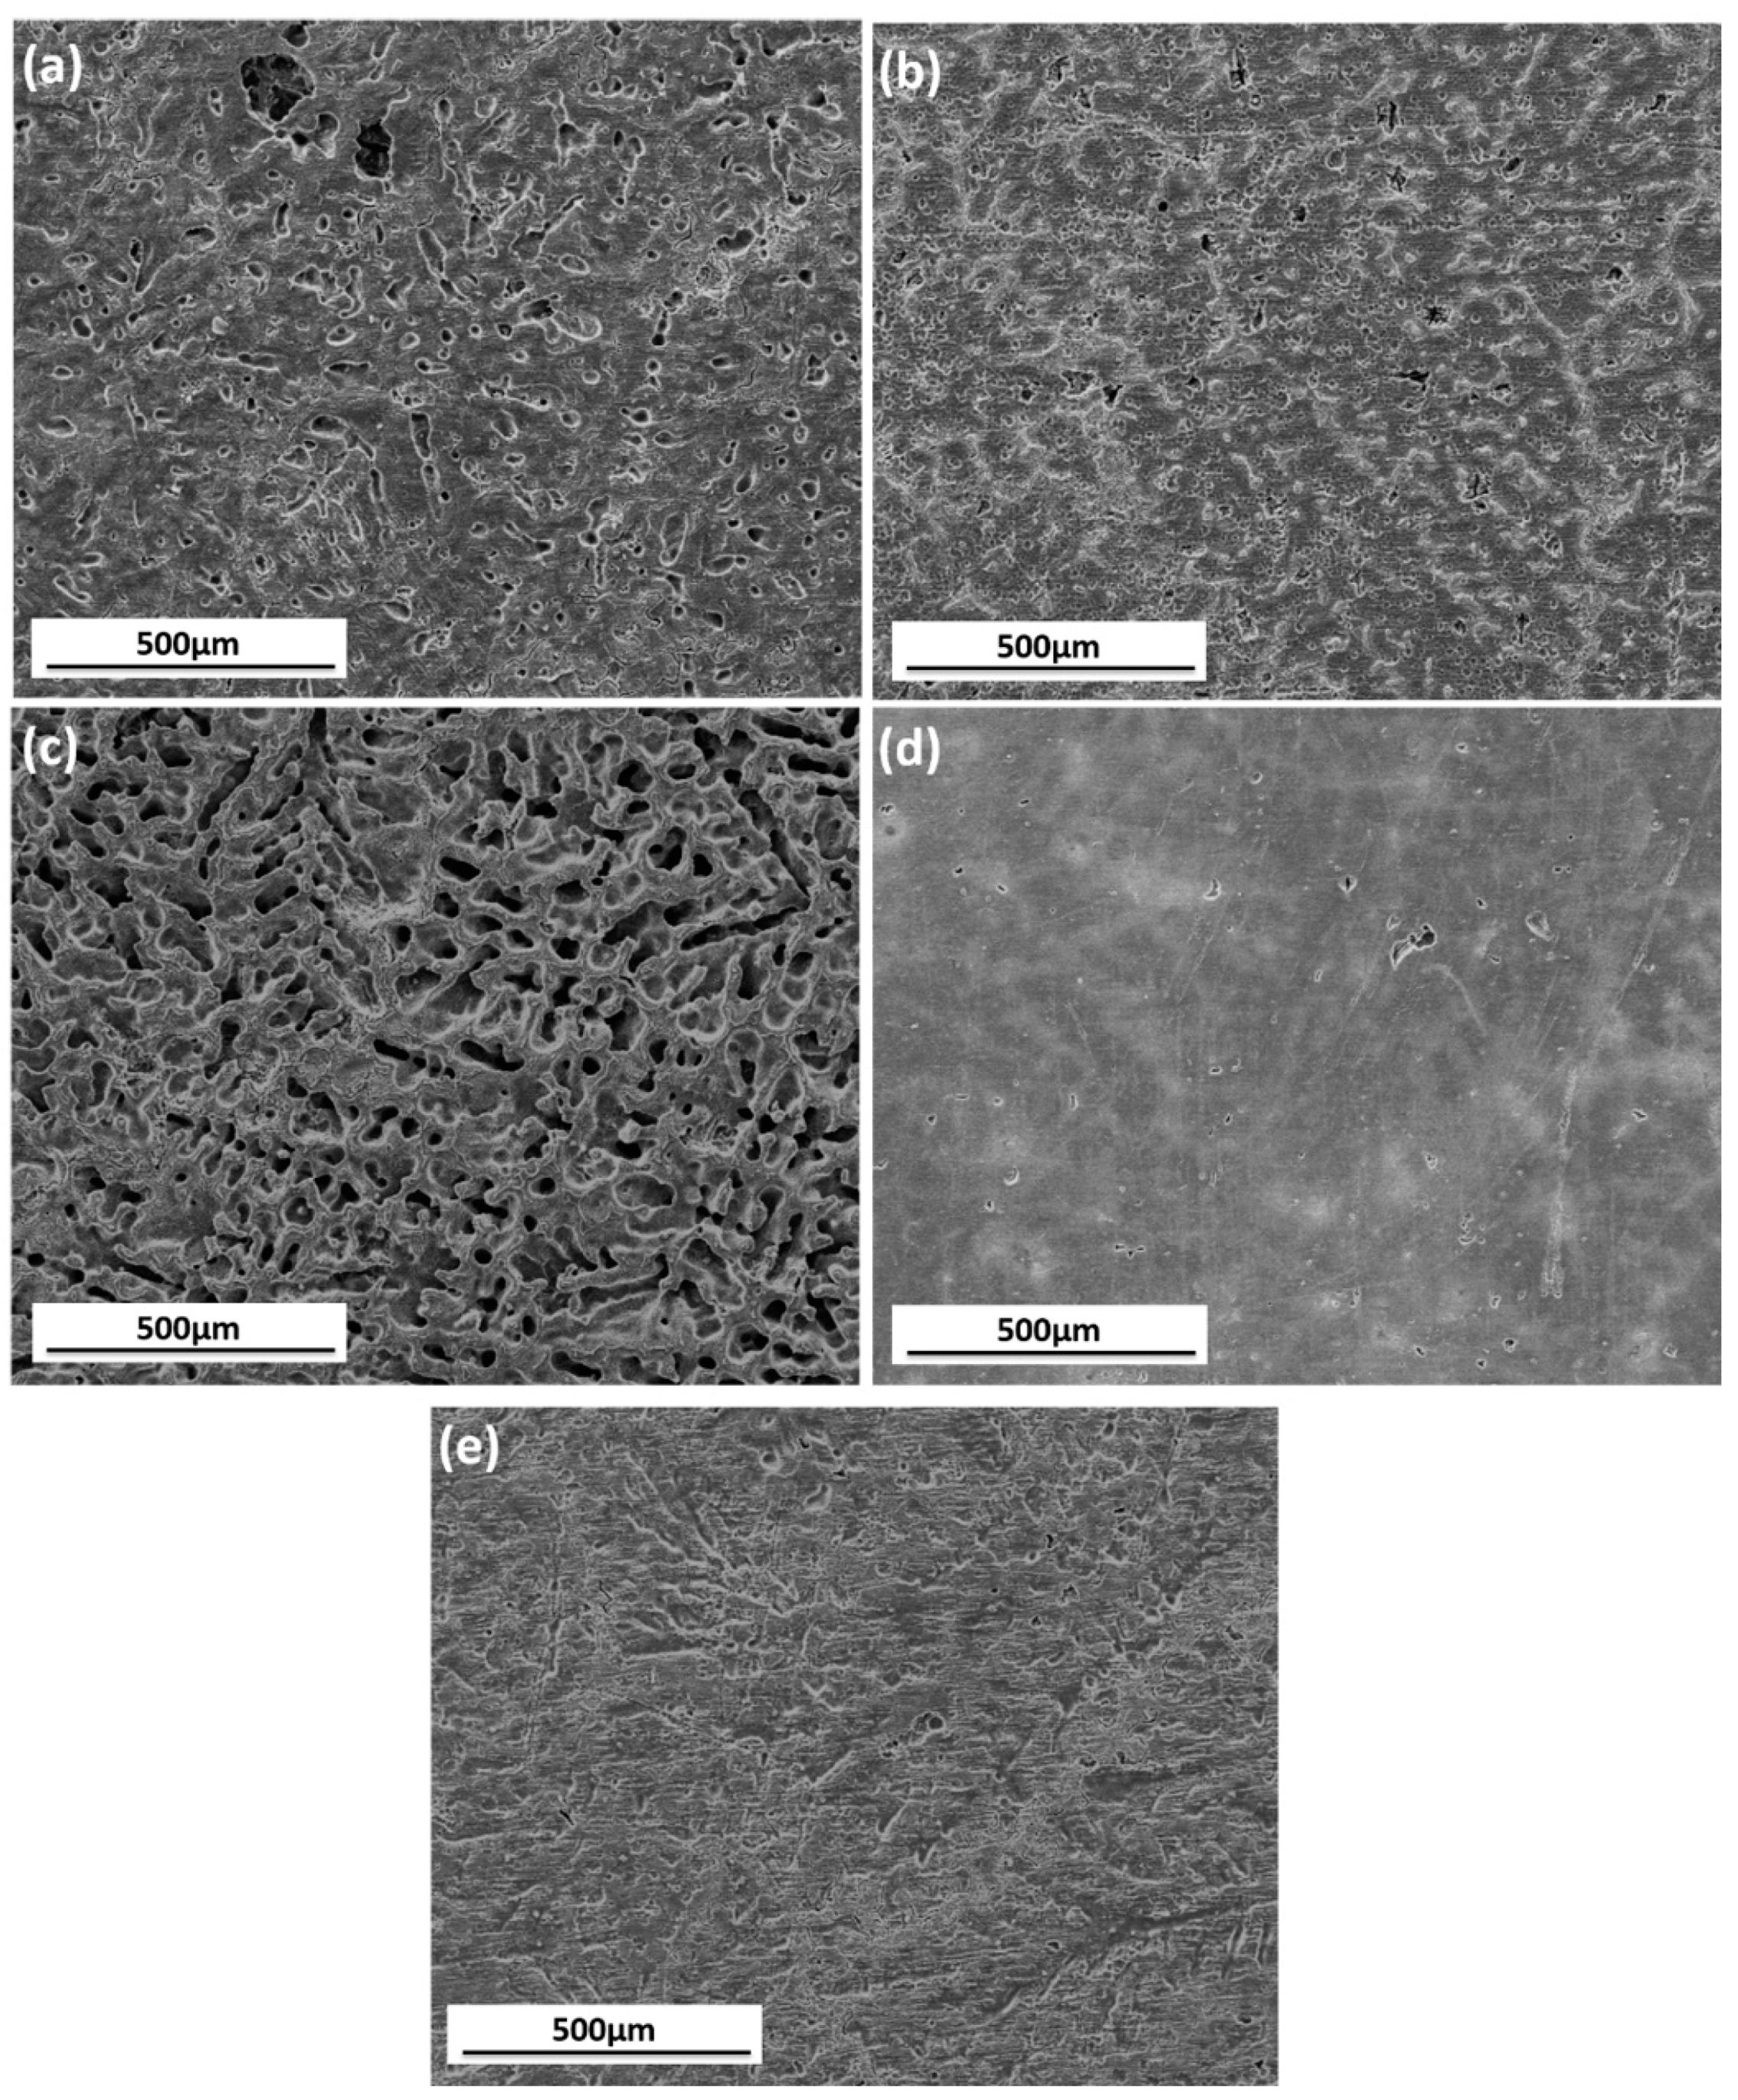
Figure 11 shows the surface morphology of tested samples after rust removal. Figure 11a shows that overall corrosion and localized corrosion develop on the surface when immersed in simulated HA solution. In the absence of , less serious localized corrosion pits are formed on the surface, as Figure 11b shows. The morphology in Figure 11c reveals the terrible corroded surface resulting from the lack of , and the corrosion pits are distributed around the resistant β-phase network, suggesting that holds back the corrosion process as it does for some other metals [33]. The slight pitting corrosion shown in Figure 11d discloses that the absence of slows down the corrosion process drastically. The shortage of Cl− alleviates the pitting corrosion of AZ91D (Figure 11e), indicating that Cl− helps to develop localized corrosion. The pre-study shows that Cl− promotes rapid attack in neutral aqueous solutions and acidic solutions [34,35].
3.2.2. Electrochemical Measurements
In order to obtain further information about the influence of ions, electrochemical measurements were carried out. The original composition of simulated HA solution is mentioned in Section 2.1. When it comes to the influence , the concentration of is adjusted from 0.05 to 0, 0.01, 0.05, 0.1 M, respectively. This is consistent with the rest of the three ions.
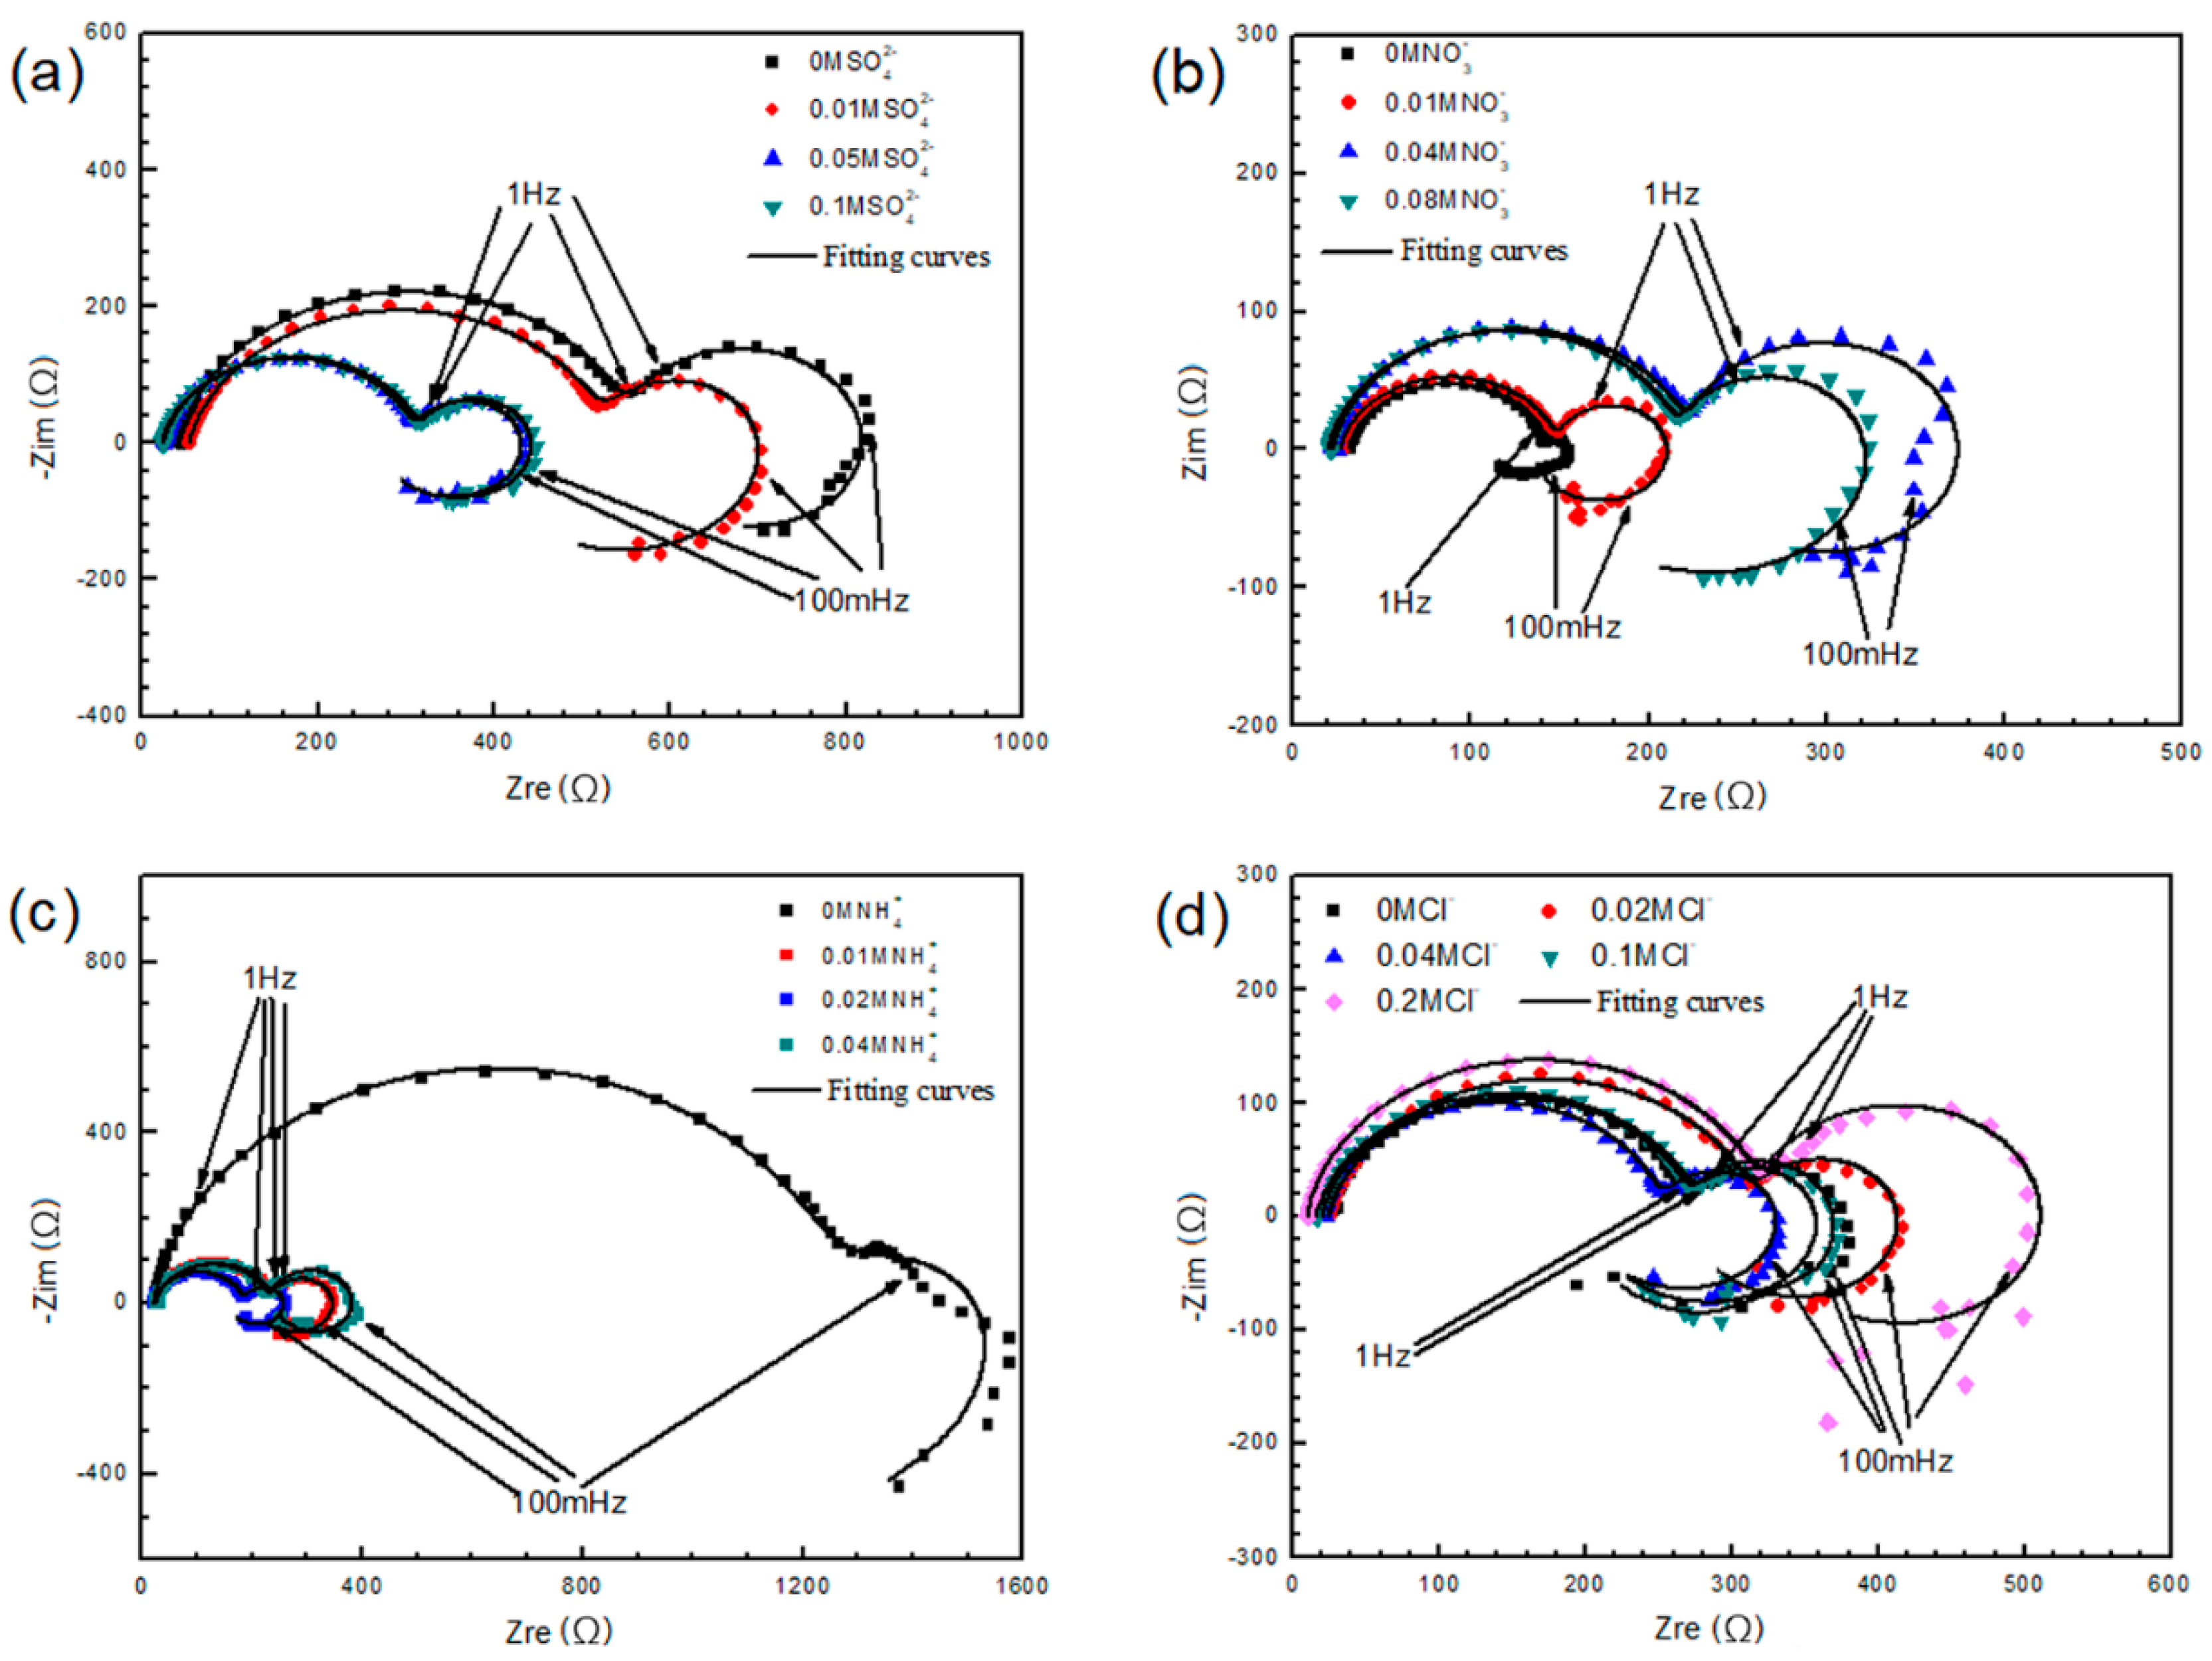
Figure 12 shows the Nyquist diagrams of AZ91D samples immersed in solutions containing different concentrations of water-soluble ions, exhibiting various electrochemical characteristics. The equivalent circuit is Model A in Figure 4a. The shape of the complex diagram changes with ions concentration and displays how the ions influenced the corrosion process. Figure 12a indicates that is harmful to AZ91D, but the impedance arcs reach a stable state once the concentration of exceeds a certain value. Figure 12b reveals that is a kind of protective ions, as the impedance modulus value tends to grow large with the increasing concentration. Figure 12c shows that is the most significant ion in this study, for the impedance modulus value decreases by more than four times with only 0.01M . Figure 12d suggests that Cl− does not show evident influence. Therefore, and are the two most obvious ions among the four kinds of water-soluble ions.
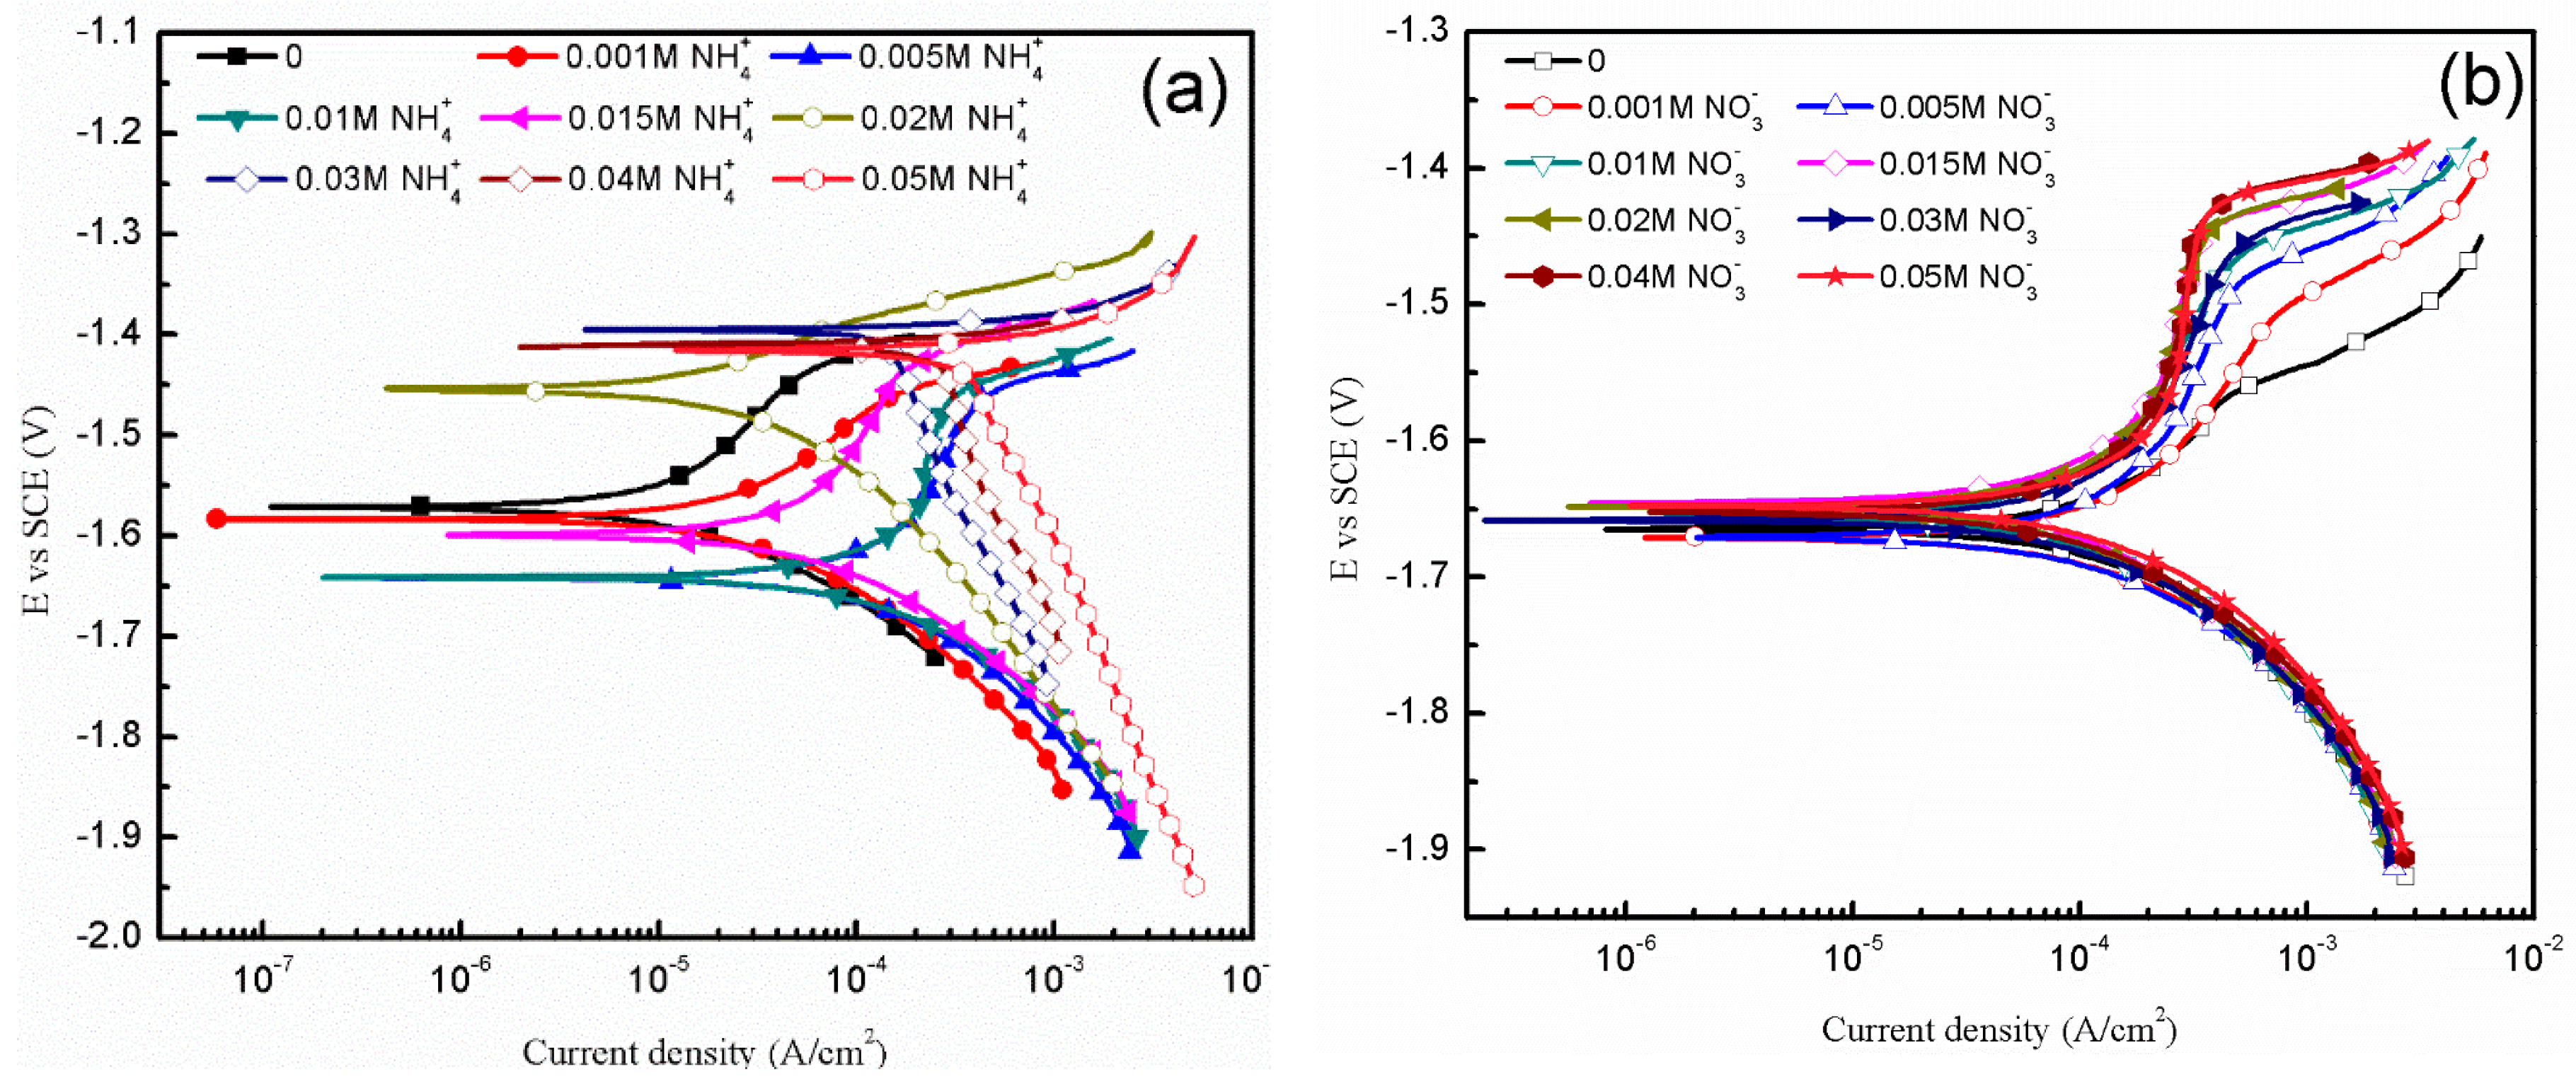
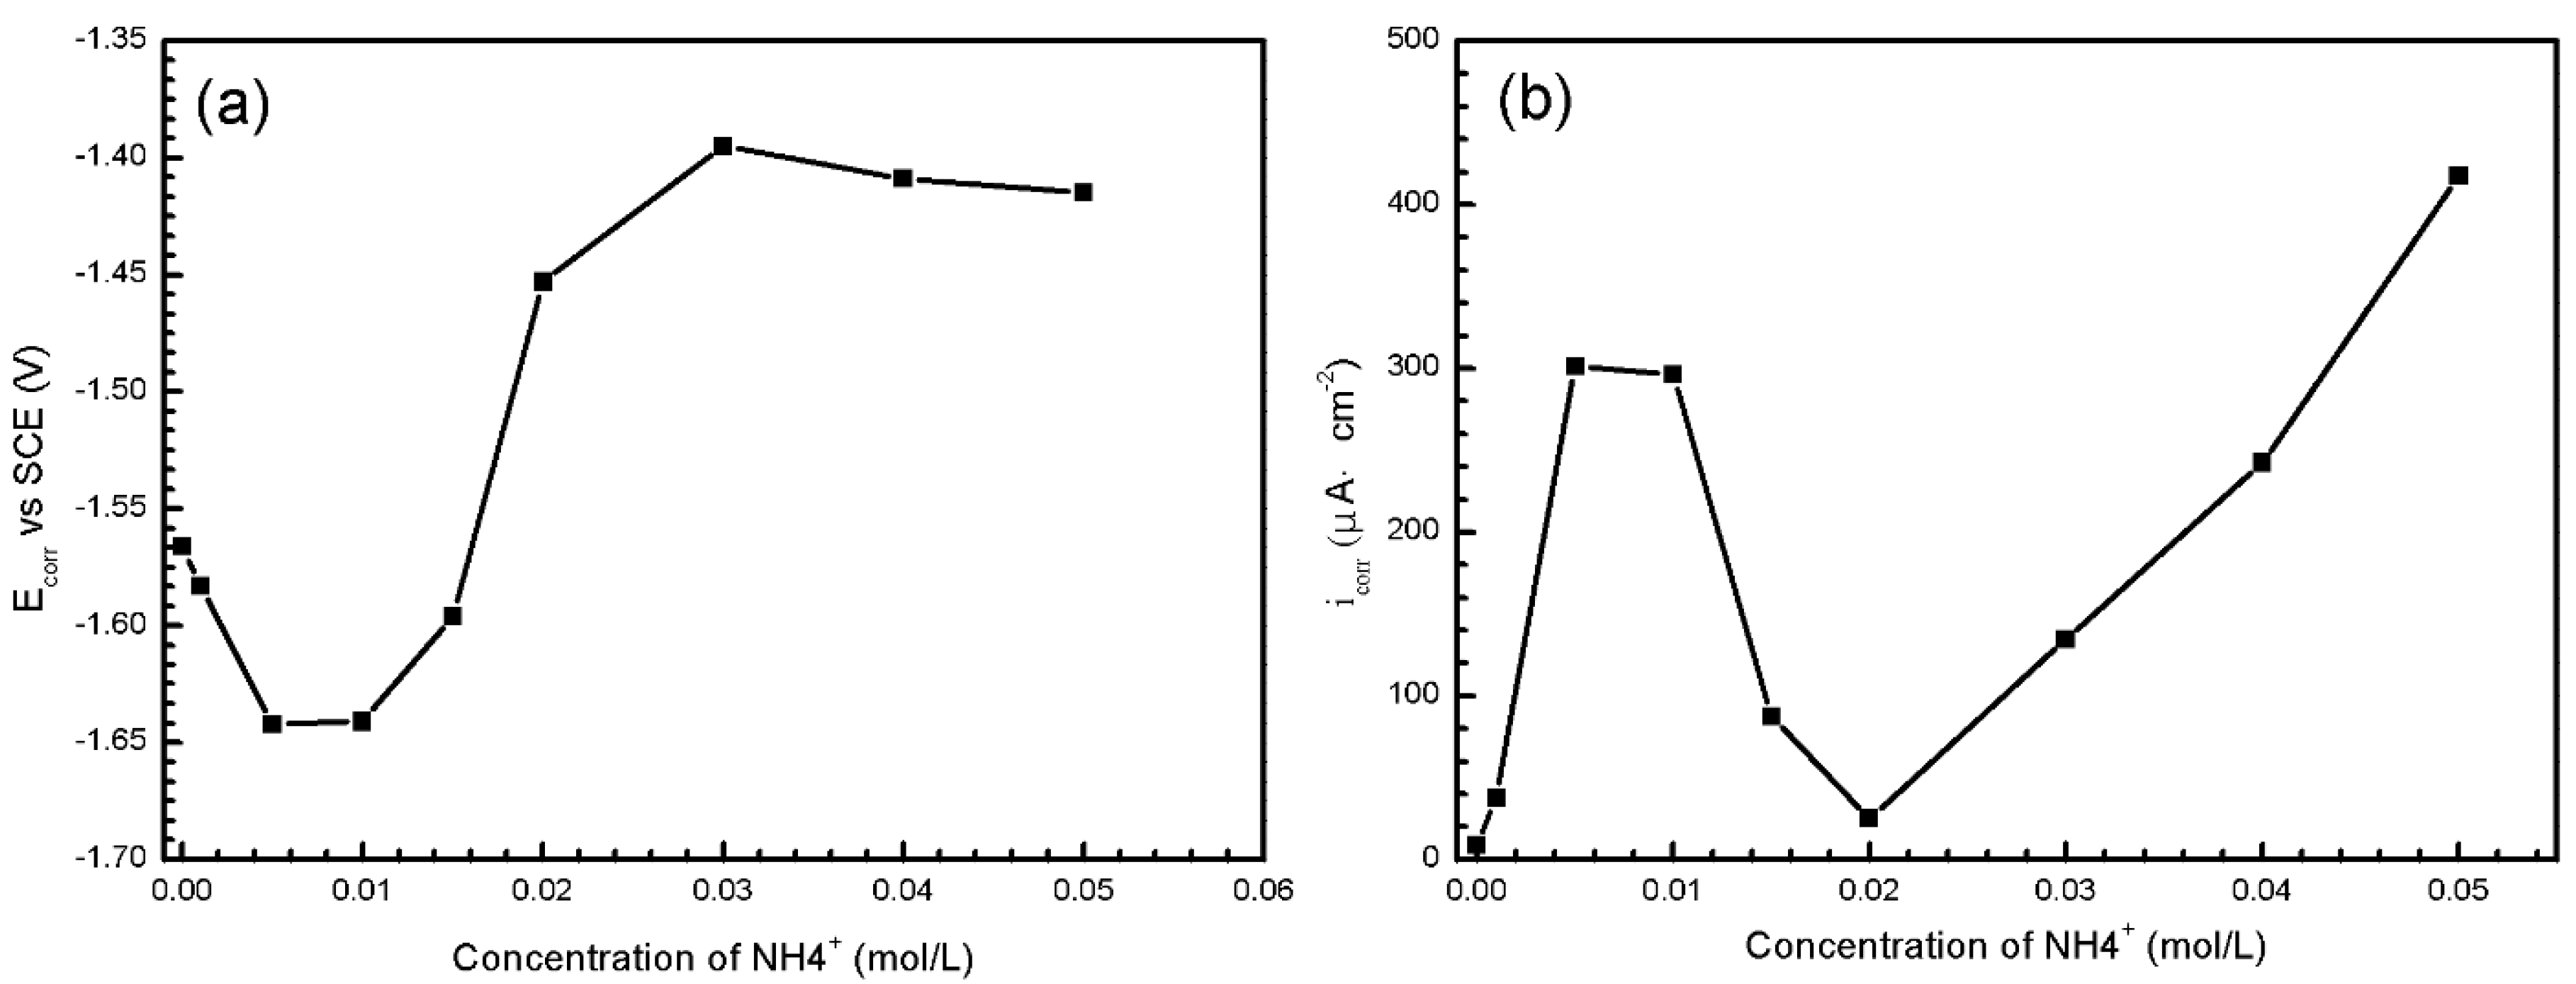
To know more about the influence of and towards specimens, further efforts were made through polarization curves, as shown in Figure 13. The corrosion potentials (Ecorr), corrosion current densities (icorr) and corrosion rate (rc) values of polarization curves in Figure 13 are summarized in Table 3. Ecorr, icorr of the samples are obtained by the Tafel extrapolation method; rc (mm/a) is related to icorr (mA/cm) [36] using
Figure 13a reveals the anodic and cathodic polarization behaviors of the specimens exposed to solutions containing of 0 to 0.05 M. As the acquired curves reveal evident curvature, the Tafel extrapolation of the anodic and cathodic branches are performed using the Tafel Fit in the P4000+. The identified dynamic polarized Ecorr and icorr obtained from Figure 13a are summarized in Figure 14. The values of icorr show a drastic change when the concentration of reaches 0.005 M. The decrease of icorr in solution of 0.02 M is likely due to the formation of corrosion product. The cathodic branch shows an extensive linear Tafel region and the cathodic current density is obviously promoted with the increasing concentration of . In addition, the slope of anodic branch has a tendency to decrease with the increasing concentration of , so it indicates that the breakdown of product coverage on corrosion surface increases the active region of corrosion reaction [37]. It can be inferred that hinders the formation of product hydroxide/oxide film by the consuming OH−. As shown in Table 3, the corrosion rate of AZ91D increases nearly tenfold from 0.8598 mm/a to 6.882 mm/a when changes from 0.001 to 0.005 M. When reaches 0.02 M, the corrosion rate drops down due to the productive film. However, as concentration increases, the corrosion rate increases linearly. Former study indicates that the corrosion rate of AZ91D immersed in 1 M NaCl solution is 0.91 mm/a [36], close to the corrosion rate of AZ91D immersed in simulated HA solution with 0.001 M . It indicates that is largely responsible for the terrible corrosion behavior in simulated HA solution.
Figure 13b shows the potentiodynamic polarization curves of samples immersed in solutions containing of 0 to 0.05 M. There is little difference among cathodic Tafel slopes, reflecting similar electrochemical reactions of hydrogen evolution. Table 3 shows that the values of Ecorr, icorr and rc fluctuate slightly with the change of concentration. However, Figure 11c reveals that does have an important influence on the corrosion behavior. It can be seen from Figure 13b that with the increasing concentration of , the slope of anodic branch increases, indicating more passive product film coverage on the corrosion surface. Therefore, the protective role plays can be attributed to the formation of passive product film.
3.2.3. XRD Analysis
After the immersion test, the corrosion product slipping off was collected and powdered to be analyzed through XRD. As shown in Figure 15, MgO and MgAl2O4 are the main corrosion products. As shown in No.2 XRD pattern, the absence of results in an evidently lower MgAl2(SO4)4·22H2O peak, indicating that MgAl2(SO4)4·22H2O is also an important product. It reveals from the No.4 XRD pattern that the product collected in solution lack of contained Mg(OH)2, which barely exists in other results, identifying accelerates corrosion by consuming OH− in a straightforward way.
4. Discussion
4.1. The Corrosion Behavior of AZ91D Alloy in the Simulated HA Solution
As described earlier, the corrosion rate of AZ91D immersed in simulated HA solution changed with time. Figure 2, Figure 3 and Figure 6 indicate that the corrosion process firstly suppressed then accelerated and finally reached stable. The corrosion resistance reached peak value after about 3 h immersion due to the formation of passive film on the α-matrix surface. played an important role in the process, according to Figure 11c and Figure 13b. In the meantime, the Cl− preferentially attacked the weak sites of surface film to form the active sites [38]. Then the localized corrosion initiated at the active sites, as depicted in Figure 9a.
When the immersion time exceeded 3 h, the corrosion rate increased. As can be seen from Figure 7c, the tiny cracks undermined the alloy matrix, and bare Mg was exposed to the solution, causing the reduction of corrosion resistance. When the cracks were so large that the surface could not hold corrosion product, part of the film began to slip. Therefore, barer matrix was exposed and corrosion became serious. According to the mechanism proposed by Chen [30], the aluminum concentration in the solution increased due to the dissolution of the eutectics (α-Mg + β-Mg17Al12), once aluminum concentration achieved a certain value, the precipitation of MgAl2(SO4)4·22H2O was formed as reaction (2), which occurred mainly in the pitting area. Figure 11b suggests that the corrosion pits still existed, but they were much more alleviative when was absent in the solution. This indicates that Cl− gave rise to the localized corrosion and aggravated corrosion pits.
The main corrosion products of AZ91D immersed in simulated HA solution for 11 days were MgO, MgAl2O4 and MgAl2(SO4)4·22H2O, as shown in Figure 15. The reason why Mg(OH)2 was absent was that consumed OH−, therefore Mg2+ could not combine with OH− to form protective Mg(OH)2 film. Without the protection of Mg(OH)2, the corrosion was more serious, which could be proved by Figure 11d and Figure 12c. It should be noted that with the development of corrosion, ran out around the localized corrosion pits, the resistant β-phase began to react with OH−, leading to the formation of Mg2Al(OH)7 and AlOOH.
4.2. The Corrosion Mechanism of AZ91D in the Simulated HA Solution
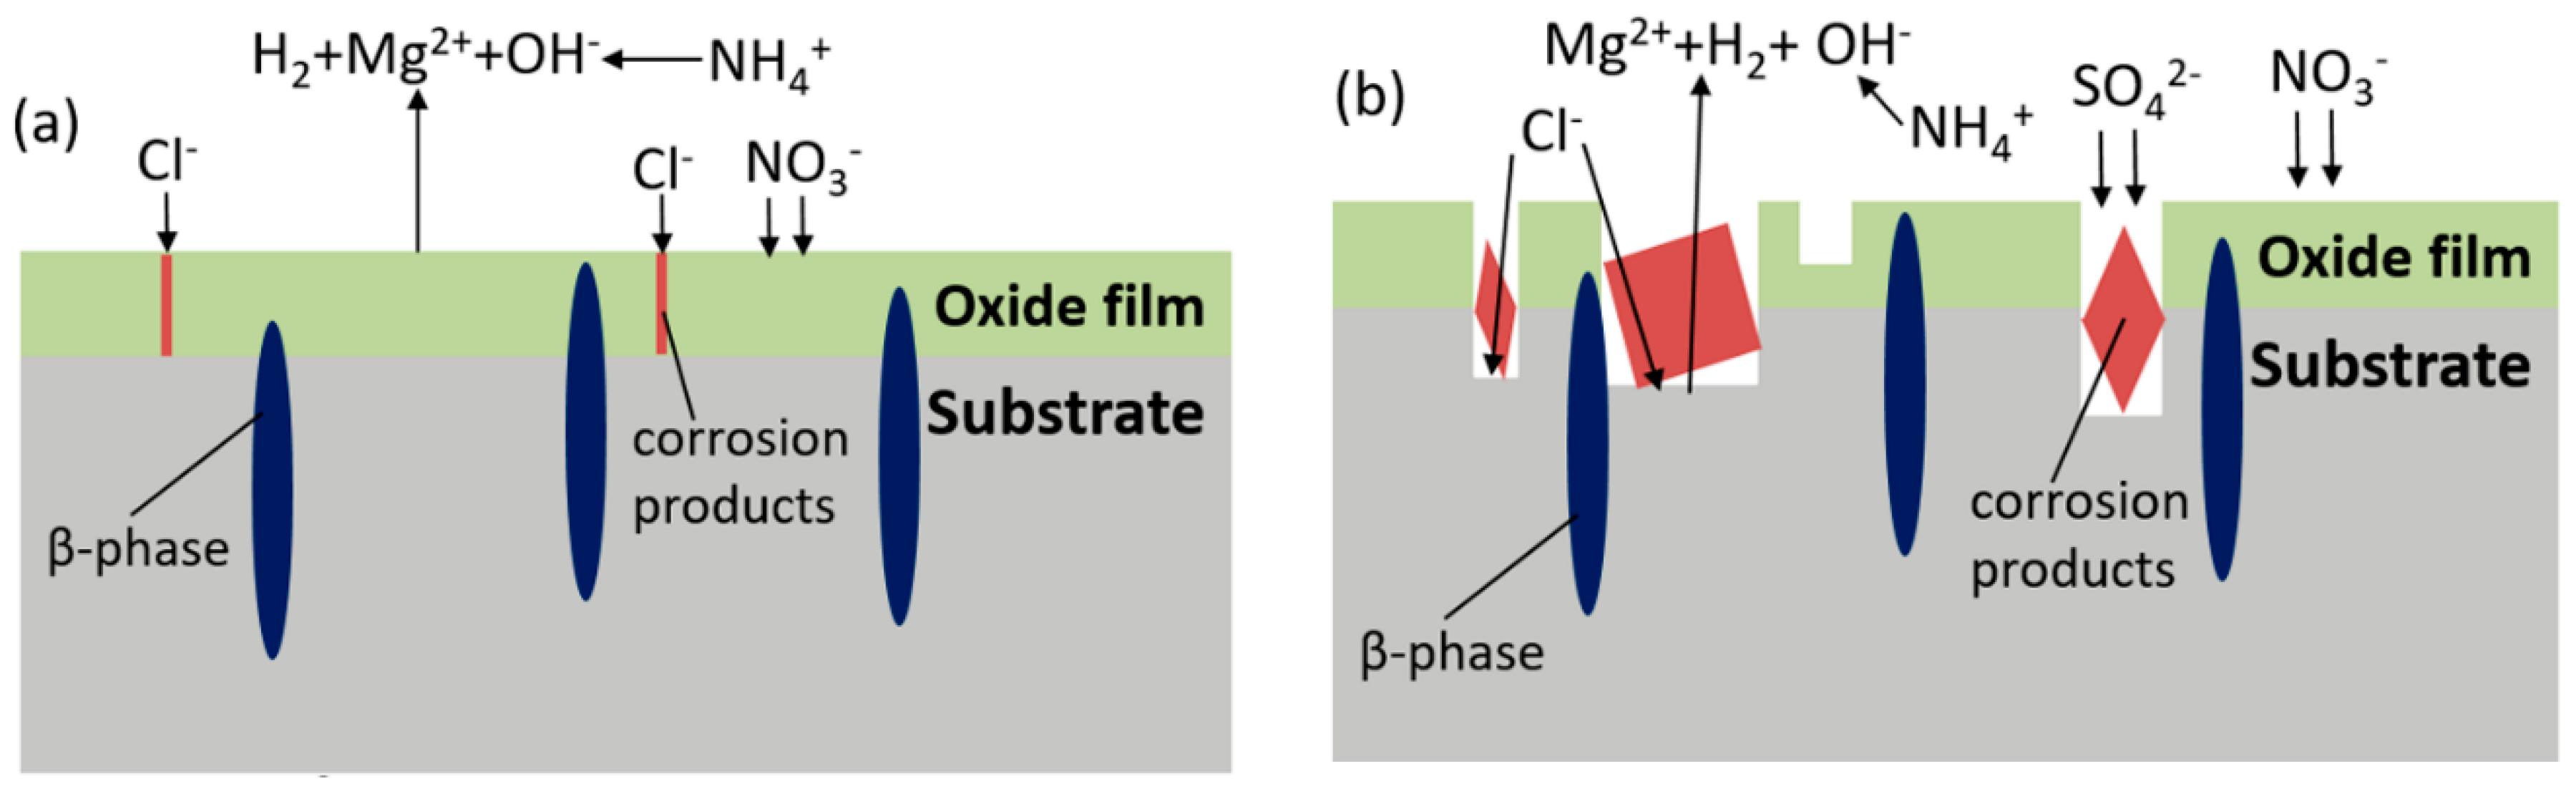
Taking into account both the corrosion process of AZ91D in the simulated HA solution and the influence of ions, a schematic diagram consisting of two stages is proposed (Figure 16) in order to explain the corrosion mechanism of AZ91D in simulated HA solution.
- First stage (shown in Figure 16a). According to Song [17], the anodic reaction becomes the following equations:The overall reaction:The cathodic reaction:Mg(OH)2 is supposed to be formed on the surface, but the process is thwarted by :Therefore, the product film is formed once the sample is exposed to the solution, and the main components refer to MgO instead of Mg(OH)2. The existence of helps to form a passive film on the surface, so the corrosion rate is soon limited. Cl− brings about the localized corrosion, therefore tiny corrosion pits appear where the sites are active.
- Second stage (shown in Figure 16b). As the corrosion develops, the resistant β-Mg17Al12 dissolves, thus aluminum concentration elevates and the precipitation of MgAl2(SO4)4·22H2O is formed according to Reaction (2), resulting in a higher corrosion rate. Corrosion continues to develop in pits, where bare α-matrix is firstly to be corroded and is consumed up by OH−, then β-phase reacts with OH−, generating Mg2Al(OH)7 and AlOOH. Cracks generally appear on the coverage and film drops out, even in a severe process, Mg particle surrounded by completely corroded material falls into solution, resulting in bare Mg exposed to the solution. Meanwhile, and Cl− keep attacking to form deeper pits.
5. Conclusions
The corrosion process and influence of ions of AZ91D samples in simulated HA solution were studied. The corrosion process was monitored by morphology observation, electrochemical experiment and hydrogen collection, and corrosion products were analyzed using EDX. The influence of four main ions in haze was examined by potentiodynamic polarization curves, SEM equipped with EDX, and the corrosion products were confirmed by XRD. The results can be summarized as follows:
- , , , Cl− are the four main water-soluble ions in simulated HA solution. and Cl− are aggressive towards AZ91D, causing and aggravating pitting corrosion. The absorption of prevents samples, especially α-matrix from severe corrosion by generating passive film on the surface. The combination of and OH− blocks the formation of Mg(OH)2, therefore corrosion process accelerates drastically.
- The corrosion attack of AZ91D immersed in simulated HA solution mainly takes place in α-phase matrix. Pitting corrosion is the main damage taking place on the surface. In addition, shallow pits resulting from Cl− are superimposed to form deep pits due to , and Mg particle undermining might take place. The main corrosion products are MgO, MgAl2O4 and MgAl2(SO4)4·22H2O.
- With the development of the corrosion, α-matrix and β-Mg17Al12 are dissolved, and localized corrosion aggravates, so the corrosion rate rises and finally stabilizes.
Author Contributions
L.C. and Z.L. conceived and designed the experiments; L.C. and P.H. performed the experiments; L.C. and J.S. analyzed the data; B.J. contributed materials; L.C. wrote the paper with the assistance of Z.L., C.D. and X.L.
Funding
This research was funded by the National Environmental Corrosion Platform, the National Basic Research Program of China (973 Program project, No. 2014CB643300), and the National Natural Science Foundation of China (No. 51471034).
Acknowledgments
Firstly, I would like to show my deepest gratitude to my supervisor, Liu, a respectable, responsible and resourceful scholar, who has provided me with valuable guidance in every stage of the writing of this thesis. Secondly, I shall extend my thanks to Peng Hu for his impressive kindness and patience. Finally, my sincere appreciation also goes to all the rest of authors in this study for their encouragement and technical support.
Conflicts of Interest
The authors declare no conflict of interest.
References
- Turan, M.E.; Sun, Y.; Akgul, Y. Mechanical, tribological and corrosion properties of fullerene reinforced magnesium matrix composites fabricated by semi powder metallurgy. J. Alloys Compd. 2018, 740, 1149–1158. [Google Scholar] [CrossRef]
- Heakal, F.E.T.; Fekry, A.M.; Fatayerji, M.Z. Influence of halides on the dissolution and passivation behavior of AZ91D magnesium alloy in aqueous solutions. Electrochim. Acta 2009, 54, 1545–1557. [Google Scholar] [CrossRef]
- Zhang, Y.F.; Blawert, C.; Tang, S.W. Influence of surface pre-treatment on the deposition and corrosion properties of hydrophobic coatings on a magnesium alloy. Corros. Sci. 2016, 112, 483–494. [Google Scholar] [CrossRef]
- Liu, B.; Zhang, X.; Xiao, G.Y.; Lu, Y.P. Phosphate chemical conversion coatings on metallic substrates for biomedical application: A review. Mater. Sci. Eng. C 2015, 47, 97–104. [Google Scholar] [CrossRef] [PubMed]
- Gao, Y.H.; Yerokhin, A.; Matthews, A. Deposition and evaluation of duplex hydroxyapatite and plasma electrolytic oxidation coatings on magnesium. Surf. Coat. Technol. 2015, 269, 170–182. [Google Scholar] [CrossRef]
- Mohedano, M.; Blawert, C.; Zheludkevich, M.L. Cerium-based sealing of PEO coated AM50 magnesium alloy. Surf. Coat. Technol. 2015, 269, 145–154. [Google Scholar] [CrossRef] [Green Version]
- Amaravathy, P.; Sowndarya, S.; Sathyanarayanan, S.; Rajendran, N. Novel sol gel coating of Nb2O5 on magnesium alloy for biomedical applications. Surf. Coat. Technol. 2014, 244, 131–141. [Google Scholar] [CrossRef]
- Nezamdoust, S.; Seifzadeh, D.; Rajabalizadeh, Z. PTMS/OH-MWCNT sol-gel nanocomposite for corrosion protection of magnesium alloy. Surf. Coat. Technol. 2018, 335, 228–240. [Google Scholar] [CrossRef]
- Baiocco, G.; Rubino, G.; Tagliaferri, V.; Ucciardello, N. Al2O3 coatings on magnesium alloy deposited by the Fluidized Bed (FB) technique. Materials 2018, 11, 94. [Google Scholar] [CrossRef] [PubMed]
- Huang, X.F.; Han, G.M.; Huang, W.G. T6 treatment and its effects on corrosion properties of an Mg–4Sn–4Zn–2Al Alloy. Materials 2018, 11, 628. [Google Scholar] [CrossRef] [PubMed]
- Pardo, A.; Merino, M.C.; Coy, A.E. Influence of microstructure and composition on the corrosion behavior of Mg/Al alloys in chloride media. Electrochim. Acta 2008, 53, 7890–7902. [Google Scholar] [CrossRef]
- Liu, L.; Yuan, F.L.; Zhao, M.C. Rare earth element yttrium modified Mg-Al-Zn alloy: microstructure, degradation properties and hardness. Materials 2017, 10, 477. [Google Scholar] [CrossRef] [PubMed]
- Anawati, A.; Asoh, H.; Ono, S. Effects of alloying element Ca on the corrosion behavior and bioactivity of anodic films formed on AM60 Mg alloys. Materials 2017, 10, 11. [Google Scholar] [CrossRef] [PubMed]
- Gao, H.; Li, Q.; Chen, F.N.; Dai, Y.; Luo, F.; Li, L.Q. Study of the corrosion inhibition effect of sodium silicate on AZ91D magnesium alloy. Corros. Sci. 2011, 53, 1401–1407. [Google Scholar] [CrossRef]
- Liao, J.S.; Hotta, M. Corrosion products of field-exposed Mg-Al series magnesium alloys. Corros. Sci. 2016, 112, 276–288. [Google Scholar] [CrossRef]
- Hara, N.; Kobayashi, Y.; Kagaya, D.; Akao, N. Formation and breakdown of surface films on magnesium and its alloys in aqueous solutions. Corros. Sci. 2007, 49, 166–175. [Google Scholar] [CrossRef]
- Song, G.L.; Atrens, A. Corrosion mechanisms of magnesium alloys. Adv. Eng. Mater. 1999, 1, 11–33. [Google Scholar] [CrossRef]
- Santamaria, M.; Quarto, F.D.; Zanna, S.; Marcus, P. Initial surface film on magnesium metal: A characterization by X-ray photoelectron spectroscopy (XPS) and photocurrent spectroscopy (PCS). Electrochim. Acta 2007, 53, 1314–1324. [Google Scholar] [CrossRef] [Green Version]
- Ghali, E.; Dietzel, W.; Kainer, K.U. General and localized corrosion of magnesium alloys: A critical review. J. Mater. Eng. Perform. 2004, 13, 7–23. [Google Scholar] [CrossRef]
- Curioni, M.; Scenini, F.; Monetta, T.; Bellucci, F. Correlation between electrochemical impedance measurements and corrosion rate of magnesium investigated by real-time hydrogen measurement and optical imaging. Electrochim. Acta 2015, 166, 372–384. [Google Scholar] [CrossRef] [Green Version]
- Chang, Q.; Yang, F.M.; Li, X.H. Characteristics of mass and chemical species size distributions of particulate matter during haze pollution in the winter in Beijing. Acta Sci. Circumst. 2015, 35, 363–370. [Google Scholar] [CrossRef]
- Fekry, A.M.; Fatayerji, M.Z. Electrochemical corrosion behavior of AZ91D alloy in ethylene glycol. Electrochim. Acta 2009, 54, 6522–6528. [Google Scholar] [CrossRef]
- Retter, U.; Widmann, A.; Siegler, K.; Kahlert, H. On the impedance of potassium nickel(II) hexacyanoferrate(II) composite electrodes—the generalization of the Randles model referring to inhomogeneous electrode materials. J. Electroanal. Chem. 2003, 546, 87–96. [Google Scholar] [CrossRef]
- Song, G.L. Corrosion of Magnesium Alloys; Woodhead Publishing: Cambridge, UK, 2011. [Google Scholar]
- Liu, Z.Y.; Li, X.G.; Du, C.W. Effect of inclusions on initiation of stress corrosion cracks in X70 pipeline steel in an acidic soil environment. Corros. Sci. 2009, 51, 895–900. [Google Scholar] [CrossRef]
- Liu, Z.Y.; Wang, X.Z.; Du, C.W. Effect of hydrogen-induced plasticity on the stress corrosion cracking of X70 pipeline steel in simulated soil environments. Mater. Sci. Eng. A 2016, 658, 348–354. [Google Scholar] [CrossRef] [Green Version]
- Ma, H.C.; Liu, Z.Y.; Du, C.W.; Li, X.G.; Cui, Z.Y. Comparative study of the SCC behavior of E690 steel and simulated HAZ microstructures in a SO2-polluted marine atmosphere. Mater. Sci. Eng. A 2016, 650, 93–101. [Google Scholar] [CrossRef]
- Shi, Z.M.; Jia, J.X.; Atrens, A. Galvanostatic anodic polarization curves and galvanic corrosion of high purity Mg in 3.5% NaCl saturated with Mg(OH)2. Corros. Sci. 2012, 60, 296–308. [Google Scholar] [CrossRef]
- Shi, Z.M.; Jia, J.X.; Atrens, A. Galvanostatic anodic polarisation and galvanic corrosion of AZ31B in 0.01 M Na2SO4 saturated with Mg(OH)2. Adv. Eng. Mater. 2012, 14, 324–334. [Google Scholar] [CrossRef]
- Chen, J.; Wang, J.Q.; Han, E.H. AC impedance spectroscopy study of the corrosion behavior of an AZ91 magnesium alloy in 0.1 M sodium sulfate solution. Electrochim. Acta 2007, 52, 3299–3309. [Google Scholar] [CrossRef]
- Song, G.L.; Atrens, A.; John, D.; Wu, X.; Nairn, J. The anodic dissolution of magnesium in chloride and sulphate solutions. Corros. Sci. 1997, 39, 1981–2004. [Google Scholar] [CrossRef]
- King, A.D.; Birbilis, N.; Scully, J.R. Accurate electrochemical measurement of magnesium corrosion rates; a combined impedance, mass-loss and hydrogen collection atudy. Electrochim. Acta 2014, 121, 394–460. [Google Scholar] [CrossRef]
- Song, G.L. Corrosion of Magnesium Alloys; Chemical Industry Press: Beijing, China, 2006. [Google Scholar]
- El-Naggar, M.M. Effects of Cl−, and anions on the anodic behavior of carbon steel in deaerated 0.50 M NaHCO3 solutions. Appl. Surf. Sci. 2006, 252, 6179–6194. [Google Scholar] [CrossRef]
- Song, G.L. Corrosion Prevention of Magnesium Alloys; Woodhead Publishing: Cambridge, UK, 2013. [Google Scholar]
- Shi, Z.M.; Liu, M.; Atrens, A. Measurement of the corrosion rate of magnesium alloys using Tafel extrapolation. Corros. Sci. 2010, 52, 579–588. [Google Scholar] [CrossRef]
- Yang, W.; Zhu, Z.J.; Wang, J.J. Slow positron beam study of corrosion behavior of AM60B magnesium alloy in NaCl solution. Corros. Sci. 2016, 106, 271–280. [Google Scholar] [CrossRef]
- Song, Y.W.; Shan, D.Y.; Chen, R.S.; Han, E.H. Corrosion characterization of Mg–8Li alloy in NaCl solution. Corros. Sci. 2009, 51, 1087–1094. [Google Scholar] [CrossRef]
Figure 1.
The microstructure of AZ91D.

Figure 2.
OCP dependence on immersion time of AZ91D in simulated HA solution.

Figure 3.
EIS dependence on immersion time of AZ91D in simulated HA solution: (a,c,e) Nyquist (b,d,f) Bode.
Figure 3.
EIS dependence on immersion time of AZ91D in simulated HA solution: (a,c,e) Nyquist (b,d,f) Bode.

Figure 4.
Equivalent circuits for AZ91D with different exposure time in simulated HA solution: (a) Model A, (b) Model B, (c) Model C.
Figure 4.
Equivalent circuits for AZ91D with different exposure time in simulated HA solution: (a) Model A, (b) Model B, (c) Model C.

Figure 5.
Fitting results of resistances and constant phase element during the immersion test: (a) charge transfer resistance Rt, (b) constant phase element CPEdl, (c) film resistance Rf.
Figure 5.
Fitting results of resistances and constant phase element during the immersion test: (a) charge transfer resistance Rt, (b) constant phase element CPEdl, (c) film resistance Rf.

Figure 6.
Volume of hydrogen evolution of AZ91D in simulated HA solution.

Figure 7.
SEM (a,c,e,g) images and EDX results of samples immersed in solution for 1.5 h (a,b), 3 h (c,d), 8 h (e,f) and 48 h (g,h).
Figure 7.
SEM (a,c,e,g) images and EDX results of samples immersed in solution for 1.5 h (a,b), 3 h (c,d), 8 h (e,f) and 48 h (g,h).
Figure 8.
The cross-section of sample immersed in HA solution for 48 h (a) and the corresponding linear EDX spectra (b).
Figure 8.
The cross-section of sample immersed in HA solution for 48 h (a) and the corresponding linear EDX spectra (b).
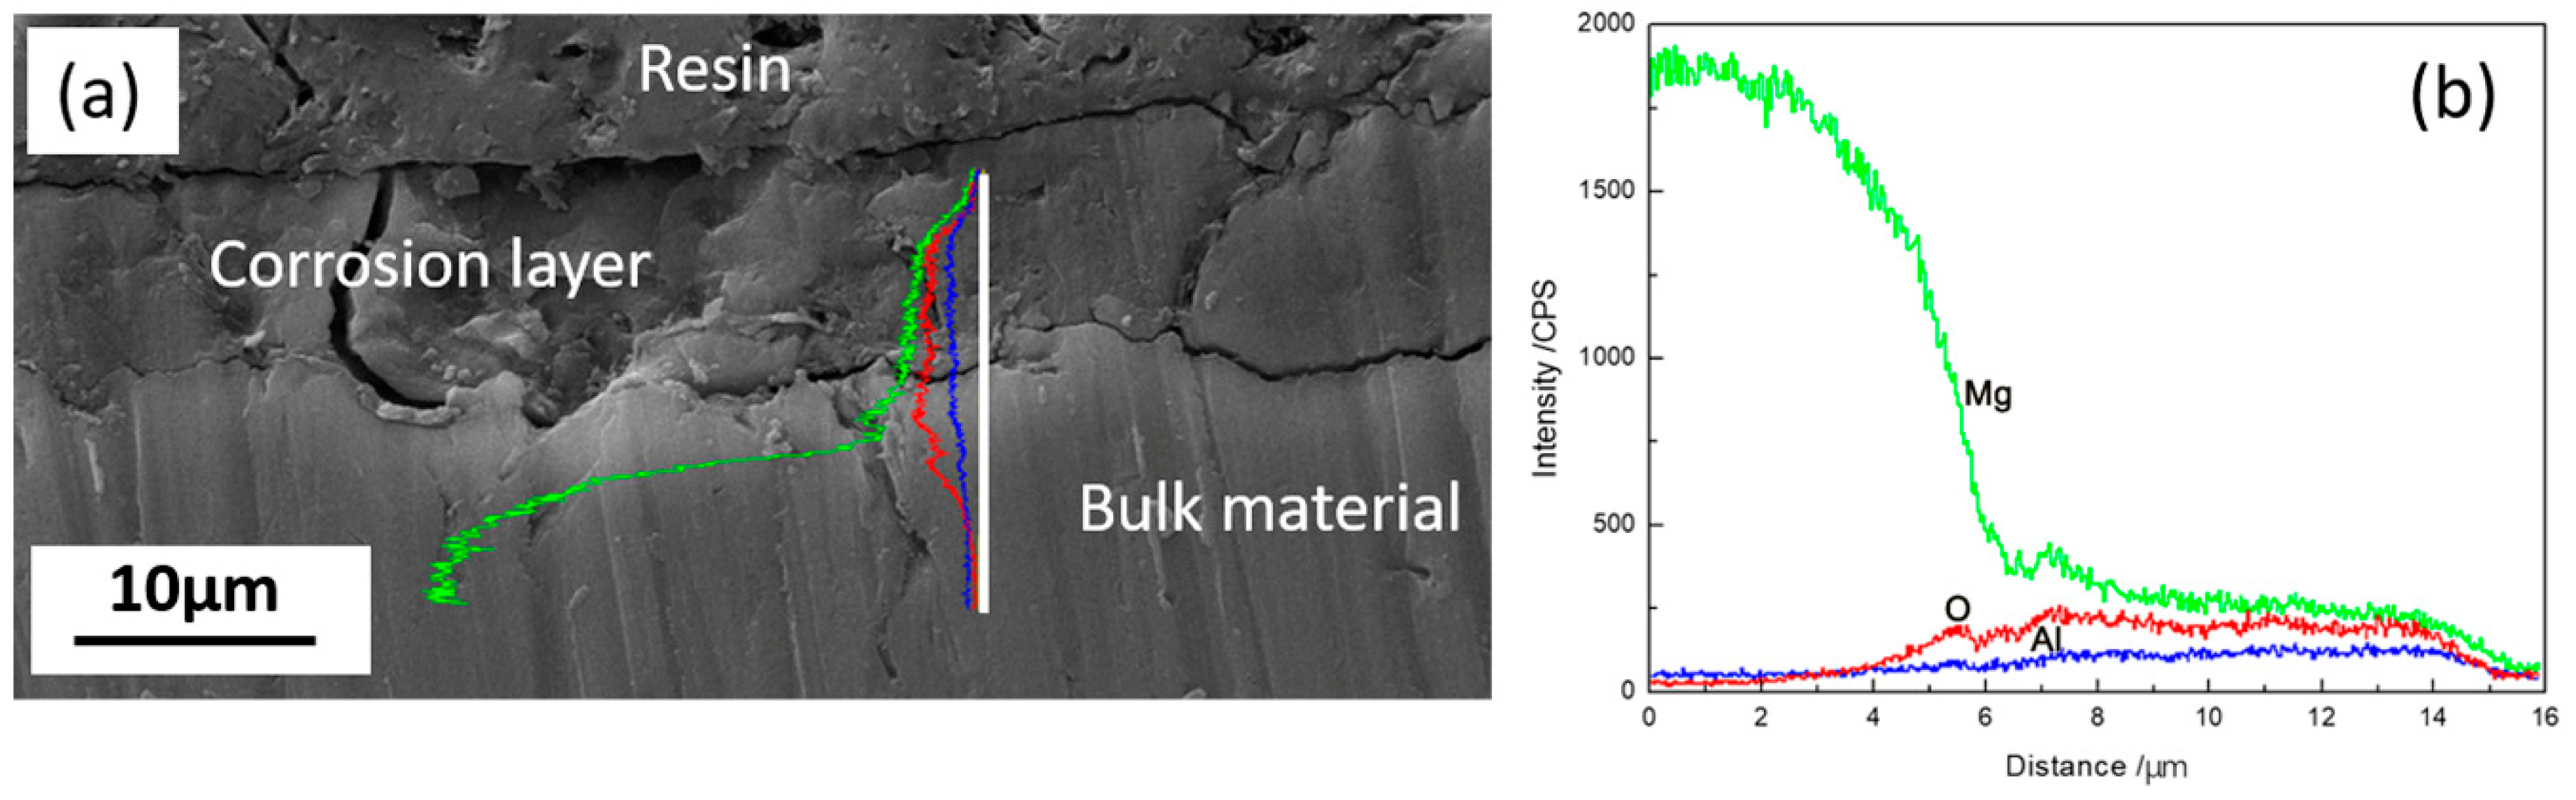
Figure 9.
SEM (a,c,e,g) and CLSM (b,d,f,h) images of samples immersed in solution for 1.5 h (a,b), 3 h (c,d), 8 h (e,f) and 48 h (g,h) after rust removal.
Figure 9.
SEM (a,c,e,g) and CLSM (b,d,f,h) images of samples immersed in solution for 1.5 h (a,b), 3 h (c,d), 8 h (e,f) and 48 h (g,h) after rust removal.
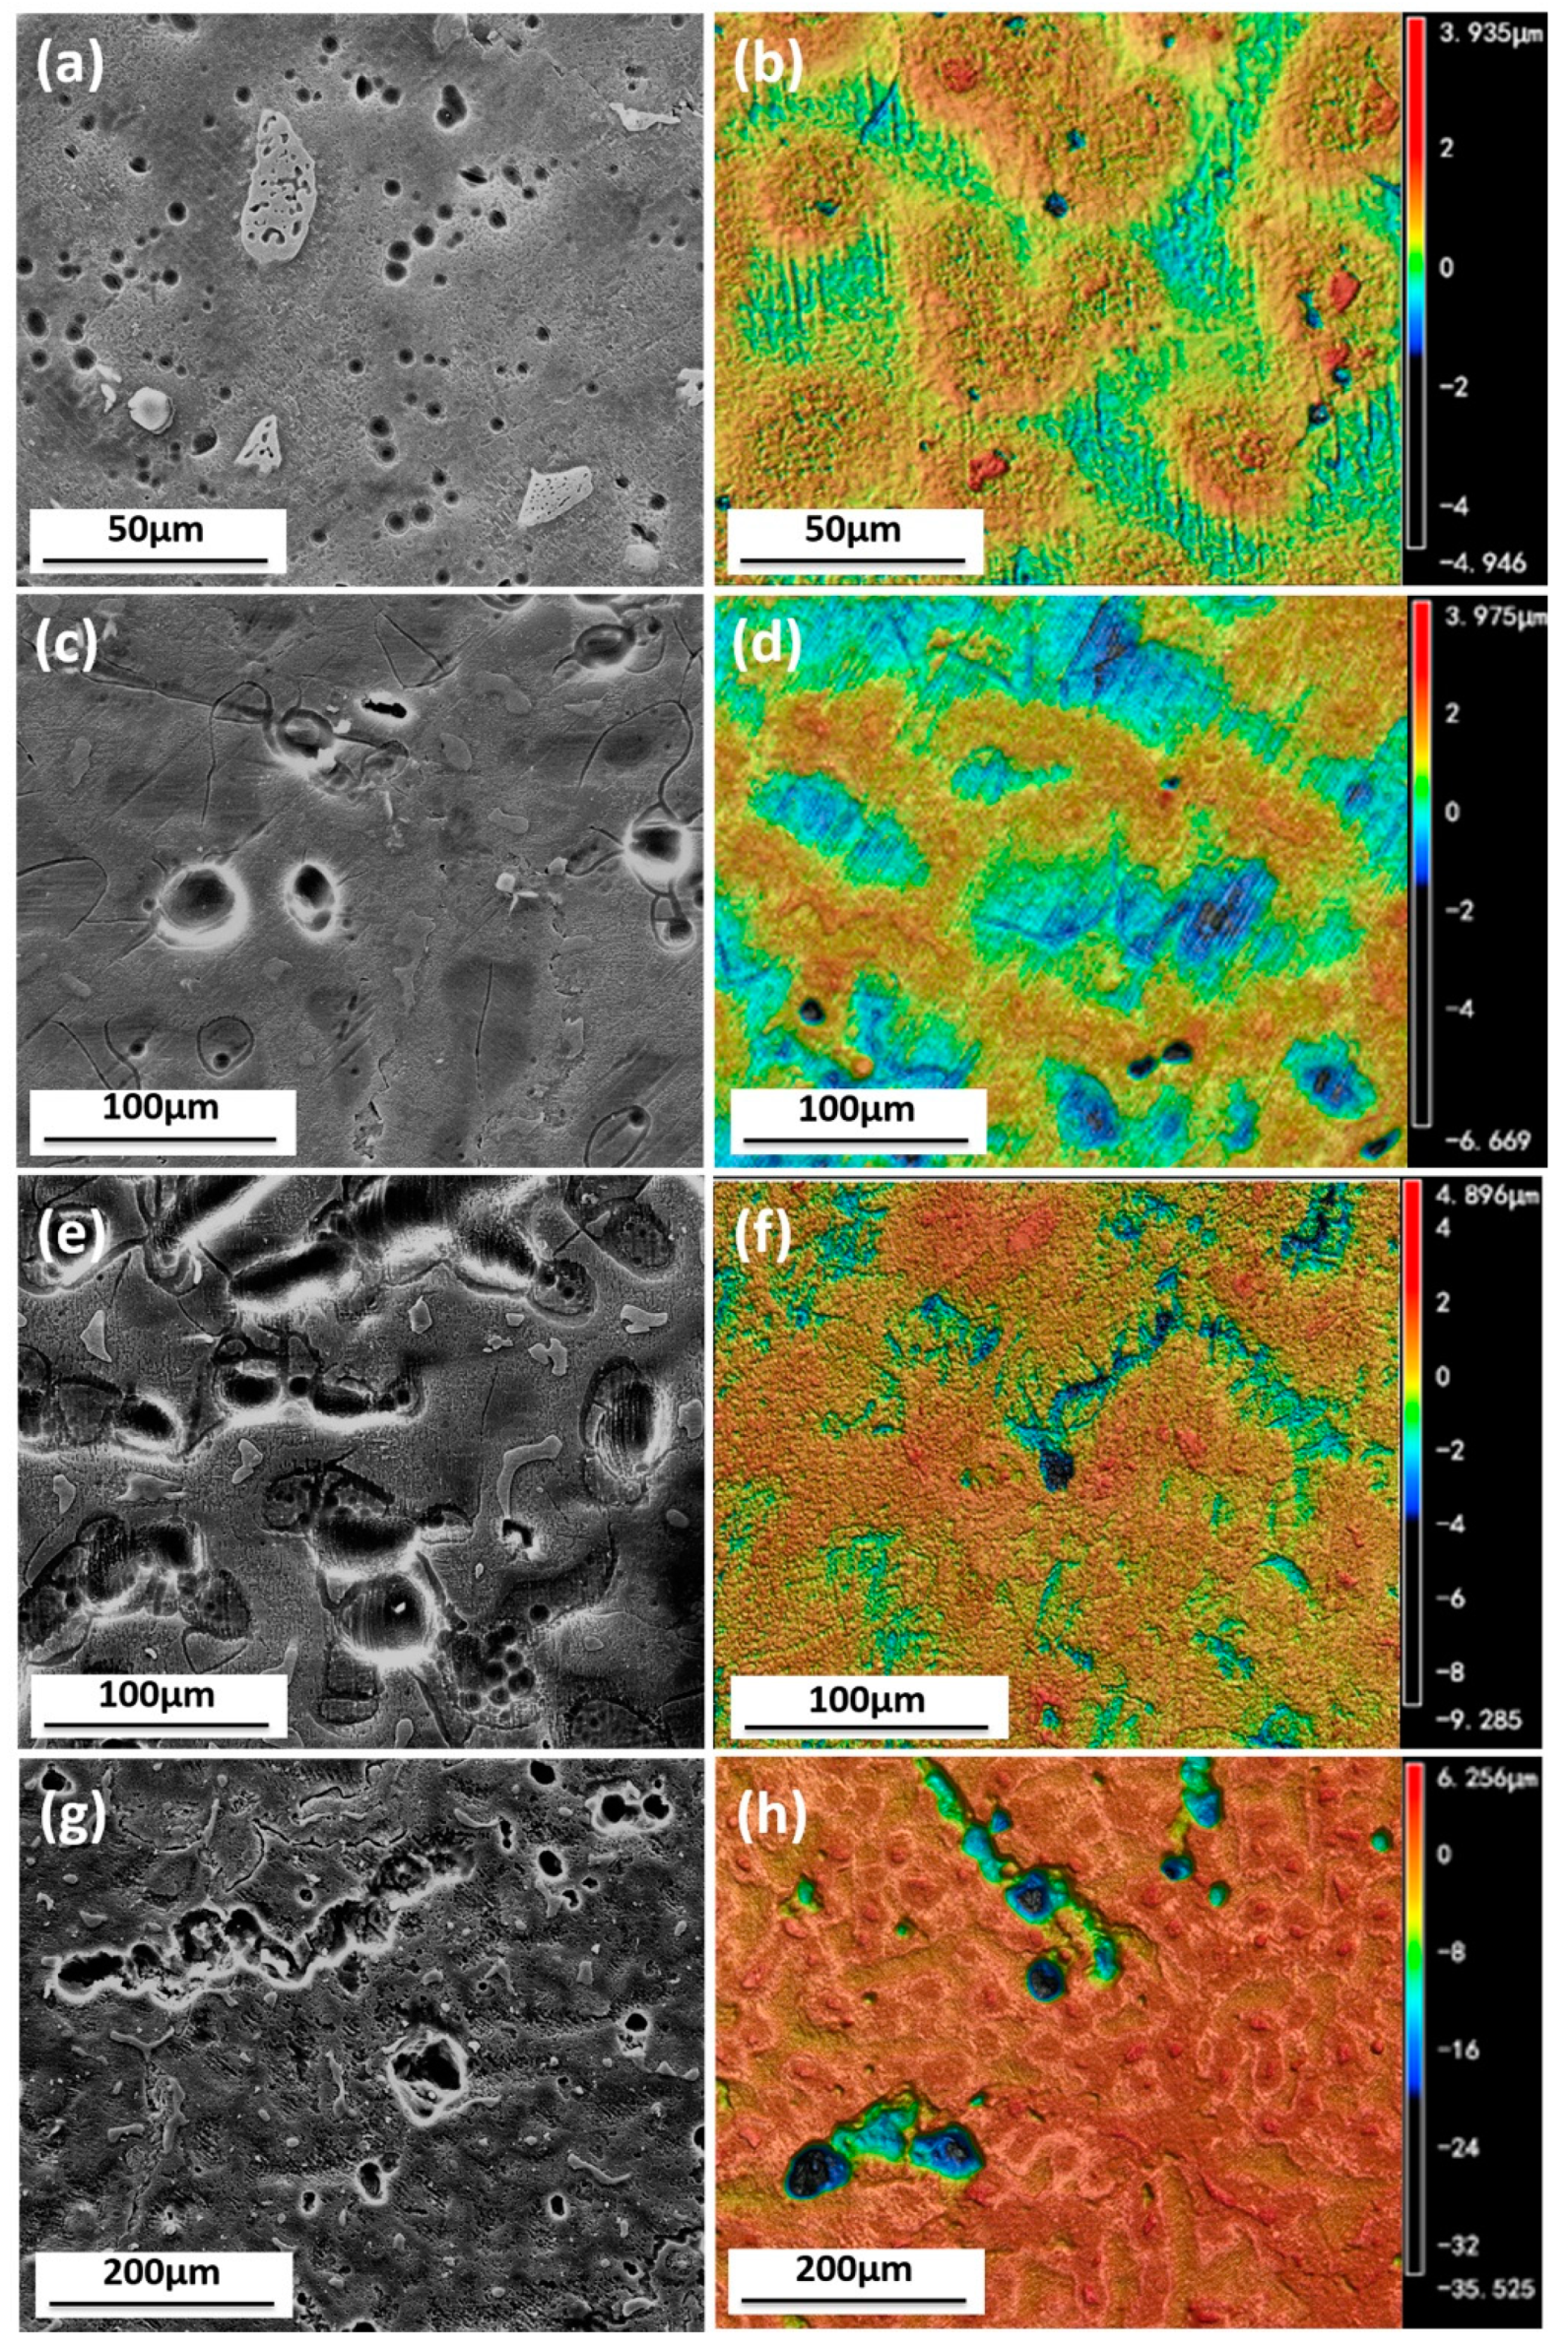
Figure 10.
SEM images and corresponding X-ray maps of Mg, Al and O for AZ91D after immersed in simulated HA solution (a), and solutions at the shortage of (b), (c), (d), Cl− (e) for 11 days.
Figure 10.
SEM images and corresponding X-ray maps of Mg, Al and O for AZ91D after immersed in simulated HA solution (a), and solutions at the shortage of (b), (c), (d), Cl− (e) for 11 days.

Figure 11.
SEM images of AZ91D immersed in simulated HA solution (a), and solutions at the shortage of (b), (c), (d), Cl− (e) for 11 days after rust removal.
Figure 11.
SEM images of AZ91D immersed in simulated HA solution (a), and solutions at the shortage of (b), (c), (d), Cl− (e) for 11 days after rust removal.

Figure 12.
EIS dependence on (a), (b), (c), Cl− (d) concentration of AZ91D.

Figure 13.
Polarization curves of AZ91D in solutions of different (a) and (b) concentration.

Figure 15.
XRD patterns for the product of AZ91D after immersed in simulated HA solution (1), and at the shortage of (2), (3), (4), Cl− (5) for 11 days.
Figure 15.
XRD patterns for the product of AZ91D after immersed in simulated HA solution (1), and at the shortage of (2), (3), (4), Cl− (5) for 11 days.
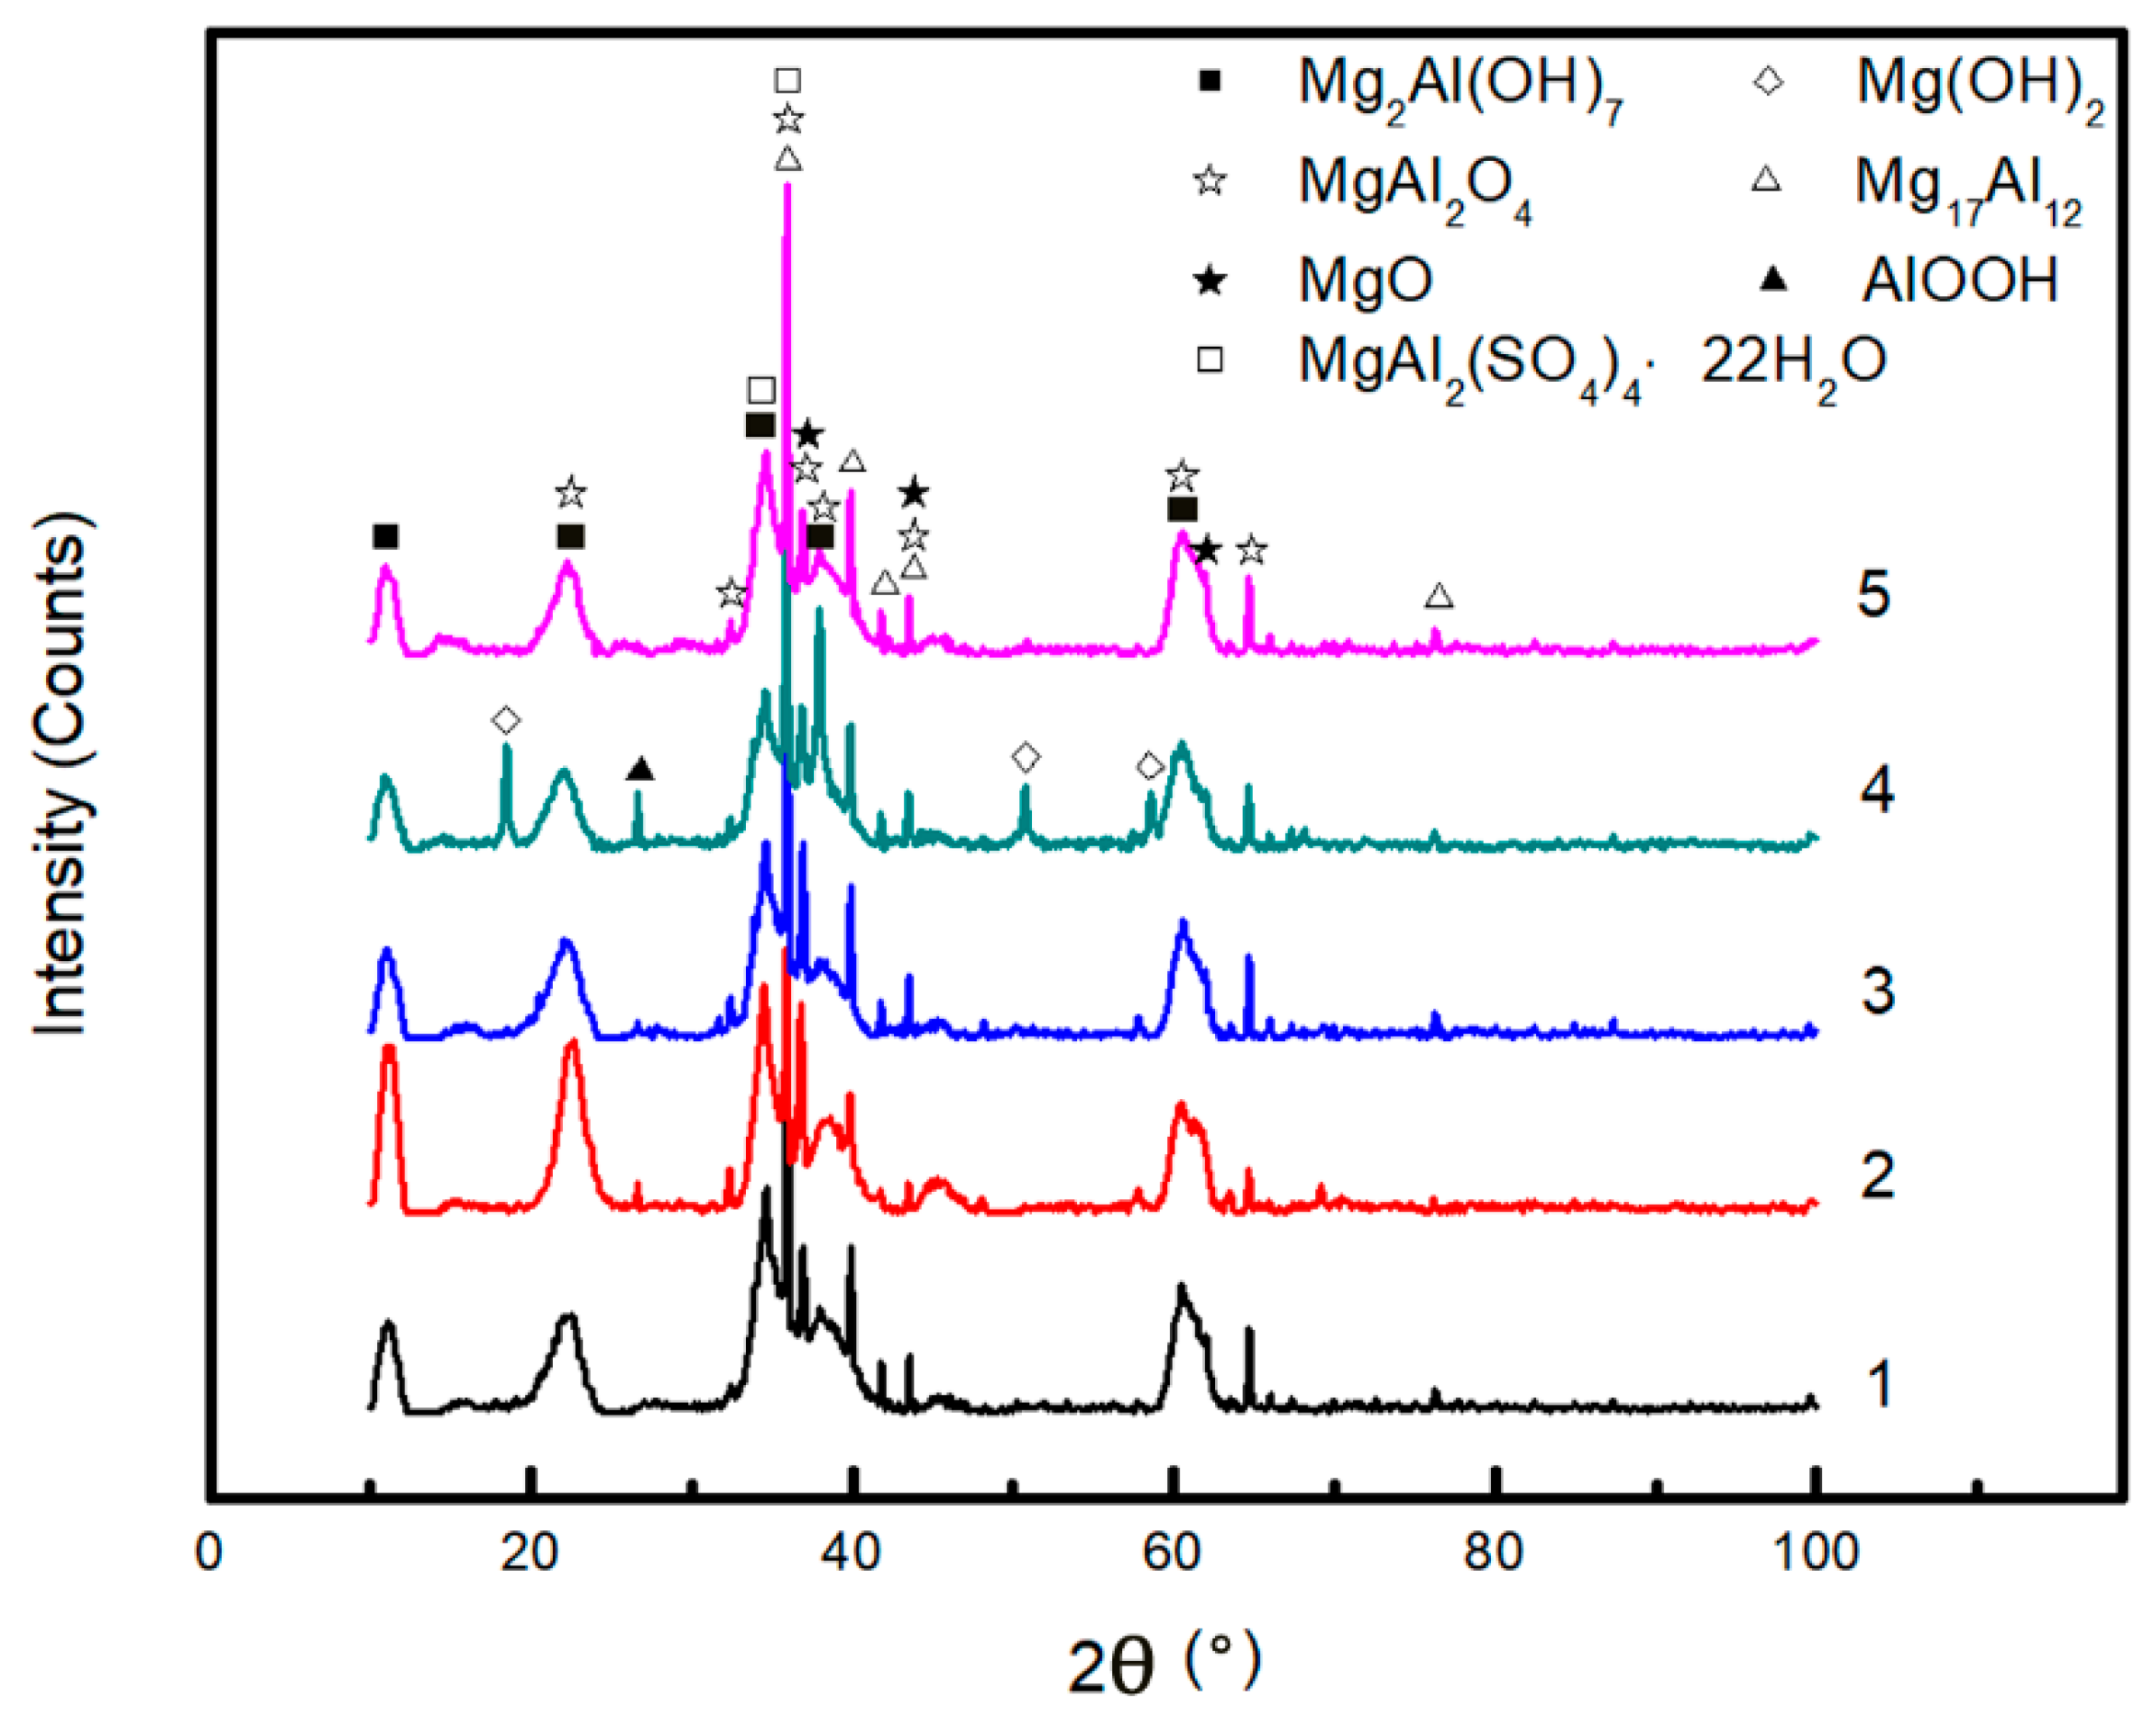
Figure 16.
Corrosion process diagram of AZ91D consisting of a first stage (a) and a second stage (b) immersed in HA solution.
Figure 16.
Corrosion process diagram of AZ91D consisting of a first stage (a) and a second stage (b) immersed in HA solution.


Table 1.
Chemical composition of AZ91D (in wt.%).
| Al | Zn | Mn | Si | Ni | Fe | Cu | Mg |
|---|---|---|---|---|---|---|---|
| 8.56 | 0.54 | 0.22 | 0.054 | <0.005 | <0.005 | <0.005 | Bal. |
Table 2.
The element composition of regions 1 and 2 in Figure 1 (in wt.%).
Table 2.
The element composition of regions 1 and 2 in Figure 1 (in wt.%).
| Region | Mg | Al | Zn |
|---|---|---|---|
| 1 | 97.72 | 1.56 | – |
| 2 | 70.21 | 27.25 | 1.86 |
Table 3.
Tafel extrapolation evaluated Ecorr, icorr and rc values of AZ91D at solutions of different and concentration.
Table 3.
Tafel extrapolation evaluated Ecorr, icorr and rc values of AZ91D at solutions of different and concentration.
| Concentration (mol/L) | ||||||
|---|---|---|---|---|---|---|
| Ecorr (V vs. SCE) | icorr (μA/cm2) | rc (mm/a) | Ecorr (V vs. SCE) | icorr (μA/cm2) | rc (mm/a) | |
| 0 | −1.566 | 8.68 | 0.1983 | −1.665 | 246.7 | 5.637 |
| 0.001 | −1.583 | 37.63 | 0.8598 | −1.670 | 224.0 | 5.118 |
| 0.005 | −1.642 | 301.2 | 6.882 | −1.670 | 265.2 | 6.060 |
| 0.01 | −1.641 | 296.2 | 6.768 | −1.653 | 172.7 | 3.946 |
| 0.015 | −1.596 | 87.52 | 2.000 | −1.645 | 203.0 | 4.639 |
| 0.02 | −1.453 | 25.07 | 0.5729 | −1.648 | 239.7 | 5.477 |
| 0.03 | −1.395 | 134.5 | 3.073 | −1.657 | 268.5 | 6.135 |
| 0.04 | −1.409 | 242.3 | 5.537 | −1.652 | 244.1 | 5.578 |
| 0.05 | −1.415 | 417.6 | 9.542 | −1.648 | 280.2 | 6.403 |
© 2018 by the authors. Licensee MDPI, Basel, Switzerland. This article is an open access article distributed under the terms and conditions of the Creative Commons Attribution (CC BY) license (http://creativecommons.org/licenses/by/4.0/).
Share and Cite
MDPI and ACS Style
Cui, L.; Liu, Z.; Hu, P.; Shao, J.; Li, X.; Du, C.; Jiang, B. The Corrosion Behavior of AZ91D Magnesium Alloy in Simulated Haze Aqueous Solution. Materials 2018, 11, 970. https://doi.org/10.3390/ma11060970
AMA Style
Cui L, Liu Z, Hu P, Shao J, Li X, Du C, Jiang B. The Corrosion Behavior of AZ91D Magnesium Alloy in Simulated Haze Aqueous Solution. Materials. 2018; 11(6):970. https://doi.org/10.3390/ma11060970
Chicago/Turabian StyleCui, Liying, Zhiyong Liu, Peng Hu, Jiamin Shao, Xiaogang Li, Cuiwei Du, and Bin Jiang. 2018. "The Corrosion Behavior of AZ91D Magnesium Alloy in Simulated Haze Aqueous Solution" Materials 11, no. 6: 970. https://doi.org/10.3390/ma11060970
Note that from the first issue of 2016, this journal uses article numbers instead of page numbers. See further details here.