Study of Fluorinated Quantum Dots-Protein Interactions at the Oil/Water Interface by Interfacial Surface Tension Changes


Abstract
:1. Introduction
2. Materials and Methods
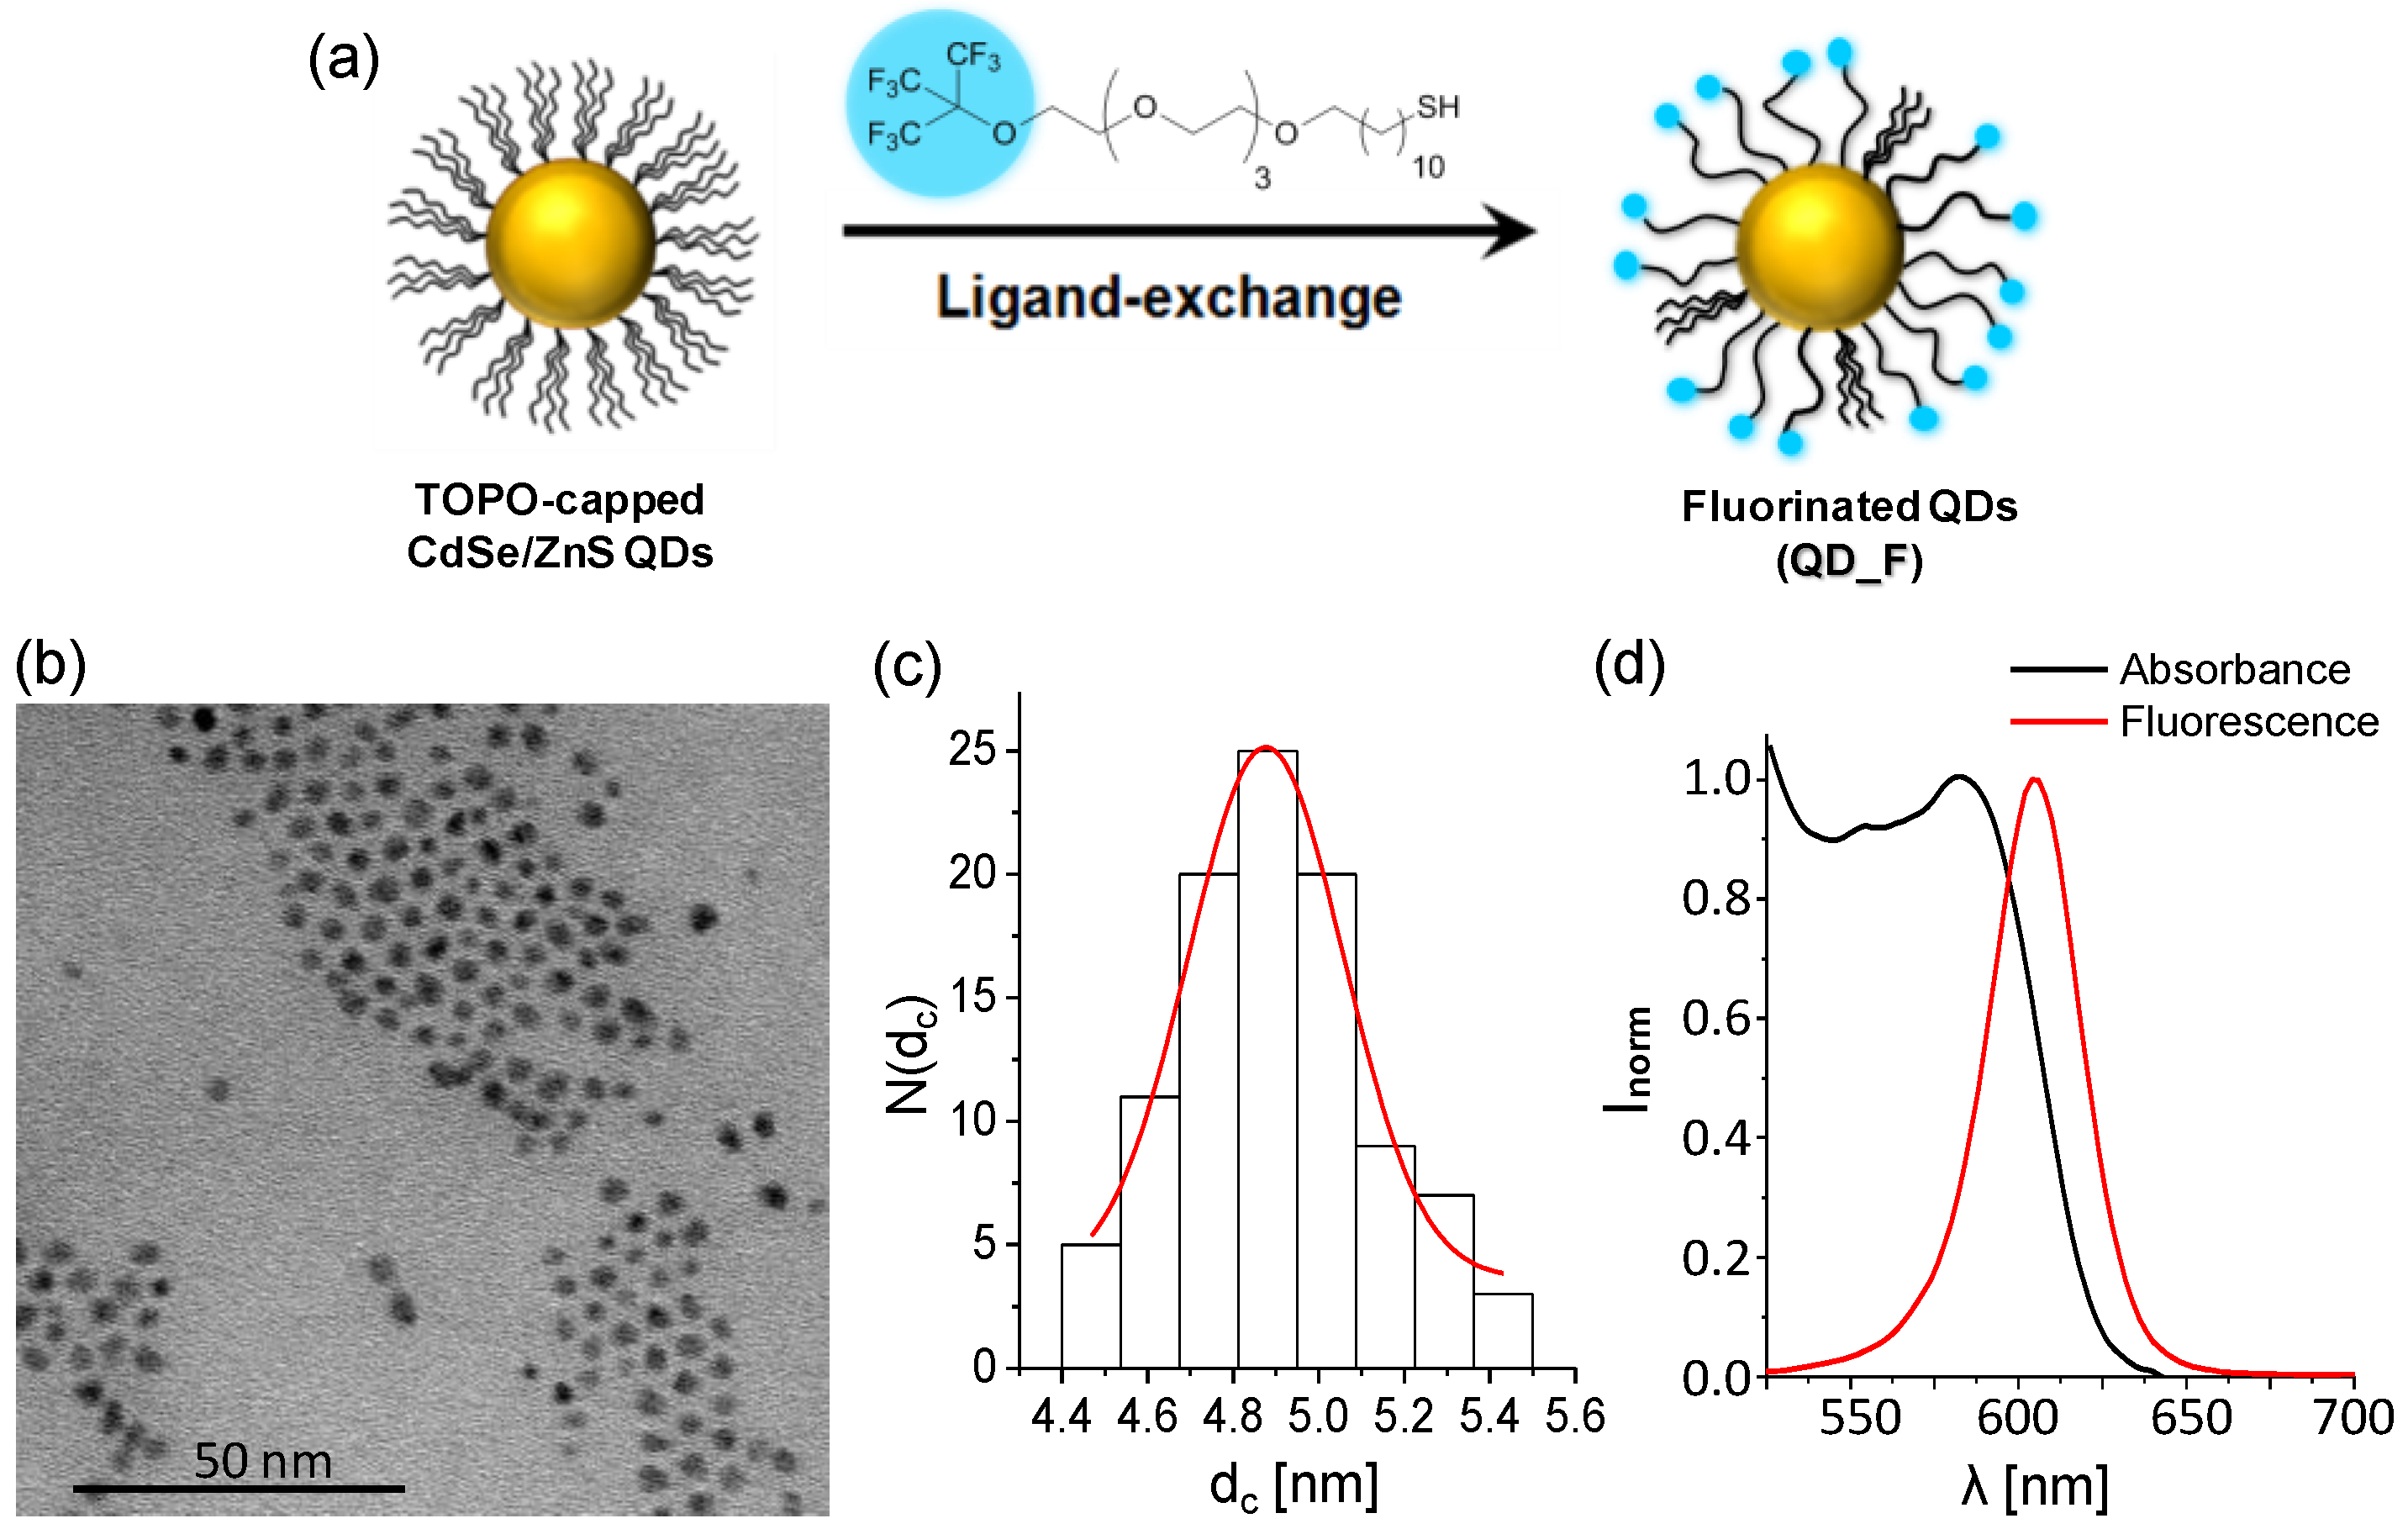
2.1. Synthesis of Fluorinated Quantum Dots
2.2. Characterization of Fluorinated Quantum Dots
2.3. Interfacial Tension Measurements
3. Results and Discussion
Supplementary Materials
Author Contributions
Funding
Acknowledgments
Conflicts of Interest
References
- Lundqvist, M.; Stigler, J.; Elia, G.; Lynch, I.; Cedervall, T.; Dawson, K.A. Nanoparticle Size and Surface Properties Determine the Protein Corona with Possible Implications for Biological Impacts. Proc. Natl. Acad. Sci. USA 2008, 105, 14265–14270. [Google Scholar] [CrossRef] [PubMed]
- Lynch, I.; Dawson, K.A. Protein–Nanoparticle Interactions. Nano Today 2008, 3, 40–47. [Google Scholar] [CrossRef]
- Monopoli, M.P.; Walczyk, D.; Campbell, A.; Elia, G.; Lynch, I.; BaldelliBombelli, F.; Dawson, K.A. Physical-chemical aspects of protein corona: Relevance to in vitro and in vivo biological impacts of nanoparticles. J. Am. Chem. Soc. 2011, 133, 2525–2534. [Google Scholar] [CrossRef] [PubMed]
- Del_Pino, P.; Pelaz, B.; Zhang, Q.; Maffre, P.; Nienhaus, G.U.; Parak, W.J. Protein corona formation around nanoparticles-from the past to the future. Mater. Horiz. 2014, 1, 301–313. [Google Scholar]
- Ge, C.; Tian, J.; Zhao, Y.; Chen, C.; Zhou, R.; Chai, Z. Towards understanding of nanoparticle-protein corona. Arch. Toxicol. 2015, 89, 519–539. [Google Scholar] [CrossRef] [PubMed]
- Tenzer, S.; Docter, D.; Kuharev, J.; Musyanovych, A.; Fetz, V.; Hecht, R.; Schlenk, F.; Fischer, D.; Kiouptsi, K.; Reinhardt, C.; et al. Rapid formation of plasma protein corona critically affects nanoparticle pathophysiology. Nat. Nanotechnol. 2013, 8, 772–781. [Google Scholar] [CrossRef] [PubMed]
- Docter, D.; Strieth, S.; Westmei, D.; Hayden, O.; Gao, M.Y.; Knauer, S.K.; Stauber, R.H. No king without a crown—Impact of the nanomaterial-protein corona on nanobiomedicine. Nanomedicine 2015, 10, 503–519. [Google Scholar] [CrossRef] [PubMed]
- Ashraf, S.; Park, J.; Bichelberger, M.A.; Kantner, K.; Hartmann, R.; Maffre, P.; Said, A.H.; Feliu, N.; Lee, J.; Lee, D.; et al. Zwitterionic surface coating of quantum dots reduces protein adsorption and cellular uptake. Nanoscale 2016, 8, 17794–17800. [Google Scholar] [CrossRef] [PubMed]
- Carrillo-Carrion, C.; Carril, M.; Parak, W. Techniques for the experimental investigation of the protein corona. Curr. Opin. Biotechnol. 2017, 46, 106–113. [Google Scholar] [CrossRef] [PubMed]
- Thakur, G.; Micic, M.; Leblanc, R.M. Surface Chemistry and Spectroscopy of Amyloid β (1-42) Mixed with and Conjugated to Quantum Dots Langmuir Monolayer. J. Phys. Chem. C 2010, 114, 15084–15093. [Google Scholar] [CrossRef]
- Goto, T.E.; Lopes, C.C.; Nader, H.B.; Silva, A.C.; Dantas, N.O.; Siqueira, J.R., Jr.; Caseli, L. CdSe magic-sized quantum dots incorporated in biomembrane models at the air–water interface composed of components of tumorigenic and non-tumorigenic cells. Biochim. Biophys. Acta 2016, 1858, 1533–1540. [Google Scholar] [CrossRef] [PubMed]
- Crawford, N.F.; Leblanc, R.M. CdSe and CdSe (ZnS) quantum dots in 2D: A Langmuir monolayer approach. Coord. Chem. Rev. 2014, 263, 13–24. [Google Scholar] [CrossRef]
- Pollock, J.; Borkin, D.; Lund, G.; Purohit, T.; Dyguda-Kazimierowicz, E.; Grembecka, J.; Cierpicki, T. Rational Design of Orthogonal Multipolar Interactions with Fluorine in Protein-Ligand Complexes. J. Med. Chem. 2015, 58, 7465–7474. [Google Scholar] [CrossRef] [PubMed]
- Wang, Z.; Zuilhof, H. Self-Healing Superhydrophobic Fluoropolymer Brushes as Highly Protein-Repellent Coatings. Langmuir 2016, 32, 6310–6318. [Google Scholar] [CrossRef] [PubMed]
- Carril, M.; Padro, D.; Del Pino, P.; Carrillo-Carrion, C.; Gallego, M.; Parak, W.J. In situ detection of the protein corona in complex environments. Nat. Commun. 2017, 8, 1542. [Google Scholar] [CrossRef] [PubMed]
- Carrillo-Carrión, C.; Atabakhshi-Kashi, M.; Carril, M.; Khajeh, K.; Parak, W.J. Taking advantage of hydrophobic fluorine interactions for self-assembled nanoclusters of quantum dots as delivery platform for enzymes. Angew. Chem. Int. Ed. Engl. 2018, 57, 5033–5036. [Google Scholar] [CrossRef]
- Beverung, C.J.; Radke, C.J.; Blanch, H.W. Protein adsorption at the oil water interface: Characterization of adsorption kinetics by dynamic interfacial tension measurements. Biophys. Chem. 1999, 81, 59–80. [Google Scholar] [CrossRef]
- Boury, F.; Ivanova, T.; Panaieotov, I.; Proust, J.E.; Bois, A.; Richou, J. Dilatational Properties of Adsorbed Poly(d,l-lactide) and Bovine Serum Albumin Monolayers at the Dichloromethane/Water Interface. Langmuir 1995, 11, 1636–1644. [Google Scholar] [CrossRef]
- Juárez, J.; Galaz, J.G.; Machi, L.; Burboa, M.; Gutiérrez-Millán, L.E.; Goycoolea, F.M.; Valdez, M.A. Interfacial behavior of N-nitrosodiethylamine/bovine serum albumin complexes at the air-water and the chloroform-water interfaces by axisymmetric drop tensiometry. J. Phys. Chem. B 2007, 111, 2727–2735. [Google Scholar] [CrossRef] [PubMed]
- Rana, S.; Yu, X.; Patra, D.; Moyano, D.F.; Miranda, O.R.; Hussain, I.; Rotello, V.M. Control of surface tension at liquid-liquid interfaces using nanoparticles and nanoparticle-protein complexes. Langmuir 2012, 28, 2023–2027. [Google Scholar] [CrossRef] [PubMed]
- Hühn, J.; Carrillo-Carrion, C.; Soliman, M.G.; Pfeiffer, C.; Valdeperez, D.; Masood, A.; Chakraborty, I.; Zhu, L.; Gallego, M.; Zhao, Y.; et al. Selected Standard Protocols for the Synthesis, Phase Transfer and Characterization of Inorganic Colloidal Nanoparticles. Chem. Mater. 2017, 29, 399–461. [Google Scholar] [CrossRef]
- Michelena, O.; Padro, D.; Carrillo-Carrión, C.; Del Pino, P.; Blanco, J.; Arnaiz, B.; Parak, W.J.; Carril, M. Novel fluorinated ligands for gold nanoparticle labelling with applications in 19 F-MRI. Chem. Commun. 2017, 53, 2447–2450. [Google Scholar] [CrossRef] [PubMed]
- Del Pino, P.; Yang, F.; Pelaz, B.; Zhang, Q.; Kantner, K.; Hartmann, R.; Martinez De Baroja, N.; Gallego, M.; Möller, M.; Manshian, B.B.; et al. Basic physicochemical properties of polyethylene glycol coated gold nanoparticles that determine their interaction with cells. Angew. Chem. Int. Ed. 2016, 55, 5483–5487. [Google Scholar] [CrossRef] [PubMed]
- Hua, X.Y.; Rosen, M.J. Dynamic surface tension of aqueous surfactant solutions: I. Basic paremeters. J. Colloid Interface Sci. 1988, 124, 652–659. [Google Scholar] [CrossRef]
- Young, B.R.; Pitt, W.G.; Cooper, S.L. Protein adsorption on polymeric biomaterials I. Adsorption isotherms. J. Colloid Interface Sci. 1988, 124, 28–43. [Google Scholar] [CrossRef]


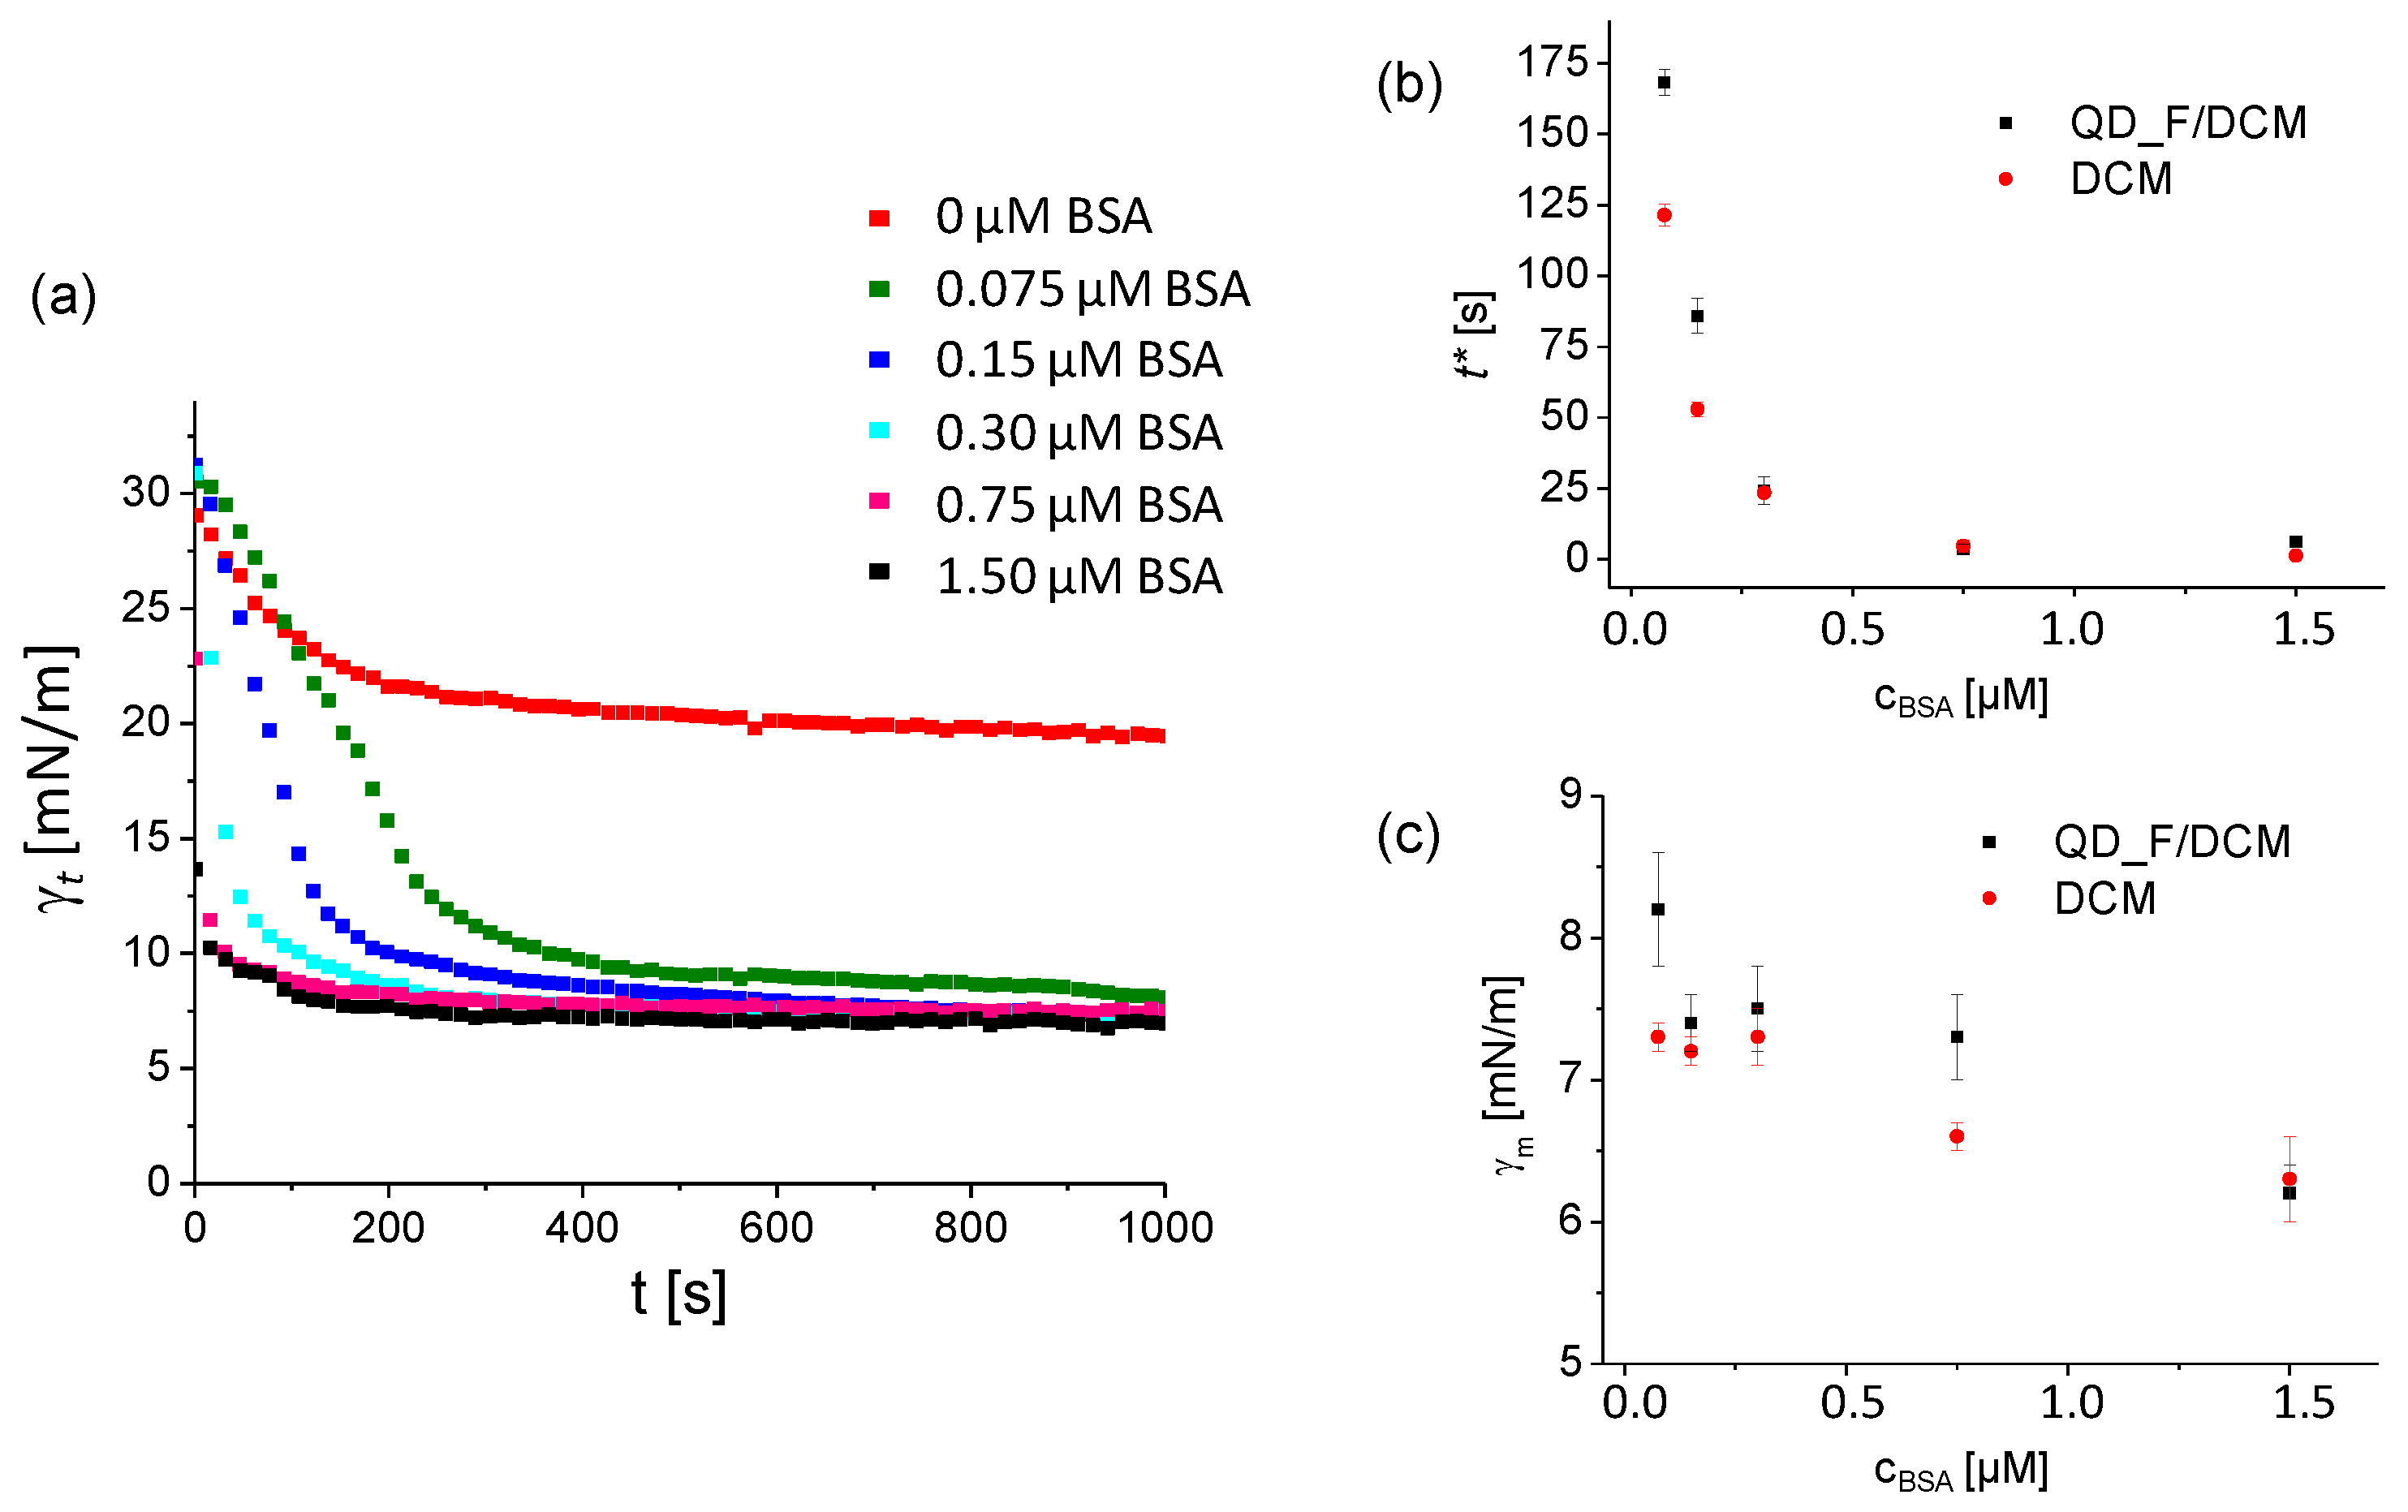
| cBSA (μM) | Oil Phase | γm (mN/m) | t* (s) | cBSA (μM) | Oil Phase | γm (mN/m) | t* (s) |
| 0.075 | DCM | 7.4 ± 0.1 | 121.4 ± 3.9 | 0.075 | QD_F | 8.2 ± 0.4 | 168.2 ± 4.5 |
| 0.15 | DCM | 7.2 ± 0.1 | 52.9 ± 2.5 | 0.15 | QD_F | 7.4 ± 0.2 | 85.9 ± 6.2 |
| 0.3 | DCM | 7.3 ± 0.2 | 23.4 ± 0.7 | 0.3 | QD_F | 7.5 ± 0.3 | 24.2 ± 4.8 |
| 0.75 | DCM | 6.6 ± 0.1 | 4.7 ± 2.1 | 0.75 | QD_F | 7.3 ± 0.3 | 3.8 ± 1.5 |
| 1.5 | DCM | 6.3 ± 0.3 | 1.3 ± 0.2 | 1.5 | QD_F | 6.2 ± 0.2 | 0.7 ± 0.2 |
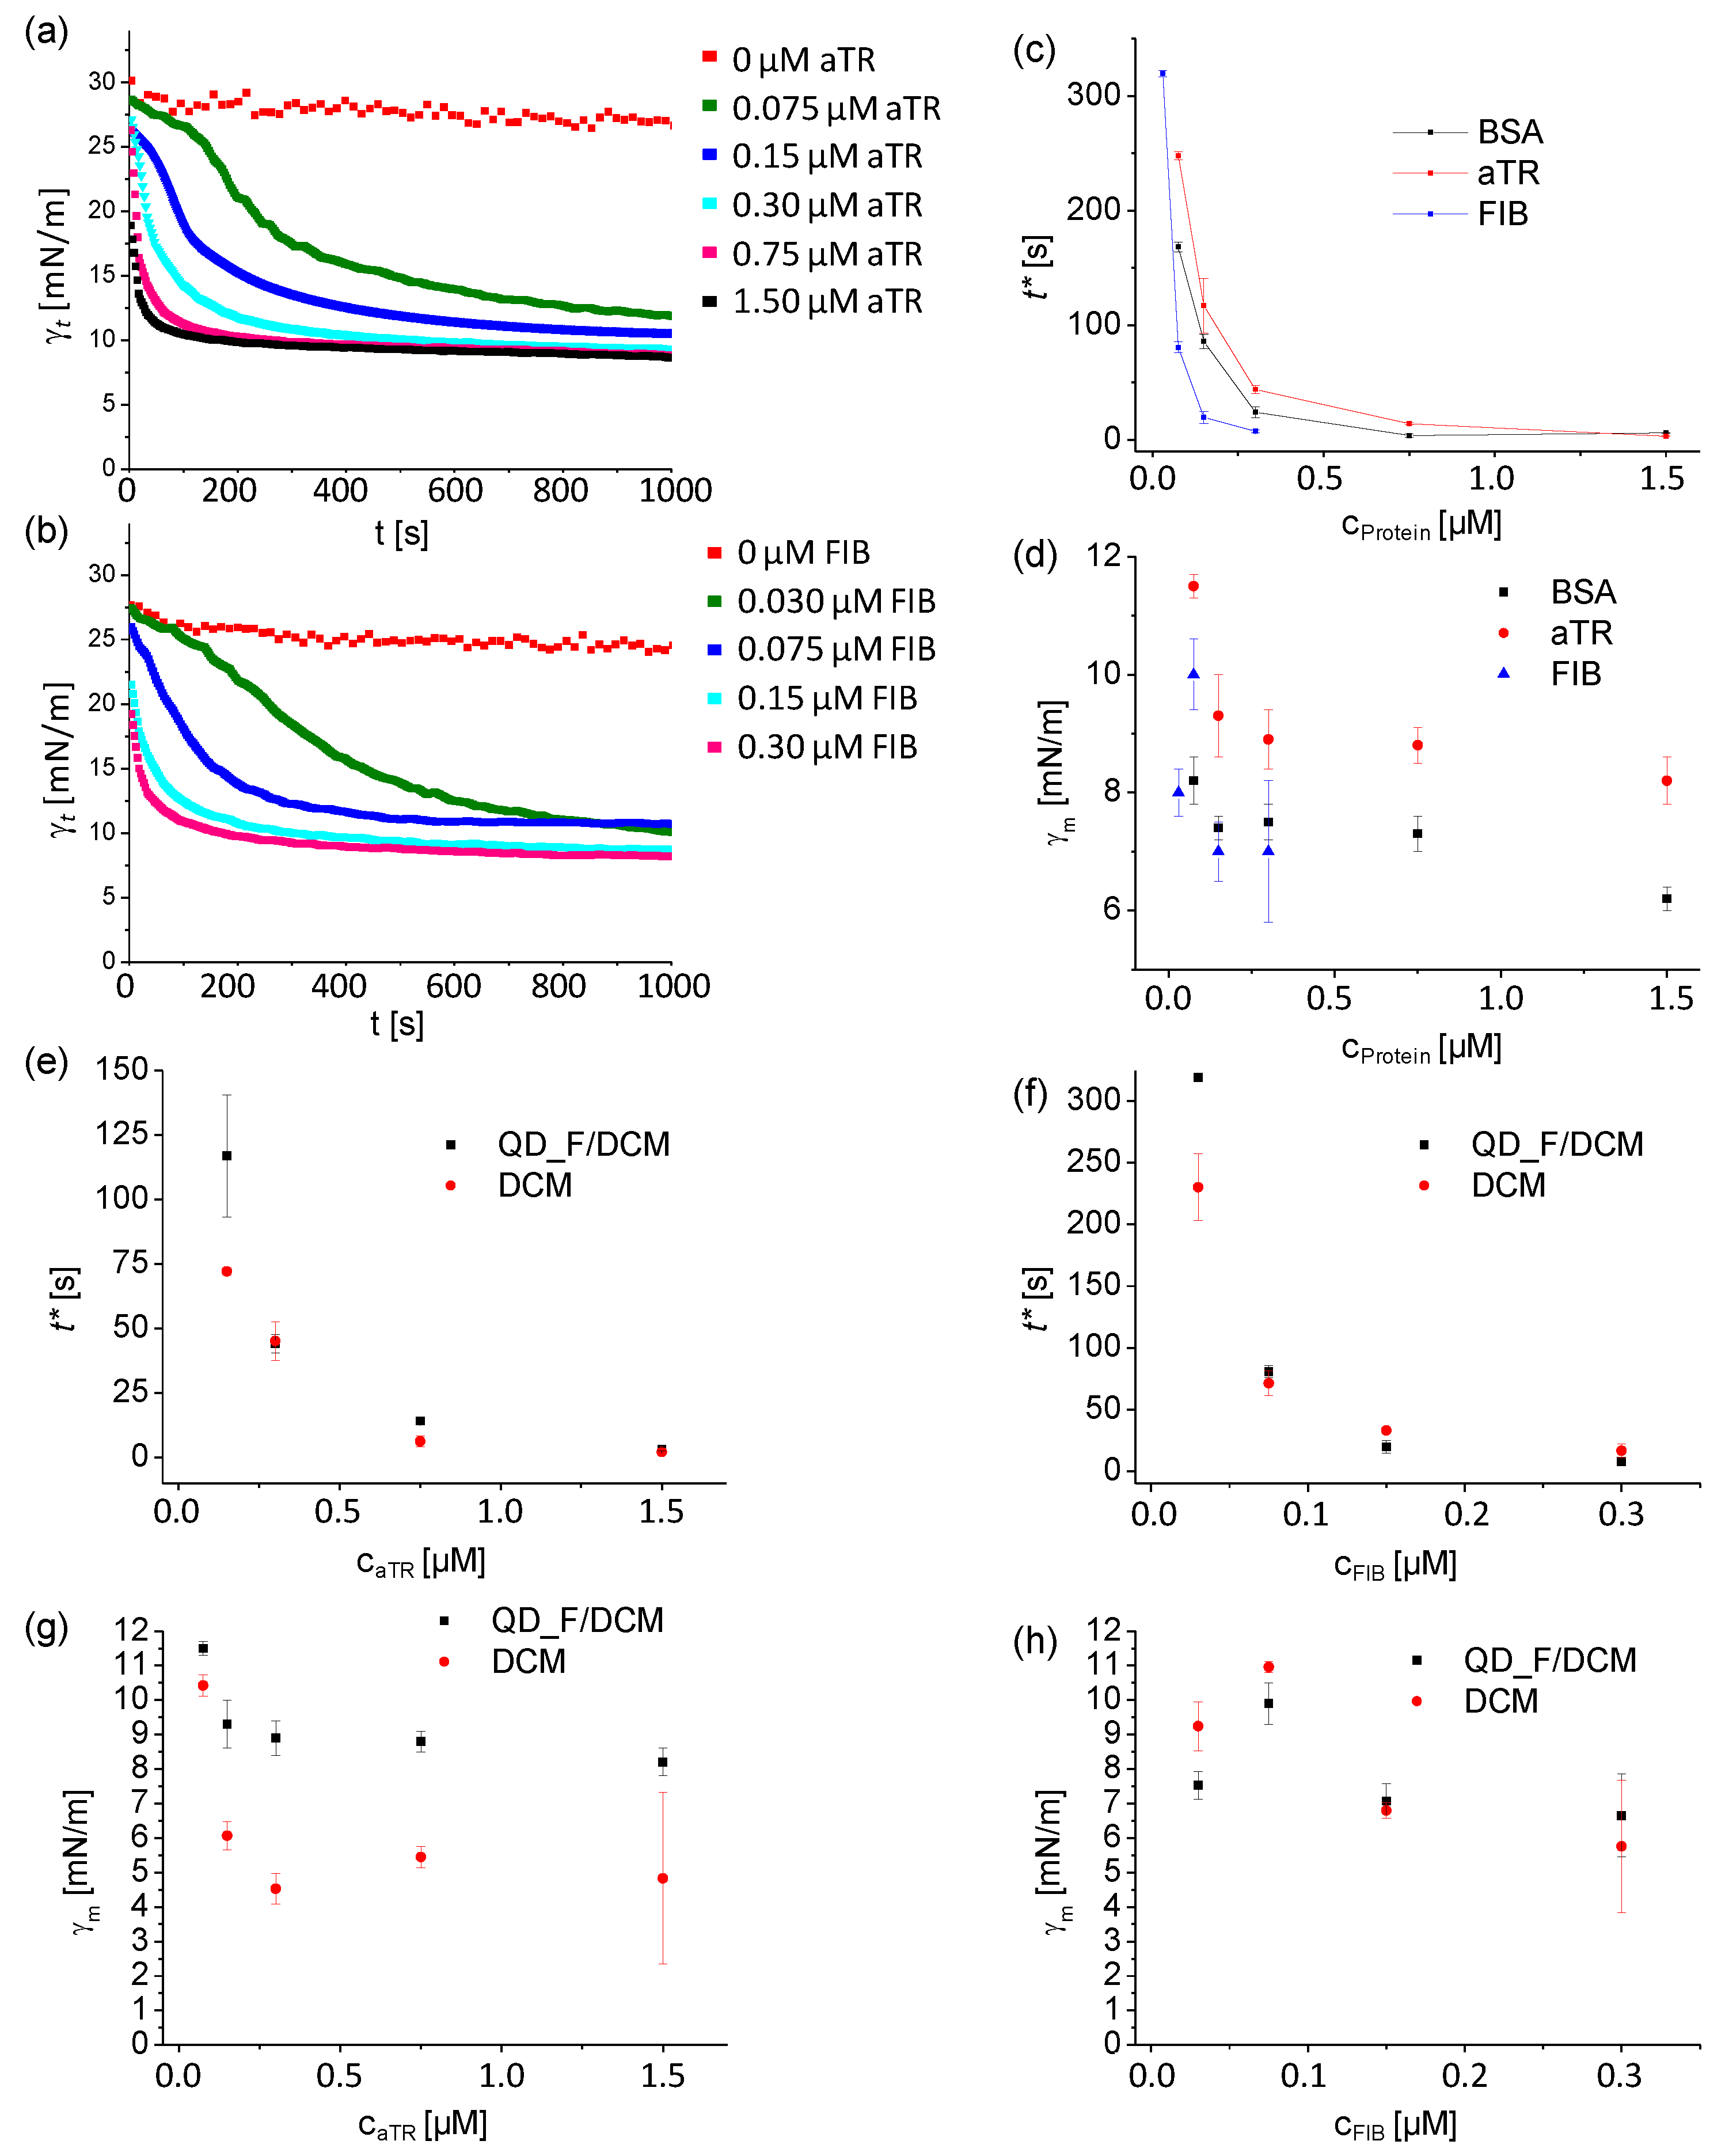
| caTR (μM) | Oil Phase | γm (mN/m) | t* (s) | caTR (μM) | Oil Phase | γm (mN/m) | t* (s) |
| 0.075 | DCM | 10.4 ± 0.3 | 197.5 ± 8.8 | 0.075 | QD_F | 11.5 ± 0.2 | 247.7 ± 3.6 |
| 0.15 | DCM | 6.1 ± 0.4 | 72.1 ± 1.5 | 0.15 | QD_F | 9.3 ± 0.7 | 116.9 ± 23.7 |
| 0.3 | DCM | 4.5 ± 0.4 | 45.1 ± 7.5 | 0.3 | QD_F | 8.9 ± 0.5 | 44.0 ± 3.6 |
| 0.75 | DCM | 5.5 ± 0.3 | 6.3 ± 2.2 | 0.75 | QD_F | 8.8 ± 0.3 | 14.0 ± 1.1 |
| 1.5 | DCM | 4.8 ± 2.5 | 2.2 ± 0.7 | 1.5 | QD_F | 8.2 ± 0.4 | 3.2 ± 0.6 |
| cFIB (μM) | Oil Phase | γm (mN/m) | t* (s) | cFIB (μM) | Oil Phase | γm (mN/m) | t* (s) |
| 0.03 | DCM | 9.2 ± 0.7 | 230.2 ± 27.0 | 0.03 | QD_F | 7.5 ± 0.4 | 319.3 ± 2.7 |
| 0.075 | DCM | 10.9 ± 0.2 | 71.2 ± 9.8 | 0.075 | QD_F | 9.9 ± 0.6 | 80.6 ± 4.8 |
| 0.15 | DCM | 6.8 ± 0.2 | 32.9 ± 1.0 | 0.15 | QD_F | 7.1 ± 0.4 | 19.6 ± 5.3 |
| 0.3 | DCM | 5.8 ± 1.9 | 16.3 ± 5.6 | 0.3 | QD_F | 6.7 ± 1.2 | 7.5 ± 1.4 |
© 2018 by the authors. Licensee MDPI, Basel, Switzerland. This article is an open access article distributed under the terms and conditions of the Creative Commons Attribution (CC BY) license (http://creativecommons.org/licenses/by/4.0/).
Share and Cite
Carrillo-Carrión, C.; Gallego, M.; Parak, W.J.; Carril, M. Study of Fluorinated Quantum Dots-Protein Interactions at the Oil/Water Interface by Interfacial Surface Tension Changes. Materials 2018, 11, 750. https://doi.org/10.3390/ma11050750
Carrillo-Carrión C, Gallego M, Parak WJ, Carril M. Study of Fluorinated Quantum Dots-Protein Interactions at the Oil/Water Interface by Interfacial Surface Tension Changes. Materials. 2018; 11(5):750. https://doi.org/10.3390/ma11050750
Chicago/Turabian StyleCarrillo-Carrión, Carolina, Marta Gallego, Wolfgang J. Parak, and Mónica Carril. 2018. "Study of Fluorinated Quantum Dots-Protein Interactions at the Oil/Water Interface by Interfacial Surface Tension Changes" Materials 11, no. 5: 750. https://doi.org/10.3390/ma11050750