Comparison of SF6 and CF4 Plasma Treatment for Surface Hydrophobization of PET Polymer


1
Jozef Stefan International Postgraduate School, Jamova 39, Ljubljana 1000, Slovenia
2
Jozef Stefan Institute, Jamova 39, Ljubljana 1000, Slovenia
*
Author to whom correspondence should be addressed.
Materials 2018, 11(2), 311; https://doi.org/10.3390/ma11020311
Submission received: 20 January 2018
/
Revised: 13 February 2018
/
Accepted: 18 February 2018
/
Published: 21 February 2018
(This article belongs to the Special Issue Surface Modification to Improve Properties of Materials)
Abstract
:The fluorination of the polymer polyethylene terephthalate in plasma created from SF6 or CF4 gas at various pressures was investigated. The surface was analysed by X-ray photoelectron spectroscopy and water contact angle measurements, whereas the plasma was characterized by optical emission spectroscopy. The extent of the polymer surface fluorination was dependent on the pressure. Up to a threshold pressure, the amount of fluorine on the polymer surface and the surface hydrophobicity were similar, which was explained by the full dissociation of the SF6 and CF4 gases, leading to high concentrations of fluorine radicals in the plasma and thus causing the saturation of the polymer surface with fluorine functional groups. Above the threshold pressure, the amount of fluorine on the polymer surface significantly decreased, whereas the oxygen concentration increased, leading to the formation of the hydrophilic surface. This effect, which was more pronounced for the SF6 plasma, was explained by the electronegativity of both gases.
1. Introduction
Fluorine-containing plasmas are often used for the surface hydrophobization of polymer materials [1,2,3,4,5,6,7,8] and for dry-etching in the semiconducting industry [9,10,11,12]. In the latter, the addition of oxygen is used to enhance the etching rate [11]. If no oxygen is added, etching of the surface could be done by using substrate biasing. However, high ion energies can cause sample graphitization [10]. When fluorine plasmas are used to enhance the surface hydrophobicity, two effects can be obtained, namely, functionalization or deposition (polymerization of fluorocarbons), depending on the F/C ratio [13,14]. If the F/C ratio is high (F/C > 3), there is no polymerization, whereas if the F/C ratio is low (F/C ≤ 2), fluorocarbons will polymerize on the surface. Thus, gases such as CF4, SF6 and C2F6 do not cause polymerization [14,15] unless CH4 is added to change the F/C ratio [16]. CF4 is therefore often used for polymer surface modification to introduce nonpolar functional groups. SF6 is rarely used, and therefore, literature is scarce. SF6 plasma has been used to treat polyethylene terephthalate PET (fabric [1], fibres [7] or film [5]), cotton fibres [7], polypropylene (PP) [3,4], polyethylene (PE) [5], polyvinyl chloride (PVC) [5] and polymethyl methacrylate [2]. The authors reported increased hydrophobicity; however, different authors reported different stabilities of the hydrophobic surface. Selli et al. found that repeated SF6 treatment caused more stable hydrophobicity [7]. Walton et al. found a negligible ageing effect after one year for the sample treated for the longest treatment time of 60 s, but this was not the case for the samples treated for shorter times [6]. Mrad et al. observed the ageing of PET, whereas PVC was stable even 210 days after treatment [5]. Polyethylene was quite stable as well, because the contact angle did not change in the first 40 days of ageing, whereas later it slightly decreased. Here, it is worth mentioning that all authors observed fluorine at the surface treated in SF6 plasma; however, few authors observed sulphur because of grafting of SFx species on the treated surface, which were very sensitive to ablation [8,17].
There have also been some reports in the literature on using O2 plasma followed by SF6. Mangindaan et al. prepared gradient PP surfaces with wettability between 20° and 135° by applying an O2 pretreatment followed by SF6 plasma treatment under a specially designed mask with an open end and a closed end, which allowed the diffusion of reactive fluorine species [3,4]. The highest fluorine content of 44 at % was found at the open end, and only 3 at % was found at the close end of the mask. In contrast, the oxygen concentration was approximately 11 and 30 at % at the open and closed ends, respectively. The sulphur content was very small at approximately 0.4 at %. The authors also studied the adhesion of fibroblast cells and found that the number of cells decreased from the hydrophobic surface at the open end to the hydrophilic surface at the closed end. Consecutive O2 and SF6 plasma treatments were also applied by Bi et al. for treatment of Parylene-C to obtain a superhydrophobic surface [18]. Oxygen plasma treatment time was varied, whereas the treatment time in the SF6 plasma was kept constant. The hydrophobicity increased with increasing pretreatment time in the O2 plasma until saturation was achieved with a contact angle of 169°. The obtained superhydrophobic surface was a result of the increased surface nanoroughness induced by O2 plasma treatment, followed by surface fluorination with SF6 plasma treatment.
In this paper, we investigated and compared the SF6 and CF4 plasma created at various pressures on the surface modification of PET polymer films.
2. Materials and Methods
2.1. Plasma Treatment
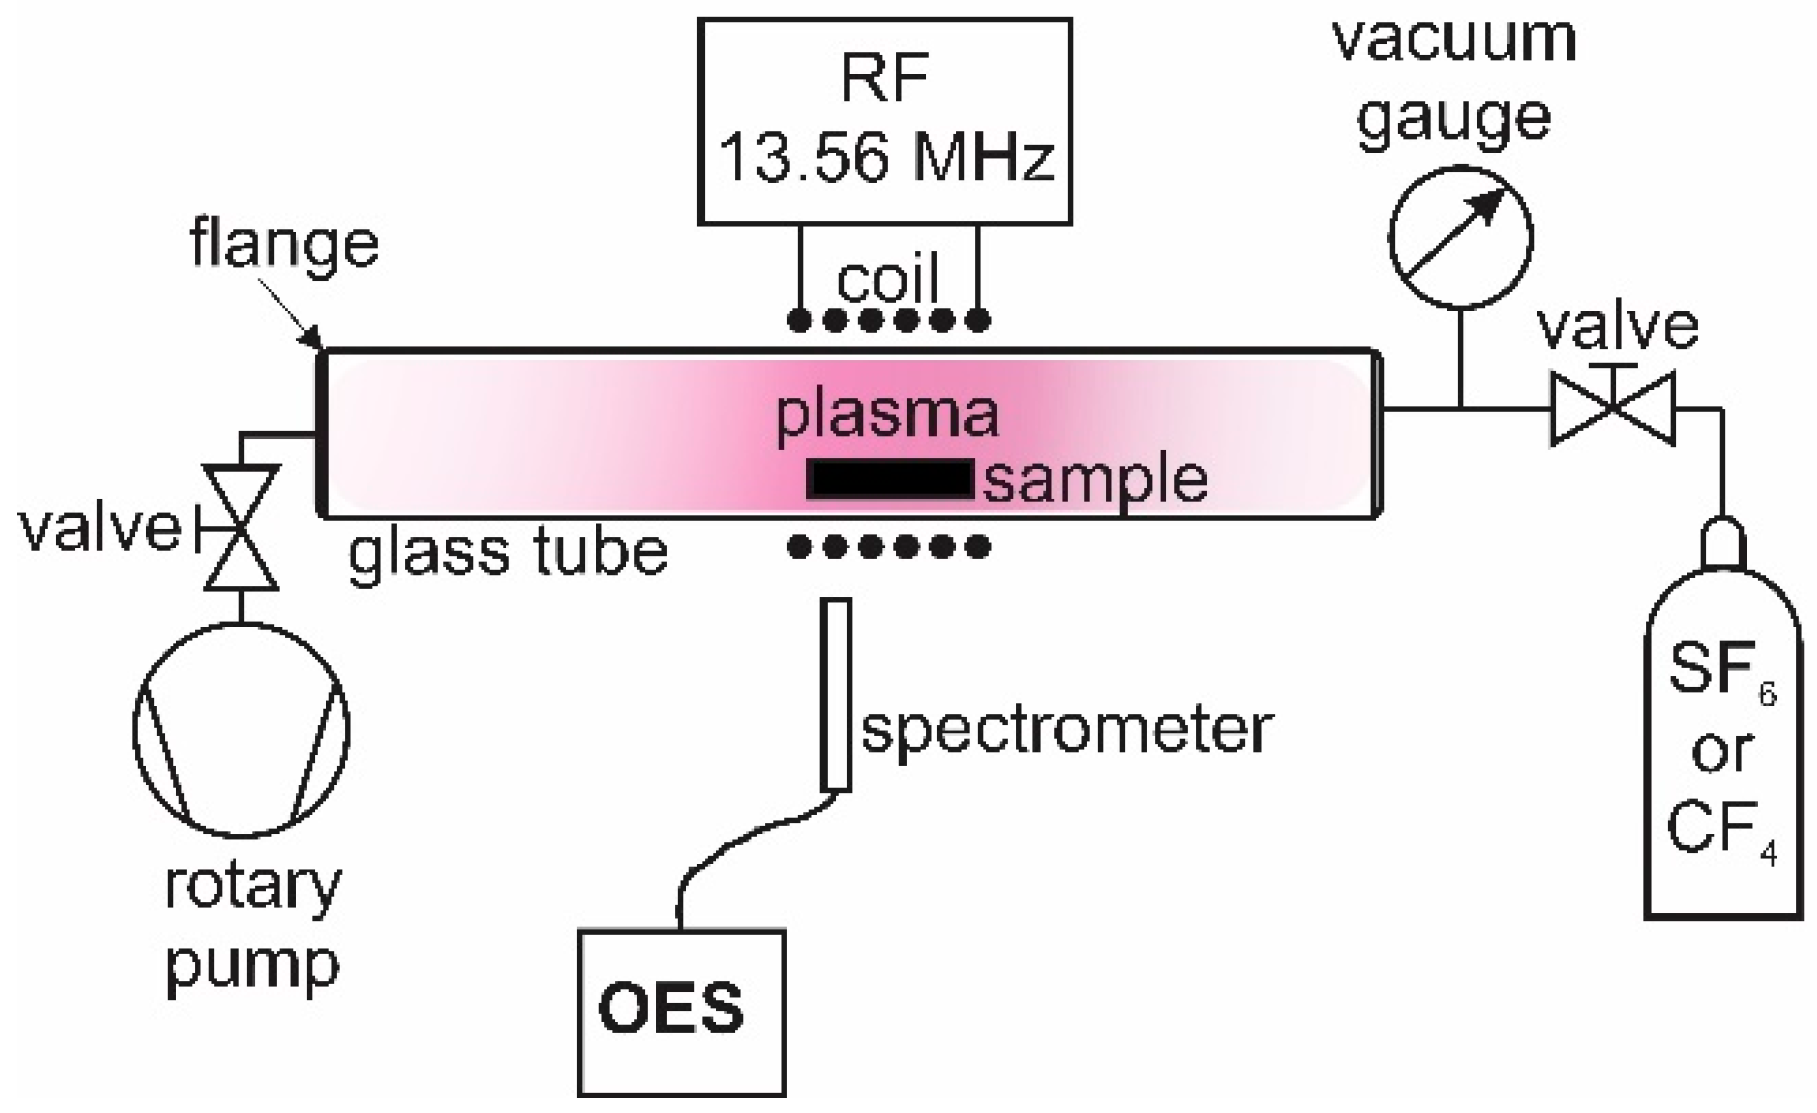
A semi-crystalline PET polymer with a thickness of 0.250 mm was obtained from Goodfellow (Goodfellow Cambridge Ltd., Huntingdon, England). It was cut into small samples of 1 × 1 cm2. The samples were treated in a plasma system, as shown in Figure 1. The plasma was created in a Pyrex discharge tube with a length of 80 cm and a diameter of 4 cm. A coil with 6 turns was placed in the centre of the tube. The coil was connected to a radiofrequency RF generator (13.56 MHz) via a matching network. The generator nominal power was fixed to 200 W. The discharge chamber was pumped with a rotary pump with a nominal pumping speed of 80 m3·h−1. The base pressure was 1 Pa. Sulphur hexafluoride (SF6) or tetrafluoromethane (CF4) gas (supplied by Messer, Messer Group GmbH, Bad Soden, Germany) was leaked into the plasma chamber, and the gas purity was 99.998 and 99.995, respectively. Samples of the PET polymer were placed in the middle of the coil and treated by plasma at various gas pressures. The lowest pressure was set at 10 Pa, whereas the maximum pressure was determined as a pressure at which it was still possible to ignite the plasma. For the SF6 plasma, the highest pressure was 200 Pa, whereas for the CF4 plasma, it was 500 Pa. The treatment time was kept constant at 40 s.
2.2. Plasma Characterization
The plasma was characterized using optical emission spectroscopy (OES). OES measurements were performed in a quartz tube with a 16-bit Avantes AvaSpec 3648 fibre optic spectrometer (Avantes Inc., Louisville, CO, USA). A nominal spectral resolution was 0.8 nm, and the spectra were recorded in the range from 200 to 1100 nm. A combined deuterium-tungsten reference light source was used to determine the spectral response of the spectrometer. The measured OES spectra were calibrated with this spectral response.
2.3. Surface Characterization
Approximately 20 min after plasma treatment, the surface composition of the samples was analysed by X-ray photoelectron spectroscopy (XPS). An XPS instrument model TFA XPS from Physical Electronics (Munich, Germany) was used. The samples were excited using monochromatic Al Kα1,2 radiation at 1486.6 eV. Photoelectrons were detected at an angle of 45° with respect to the normal of the sample surface. XPS survey spectra were measured at a pass-energy of 187 eV using an energy step of 0.4 eV. High-resolution C 1s spectra were measured at a pass-energy of 23.5 eV using an energy step of 0.1 eV. An additional electron gun was used for the surface charge compensation. All spectra were referenced to the main C 1s peak with a position set to 284.8 eV. The measured spectra were evaluated using MultiPak v8.1c software (Ulvac-Phi, Inc., Kanagawa, Japan, 2006) from Physical Electronics.
The surface wettability was measured 5 min after plasma treatment by a See System (Advex Instruments, Brno, Czech Republic). Contact angles (WCA) were determined with a demineralized water droplet of a volume of 3 μL. Three measurements were taken to minimize the statistical error.
The surface roughness and morphology were analysed by atomic force microscopy (AFM) using a Solver PRO (NT-MDT, Moscow, Russia) in tapping mode. The surface roughness, Ra, was measured over an area of 5 μm × 5 μm.
3. Results and Discussion
Figure 2a shows the variation of the XPS surface composition of the PET polymer treated in SF6 plasma versus pressure. The values for the atomic concentration at a pressure of 0 Pa correspond to an untreated sample. The measured values for the untreated sample, i.e., 25 at % oxygen and 75 at % carbon, are close to the theoretical values for pure polyethylene terephthalate. These values are altered upon plasma treatment, as demonstrated in Figure 2a.
As expected, fluorine appeared on the surface, and its concentration was dependent upon the pressure in the discharge chamber during the plasma treatment of the polymer sample. Two regions can be distinguished. The first one appeared at pressures up to approximately 130 Pa, where the surface composition was relatively constant and was independent of the pressure. However, at pressures higher than 130 Pa, a drastic (and rather abrupt) modification of the surface composition occurred. Hereinafter, a pressure of 130 Pa is considered the threshold pressure. In the first region, below the threshold pressure, plasma treatment resulted in intensive fluorination of the polymer because a high fluorine content of approximately 46 at % was found. Furthermore, the oxygen concentration decreased from the initial 26 to 10 at %. In the second region, above the threshold pressure, the fluorine concentration on the polymer surface dropped to only ~ 16 at %, whereas the oxygen concentration increased to almost 30 at %. Another important difference in both regions was the presence of a minor concentration of other elements. In addition to carbon and oxygen, which were already present in the original polymer, only fluorine was found in the first region. However, in the second region, a minor concentration of sulphur from SFx radicals was found as well (<1 at %). A detailed reason for this transition will be explained later in the text. It is correlated with the concentration of F atoms in the plasma, which was lower after the threshold pressure; therefore, surface fluorination was less efficient. Furthermore, all vacuum systems contain water vapour, which dissociates to O and OH radicals that compete with F atoms and cause oxidation. For this reason, a higher oxygen concentration was found above the threshold pressure. This phenomenon, whereby oxidation may occur when treating materials in F-containing plasmas, has been observed before and was published in [19].
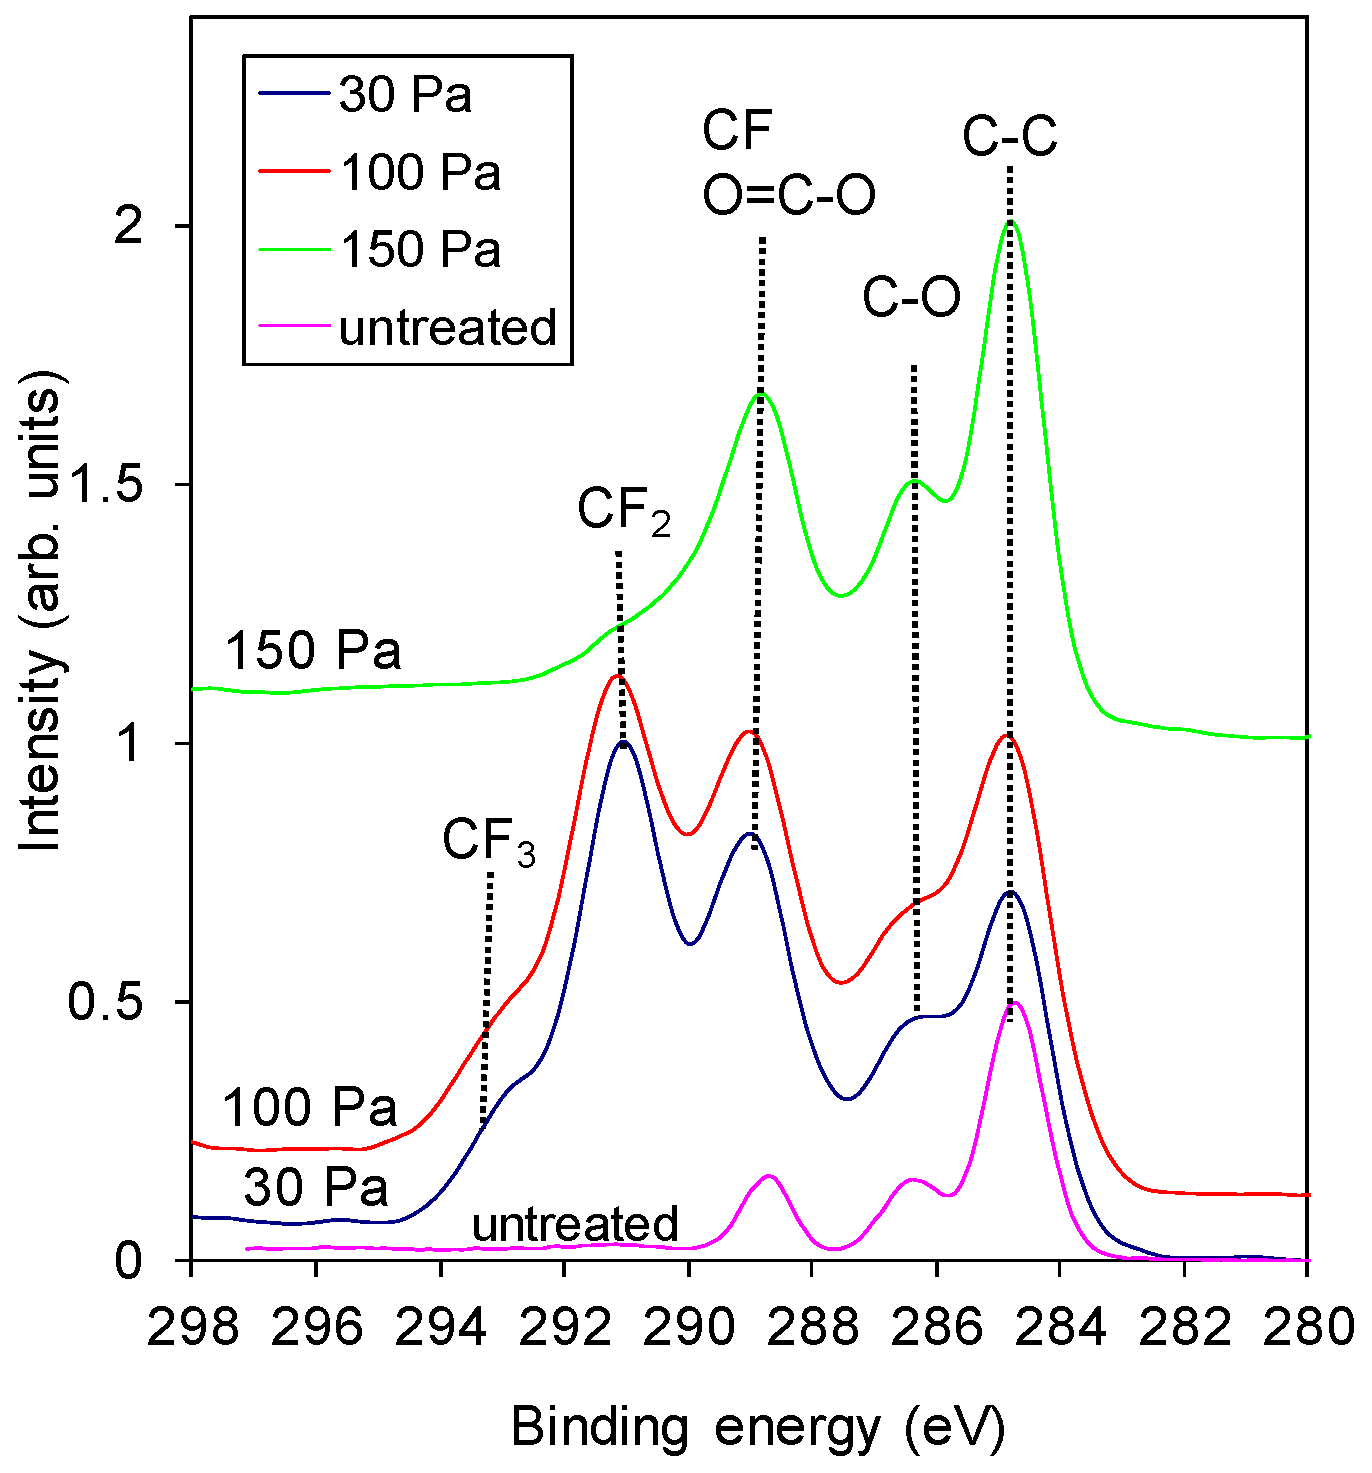
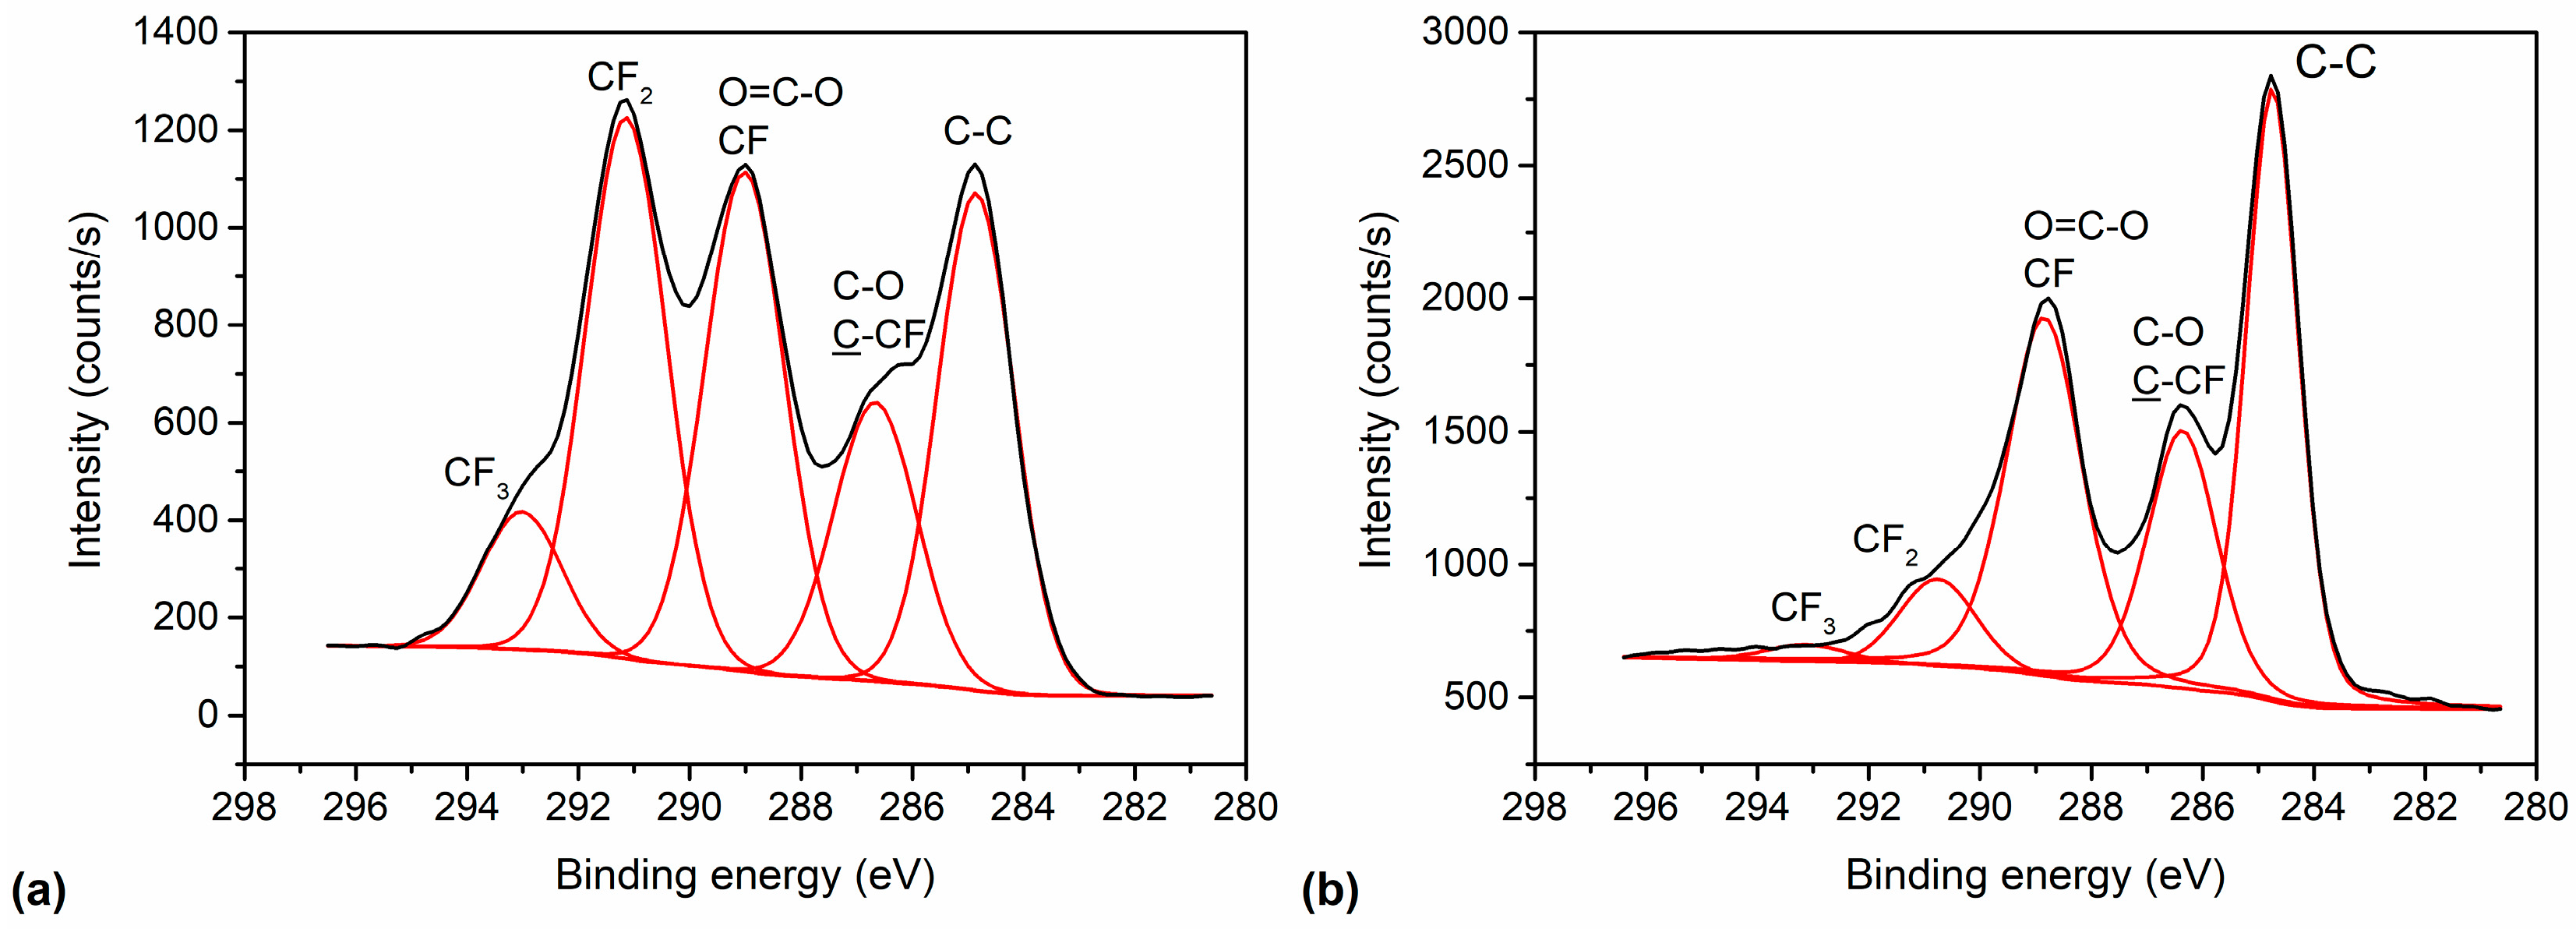
The significant change in the surface concentration of F and O before and after the threshold pressure is also observed in the high-resolution carbon C 1s spectra shown in Figure 3. The samples treated at pressures below the threshold pressure were rich in CF3 and CF2 as well as CF functional groups (see Figure 4 also), whereas the sample treated at pressures higher than the threshold pressure had only some CF groups and an insignificant number of CF2 functional groups in the surface film probed by the photoelectrons. This result is shown in more detail in Figure 4, where an example of a detailed curve deconvolution of the C 1s spectra showing peak assignment is presented. The C 1s peak was fitted with five components positioned at the binding energies of 284.8 eV assigned to C–C, 286.5 eV assigned to C–O and C–CF, 289 eV assigned to O–C=O and CF, 291.3 eV to CF2 and 293 eV to CF3 [20,21].
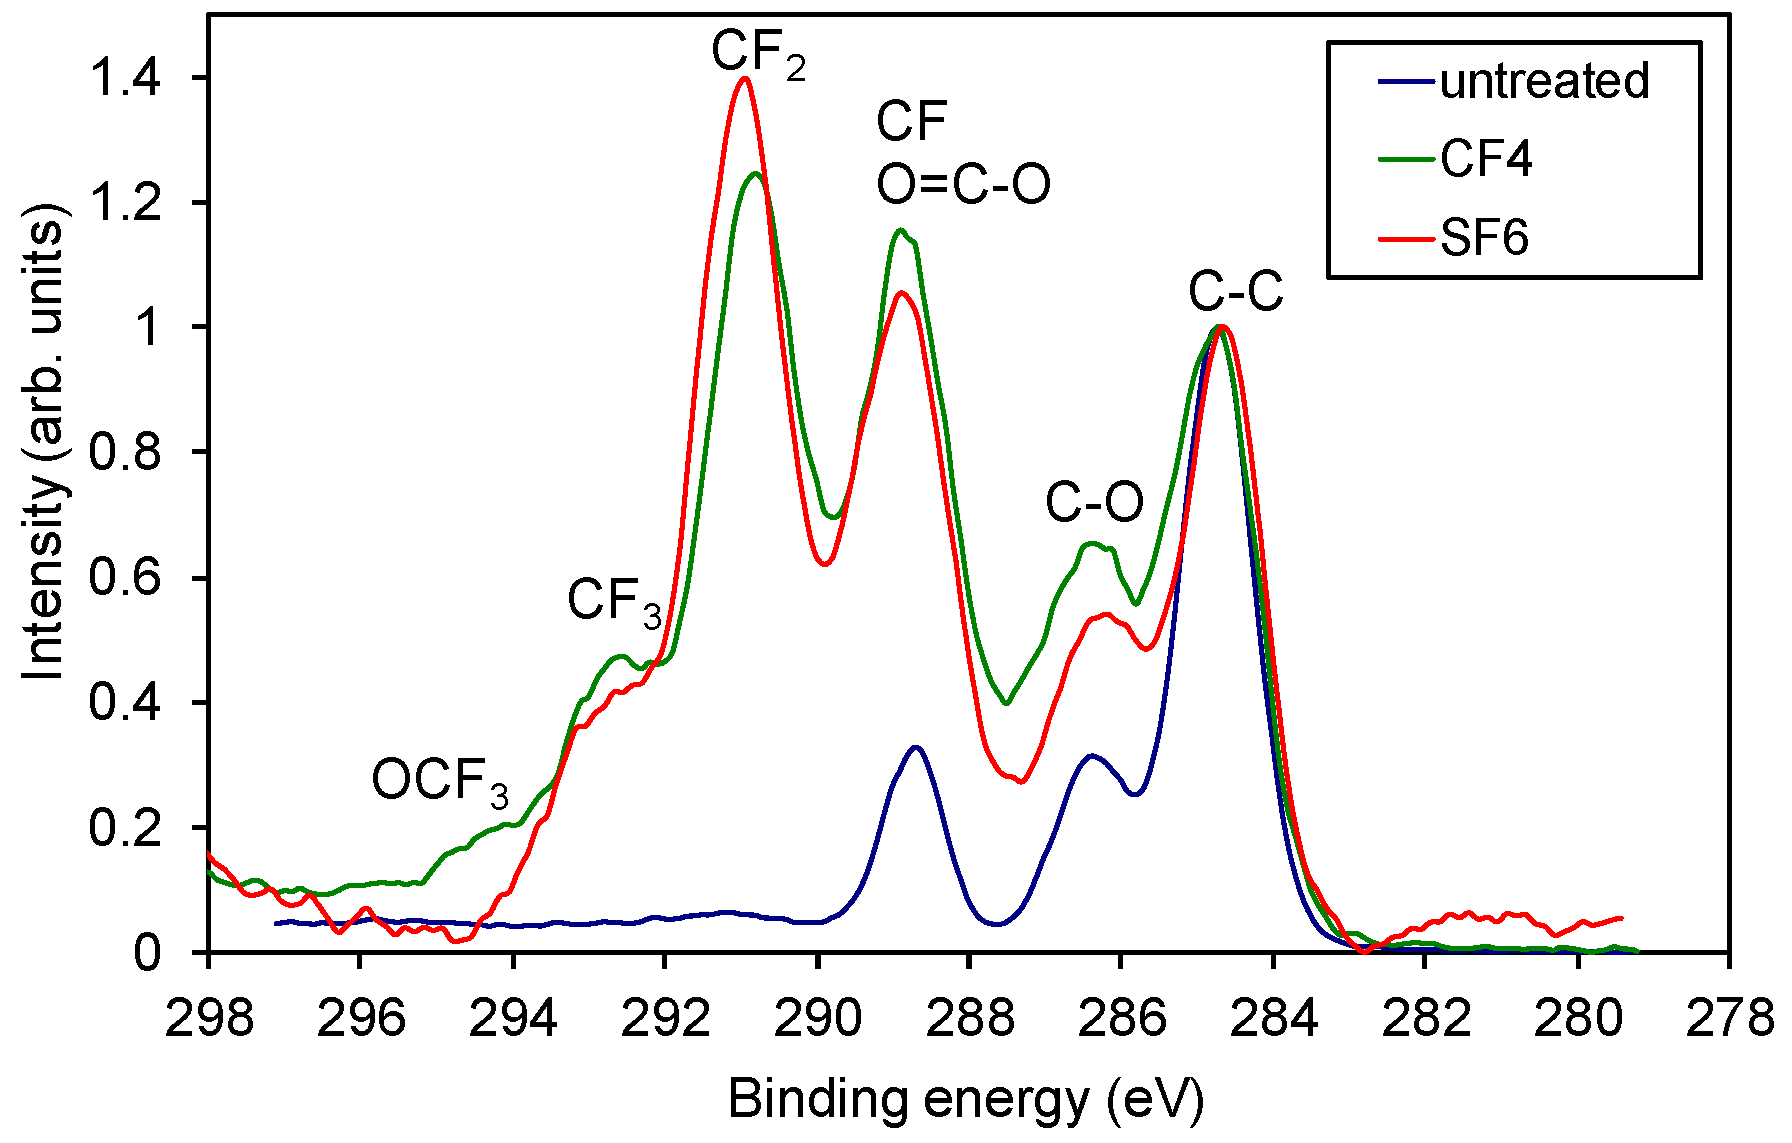
When treating the polymer in CF4 plasma (Figure 2b), a similar behaviour was observed as when treated in SF6 plasma. However, the transition between the regions of high and low fluorine content was not very sharp (it appeared approximately at a threshold pressure of 200 Pa) and was less intense (the fluorine concentration dropped to only 30 at %, and oxygen increased to almost 23 at %). In the first region below the threshold pressure, there was no significant difference in the fluorine concentration on the sample treated in CF4 or SF6 plasma, (Figure 2a,b, respectively). Figure 5 shows a comparison of selected carbon peaks for the samples treated in CF4 and SF6 plasma at 100 Pa (low-pressure region). We see only minor differences in the intensity of the various fluorine functional groups of CF, CF2, and CF3 and the presence of OCF3 at ~295 eV for the sample treated in CF4 plasma.
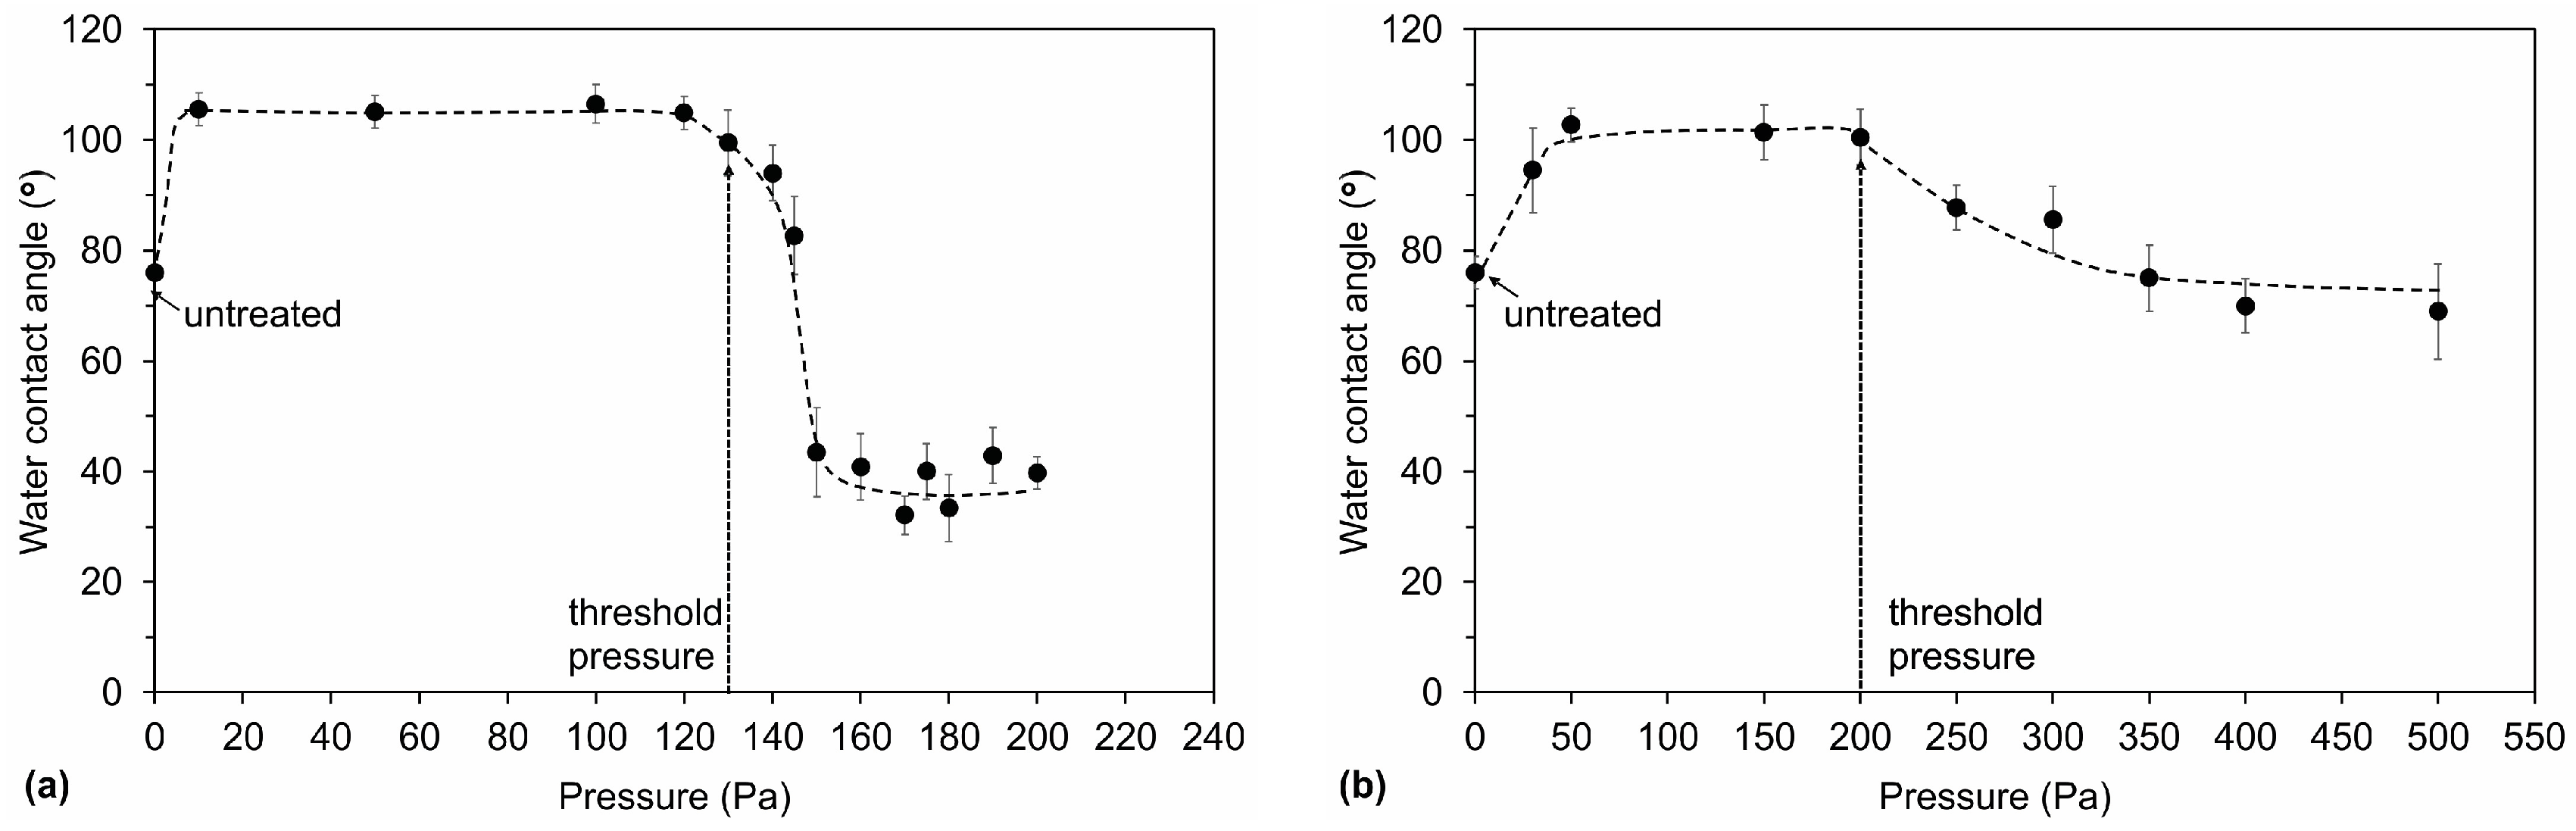
Plasma treatment changed the surface hydrophobicity of the samples. The water contact angle increased from the initial 76° to approximately 106° regardless of using the CF4 or SF6 plasma as long as the pressure was low enough (below the threshold). The value of 106° is typical for hydrophobic materials with a smooth surface [22]. The variation of the contact angle with pressure is interesting, as shown in Figure 6a. We can see that after the threshold pressure, when a decrease in fluorine and an increase in the oxygen concentration were observed (Figure 2a), the water contact angle significantly decreased to approximately 35°. The surface lost its hydrophobic character and became hydrophilic because of a lack of nonpolar fluorine functional groups and the presence of more polar oxygen groups. Interestingly, the water contact angle for PET treated at high pressure in SF6 plasma was much lower than that for the untreated polymer, which was 76°. Measurements of the surface roughness by AFM showed only a slight increase in the roughness from 1.2 nm measured for the untreated sample to 2.3 and 2.6 nm measured for the samples treated in SF6 and CF4 plasma, respectively. Therefore, only a minor influence of the surface roughness on the contact angles was observed, and the major reason for modified wettability is thus chemical modification of the surface. Figure 6b also shows the results for the CF4 plasma. Similar to the results obtained for SF6 plasma treatment, we observed that, after the threshold pressure, the contact angle decreased. However, the decrease was less pronounced, which is correlated with a lower oxygen content in comparison to the sample treated in SF6 plasma (Figure 2).
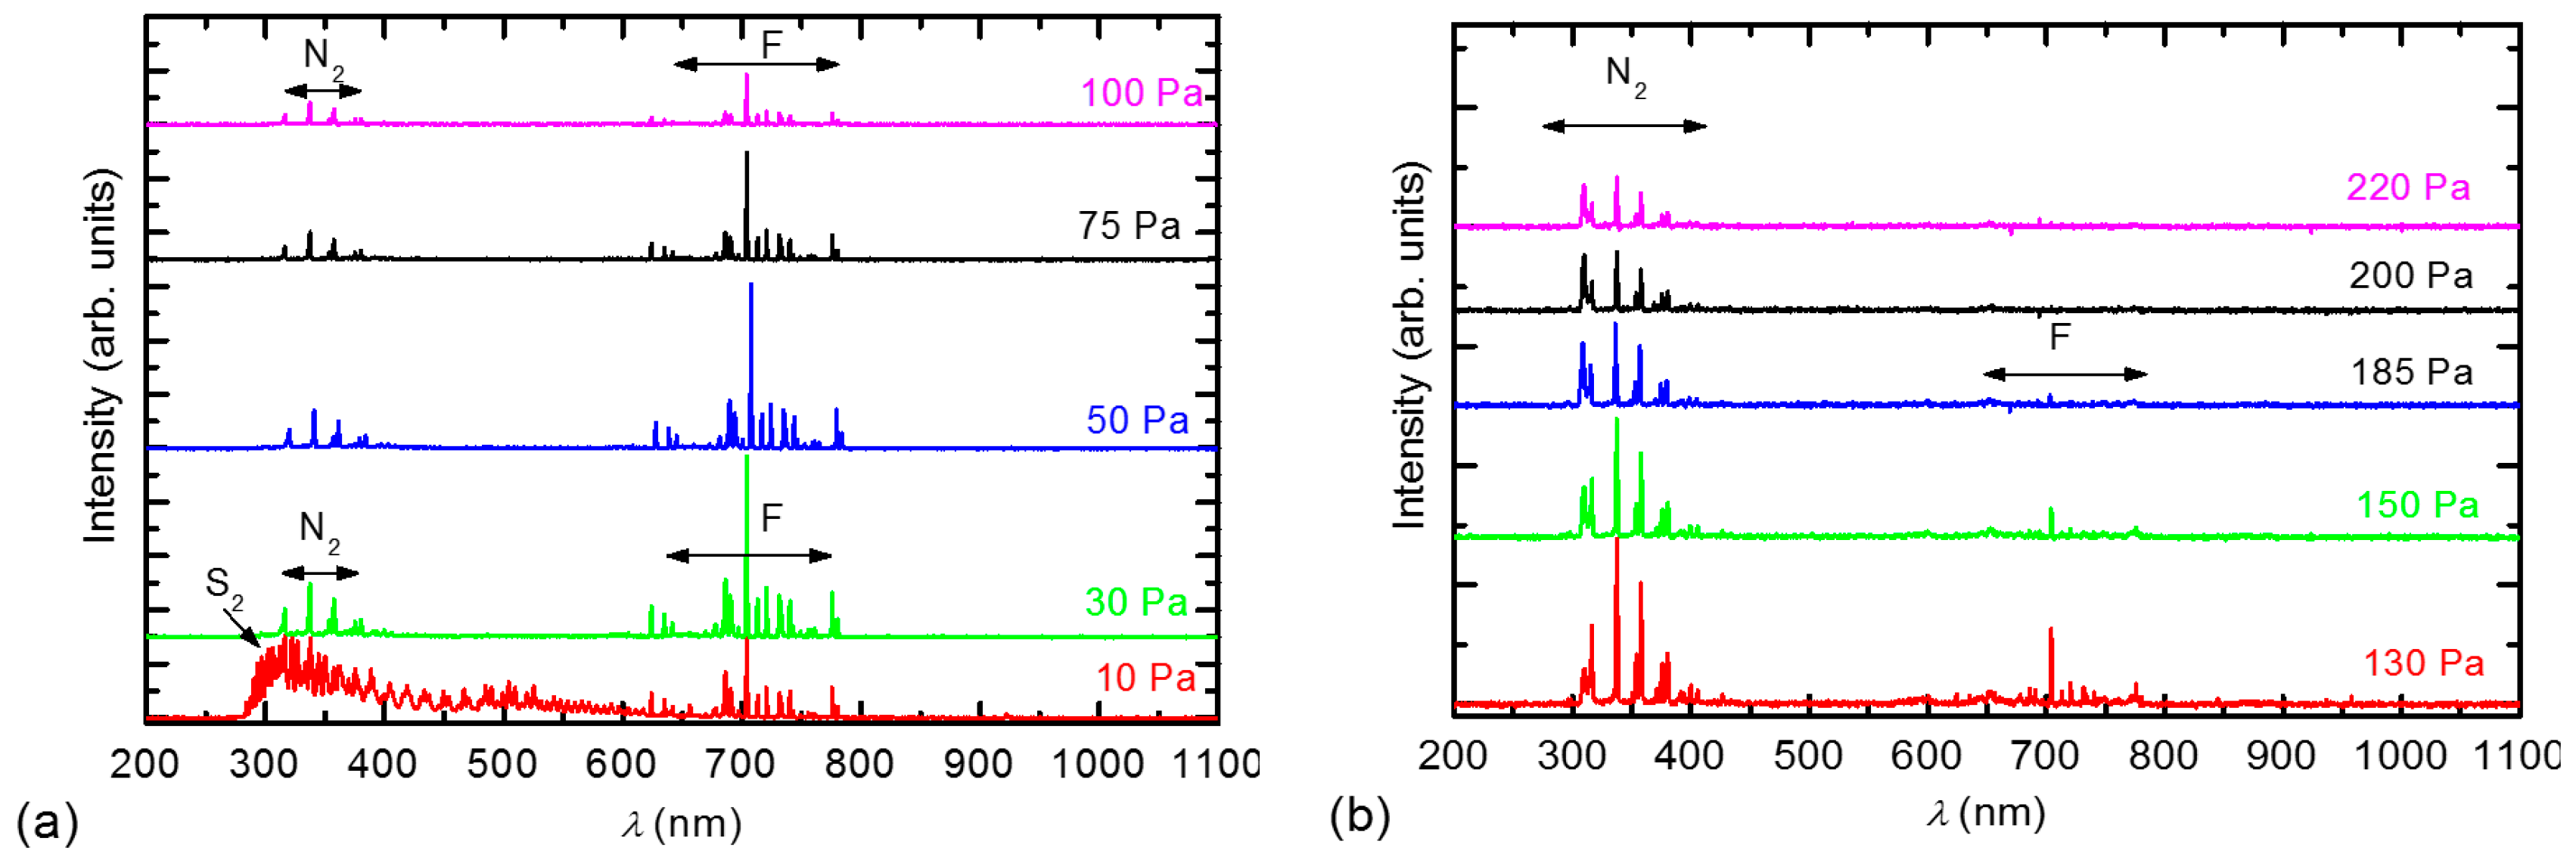
To explain such unusual behaviour of the surface composition and surface wettability with the pressure, we performed OES characterization of the plasma. OES spectra are shown in Figure 7. Figure 7a shows the spectra measured at low pressures (before the threshold pressure), while Figure 7b shows the spectra measured above the threshold pressure.
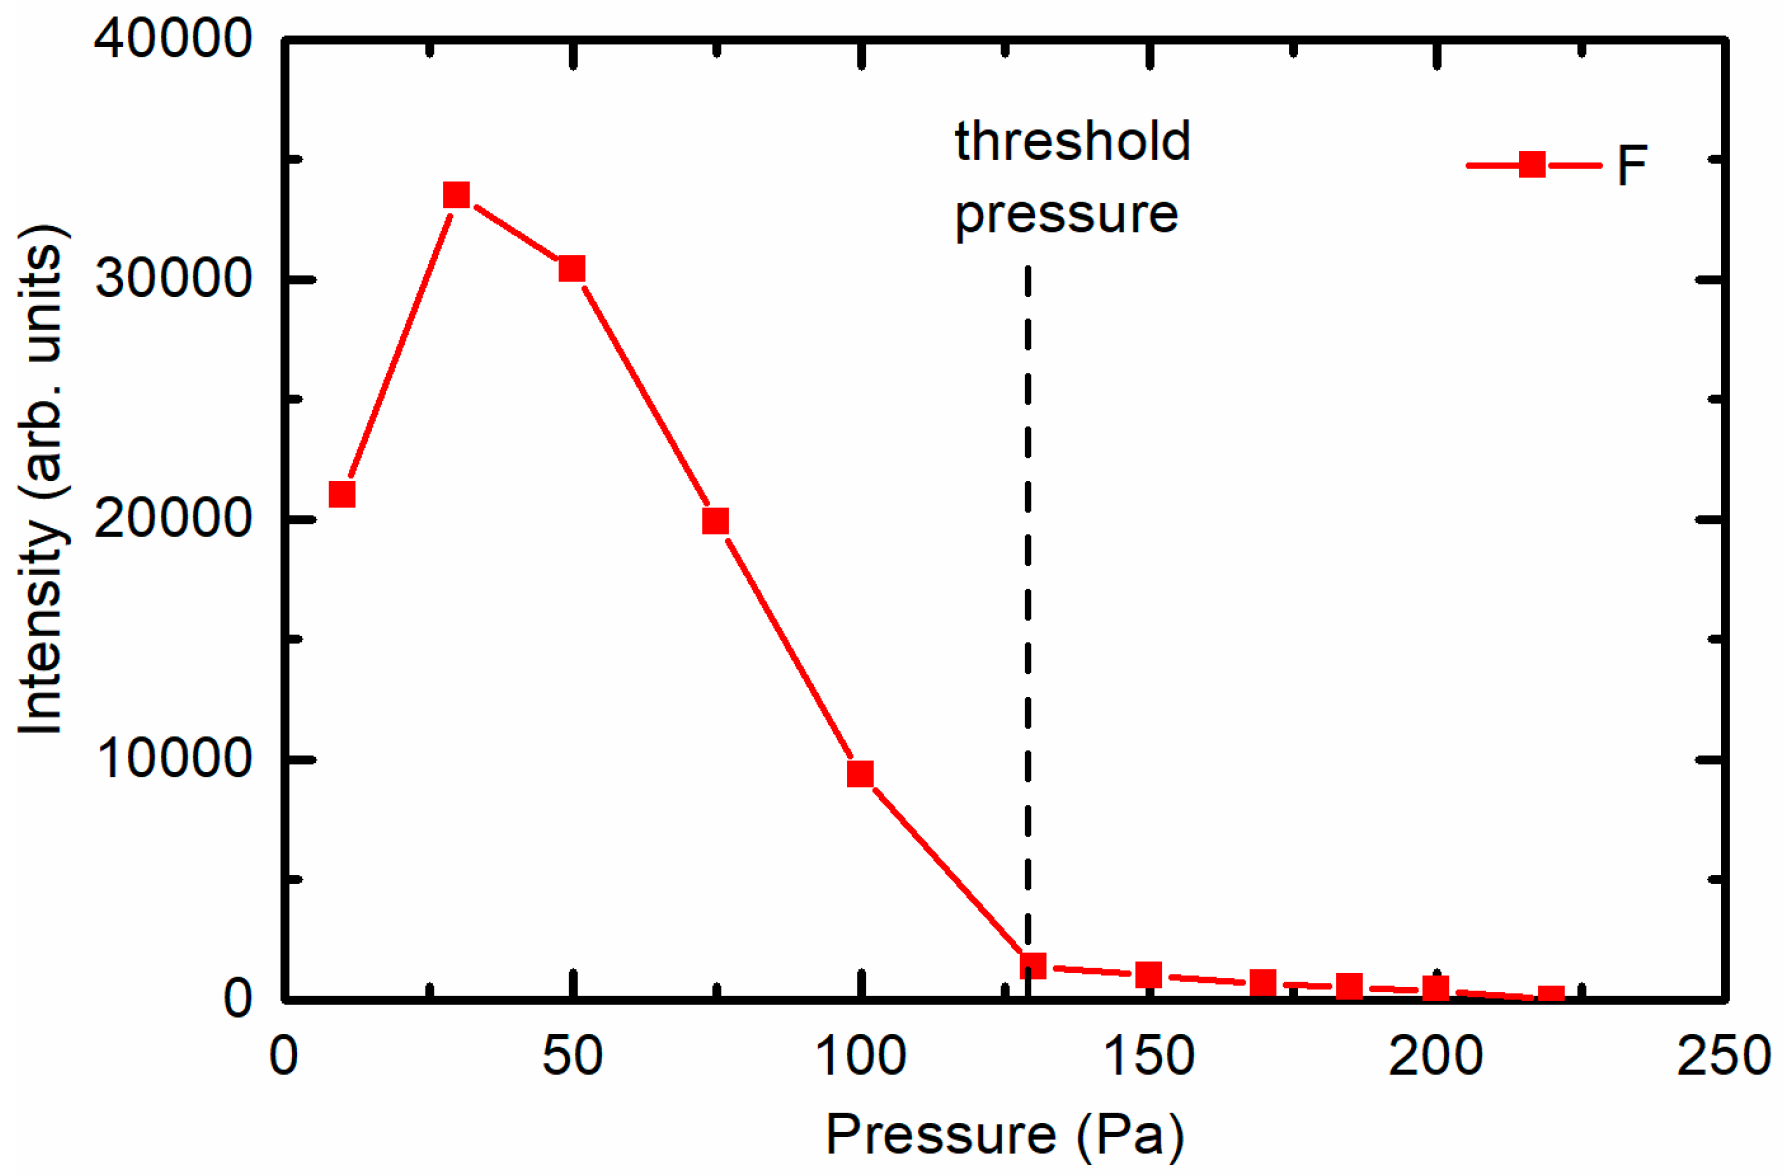
At low pressures, intensive atomic F lines in addition to bands corresponding to the N2 molecule are observed (Figure 7a). One exception is the spectrum measured at the lowest pressure 10 Pa, where bands corresponding to the S2 molecule are observed as well. The appearance of the S2 molecules can only be explained by the almost full dissociation of SF6 and the subsequent recombination to sulphur dimers. The presence of nitrogen, which is known to be a strong emitter, was explained as an impurity present in the original gas according to the manufacturer’s specifications. At high pressures (Figure 7b), the situation was different because the intensity of the F lines decreased. The variation in the F emission intensity with pressure is plotted in Figure 8. Figure 8 is in excellent agreement with Figure 2; at low pressures, where the emission intensity of F is high, the concentration of fluorine on the polymer surface is high. Whereas at higher pressures, when the OES intensity of F decreased, the XPS concentration of fluorine decreased.
The extent of dissociation and thus the concentration of radicals such as SF5, SF4, SF3, SF2, SF, S and F depends on the electron density and temperature, which in turn depends on the pressure. According to Kokkoris et al., a loss of SFx and F species on the reactor walls is also important for the production and consumption of neutral plasma species [23]. The F atoms tend to associate with F2 molecules either by heterogeneous surface recombination or in the gas-phase—the probability of gas-phase loss increases as a square of the pressure, because three-body collisions are necessary.
SF6 gas is also known to be a highly electronegative gas, which means that it has a strong tendency to acquire free electrons, thus forming negative ions: [24,25]. At low pressures, the electron temperature is high, thus causing a strong dissociation of SF6 and, thus, the occurrence of a high density of F atoms in the plasma. The F atoms diffuse and eventually reach the polymer surface where they interact chemically and cause at least partial substitution of oxygen in the surface film of the PET polymer. The exact interaction mechanism is still unknown, but a high fluence of F atoms onto the surface of the polymer will guarantee the substitution of almost all oxygen in the PET surface by fluorine. The curves in Figure 3 obtained at 30 and 100 Pa confirm this simplified explanation.
At high pressures, however, the electron density and temperature decrease; therefore, the dissociation of SF6, which has a relatively high dissociation energy of WD = 9.6 eV, is less effective [24]. Furthermore, the loss of F atoms due to the gas phase reactions becomes important. Electrons are also lost by the attachment to SF6 molecules. The lack of electrons capable of SF6 dissociation caused the density of the fluorine atoms in the plasma to decrease significantly at elevated pressure.
Similar conclusions can be drawn for SF6 plasma as for CF4 plasma. However, CF4 is as strongly electronegative as SF6; therefore, this effect is not very pronounced. For the CF4 plasma, F atomic lines are observed in the OES spectra at low pressures up to the threshold pressure (Figure 9a). The CF3 continuum is not observed below the threshold pressure (200 Pa), where it is barely noticeable.
Therefore, we can expect good dissociation of CF4 at low pressures according to [26]:
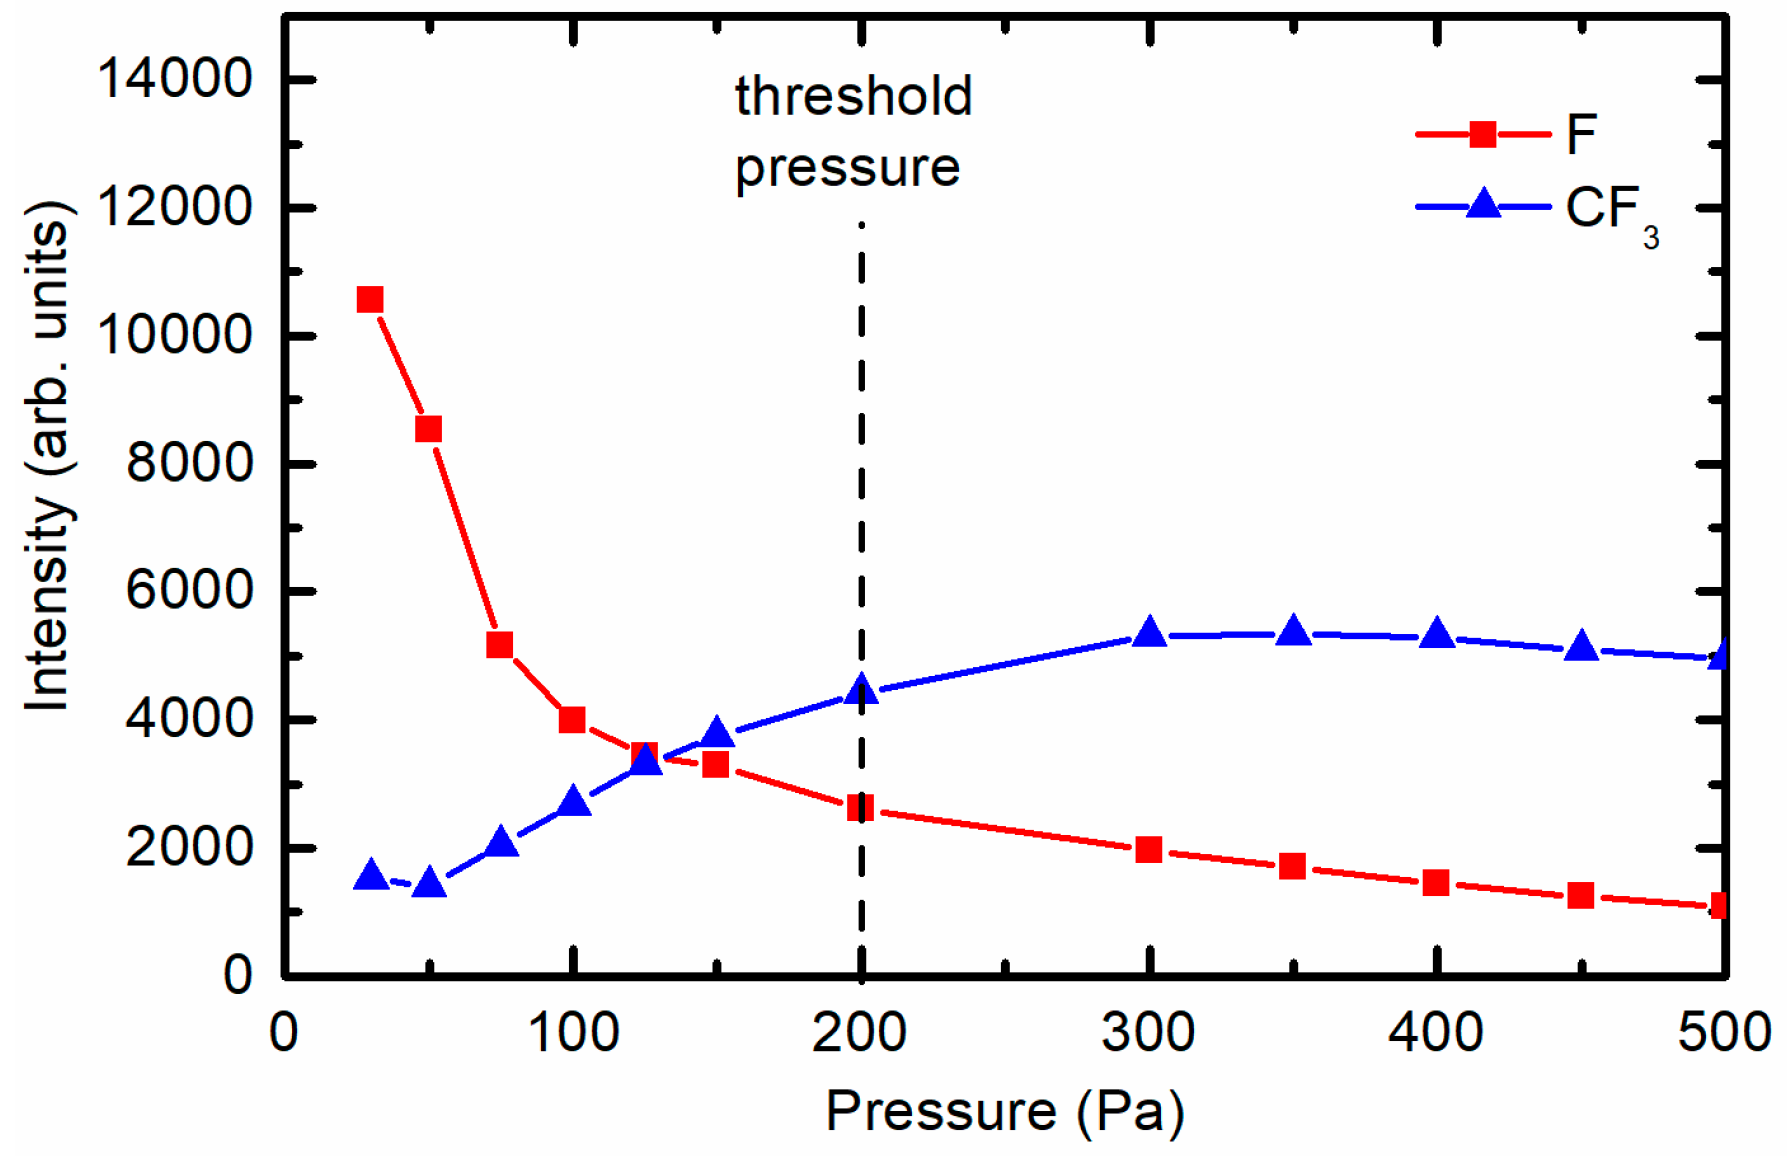
The intensity of the F line decreased with increasing pressure. Furthermore, a continuum corresponding to CF3 appeared at high pressures (Figure 9b). The appearance of the CF3 continuum coincided with a decrease in the F intensity. Figure 10 represents the radiation intensity arising from the F atoms and the CF3 radicals. At elevated pressure, the radiation from the F-atoms became marginal, indicating qualitatively that the dissociation of multiple CF4 molecules was scarce. Comparing Figure 2 and Figure 10, we can again conclude that at high pressures, the electron temperature and density was so low that it was insufficient to cause substantial dissociation of CF4, and thus, the substitution of oxygen with fluorine on the PET polymer upon plasma treatment was poor.
4. Conclusions
Fluorination of the polymer surface in SF6 and CF4 plasma was investigated. Plasma was created at various pressures. It was observed that at low pressures up to the threshold pressure, the XPS concentration of fluorine on the polymer surface was high (~46 at %) regardless of the gas used. After the threshold pressure, a sudden decrease in the fluorine concentration was observed, which was more pronounced for the SF6 plasma. Simultaneously, the concentration of oxygen increased. Therefore, the surface changed from hydrophobic to hydrophilic. The threshold pressure for the SF6 plasma was ~130 Pa, whereas for the CF4 plasma it was slightly higher at ~200 Pa. This effect was explained by the electronegativity of both gases, especially SF6. At low pressures up to the threshold pressure, electrons can cause the full dissociation of gas molecules in plasma giving rise to a high concentration of fluorine radicals, which are responsible for surface fluorination. Because the density of fluorine in the plasma was high, the surface was fully saturated with the fluorine functional groups. At high pressures, the electron density and temperature decreased. Furthermore, they were also lost by electron attachment; therefore, the gas dissociation was weak, thus causing poor surface reactions.
Acknowledgments
The authors acknowledge the financial support from the Slovenian Research Agency (research core funding No. P2-0082) as well as the Young researcher grant.
Author Contributions
Matic Resnik designed the experiments and performed the plasma treatment under the supervision of Alenka Vesel and Miran Mozetic; Alenka Vesel performed the surface characterization of the samples; Rok Zaplotnik performed the plasma characterization; Alenka Vesel and Miran Mozetic analysed the data and wrote the paper.
Conflicts of Interest
The authors declare no conflicts of interest.
References
- Barni, R.; Riccardi, C.; Selli, E.; Massafra, M.R.; Marcandalli, B.; Orsini, F.; Poletti, G.; Meda, L. Wettability and dyeability modulation of poly(ethylene terephthalate) fibers through cold SF6 plasma treatment. Plasma Process. Polym. 2005, 2, 64–72. [Google Scholar] [CrossRef]
- Korotkov, R.Y.; Goff, T.; Ricou, P. Fluorination of polymethylmethacrylate with SF6 and hexafluoropropylene using dielectric barrier discharge system at atmospheric pressure. Surf. Coat. Technol. 2007, 201, 7207–7215. [Google Scholar] [CrossRef]
- Mangindaan, D.; Kuo, C.-C.; Lin, S.-Y.; Wang, M.-J. The diffusion-reaction model on the wettability gradient created by SF6 plasma. Plasma Process. Polym. 2012, 9, 808–819. [Google Scholar] [CrossRef]
- Mangindaan, D.; Kuo, W.-H.; Wang, Y.-L.; Wang, M.-J. Experimental and numerical modeling of the controllable wettability gradient on poly(propylene) created by SF6 plasma. Plasma Process. Polym. 2010, 7, 754–765. [Google Scholar] [CrossRef]
- Mrad, O.; Saloum, S.; Al-Mariri, A. Effect of a new low pressure SF6 plasma sterilization system on polymeric devices. Vacuum 2013, 88, 11–16. [Google Scholar] [CrossRef]
- Walton, S.G.; Lock, E.H.; Ni, A.; Baraket, M.; Fernsler, R.F.; Pappas, D.D.; Strawhecker, K.E.; Bujanda, A.A. Study of plasma-polyethylene interactions using electron beam-generated plasmas produced in Ar/SF6 mixtures. J. Appl. Polym. Sci. 2010, 117, 3515–3523. [Google Scholar] [CrossRef]
- Selli, E.; Mazzone, G.; Oliva, C.; Martini, F.; Riccardi, C.; Barni, R.; Marcandalli, B.; Massafra, M.R. Characterisation of poly(ethylene terephthalate) and cotton fibres after cold SF6 plasma treatment. J. Mater. Chem. 2001, 11, 1985–1991. [Google Scholar] [CrossRef]
- Barni, R.; Zanini, S.; Beretta, D.; Riccardi, C. Experimental study of hydrophobic/hydrophilic transition in SF6 plasma interaction with polymer surfaces. Eur. Phys. J.-Appl. Phys. 2007, 38, 263–268. [Google Scholar] [CrossRef]
- Chen, Q.W.; Wang, Z.Y.; Tan, Z.M.; Liu, L.T. Characterization of reactive ion etching of benzocyclobutente in SF6/O2 plasmas. Microelectron. Eng. 2010, 87, 1945–1950. [Google Scholar] [CrossRef]
- Joubert, O.; Pelletier, J.; Fiori, C.; Tan, T.A.N. Surface mechanisms in O2 and SF6 microwave plasma-etching of polymers. J. Appl. Phys. 1990, 67, 4291–4296. [Google Scholar] [CrossRef]
- Kim, S.H.; Woo, S.G.; Ahn, J.H. Effects of SF6 addition to O2 plasma on polyimide etching. Jpn. J. Appl. Phys. 2000, 39, 7011–7014. [Google Scholar] [CrossRef]
- Kim, G.S.; Steinbruchel, C. Plasma etching of benzocyclobutene in CF4/O2 and SF6/O2 plasmas. J. Vac. Sci. Technol. A 2006, 24, 424–430. [Google Scholar] [CrossRef]
- Gilliam, M.A. A Plasma Polymerization Investigation and Low Temperature Cascade Arc Plasma for Polymeric Surface Modification. Ph.D. Thesis, University of Missouri, Columbia, MO, USA, August 2006. [Google Scholar]
- Iriyama, Y.; Yasuda, H. Fundamental aspect and behavior of saturated fluorocarbons in glow-discharge in absence of potential source of hydrogen. J. Polym. Sci. Pol. Chem. 1992, 30, 1731–1739. [Google Scholar] [CrossRef]
- Strobel, M.; Corn, S.; Lyons, C.S.; Korba, G.A. Surface modification of polypropylene with CF4, CF3H, CF3Cl, and CF3Br plasmas. J. Polym. Sci. Pol. Chem. 1985, 23, 1125–1135. [Google Scholar] [CrossRef]
- Inagaki, N.; Katsuura, K. Glow-discharge polymerization of CF4/CH4 mixture investigated by infrared-spectroscopy and esca. J. Macromol. Sci. Chem. 1982, A18, 661–672. [Google Scholar] [CrossRef]
- Leonard, D.; Bertrand, P.; Khairallahabdelnour, Y.; Arefikhonsari, F.; Amouroux, J. Time-of-flight secondary-ion mass-spectrometry (ToF-SIMS) study of SF6 and SF6–CF4 plasma-treated low-density polyethylene films. Surf. Interface Anal. 1995, 23, 467–476. [Google Scholar] [CrossRef]
- Bi, X.P.; Crum, B.P.; Li, W. Super hydrophobic parylene-C produced by consecutive O2 and SF6 plasma treatment. J. Microelectromech. Syst. 2014, 23, 628–635. [Google Scholar] [CrossRef]
- Gorjanc, M.; Jazbec, K.; Šala, M.; Zaplotnik, R.; Vesel, A.; Mozetic, M. Creating cellulose fibres with excellent UV protective properties using moist CF4 plasma and ZnO nanoparticles. Cellulose 2014, 21, 3007–3021. [Google Scholar] [CrossRef]
- Vandencasteele, N.; Fairbrother, H.; Reniers, F. Selected effect of the ions and the neutrals in the plasma treatment of PTFE surfaces: An OES-AFM-contact angle and XPS study. Plasma Process. Polym. 2005, 2, 493–500. [Google Scholar] [CrossRef]
- Kim, Y.; Lee, Y.; Han, S.; Kim, K.-J. Improvement of hydrophobic properties of polymer surfaces by plasma source ion implantation. Surf. Coat. Technol. 2006, 200, 4763–4769. [Google Scholar] [CrossRef]
- Test, A.D. Critical Surface Tension and Contact Angle with Water for Various Polymers. Available online: https://www.accudynetest.com/polytable_03.html?sortby=contact_angle (accessed on 20 December 2017).
- Kokkoris, G.; Panagiotopoulos, A.; Goodyear, A.; Cooke, M.; Gogolides, E. A global model for SF6 plasmas coupling reaction kinetics in the gas phase and on the surface of the reactor walls. J. Phys. D Appl. Phys. 2009, 42. [Google Scholar] [CrossRef]
- Lallement, L.; Rhallabi, A.; Cardinaud, C.; Peignon-Fernandez, M.C.; Alves, L.L. Global model and diagnostic of a low-pressure SF6/Ar inductively coupled plasma. Plasma Sources Sci. Technol. 2009, 18. [Google Scholar] [CrossRef]
- Christophorou, L.G.; Olthoff, J.K. Electron interactions with SF6. J. Phys. Chem. Ref. Data 2000, 29, 267–330. [Google Scholar] [CrossRef]
- Hiroshi, F.; Isao, F.; Yoshinori, T.; Koji, E.; Kouichi, O. Plasma chemical behaviour of reactants and reaction products during inductively coupled CF4 plasma etching of SiO2. Plasma Sources Sci. Technol. 2009, 18. [Google Scholar] [CrossRef]
Figure 1.
Schematic diagram of the plasma system for sample treatment.

Figure 2.
Surface composition of the PET samples treated at various pressures, as determined by XPS: (a) treated in SF6 plasma and (b) treated in CF4 plasma. Two different regions regarding the surface composition are observed at low/high pressures. The values of the atom concentration at a pressure of 0 Pa correspond to the untreated sample.
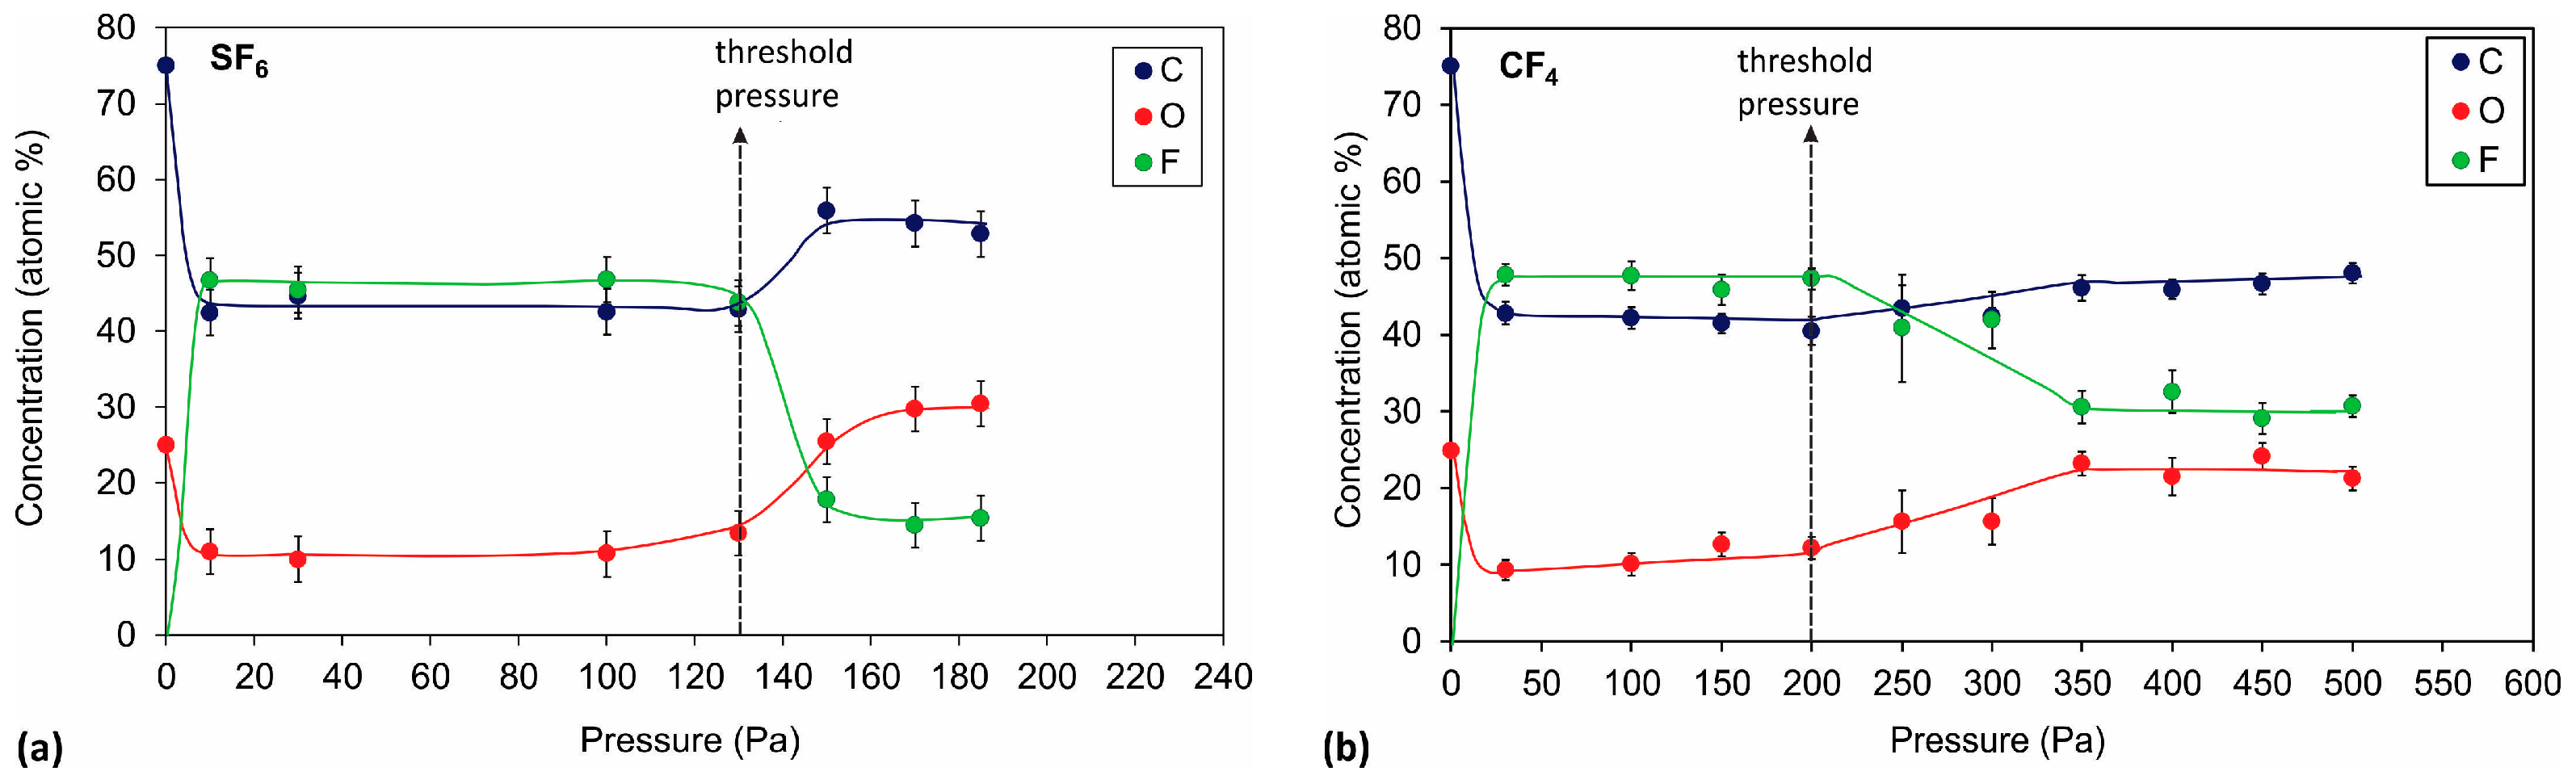
Figure 3.
Comparison of high-resolution spectra C 1s of samples treated at various SF6 pressures. A spectrum for the untreated PET is added for comparison.
Figure 3.
Comparison of high-resolution spectra C 1s of samples treated at various SF6 pressures. A spectrum for the untreated PET is added for comparison.

Figure 4.
Deconvolution of C 1s spectra: (a) below and (b) above the threshold pressure.

Figure 5.
Comparison of selected high-resolution C 1s spectra of the untreated PET sample and the plasma-treated samples in the first region, below the threshold pressure.
Figure 5.
Comparison of selected high-resolution C 1s spectra of the untreated PET sample and the plasma-treated samples in the first region, below the threshold pressure.

Figure 6.
Water contact angles for the samples treated in: (a) SF6 plasma and (b) CF4 plasma at various pressures.
Figure 6.
Water contact angles for the samples treated in: (a) SF6 plasma and (b) CF4 plasma at various pressures.

Figure 7.
OES spectra of SF6 plasma at various pressures: (a) below the threshold pressure and (b) above the threshold pressure.
Figure 7.
OES spectra of SF6 plasma at various pressures: (a) below the threshold pressure and (b) above the threshold pressure.

Figure 8.
OES intensity of the F emission line at 703 nm versus SF6 pressure.

Figure 9.
OES spectra of CF4 plasma at various pressures: (a) below the threshold pressure and (b) above the threshold pressure.
Figure 9.
OES spectra of CF4 plasma at various pressures: (a) below the threshold pressure and (b) above the threshold pressure.
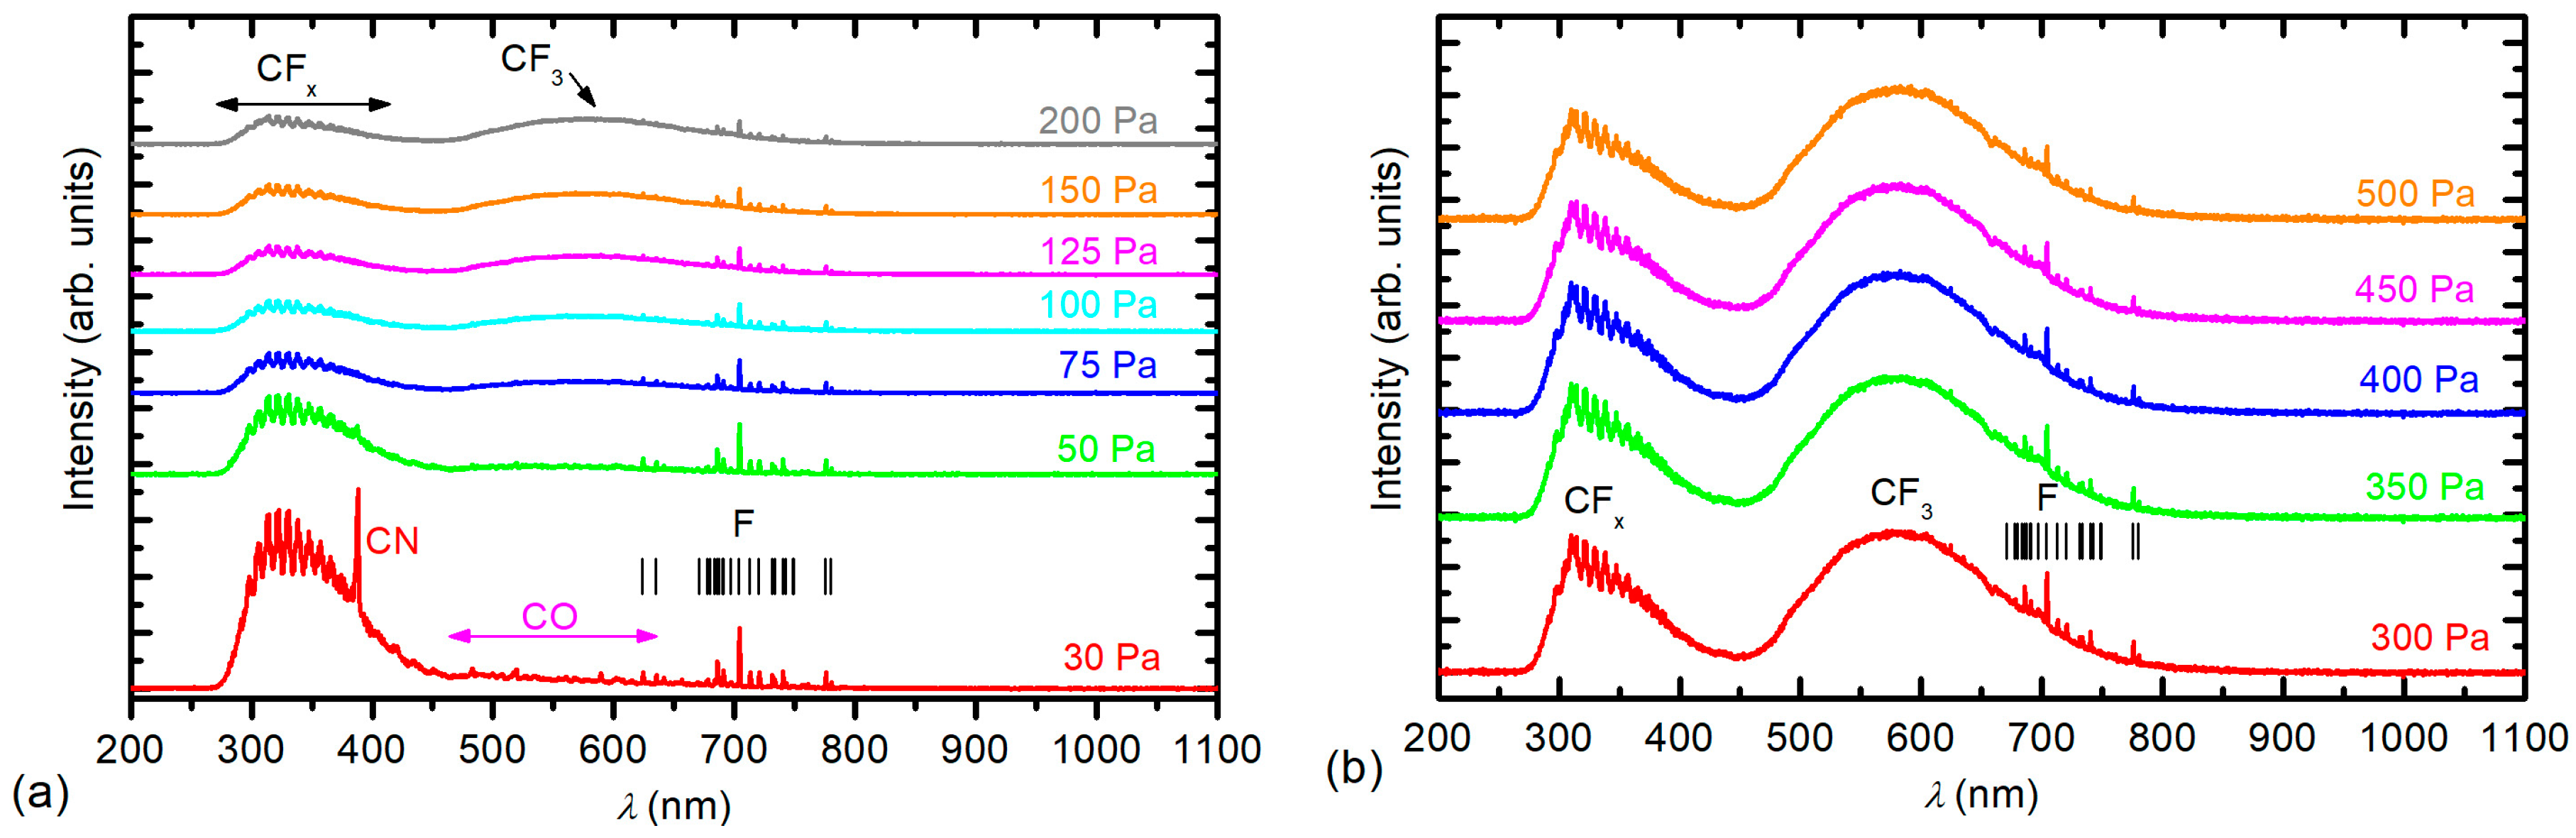
Figure 10.
OES intensity of the F emission line at 703 nm and the CF3 band at 580 nm versus CF4 pressure.
Figure 10.
OES intensity of the F emission line at 703 nm and the CF3 band at 580 nm versus CF4 pressure.
© 2018 by the authors. Licensee MDPI, Basel, Switzerland. This article is an open access article distributed under the terms and conditions of the Creative Commons Attribution (CC BY) license (http://creativecommons.org/licenses/by/4.0/).
Share and Cite
MDPI and ACS Style
Resnik, M.; Zaplotnik, R.; Mozetic, M.; Vesel, A. Comparison of SF6 and CF4 Plasma Treatment for Surface Hydrophobization of PET Polymer. Materials 2018, 11, 311. https://doi.org/10.3390/ma11020311
AMA Style
Resnik M, Zaplotnik R, Mozetic M, Vesel A. Comparison of SF6 and CF4 Plasma Treatment for Surface Hydrophobization of PET Polymer. Materials. 2018; 11(2):311. https://doi.org/10.3390/ma11020311
Chicago/Turabian StyleResnik, Matic, Rok Zaplotnik, Miran Mozetic, and Alenka Vesel. 2018. "Comparison of SF6 and CF4 Plasma Treatment for Surface Hydrophobization of PET Polymer" Materials 11, no. 2: 311. https://doi.org/10.3390/ma11020311
Note that from the first issue of 2016, this journal uses article numbers instead of page numbers. See further details here.