Multiferroic Core-Shell Nanofibers, Assembly in a Magnetic Field, and Studies on Magneto-Electric Interactions

 , and
, and 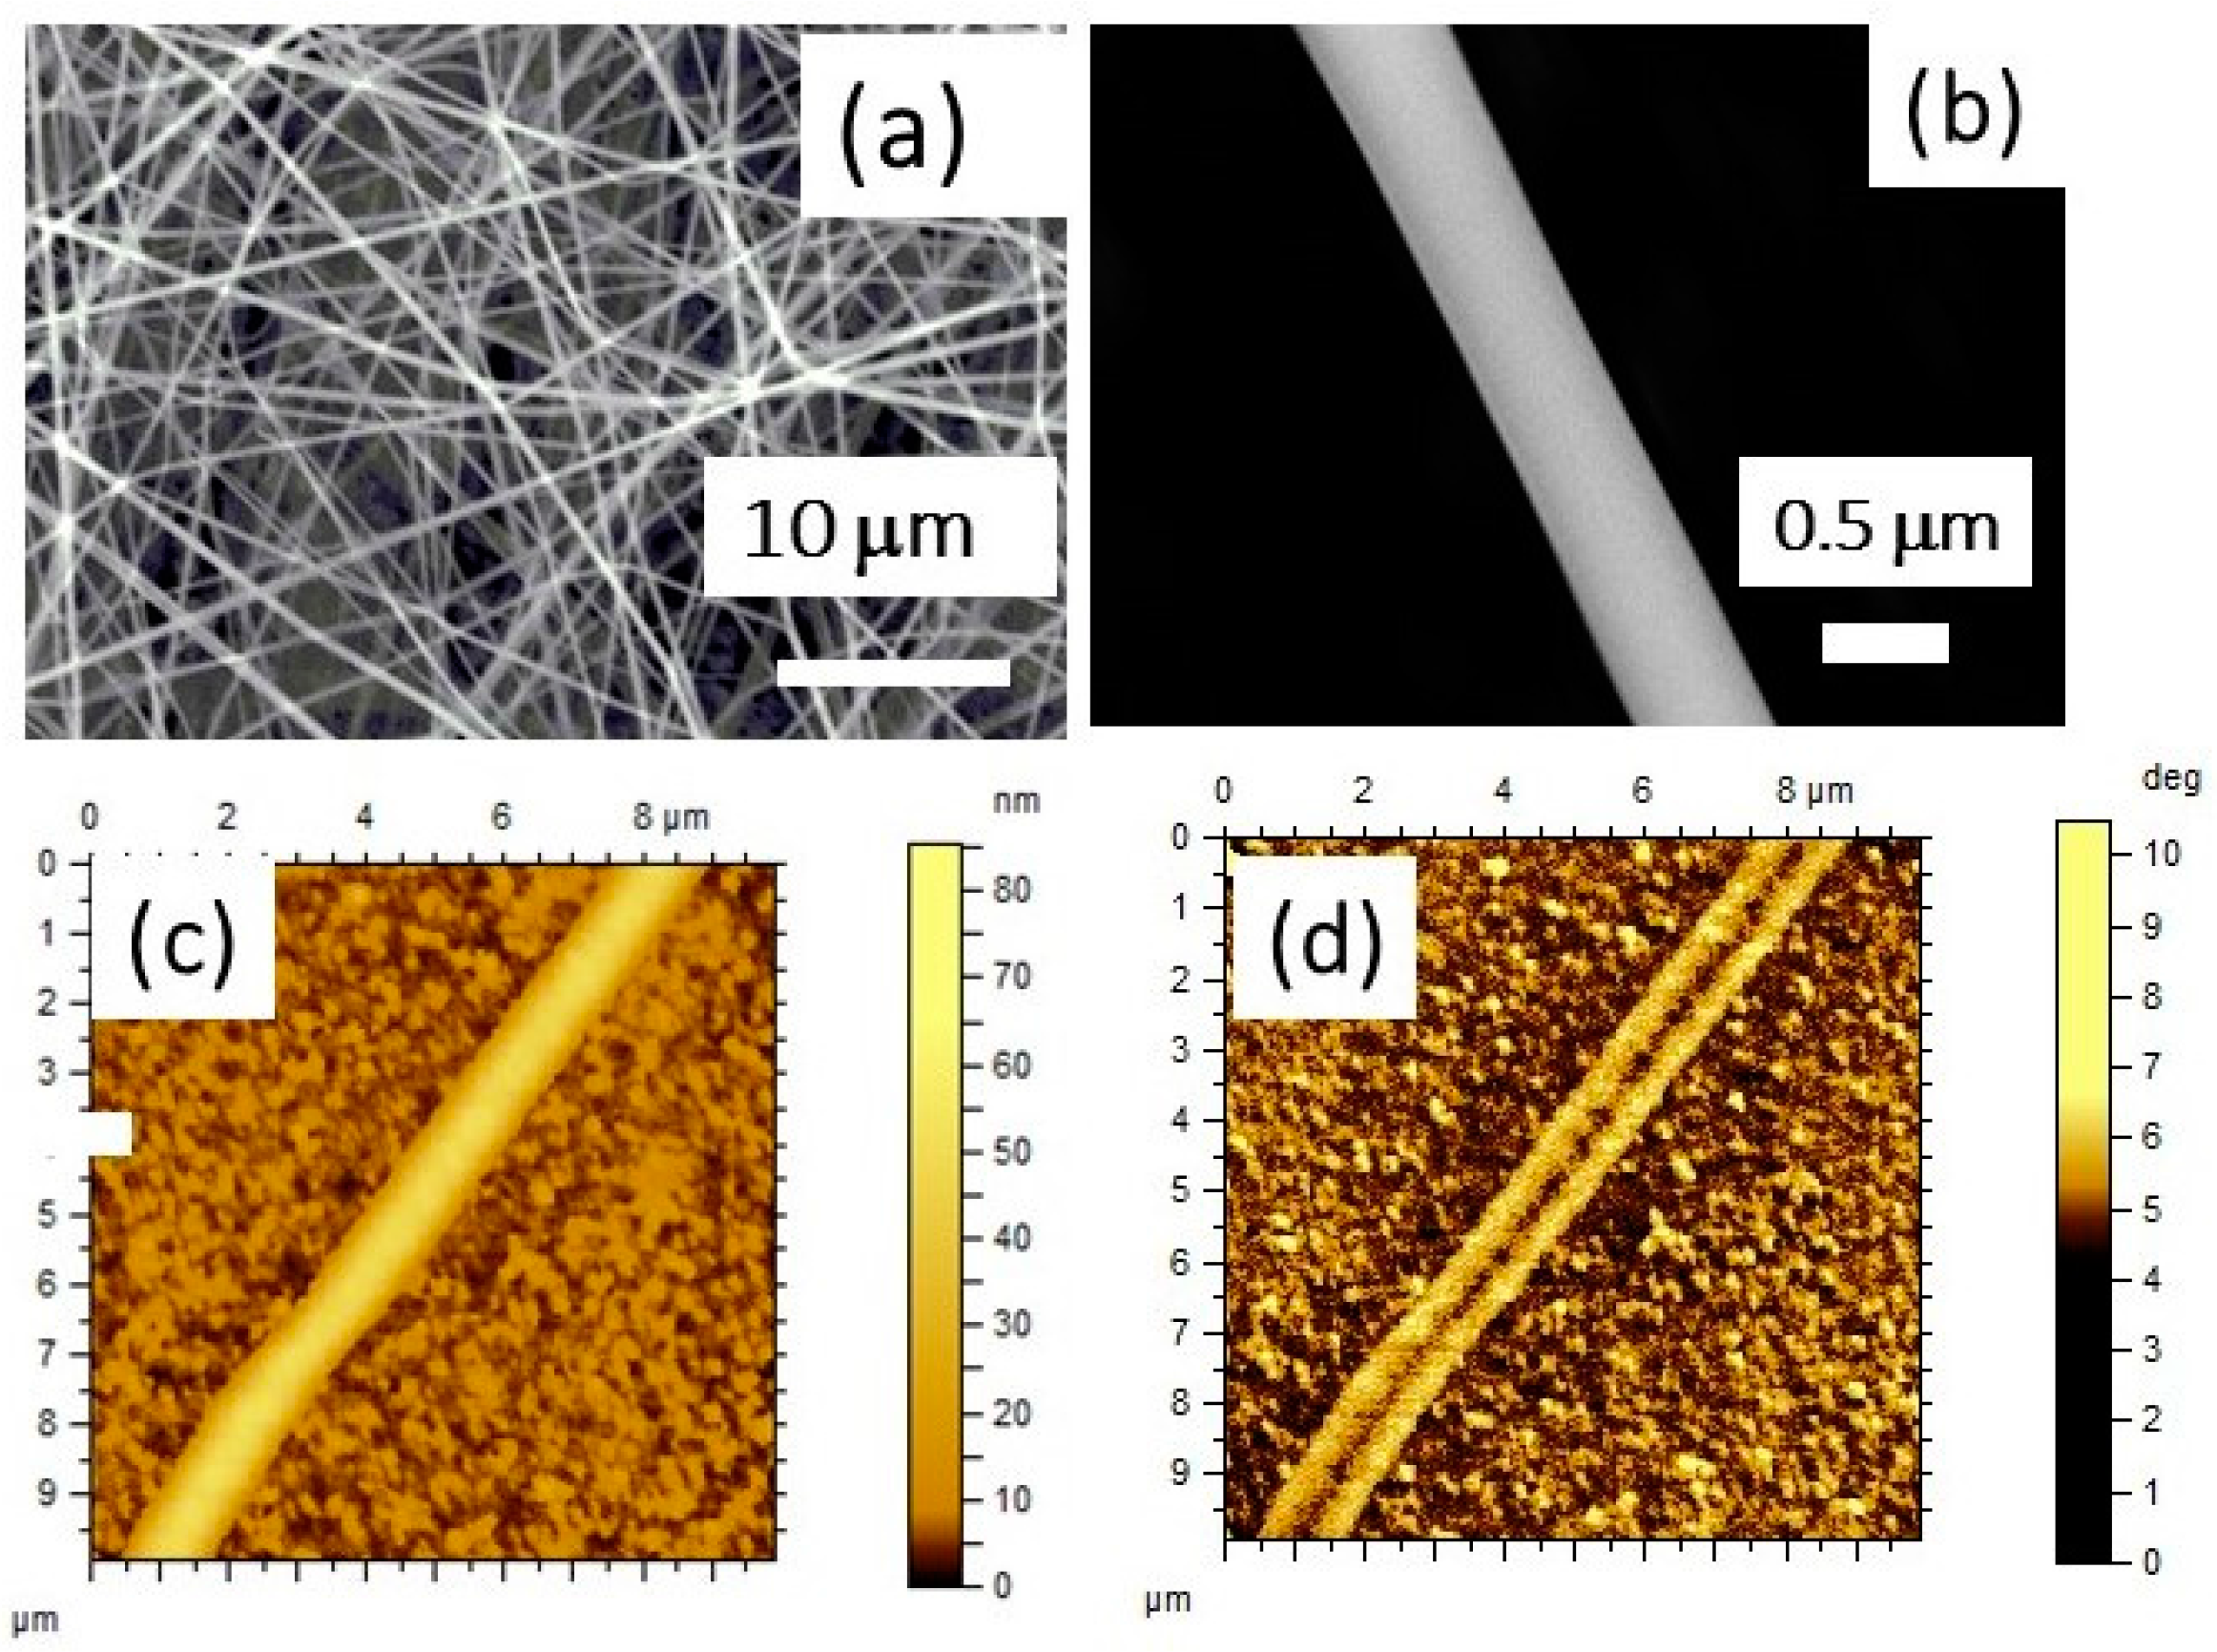
Abstract
:1. Introduction
2. Experiment
3. Results and Discussion
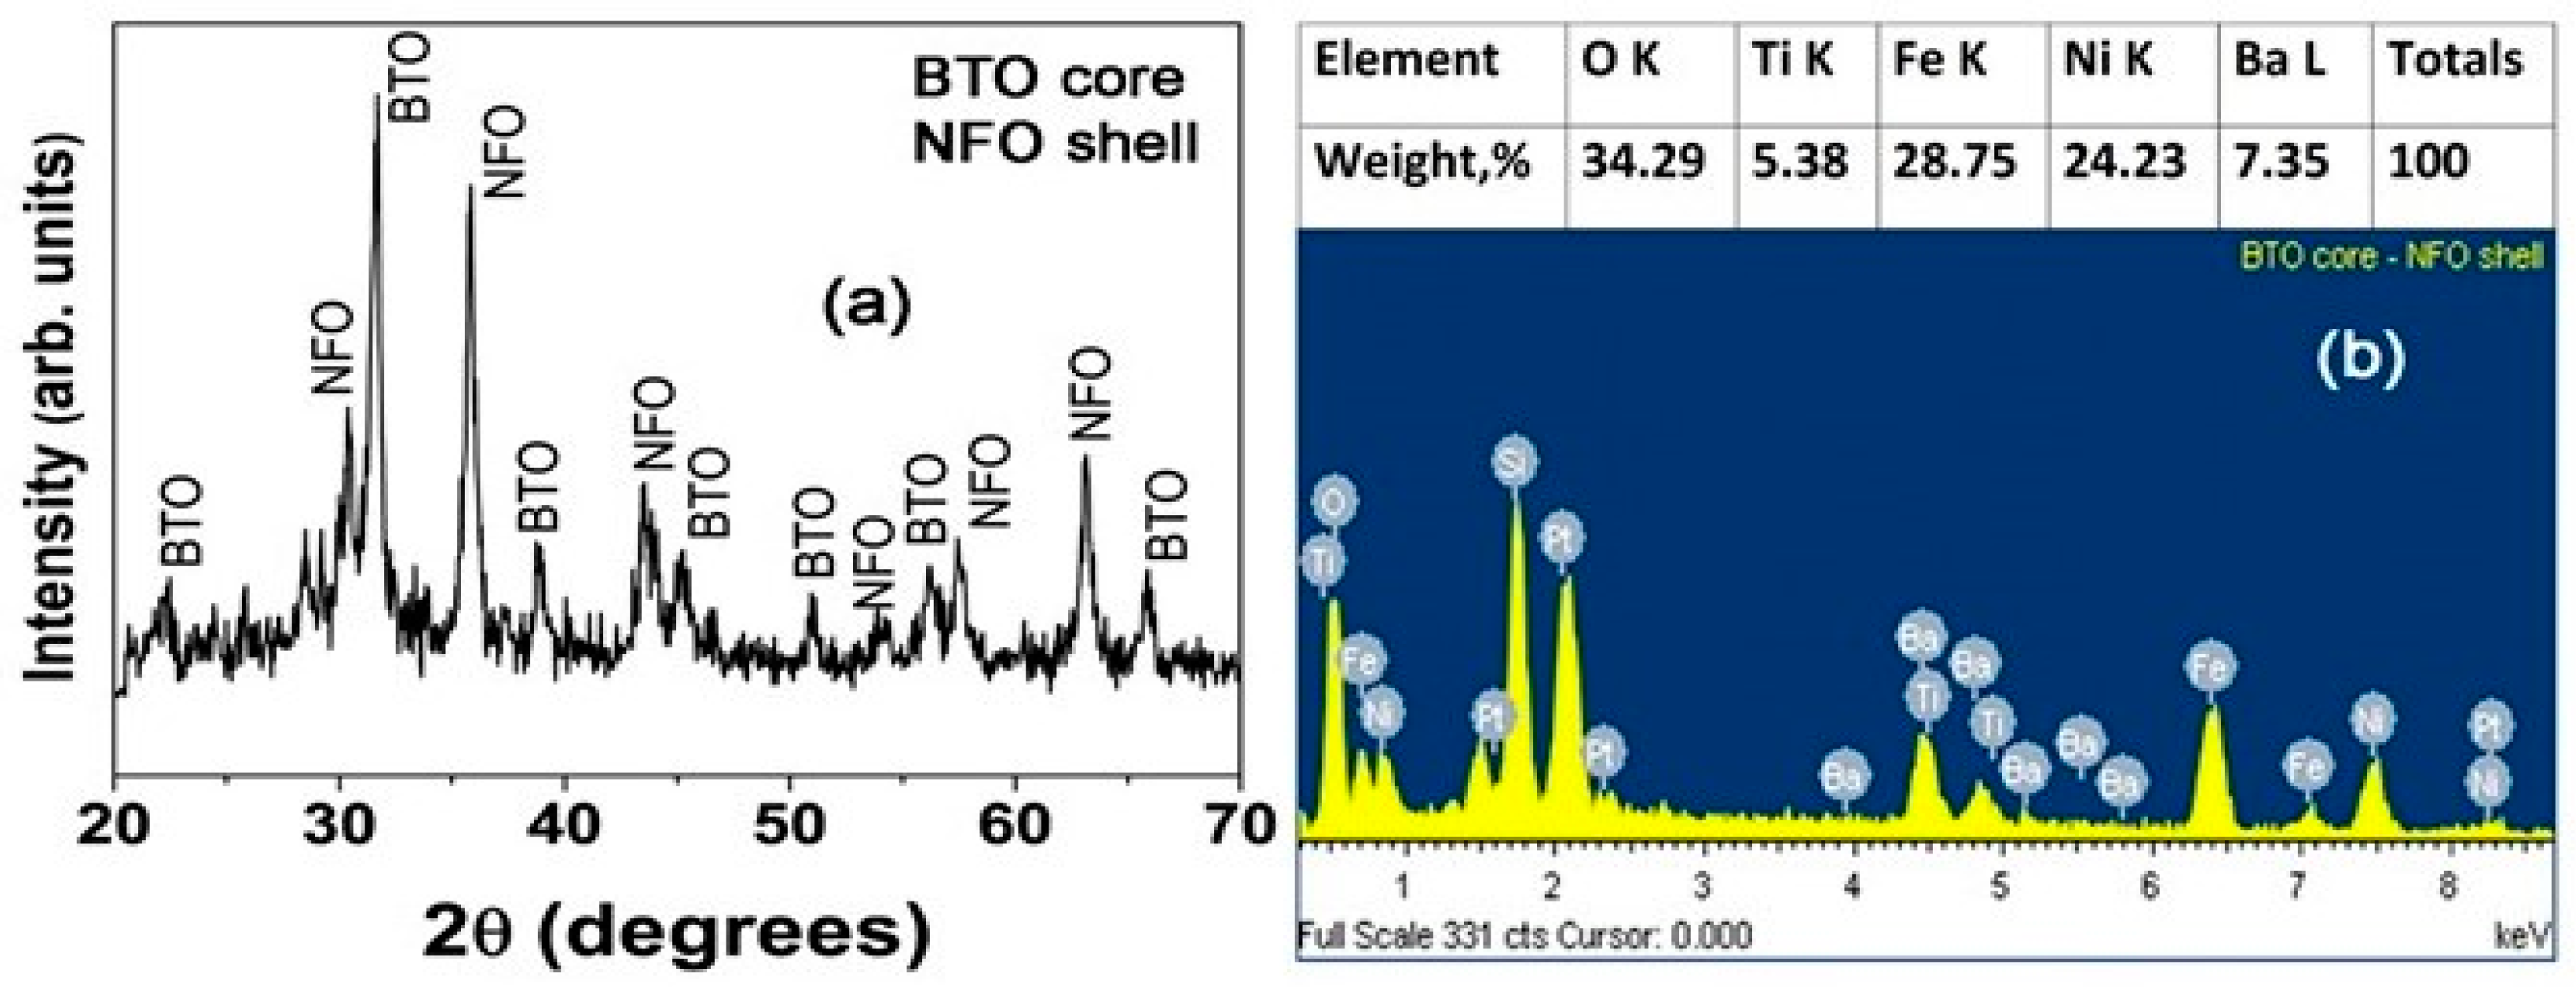
3.1. Structural Characterization
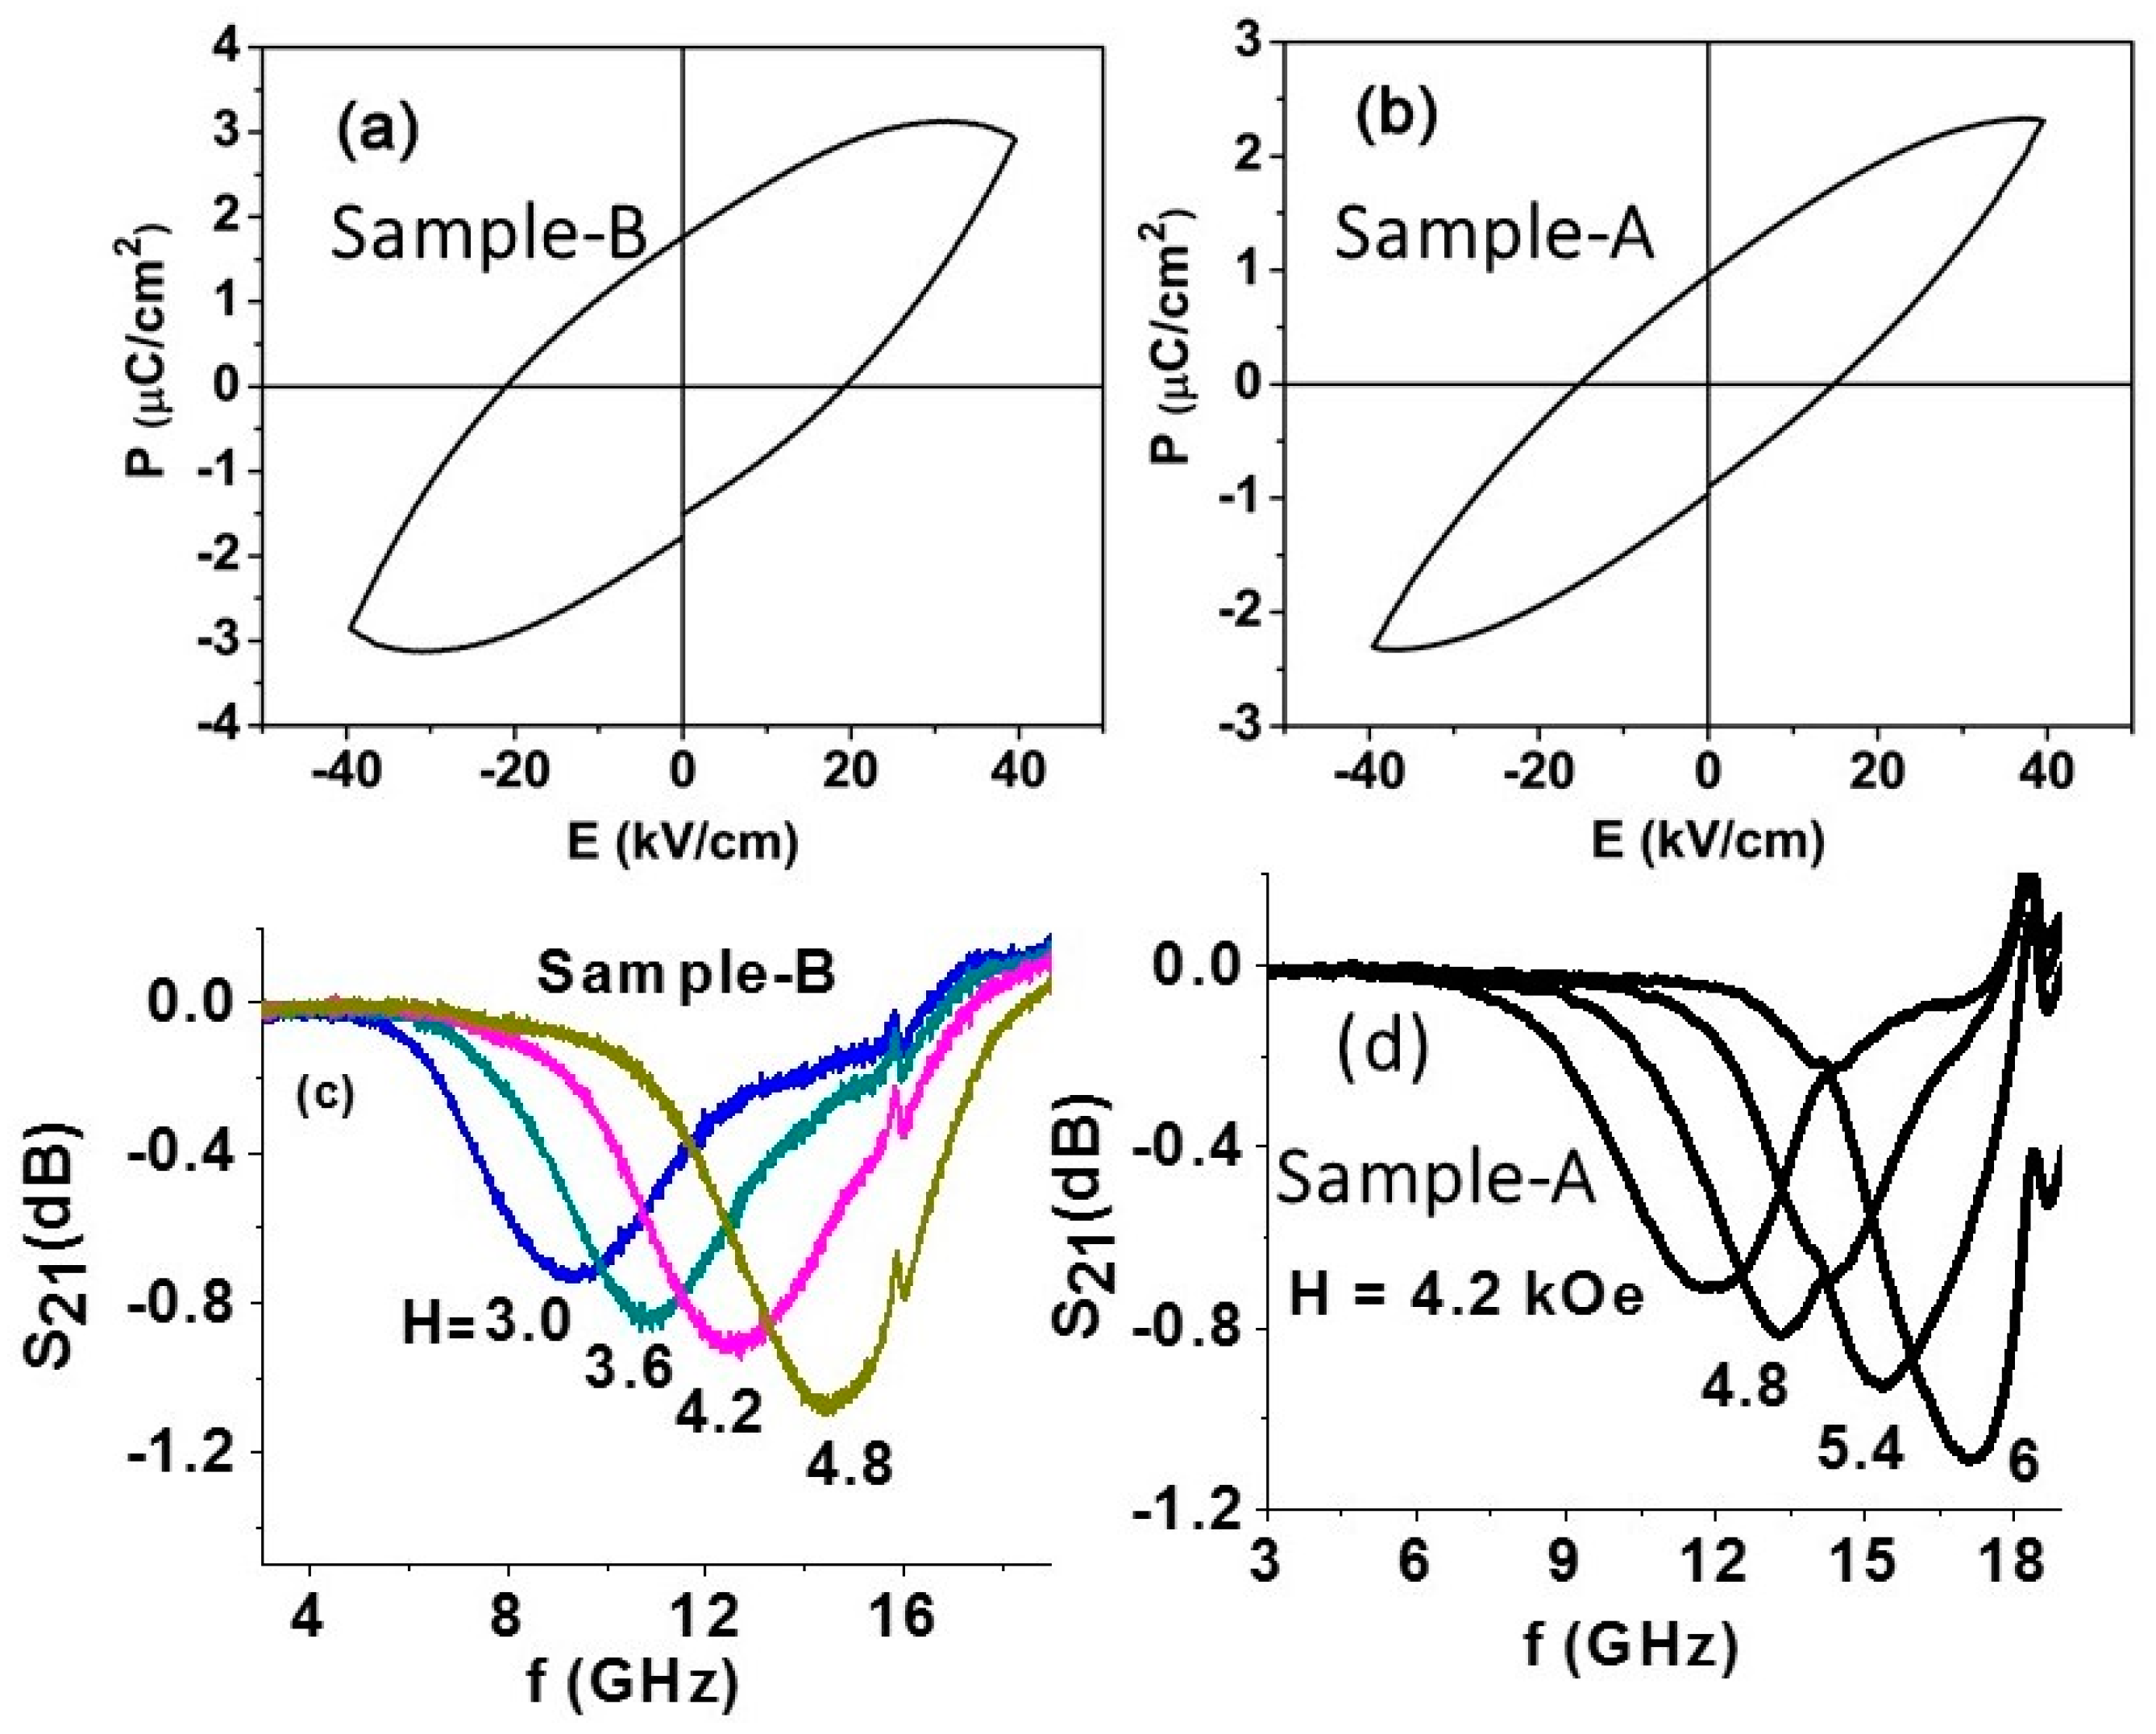
3.2. Ferroic Order Parameters
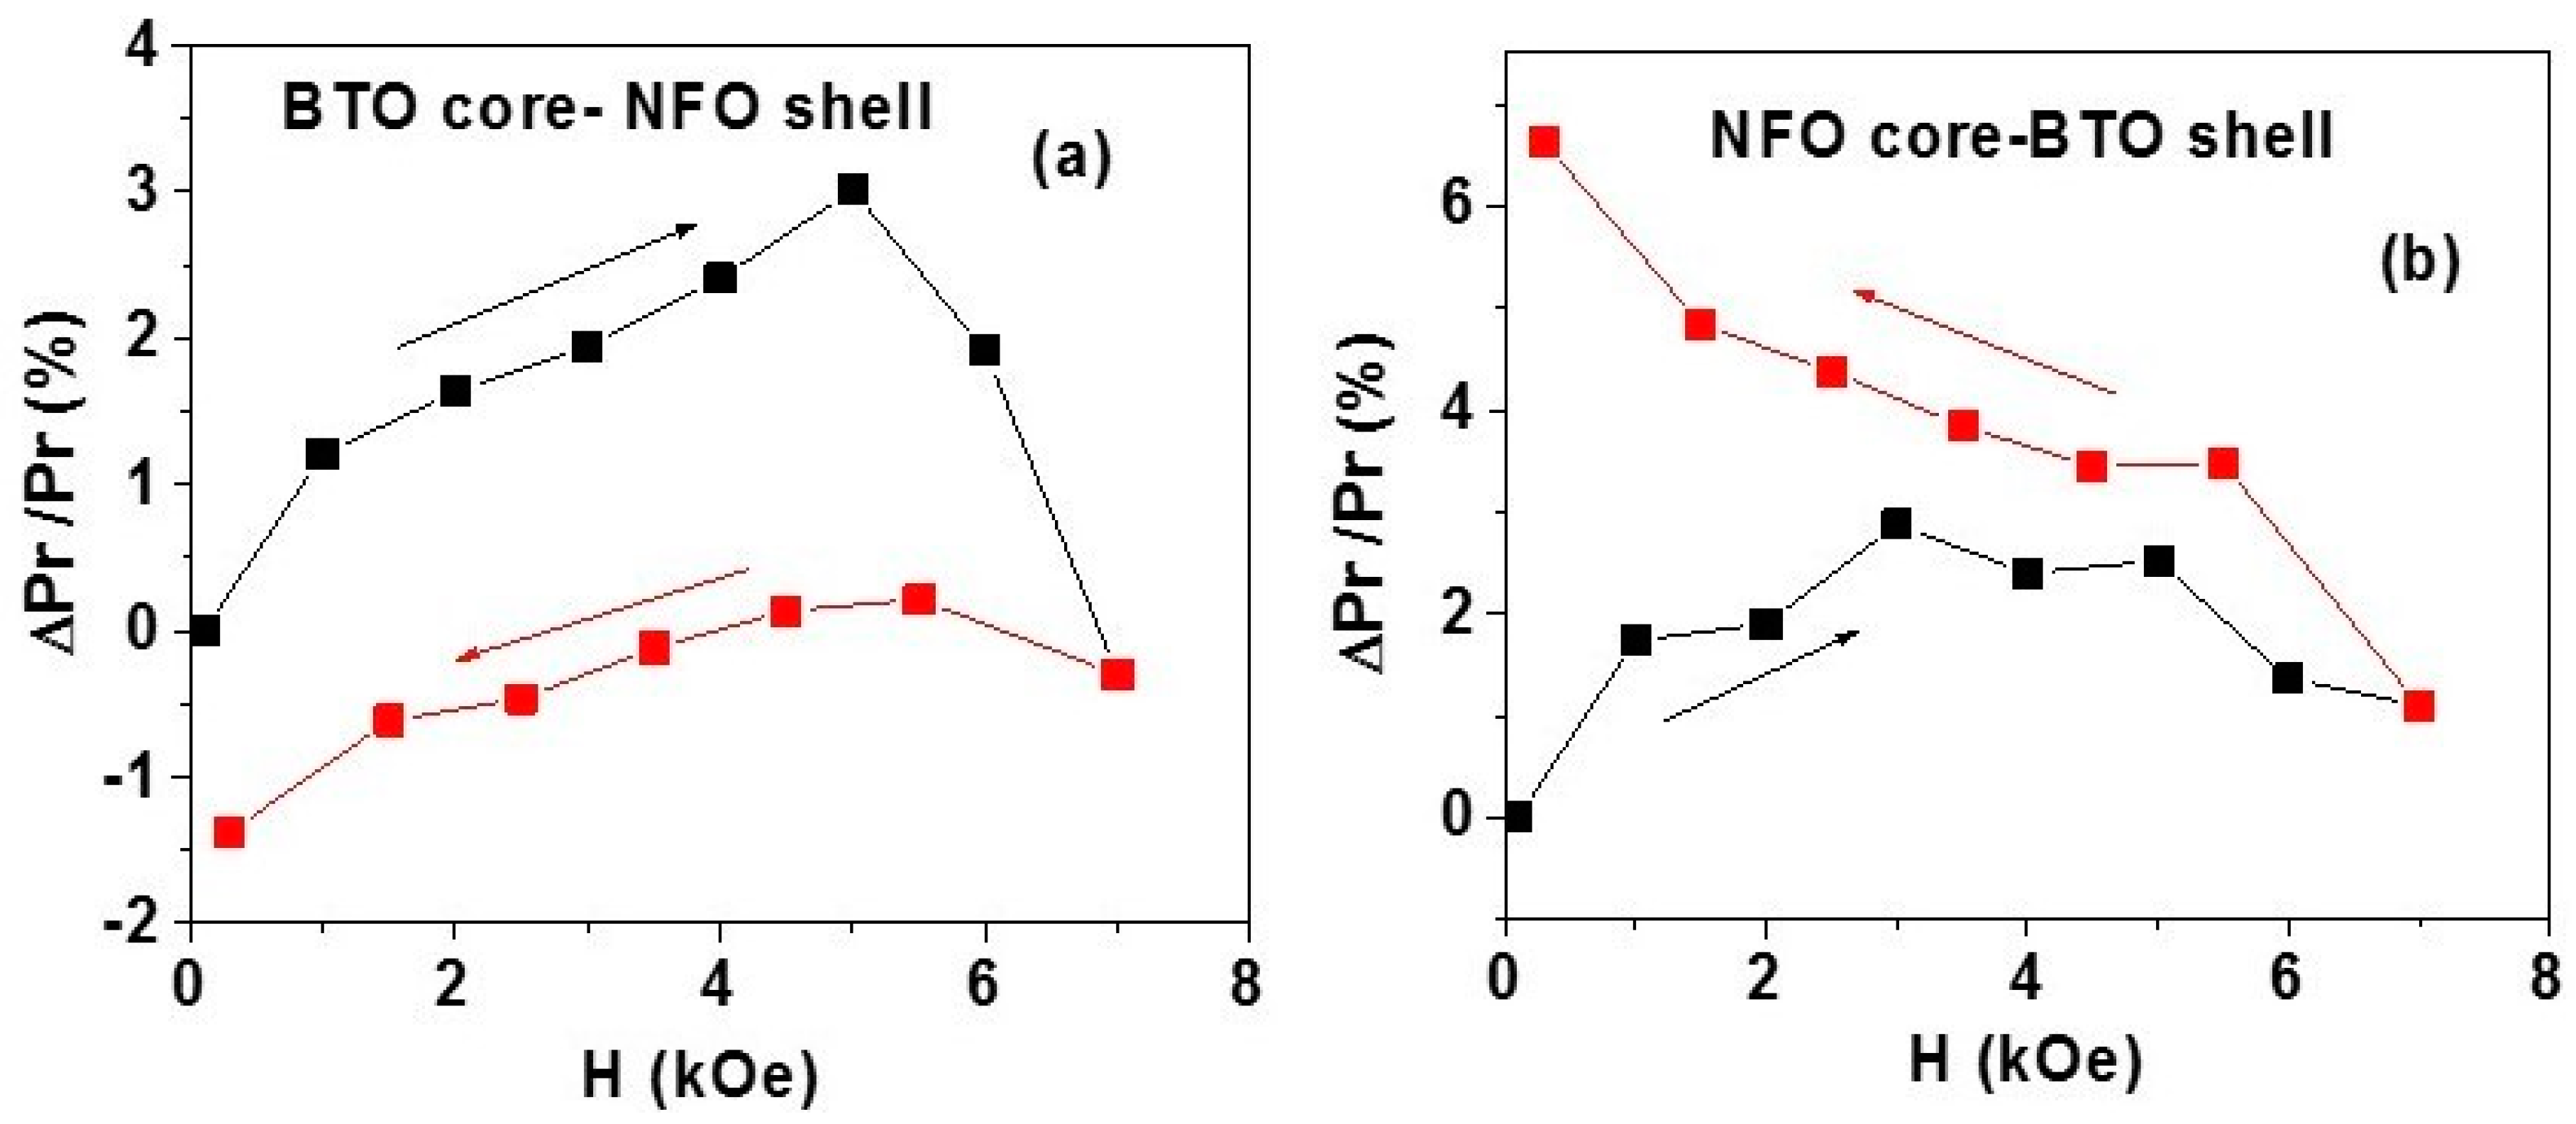
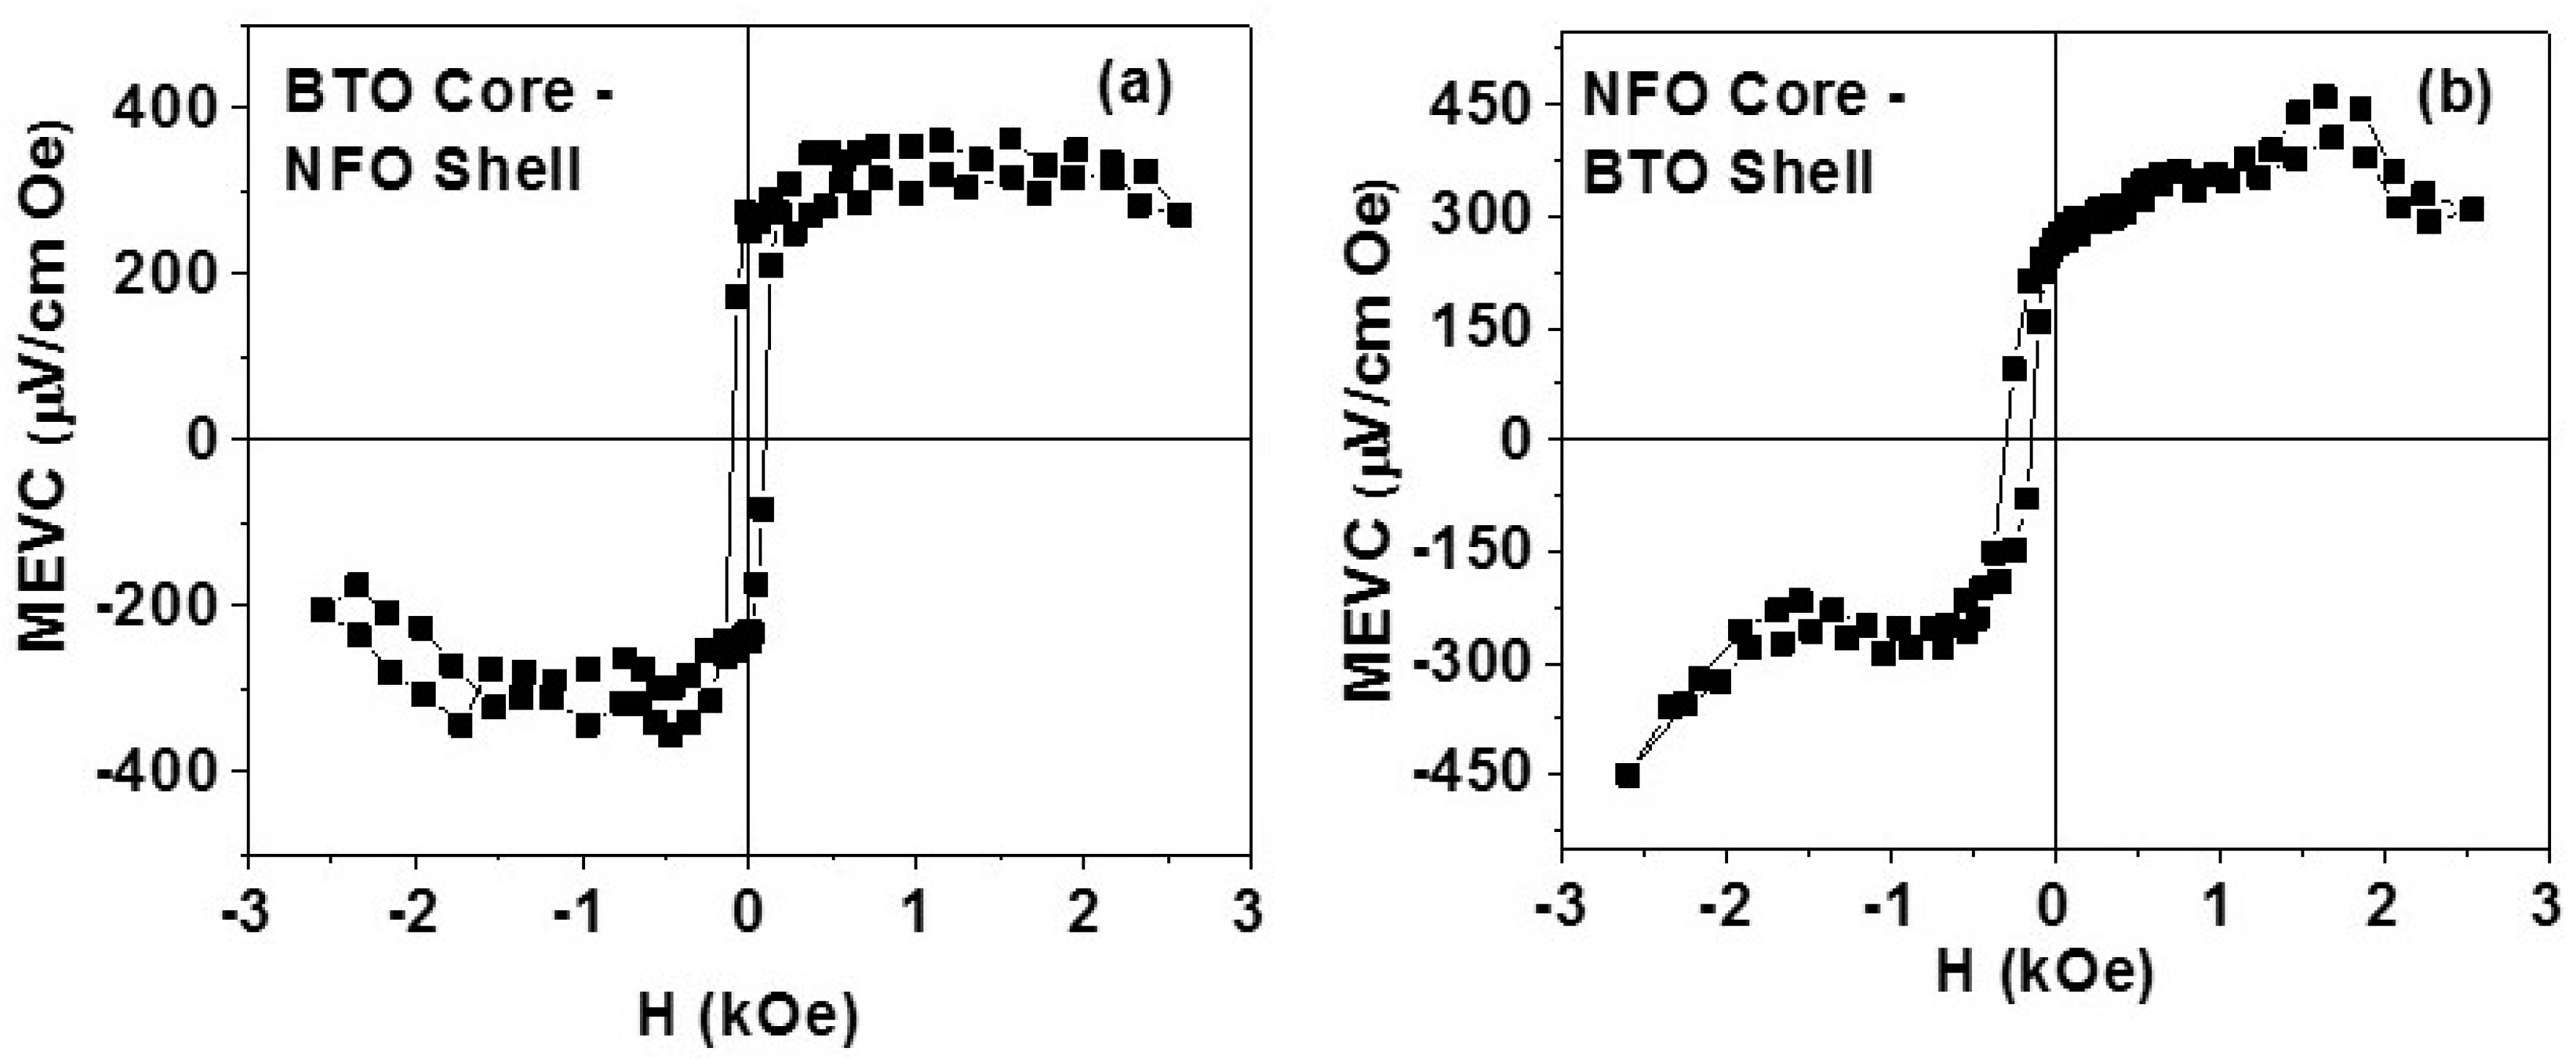
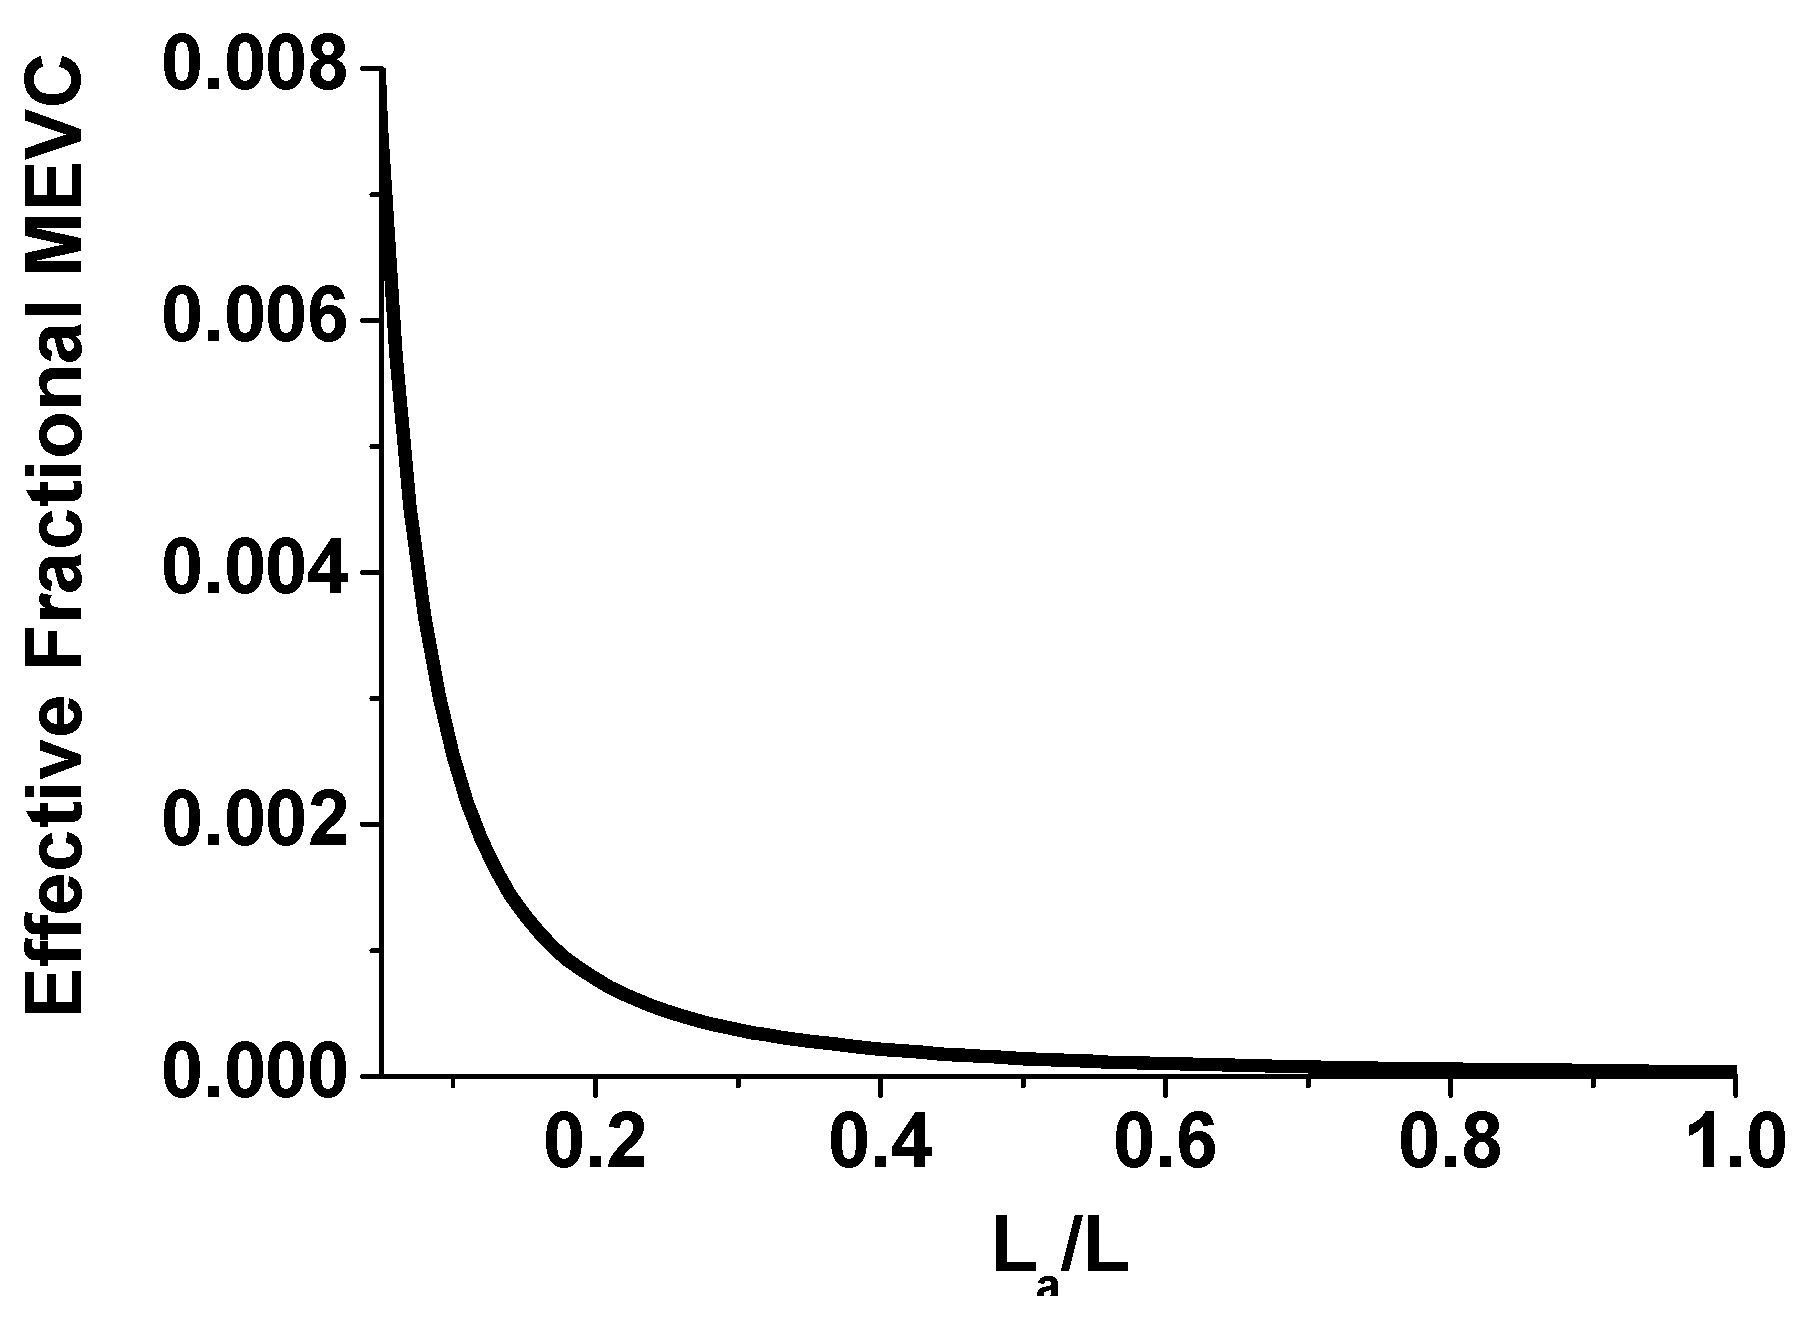
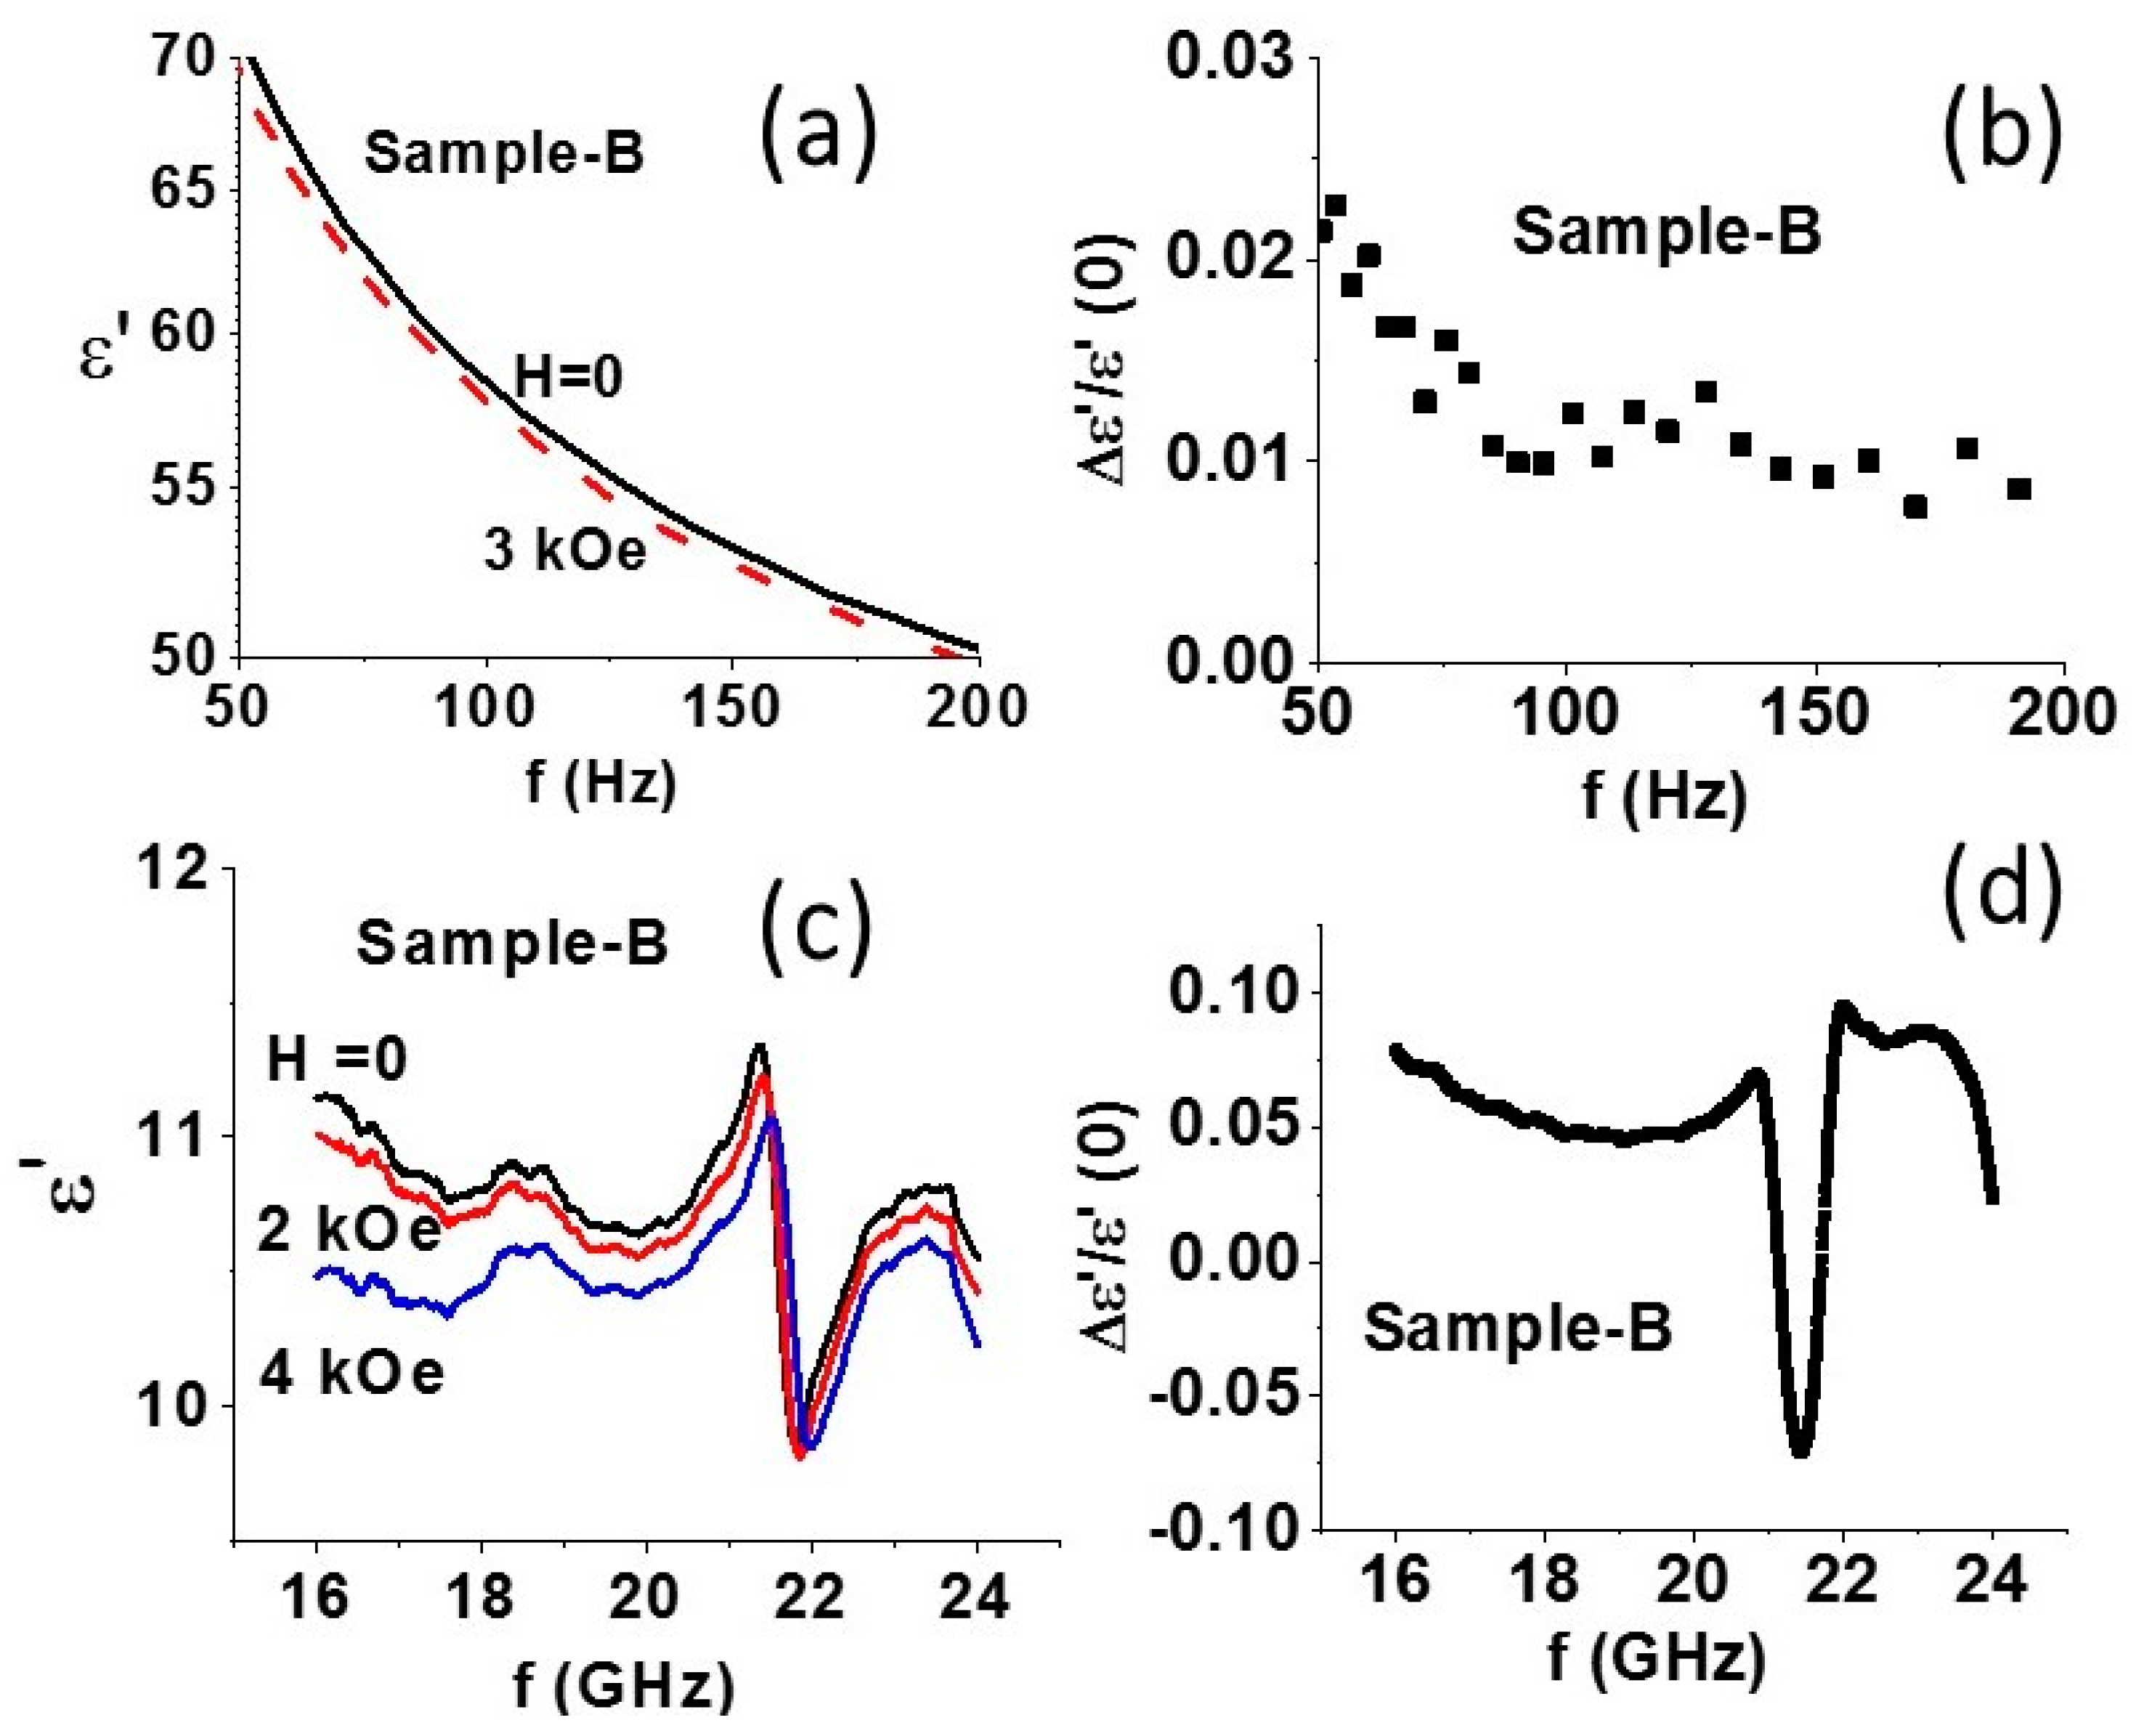
3.3. Magnetoelectric Interactions
4. Conclusions
Acknowledgments
Author Contributions
Conflicts of Interest
References
- Schmid, H. Some symmetry aspects of ferroics and single phase multiferroics. J. Phys. Condens. Matter 2008, 20, 434201. [Google Scholar] [CrossRef]
- Cheong, S.W.; Mostovoy, M. Multiferroics: A magnetic twist for ferroelectricity. Nat. Mater. 2007, 6, 13–20. [Google Scholar] [CrossRef] [PubMed]
- Ramesh, R.; Spaldin, N.A. Multiferroics: Progress and prospects in thin films. Nat. Mater. 2007, 6, 21–29. [Google Scholar] [CrossRef] [PubMed]
- Johnson, R.D.; Radaelli, P.G. Diffraction studies of multiferroics. Annu. Rev. Mater. Res. 2014, 44, 269–298. [Google Scholar] [CrossRef]
- Tokura, Y.; Seki, S.; Nagaosa, N. Multiferroics of spin origin. Rep. Prog. Phys. 2014, 77, 076501. [Google Scholar] [CrossRef] [PubMed]
- Scott, J.F. Room-temperature multiferroic magnetoelectrics. NPG Asia Mater. 2013, 5, e72. [Google Scholar] [CrossRef]
- Balbashov, A.M.; Ivanov, V.Y.; Mukhin, A.A.; Iskhakova, L.D.; Popov, Y.F.; Vorob’ev, G.P.; Voronchikhina, M.E. Magnetic and magnetoelectric properties of M-type substitution hexaferrites TScxFe12-x O19 (T = Ba,Sr). JETP Lett. 2015, 101, 489–496. [Google Scholar] [CrossRef]
- Nan, C.; Bichurin, M.I.; Dong, S.; Viehland, D.; Srinivasan, G. Multiferroic magnetoelectric composites: Historical perspective, status, and future directions. J. Appl. Phys. 2008, 103, 031101. [Google Scholar] [CrossRef]
- Ma, J.; Hu, J.; Li, Z.; Nan, C. Recent progress in multiferroic magnetoelectric composites: From bulk to thin films. Adv. Mater. 2011, 23, 1062–1087. [Google Scholar] [CrossRef] [PubMed]
- Sun, N.X.; Srinivasan, G. Voltage control of magnetism in multiferroic heterostructures and devices. SPIN 2012, 2, 1240004. [Google Scholar] [CrossRef]
- Zhai, J.; Xing, Z.; Dong, S.; Li, J.; Viehland, D. Magnetoelectric laminate composites: An overview. J. Am. Ceram. Soc. 2008, 91, 351–358. [Google Scholar] [CrossRef]
- Zhou, Y.; Maurya, D.; Yan, Y.; Srinivasan, G.; Quandt, E.; Priya, S. Self-biased magnetoelectric composites: An overview and future perspectives. Energy Harvest. Syst. 2016, 3, 1–42. [Google Scholar] [CrossRef]
- Van den Boomgaard, J.; Terrell, D.R.; Born, R.A.J. An in situ grown eutectic magnetoelectric composite material. J. Mater. Sci. 1974, 9, 1705–1709. [Google Scholar] [CrossRef]
- Van den Boomgaard, J.; Born, R.A.J. A sintered magnetoelectric composite material BaTiO3-Ni (Co, Mn) Fe2O4. J. Mater. Sci. 1978, 13, 1538–1548. [Google Scholar] [CrossRef]
- Harshe, G.; Dougherty, J.P.; Newnham, R.E. Theoretical modelling of multilayer magnetoelectric composites. Int. J. Appl. Electromagn. Mater. 1993, 4, 145. [Google Scholar]
- Lupeiko, T.G.; Lisnevskaya, I.V.; Chkheidze, M.D.; Zvyagintsev, B.I. Layered magnetoelectric composites based on nickel ferrite and lead zirconate-titanate materials. Inorg. Mater. 1995, 31, 1245–1248. [Google Scholar]
- Bai, F.; Zhang, H.; Li, J.; Viehland, D. Magnetic and magnetoelectric properties of as-deposited and annealed BaTiO3–CoFe2O4 nanocomposite thin films. J. Phys. D Appl. Phys. 2010, 43, 285002. [Google Scholar] [CrossRef]
- Gao, X.S.; Rodriguez, B.J.; Liu, L.F.; Birajdar, B.; Pantel, D.; Ziese, M.; Alexe, M.; Hesse, D. Microstructure and Properties of Well-Ordered Multiferroic Pb(Zr,Ti)O3/CoFe2O4Nanocomposites. ACS Nano 2010, 4, 1099–1107. [Google Scholar] [CrossRef] [PubMed]
- Buscaglia, M.T.; Buscaglia, V.; Curecheriu, L.; Postolache, P.; Mitoseriu, L.; Ianculescu, A.C.; Vasile, B.S.; Zhe, Z.; Nanni, P. Fe2O3@BaTiO3 Core−Shell Particles as Reactive Precursors for the Preparation of Multifunctional Composites Containing Different Magnetic Phases. Chem. Mater. 2010, 22, 4740–4748. [Google Scholar] [CrossRef]
- Zhao, S.Y.; Lee, D.K.; Kim, C.W.; Cha, H.G.; Kim, Y.H.; Kang, Y.S. Synthesis of Magnetic Nanoparticles of Fe3O4 and CoFe2O4 and Their Surface Modification by Surfactant Adsorption. Bull. Korean Chem. Soc. 2006, 27, 237. [Google Scholar]
- Koo, Y.S.; Song, K.M.; Hur, N.; Jung, J.H.; Jang, T.; Lee, H.J.; Koo, T.Y.; Jeong, Y.H.; Cho, J.H.; Jo, Y.H. Strain-induced magnetoelectric coupling in BaTiO3/Fe3O4 core/shell nanoparticles. Appl. Phys. Lett. 2009, 94, 032903. [Google Scholar] [CrossRef]
- Schileo, G. Recent developments in ceramic multiferroic composites based on core/shell and other heterostructures obtained by sol–gel routes. Prog. Solid State Chem. 2013, 41, 87. [Google Scholar] [CrossRef]
- Sreenivasulu, G.; Popov, M.; Chavez, F.A.; Hamilton, S.L.; Lehto, P.R.; Srinivasan, G. Controlled self-assembly of multiferroic core-shell nanoparticles exhibiting strong magneto-electric effects. Appl. Phys. Lett. 2014, 104, 052901. [Google Scholar] [CrossRef]
- Sreenivasulu, G.; Petrov, V.M.; Chavez, F.A.; Srinivasan, G. Superstructures of self-assembled multiferroic core-shell nanoparticles and studies on magneto-electric interactions. Appl. Phys. Lett. 2014, 105, 072905. [Google Scholar] [CrossRef]
- Srinivasan, G.; Popov, M.; Sreenivasulu, G.; Petrov, V.M.; Chavez, F. Millimeter-wave magneto-dielectric effects in self-assembled ferrite-ferroelectric core-shell nanoparticles. J. Appl. Phys. 2015, 117, 17A309. [Google Scholar] [CrossRef]
- Srinivasan, G.; Sreenivasulu, G.; Benoit, C.; Petrov, V.M.; Chavez, F. Magnetic field directed assembly of superstructures of ferrite-ferroelectric core-shell nanoparticles and studies on magneto-electric interactions. J. Appl. Phys. 2015, 117, 17B904. [Google Scholar] [CrossRef]
- Sreenivasulu, G.; Lochbiler, T.A.; Panda, M.; Srinivasan, G.; Chavez, F.A. Self-assembly of multiferroic core-shell particulate nanocomposites through DNA-DNA hybridization and magnetic field directed assembly of superstructures. AIP Adv. 2016, 6, 045202. [Google Scholar] [CrossRef]
- Hua, Z.H.; Yang, P.; Huang, H.B.; Wan, J.G.; Yu, Z.Z.; Yang, S.G.; Lu, M.; Gu, B.X.; Du, Y.W. Sol–gel template synthesis and characterization of magnetoelectric CoFe2O4/Pb(Zr0.52Ti0.48)O3nanotubes. Mater.Chem. Phys. 2008, 107, 541–546. [Google Scholar] [CrossRef]
- Liu, M.; Li, X.; Imrane, H.; Chen, Y.J.; Goodrich, T.; Cai, Z.H.; Ziemer, K.S.; Huang, J.Y.; Sun, N.X. Synthesis of ordered arrays of multiferroic NiFe2O4-Pb(Zr0.52Ti0.48)O3 core-shell nanowires. Appl. Phys. Lett. 2007, 90, 152501. [Google Scholar] [CrossRef]
- Yourdkhani, A.; Caruntu, G. Highly ordered transition metal ferrite nanotube arrays synthesized by template-assisted liquid phase deposition. J. Mater. Chem. 2011, 21, 7145–7153. [Google Scholar] [CrossRef]
- Laudenslager, M.J.; Sigmund, W.M. Developments in electrohydrodynamic forming: Fabricating nanomaterials from charged liquids via electrospinning and electrospraying. Am. Ceram. Soc. Bull. 2011, 90, 22–27. [Google Scholar]
- Xie, S.; Ma, F.; Liu, Y.; Li, J. Multiferroic CoFe2O4–Pb(Zr0.52Ti0.48)O3 core-shell nanofibers and their magnetoelectric coupling. Nanoscale 2011, 3, 3152–3158. [Google Scholar] [CrossRef] [PubMed]
- Xie, S.H.; Liu, Y.; Li, J. Synthesis, microstructures, and magnetoelectric couplings of electrospun multiferroic nanofibers. Front. Phys. 2012, 7, 399–407. [Google Scholar] [CrossRef]
- Sreenivasulu, G.; Popov, M.; Zhang, R.; Sharma, K.; Janes, C.; Mukundan, A.; Srinivasan, G. Magnetic field assisted self-assembly of ferrite-ferroelectric core-shell nanofibers and studies on magneto-electric interactions. Appl. Phys. Lett. 2014, 104, 052910. [Google Scholar] [CrossRef]
- McCann, J.T.; Chen, J.I.L.; Li, D.; Ye, Z.; Xia, Y. Electrospinning of polycrystalline barium titanate nanofibers with controllable morphology and alignment. Chem. Phys. Lett. 2006, 424, 162–166. [Google Scholar] [CrossRef]
- Yuh, J.; Nino, J.C.; Sigmund, W.M. Synthesis of barium titanate (BaTiO3) nanofibers via electrospinning. Mater. Lett. 2005, 59, 3645–3647. [Google Scholar] [CrossRef]
- Etier, M.; Antoniak, C.S.; Salamon, S.; Trivedi, H.; Gao, Y.; Nazrabi, A.; Landers, J.; Gautam, D.; Winterer, M.; Schmitz, D.; et al. Magnetoelectric coupling on multiferroic cobalt ferrite–barium titanate ceramic composites with different connectivity schemes. Acta Mater. 2015, 90, 1–9. [Google Scholar] [CrossRef] [Green Version]
- Landolt, H.; Börnstein, R. (Eds.) Landolt-Bornstein: Numerical Data and Functional Relationships in Science and Technology, Group III, Crystal and Solid State Physics, vol 4(b), Magnetic and Other Properties of Oxides; Springer: New York, NY, USA, 1970. [Google Scholar]
- Wang, D.; Ko, H.H. Magnetic-assisted self-assembly of rectangular-shaped parts. Sens. Actuators 2009, 151, 195–220. [Google Scholar] [CrossRef]
- Cheng, G.; Fraser, G.T.; Walker, A.R.H. Magnetic-field-induced assemblies of cobalt nanoparticles. Langmuir 2005, 21, 12055–12059. [Google Scholar] [CrossRef] [PubMed]
- Tracy, J.B.; Crawford, T.M. Magnetic field-directed self-assembly of magnetic nanoparticles. MRS Bull. 2013, 38, 915–920. [Google Scholar] [CrossRef]
- Bichurin, M.I.; Petrov, V.M.; Srinivasan, G. Theory of low-frequency magnetoelectric coupling in magnetostrictive-piezoelectric bilayers. Phys. Rev. B 2003, 68, 054402. [Google Scholar] [CrossRef]
- Petrov, V.M.; Srinivasan, G.; Bichurin, M.I.; Gupta, A. Theory of magnetoelectric effects in ferrite piezoelectric nanocomposites. Phys. Rev. B 2007, 75, 224407. [Google Scholar] [CrossRef]
- Lawes, G.; Srinivasan, G. Introduction to magnetoelectric coupling and multiferroic films. J. Phys. D Appl. Phys. 2011, 44, 243001. [Google Scholar] [CrossRef]
- Singh, S.; Kumar, N.; Bhargava, R.; Sahni, M.; Sung, K.; Jung, J.H. Magnetodielectric effect in BaTiO3/ZnFe2O4 core/shell nanoparticles. J. Allyos Compd. 2014, 587, 437–441. [Google Scholar] [CrossRef]
- Zhang, J.X.; Dai, J.Y.; Lu, W.; Chan, H.L.W.; Wu, B.; Li, D.X. A novel nanostructure and multiferroic properties in Pb (Zr0. 52Ti0. 48)O3/CoFe2O4 nanocomposite films grown by pulsed-laser deposition. J. Phys. D Appl. Phys. 2008, 41, 235405. [Google Scholar] [CrossRef]
- Li, B.; Wang, C.; Zhang, W.; Hang, C.; Fei, J.; Wang, H. Fabrication of multiferroic Ba0.7Sr0.3TiO3–Ni0.8Zn0.2Fe2O4 composite nanofibers by electrospinning. Mater. Lett. 2013, 91, 55–58. [Google Scholar] [CrossRef]
- Caruntu, G.; Ypurdkhani, A.; Vopsaroiu, M.; Srinivasan, G. Probing the local strain-mediated magnetoelectric coupling in multiferroic nanocomposites by magnetic field-assisted piezoresponse force microscopy. Nanoscale 2012, 4, 3218–3227. [Google Scholar] [CrossRef] [PubMed] [Green Version]


© 2017 by the authors. Licensee MDPI, Basel, Switzerland. This article is an open access article distributed under the terms and conditions of the Creative Commons Attribution (CC BY) license (http://creativecommons.org/licenses/by/4.0/).
Share and Cite
Sreenivasulu, G.; Zhang, J.; Zhang, R.; Popov, M.; Petrov, V.; Srinivasan, G. Multiferroic Core-Shell Nanofibers, Assembly in a Magnetic Field, and Studies on Magneto-Electric Interactions. Materials 2018, 11, 18. https://doi.org/10.3390/ma11010018
Sreenivasulu G, Zhang J, Zhang R, Popov M, Petrov V, Srinivasan G. Multiferroic Core-Shell Nanofibers, Assembly in a Magnetic Field, and Studies on Magneto-Electric Interactions. Materials. 2018; 11(1):18. https://doi.org/10.3390/ma11010018
Chicago/Turabian StyleSreenivasulu, Gollapudi, Jitao Zhang, Ru Zhang, Maksym Popov, Vladimir Petrov, and Gopalan Srinivasan. 2018. "Multiferroic Core-Shell Nanofibers, Assembly in a Magnetic Field, and Studies on Magneto-Electric Interactions" Materials 11, no. 1: 18. https://doi.org/10.3390/ma11010018