Counting the Photons: Determining the Absolute Storage Capacity of Persistent Phosphors
by
 , ,
, ,
David Van der Heggen
1 ,
,
Jonas J. Joos
1,
Diana C. Rodríguez Burbano
2,
John A. Capobianco
2 and
Philippe F. Smet
1,* 1
Lumilab, Department of Solid State Sciences, Ghent University, Krijgslaan 281 S1, 9000 Gent, Belgium
2
Department of Chemistry and Biochemistry and Center for Nanoscience Research, Concordia University, Montreal, QC H4B 1R6, Canada
*
Author to whom correspondence should be addressed.
Materials 2017, 10(8), 867; https://doi.org/10.3390/ma10080867
Submission received: 29 June 2017
/
Revised: 16 July 2017
/
Accepted: 24 July 2017
/
Published: 28 July 2017
(This article belongs to the Special Issue Techniques and Methods for Advanced Characterization of Luminescent Materials)
Abstract
:The performance of a persistent phosphor is often determined by comparing luminance decay curves, expressed in cd/m. However, these photometric units do not enable a straightforward, objective comparison between different phosphors in terms of the total number of emitted photons, as these units are dependent on the emission spectrum of the phosphor. This may lead to incorrect conclusions regarding the storage capacity of the phosphor. An alternative and convenient technique of characterizing the performance of a phosphor was developed on the basis of the absolute storage capacity of phosphors. In this technique, the phosphor is incorporated in a transparent polymer and the measured afterglow is converted into an absolute number of emitted photons, effectively quantifying the amount of energy that can be stored in the material. This method was applied to the benchmark phosphor SrAlO:Eu,Dy and to the nano-sized phosphor CaS:Eu. The results indicated that only a fraction of the Eu ions (around 1.6% in the case of SrAlO:Eu,Dy) participated in the energy storage process, which is in line with earlier reports based on X-ray absorption spectroscopy. These findings imply that there is still a significant margin for improving the storage capacity of persistent phosphors.

1. Introduction
An important class of luminescent materials, usually referred to as persistent or afterglow phosphors, possess the capability to store energy for a period of time. This energy is stored during the charging of the phosphor, typically achieved by irradiation with blue or near-UV (ultraviolet) light, after which it is gradually released, manifesting itself as delayed emission. The field of persistent luminescent materials gained importance with the discovery of SrAlO:Eu,Dy by Matsuzawa et al. [1], replacing ZnS:Cu,Co [2] as the benchmark afterglow phosphor. This green emitting phosphor shows afterglow for several hours after the excitation has stopped, and has been extensively investigated [3,4,5]. Two decades after the discovery by Matsuzawa et al., the list of afterglow phosphors has grown, and in addition to the alkaline earth aluminates it now also includes, among others, silicates and sulfides doped with a wide variety of activators, such as Eu [6], Ce [7,8] or transition metal ions [9]. An important class of these materials are the red- and infrared-emitting persistent phosphors, which are quite scarce compared to other classes, but are highly desired in diverse applications, such as bioimaging and safety signage. These phosphors are expected to exhibit efficient afterglow and are often based on the luminescence of transition metal ions [10,11,12].
A well-studied, red-emitting phosphor that is not based on transitions metals is CaS:Eu. Although this sulfide, like many other sulfides, has a relatively poor chemical stability, its high luminescence efficiency and the limited broadness of the emission spectrum led researchers to suggest that this phosphor could be applied as a white LED (light-emitting diode) phosphor. This claim was further supported by the discovery of the color tunability of the Eu emission in the CaSrS solid solution [13]. It was quickly found that the phosphor exhibits persistent luminescence when it is codoped with other lanthanides [14,15], which possibly paves the way for other applications. Recently it was reported that the persistent luminescence also arises in CaS:Eu if the grain size of the powder is reduced to a few hundred nanometers [16]. The dimensions of the grains in the nano-sized regime, in combination with the spectral location of the emission, provides the phosphor with characteristics for applications such as optical imaging in biomedicine. However, the surface must be functionalized in order to render the nanoparticles stable in aqueous media [17,18,19].
The performance of persistent phosphors is often determined on the basis of luminance decay curves, which are usually measured for as long as the emission can be perceived by the dark-adapted eye [20]. Although this approach provides a relatively easy way to compare different persistent phosphors, the method also entails some problems.
Commonly, decay curves are presented in arbitrary units [21,22], allowing only for a comparison with other phosphors presented within the same work. Moreover, even if the decay curves are presented in the correct photometric units, a direct comparison concerning the trapping capabilities of different phosphors is not possible for reasons that are inherent to luminances and the way they are measured. A photometric measure such as the luminance depends strongly on the spectral shape of the emission, and, more specifically, on how it overlaps with the spectral eye sensitivity. This implies that two phosphors with a comparable storage capacity but a different emission spectrum can have very different luminances [23]. An extreme example is the infrared persistent phosphors, for which the emission does not overlap with the eye sensitivity curve; therefore they have a zero luminance by definition. Another drawback, which is often overlooked, originates from the fact that luminance measurements are usually performed on an infinitely thick sample, ensuring that the layer thickness of the powder is higher than the penetration depth of the excitation light. Although this approach guarantees that measurements on the same material are reproducible, it inhibits a meaningful comparison between different materials because variations in the penetration depth of the excitation light in different materials will lead to different amounts of phosphor being excited.
Transparent samples, such as ceramic or glass-ceramic phosphors, are notable examples for which a seemingly better performance in terms of persistent luminescence is achieved due to a marked increase in the penetration depth of light compared to polycrystalline powders. Typical examples are transparent ceramics of Cr or Ce activated garnets [24,25,26], (glass-)ceramics of SrAlO:Eu, Dy [27,28,29], near-infrared-emitting ZnGaO:Cr [30,31] and other oxide phosphors [10,32,33]. The luminance or radiance decay curve of a thick ceramic sample will remain above a pre-defined threshold for a much longer time than for a powder sample with a comparable storage capacity and trap depth distribution, making an objective comparison between powder and ceramic samples impossible unless the amount of excited phosphor material is well-controlled.
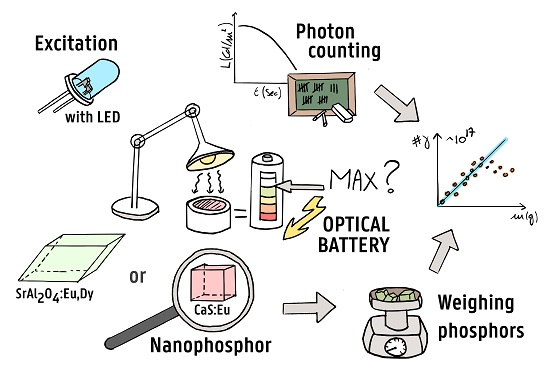
One way to overcome this drawback is to deposit the phosphor as a thin film with a thickness that is less than the penetration depth of the excitation light in that material. However, another approach that requires less-elaborate experimental conditions is to incorporate a well-known amount of the phosphor in a transparent polymer. This ensures that the luminescent material is sufficiently spread out, such that a homogeneous excitation of the phosphor is accomplished. The determination of the absolute storage capacity of the phosphor can then simply be accomplished by measuring the afterglow of this polymer layer and converting the decay profile into an absolute number of photons. This latter approach is used to estimate the amount of energy that can be stored in SrAlO:Eu,Dy and CaS:Eu nanoparticles. Figure 1 shows a schematic overview of the developed method to measure the absolute storage capacity of the phosphors in the polymer layer.
The storage capacity that is obtained in this way only takes into account the emptying of shallow traps that are responsible for the afterglow exhibited by the phosphors at room temperature. Deep traps that are not emptied at room temperature are therefore not taken into account. However, for many applications, such as safety signage, traffic markings [34,35], optical memory applications [36] or bio-imaging [17,37,38,39], these are exactly the traps that are considered to be useful. The use of external stimuli, such as temperature and infrared light, can, however, offer a way to expand this method to determine the full storage capacity of these phosphors. An accessible way to determine the total trapping capacity is needed, as it is an important property that defines the usability of the phosphors in many applications. In many cases, further improvement is still needed, which could, for example, lead to highly demanding applications such as traffic markings that emit light overnight, or bio-imaging phosphors that do not have the need to be recharged after injection [40,41].
2. Materials and Methods
The measurements have been performed on commercial SrAl:Eu,Dy (GloTech Intl.; Auckland, New Zealand; GT 8400, 0.88% Eu and 1.6% Dy) and on nano-sized CaS:Eu synthesized by the co-precipitation method. The phase purity of both phosphors was verified by powder X-ray (Cu K) diffraction measurements using a Siemens D5000 diffractometer. Details concerning the synthesis, characterization and structural properties of the CaS:Eu nanophosphor were described by Rodríguez Burbano et al. [16]. The phosphors were incorporated into a polymer layer by mixing an appropriate amount of the powders in a 20 wt% solution of kraton FG1901X in 3:1 toluene-to-methyl ethyl ketone, after which the mixture was cast on a circular glass plate with a diameter of 18 mm [42]. Care was taken to avoid the inclusion of air bubbles and to obtain a homogeneous phosphor loading over the glass plate area. After evaporation of the solvents at room temperature, a uniform phosphor-containing polymer layer was obtained (Figure 1a (top)).
Photoluminescence emission spectra were recorded using a ProEM1600 EMCCD camera attached to an Acton SP2300 monochromator (Princeton Instruments; Trenton, NJ, USA), which was intensity calibrated using a DH-2000-CAL calibration lamp (Ocean Optics; Dunedin, FL, USA). Afterglow measurements were performed using an ILT 1700 calibrated photometer (International Light Technologies; Peabody, MA, USA) equipped with a photopic filter (YPM). The samples were placed on a diffuse reflective BaSO-coated sample holder to enable detection of the light emitted in all directions. SrAl:Eu,Dy and CaS:Eu were excited using LEDs with a wavelength of 450 and 470 nm, respectively. A high-power infrared LED with a wavelength of 970 nm was used to induce optically stimulated luminescence (OSL; see Figure 1e) in CaS:Eu, and a low-pass filter ( nm) was used to block the stimulating light. Diffuse transmission spectra were recorded using a Varian Cary 500 UV-VIS-NIR spectrophotometer equipped with a 110 mm BaSO-coated integrating sphere.
3. Results
The photometric data from a luminance decay curve can be converted into an absolute number of photons by using Equation (1), whereby one converts the luminance reading to a photon stream by taking the luminance efficacy and the average photon energy into account and integrating over all emission angles:
Here, is the luminance as a function of time and solid angle in cd/m, A is the surface area of the sample, is the luminous efficacy of the emission spectrum in lm/W and is the average photon energy of the emission spectrum of the phosphor. It can readily be seen from this equation that information on the angular dependence of the emission is needed to perform the integration over the solid angle. In general, as a first approximation, flat and uniform surfaces such as the polymer layers may be considered to be Lambertian emitters. However, as it will be discussed later, a more accurate result can be obtained if the angular emission profile is measured.
Moreover, in addition to the information regarding the angular dependence of the emission, an emission spectrum is needed to determine the luminous efficacy and the average photon energy. The spectrum must be corrected for the instrument response to yield a photon flux per wavelength interval [43]. The luminous efficacy and the average photon energy can then be determined using Equations (2) and (3), in combination with the known eye sensitivity curve [23]:
where is the spectral radiant flux, which is related to the photon flux by dd. Care should be taken when converting a flux per wavelength interval into a flux per energy interval, as the relation in Equation (4) holds [44]:
The method outlined in this section was validated using the commercial SrAlO:Eu,Dy phosphor and was then applied to the CaS:Eu nanophosphor to demonstrate its versatility in determining the absolute storage capacity with relatively low experimental effort.
3.1. Validating the Method: SrAlO:Eu,Dy
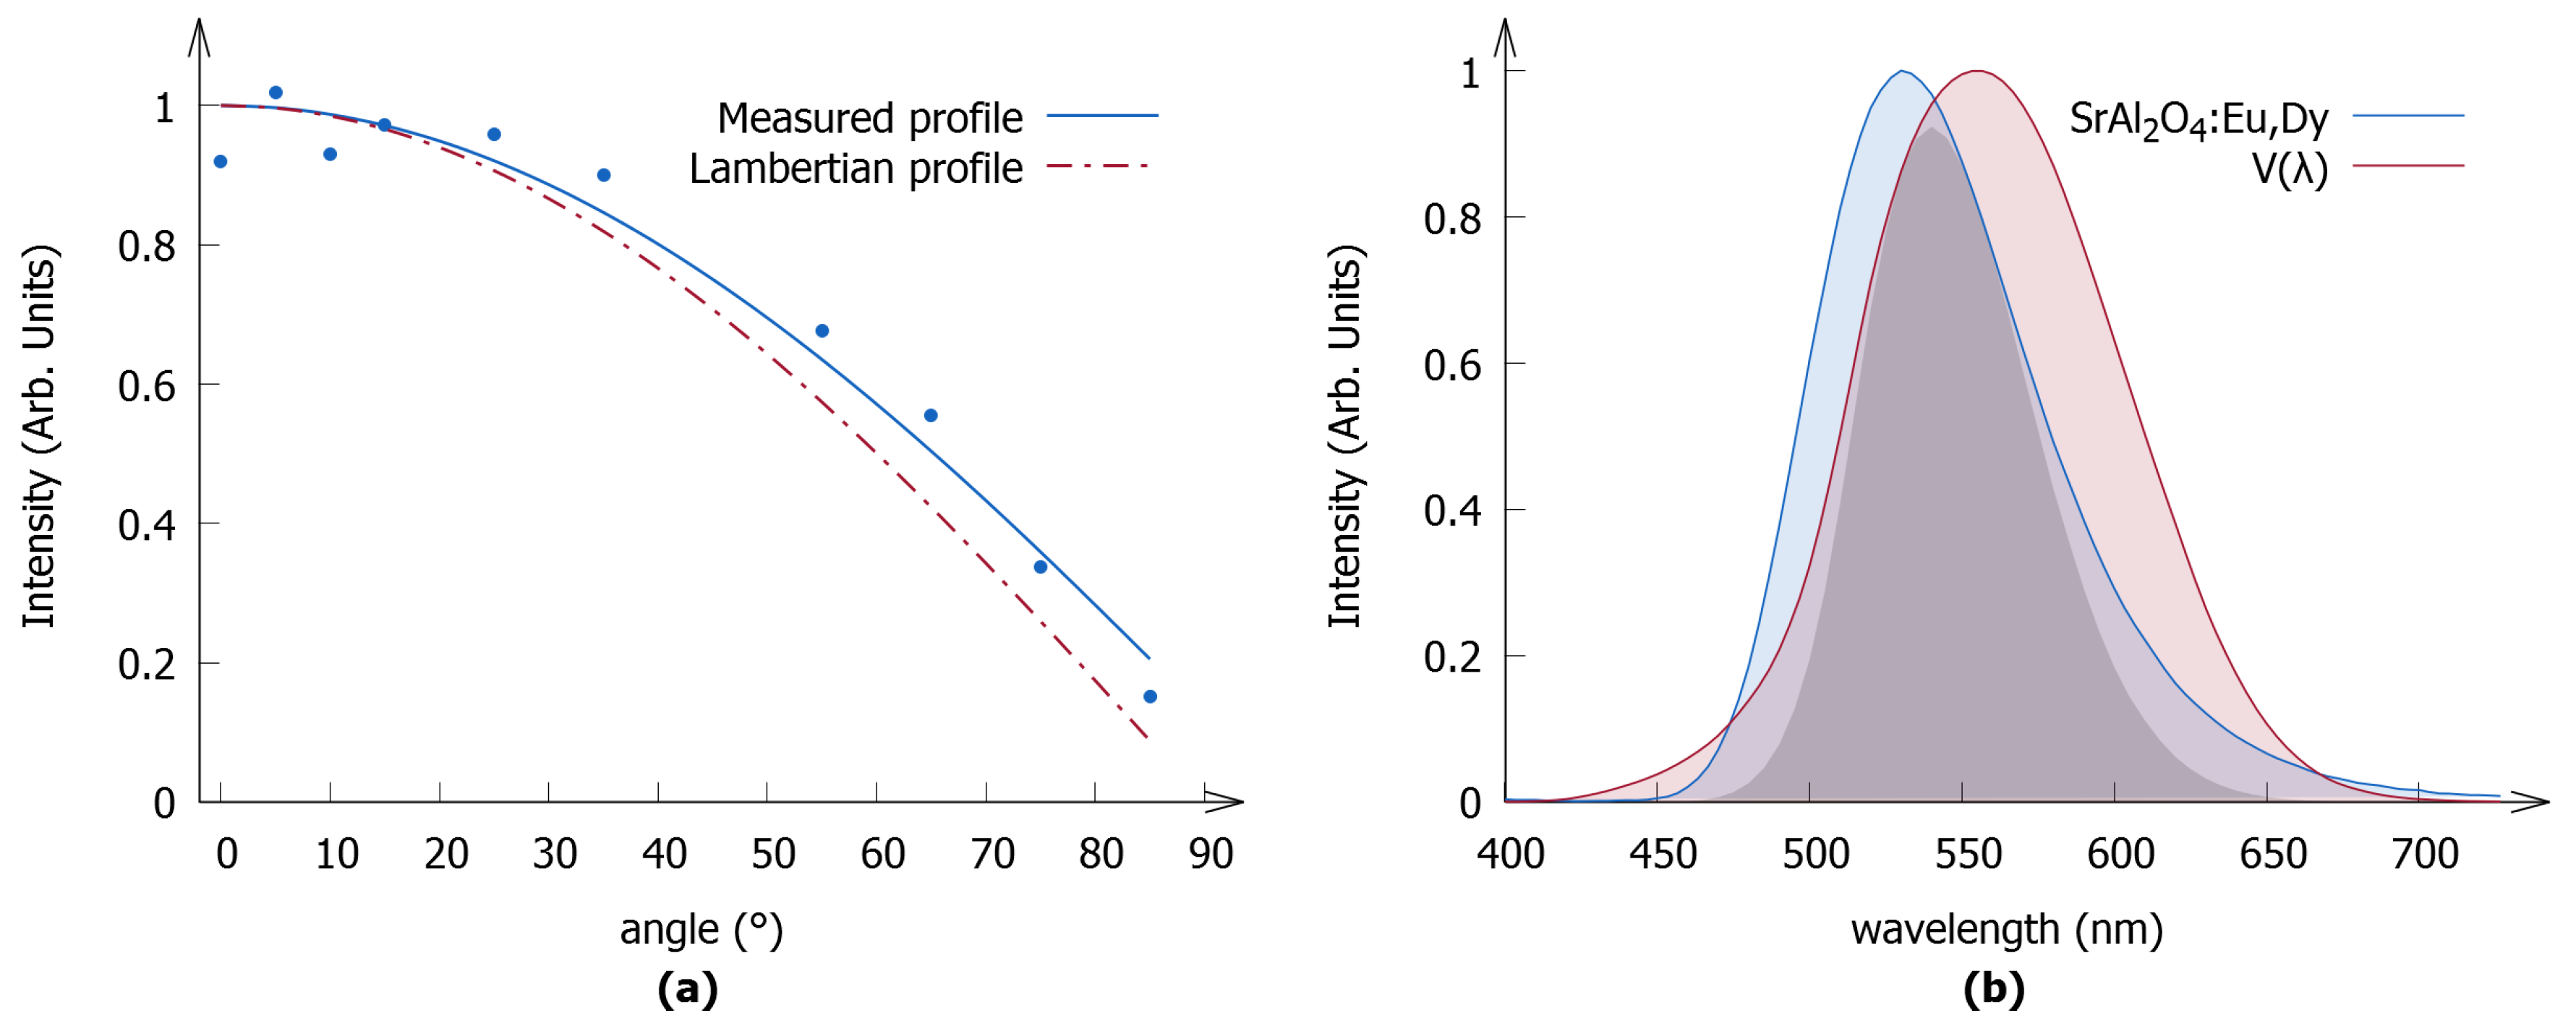
Figure 2a shows the angular distribution emission profile of the SrAlO:Eu,Dy polymer layer and how it deviates from a Lambertian profile. The deviation, most evident at larger angles, may be attributed to the specific geometry of the sample holder, which, in this case, redistributes the intensity to larger angles. This illustrates the need to measure the angular dependence of the emission as the initial approximation of the layers, as Lambertian emitters would have led to an underestimation of the storage capacity.
The emission spectrum of SrAlO:Eu,Dy is shown in Figure 2b. It exhibits the characteristic broadband emission of Eu, which has a maximum at around 530 nm attributable to the radiative transition from the lowest 4f5d excited state to the 4f ground state [45]. The emission spectrum overlaps fairly well with the eye sensitivity curve, which results in a high luminous efficacy of 477.80 lm/W. The average photon energy was found to be 2.25 eV.
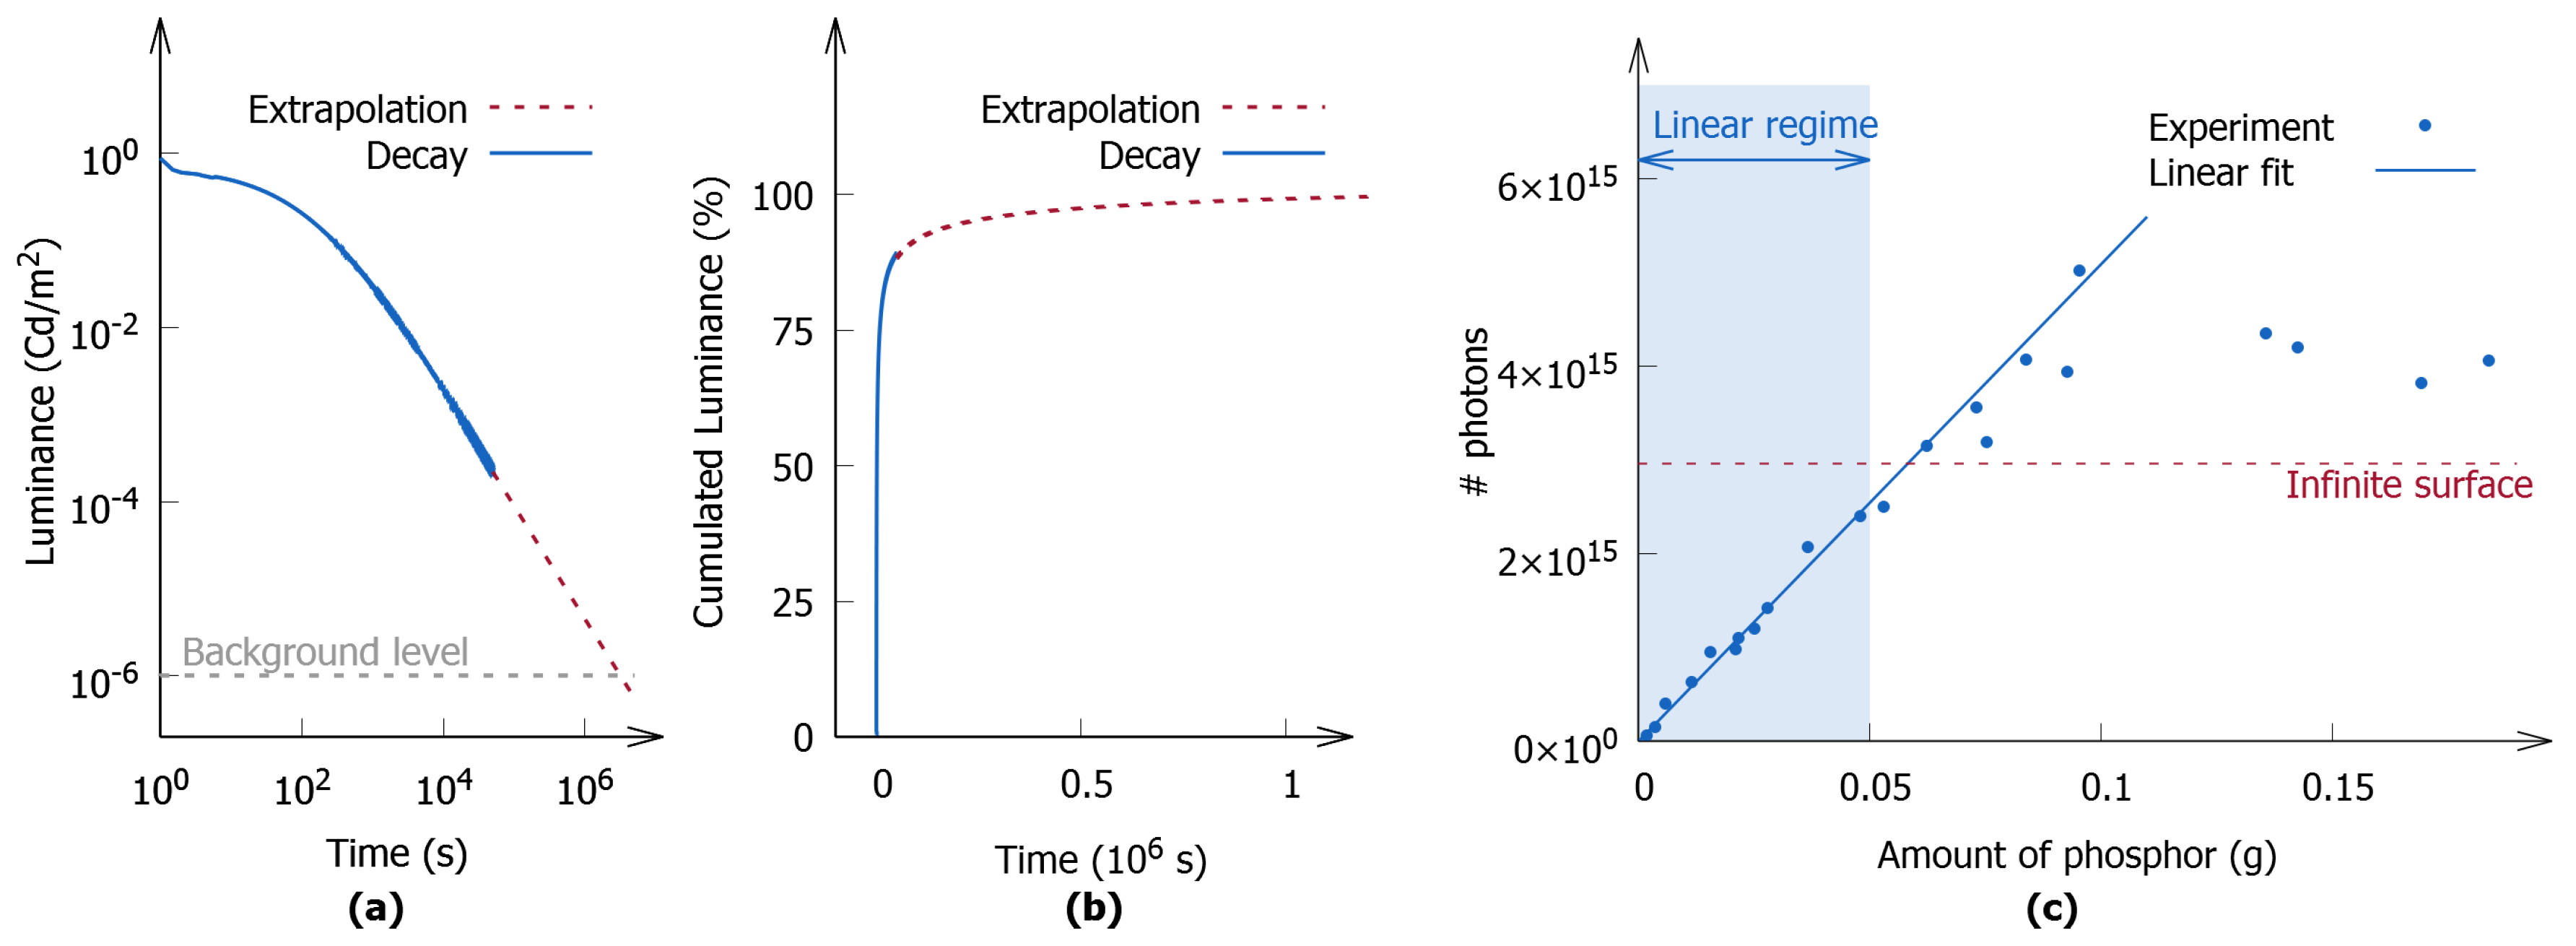
The storage capacity of SrAl:Eu,Dy was determined by preparing multiple polymer layers with different amounts of phosphor, ranging from 0.0018 to 0.1850 g. All the layers were charged using a 450 nm LED with a constant irradiance of mW/cm over 15 min, a time that was sufficiently long to arrive at a dynamic equilibrium between the storage and release of energy. After charging, the afterglow decay curves were recorded. An example of such a decay curve is shown in Figure 3a, where the characteristic long-persistent luminescence duration of up to several hours is exhibited. To minimize the time length for the acquisition of data, the afterglow was measured for several hours. Then, the final portion of the decay profile was extrapolated to the background level. The cumulative luminance is represented on a linear scale in Figure 3b, and the stagnating behavior of the curve justifies the approach outlined above. The figure also illustrates that a measurement of several hours already covers a large fraction of the total emission, as the first 65% of the total intensity was recorded during the first hour of afterglow, and this fraction could have been increased to 80% if the measurement duration was extended to 10 h.
Following the acquisition of data, the afterglow decay curves were converted to an absolute number of photons using the aforementioned method, and the results are shown in Figure 3c. Two regions were identified on the basis of how the luminescent output was related to the amount of phosphor integrated in the polymer layer.
The first region is characterized by a linear dependence of the optical output on the incorporated amount of phosphor, and is situated in the part of the curve that contains polymer layers with low loading. This region was used to determine the absolute storage capacity of the phosphor, resulting in a storage capacity of photons per gram of material. The remainder of the graph is characterized by an initial stagnation, followed by a slight decrease in the luminescent output when elevating the amounts of phosphor, and cannot be used to determine the storage capacity, as it is unclear how much of the phosphor was exposed to the excitation light (see Section 3.1.2).
3.1.1. Intensity Dependence
The measurements described above have been performed for different loadings of the polymer layers, keeping the irradiance of the excitation light constant for all the samples. One could question whether the storage capacity would change if the intensity of the excitation light is varied. Therefore the storage capacity was measured as a function of the excitation intensity for one polymer layer with a loading of 48 mg of SrAlO:Eu,Dy. The results are shown in Figure 4a, and they reveal an increase in the storage capacity as the intensity increased. A linear increase is observed for low irradiance, whereas at an irradiance higher than 5 mW/cm a plateau is obtained, indicating an absolute trapping capacity had been reached. The absolute and maximal storage capacity of this polymer layer was found to be , corresponding to a storage capacity of photons per gram of SrAlO:Eu,Dy.
The luminance decay curves were measured as a function of the excitation intensity, and are shown in Figure 4b. As the excitation intensity increases, the luminance decay curve shifts to higher luminance values. However, at higher values of the excitation intensity, the shift is less significant—it is almost unchanged. At values greater than 42.36 mW/cm, no changes in the decay curve are observed, allowing us to state that an absolute, maximum storage had been reached.
3.1.2. Defining the Boundaries of the Linear Regime
The nonlinear region observed in Figure 3c does not contain useful information to determine the storage capacity of phosphors. However, the information provided by this nonlinear regime can be used to establish the boundaries of the linear regime. In addition, this region can lead to the specification of the requirements to which a polymer layer has to comply in order to be used to determine storage capacities, which can considerably lower the experimental effort.
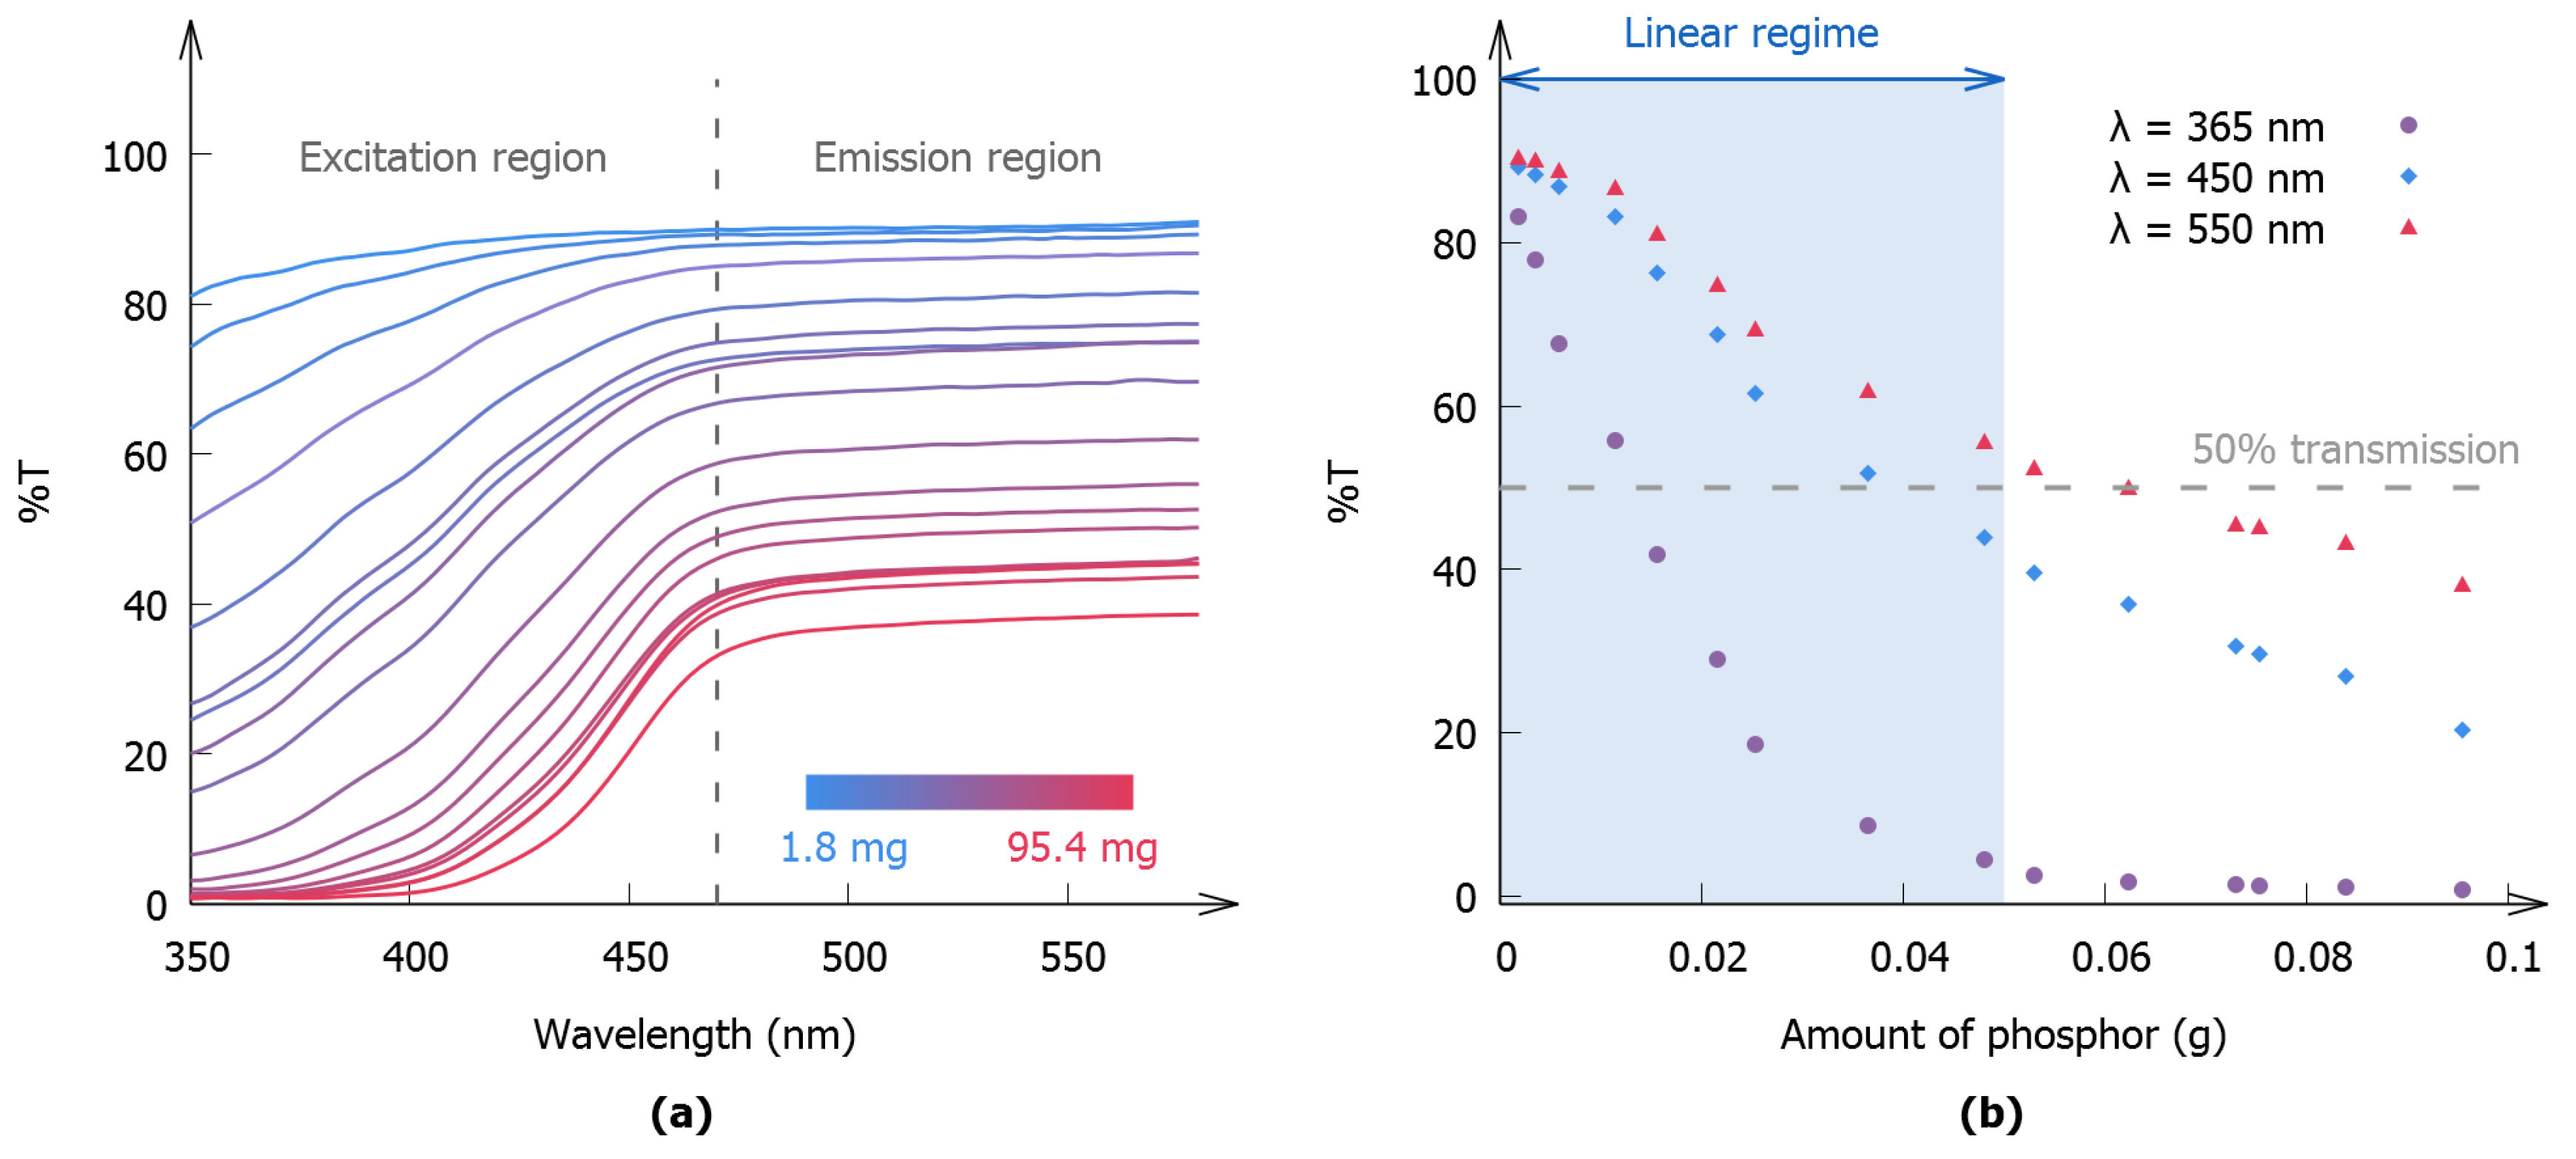
To gain further insight into the processes that lie at the origin of this nonlinear behavior, it is imperative to study the diffuse transmission of the phosphor layers. The transmission spectra of the individual polymer layers are represented in Figure 5a. A distinction is made between an excitation region, which is characterized by an absorption band that originates from the 4f 4f5d transitions of Eu [45], and an emission region that covers the wavelength range where the emission of the phosphor is located.
The transmission of the excitation light poses a limit on the amount of phosphor in the layer that can be exposed to the excitation light. If too much material is added to the layer, shadowing effects will arise and the excess powder will not be excited. This will result in a stagnation of the optical output as a function of the incorporated amount of phosphor. On the other hand, the transmission at the emission wavelength will determine how much of the initially emitted light will reach the detector. If the layer becomes too opaque, light that is reflected off the sample holder will not be detected, and only half of the emitted light will be recorded. This effect will give rise to a decrease in the optical output with an increase of phosphor content. The combination of these effects gives rise to the nonlinear behavior illustrated in Figure 3c. In an attempt to quantify these two effects, the transmission at the excitation and emission wavelengths is represented in Figure 5b. It is apparent from this figure that all polymer layers in the linear regime had an average transmission for excitation and emission light that lies above 50%. We therefore propose to use this criterion as a rule of thumb to discriminate between layers that are situated in the linear regime and layers that are not.
The transmission of the layers at 365 nm, a frequently used excitation wavelength, is shown in the same figure. It can readily be seen that the transmission quickly decreases with an increasing loading. This is due to the fact that this wavelength is located near the center of the excitation band leading to high absorption. Applying the rule of thumb to this curve leads to the conclusion that the range of loadings for which a layer ends up in the linear regime drastically decreases. It can thus be concluded that it is desirable to excite the phosphor near the edge of an absorption band.
3.2. Applying the Method: CaS:Eu
The validated method was applied to study the CaS:Eu nanophosphor. The emission spectrum is shown in Figure 6a and exists as a single emission band peaking at 657 nm (full width at half maximum of 80 nm). The measurements for this phosphor have been performed on a single polymer layer containing 9 mg of the nanopowder. The afterglow was measured after exciting the phosphor for 15 min with a 475 nm LED, which corresponds to excitation into the first 4ff5d band of Eu in CaS. These measurements resulted in a storage capacity of photons per gram.
Recently, Rodríguez Burbano et al. reported that this material also exhibits OSL under illumination with infrared light [16]. Therefore, the sample was illuminated with 970 nm infrared light after measuring the initial afterglow. As can be seen from Figure 6b, this indeed results in OSL, which manifests itself as a regeneration of the decay curve. If the additional optical output is taken into account, the storage capacity of the phosphor nearly doubles, to about photons per gram of phosphor, which corresponds to an average of about 100 photons per nanoparticle.
4. Discussion
The storage capacity of a phosphor, as it was determined for SrAlO:Eu,Dy in the previous section, does not correspond to a general, overall maximum storage capacity of the phosphor. It is rather the result of several cooperating processes that together determine the storage capacity of the phosphor under specific experimental conditions, such as the temperature and excitation wavelength [45]. Among these processes, OSL by the excitation light during charging can have a major impact on the storage capacity of a phosphor. This effect was recently reported for SrMgSiO:Eu,Dy [46].
Moreover, it is important to consider possible non-radiative losses, as not every released charge will lead to a radiative decay. A quantity taking this into account is the afterglow quantum efficiency, which is defined as the efficiency by which the release of a trapped charge leads to the emission of a photon. Botterman et al. [45] estimated the afterglow quantum efficiency of SrAlO:Eu,Dy to be around (65 ± 10)%. They also found that the light output, measured during the first 45 min of afterglow at room temperature, can be doubled by raising the temperature during a subsequent thermoluminescence (TL) experiment. It is worth noticing that also in CaS:Eu, the estimated storage capacity is doubled when applying external infrared light photo-stimulation in order to empty deeper traps that are not accessible at room temperature.
Various theoretical models attempt to describe the trapping mechanism in persistent phosphors [47,48,49] and despite that the chemical nature of the traps in these models is different or often not specified, they all suggest that the trapped charges originate from photo-ionized Eu centers. Considering the quantum efficiency of the afterglow and doubling the light output measured in the first 45 min, to take into account the amount of traps that can additionally be emptied during TL, it can be concluded that after charging, 1 g of material contains about filled traps. This roughly corresponds to about 1.6% of the Eu ions participating in the energy storage process. Korthout et al. [50] reported changes in the XANES (X-ray Absorption Near Edge Spectroscopy) signal of a few percent upon charging SrAlO:Eu,Dy, indicating a valence change of a similar fraction of the Eu ions within the material, which is in agreement with the estimation above.
The storage capacity of SrAlO:Eu,Dy and CaS:Eu can be compared to the storage capacity of LiYSiO:Ce (5%) [51]. This is one of the many materials that are reported in literature as storage phosphors. The penetration depth of the -radiation, which is used as an excitation source, was calculated to be considerably less than the penetration depth of the stimulation light used to empty the traps. Based on the information provided by Knitel et al., LiYSiO:Ce exhibits a storage capacity of about 10 photons per gram after exposure of the material to 1.7 Gy of -radiation. It is important to note that despite the vast number of reports on storage phosphors, only a few contain enough information to determine the storage capacity, and even less describe samples that were prepared according to the requirements stated above.
Every measurement method inevitably comes with its own limitations, and the method described above is of course no exception. The incorporation of the phosphor into the polymer matrix has consequences for the optical properties. Phosphors are often characterized by a high refractive index (approximately 1.6 and 2.1 for SrAlO:Eu,Dy and CaS:Eu, respectively [52,53]), whereas polymers generally possess a low refractive index (1.51 for kraton FG1901X [54]). This significant difference will have an effect on optical properties, such as outcoupling and the scattering of light in the polymer layers, and will introduce an uncertainty into the obtained results. The latter effect mainly plays an important role during the excitation, as scattering determines how much material can be exposed to the excitation light. The boundaries of the linear regime will thus, to some extent, depend on the refractive indices of the materials. Moreover, the scattering properties are influenced by the morphology and the dimensions of the phosphor grains, which will have a moderate effect on the measured storage capacities. Although these effects are important, they are expected to have only a moderate impact on the determined storage capacities [52].
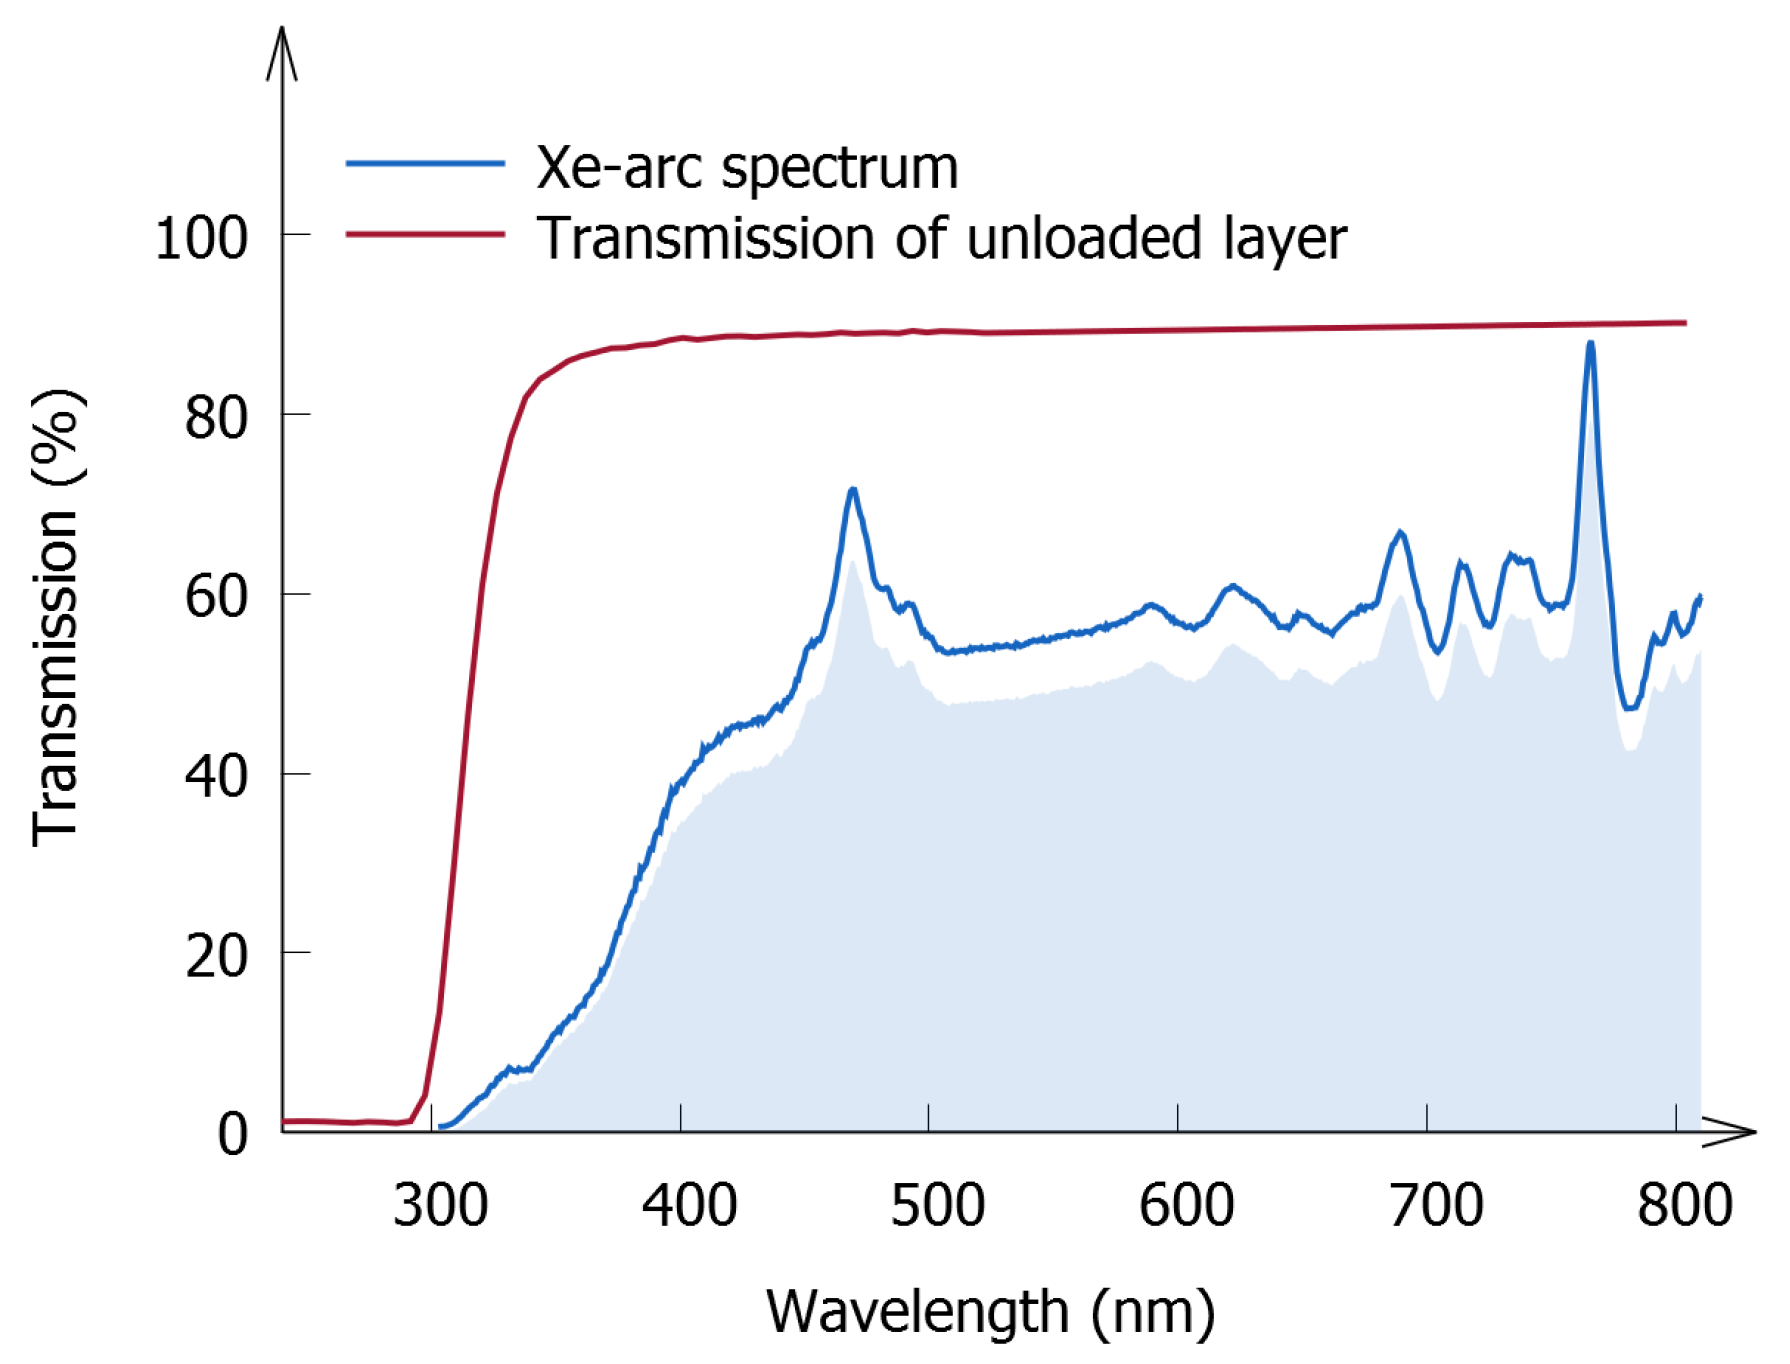
Finally, we evaluate to what extent the developed method can be incorporated in already established measuring methods used in the industry, in which a 1000 lux Xe-arc lamp is required for excitation. To that purpose, the transmission of an unloaded polymer layer was measured; it is presented in Figure 7 and compared with the spectrum of the Xe-arc lamp. The absorption edge of the unloaded sample is located at around 300 nm, which is before the major onset of the spectrum of the lamp, suggesting that a substantial part of the light emitted by the lamp can indeed be used to excite the phosphor. This means that the industry-standard excitation source can be combined with the method described above. However, care should be taken, as other polymers might have a higher absorption. Moreover, many non-Eu-based phosphors, such as transition metal-activated phosphors, need to be excited by deep UV light, which might pose problems, considering the above methodology. In these cases, it is important to check the optical compatibility of the used polymer, which can be done by standard UV-vis absorption spectroscopy.
Furthermore, we would like to express a concern related to the use of the 1000 lux Xe-arc lamp as an excitation source to measure storage capacities. The Xe-arc lamp has a considerable optical output in the infrared, which will induce OSL while charging, thereby limiting the storage of energy during the first stages of the experiment. Moreover, it can be argued that the spectrum of the lamp, which reproduces daylight conditions fairly well, is a poor representation of the indoor conditions under which many of the envisaged applications take place. Lastly, it is important to consider that the wavelength dependence of the transmission, as discussed in Section 3.1.2, might introduce problems when using a white excitation source. Considering all of the above, we would propose the use of a more monochromatic excitation source, such as those used in this work.
5. Conclusions
A method to determine the absolute storage capacity of a persistent phosphor from its luminance decay curve was introduced. This method enables an unambiguous comparison between the performance of different persistent phosphors, and was validated using commercial SrAlO:Eu,Dy. The storage capacity of this benchmark phosphor was found to be equal to photons per gram of SrAlO:Eu,Dy. These results imply that only a small fraction of the Eu ions participate in the storage process, which agrees with earlier results based on XANES measurements. Subsequently, this method was applied to red-emitting nano-sized CaS:Eu, illustrating that the method indeed enables the comparison of persistent phosphors with very different emission spectra. The storage capacity of the nanophosphor was found to be photons per gram of CaS:Eu, or about 100 photons per nanoparticle, when deeper traps, accessible by infrared stimulation, are included. This method now allows us to evaluate unambiguously the influence of (nano)particle size and surface chemistry on the absolute trapping capacity of a particular phosphor, as compared to the bulk counterpart.
Finally, it was evaluated whether the Xe-arc lamp, which is considered to be an industrial standard, can be used as an excitation source. It was found that there are no practical limitations to combine the Xe-arc lamp with the proposed measurement method. Nevertheless, some compelling arguments were put forward that plead for the use of a more monochromatic light source when determining the storage capacity of a phosphor.
Acknowledgments
This work was financially supported by the agency for Innovation by Science and Technology (IWT) for a SBO-IWT grant (SBO130030) and by the UGent Special Research Fund (BOF) for a doctoral scholarship (BOF16/DOC/327).
Author Contributions
D.V.d.H. and P.F.S. conceived and designed the experiments. D.C.R.B. and J.A.C. provided the nano-sized CaS:Eu samples. D.V.d.H. performed the experiments. D.V.d.H. and J.J.J. analyzed the data. All authors contributed to finalizing the paper, and D.V.d.H. wrote the draft of the manuscript.
Conflicts of Interest
The authors declare no conflict of interest. The funding sponsors had no role in the design of the study; in the collection, analyses, or interpretation of data; in the writing of the manuscript, or in the decision to publish the results.
References
- Matsuzawa, T.; Aoki, Y.; Takeuchi, N.; Murayama, Y. A new long phosphorescent phosphor with high brightness, SrAl2O4:Eu2+,Dy3+. J. Electrochem. Soc. 1996, 143, 2670–2673. [Google Scholar] [CrossRef]
- Hoogenstraaten, W.; Klasens, H.A. Some Properties of Zinc Sulfide Activated with Copper and Cobalt. J. Electrochem. Soc. 1953, 100, 366–375. [Google Scholar] [CrossRef]
- Bierwagen, J.; Yoon, S.; Gartmann, N.; Walfort, B.; Hagemann, H. Thermal and concentration dependent energy transfer of Eu2+ in SrAl2O4. Opt. Mater. Express 2016, 6, 793–803. [Google Scholar] [CrossRef]
- Hagemann, H.; Lovy, D.; Yoon, S.; Pokrant, S.; Gartmann, N.; Walfort, B.; Bierwagen, J. Wavelength dependent loading of traps in the persistent phosphor SrAl2O4:Eu2+, Dy3+. J. Lumin. 2016, 170, 299–304. [Google Scholar] [CrossRef]
- Liu, H.; Feng, B.; Luo, L.; Han, C.; Tanner, P.A. Near infrared photostimulated persistent luminescence and information storage of SrAl2O4:Eu2+,Dy3+ phosphor. Opt. Mater. Express 2016, 6, 3375–3385. [Google Scholar] [CrossRef]
- Van den Eeckhout, K.; Smet, P.F.; Poelman, D. Persistent Luminescence in Eu2+-Doped Compounds: A Review. Materials 2010, 3, 2536–2566. [Google Scholar] [CrossRef] [Green Version]
- Wang, B.; Lin, H.; Yu, Y.; Chen, D.; Zhang, R.; Xu, J.; Wang, Y. Ce3+/Pr3+: YAGG: A Long Persistent Phosphor Activated by Blue-Light. J. Am. Ceram. Soc. 2014, 97, 2539–2545. [Google Scholar] [CrossRef]
- Ueda, J.; Aishima, K.; Nishiura, S.; Tanabe, S. Afterglow Luminescence in Ce3+-Doped Y3Sc2Ga3O12 Ceramics. Appl. Phys. Express 2011, 4, 042602. [Google Scholar] [CrossRef]
- Van den Eeckhout, K.; Poelman, D.; Smet, P.F. Persistent luminescence in non-Eu2+-doped compounds: A review. Materials 2013, 6, 2789–2818. [Google Scholar] [CrossRef] [Green Version]
- Pan, Z.; Lu, Y.Y.; Liu, F. Sunlight-activated long-persistent luminescence in the near-infrared from Cr3+-doped zinc gallogermanates. Nat. Mater. 2012, 11, 58–63. [Google Scholar] [CrossRef] [PubMed]
- Basavaraju, N.; Priolkar, K.R.; Bessiere, A.; Sharma, S.K.; Gourier, D.; Binet, L.; Viana, B.; Emura, S. Controlling disorder in the ZnGa2O4:Cr3+ persistent phosphor by Mg2+ substitution. Phys. Chem. Chem. Phys. 2017, 19, 1369–1377. [Google Scholar] [CrossRef] [PubMed]
- Li, P.; Peng, M.; Wondraczek, L.; Zhao, Y.; Viana, B. Red to near infrared ultralong lasting luminescence from Mn2+-doped sodium gallium aluminum germanate glasses and (Al,Ga)-albite glass-ceramics. J. Mater. Chem. C 2015, 3, 3406–3415. [Google Scholar] [CrossRef]
- Nazarov, M.; Yoon, C. Controlled peak wavelength shift of Ca1−xSrx(SySe1−y): Eu2+ phosphor for LED application. J. Solid State Chem. 2006, 179, 2529–2533. [Google Scholar] [CrossRef]
- Jia, D.D.; Jia, W.Y.; Evans, D.R.; Dennis, W.M.; Liu, H.M.; Zhu, J.; Yen, W.M. Trapping processes in CaS:Eu2+,Tm3+. J. Appl. Phys. 2000, 88, 3402–3407. [Google Scholar] [CrossRef]
- Kojima, Y.; Aoyagi, K.; Yasue, T. Afterglow mechanism and thermoluminescence of red-emitting CaS:Eu2+,Pr3+ phosphor with incorporated Li+ ion upon visible light irradiation. J. Lumin. 2007, 126, 319–322. [Google Scholar] [CrossRef]
- Rodriguez Burbano, D.C.; Sharma, S.K.; Dorenbos, P.; Viana, B.; Capobianco, J.A. Persistent and Photostimulated Red Emission in CaS:Eu2+,Dy3+ Nanophosphors. Adv. Opt. Mater. 2015, 3, 551–557. [Google Scholar] [CrossRef]
- De Chermont le Masne, Q.; Chaneac, C.; Seguin, J.; Pelle, F.; Maitrejean, S.; Jolivet, J.; Gourier, D.; Bessodes, M.; Scherman, D. Nanoprobes with near-infrared persistent luminescence for in vivo imaging. Proc. Natl. Acad. Sci. USA 2007, 104, 9266–9271. [Google Scholar] [CrossRef] [PubMed]
- Vetrone, F.; Capobianco, J.A. Lanthanide-doped fluoride nanoparticles: Luminescence, upconversion, and biological applications. Int. J. Nanotechnol. 2008, 5, 1306–1339. [Google Scholar] [CrossRef]
- Lecuyer, T.; Teston, E.; Ramirez-Garcia, G.; Maldiney, T.; Viana, B.; Seguin, J.; Mignet, N.; Scherman, D.; Richard, C. Chemically engineered persistent luminescence nanoprobes for bioimaging. Theranostics 2016, 6, 2488–2524. [Google Scholar] [CrossRef] [PubMed]
- Norrbo, I.; Carvalho, J.M.; Laukkanen, P.; Makela, J.; Mamedov, F.; Peurla, M.; Helminen, H.; Pihlasalo, S.; Harma, H.; Sinkkonen, J.; et al. Lanthanide and Heavy Metal Free Long White Persistent Luminescence from Ti Doped Li-Hackmanite: A Versatile, Low-Cost Material. Adv. Funct. Mater. 2017, 27, 1606547. [Google Scholar] [CrossRef]
- Wang, X.; Jia, D.; Yen, W.M. Mn2+ activated green, yellow, and red long persistent phosphors. J. Lumin. 2003, 102–103, 34–37. [Google Scholar] [CrossRef]
- Fu, J. Orange and red emitting long-lasting phosphors MO:Eu3+ (M = Ca, Sr, Ba). Electrochem. Solid State Lett. 2000, 3, 350–351. [Google Scholar] [CrossRef]
- Poelman, D.; Avci, N.; Smet, P.F. Measured luminance and visual appearance of multi-color persistent phosphors. Opt. Express 2009, 17, 358–364. [Google Scholar] [CrossRef] [PubMed]
- Ueda, J.; Kuroishi, K.; Tanabe, S. Yellow persistent luminescence in Ce3+–Cr3+-codoped gadolinium aluminum gallium garnet transparent ceramics after blue-light excitation. Appl. Phys. Express 2014, 7, 062201. [Google Scholar] [CrossRef]
- Ueda, J. Analysis of optoelectronic properties and development of new persistent phosphor in Ce3+-doped garnet ceramics. J. Ceram. Soc. Jpn 2015, 123, 1059–1064. [Google Scholar] [CrossRef]
- Dosovitskiy, G.; Fedorov, A.; Mechinsky, V.; Borisevich, A.; Dosovitskiy, A.; Tret’jak, E.; Korjik, M. Persistent luminescence in powdered and ceramic polycrystalline Gd3 Al2Ga3O12:Ce. IOP Conf. Ser. Mater. Sci. Eng. 2017, 169, 12014. [Google Scholar] [CrossRef]
- Nakanishi, T.; Katayama, Y.; Ueda, J.; Honma, T.; Tanabe, S.; Komatsu, T. Fabrication of Eu:SrAl2O4-based glass ceramics using Frozen sorbet method. J. Ceram. Soc. Jpn. 2011, 119, 609–615. [Google Scholar] [CrossRef]
- Nakanishi, T.; Watanabe, K.; Ueda, J.; Fushimi, K.; Tanabe, S.; Hasegawa, Y. Enhanced Light Storage of SrAl2O4 Glass-Ceramics Controlled by Selective Europium Reduction. J. Am. Ceram. Soc. 2015, 98, 423–429. [Google Scholar] [CrossRef]
- Alves, Y.G.S.; Sampaio, D.V.; Souza, N.R.S.; Silva, D.C.; Cunha, T.R.; Meneses, C.T.; Fonseca, E.J.S.; Silva, R.S. Persistent luminescence properties of SrBXAl2−XO4:Eu,Dy laser-sintered ceramics. Opt. Mater. 2017, 70, 63–68. [Google Scholar] [CrossRef]
- Chenu, S.; Véron, E.; Genevois, C.; Garcia, A.; Matzen, G.; Allix, M. Long-lasting luminescent ZnGa2O4:Cr3+ transparent glass-ceramics. J. Mater. Chem. C 2014, 2, 10002–10010. [Google Scholar] [CrossRef]
- Castaing, V.; Pellerin, M.; Sontakke, A.D.; Fernández Carriónc, A.J.; Chaneac, C.; Allix, M.; Gourier, D.; Viana, B. Persistent luminescence in ZnGa2O4:Cr3+ transparent glass-ceramics. Proc. SPIE 2017, 10105, 101050R. [Google Scholar]
- Katayama, Y.; Ueda, J.; Tanabe, S. Photo-electronic properties and persistent luminescence in Pr3+ doped (Ca,Sr)TiO3 ceramics. J. Lumin. 2014, 148, 290–295. [Google Scholar] [CrossRef]
- Massera, J.; Gaussiran, M.; Gluchowski, P.; Lastusaari, M.; Petit, L.; Hölsä, J.; Hupa, L. Effect of the glass melting condition on the processing of phosphate-based glass–ceramics with persistent luminescence properties. Opt. Mater. 2016, 52, 56–61. [Google Scholar] [CrossRef]
- Li, Y.; Gecevicius, M.; Qiu, J. Long persistent phosphors-from fundamentals to applications. Chem. Soc. Rev. 2016, 45, 2090–2136. [Google Scholar] [CrossRef] [PubMed]
- Saito, M.; Adachi, N.; Kondo, H. Full-color illumination that needs no electric power. Opt. Express 2007, 15, 1621–1626. [Google Scholar] [CrossRef] [PubMed]
- Kravets, V. Using electron trapping materials for optical memory. Opt. Mater. 2001, 16, 369–375. [Google Scholar] [CrossRef]
- Maldiney, T.; Lecointre, A.; Viana, B.; Bessiere, A.; Bessodes, M.; Gourier, D.; Richard, C.; Scherman, D. Controlling Electron Trap Depth To Enhance Optical Properties of Persistent Luminescence Nanoparticles for In Vivo Imaging. J. Am. Chem. Soc. 2011, 133, 11810–11815. [Google Scholar] [CrossRef] [PubMed]
- Viana, B.; Sharma, S.; Gourier, D.; Maldiney, T.; Teston, E.; Scherman, D.; Richard, C. Long term in vivo imaging with Cr3+ doped spinel nanoparticles exhibiting persistent luminescence. J. Lumin. 2016, 170, 879–887. [Google Scholar] [CrossRef]
- Sharma, S.K.; Gourier, D.; Teston, E.; Scherman, D.; Richard, C.; Viana, B. Persistent luminescence induced by near infra-red photostimulation in chromium-doped zinc gallate for in vivo optical imaging. Opt. Mater. 2017, 63, 51–58. [Google Scholar] [CrossRef]
- Botterman, J.; Smet, P.F. Persistent phosphor SrAl2O4:Eu,Dy in outdoor conditions: Saved by the trap distribution. Opt. Express 2015, 23, A868–A881. [Google Scholar] [CrossRef] [PubMed]
- Maldiney, T.; Bessiere, A.; Seguin, J.; Teston, E.; Sharma, S.K.; Viana, B.; Bos, A.J.J.; Dorenbos, P.; Bessodes, M.; Gourier, D.; et al. The in vivo activation of persistent nanophosphors for optical imaging of vascularization, tumours and grafted cells. Nat. Mater. 2014, 13, 418–426. [Google Scholar] [CrossRef] [PubMed]
- Abe, S.; Joos, J.J.; Martin, L.I.D.J.; Hens, Z.; Smet, P.F. Hybrid remote quantum dot/powder phosphor designs for display backlights. Light-Sci. Appl. 2017, 6, e16271. [Google Scholar] [CrossRef]
- Leyre, S.; Coutino-Gonzalez, E.; Joos, J.J.; Ryckaert, J.; Meuret, Y.; Poelman, D.; Smet, P.F.; Durinck, G.; Hofkens, J.; Deconinck, G.; et al. Absolute determination of photoluminescence quantum efficiency using an integrating sphere setup. Rev. Sci. Instrum. 2014, 85, 123115. [Google Scholar] [CrossRef] [PubMed]
- Ejder, E. Methods of Representing Emission, Excitation and Photoconductivity Spectra. J. Opt. Soc. Am. 1969, 59, 223–224. [Google Scholar] [CrossRef]
- Botterman, J.; Joos, J.J.; Smet, P.F. Trapping and detrapping in SrAl2O4:Eu,Dy persistent phosphors: Influence of excitation wavelength and temperature. Phys. Rev. B 2014, 90, 85147. [Google Scholar] [CrossRef]
- Tydtgat, C.; Meert, K.W.; Poelman, D.; Smet, P.F. Optically stimulated detrapping during charging of persistent phosphors. Opt. Mater. Express 2016, 6, 844–858. [Google Scholar] [CrossRef]
- Aitasallo, T.; Holsa, J.; Jungner, H.; Lastusaari, M.; Niittykoski, J. Thermoluminescence study of persistent luminescence materials: Eu2+- and R3+-doped calcium aluminates, CaAl2O4:Eu2+,R3+. J. Phys. Chem. B 2006, 110, 4589–4598. [Google Scholar] [CrossRef] [PubMed]
- Clabau, F.; Rocquefelte, X.; Jobic, S.; Deniard, P.; Whangbo, M.H.; Garcia, A.; Le Mercier, T. Mechanism of phosphorescence appropriate for the long-lasting phosphors Eu2+-doped SrAl2O4 with codopants Dy3+ and B3+. Chem. Mater. 2005, 17, 3904–3912. [Google Scholar] [CrossRef]
- Dorenbos, P. Mechanism of persistent luminescence in Eu2+ and Dy3+ codoped aluminate and silicate compounds. J. Electrochem. Soc. 2005, 152, H107–H110. [Google Scholar] [CrossRef]
- Korthout, K.; Van den Eeckhout, K.; Botterman, J.; Nikitenko, S.; Poelman, D.; Smet, P.F. Luminescence and X-ray absorption measurements of persistent SrAl2O4:Eu,Dy powders: Evidence for valence state changes. Phys. Rev. B 2011, 84, 85140. [Google Scholar] [CrossRef]
- Knitel, M.J.; Dorenbos, P.; Combes, C.M.; Andriessen, J.; van Eijk, C.W.E. Luminescence and storage properties of LiYSiO4:Ce. J. Lumin. 1996, 69, 325–334. [Google Scholar] [CrossRef]
- Imai, Y.; Momoda, R.; Xu, C.N. Elasticoluminescence of europium-doped strontium aluminate spherical particles dispersed in polymeric matrices. Mater. Lett. 2007, 61, 4124–4127. [Google Scholar] [CrossRef]
- Zhang, J.G.; Eklund, P.C.; Hua, Z.L.; Salamancariba, L.G.; Wuttig, M.; Soltani, P.K.; Storti, G.M. Photoluminescence and optical absorption in CaS:Eu2+,Sm3+ thin films. J. Mater. Res. 1992, 7, 411–417. [Google Scholar] [CrossRef]
- Khanarian, G. Rubber toughened and optically transparent blends of Cyclic Olefin Copolymers. Polym. Eng. Sci. 2000, 40, 2590–2601. [Google Scholar] [CrossRef]
Figure 1.
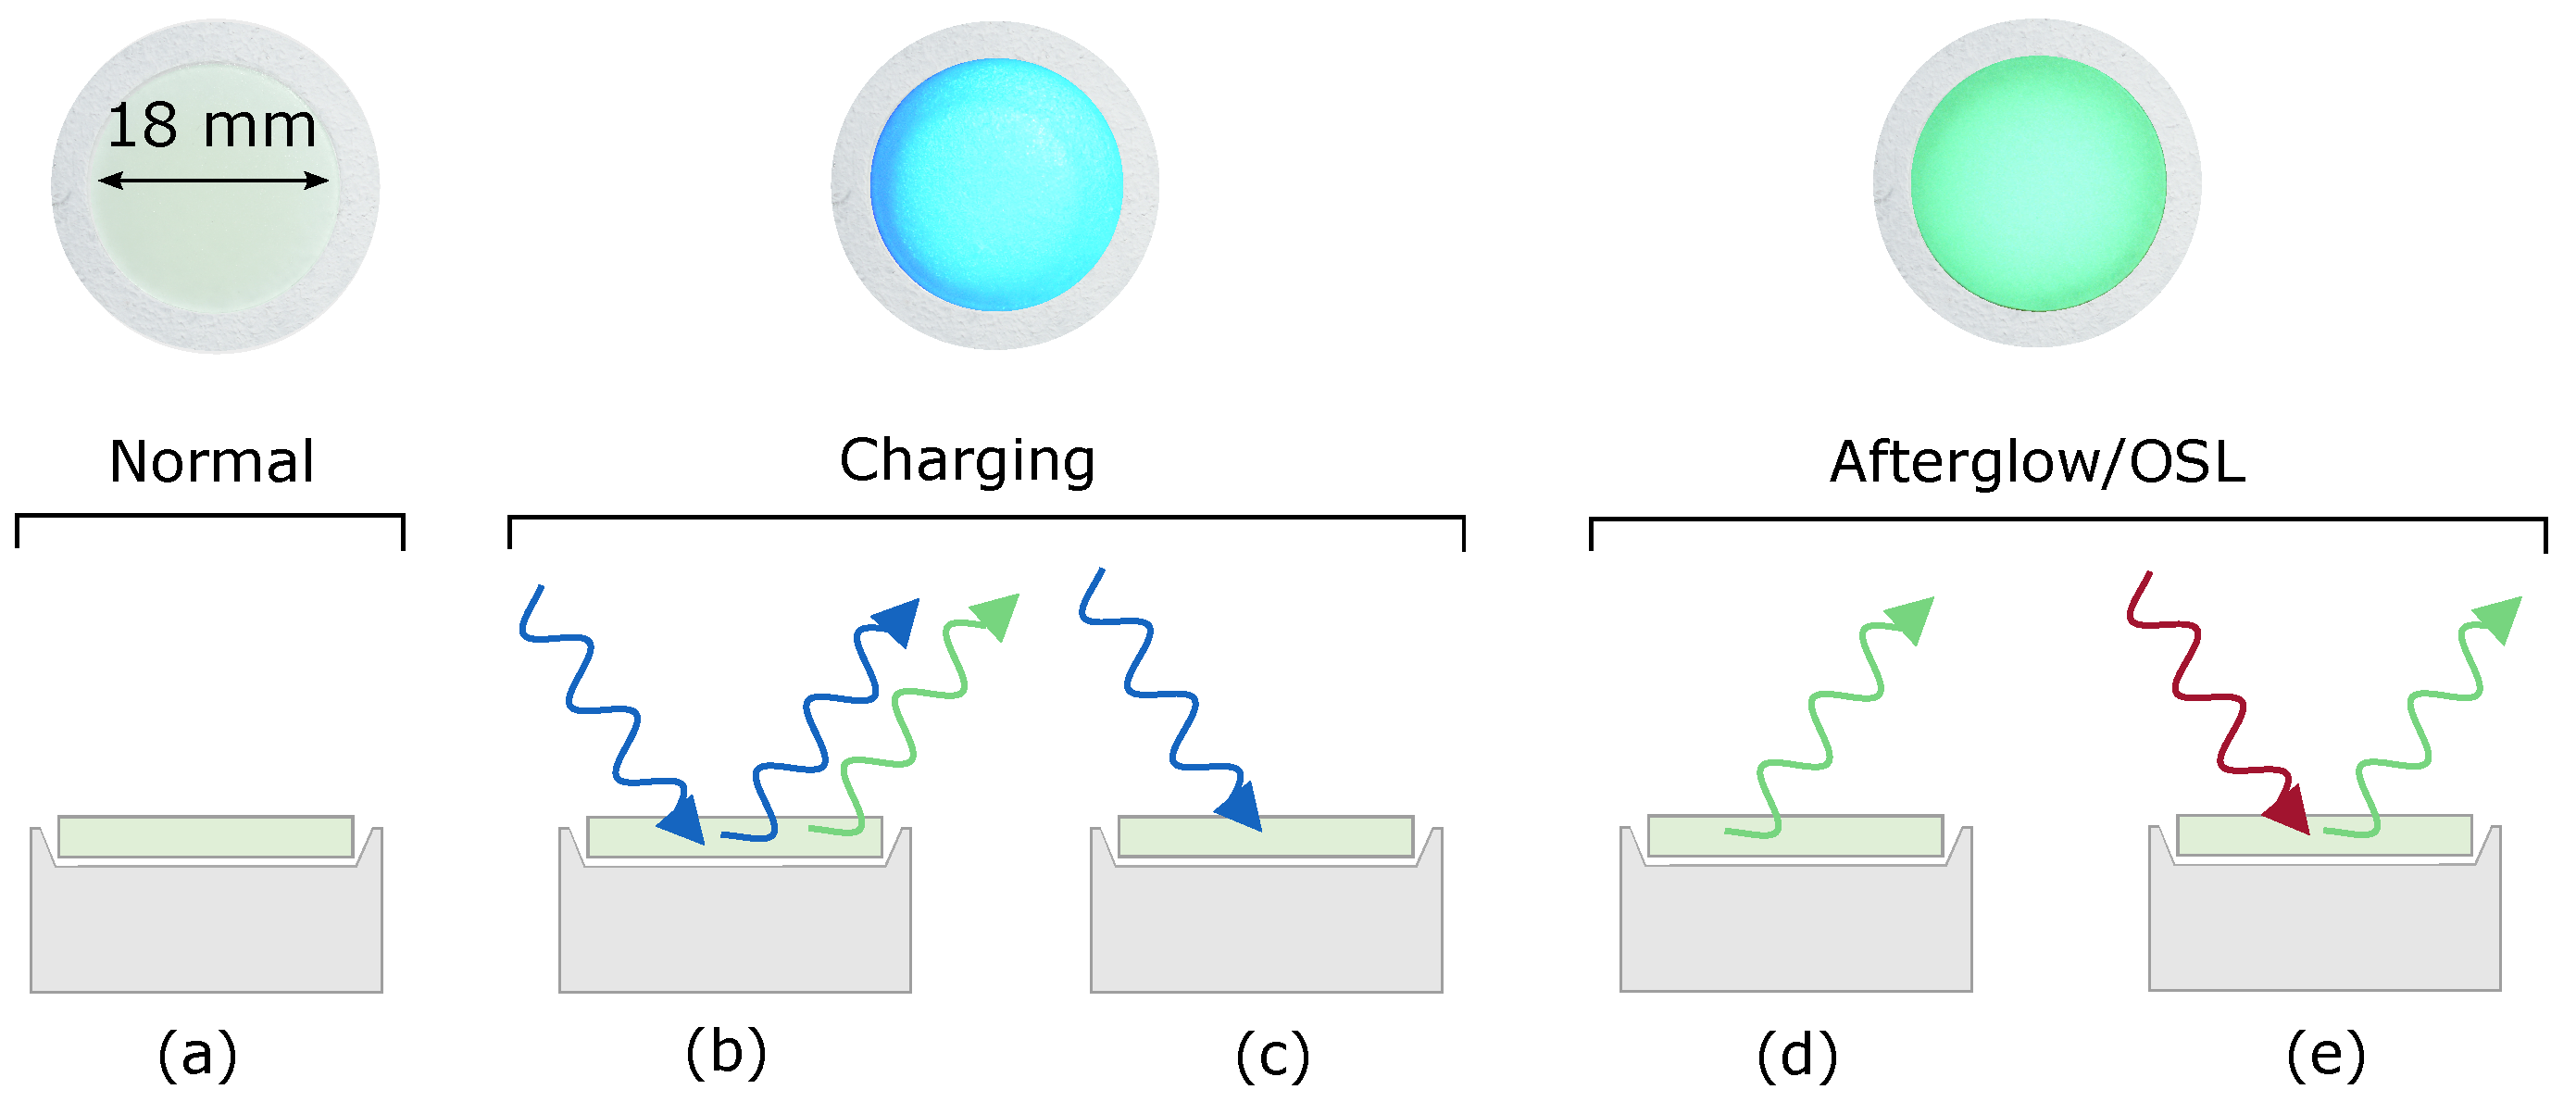
Schematic of the experimental procedure to measure the absolute storage capacity of phosphors. The top of each panel shows a photograph of a polymer layer on the sample holder (top view) under different experimental conditions. The bottom part of each panel represents a schematic side view of the sample shown in the top part. (a) An uncharged polymer layer; (b) Reflection of the excitation light (blue) and absorption leading to photoluminescence (green); (c) Absorption of excitation light (blue) leading to trapping; (d) Spontaneous afterglow (green) after excitation; (e) Absorption of a (low-energy) photon (red) leading to the release of a trapped charge and yielding emission of light (green). This effect is called optically stimulated luminescence (OSL).
Figure 1.
Schematic of the experimental procedure to measure the absolute storage capacity of phosphors. The top of each panel shows a photograph of a polymer layer on the sample holder (top view) under different experimental conditions. The bottom part of each panel represents a schematic side view of the sample shown in the top part. (a) An uncharged polymer layer; (b) Reflection of the excitation light (blue) and absorption leading to photoluminescence (green); (c) Absorption of excitation light (blue) leading to trapping; (d) Spontaneous afterglow (green) after excitation; (e) Absorption of a (low-energy) photon (red) leading to the release of a trapped charge and yielding emission of light (green). This effect is called optically stimulated luminescence (OSL).

Figure 2.
(a) Angular distribution of the emission of the polymer layers; the Lambertian profile is added as a reference; (b) The emission spectrum (photon flux) of SrAlO:Eu,Dy is shown in blue. The spectrum was recorded at 300 K under excitation at 400 nm. The photopic eye sensitivity curve is shown in red. The product of both curves is depicted as the shaded gray area.

Figure 3.
(a) An afterglow curve for a polymer layer containing 0.0032 g of SrAlO:Eu,Dy. The extrapolation method and the instrumental background level are also indicated; (b) Cumulative decay curve indicating the fractions of the total luminance that are measured or deduced from extrapolation; (c) The number of photons that were released from SrAlO:Eu,Dy during the afterglow after 15 min of excitation with a 450 nm LED ( mW/cm). The region where the number of photons was linearly related to the amount of phosphor incorporated in the layers is also indicated. The level indicated as “infinite surface” corresponds to the number of photons calculated from a luminance decay curve that was measured on an infinitely thick surface.

Figure 4.
(a) The measured storage capacity for SrAlO:Eu,Dy (blue dots) as a function of the irradiance of the excitation light during charging. The first data point, at the lowest excitation intensity, corresponds to the experimental conditions used for the experiments shown in Figure 3. The red line is a guide for the eye; (b) The decay curves for different excitation intensities.
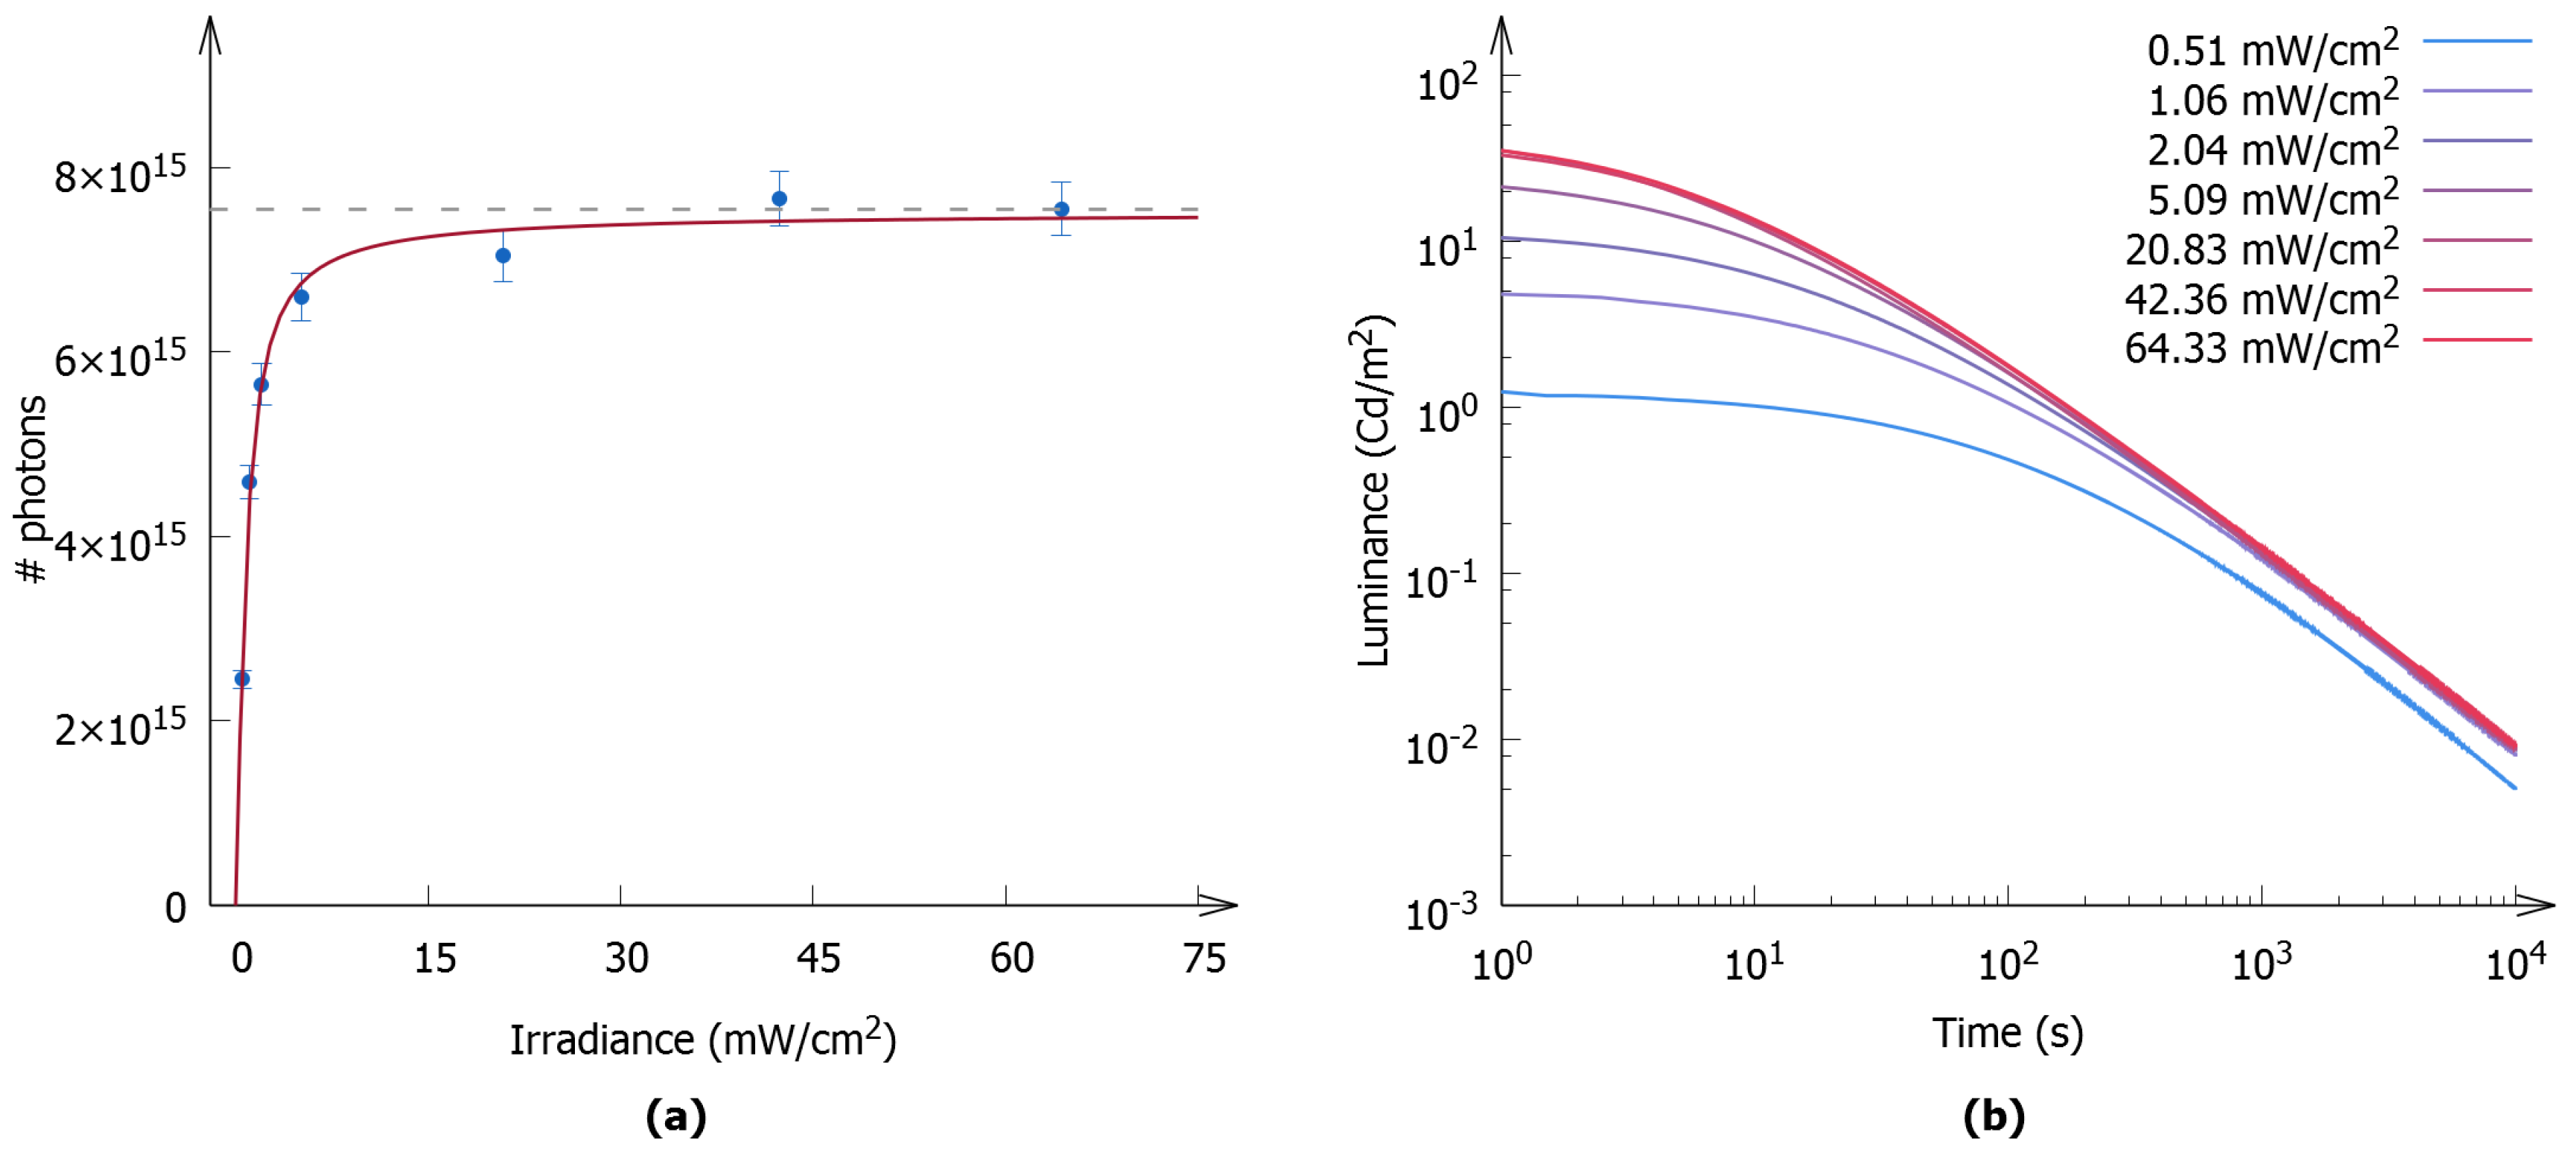
Figure 5.
(a) Diffuse transmission spectra of polymer layers with different amounts of SrAlO:Eu,Dy incorporated. The plot is divided into a low- and a high-wavelength range, covering the excitation and emission wavelengths of the phosphor, respectively; (b) The transmission of the layers at 365 nm, at the excitation wavelength used in this work (450 nm), and at the emission wavelength (550 nm). The linear regime from Figure 3 is indicated as a reference.

Figure 6.
(a) The emission spectrum (photon flux) of CaS:Eu is shown in blue. The spectrum was recorded at 300 K under excitation at 475 nm. The photopic eye sensitivity curve is shown in red. The product of both curves is depicted as the shaded gray area; (b) Luminance decay profiles of the polymer layer containing 9 mg of the CaS:Eu nanophosphor after excitation with a 475 nm LED. The OSL is clearly visible as a rise in intensity upon continuous irradiation of the sample with infrared light ( nm).
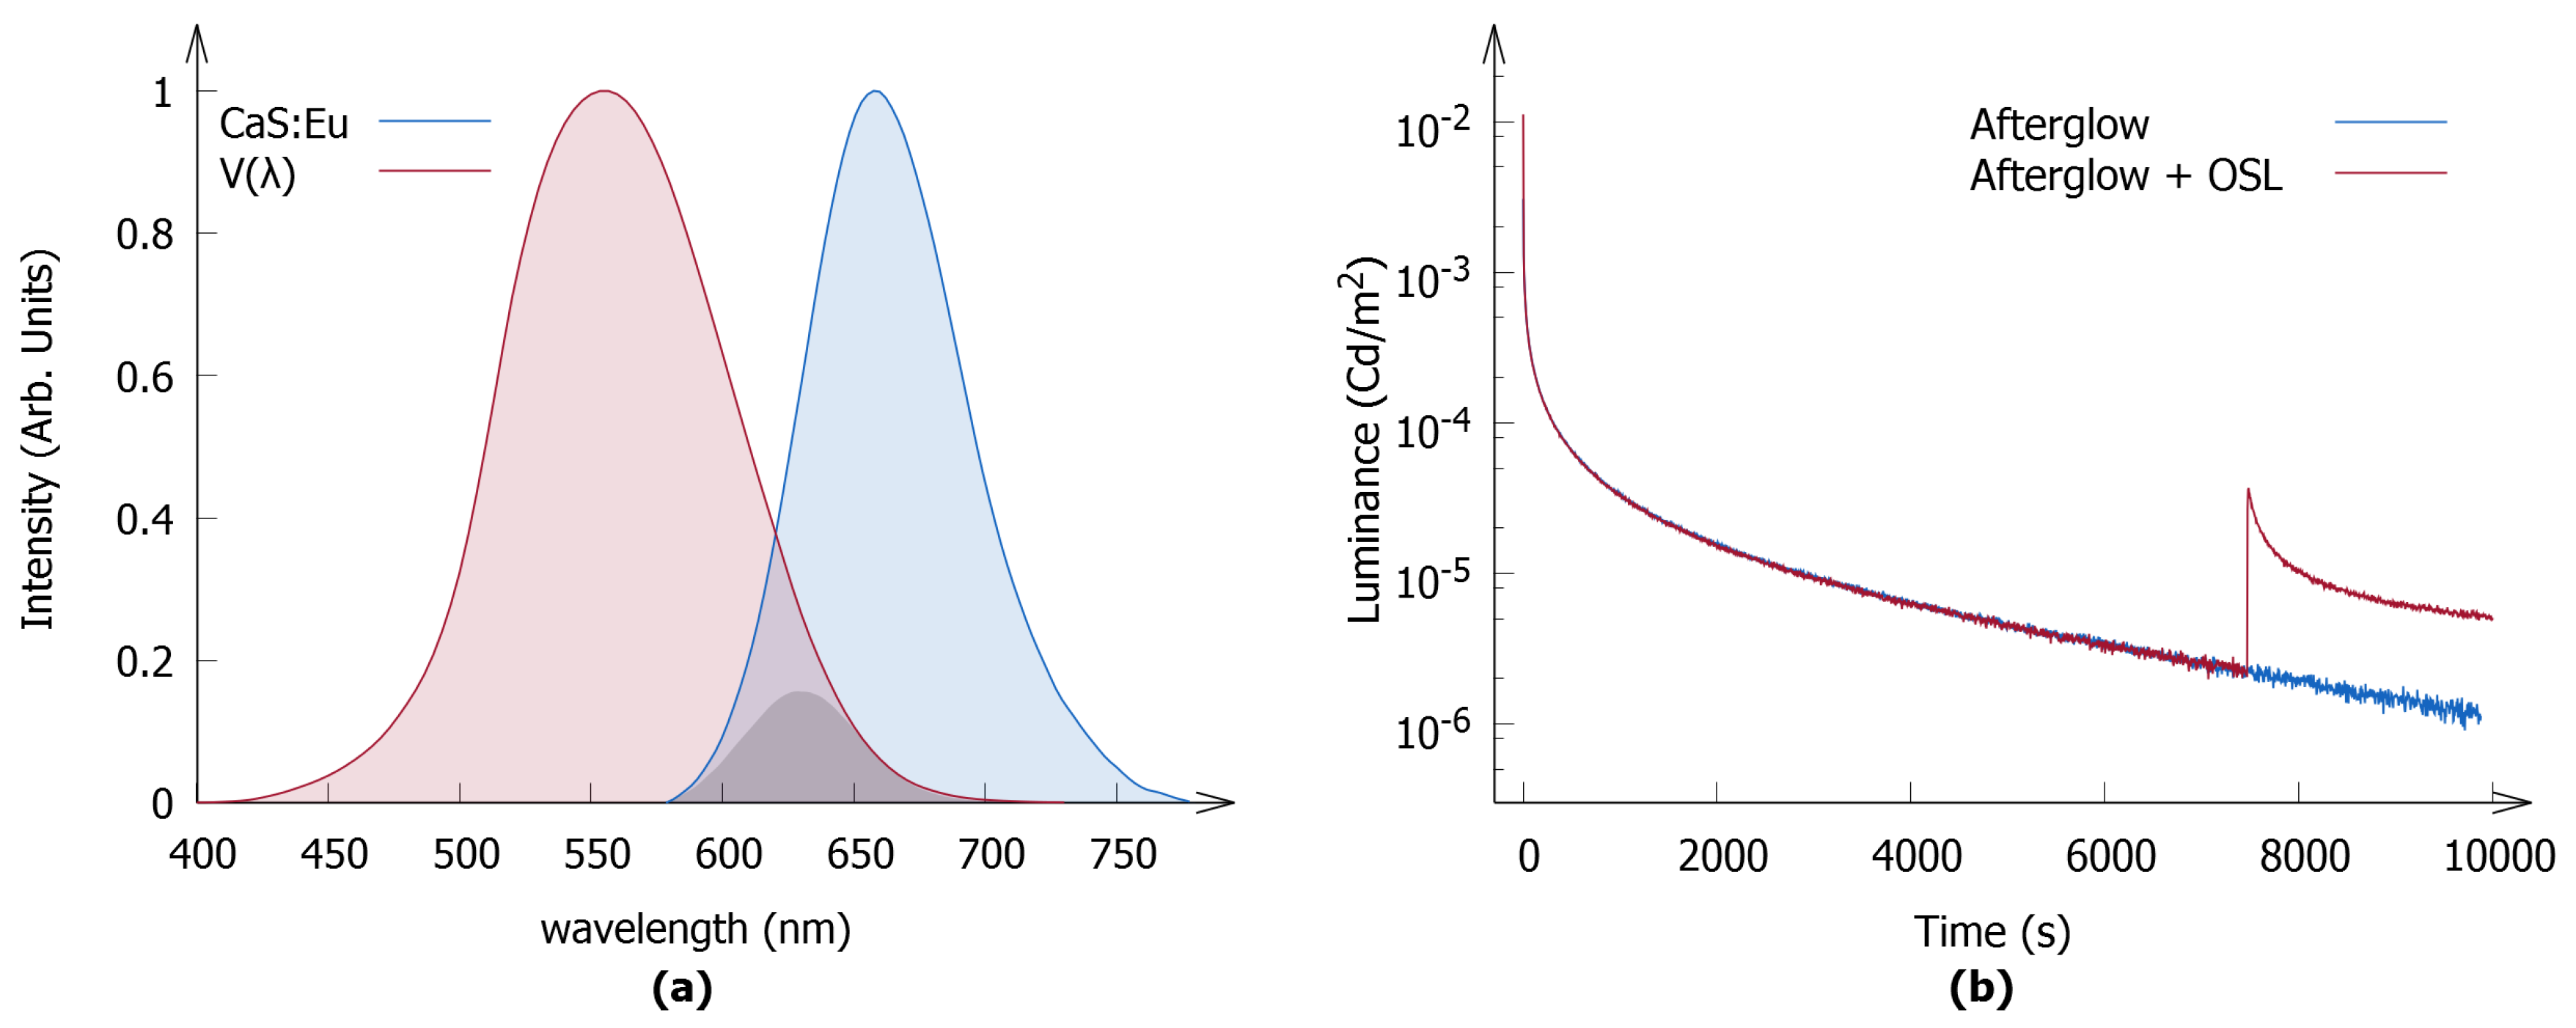
Figure 7.
Diffuse transmission spectrum of an unloaded (i.e., without-phosphor) polymer layer. The spectrum of the 1000 lux Xe-arc industrial standard is also depicted. The shaded area indicates the fraction of light that can be used for excitation of the phosphor, taking into account losses due to the glass substrate and polymer.
© 2017 by the authors. Licensee MDPI, Basel, Switzerland. This article is an open access article distributed under the terms and conditions of the Creative Commons Attribution (CC BY) license (http://creativecommons.org/licenses/by/4.0/).
Share and Cite
MDPI and ACS Style
Van der Heggen, D.; Joos, J.J.; Rodríguez Burbano, D.C.; Capobianco, J.A.; Smet, P.F. Counting the Photons: Determining the Absolute Storage Capacity of Persistent Phosphors. Materials 2017, 10, 867. https://doi.org/10.3390/ma10080867
AMA Style
Van der Heggen D, Joos JJ, Rodríguez Burbano DC, Capobianco JA, Smet PF. Counting the Photons: Determining the Absolute Storage Capacity of Persistent Phosphors. Materials. 2017; 10(8):867. https://doi.org/10.3390/ma10080867
Chicago/Turabian StyleVan der Heggen, David, Jonas J. Joos, Diana C. Rodríguez Burbano, John A. Capobianco, and Philippe F. Smet. 2017. "Counting the Photons: Determining the Absolute Storage Capacity of Persistent Phosphors" Materials 10, no. 8: 867. https://doi.org/10.3390/ma10080867
Note that from the first issue of 2016, this journal uses article numbers instead of page numbers. See further details here.