Corrosion Behavior of Silver-Plated Circuit Boards in a Simulated Marine Environment with Industrial Pollution

Corrosion and Protection Center, University of Science and Technology Beijing, Beijing 100083, China
*
Author to whom correspondence should be addressed.
Materials 2017, 10(7), 762; https://doi.org/10.3390/ma10070762
Submission received: 3 June 2017
/
Revised: 29 June 2017
/
Accepted: 3 July 2017
/
Published: 6 July 2017
Abstract
:The electrochemical corrosion behavior of a silver-plated circuit board (PCB-ImAg) in a polluted marine atmosphere environment (Qingdao in China) is studied through a simulated experiment. The morphologies of PCB-ImAg show some micropores on the surface that act as the corrosion-active points in the tests. Cl− mainly induces microporous corrosion, whereas SO2 causes general corrosion. Notably, the silver color changes significantly under SO2 influence. EIS results show that the initial charge transfer resistance in the test containing SO2 and Cl− is 9.847 × 10³, while it is 3.701 × 10⁴ in the test containing Cl− only, which demonstrates that corrosion accelerates in a mixed atmosphere. Polarization curves further show that corrosion potential is lower in mixed solutions (between −0.397 V SCE and −0.214 V SCE) than it in the solution containing Cl− only (−0.168 V SCE), indicating that corrosion tendency increases with increased HSO3− concentration.
1. Introduction
Currently, electronic components are widely used. However, these components are susceptible to corrosion, especially in environments that contain moisture, dust, and atmosphere pollutant [1,2]. Chlorine (Cl−) and sulfur dioxide (SO2) are significant contaminants in the environment that can lead to high corrosion rates of silver and copper [3,4].
Copper and silver are sensitive to Cl− [5,6,7]. In recent years, the effects of Cl− on the corrosion mechanism of copper have been studied [8,9,10,11,12]. In a solution containing Cl−, CuCl forms rapidly on the surface of copper; this film later transforms into CuCl2−, and protection of the interior copper atoms is lost with continuous penetration of chloride ions [13,14]. The anodic dissolution is determined by the rate of dissolution of the CuCl2− into bulk [14,15]. AgCl usually forms on the surface of silver in physiological NaCl solution [16]. Moreover, a high concentration of Cl− in the electrolyte film accelerates the dissolution of AgCl [17,18,19].
SO2 is one of the main corrosion factors for copper and silver. SO2 can be adsorbed in the thin electrolyte film on the surface of copper and silver when exposed to a humid environment. Studies have found that these presently formed corrosion products, such as Ag2O, AgOH, and Ag2SO3, act as physical barriers that protect the electrode surface. The dissolution rate of SO2 is the control step of the corrosion process [20,21]. One study has demonstrated that SO2 combines in a lattice plane in a type of sulfur compound. The formation of Ag2SO3, Ag2SO4, and Cu4SO4(OH)6 is attributed to the adsorption of SO2 [22,23,24].
The dissolution rate is accelerated with increased HSO3− concentration in a mixed solution containing HSO3− and Cl−. HSO3− is the dominant factor when the potential is below −0.2 V SCE, and Cl− is the control factor when the potential is above −0.2 V SCE [14]. Currently, plated circuit boards (PCBs) are more widely used, but they are more sensitive to pollutants, especially SO2 and Cl−. However, almost no research has been conducted on the corrosion behavior of PCB-ImAg in a polluted environment, especially in an environment that contains Cl− and SO2. The special environment is similar to polluted marine atmosphere environment, such as Qingdao, China.
To study the effects of Cl− and SO2 on PCB-ImAg, the present experiment was performed on the PCB-ImAg specimens in a salt-spray environment (the environment containing Cl− only) and an acid salt-spray environment (the environment containing Cl− and SO2) to simulate the corrosion behavior of PCB-ImAg in a polluted marine atmosphere environment. As SO2 dissolved into the thin liquid film to form HSO3−, some polarization experiments were conducted in a solution environment that contained Cl− and HSO3− to further explain the anti-corrosive property of PCB-ImAg in the polluted marine atmosphere environment.
2. Results
2.1. Morphology Analyses of the Specimens
As shown in Figure 1a, the optical morphology of PCB-ImAg before the test is smooth and keeps the original color. Figure 1b shows that the color of the sample after the salt-spray test containing Cl− only still keeps the original silver color. The difference is that several corrosion parts are observed on the silver surface after 16 h. The morphology of PCB-ImAg in the test containing Cl− and SO2 is quite different from the morphology in Figure 1b. The color of PCB-ImAg has changed a lot after 16 h. The surface has been heavily damaged as shown in Figure 1c. This phenomenon shows that silver is quite sensitive to SO2, even with tiny amounts of SO2.
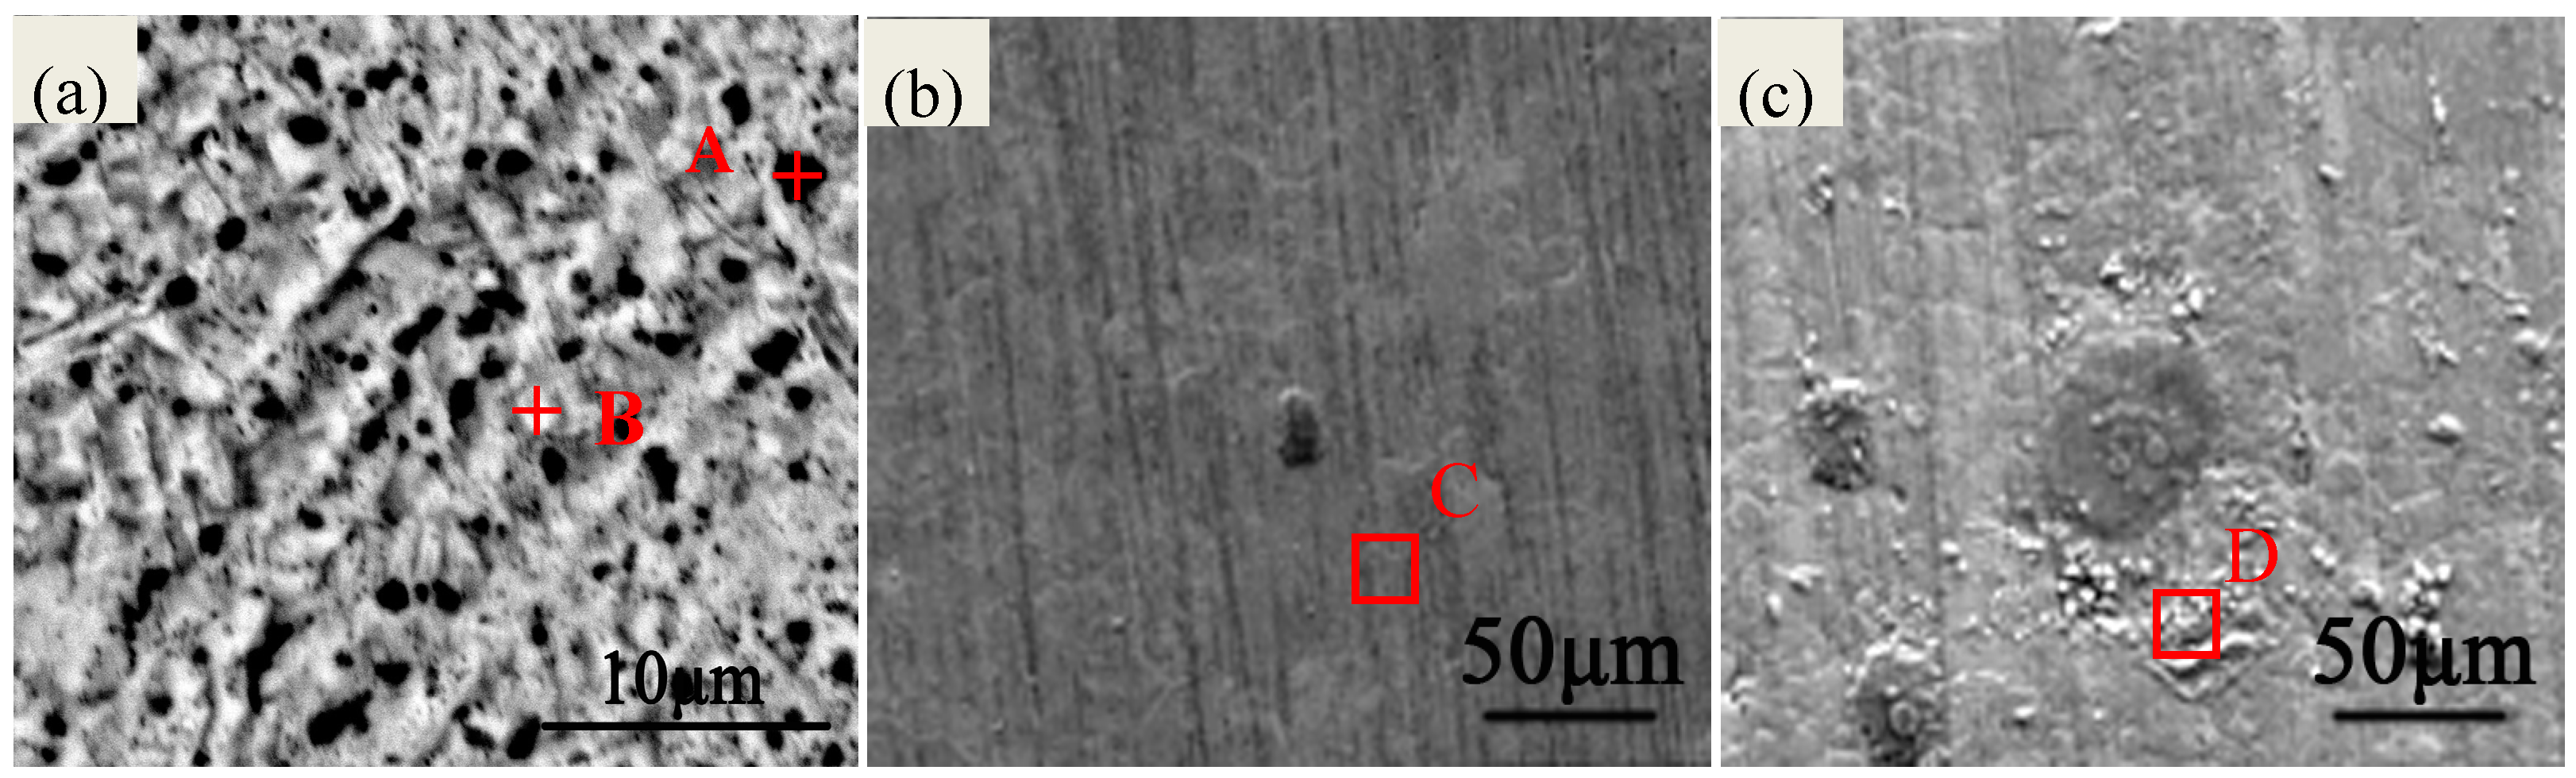
Figure 2a shows the SEM (FEI Quanta 250, Hillsboro, OR, USA) morphology of PCB-ImAg before testing. Several micropores are observed on the surface where these micropores act as corrosion-active sites. Energy-dispersive spectroscopy (EDS, EDAX, Mahwah, NJ, USA) results of Figure 2a as shown in Table 1 indicate that the ratio of Ag/Cu elements is much lower in point A than the value in point B. The results show that the amount of Ag element is lower in defects; hence, the copper substrate cannot obtain good protection. Moreover, Figure 2b also shows only one bump of corrosion product in the test containing Cl− only. However, the samples located in the test containing SO2 and Cl− have suffered from more serious damage. Moreover, the EDS results of areas A and B show that the oxygen content obviously increases in the corrosion products, these results suggest more serious corrosion occurs under the environment containing SO2 and Cl− condition.
2.2. Electrochemical Impedance Spectroscopy Analysis
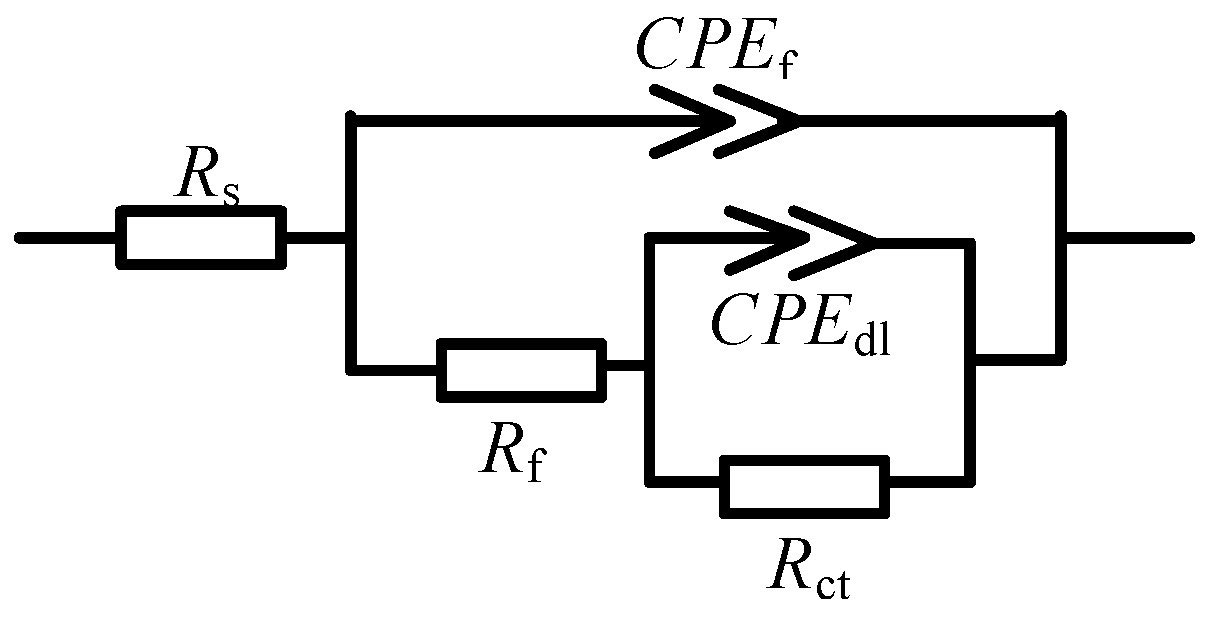
Impedance measurements were carried out for the samples after being subjected to salt tests (the test containing Cl− only and the test containing Cl− and SO2) to study the effects of SO2 on the corrosion behavior of sample. The EIS diagram was shown in Figure 3. The equivalent circuits presented in Figure 4 were used to fit the electrochemical impedance spectroscopy (EIS) data. Rs corresponds to the electrolyte resistance; CPEf and Rf correspond to the capacitance dispersion and resistance of the corrosion products on the surface coating, respectively; and CPEdl and Rct represent the electric double-layer capacitor and charge transfer at the interface, respectively. The changes in the CPEf and CPEdl are related to the changes in the material surface. Rf shows the protection of the surface coating and the corrosion products. Rct represents the corrosion rate; a high value corresponds to a slow rate. Rct1 illustrates the charge transfer of samples in the salt-spray test containing Cl− and SO2, and Rct2 represents the charge transfer of samples in the salt-spray test containing Cl− only. The corresponding fitting results of the EIS for PCB-ImAg under the two test environments are listed in Table 2 and Table 3.
The Nyquist plot shows two capacitive arcs: the high-frequency one conveys information on the surface coating or corrosion products, whereas the other, at low frequency, conveys information on the interface reaction. A comparison between the two figures shows that the radius in Figure 3a are always lower than that in Figure 3b, this finding suggests that SO2 can accelerate the corrosion of PCB-ImAg. Moreover, Table 3 indicates that Rct1 shows the minimal at the initial stage of the test containing SO2 and Cl−, that is, the corrosion rate is the greatest. As the extension of the salt spray test time, the corrosion rate shows a decreasing trend. However, after 24 h, the corrosion rate gradually increases. When the test time reaches 168 h, the corrosion rate decreases again. This phenomenon will be explained in the discussion part.
2.3. Electrochemical Measurements in Different Types of Solutions
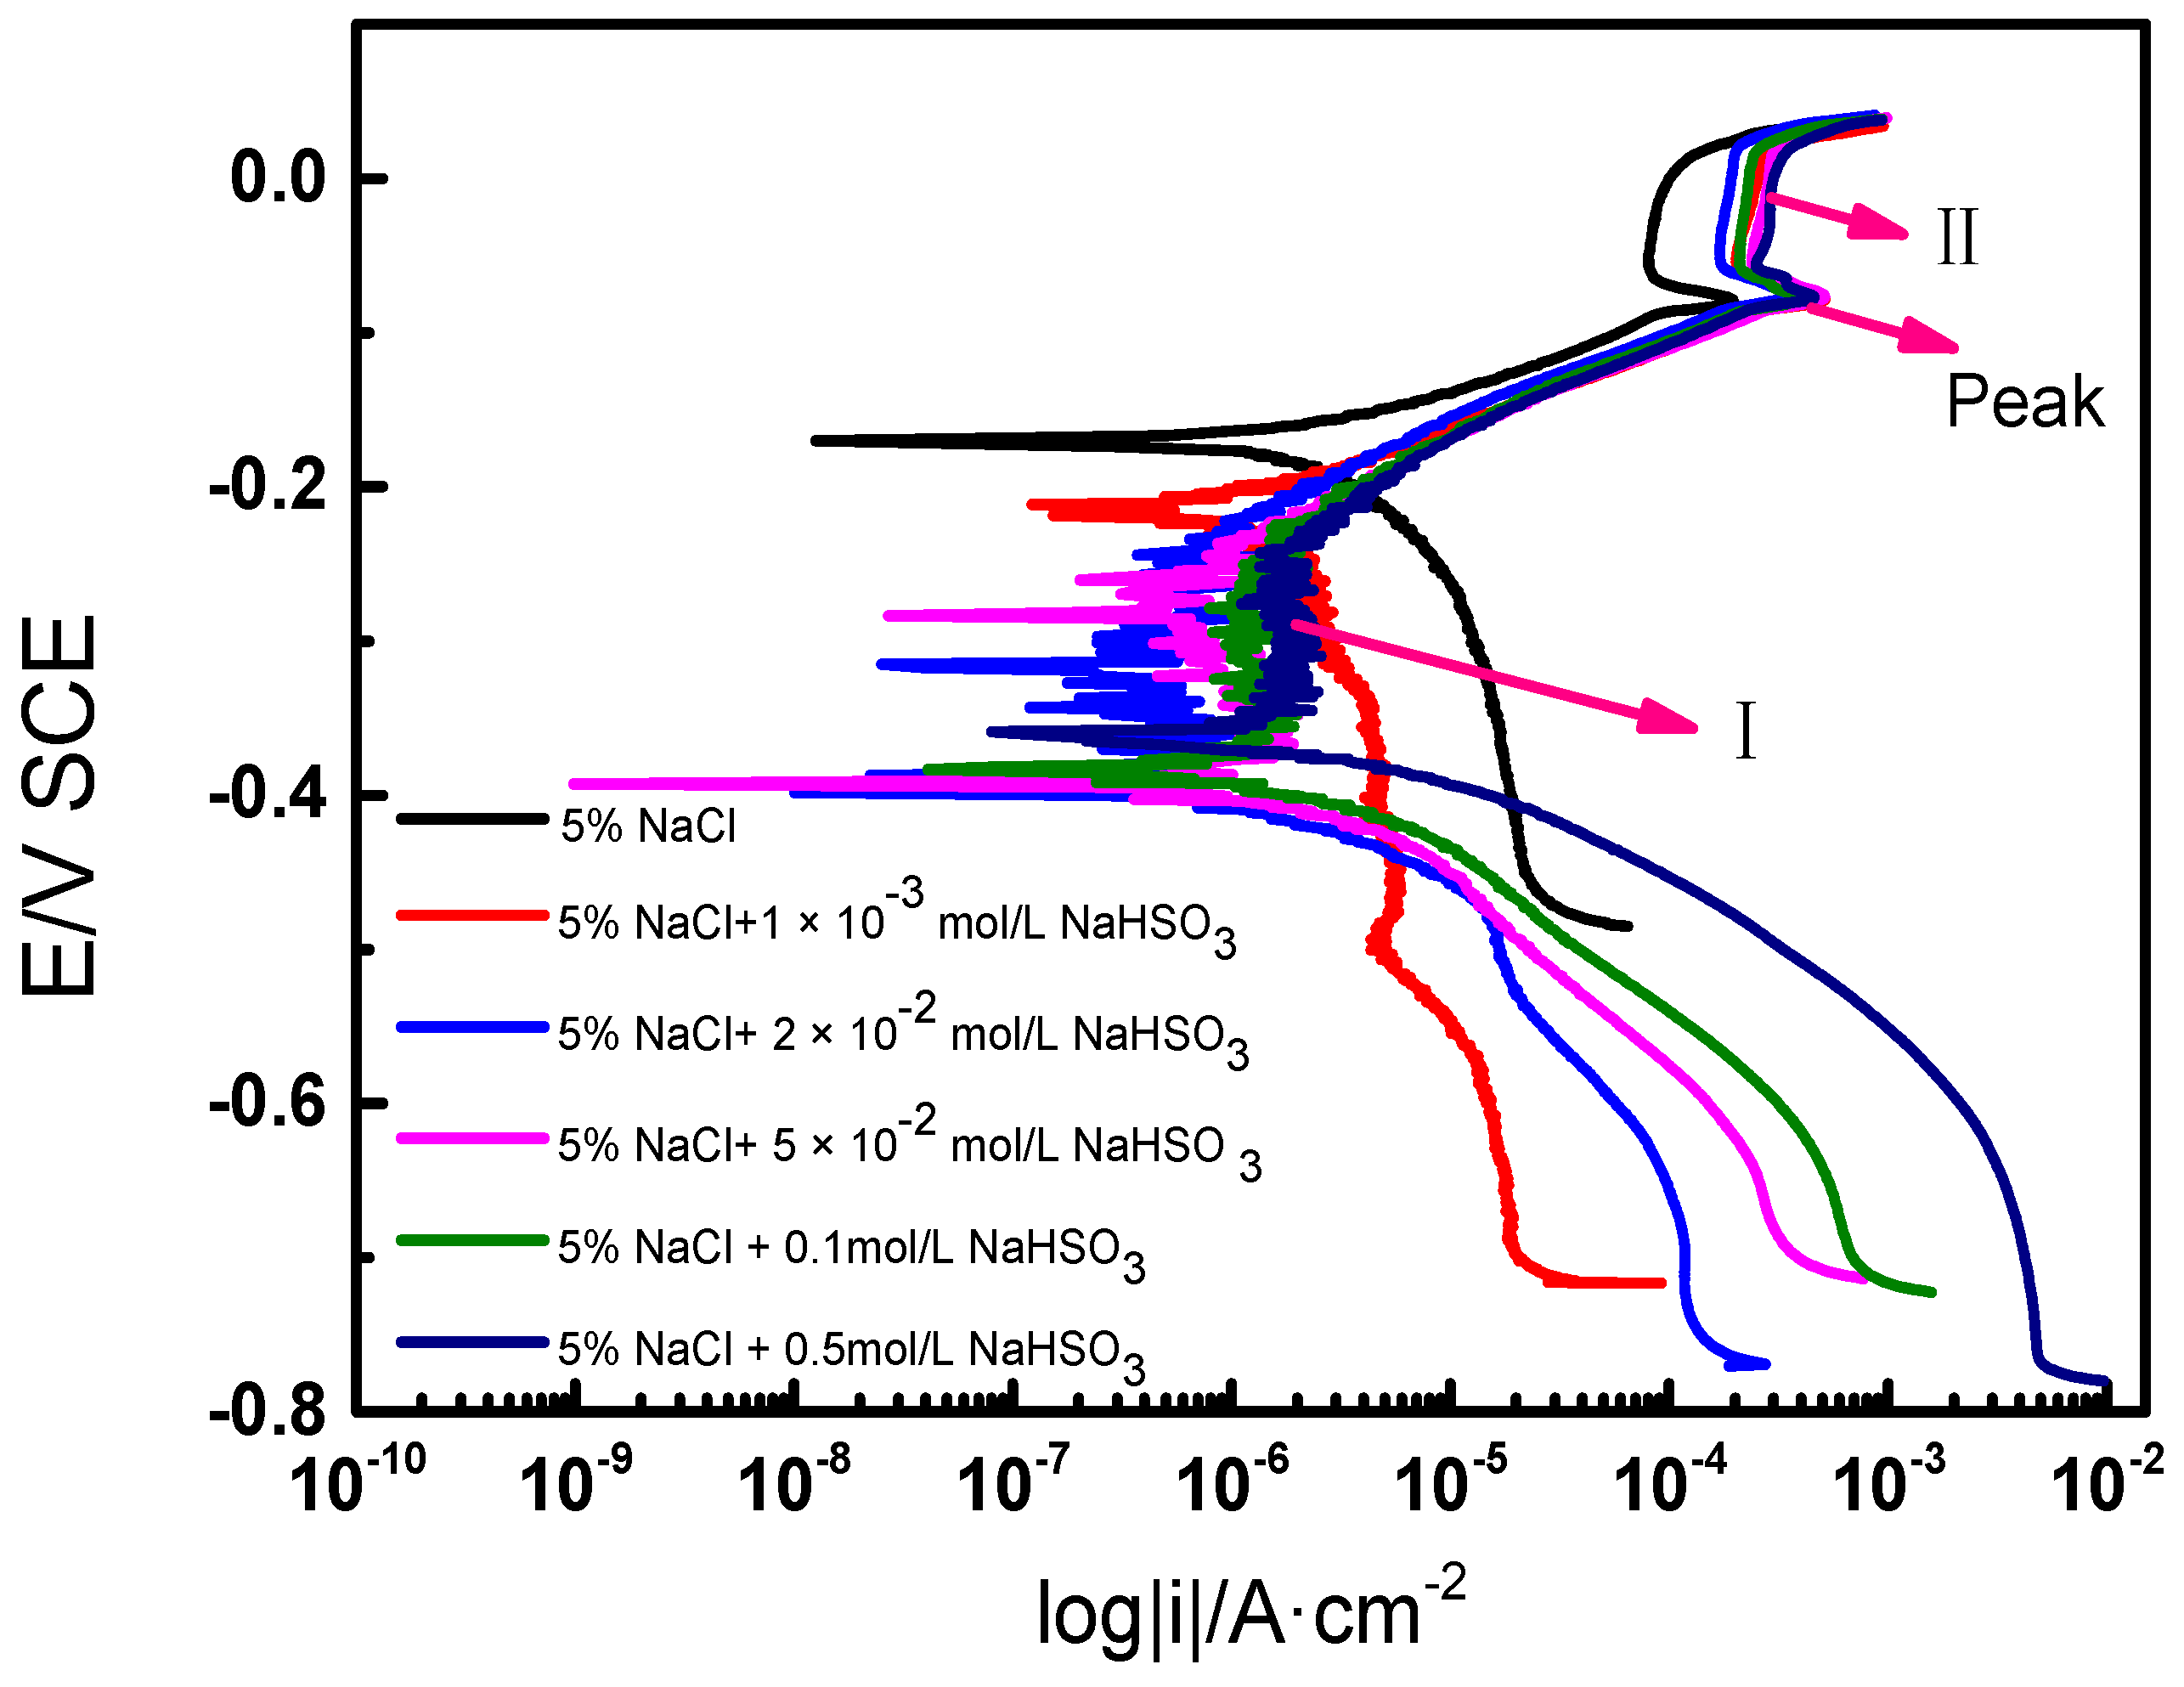
The potentiodynamic polarization behavior of PCB-ImAg specimens in the 5% NaCl solution and the five other solutions containing different concentrations of NaHSO3 are shown in Figure 5. The cathodic current density shifts to more noble values with increased NaHSO3 concentration. This phenomenon indicates that cathodic reactions are accelerated by adding HSO3− ions in the solution. The corrosion potential of the sample in the blended aqueous solution system is lower, which indicates that the samples corrode easily in the mixed solution.
All of the potentiodynamic curves have similar appearance in Region I. Corrosion has occurred in this region, and these corrosion products may have protective effects for the underlying layers. In addition, the current peak of the sample in the solution containing NaHSO3 is higher, which shows that the anodic dissolution is significant in this solution. The equilibrium potential of the AgCl is −0.0218 V SCE, as shown in Equation (1). This equilibrium potential deviates from the passive potential, which may be attributed to different species of corrosion ions and different concentrations of corrosion ions. Thus, Region II appearance can be attributed to the formation of AgCl [3]. The current density is high in the system that contains HSO3− at the peak and region II labeled curve sections; these high densities show that a protective, anti-corrosion film is difficult to form on samples in mixed solutions. Thus, the polarization potential at approximately 0.02 V SCE leads to a rapid increase in current density because of the breakdown of the AgCl film. The continuous penetration of chloride ions dissolves the AgCl to form soluble AgCl2−. This reaction equation is shown in Equation (2).
HSO3− is the main controlling factor in a mixed solution when the potential is lower than −0.2 V SCE. An unstable passivation zone appears near the corrosion potential when the HSO3− concentration is higher than 0.02 mol/L. The fluctuation of current density indicates the existence of two or more reactions. Passivation and activation alternately appear in the potential region. The current density increases when activation appears, and the current density decreases when passivation appears.
3. Discussions
All of the phenomena of the simulated test containing Cl− only indicate that silver has strong resistance to Cl−; hence, the color of the silver coating shows no significant changes in a short period. The corrosion morphology shows microporous corrosion. The sedimentation of NaCl particles accelerates the formation of thin electrolyte film. Additionally, due to very thin surface coating, the surface has micro hole defects, and the defects are the corrosion-active sites [25]. Moreover, SO2 can induce color change on Ag [26,27]. SO2 dissolves in the thin electrolyte film to acidize the chemical environment, which aggravates the corrosion degree of the PCB-ImAg.
EIS measurements show that the charge transfer resistance is lower in the test containing SO2. Additionally, a large semicircle on the impedance spectrum is obtained in the salt-spray test containing Cl− only; this result is related to the dissolution of SO2 in the liquid film. It is consistent with the conclusions of previous studies [21,28,29]. The charge transfer resistance of the sample under the SO2 and Cl− condition shows initial increases, then decreases, and finally increases again. This phenomenon can be explained as follows: at the initial stage, the electrolyte containing Cl− progressively permeates into the micropores under the activation effects of SO2 that results in the corrosion of the substrate (Cu) of nearby the micropores. Moreover, the galvanic corrosion occurs between the copper (anode) and ImAg layer (cathode). The corrosion rate was accelerated under the big cathode small anode model. Consequently, the initial corrosion rate of the sample under the salt-spray test containing SO2 and Cl− is quite large. However, at 24 h, the corrosion products accumulated on the micropores on the sample’s surface; this accumulation hinders the penetration of electrolyte into the micropores to some extent. Accordingly, the corrosion rate decreases at that time. With the increase of test time, the corrosion process occurs on the entire surface of PCB, that is, general corrosion, which also leads to the increasing of corrosion rate. A great number of corrosion products pile on the entire surface after 168 h; hence, the corrosion rate decreases again. This result is similar to the conclusions of a previous study [30].
The dissolution rate of brass increases with the increase of HSO3− concentration in a mixed solution, which contains HSO3− and Cl− [13]. In this test, the cathodic current density is accelerated by adding HSO3− ions to the solution; these results are due to the adsorption of Cl− and HSO3− on the electrode. Lower corrosion potential and higher corrosion current density are obtained with the increase of the concentration of NaHSO3 due to the reaction between anions absorbed onto the electrode with the metal. The lower corrosion potential indicates that the corrosive tendency of electrodes increases. The decrease in corrosion current density is due to the formation of protective corrosion products, which hinders the invasion of ions.
Several studies have reported the corrosion effects of Cl−, which showed that the diameters of chloride ions are small and have strong penetration [29,30]. The region of the current fluctuation is formed by adding HSO3−. The reaction occurs rapidly between HSO3− and the electrode. Then, an unstable passive film forms on the surface. However, Cl− ions have penetrability, and thus they react with the formed passive film. These reactions occur alternately, which explains the formation of the unstable region. An unstable passivation zone near the corrosion potential is due to the process of accelerating and inhibiting the electrode dissolution rate, which is similar to the results of another study [29]. AgCl would form under the penetration of Cl−, but this AgCl film would dissolve with the acceleration of Cl− [3]. In this study, with the rise in potential, a more stable AgCl film was formed by the reaction of the silver coating and Cl−. The appearance of peak current density indicates that the AgCl film has dissolved quickly by the erosion of Cl−. The copper substrate loses protection from the AgCl film. Then, copper chloride forms. However, this film is less protective. Thus, the corrosion resistance of the PCB-ImAg specimen is poor in the mixed solution because an acidic environment is created by adding HSO3−, and the silver coating is sensitive to the HSO3−.
4. Materials and Methods
4.1. Design of the Experimental Setup
Salt-spray and acid salt-spray environments were simulated on a PCB-ImAg with the following structural parameters: the substrate material was FR-4 epoxy glass cloth laminate, 0.8 mm thickness, the underlying copper was 35 µm thick, and the thickness of the immersion silver which coated on Cu substrate was 0.02 µm. Before tests, the samples were dipped in acetone and cleaned with an ultrasonic washer for 10 min. Next, the samples were cleaned with deionized water for 10 min. The last step was air-drying after scrubbing with anhydrous ethyl alcohol. The samples were placed in a homemade box, and then the device was placed in two test chambers for 16, 24, 48, 96, and 168 h. The parameters of one chamber include temperature at 35 °C and salt fog concentration of 5% NaCl. SO2 was continuously bubbled into this chamber during the experiment. The parameters of the other chamber include temperature at 35 °C and salt fog concentration of 5% NaCl but with no SO2. After the salt-spray test, the samples were withdrawn and subjected to rinsing by the deionized water and dried with compressed air.
Analytical-grade NaCl, NaHSO3, and distilled water were used to prepare the solutions for the polarization curve test. The solution concentrations used in this experiment were as follows: 5% (wt) NaCl +0, 0.001, 0.02, 0.05, 0.1, and 0.5 mol/L Na2SO4.
4.2. Surface Analysis Methods
After the corrosion tests, surface analysis methods were applied, such as stereology macroscopy (VHX-2000, Keyence, Japan) and scanning electron microscope (SEM, FEI Quanta 250, Hillsboro, OR, USA).
4.3. Electrochemical Measurements
EIS and polarization curves were conducted using the PARSTAT 2273 electrochemical workstation (Princeton Applied Research, Oak Ridge, TN, USA). Electrochemical measurements were performed with a three-electrode cell. PCB-ImAg samples acted as the working electrodes. Platinum was used as the counter electrode, and a saturated calomel electrode was employed as the reference electrode. The available working area was 1 cm2.
After the salt-spray tests, the EIS experiment on the specimens were conducted in analytically pure 0.1 mol/L Na2SO4 solution. Each set of tests was performed three times, and then Zview V3.1 (Princeton Applied Research, Oak Ridge, TN, USA) software was used to fit the EIS data.
Polarization curve analysis of the PCB-ImAg in the solution containing NaCl and NaHSO3 was performed. The polarization curve was measured from −0.5 V (vs. open circuit potential) with a scan rate of 0.333 mV/s. When the polarization current density reaches 1 mA·cm−2, the polarization curve test automatically stops.
5. Conclusions
The electrochemical corrosion behavior of PCB-ImAg in a polluted marine atmosphere environment (Qingdao in China) is studied through a simulated experiment. The main conclusions are as follows.
- (1)
- Cl− mainly induces the microporous corrosion. The silver coating is not sensitive to Cl−. Also, the settlements of salt particles on the surface of PCB-ImAg act as the corrosion-active points.
- (2)
- SO2 mainly induces general corrosion of silver coating. The color of silver changes significantly under the influence of SO2. Then, the silver coating protection of the copper substrate decreases quickly.
- (3)
- The lower charge transfer resistance obtained in a test containing SO2 demonstrates that the corrosion rate is accelerated in a mixed atmosphere.
- (4)
- The corrosion potential is lower in mixed solutions, which indicates that the corrosion tendency increases with the increase of HSO3− concentration. Addition of HSO3− ions results in current fluctuation at the potential near the corrosion potential.
Acknowledgments
This work was supported by the National Natural Science Foundation of China (No. 51671027 & 51271032 & 51131005); National Basic Research Program of China (973 Program) (No. 2014CB643300); and the National Environmental Corrosion Platform (NECP).
Author Contributions
Kui Xiao and Pan Yi conceived and designed the experiments; Pan Yi, Lidan Yan, Ziheng Bai, Pengfei Dong and Xiong Gao performed the experiments; Kui Xiao and Pan Yi analyzed the data; Kui Xiao and Chaofang Dong contributed reagents/materials/analysis tools; Kui Xiao wrote the paper.
Conflicts of Interest
The authors declare no conflict of interest.
References
- Kim, H. Corrosion process of silver in environments containing 0.1 ppm H2S and 1.2 ppm NO2. Mater. Corros. 2003, 54, 243–250. [Google Scholar] [CrossRef]
- Zou, S.; Li, X.; Dong, C.; Ding, K.; Xiao, K. Electrochemical migration, whisker formation, and corrosion behavior of printed circuit board under wet H2S environment. Electrochim. Acta 2013, 114, 363–371. [Google Scholar] [CrossRef]
- Comizzoli, R.; Frankenthal, R.; Milner, P.; Sinclair, J. Corrosion of electronic materials and devices. Science 1986, 234, 340–346. [Google Scholar] [CrossRef]
- Wiesinger, R.; Martina, I.; Kleber, C.; Schreiner, M. Influence of relative humidity and ozone on atmospheric silver corrosion. Corros. Sci. 2013, 77, 69–76. [Google Scholar] [CrossRef]
- Tromans, D.; Sun, R.H. Anodic behavior of copper in weakly alkaline solutions. J. Electrochem. Soc. 1992, 139, 1945–1951. [Google Scholar] [CrossRef]
- Huang, H.; Pan, Z.; Guo, X.; Qiu, Y. Effects of direct current electric field on corrosion behaviour of copper, Cl− ion migration behaviour and dendrites growth under thin electrolyte layer. Trans. Nonferr. Met. Soc. China 2014, 24, 285–291. [Google Scholar] [CrossRef]
- Rickett, B.; Payer, J. Composition of copper tarnish products formed in moist air with trace levels of pollutant gas: Sulfur dioxide and sulfur dioxide/nitrogen dioxide. J. Electrochem. Soc. 1995, 142, 3713–3722. [Google Scholar] [CrossRef]
- Kear, G.; Barker, B.; Walsh, F. Electrochemical corrosion of unalloyed copper in chloride media––A critical review. Corros. Sci. 2004, 46, 109–135. [Google Scholar] [CrossRef]
- Warraky, A.E.; Shayeb, H.E.; Sherif, E. Pitting corrosion of copper in chloride solutions. Anti-Corros. Methods Mater. 2004, 51, 52–61. [Google Scholar] [CrossRef]
- Liao, X.; Cao, F.; Zheng, L.; Liu, W.; Chen, A.; Zhang, J.; Cao, C. Corrosion behaviour of copper under chloride-containing thin electrolyte layer. Corros. Sci. 2011, 53, 3289–3298. [Google Scholar] [CrossRef]
- Alfantazi, A.; Ahmed, T.; Tromans, D. Corrosion behavior of copper alloys in chloride media. Mater. Des. 2009, 30, 2425–2430. [Google Scholar] [CrossRef]
- Qiang, Y.; Zhang, S.; Xu, S.; Li, W. Experimental and theoretical studies on the corrosion inhibition of copper by two indazole derivatives in 3.0% NaCl solution. J. Colloid Interface Sci. 2016, 472, 52–59. [Google Scholar] [CrossRef] [PubMed]
- Liu, Q.; Luo, H.; Dong, C.; Xiao, K.; Li, X. The electrochemical behaviour of brass in NaHSO3 solution without and with Cl. Int. J. Electrochem. Sci. 2012, 7, 11123–11136. [Google Scholar]
- Betova, I.; Bojinov, M.; Lilja, C. Influence of chloride on the long-term interaction of copper with deoxygenated neutral aqueous solutions. Corros. Sci. 2013, 76, 192–205. [Google Scholar] [CrossRef]
- Rahal, C.; Masmoudi, M.; Abdelhedi, R.; Sabot, R.; Jeannin, M.; Bouaziz, M.; Refait, P. Olive leaf extract as natural corrosion inhibitor for pure copper in 0.5 M NaCl solution: A study by voltammetry around OCP. J. Electroanal. Chem. 2016, 769, 53–61. [Google Scholar] [CrossRef]
- Sarkar, N.; Fuys, J., Jr.; Stanford, J. The chloride corrosion behavior of silver-base casting alloys. J. Dent. Res. 1979, 58, 1572–1577. [Google Scholar] [CrossRef] [PubMed]
- Ha, H.; Payer, J. The effect of silver chloride formation on the kinetics of silver dissolution in chloride solution. Electrochim. Acta 2011, 56, 2781–2791. [Google Scholar] [CrossRef] [PubMed]
- Jin, X.; Lu, J.; Liu, P.; Tong, H. The electrochemical formation and reduction of a thick AgCl deposition layer on a silver substrate. J. Electroanal. Chem. 2003, 542, 85–96. [Google Scholar] [CrossRef]
- Graedel, T. Corrosion mechanisms for silver exposed to the atmosphere. J. Electrochem. Soc. 1992, 139, 1963–1970. [Google Scholar] [CrossRef]
- Changjiang, Y.; Chenghao, L.; Peng, W. Investigation of the tarnish on the surface of a panda gold coin. R. Metals 2007, 26, 68–73. [Google Scholar] [CrossRef]
- Volpe, L.; Peterson, P. The atmospheric sulfidation of silver in a tubular corrosion reactor. Corros. Sci. 1989, 29, 1179–1187, 1189–1196. [Google Scholar] [CrossRef]
- Odnevall, I.; Leygraf, C. Atmospheric corrosion of copper in a rural atmosphere. J. Electrochem. Soc. 1995, 142, 3682–3689. [Google Scholar] [CrossRef]
- Feliú, S., Jr.; Mariaca, L.; Simancas, J.; González, J.; Morcillo, M. X-ray photoelectron spectroscopy study of the effect of nitrogen dioxide and sulfur dioxide on the atmospheric corrosion of copper at low relative humidity values. Corrosion 2005, 61, 627–638. [Google Scholar] [CrossRef]
- Tidblad, J.; Leygraf, C. Atmospheric corrosion effects of SO2 and NO2 a comparison of laboratory and field-exposed copper. J. Electrochem. Soc. 1995, 142, 749–756. [Google Scholar] [CrossRef]
- Pan, Y.; Kui, X.; Ding, K.; Gang, L.; Dong, C.; Li, X. In situ investigation of atmospheric corrosion behavior of PCB-ENIG under adsorbed thin electrolyte layer. Trans. Nonferr. Met. Soc. China 2016, 26, 1146–1154. [Google Scholar]
- Gil, H.; Buitrago, C.; Echavarría, A. Characterization of atmospheric corrosion products formed on silver in tropical-mountain environments. J. Solid State Electrochem. 2015, 19, 1817–1825. [Google Scholar] [CrossRef]
- Wan, Y.; Wang, X.; Wang, X.; Li, Y.; Sun, H.; Zhang, K. Determination and generation of the corrosion compounds on silver exposed to the atmospheres. Int. J. Electrochem. Sci. 2015, 10, 2336–2354. [Google Scholar]
- Stratmann, M.; Streckel, H. On the atmospheric corrosion of metals which are covered with thin electrolyte layers—I. Verification of the experimental technique. Corros. Sci. 1990, 30, 681–696. [Google Scholar] [CrossRef]
- Watanabe, M.; Hokazono, A.; Handa, T.; Ichino, T.; Kuwaki, N. Corrosion of copper and silver plates by volcanic gases. Corros. Sci. 2006, 48, 3759–3766. [Google Scholar] [CrossRef]
- Olsson, C.O.; Landolt, D. Passive films on stainless steels—Chemistry, structure and growth. Electrochim. Acta 2003, 48, 1093–1104. [Google Scholar] [CrossRef]
Figure 1.
Optical micrographs of a PCB-ImAg test specimen (a) 0 h; (b) the sample in the test containing Cl− only after 16 h; (c) the sample in the test containing Cl− and SO2 after 16 h.
Figure 1.
Optical micrographs of a PCB-ImAg test specimen (a) 0 h; (b) the sample in the test containing Cl− only after 16 h; (c) the sample in the test containing Cl− and SO2 after 16 h.
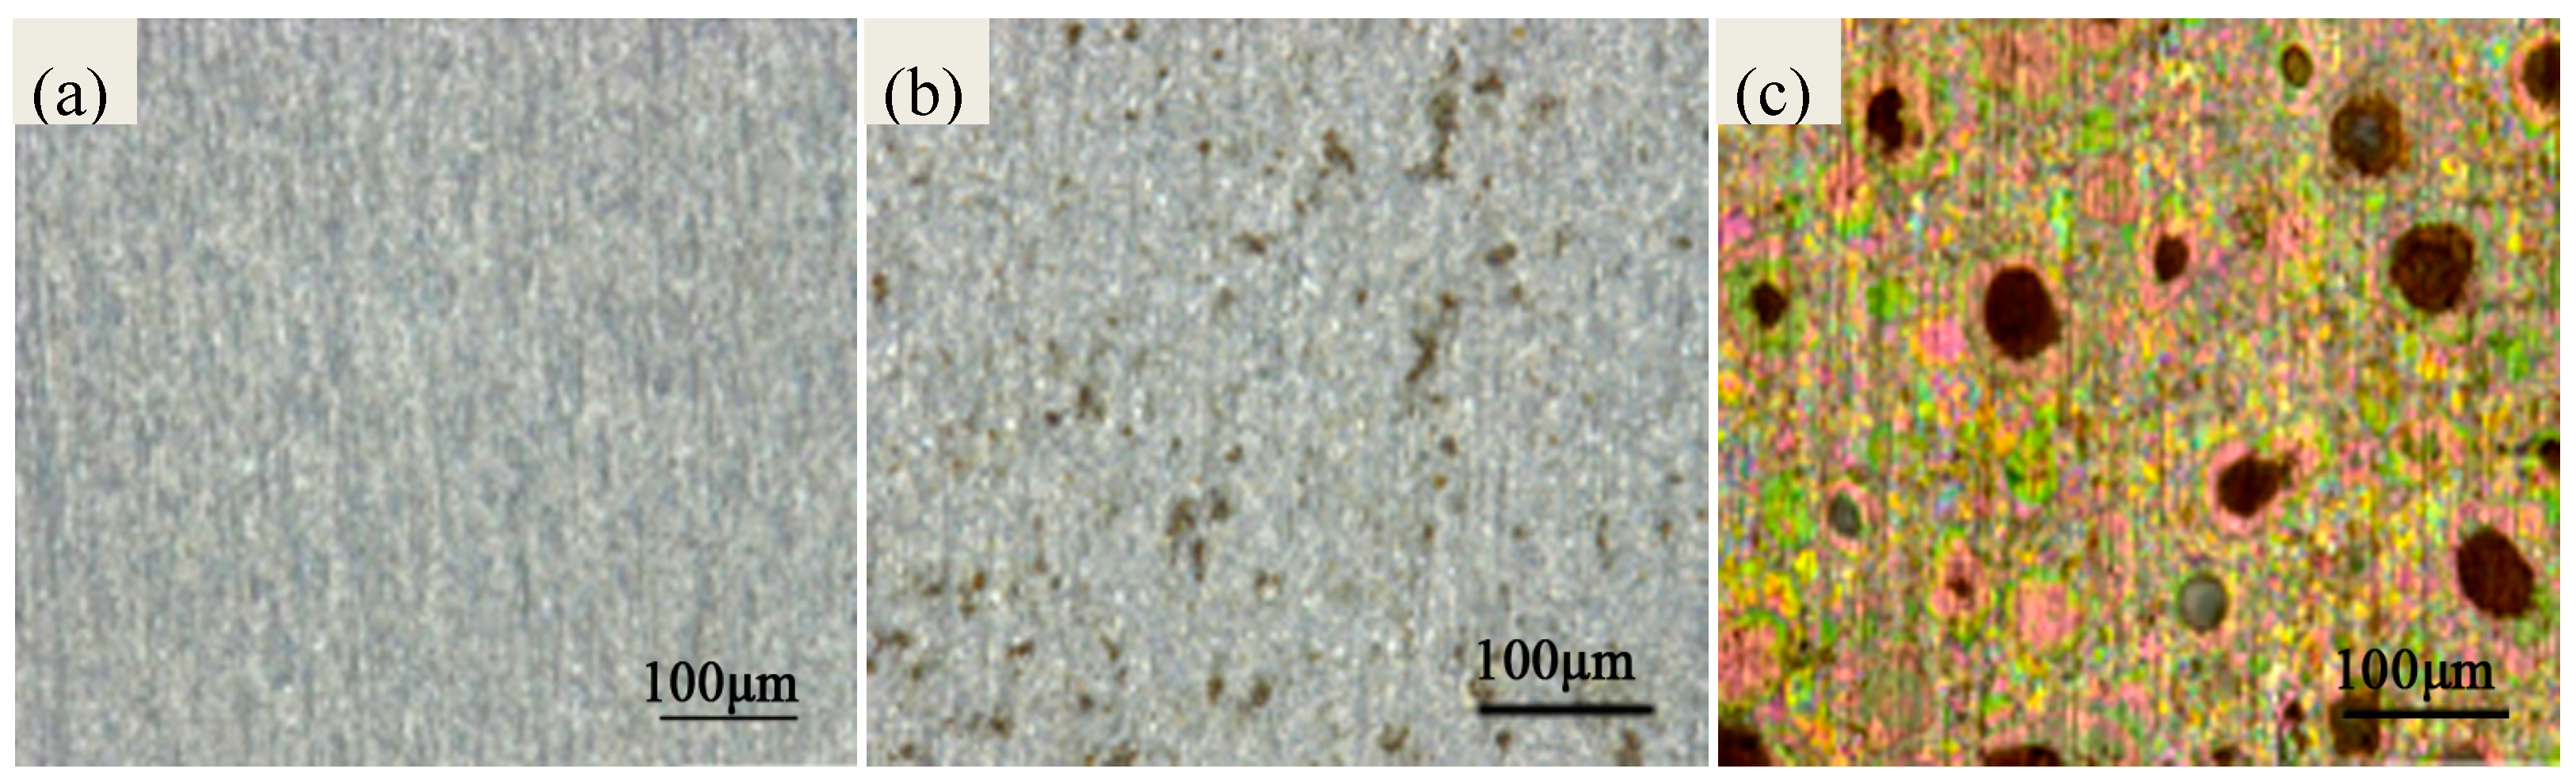
Figure 2.
SEM morphology of PCB-ImAg: (a) 0 h; (b) PCB-ImAg in the test containing Cl− only after 16 h; (c) PCB-ImAg in the test containing Cl− and SO2 after16 h
Figure 2.
SEM morphology of PCB-ImAg: (a) 0 h; (b) PCB-ImAg in the test containing Cl− only after 16 h; (c) PCB-ImAg in the test containing Cl− and SO2 after16 h

Figure 3.
EIS and fitting curves of PCB-ImAg: (a) Nyquist fitting curves of the specimen after SO2 containing salt-spray test; (b) Nyquist fitting curves after the salt-spray test with no SO2.
Figure 3.
EIS and fitting curves of PCB-ImAg: (a) Nyquist fitting curves of the specimen after SO2 containing salt-spray test; (b) Nyquist fitting curves after the salt-spray test with no SO2.
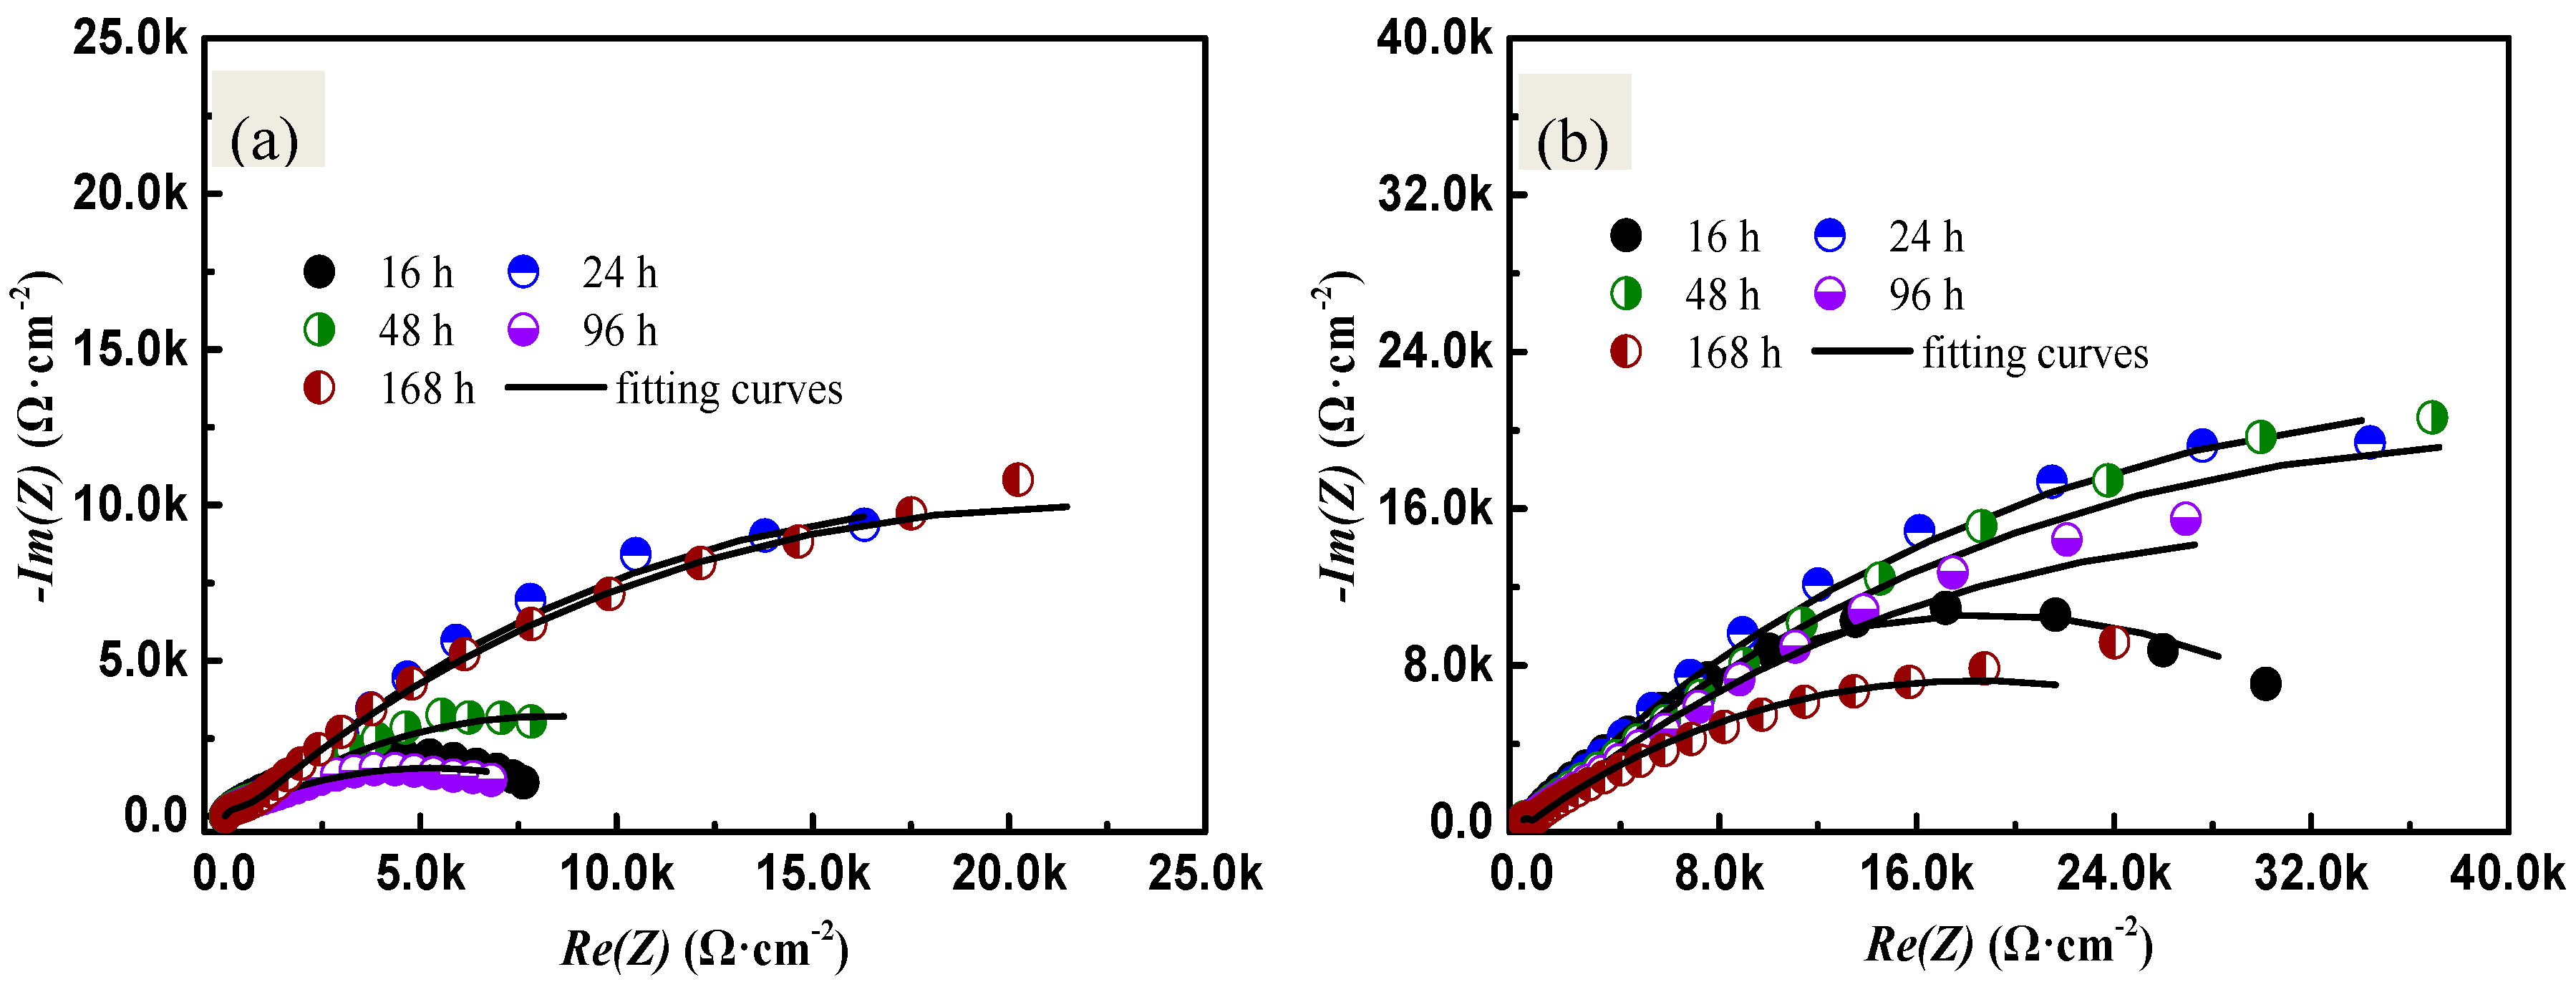
Figure 4.
EIS equivalent circuits of PCB-ImAg specimen.
Figure 5.
Polarization curves of PCB-ImAg in different electrolyte solutions: (a) 5% NaCl; (b) 5% NaCl + 1 × 10⁻³ mol/L NaHSO3; (c) 5% NaCl + 2 × 10⁻² mol/L NaHSO3; (d) 5% NaCl + 5 × 10⁻² mol/L NaHSO3; (e) 5% NaCl + 0.1 mol/L NaHSO3; (f) 5% NaCl + 0.5 mol/L NaHSO3.
Figure 5.
Polarization curves of PCB-ImAg in different electrolyte solutions: (a) 5% NaCl; (b) 5% NaCl + 1 × 10⁻³ mol/L NaHSO3; (c) 5% NaCl + 2 × 10⁻² mol/L NaHSO3; (d) 5% NaCl + 5 × 10⁻² mol/L NaHSO3; (e) 5% NaCl + 0.1 mol/L NaHSO3; (f) 5% NaCl + 0.5 mol/L NaHSO3.

Table 1.
EDS results of A and B points in Figure 2 (at %).
Table 1.
EDS results of A and B points in Figure 2 (at %).
| Chemical Elements | Ag | Cu | O | S | C | Cl |
|---|---|---|---|---|---|---|
| A | 26.62 | 73.38 | - | - | - | - |
| B | 57.91 | 42.09 | - | - | - | - |
| C | 38.93 | 45.53 | 0.83 | - | 13.56 | 1.15 |
| D | 17.84 | 33.26 | 42.75 | 0.28 | 5.33 | 0.55 |
Table 2.
Impedance parameters after salt-spray tests containing Cl− and SO2.
| Experimental Period/h | Rs/Ω | Qdl/Ω−1·cm−2·s−n | n2 | Rdl/Ω |
|---|---|---|---|---|
| 16 | 10.30 | 1.831 × 10⁻⁶ | 1 | 9.847 × 10³ |
| 24 | 12.27 | 1.856 × 10⁻⁴ | 0.5660 | 4.823 × 10⁴ |
| 48 | 11.90 | 2.417 × 10⁻⁴ | 0.4971 | 1.525 × 10⁴ |
| 96 | 11.42 | 5.765 × 10⁻⁵ | 0.9799 | 1.048 × 10⁴ |
| 168 | 13.67 | 1.080 × 10⁻⁴ | 0.5461 | 4.293 × 10⁴ |
Table 3.
Impedance parameters after salt-spray tests containing Cl− only.
| Experimental Period/h | Rs/Ω | Qdl/Ω−1·cm−2·s−n | n2 | Rdl/Ω |
|---|---|---|---|---|
| 16 | 9.600 | 7.216 × 10⁻⁵ | 0.6620 | 3.701 × 10⁴ |
| 24 | 13.24 | 8.508 × 10⁻⁵ | 0.5957 | 8.368 × 10⁴ |
| 48 | 9.860 | 6.759 × 10⁻⁵ | 0.5569 | 8.267 × 10⁴ |
| 96 | 10.01 | 6.956 × 10⁻⁵ | 0.5288 | 6.609 × 10⁴ |
| 168 | 11.02 | 7.768 × 10⁻⁵ | 0.4876 | 3.589 × 10⁴ |
© 2017 by the authors. Licensee MDPI, Basel, Switzerland. This article is an open access article distributed under the terms and conditions of the Creative Commons Attribution (CC BY) license (http://creativecommons.org/licenses/by/4.0/).
Share and Cite
MDPI and ACS Style
Xiao, K.; Yi, P.; Yan, L.; Bai, Z.; Dong, C.; Dong, P.; Gao, X. Corrosion Behavior of Silver-Plated Circuit Boards in a Simulated Marine Environment with Industrial Pollution. Materials 2017, 10, 762. https://doi.org/10.3390/ma10070762
AMA Style
Xiao K, Yi P, Yan L, Bai Z, Dong C, Dong P, Gao X. Corrosion Behavior of Silver-Plated Circuit Boards in a Simulated Marine Environment with Industrial Pollution. Materials. 2017; 10(7):762. https://doi.org/10.3390/ma10070762
Chicago/Turabian StyleXiao, Kui, Pan Yi, Lidan Yan, Ziheng Bai, Chaofang Dong, Pengfei Dong, and Xiong Gao. 2017. "Corrosion Behavior of Silver-Plated Circuit Boards in a Simulated Marine Environment with Industrial Pollution" Materials 10, no. 7: 762. https://doi.org/10.3390/ma10070762
Note that from the first issue of 2016, this journal uses article numbers instead of page numbers. See further details here.