
Tuning the Mechanical and Antimicrobial Performance of a Cu-Based Metallic Glass Composite through Cooling Rate Control and Annealing


Abstract
:
1. Introduction
2. Materials and Methods
3. Results and Discussion
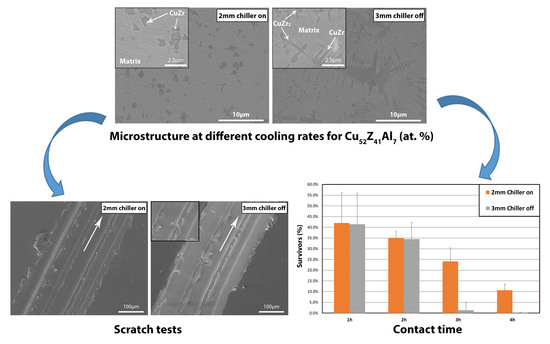
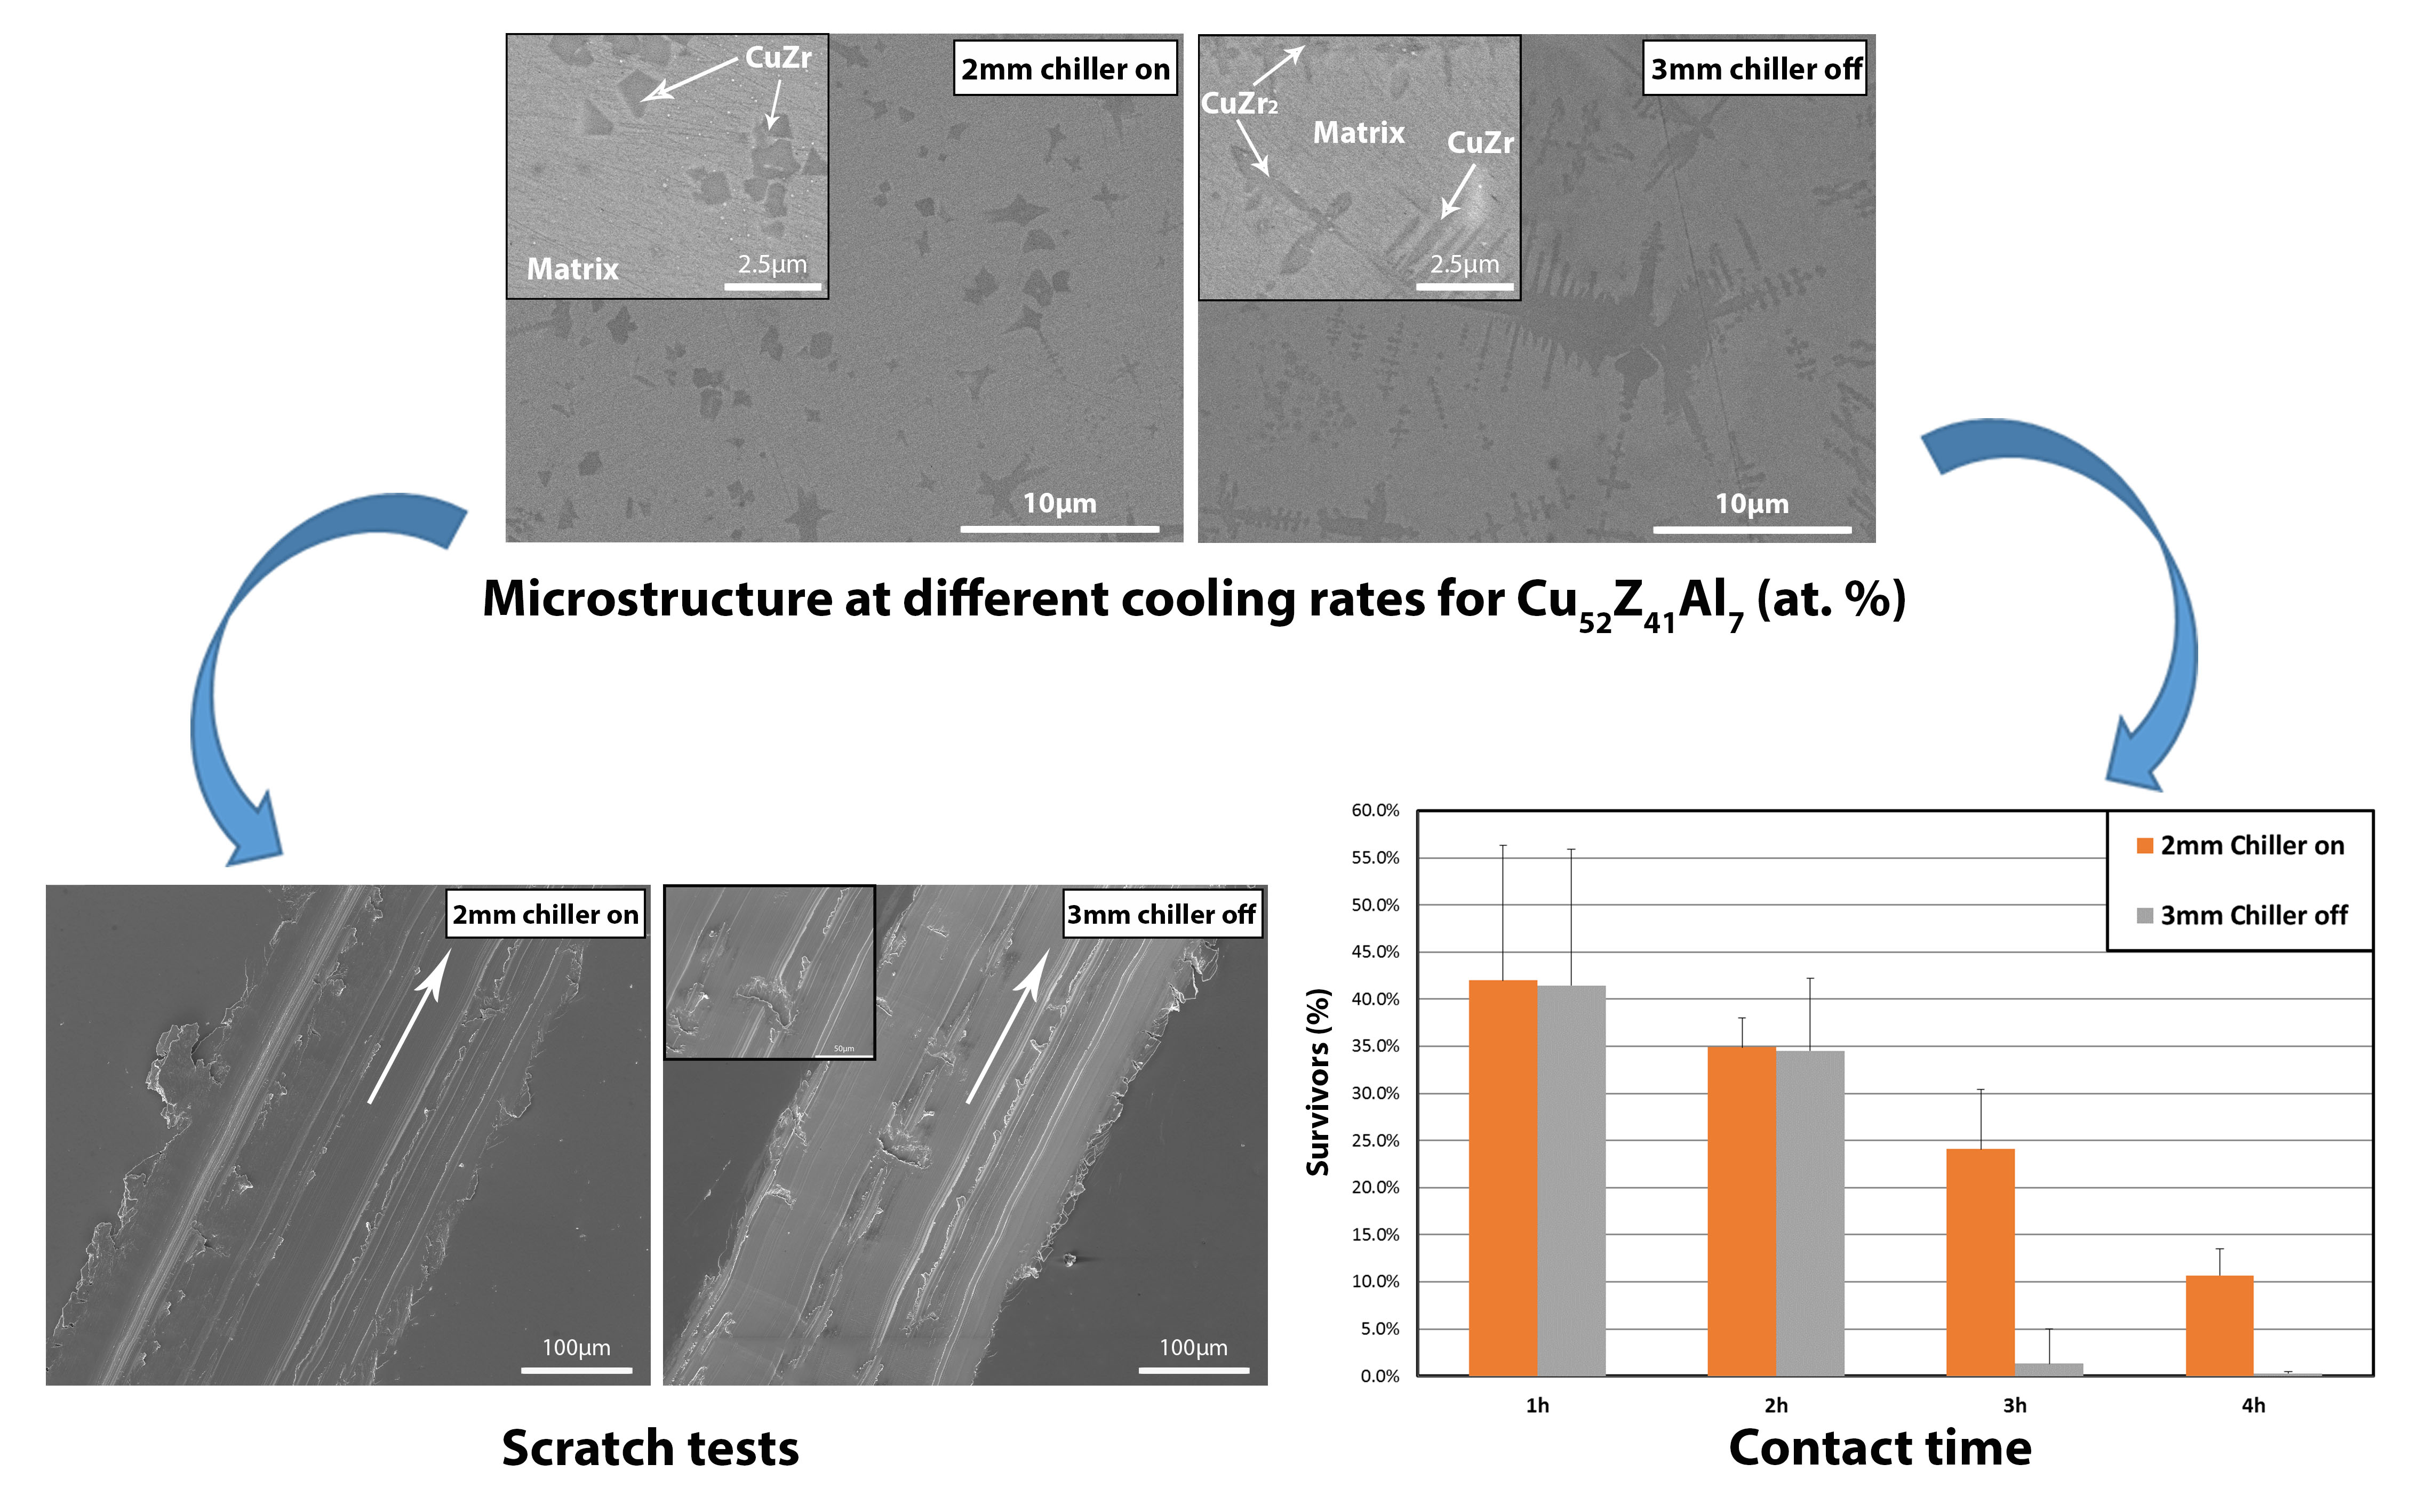
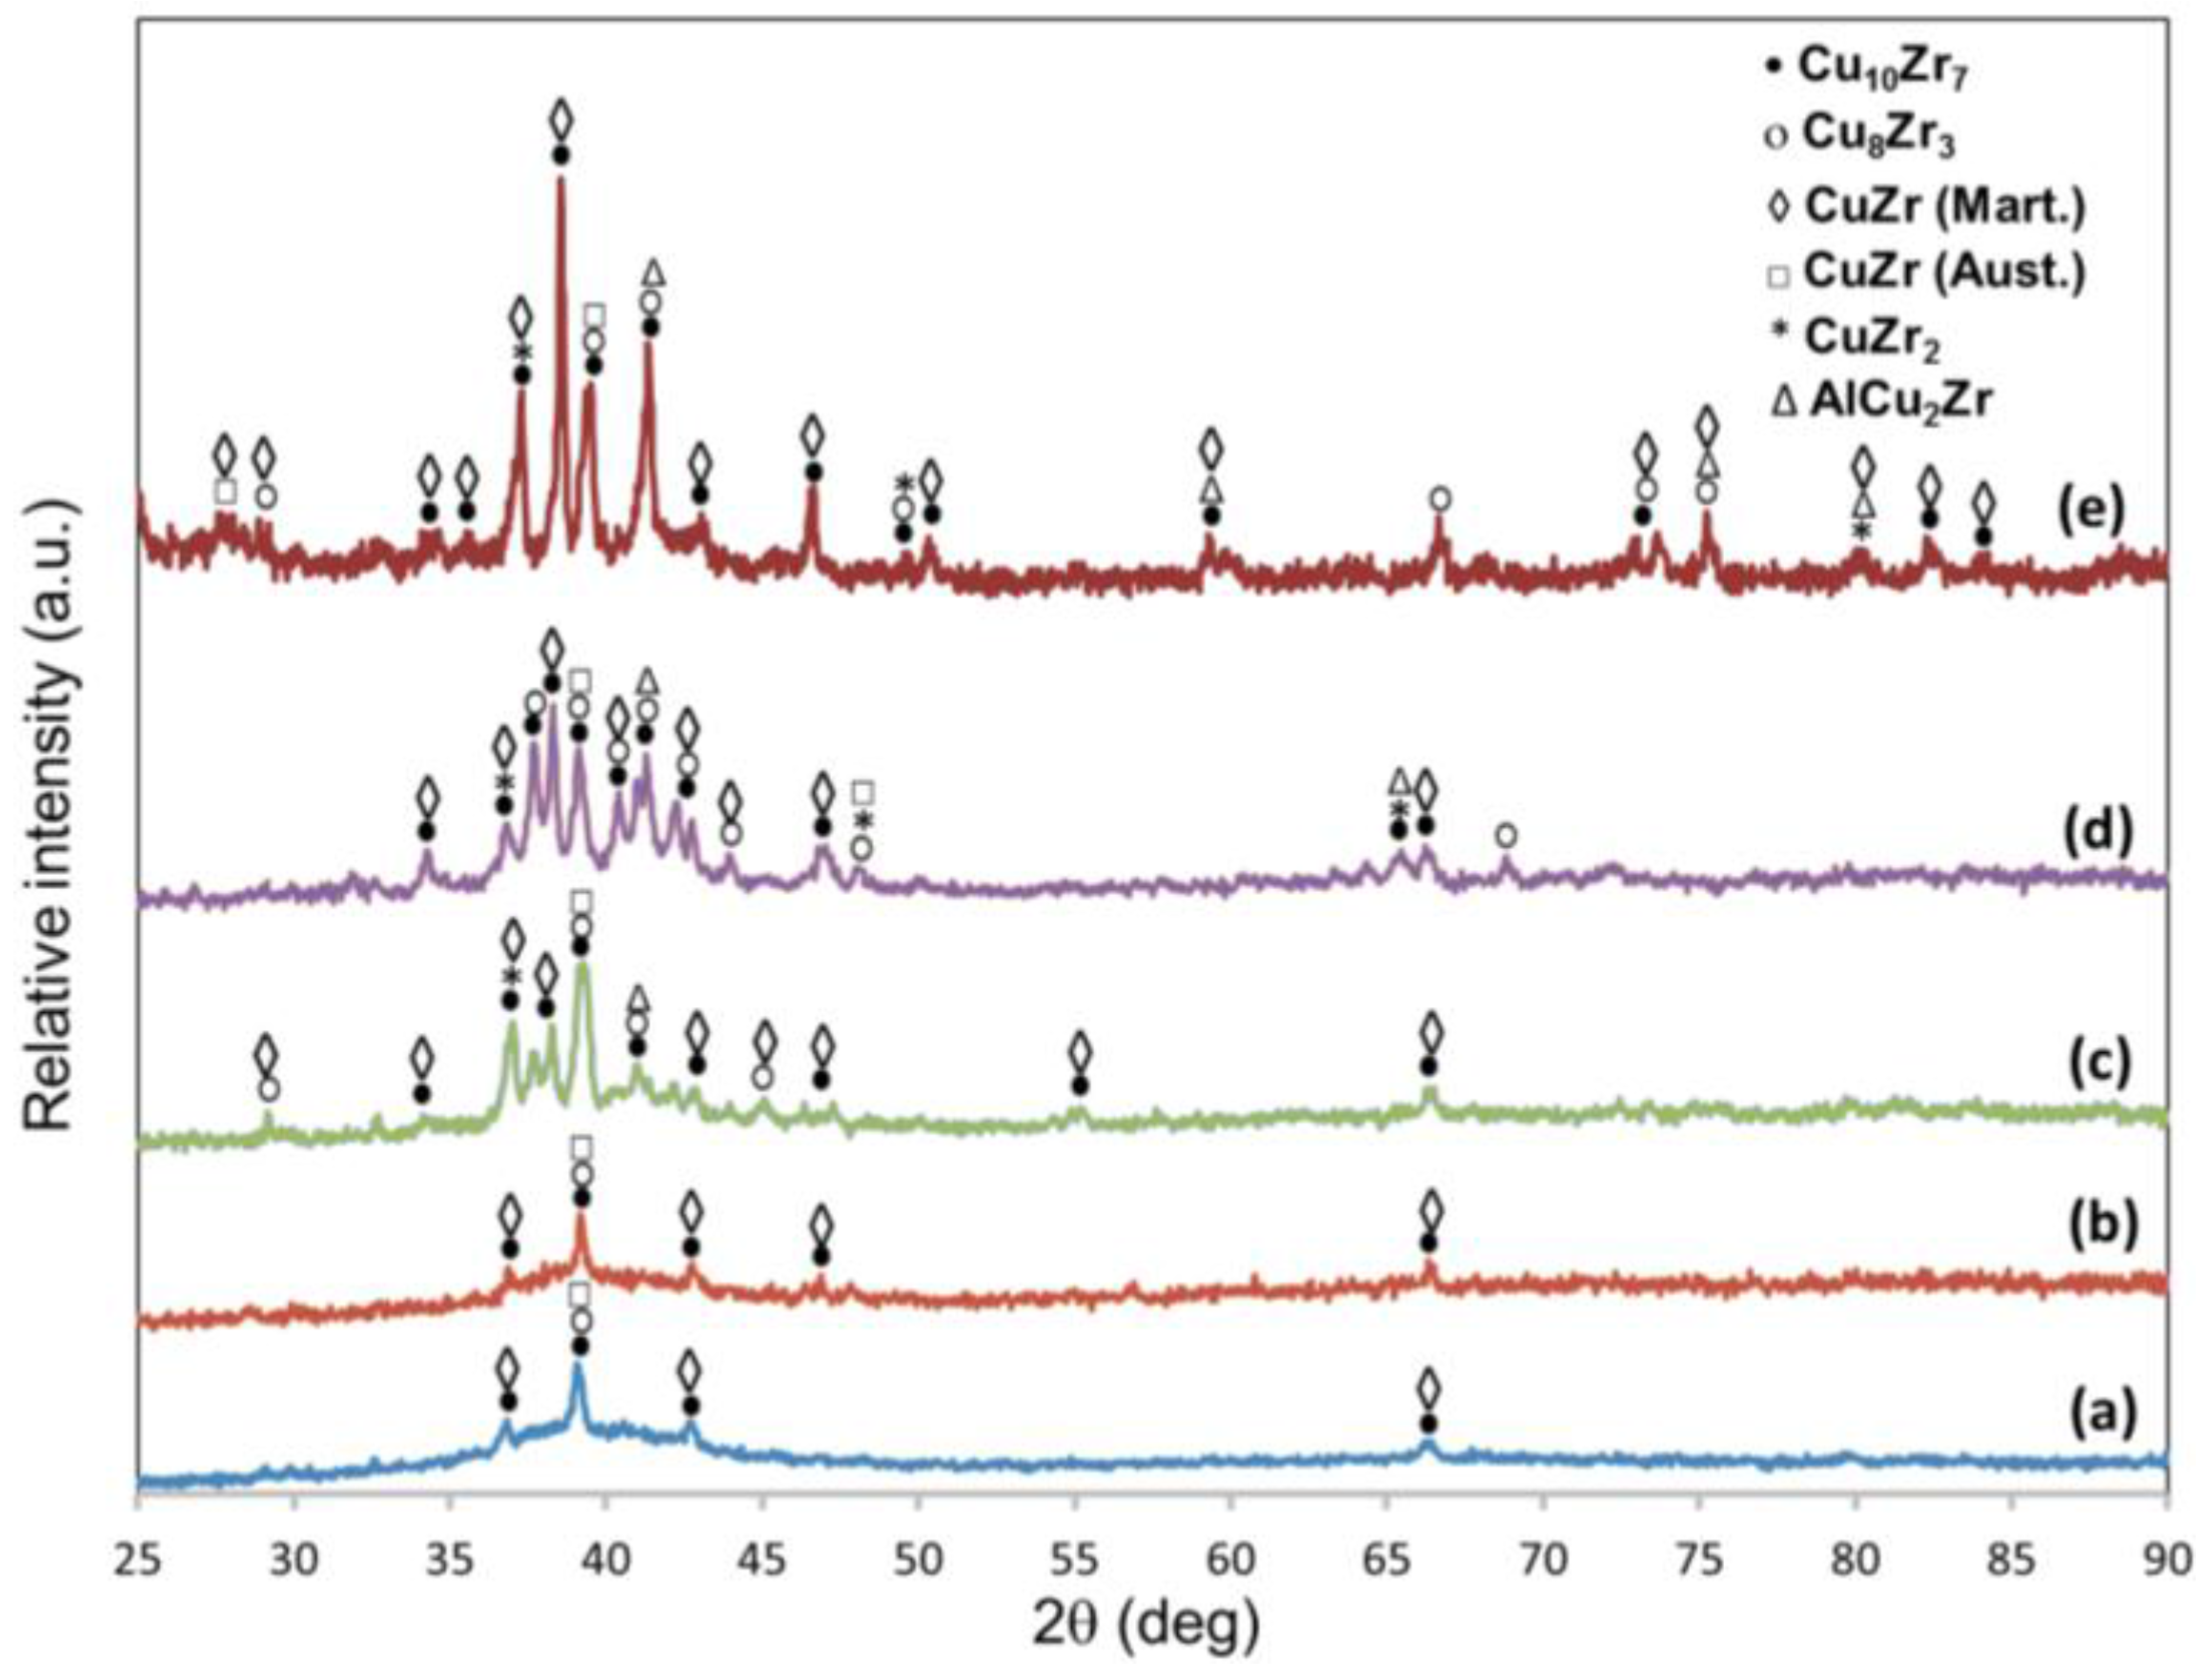
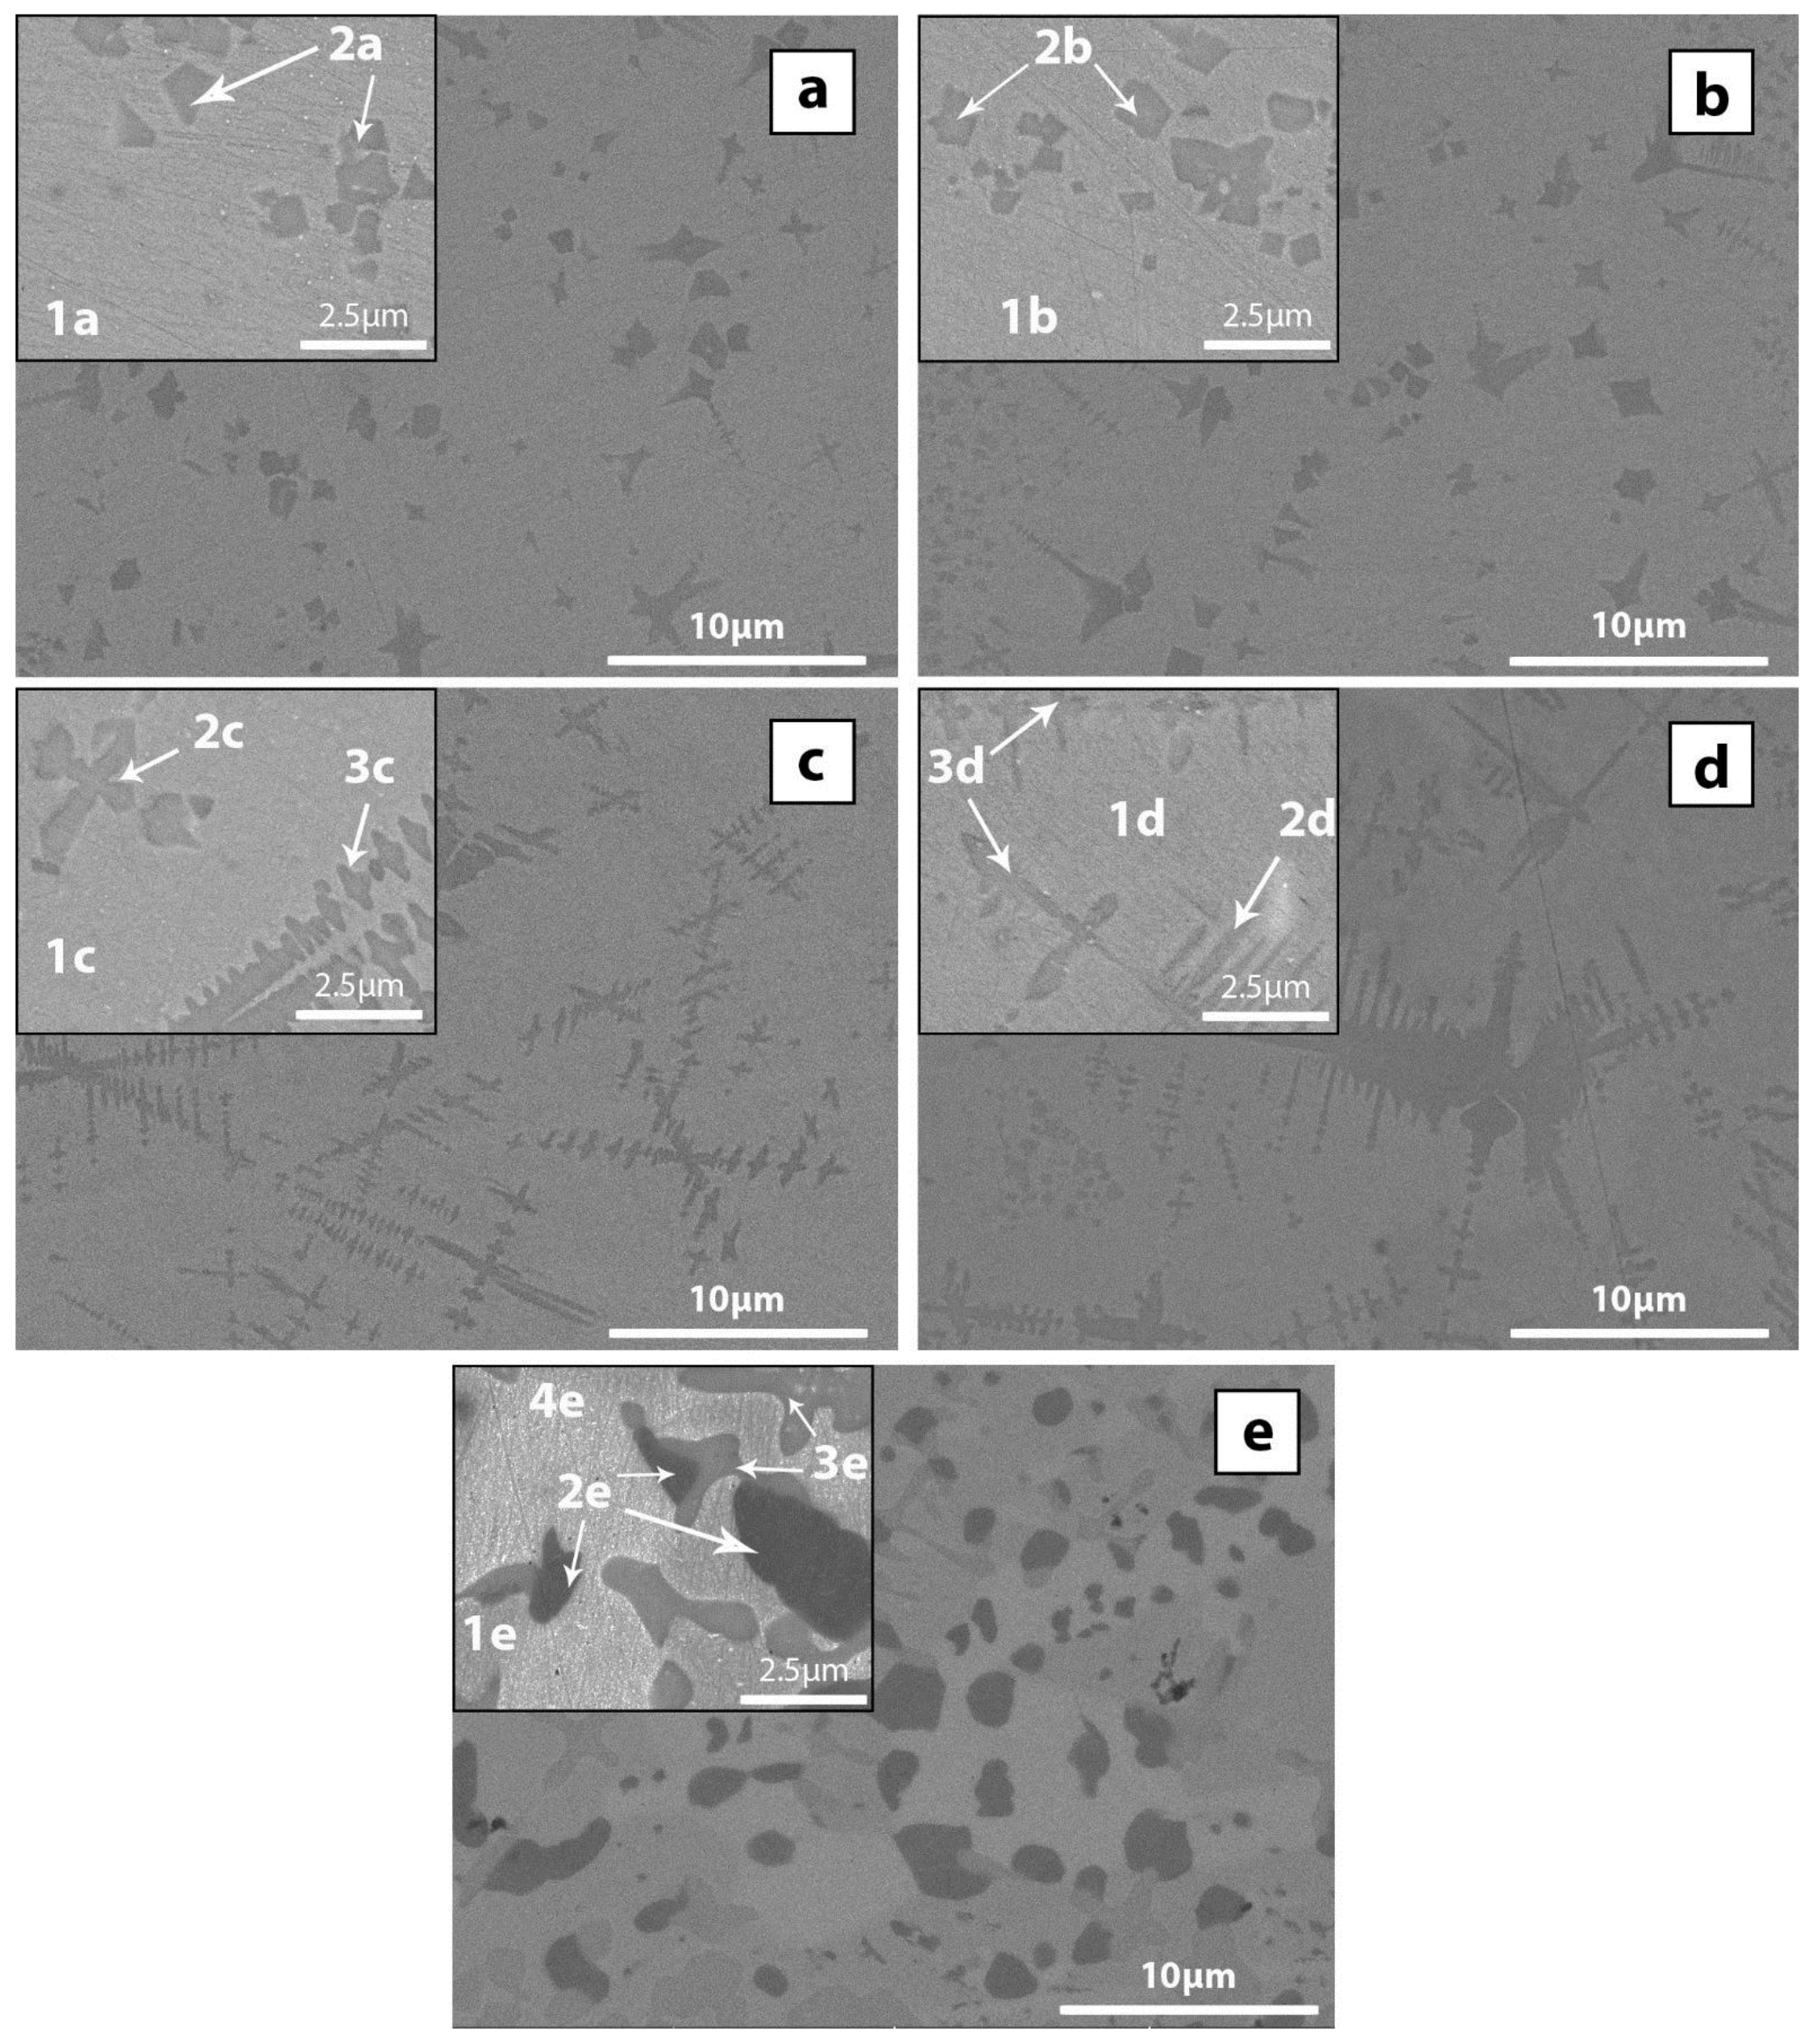
3.1. Microstructure
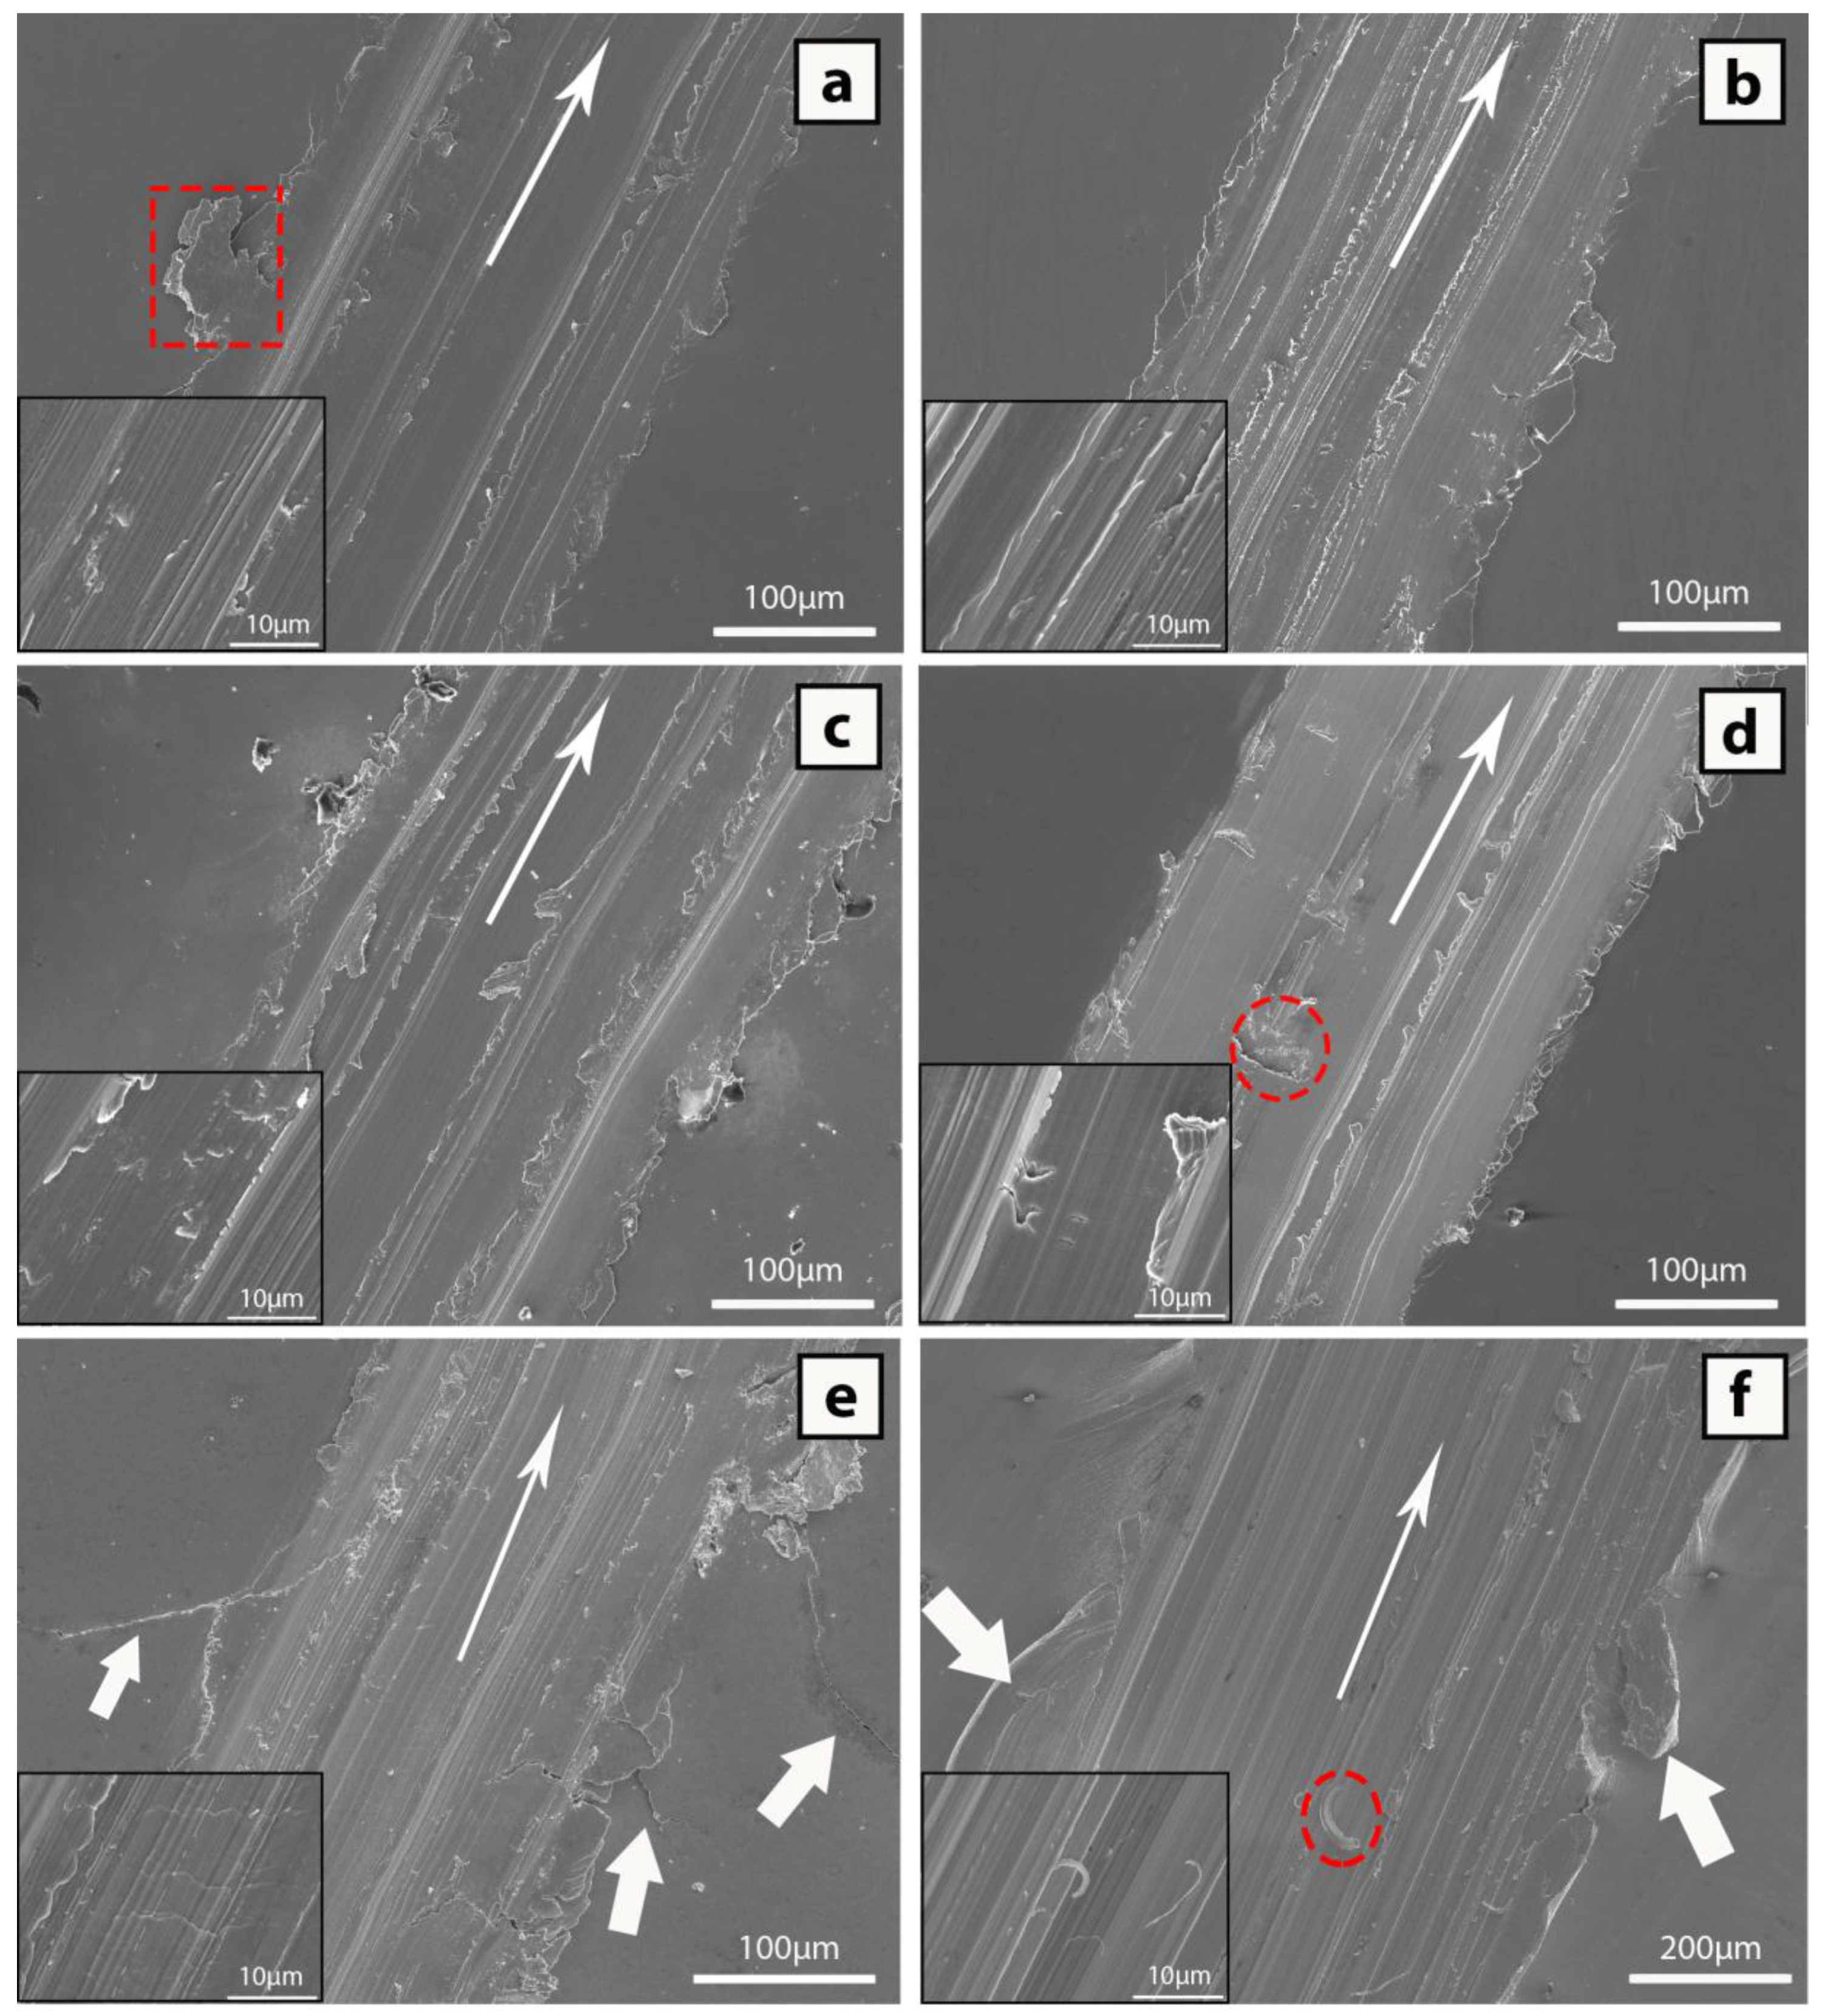
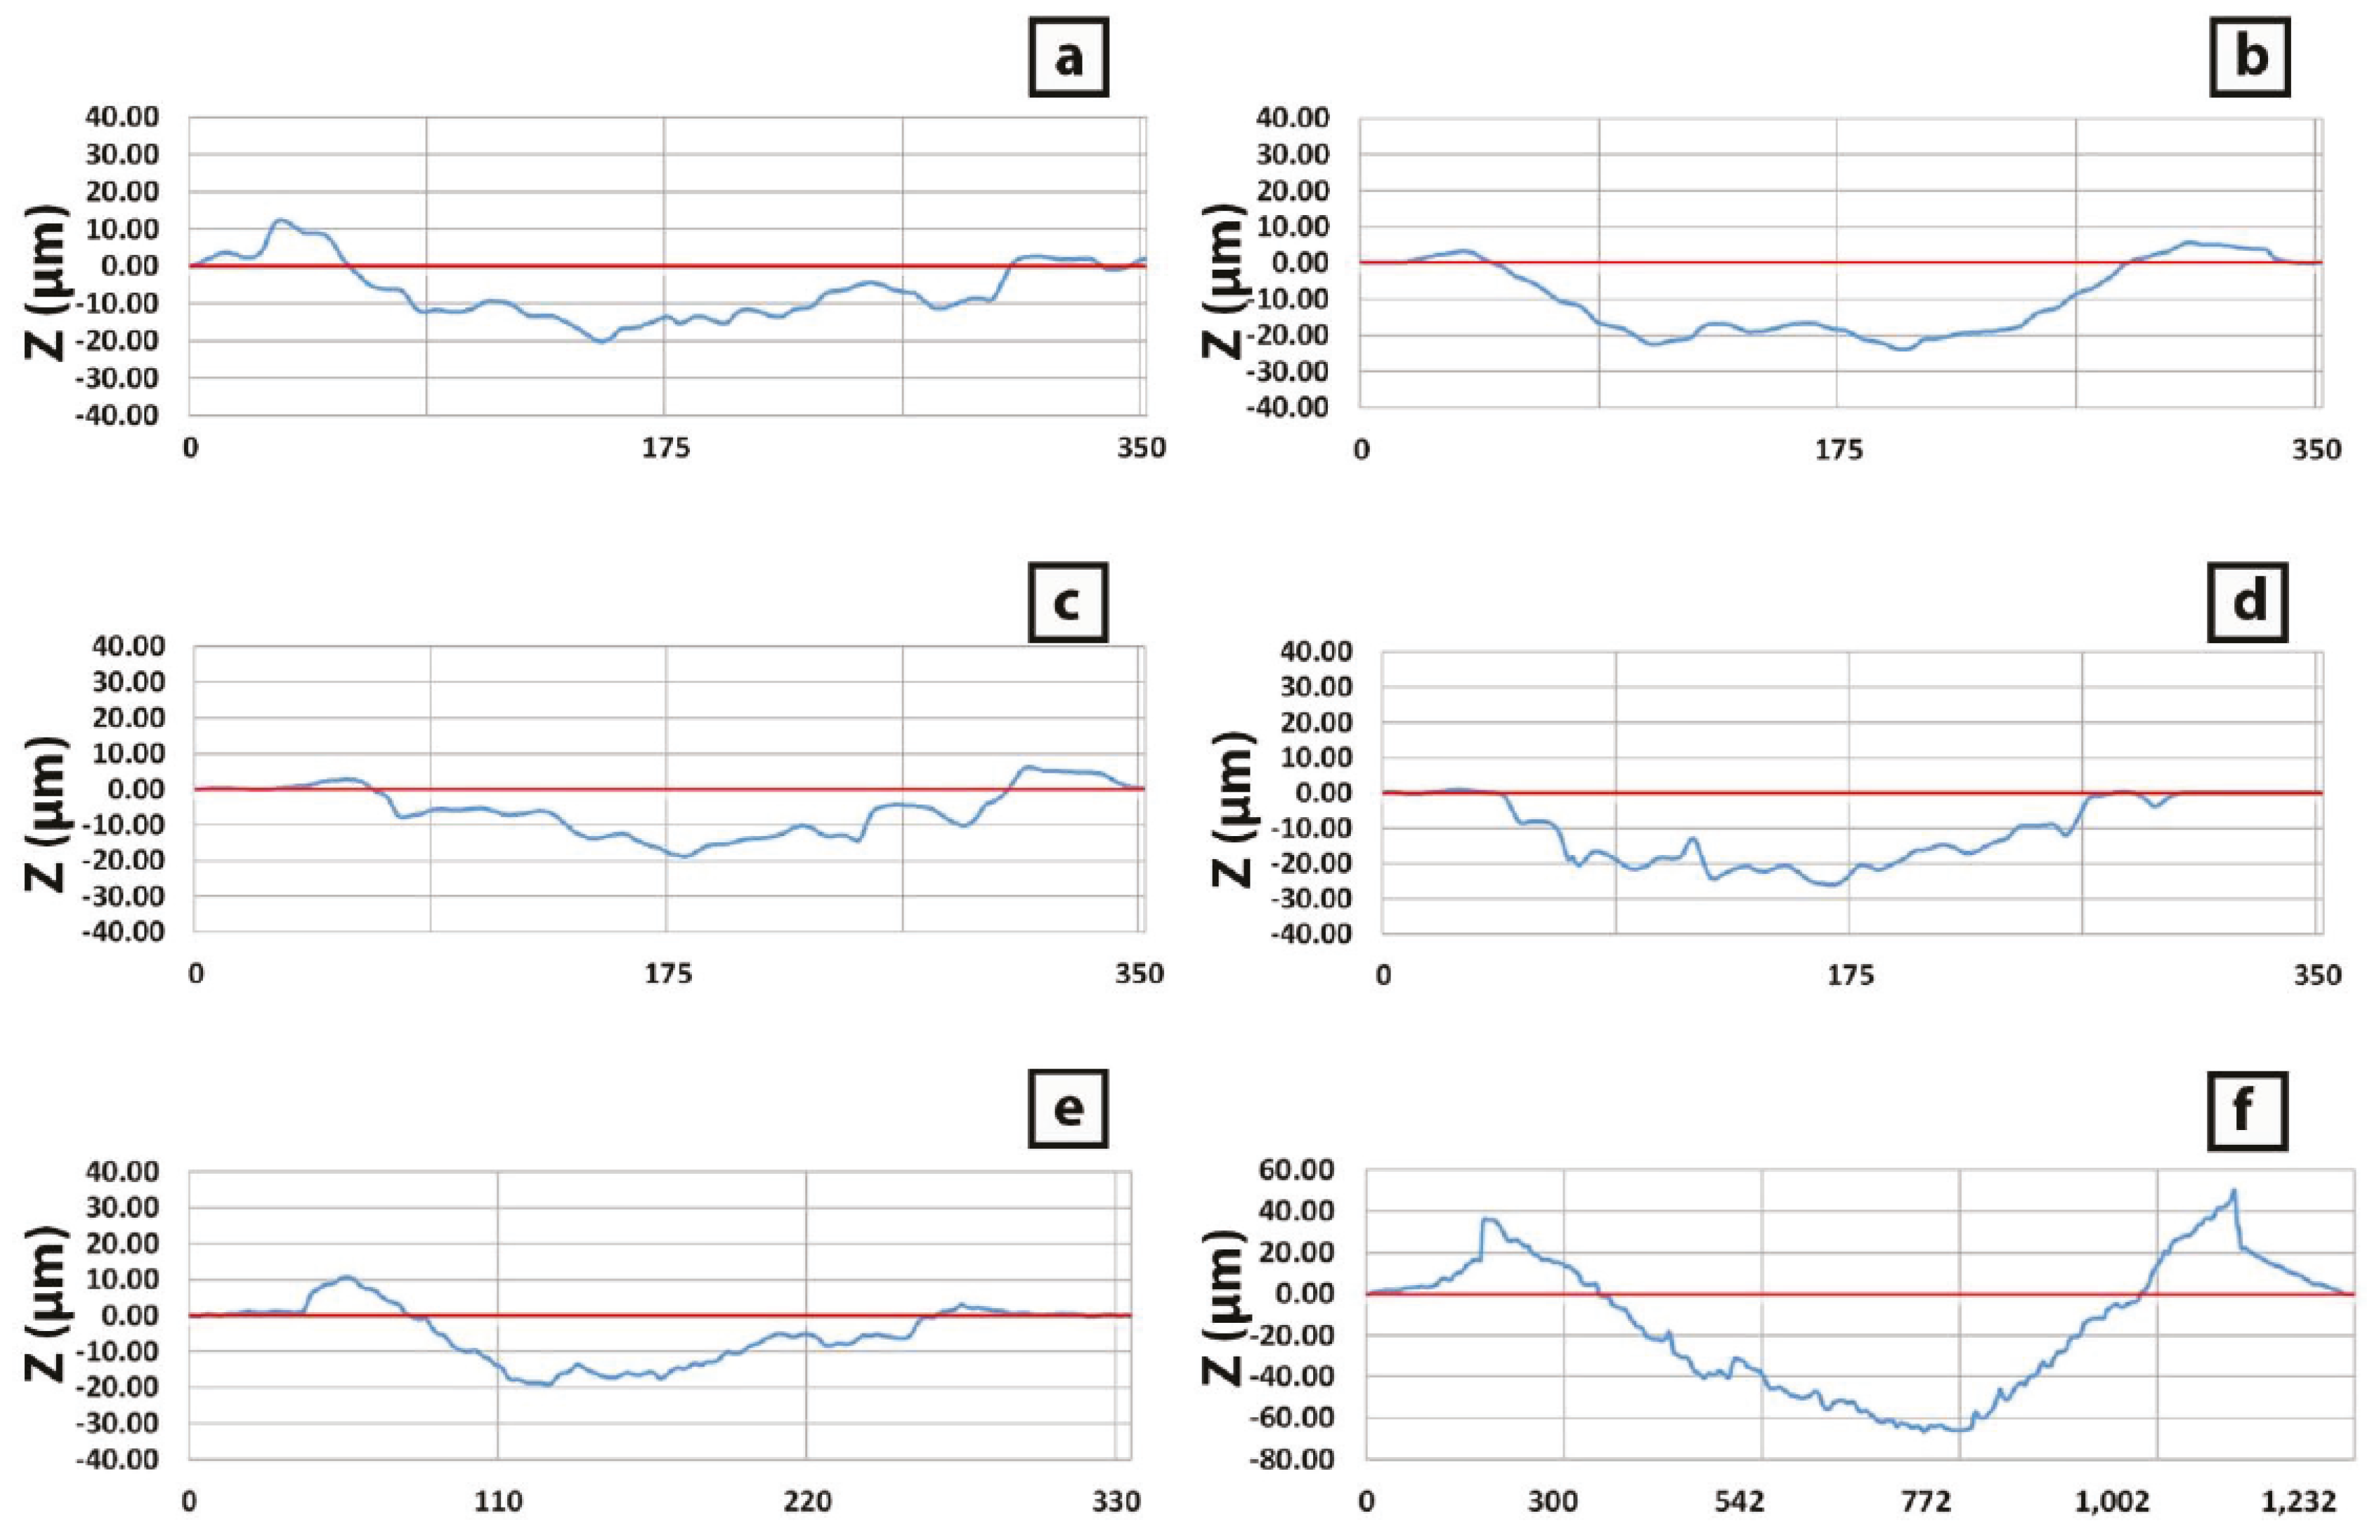
3.2. Scratch Tests
3.2.1. CH 2 and NCH 2 Samples
3.2.2. CH 3 and NCH 3 Samples
3.2.3. Annealed and Pure Copper Samples
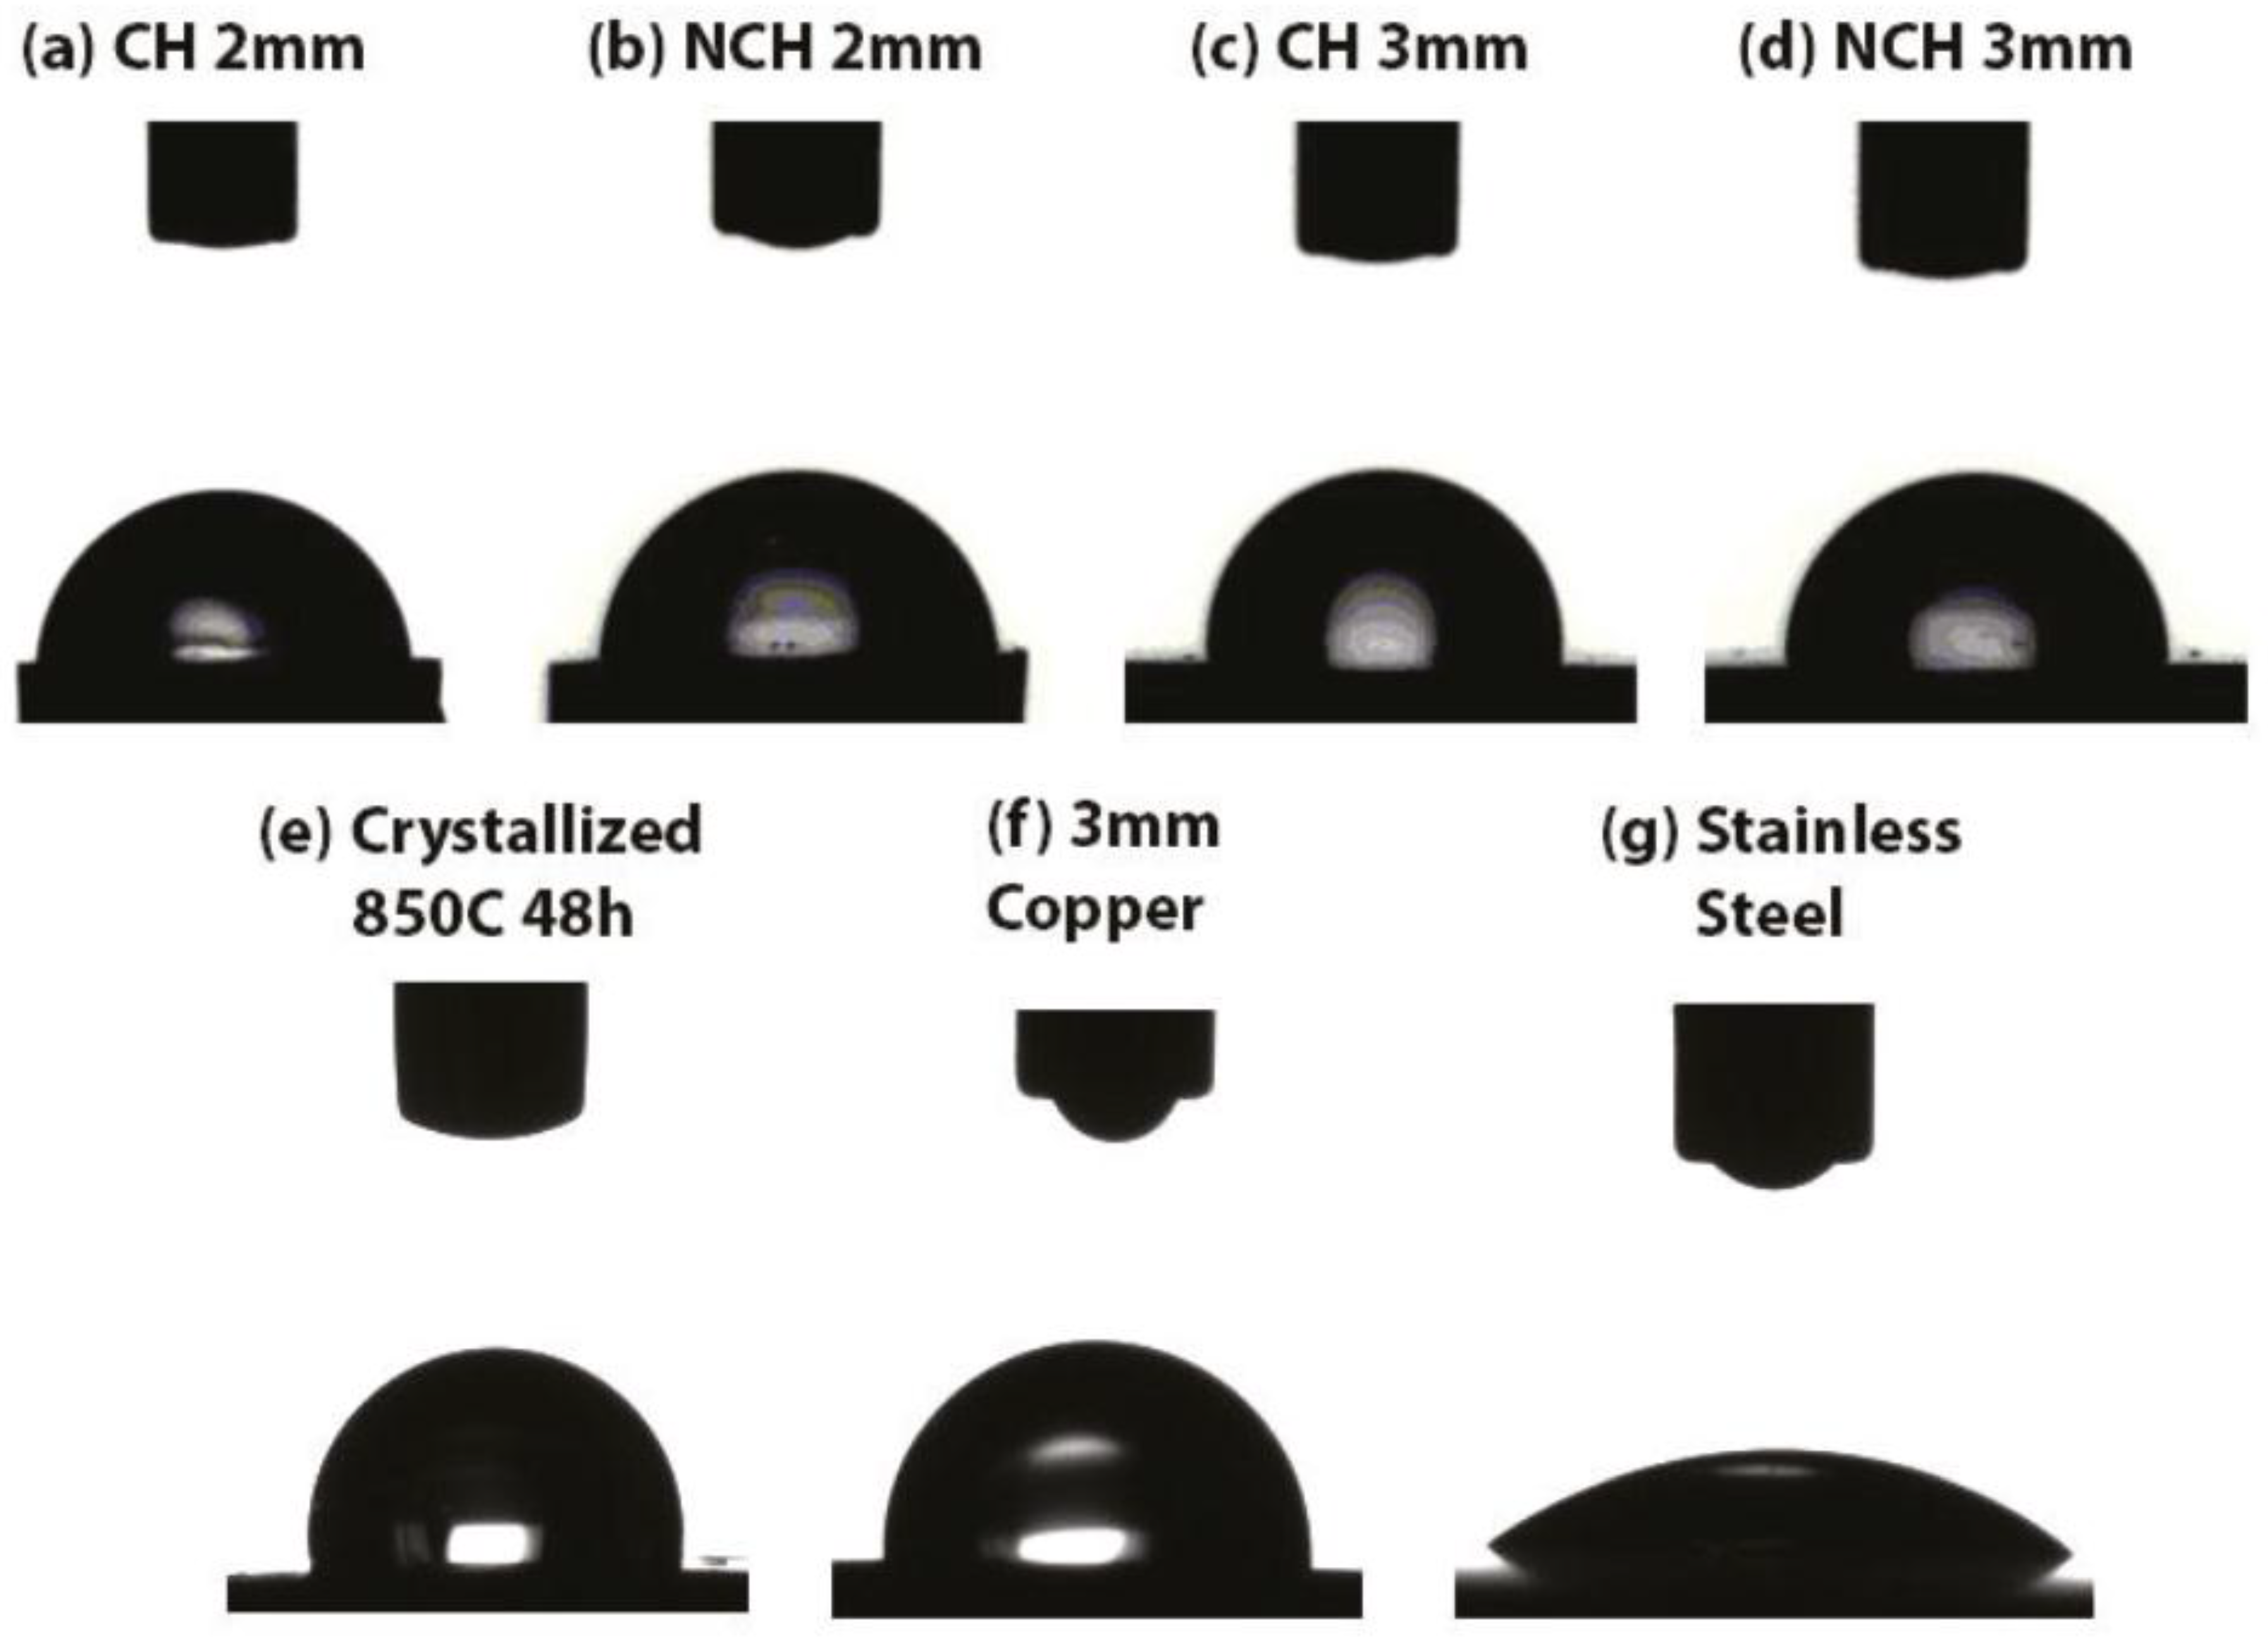
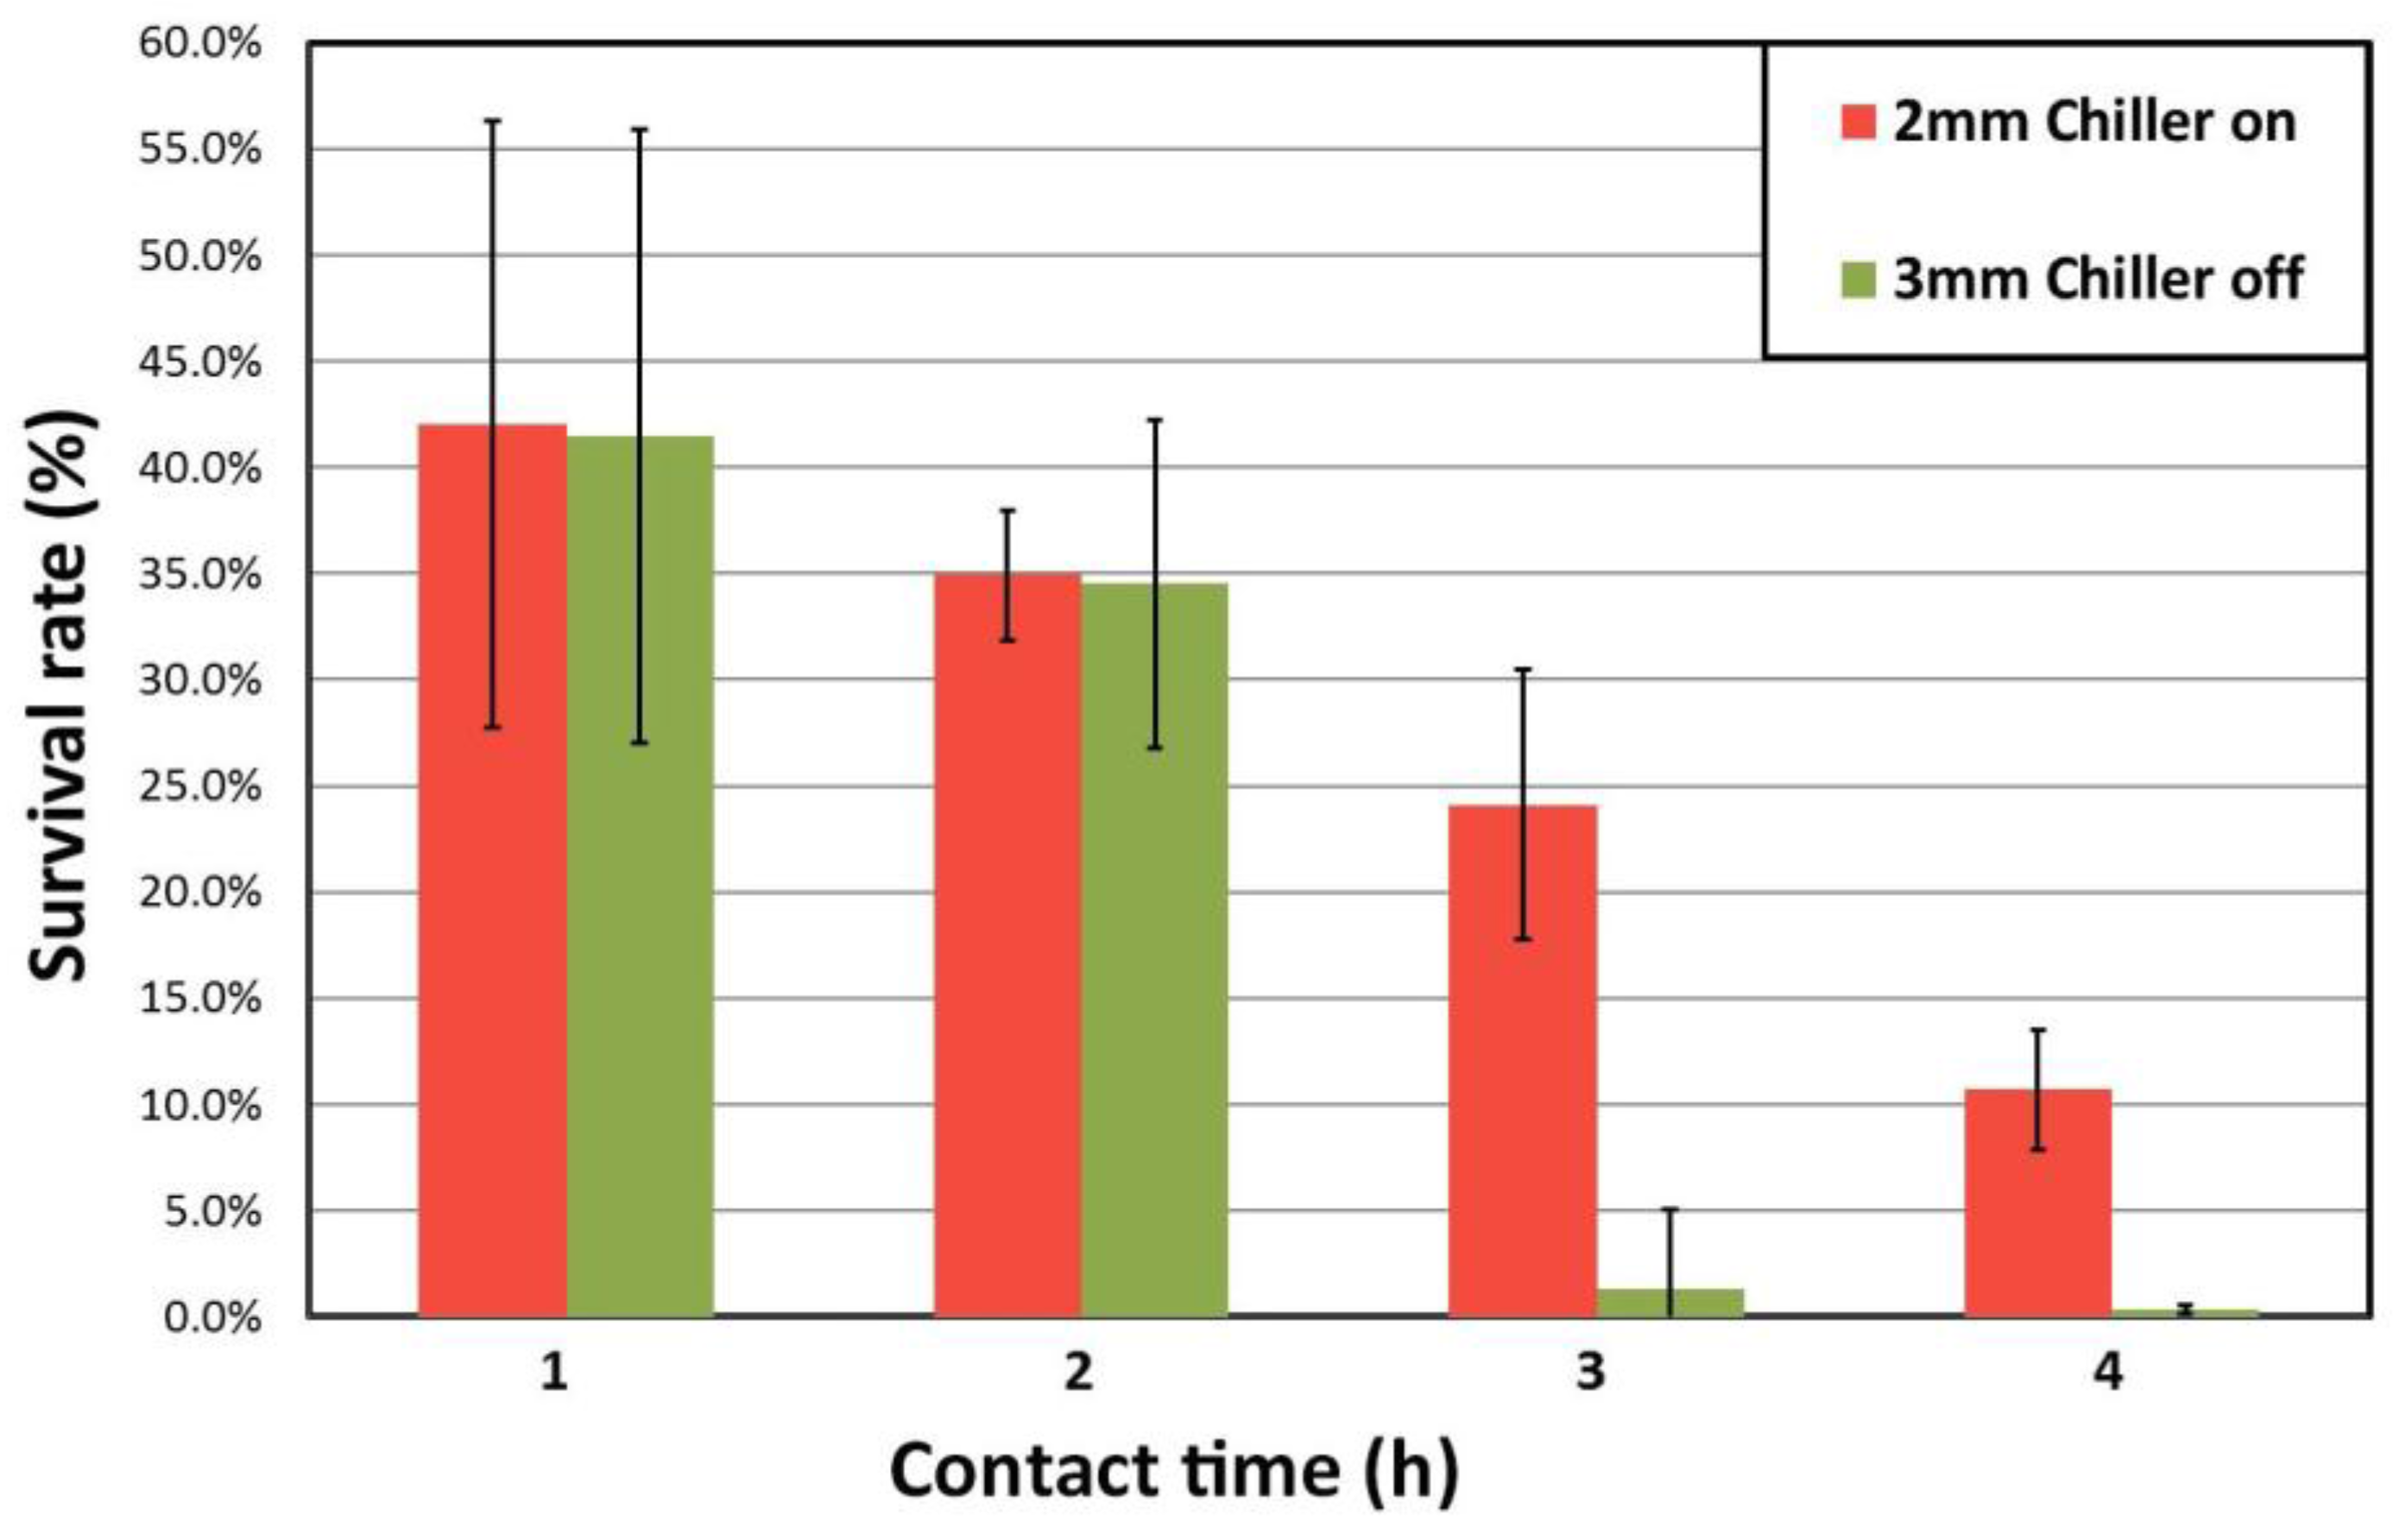
3.3. Wettability and Antimicrobial Tests
4. Conclusions
- For Cu52Z41Al7 alloy composition, a decrease of the cooling rate from the melt results in an increase in the wear resistance, linked to the embrittlement of the samples, as deduced from the scratch tests. This is revealed in the lower pile-up, higher groove, prone adhesion wear and increase in scratch hardness from 1.29 GPa for sample CH 2 mm to 1.45 GPa for sample NCH 3 mm.
- The sessile drop test shows an increase in contact angle as the microstructure gets more crystalline. As a result, adhesion of bacteria is less likely to occur in higher crystalline composites.
- The cooling system that keeps the mould cold (chiller on: 10 °C and off: 20 °C) upon suction casting has little effect on the microstructure and therefore on the alloy performance compared to the effect of the mould cavity diameter. The effect of using the chiller is practically negligible for the 2 mm diameter samples and becomes slightly larger for the 3 mm diameter samples.
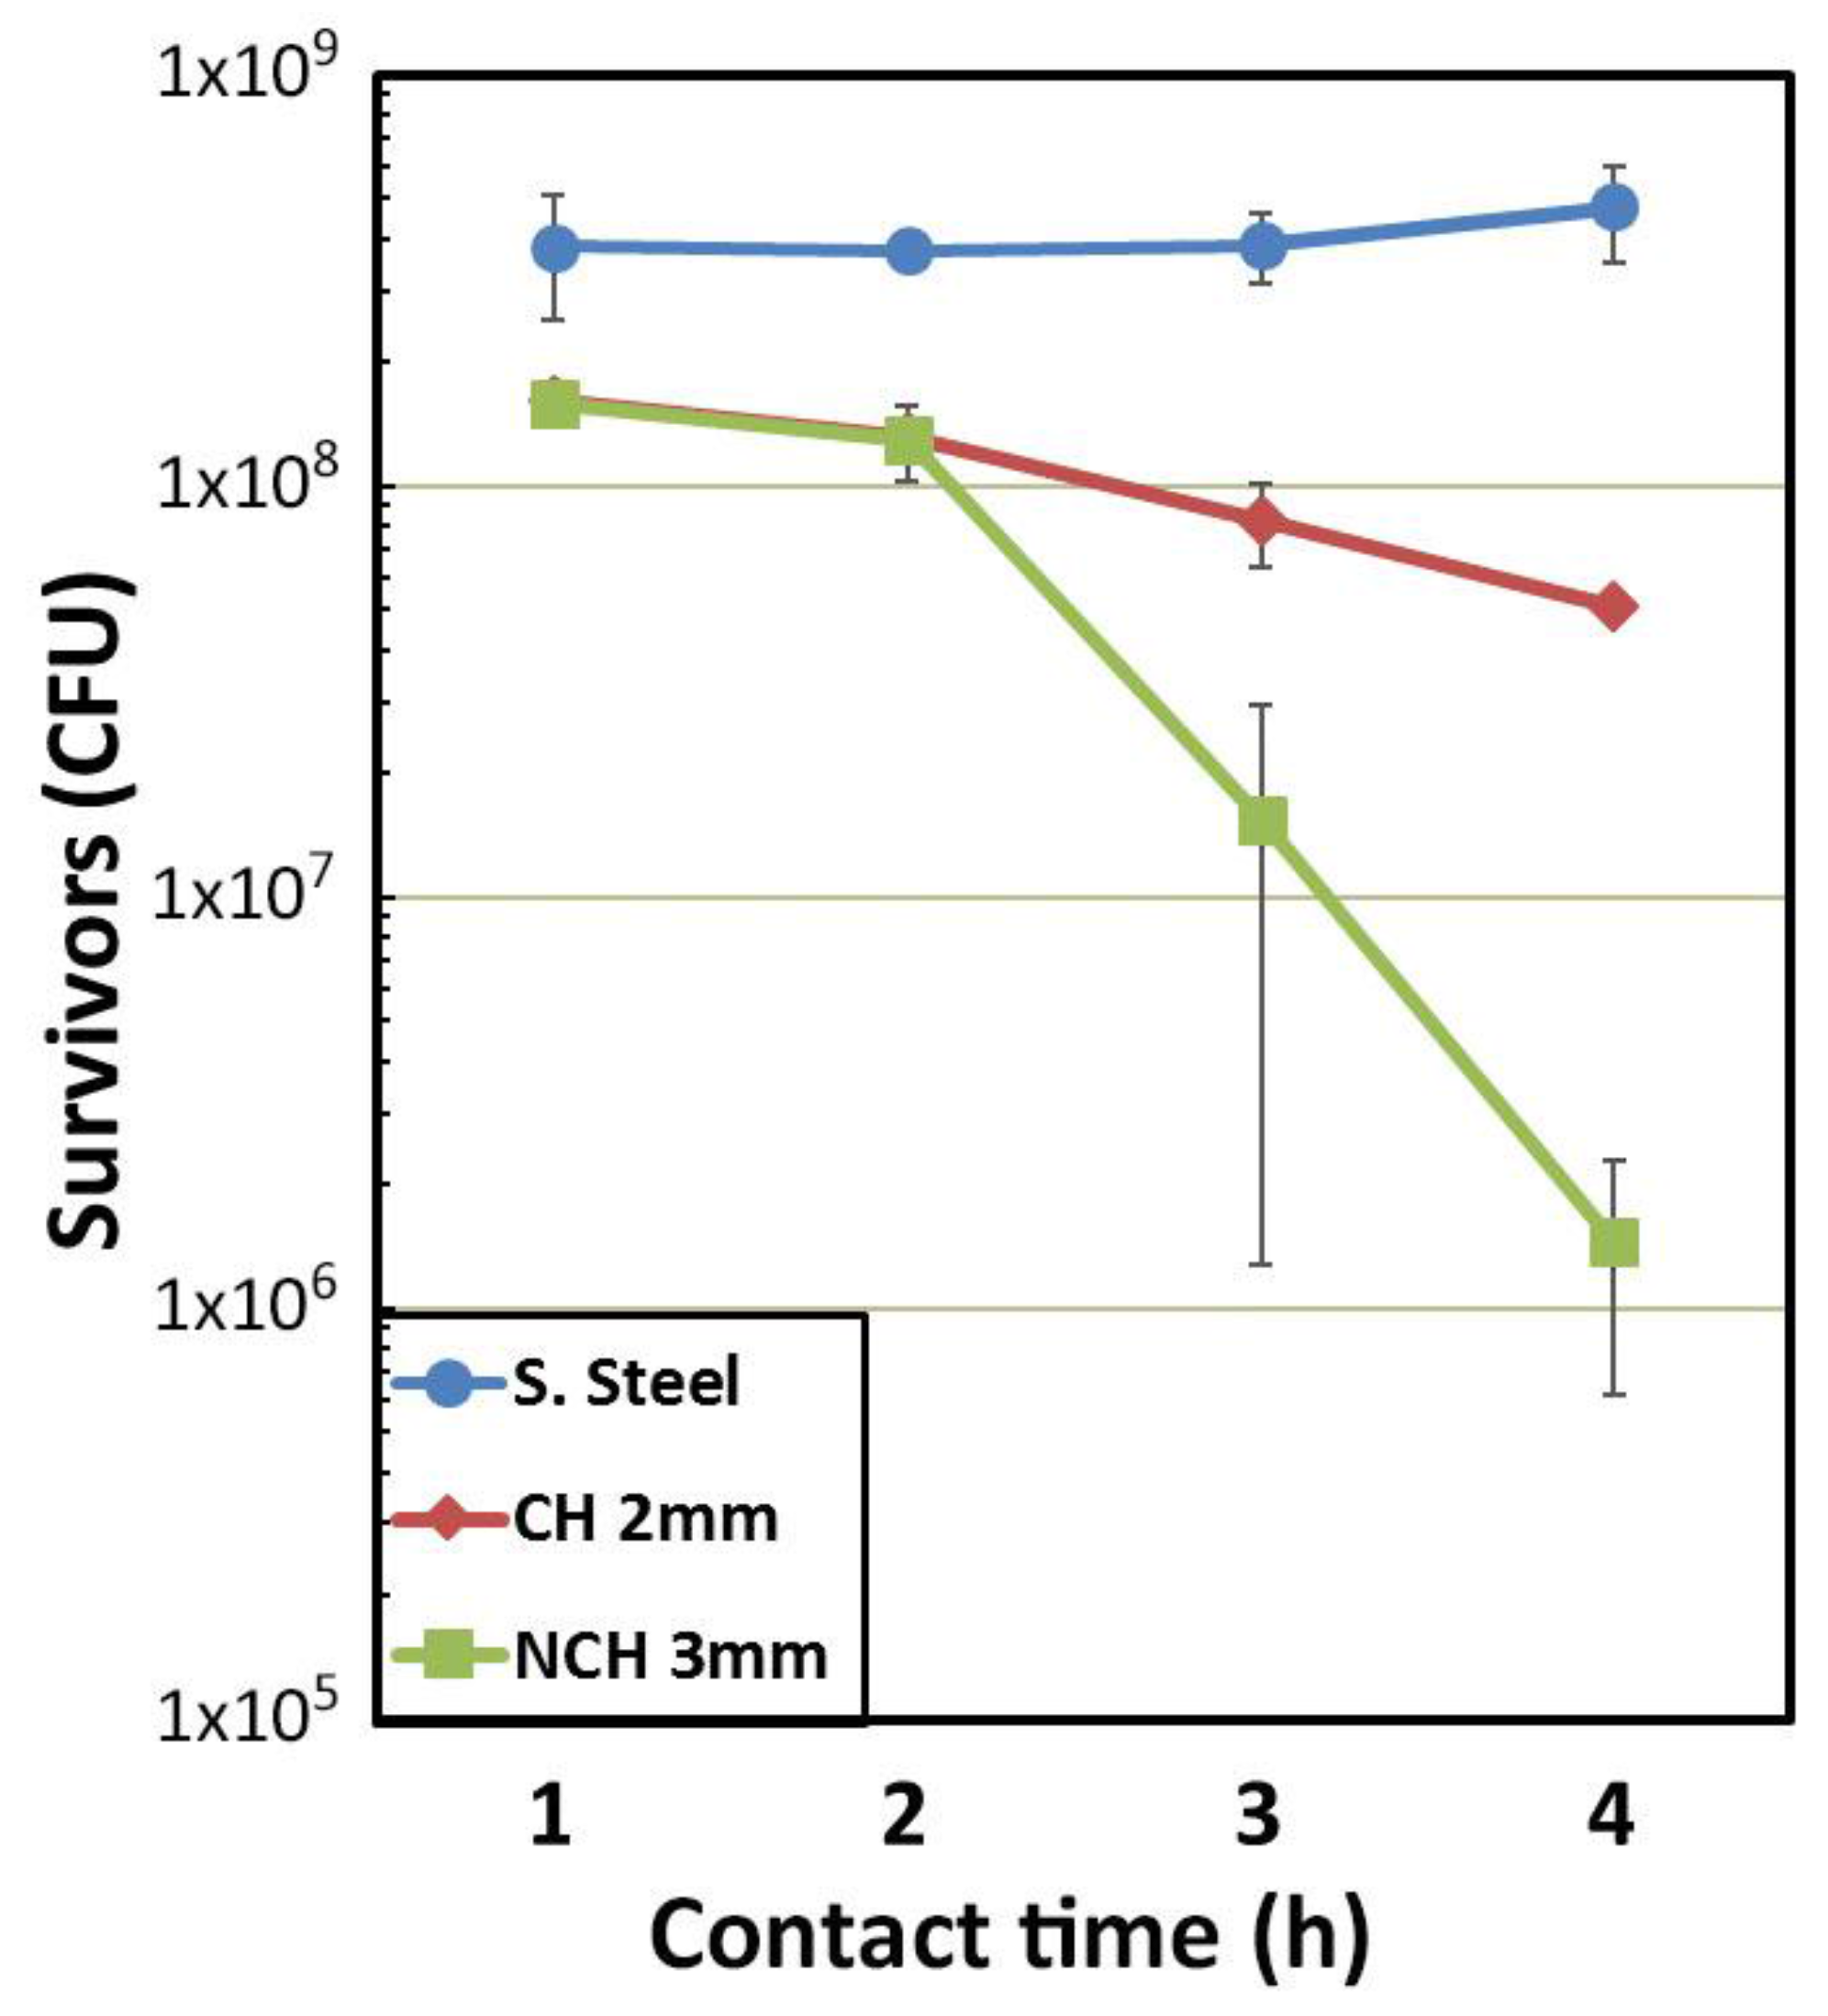
- Rapid solidification has been proven to be an efficient technique to tune the properties of the Cu-Zr-Al system upon cooling. The rapid quenched Cu52Z41Al7 alloy can be used as a precursor to tune the microstructure upon annealing (i.e., 850 °C for 48 h) and reach an antimicrobial performance beyond the threshold provided by the American protocol (i.e., the alloy is made antimicrobial). Annealing the alloy also enables us o improve the wear resistance by increasing the scratch hardness from 1.45 to 1.99 GPa.
- The crystalline sample obtained by annealing at 850 °C for 48 h exhibits the best performance in terms of antimicrobial behaviour and wear resistance (i.e. scratch hardness of 1.99 ± 0.03 GPa). However, the sample corrodes very easily and breaks into small pieces after only one hour of inoculation in sterile LB broth due to the large number of grain boundaries and the nature of the crystalline phases.
- The 3 mm diameter Cu sample exhibits a scratch hardness value of 0.4 GPa, more than three times lower than that of the 3 mm NCH metallic glass composite. Therefore, depending on the application (antimicrobial medical devices, touch surfaces, etc.), a compromise between durability and antimicrobial performance is needed and a composite might be preferred over pure copper.
Acknowledgments
Author Contributions
Conflicts of Interest
Appendix A

References
- Sorci, G.; Cornet, S.; Faivre, B. Immunity and the emergence of virulent pathogens. Infect. Genet. Evol. 2013, 16, 441–446. [Google Scholar] [CrossRef] [PubMed]
- Point prevalence survey of healthcare associated infections and antimicrobial use in european acute care hospitals. In European Centre for Disease Prevention and Control; ECDC: Stockholm, Sweden, 2013.
- Trubiano, J.A.; Padiglione, A.A. Nosocomial infections in the intensive care unit. Anaesth. Intens. Care Med. 2015, 16, 598–602. [Google Scholar] [CrossRef]
- Sadatsafavi, H.; Niknejad, B.; Zadeh, R.; Sadatsafavi, M. Do cost savings from reductions in nosocomial infections justify additional costs of single-bed romos in intensive care units? A simulation case study. J. Crit. Care 2015, 31, 194–200. [Google Scholar] [CrossRef] [PubMed]
- Lax, S.; Gilbert, J.A. Hospital associated microbiota and implications for nosocomial infections. Cell Press 2015, 21, 427–432. [Google Scholar] [CrossRef] [PubMed]
- Stone, P.W. Economic burden of healthcare-associated infections: An american perspective. Expert Rev. Pharmacoecon. Outcomes Res. 2009, 9, 417–422. [Google Scholar] [CrossRef] [PubMed]
- Fierer, N.; Hamady, M.; Lauber, C.L.; Knight, R. The influence of sex, handedness, and washing on the diversity of hand surface bacteria. Proc. Natl. Acad. Sci. 2008, 105, 17994–17999. [Google Scholar] [CrossRef] [PubMed]
- Judah, G.; Donachie, P.; Cobb, E.; Schmidt, W.; Holland, M.; Curtis, V. Dirty hands: Bacteria of faecal origin on commuters’ hands. Epidemiol. Infect. 2010, 138, 409–414. [Google Scholar] [CrossRef] [PubMed]
- Kumarasamy, K.K.; Toleman, M.A.; Walsh, T.R.; Bagaria, J.; Butt, F.; Balakrishnan, R.; Chaudhary, U.; Doumith, M.; Giske, C.G.; Irfan, S.; et al. Emergence of a new antibiotic resistance mechanism in India, Pakistan, and the UK: A molecular, biological, and epidemiological study. Lancet Infect. Dis. 2010, 10, 597–602. [Google Scholar] [CrossRef]
- Rutala, W.A.; Weber, D.J. Infection control: The role of disinfection and sterilization. J. Hosp. Infect. 1999, 43, 43–55. [Google Scholar] [CrossRef]
- Dettenkofer, M.; Block, C. Hospital disinfection: Efficacy and safety issues. Curr. Opin. Infect. Dis. 2015, 18, 320–325. [Google Scholar] [CrossRef]
- Weber, D.J.; Rutala, W.A.; Miller, M.B.; Huslage, K.; Sickbert-Bennett, E. Role of hospital surfaces in the transmission of emerging health care-associated pathogens: Norovirus, clostridium difficile, and acinetobacter species. Am. J. Infect. Control. 2010, 38, 25–33. [Google Scholar] [CrossRef] [PubMed]
- Page, K.; Wilson, M.; Parkin, I.P. Antimicrobial surfaces and their potential in reducing the role of the inanimate environment in the incidence of hospital-acquired infections. J. Mater. Chem. 2009, 19, 3819–3831. [Google Scholar] [CrossRef]
- Grass, G.; Rensing, C.; Solioz, M. Metallic copper as an antimicrobial surface. Appl. Environ. Microbiol. 2011, 77, 1541–1547. [Google Scholar] [CrossRef] [PubMed]
- Wang, Z.L. Zinc oxide nanostructures: Growth, properties and applications. J. Phys. Condens. Matter 2004, 16, R829–R858. [Google Scholar] [CrossRef]
- Chernousova, S.; Epple, M. Silver as antibacterial agent: Ion, nanoparticle, and metal. Angew. Chem. Int. Ed. 2013, 52, 1636–1653. [Google Scholar] [CrossRef] [PubMed]
- Santo, C.E.; Lam, E.W.; Elowsky, C.G.; Quaranta, D.; Domaille, D.W.; Chang, C.J.; Grass, G. Bacterial killing by dry metallic copper surfaces. Appl. Environ. Microb. 2011, 77, 794–802. [Google Scholar] [CrossRef] [PubMed]
- Warnes, S.L.; Keevil, C.W. Inactivation of norovirus on dry copper alloy surfaces. PloS One 2013, 8, e98333. [Google Scholar] [CrossRef] [PubMed]
- Warnes, S.L.; Highmore, C.J.; Keevil, C.W. Horizontal transfer of antibiotic resistance genes on abiotic touch surfaces: Implications for public health. PloS One 2012, 3, e00489-12. [Google Scholar] [CrossRef] [PubMed]
- Warnes, S.L. Laboratory studies to investigate the efficacy and mechanism of action of copper alloys to kill a range of bacterial pathogens and inactivate norovirus. Ph.D. Thesis, University of Southampton, UK, October 2014. [Google Scholar]
- Gloriant, T. Microhardness and abrasive wear resistance of metallic glasses and nanostructured composite materials. J. Non. Cryst. Solids. 2003, 316, 96–103. [Google Scholar] [CrossRef]
- Lin, B.; Mu, R.; Yang, L.F.; Bian, X.F. Antibacterial effect of metallic glasses. Chinese Sci. Bull. 2012, 57, 1069–1072. [Google Scholar] [CrossRef]
- Chu, J.H.; Lee, J.; Chang, C.C.; Chan, Y.C.; Liou, M.L.; Lee, J.W.; Jang, J.S.C.; Duh, J.G. Antimicrobial characteristics in Cu-containing Zr-based thin film metallic glass. Surf. Coat. Tech. 2014, 259, 87–93. [Google Scholar] [CrossRef]
- Huang, L.; Fozo, E.M.; Zhang, T.; Liaw, P.K.; He, W. Antimicrobial behavior of Cu-bearing Zr-based bulk metallic glasses. Mat. Sci. Eng. C-Mater. 2014, 39, 325–329. [Google Scholar] [CrossRef] [PubMed]
- Villapún, V.M.; Zhang, H.; Howden, C.; Chow, L.C.; Esat, F.; Pérez, P.; Sort, J.; Bull, S.; Stach, J.; González, S. Antimicrobial and wear performance of Cu-Zr-Al metallic glass composites. Mater. Design 2017, 115, 93–102. [Google Scholar] [CrossRef]
- Bo, H.; Wang, J.; Jin, S.; Qi, H.Y.; Yuan, X.L.; Liu, L.B.; Jin, Z.P. Thermodynamic analysis of the Al–Cu–Zr bulk metallic glass system. Intermetallics 2010, 18, 2322–2327. [Google Scholar] [CrossRef]
- Bai, X.; Li, J.H.; Cui, Y.Y.; Dai, Y.; Ding, N.; Liu, B.X. Formation and structure of Cu–Zr–Al ternary metallic glasses investigated by ion beam mixing and calculation. J. Alloys Compd. 2012, 522, 35–38. [Google Scholar] [CrossRef]
- Inoue, A. Stabilization of metallic supercooled liquid and bulk amorphous alloys. Acta Mater. 2000, 48, 279–306. [Google Scholar] [CrossRef]
- Effenberg, G.; Ilyenko, S. Light Metal Ternary Systems: Phase Diagrams, Crystallographic and Thermodynamic Data; Materials Science International Team MSIT: Stuttgart, Germany, 2007; Volume 11-A2. [Google Scholar]
- Yokoyama, Y.; Inoue, H.; Fukaura, K.; Inoue, A. Relationship between the liquidus surface and structures of Zr-Cu-Al bulk amorphous alloys. Mater. Trans. 2002, 43, 575–579. [Google Scholar] [CrossRef]
- Antibacterial products-test for antibacterial activity and efficacy; Japanese Standards Association: Tokyo, Japan, 2000; JIS Z 2801:2000.
- Plastics-Measurement of Antibacterial Activity on Plastic Surfaces; International Organization for Standardization: Geneva, Switzerland, 2007; 22196:2007.
- Protocol for the Evaluation of Bactericidal Activity of Hard, Non-Porous Copper Containing Surface Products; Environmental Protection Agency, Office of Pesticide Programs: Washington, DC, USA, 2015.
- Standard Test Method for Scratch Hardness of Materials Using a Diamond Stylus; American Society for Testing Materials: West Conshohocken, PA, USA, 2009; G171-03.
- Adler, T.A.; Walters, R.P. Wear and scratch hardness of 304 stainless steel investigated with a single scratch test. Wear 1993, 162, 713–720. [Google Scholar] [CrossRef]
- Wredenberg, F.; Larsson, P.L. Scratch testing of metals and polymers: Experiments and numerics. Wear 2009, 266, 76–83. [Google Scholar] [CrossRef]
- Briscoe, B.J.; Sinha, S.K. Density distributions characteristics of green ceramic compacts using scratch hardness. Tribol. Int. 1997, 30, 475–482. [Google Scholar] [CrossRef]
- Poletti, M.G.; Fiore, G.; Gili, F.; Mangherini, D.; Battezzati, L. Development of a new high entropy alloy for wear resistance: Fecocrniw 0.3 and Fecocrniw 0.3+ 5at.% of C. Mater. Design 2017, 115, 247–254. [Google Scholar] [CrossRef]
- Briscoe, B.J.; Evans, P.D.; Biswas, S.K.; Sinha, S.K. The hardnesses of poly (methylmethacrylate). Tribol. Int. 1996, 29, 93–104. [Google Scholar] [CrossRef]
- Sinha, S.K.; Reddy, S.U.; Gupta, M. Scratch hardness and mechanical property correlation for Mg/SiC and Mg/SiC/Ti metal–matrix composites. Tribol. Int. 2006, 39, 184–189. [Google Scholar] [CrossRef]
- González, S.; Sort, J.; Louzguine-Luzgin, D.V.; Perepezko, J.H.; Baró, M.D.; Inoue, A. Tuning the microstructure and mechanical properties of Al-based amorphous/crystalline composites by addition of Pd. Intermetallics 2010, 18, 2377–2384. [Google Scholar] [CrossRef]
- Song, K.K.; Pauly, S.; Zhang, Y.; Gargarella, P.; Li, R.; Barekar, N.S.; Kuhn, U.; Stoica, M.; Eckertm, J. Strategy for pinpointing the formation of B2 CuZr in metastable CuZr-based shape memory alloys. Acta Mater. 2011, 59, 6620–6630. [Google Scholar] [CrossRef]
- Kozachkov, H.; Kolodziejska, J.; Johnson, W.L.; Hofmann, D.C. Effect of cooling rate on the volume fraction of B2 phases in a CuZrAlCo metallic glass matrix composite. Intermetallics 2013, 39, 89–93. [Google Scholar] [CrossRef]
- Carter, J.; Fu, E.G.; Martin, M.; Xie, G.; Zhang, X.; Wang, Y.Q.; Chu, W.-K.; Shao, L. Effects of Cu ion irradiation in Cu 50 Zr 45 Ti 5 metallic glass. Scr. Mater. 2009, 61, 265–268. [Google Scholar] [CrossRef]
- Gebert, A.; Eckert, J.; Schultz, L. Effect of oxygen on phase formation and thermal stability of slowly cooled Zr 65 Al 7.5 Cu 17.5 Ni 10 metallic glass. Acta Mater. 1998, 46, 5475–5482. [Google Scholar] [CrossRef]
- Parlar, Z.; Bakkal, M.; Shih, A.J. Sliding tribological characteristics of Zr-based bulk metallic glass. Intermetallics 2008, 16, 34–41. [Google Scholar] [CrossRef]
- Pauly, S.; Liu, G.; Wang, G.; Kühn, U.; Mattern, N.; Eckert, J. Microstructural heterogeneities governing the deformation of Cu 47.5 Zr 47.5 Al 5 bulk metallic glass composites. Acta Mater. 2009, 57, 5445–5453. [Google Scholar] [CrossRef]
- Basu, J.; Nagendra, N.; Li, Y.; Ramamurty, U. Microstructure and mechanical properties of a partially crystallized La-based bulk metallic glass. Philos. Mag. 2003, 83, 1747–1760. [Google Scholar] [CrossRef]
- Ista, L.K.; Mendez, S.; Lopez, G.P. Attachment and detachment of bacteria on surfaces with tunable and switchable wettability. Biofoulding 2010, 26, 111–118. [Google Scholar] [CrossRef] [PubMed]
- Warnes, S.L.; Caves, V.; Keevil, C.W. Mechanism of copper surface toxicity in escherichia coli O157: H7 and salmonella involves immediate membrane depolarization followed by slower rate of DNA destruction which differs from that observed for gram-positive bacteria. Environ. Microbiol. 2012, 14, 1730–1743. [Google Scholar] [CrossRef] [PubMed]
- Santo, C.E.; Quaranta, D.; Grass, G. Antimicrobial metallic copper surfaces kill staphylococcus haemolyticus via membrane damage. Microbiologyopen 2012, 1, 46–52. [Google Scholar] [CrossRef] [PubMed]
- Champagne, V.K.; Helfritch, D.J. A demonstration of the antimicrobial effectiveness of various copper surfaces. J. Biol. Eng. 2013, 7, 1–6. [Google Scholar] [CrossRef] [PubMed]
- Hans, M.; Erbe, A.; Mathews, S.; Chen, Y.; Solioz, M.; Mücklich, F. Role of copper oxides in contact killing of bacteria. Langmuir 2013, 29, 16160–16166. [Google Scholar] [CrossRef] [PubMed]
- Villapún, V.M.; Dover, L.G.; Cross, A.; González, S. Antibacterial metallic touch surfaces. Materials 2016, 9, 736. [Google Scholar] [CrossRef]
- Chu, Y.Y.; Lin, Y.S.; Chang, C.M.; Liu, J.K.; Chen, C.H.; Huang, J.C. Promising antimicrobial capability of thin film metallic glasses. Mater. Sci. Eng. C 2014, 36, 221–225. [Google Scholar] [CrossRef] [PubMed]


| Element | 1a matrix | 1b matrix | 1c matrix | 1d matrix | 2a Dendrites I | 2b Dendrites I | 2c Dendrites I | 2d Dendrites I | 3c Dendrites II | 3d Dendrites II | 1e matrix | 2e Geometric Particles | 3e Dendrites | 4e Clear Matrix |
|---|---|---|---|---|---|---|---|---|---|---|---|---|---|---|
| Cu | 51.2 ± 0.2 | 51.1 ± 0.4 | 52.1 ± 0.4 | 52.5 ± 0.6 | 43.3 ± 3.0 | 45.6 ± 0.8 | 45.6 ± 1.0 | 45.9 ± 1.5 | 37.7 ± 0.1 | 37.3 ± 1.3 | 54.9 ± 1.0 | 54.8 ± 1.3 | 36.7 ± 1.5 | 46.8 ± 0.7 |
| Zr | 43.2 ± 3.3 | 42.6 ± 0.2 | 42.1 ± 1.9 | 40.4 ± 0.5 | 44.9 ± 1.8 | 43.6 ± 1.8 | 43.0 ± 0.7 | 43.0 ± 1.2 | 48.3 ± 0.2 | 49.4 ± 1.0 | 43.3 ± 0.9 | 28.5 ± 1.7 | 49.6 ± 0.9 | 51.1 ± 0.5 |
| Al | 6.8 ± 0.2 | 6.3 ± 0.4 | 5.85 ± 1.7 | 7.15 ± 0.7 | 11.9 ± 1.4 | 10.7 ± 1.2 | 11.4 ± 0.7 | 11.1 ± 0.7 | 13.9 ± 0.2 | 13.46 ± 0.5 | 1.9 ± 0.3 | 16.7 ± 1.2 | 13.8 ± 1.6 | 2.2 ± 0.6 |
| Phase | Nominal comp. | Nominal comp. | Nominal comp. | Nominal comp. | CuZr | CuZr | CuZr | CuZr | CuZr2 | CuZr2 | Cu10Zr7 | Cu2ZrAl | CuZr2 | CuZr |
| Sample | Pile-Up (µm) | Centre (µm) | Maximum (µm) | Groove Area/ Pile-Up Area | Scratch Width (µm) | Scratch Hardness Number (GPa) |
|---|---|---|---|---|---|---|
| CH 2 mm | 5.05 ± 1.92 | 15.70 ± 1.22 | 20.79 ± 1.41 | 10.05 ± 3.87 | 243.16 ± 2.36 | 1.29 ± 0.02 |
| NCH 2 mm | 3.71 ± 1.58 | 17.46 ± 0.85 | 21.82 ± 1.45 | 14.51 ± 5.87 | 241.25 ± 2.23 | 1.31 ± 0.02 |
| CH 3 mm | 2.78 ± 1.09 | 17.48 ± 1.79 | 19.82 ± 2.22 | 17.20 ± 3.72 | 240.30 ± 2.98 | 1.32 ± 0.03 |
| NCH 3 mm | 2.63 ± 1.51 | 21.92 ± 1.83 | 26.51 ± 2.42 | 31.83 ± 5.90 | 229.44 ± 5.99 | 1.45 ± 0.08 |
| 850 °C 48 h | 2.90 ± 1.31 | 17.47 ± 1.13 | 20.74 ± 1.22 | 13.97 ± 6.75 | 196.08 ± 1.57 | 1.99 ± 0.03 |
| Copper | 40.91 ± 12.08 | 61.93 ± 3.97 | 66.34 ± 2.92 | 2.97 ± 0.88 | 426.54 ± 3.61 | 0.42 ± 0.01 |
| Sample | Parameter | 1 h | 2 h | 3 h | 4 h |
|---|---|---|---|---|---|
| CH 2 mm | Ui | 8.58 | 8.57 | 8.59 | 8.68 |
| Ai | 8.21 | 8.12 | 7.92 | 7.71 | |
| R | 0.38 | 0.46 | 0.67 | 0.97 | |
| NCH 3 mm | Ui | 8.58 | 8.57 | 8.59 | 8.68 |
| Ai | 8.20 | 8.11 | 7.19 | 6.16 | |
| R | 0.38 | 0.46 | 1.40 | 2.51 |
| Sample | Parameter | 1 h | 2 h | 3 h | 4 h |
|---|---|---|---|---|---|
| CH 2 mm | a (control) | 2.62 × 10⁸ | 3.14 × 10⁸ | 3.25 × 10⁸ | 4.60 × 10⁸ |
| b | 1.61 × 10⁸ | 1.74 × 10⁸ | 2.24 × 10⁷ | 2.68 × 10⁷ | |
| % reduction | 38.73% | 44.57% | 93.09% | 94.18% | |
| NCH 3 mm | a (control) | 2.62 × 10⁸ | 3.14 × 10⁸ | 3.25 × 10⁸ | 4.60 × 10⁸ |
| b | 1.59 × 10⁸ | 1.78 × 10⁸ | 9.44 × 10⁵ | 4.23 × 10⁵ | |
| % reduction | 39.52% | 43.22% | 99.71% | 99.91% |
© 2017 by the authors. Licensee MDPI, Basel, Switzerland. This article is an open access article distributed under the terms and conditions of the Creative Commons Attribution (CC BY) license (http://creativecommons.org/licenses/by/4.0/).
Share and Cite
Villapún, V.M.; Esat, F.; Bull, S.; Dover, L.G.; González, S. Tuning the Mechanical and Antimicrobial Performance of a Cu-Based Metallic Glass Composite through Cooling Rate Control and Annealing. Materials 2017, 10, 506. https://doi.org/10.3390/ma10050506
Villapún VM, Esat F, Bull S, Dover LG, González S. Tuning the Mechanical and Antimicrobial Performance of a Cu-Based Metallic Glass Composite through Cooling Rate Control and Annealing. Materials. 2017; 10(5):506. https://doi.org/10.3390/ma10050506
Chicago/Turabian StyleVillapún, Victor M., F. Esat, S. Bull, L.G. Dover, and S. González. 2017. "Tuning the Mechanical and Antimicrobial Performance of a Cu-Based Metallic Glass Composite through Cooling Rate Control and Annealing" Materials 10, no. 5: 506. https://doi.org/10.3390/ma10050506