
Phase Equilibria and Magnetic Phases in the Ce-Fe-Co-B System

1
Department of Mechanical and Industrial Engineering, Concordia University, 1455 de Maisonneuve Boulevard West, Montreal, QC H3G 1M8, Canada
2
Department of Mechanical and Materials Engineering, Masdar Institute, Masdar City P.O. Box 54224, Abu Dhabi, United Arab Emirates
*
Author to whom correspondence should be addressed.
Materials 2017, 10(1), 16; https://doi.org/10.3390/ma10010016
Submission received: 3 November 2016
/
Revised: 2 December 2016
/
Accepted: 20 December 2016
/
Published: 28 December 2016
Abstract
:Ce-Fe-Co-B is a promising system for permanent magnets. A high-throughput screening method combining diffusion couples, key alloys, Scanning Electron Microscope/Wavelength Dispersive X-ray Spectroscope (SEM/WDS), and Magnetic Force Microscope (MFM) is used in this research to understand the phase equilibria and to explore promising magnetic phases in this system. Three magnetic phases were detected and their homogeneity ranges were determined at 900 °C, which were presented by the formulae: Ce2Fe14−xCoxB (0 ≤ x ≤ 4.76), CeCo4−xFexB (0 ≤ x ≤ 3.18), and Ce3Co11−x FexB4 (0 ≤ x ≤ 6.66). The phase relations among the magnetic phases in this system have been studied. Ce2(Fe, Co)14B appears to have stronger magnetization than Ce(Co, Fe)4B and Ce3(Co, Fe)11B4 from MFM analysis when comparing the magnetic interactions of selected key alloys. Also, a non-magnetic CeCo12−xFexB6 (0 ≤ x ≤ 8.74) phase was detected in this system. A boron-rich solid solution with Ce13FexCoyB45 (32 ≤ x ≤ 39, 3 ≤ y ≤ 10) chemical composition was also observed. However, the crystal structure of this phase could not be found in the literature. Moreover, ternary solid solutions ε1 (Ce2Fe17−xCox (0 ≤ x ≤ 12.35)) and ε2 (Ce2Co17−xFex (0 ≤ x ≤ 3.57)) were found to form between Ce2Fe17 and Ce2Co17 in the Ce-Fe-Co ternary system at 900 °C.
1. Introduction
Manufacturing of hybrid and electric cars has escalated the need for strong and inexpensive permanent magnets. Modern permanent magnets devices require the presence of large coercivity. Among different commercial permanent magnets, rare-earth-based materials have been considered as the most favorable candidates due to their suitable magnetic properties [1]. The growing world demand for permanent magnets and rising costs of Nd and other less abundant rare earth metals (e.g., Sm and Dy) necessitates the development of new Fe-based magnets with the addition of relatively abundant inexpensive rare earth metals (e.g., Ce). Despite the low Curie temperature, Ce2Fe14B was found to have suitable magnetic properties and could possibly be used in the industry [2]. Co was recognized as a potential additive to increase Curie temperature of Ce2Fe14B [3]. Thus, the Ce-Fe-Co-B quaternary system is a promising system for magnetic materials with suitable magnetic properties as well as low cost for the automotive or electromechanical applications, especially in the Fe-rich region. Knowledge of phase equilibria is necessary for magnetic materials development and for the optimization of magnets composition as well as establishing the heat-treatment conditions. However, limited experimental results can be found in the literature regarding this system. In this research, phase equilibria in the Ce-Fe-Co-B system are investigated. For this purpose and to find promising magnetic compounds, a high-throughput screening (HTS) method is adopted.
2. Literature Review
2.1. Ternary Systems
The Ce-Fe-Co-B system consists of Ce-Fe-B, Co-Fe-B, Ce-Co-B, and Ce-Fe-Co four sub-ternary systems. The phase equilibria in Ce-Fe-B, Co-Fe-B, and Ce-Co-B were established or partially established in the literature. A number of ternary compounds have been found among these three systems. However, there are still some questionable and uncertain phase relationships in the Ce-Fe-Co system which will be described in the coming section. A brief literature review regarding all the constituent ternary systems is included below.
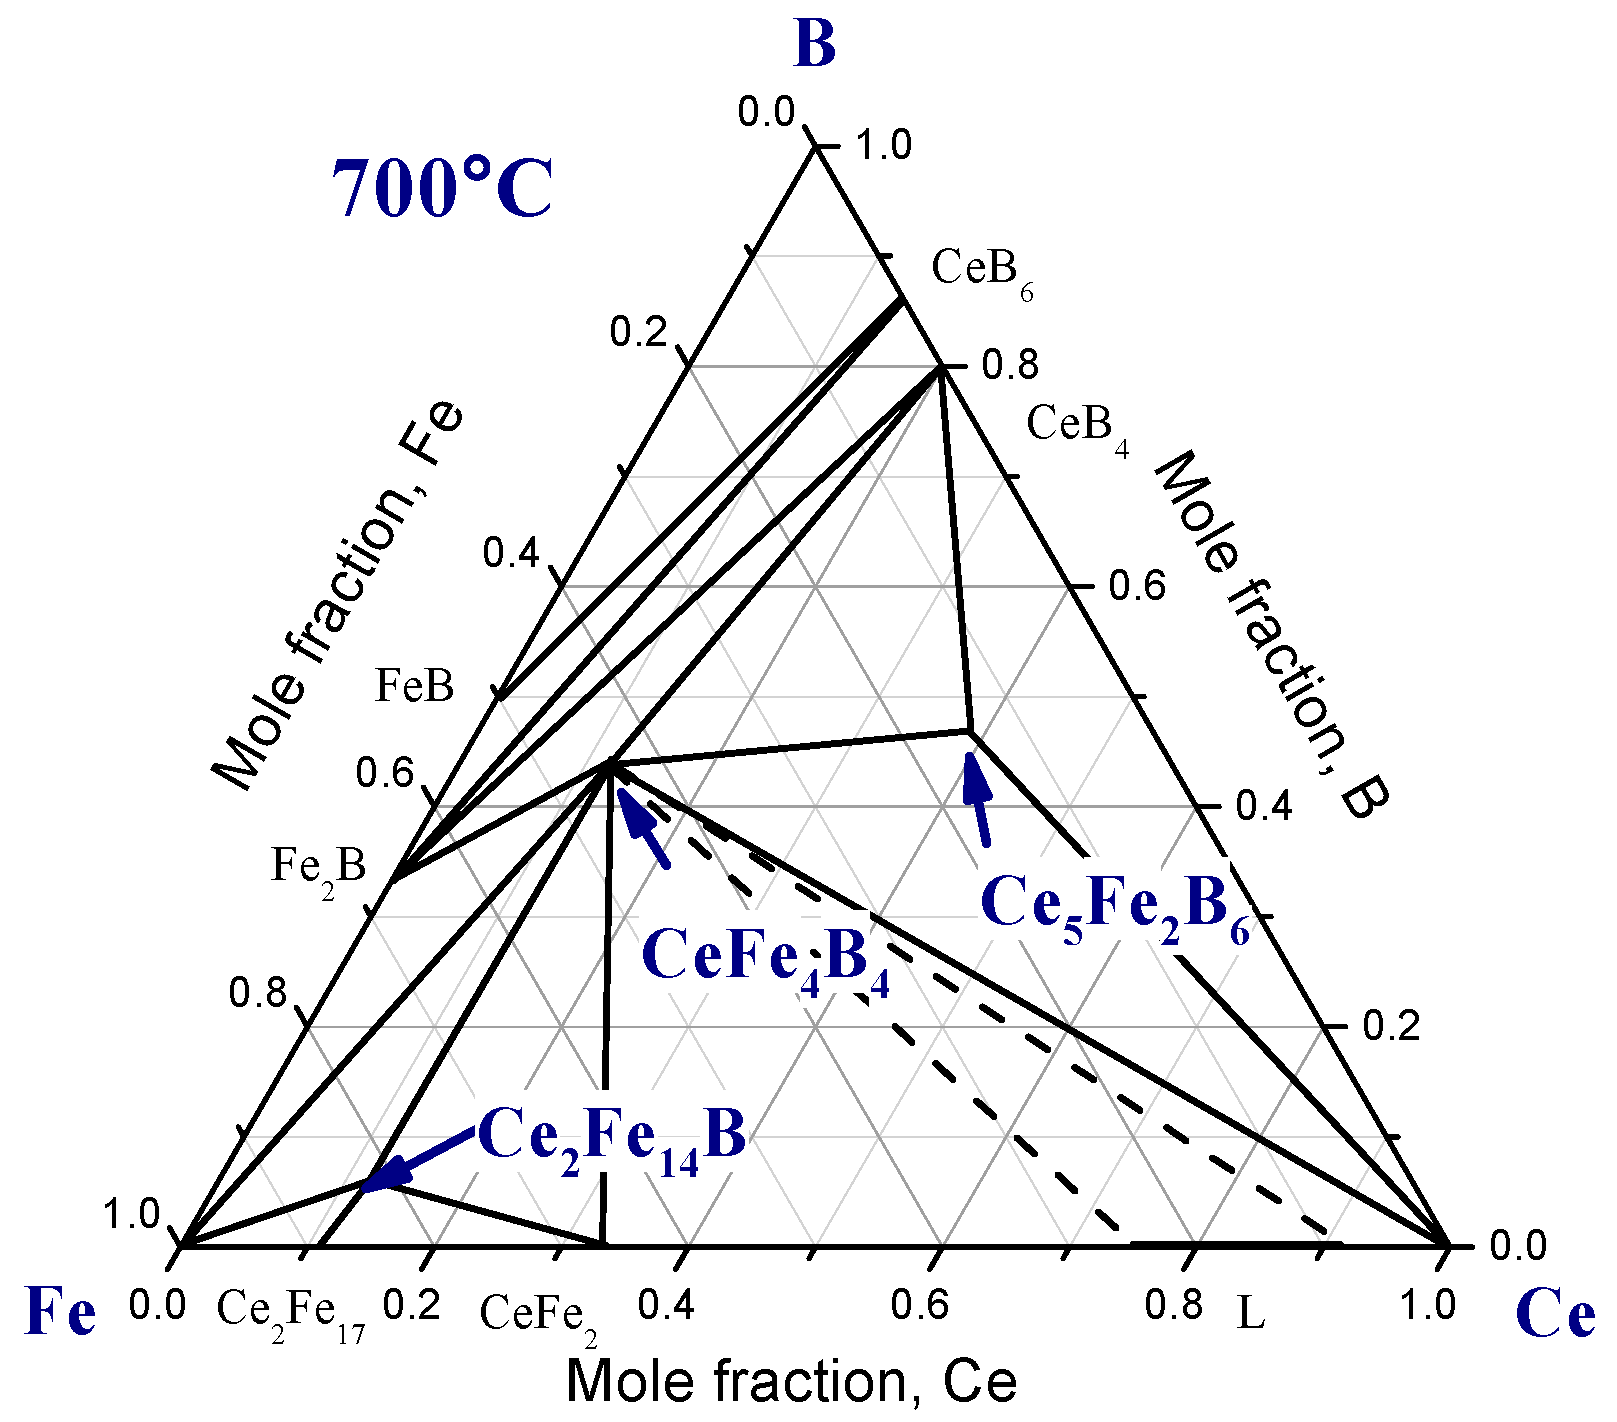
The phase diagram of the Ce-Fe-B system was investigated by several researchers [4,5,6,7]. Raghavan [8] summarized the previous works and re-drew the isothermal section at 700 °C, as shown in Figure 1. As can be seen from this figure, three ternary compounds, Ce2Fe14B, CeFe4B4, and Ce5Fe2B6, were reported.
The early experimental studies of the Co-Fe-B ternary system can be found in [9,10,11]. Liu et al. [12] calculated isothermal sections of this system at 900 °C and 1000 °C. Their results were in reasonable agreement with the experimental data provided by Van Loo et al. [11] at 900 °C as shown in Figure 2a. At 1000 °C, the experimental data provided by Liu et al. [12] and Rogl et al. [9] contradicted those reported by of Pradelli et al. [10], as can be seen from Figure 2b.
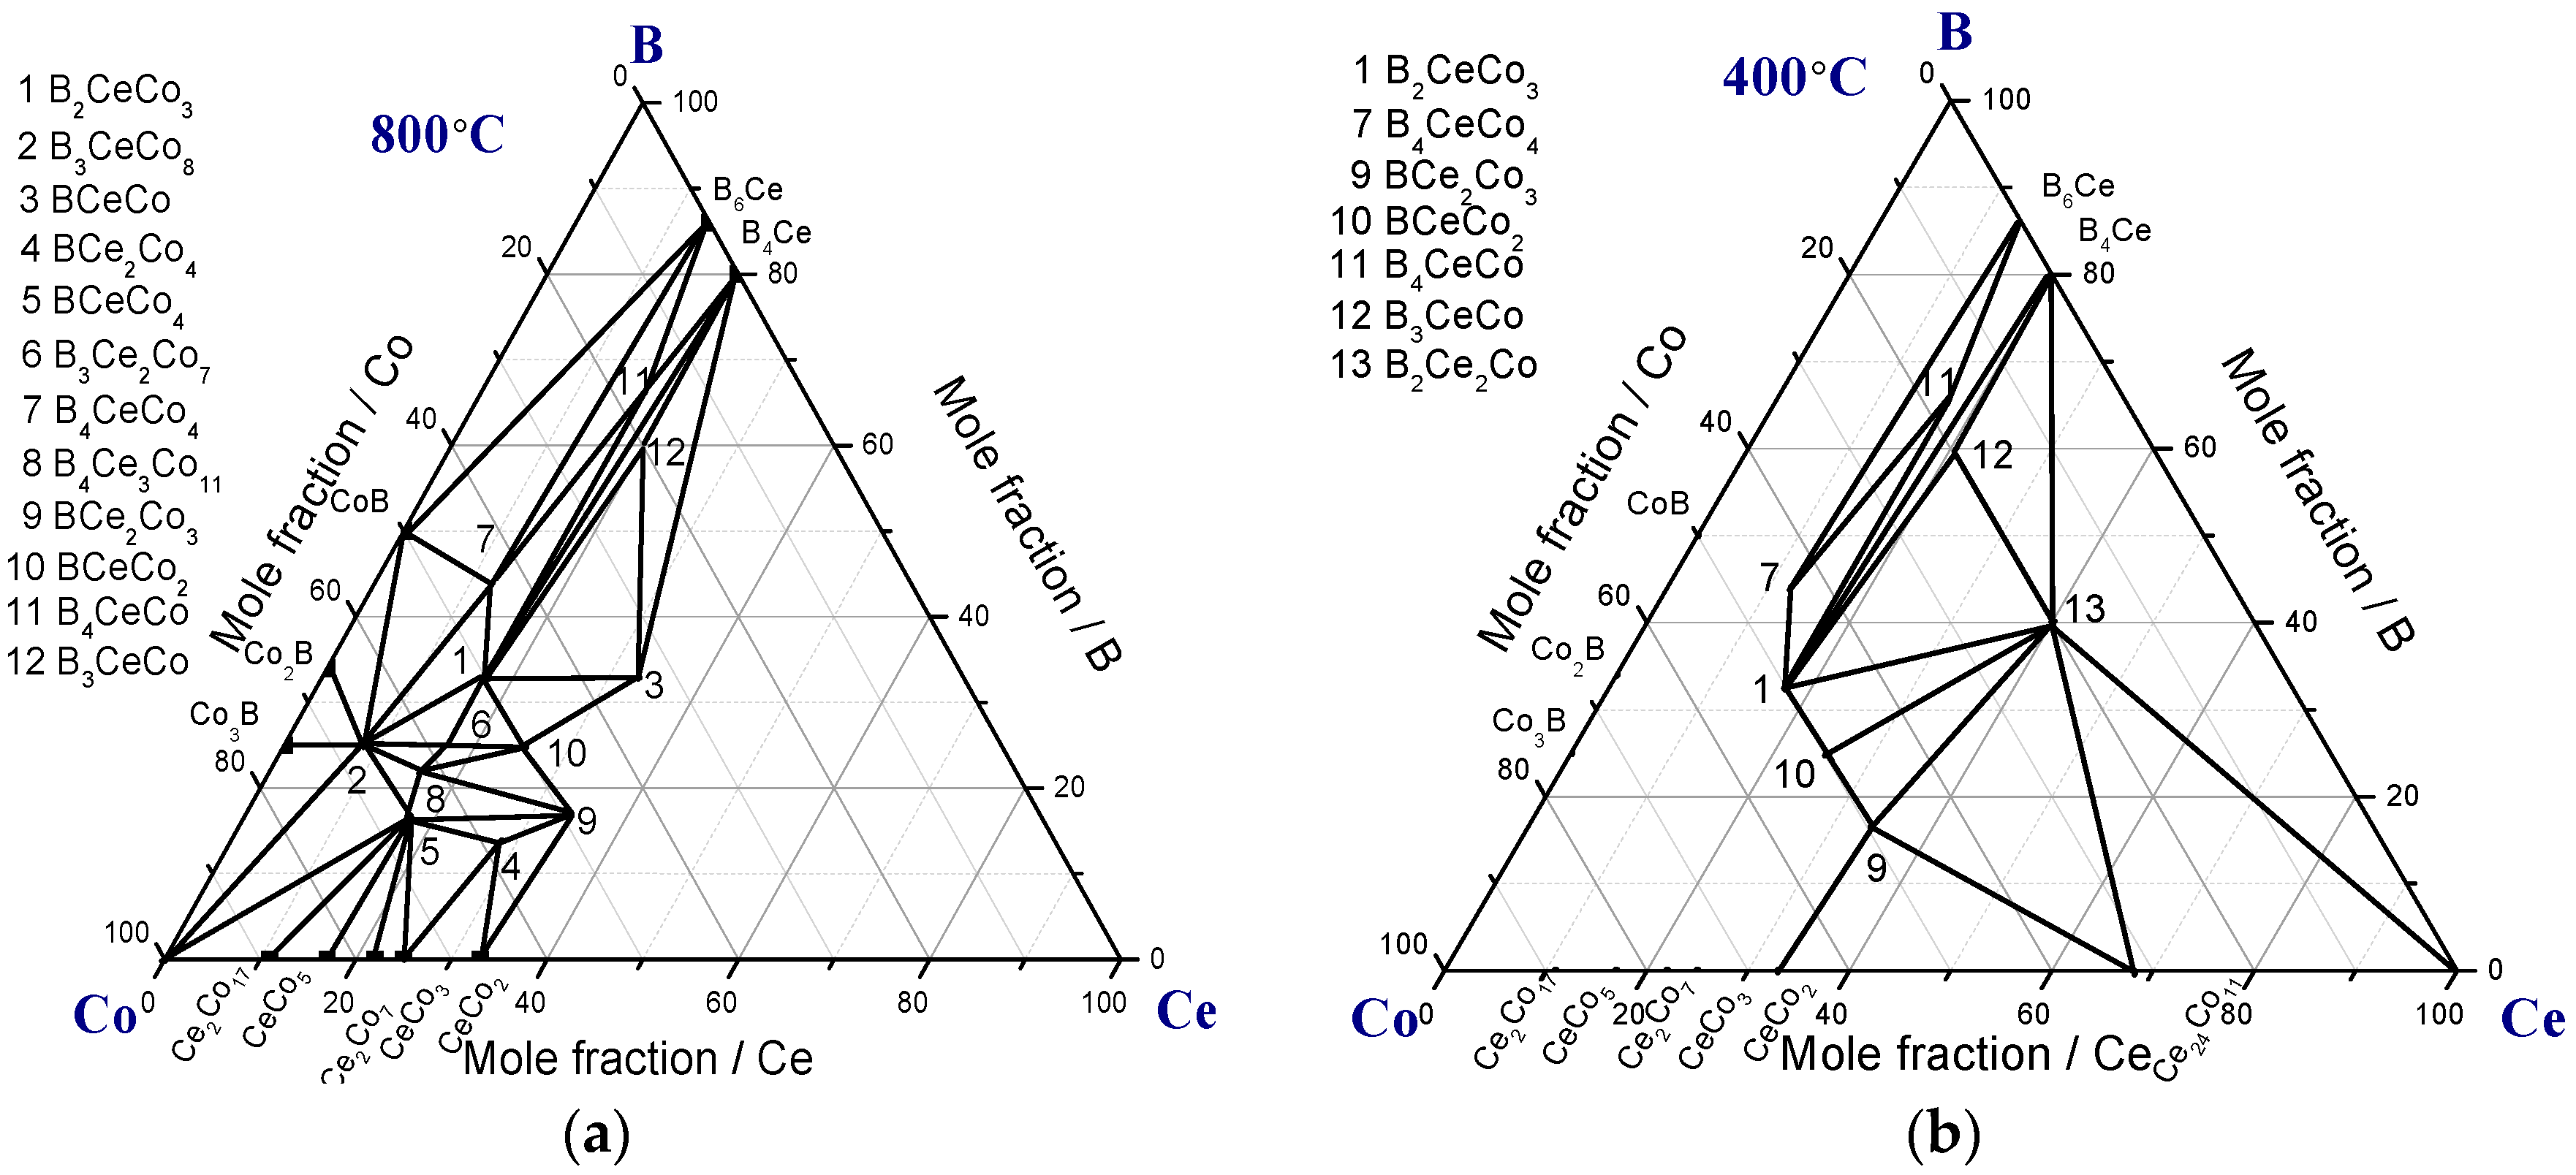
Two partial isothermal sections of Ce-Co-B were reported by Bilonizhko et al. [13], as shown in Figure 3. Thirteen ternary compounds (B2CeCo3, B3CeCo8, BCeCo, BCe2Co4, BCeCo4, B3Ce2Co7, B4CeCo4, B4Ce3Co11, BCe2Co3, BCeCo2, B4CeCo, B3CeCo, and B2Ce2Co) were found. It was reported that BCeCo is a high-temperature compound that formed at 800 °C and decomposed at 400 °C. Therefore, BCeCo can be seen only in Figure 3a, not in Figure 3b. Later, four additional ternary compounds were reported: B2Ce2Co5 [14], BCe3Co20 [15], B6CeCo12 [16], and B6Ce5Co2 [17]. However, the thermal stability of these compounds and their phase relationships are still unknown. Having sixteen ternary compounds makes B-Ce-Co a very complex system. Therefore, a significant amount of experimental and thermodynamic modeling research on this system is still needed.
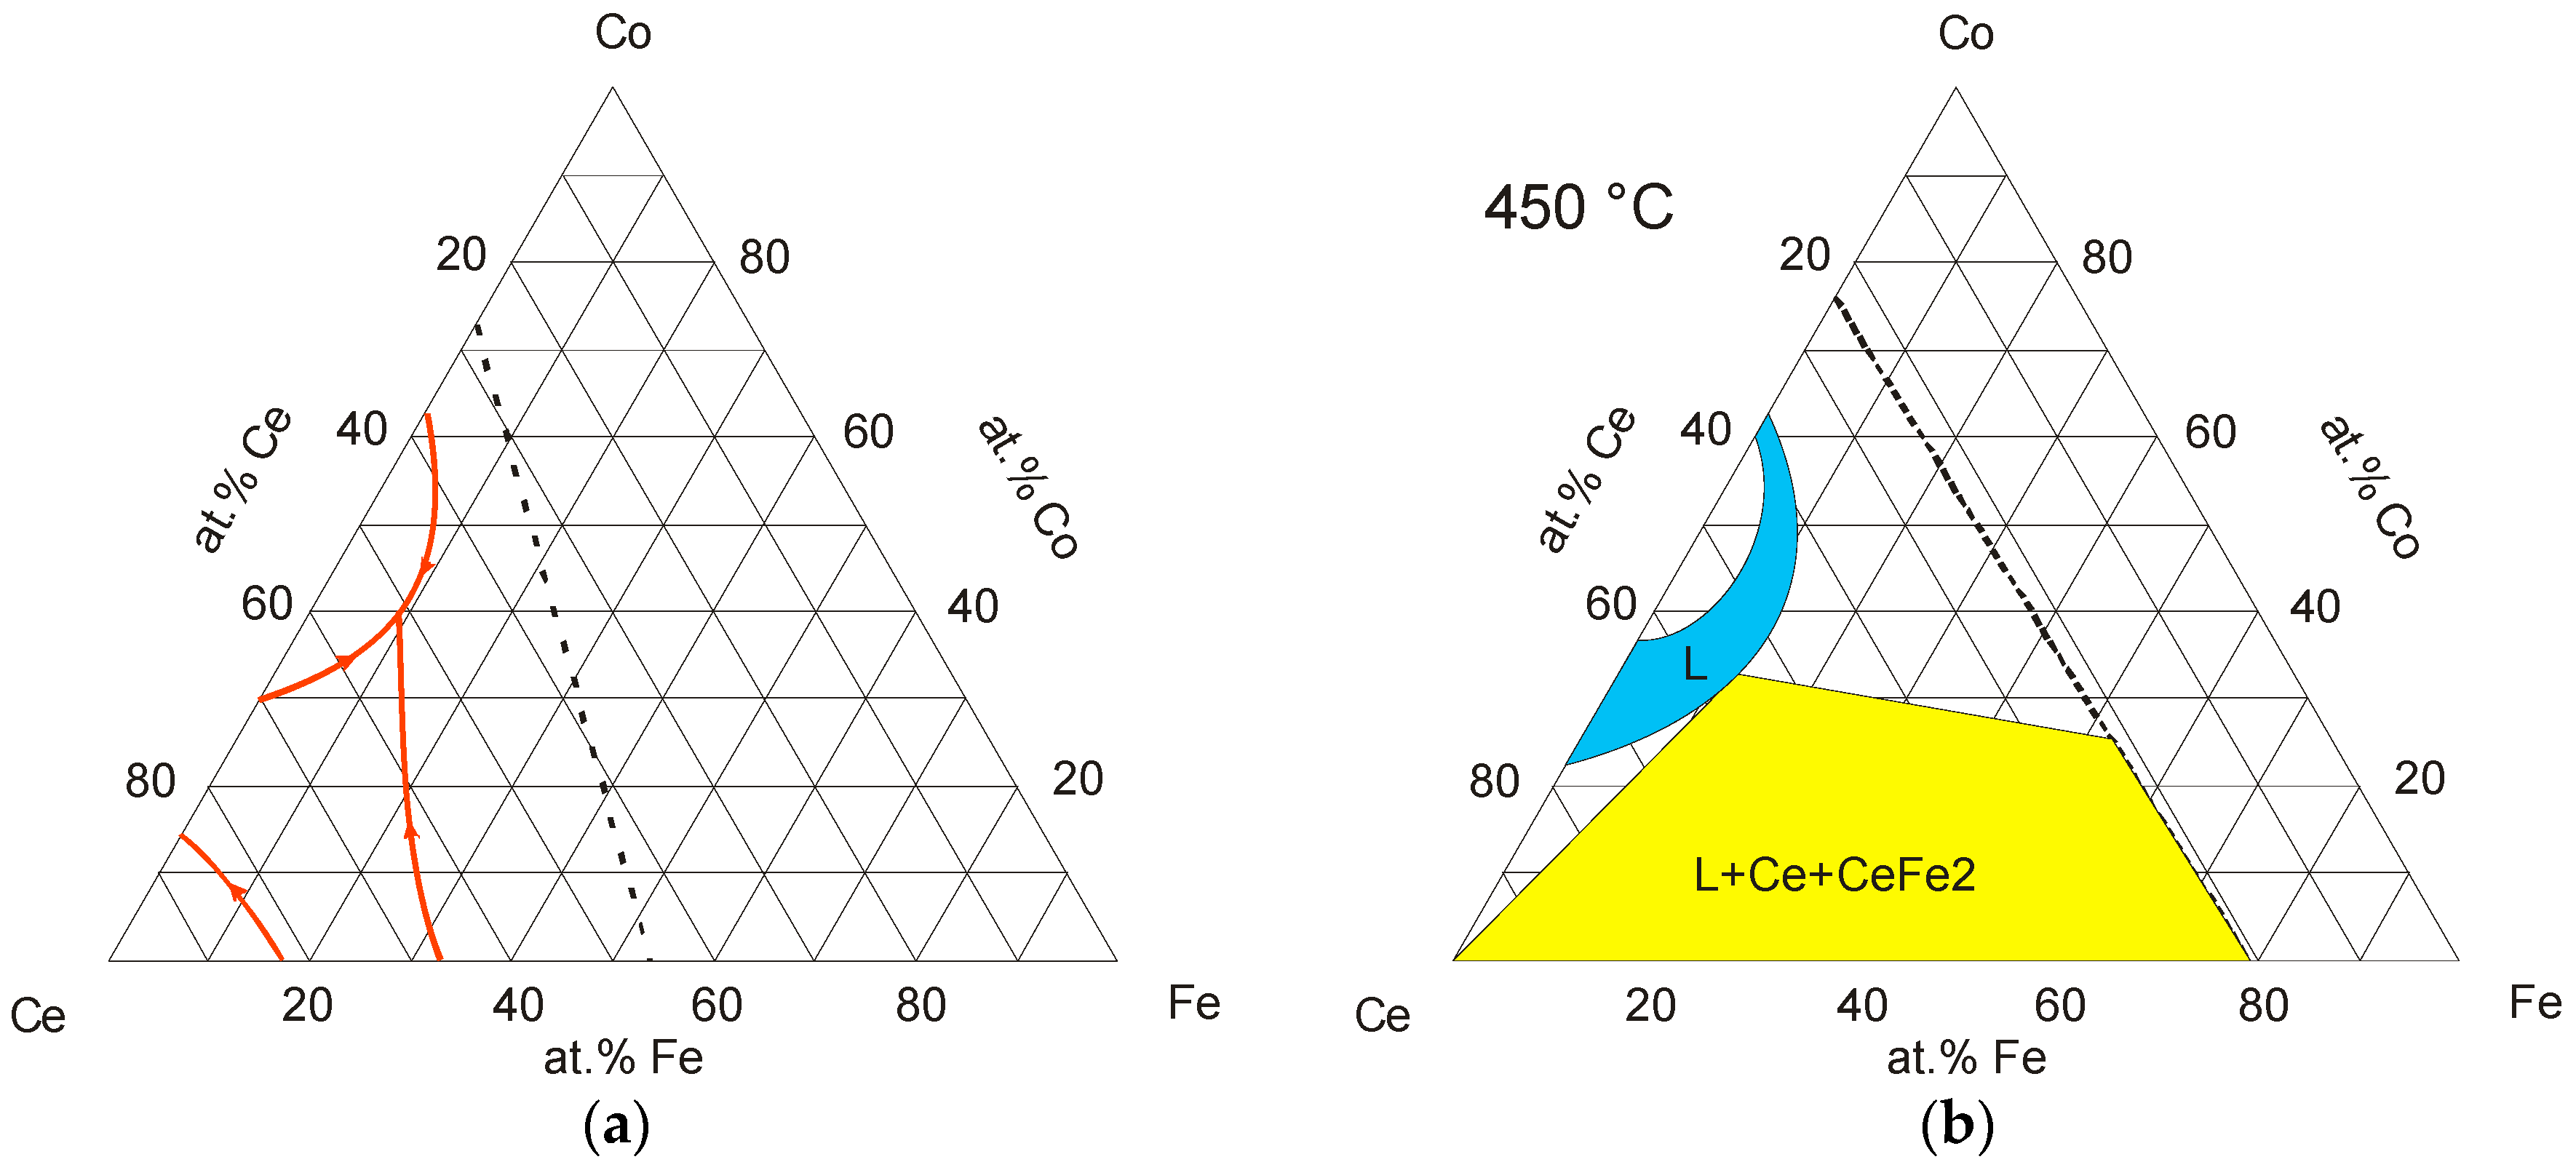
The literature data on the experimental phase equilibria in the Ce-Co-Fe ternary system is limited to the work of Critchley [18], who reported a partial liquidus projection (Figure 4a) and partial triangulation of the isothermal section at 450 °C (Figure 4b). These figures were re-drawn from the ASM Alloy Phase Diagram Database [19]. It should be mentioned that the triangulation of the L + Ce + CeFe2 three-phase region in Figure 4b is incorrect, because CeFe2 compound must not extend beyond 33 at. % Ce at the Ce-Fe side, according to the chemical composition of the compound. Also, the liquid region in the Ce-Co system should be limited to the range of 22–34 at. % Co, based on the most recent Ce-Co binary phase diagram [20]. Moreover, Mansey et al. [21] studied the change of lattice parameters of the CeFe2-CeCo2 quasi-binary section. They reported a continuous solid solubility between the CeFe2 and CeCo2 compounds. These results were confirmed later by Harris and Longworth [22], and Longworth and Harris [23], who reported that the CeFe2-CeCo2 solid solution at 1173 K has a cubic C15 Laves phase. In this ternary system, the phase equilibria in the Co-Fe side is still unclear. Especially, the phase relationships between Ce2Co17 and Ce2Fe17 are missing in the literature. These two compounds are isostructural compounds with a hexagonal Th2Zn17 crystal structure prototype [24]. Therefore, they are expected to form a continuous solid solution.
2.2. Quaternary System
Limited experimental results regarding the phase equilibria in the Ce-Fe-Co-B system can be found in the literature. Skoug et al. [3] reported two series of Ce3Fe14−xCoxB and Ce2.55Fe14−xCoxB1.27 melt-spun ribbons and their magnetic properties were also studied. Co was found to dissolve in Ce2Fe14B and form magnetic Ce2(Fe, Co)14B compound. However, the maximum solid solubility of Ce2(Fe, Co)14B is still unknown, and the phase relationships need to be understood. Also, the presence of other magnetic phases in this system should be verified. Thus, it is necessary to carry out research to understand the phase equilibria as well as to screen other promising magnetic phases in the Ce-Fe-Co-B system.
3. Materials and Methods
By combining diffusion couples and key alloys, with the aid of the Scanning Electron Microscope (SEM) and Magnetic Force Microscope (MFM), the HTS method is much more efficient to understand the phase equilibria and to screen magnetic compounds in a multi-component system. HTS is used to screen magnetic phases in the Ce-Fe-Co-B multi-component system combining microstructural, micro-elemental, and magnetic domain analyses of diffusion couples and key alloys. Magnetic phases could be identified through their domain interactions with the magnetic tip of the MFM. The analysis of one successful diffusion couple can potentially give complete information on a large number of intermetallic phases in the system at a specific temperature. Based on the diffusion couples results, key alloys are prepared and studied further by X-ray Diffraction (XRD) for phase identification and MFM to confirm the presence of a magnetic phase in a significant amount. Importantly, the key alloys can be used to measure intrinsic magnetic properties, such as saturation magnetization, anisotropy fields, and Curie temperature. These properties for Ce2Fe14B modified by Co will be reported in another paper. HTS significantly reduces the number of experiments and the timeframe. However, ternary or quaternary diffusion couples have unpredictable diffusion paths, which could lead to omitting some phases. Besides, slow kinetic formation of some phases may cause the formation of thin layers that might be difficult to be successfully analyzed [25]. Therefore, key alloys are used to verify the results obtained from diffusion couples. In this study, four solid-state diffusion couples and fifteen key alloys were prepared. Pure materials with 99 wt. % purity or better are used as the starting materials. All the elements are supplied by Alfa Aesar® (Haverhill, MA, USA), Johnson Matthey Company (London, UK). Samples of known composition are prepared from pure metals using an arc melting furnace under argon atmosphere.
The arc melting furnace is equipped with a water-cooled copper crucible and a non-consumable tungsten electrode. Every alloy must be melted several times to ensure homogeneity. The prepared samples were used as key alloys or as end-members for the diffusion-couple experiments. Diffusion couples were prepared by grinding down the contacting interfaces of end-members using 1200 grit SiC paper and then polished up to 1 µm using alcohol-based diamond suspension. Ninety-nine per cent pure ethanol was used as lubricant. The selected end-members were carefully pressed and clamped together using a stainless steel ring. For the annealing process, samples were encapsulated inside quartz tubes under vacuum. After sufficient annealing time (at least 25 days), samples were quenched in a cold water bath to obtain the high-temperature structure. Quenched samples or diffusion couples were polished and grinded up to 1 µm in order to be analyzed using SEM coupled with Energy/Wavelength Dispersive X-ray Spectroscopes (EDS/WDS) and MFM. The microstructure and phase composition of the samples were analyzed by SEM/WDS (HITACHI S-3400N, HITACHI, Tokyo, Japan). XRD was performed for the key alloys using PANAnalytical Xpert Pro X-ray diffractometer (PANAnalytical, Almelo, The Netherlands) with a CuKα radiation at 45 kV and 40 mA. XRD patterns were analyzed using X’Pert Highscore plus software [26] and the Rietveld method. The crystal structure prototypes of the detected phases were obtained from Pearson’s Database [24] and used in XRD analysis. Quenched samples were also used for MFM imaging using Digital Instruments Multimode Atomic Force Microscope (Digital Instruments, Billerica, MA, USA) in LiftMode. In this work, a 225 µm long silicon cantilever having a magnetic pyramidal tip was used to acquire the magnetic gradient images. The MFM tip, supplied by Appnano Ltd. (Mountain View, CA, USA) was coated with an approximately 50 nm CoCr layer. The cantilevers have resonant frequency between 47 and 76 kHz. This frequency is shifted by an amount proportional to the vertical gradient of the magnetic forces on the tip [27]. The frequency shifts can be detected by the phase detection capability of the MFM. The drive frequency of the cantilever for the phase detection was set to be the center of the cantilever resonance. The signal was measured as the cantilever’s phase of oscillation relative to the piezo drive. And the magnetic contrast can be achieved through the magnetostatic interaction between the MFM tip and the stray fields from the sample [27]. When attractive interactions occur, negative phase shift and dark image contrast can be observed in the MFM images. Whereas, positive phase shift and bright image contrast result when repulsive interactions take place [27].
4. Results and Discussion
4.1. Diffusion Couples Results
In order to understand the phase equilibria in the Ce-Fe-Co-B system, four diffusion couples were prepared. The chemical compositions across the diffusion couples and the corresponding phases that formed in the diffusion layers are listed in Table 1. Diffusion couples were all annealed at 900 °C for 4 weeks.
The backscattered electron (BSE) image of DC1 is presented in Figure 5a. As a result of diffusion between Ce2Fe14B and Co, six diffusion layers formed. The compositions of the formed phases were determined using WDS point analysis. The solubility ranges were measured by WDS line scan. In the first layer, the end-member Ce2Fe14B (white) was in equilibrium with the α-(Fe, Co) phase (black). Fe was substituted by Co in both phases during the diffusion process. A WDS compositional profile of Ce2(Fe, Co)14B is shown in Figure 5b. The quaternary solid solubility of Ce2Fe14B was determined as 9 at. % Co, which was presented by the formula Ce2Fe14−xCoxB (0 ≤ x ≤ 1.54). Co in α-Fe in layer 1 was found to be 6 at. %. The grey phase in layer 2 was identified as Ce2(Fe, Co)17 with Ce11Fe34–79Co10–55 composition and named as ε1 in this study. The WDS compositional profile of Ce2(Fe, Co)17 is plotted in Figure 5c. At the boundary between layers 1 and 2, three phase equilibrium (Ce2(Fe, Co)14B/α-(Fe, Co)/ε1) was observed. Moreover, the concentration of Co dissolved in α-Fe phase (black) also gradually increased from 6 to 44 at. % in layer 2. White phase in layer 3 was found to be a stoichiometric compound with Ce16Fe9Co59B16 composition. This new quaternary compound is in equilibrium with α-(Fe, Co) (black) and had similar composition to CeCo4B, considering the Fe-Co substitution which was also confirmed by key alloys. A three-phase region was established between ε1, α-(Fe, Co), and Ce(Co, Fe)4B. Co-rich Ce2(Co, Fe)17 with Ce11Fe19Co70 chemical composition was detected in layer 4, where it is in equilibrium with α-(Fe, Co). Substitution of Fe by Co was found to be up to 61 at. %. Another three-phase region was obtained among α-(Fe, Co), Ce(Co, Fe)4B, and Ce2(Co, Fe)17. Through WDS analysis, layer 5 has been analyzed as α-(Fe, Co) and its homogeneity range was measured as 65–70 at. % Co. The dominating black phase in the thin layer 6 was determined to be γ-(Fe, Co) with a relatively small amount of Fe of about 8–12 at. %. This phase is in equilibrium with Ce2(Co, Fe)17 (white), which was measured to have Ce11Fe2Co87 chemical composition. This two-phase equilibrium is also confirmed by DC2.
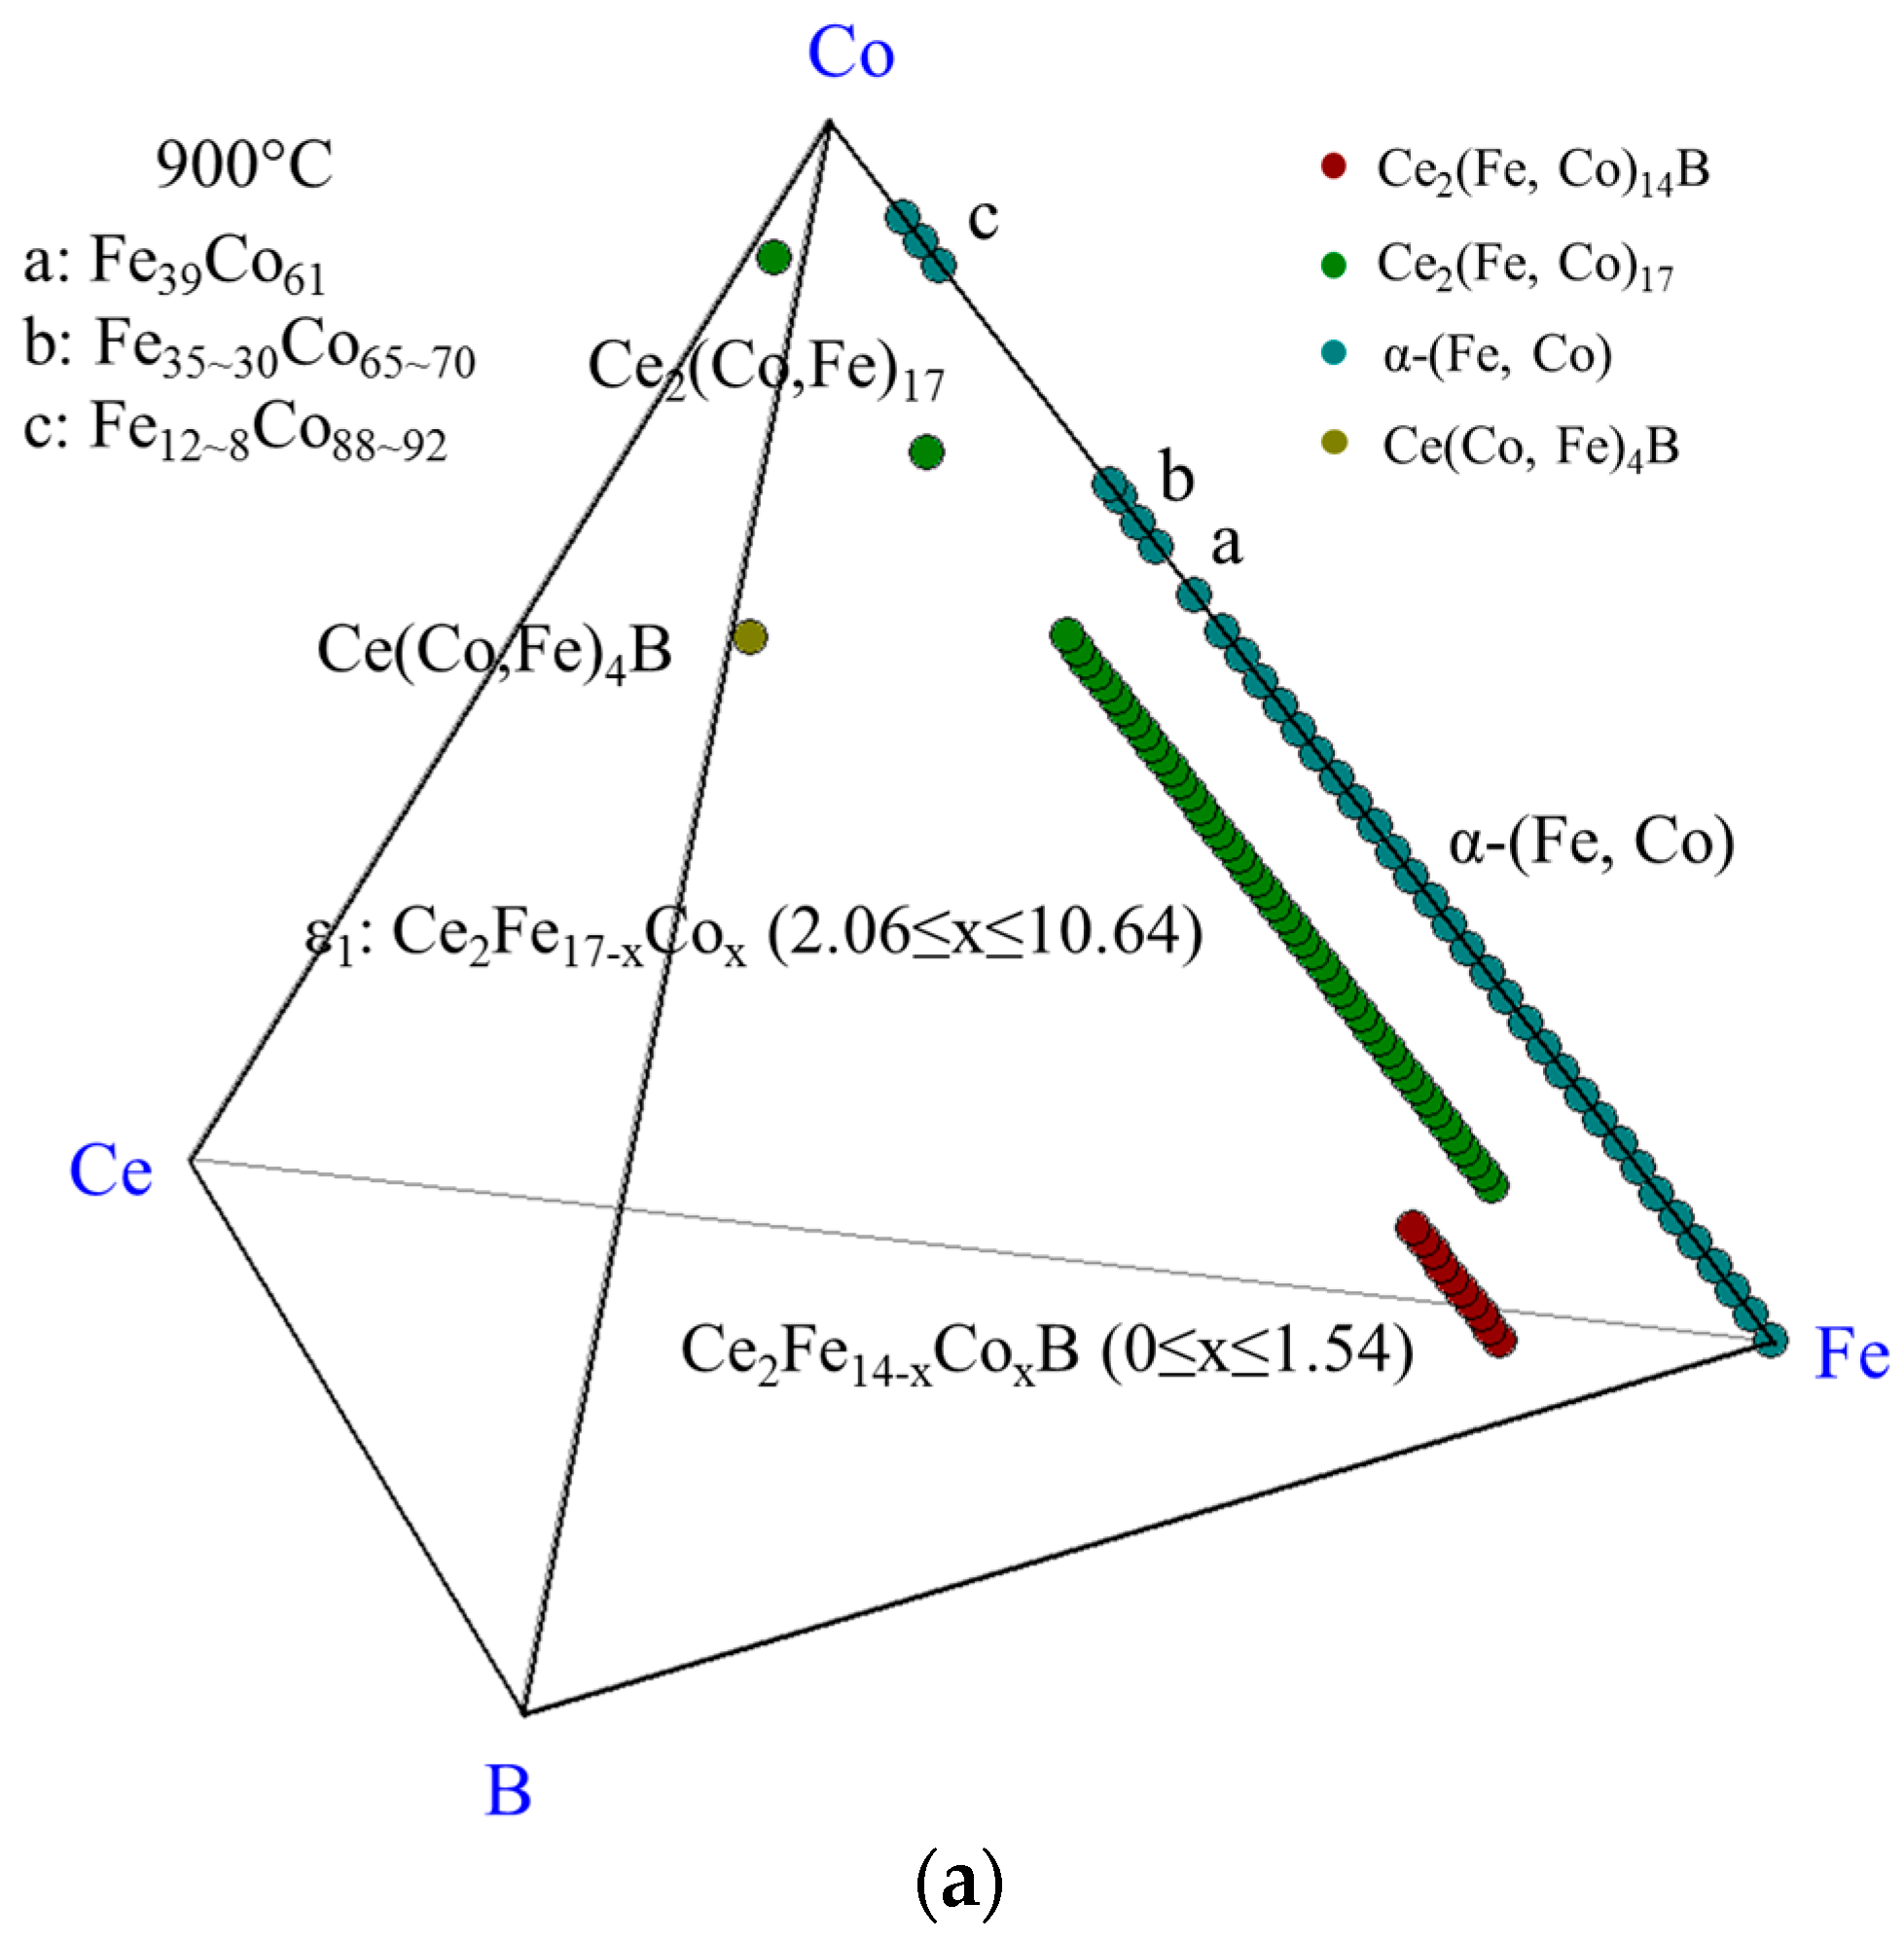
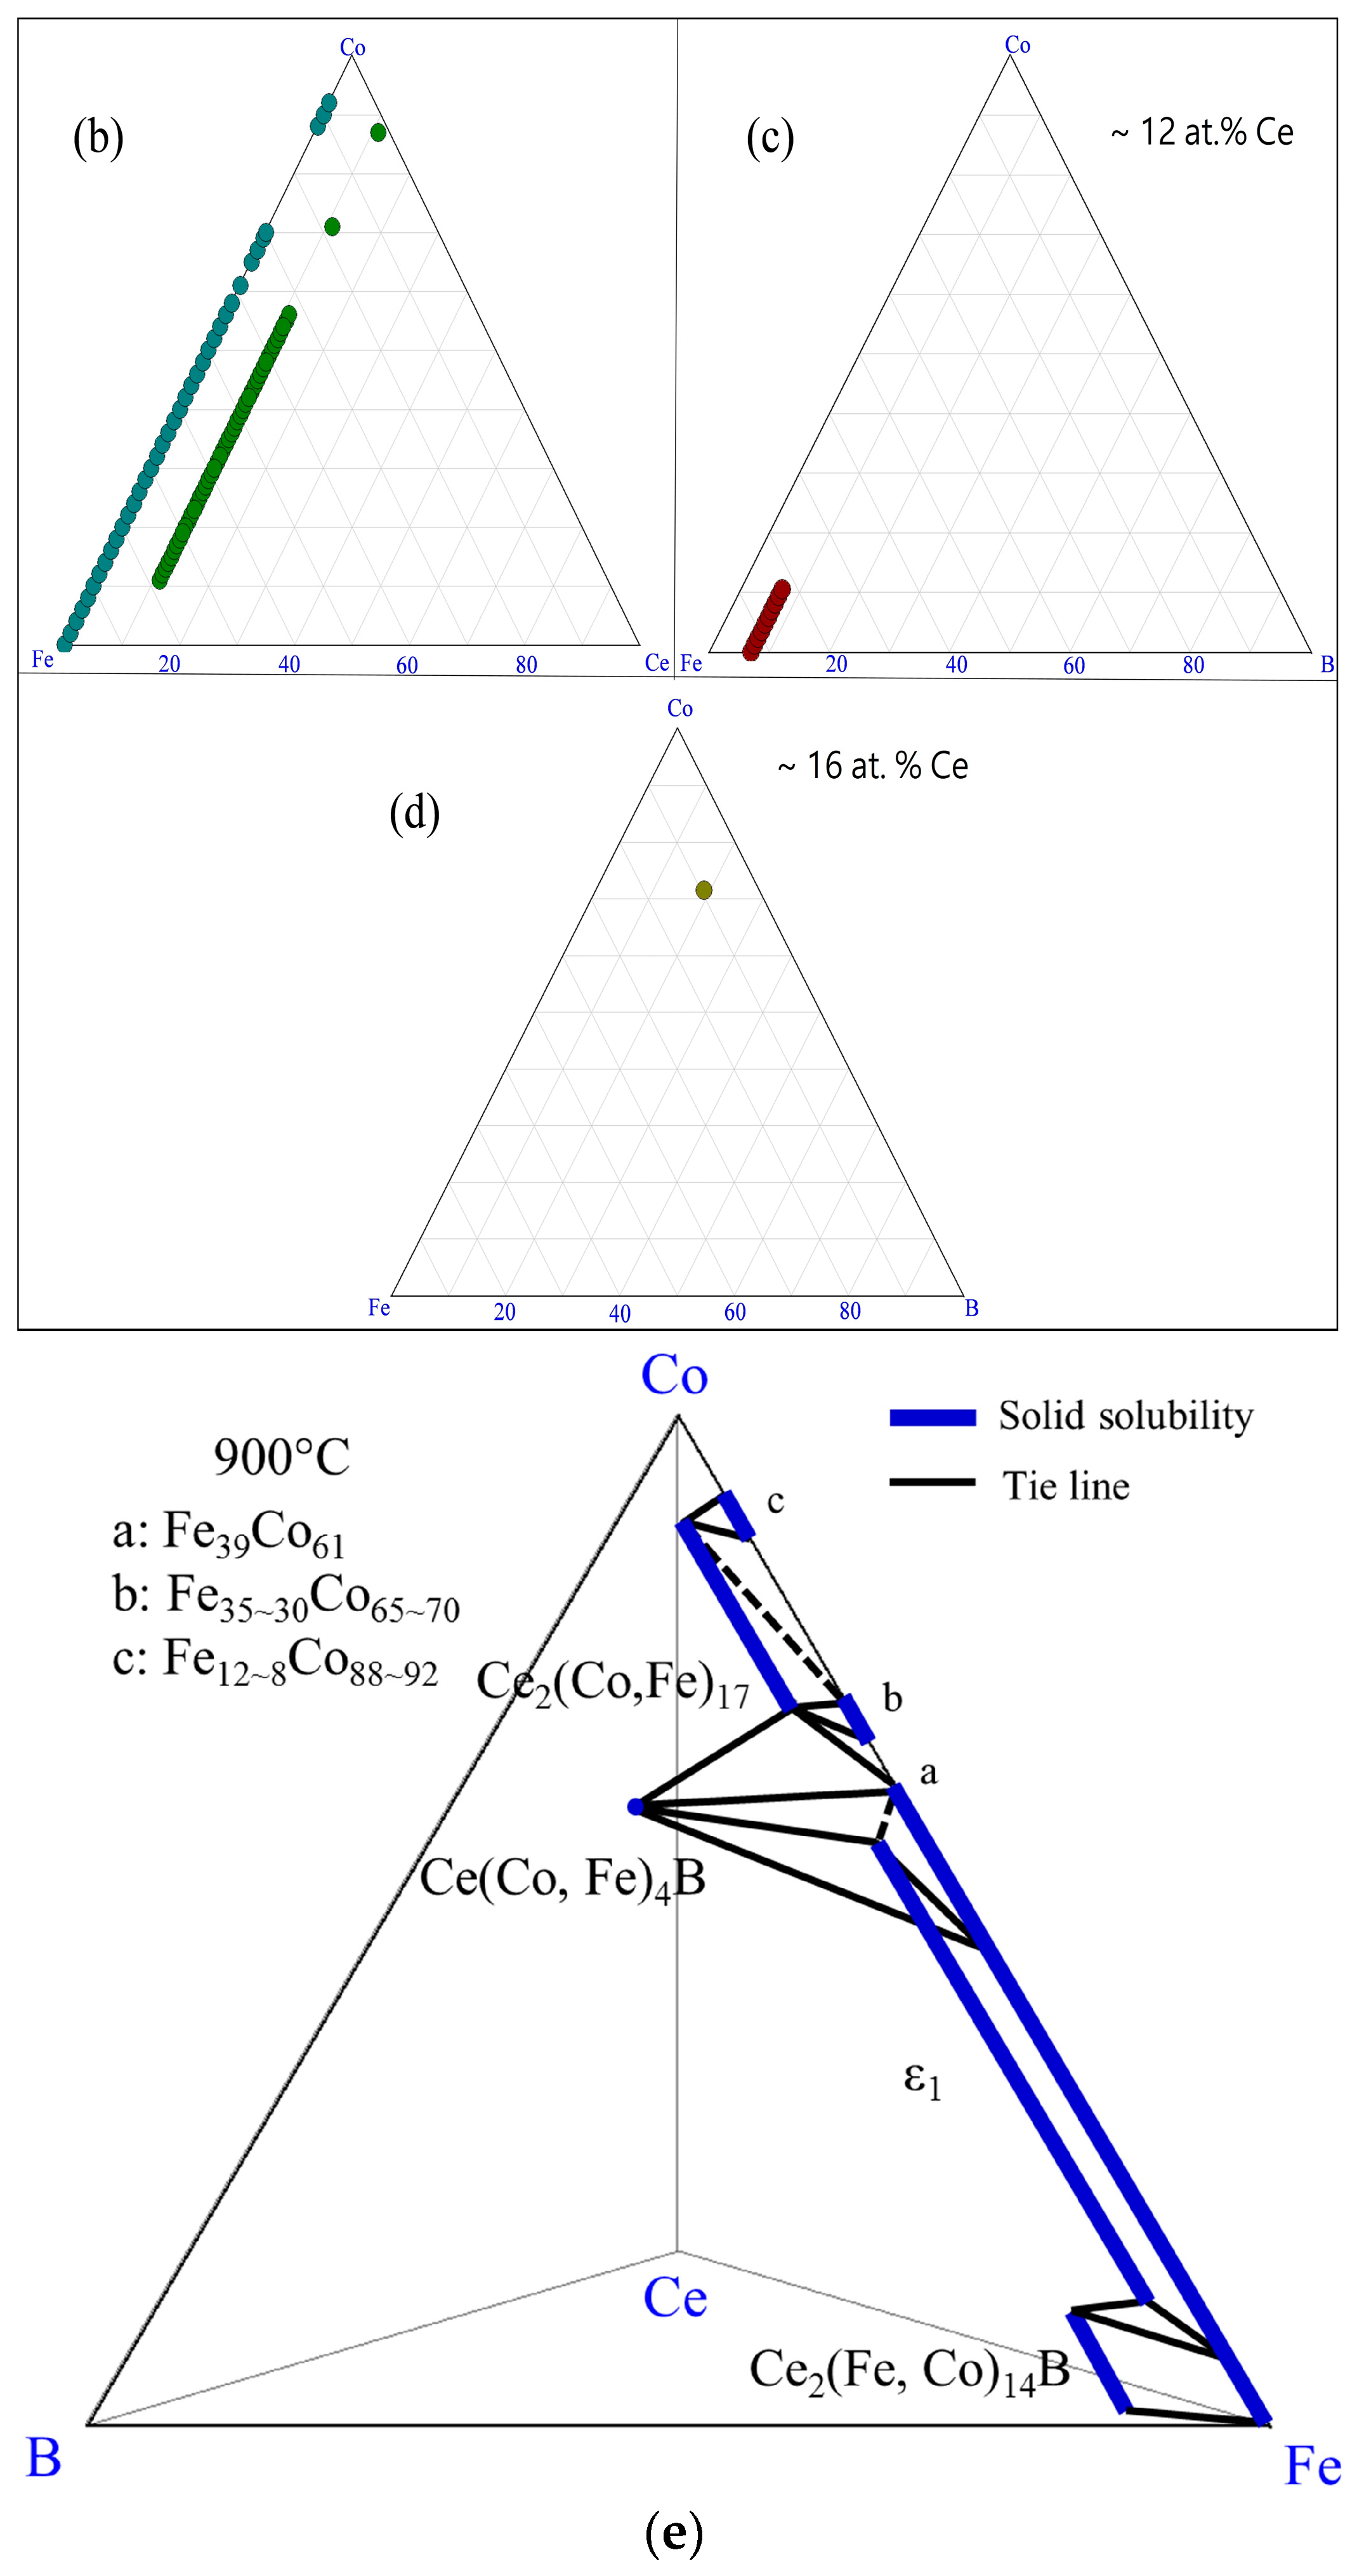
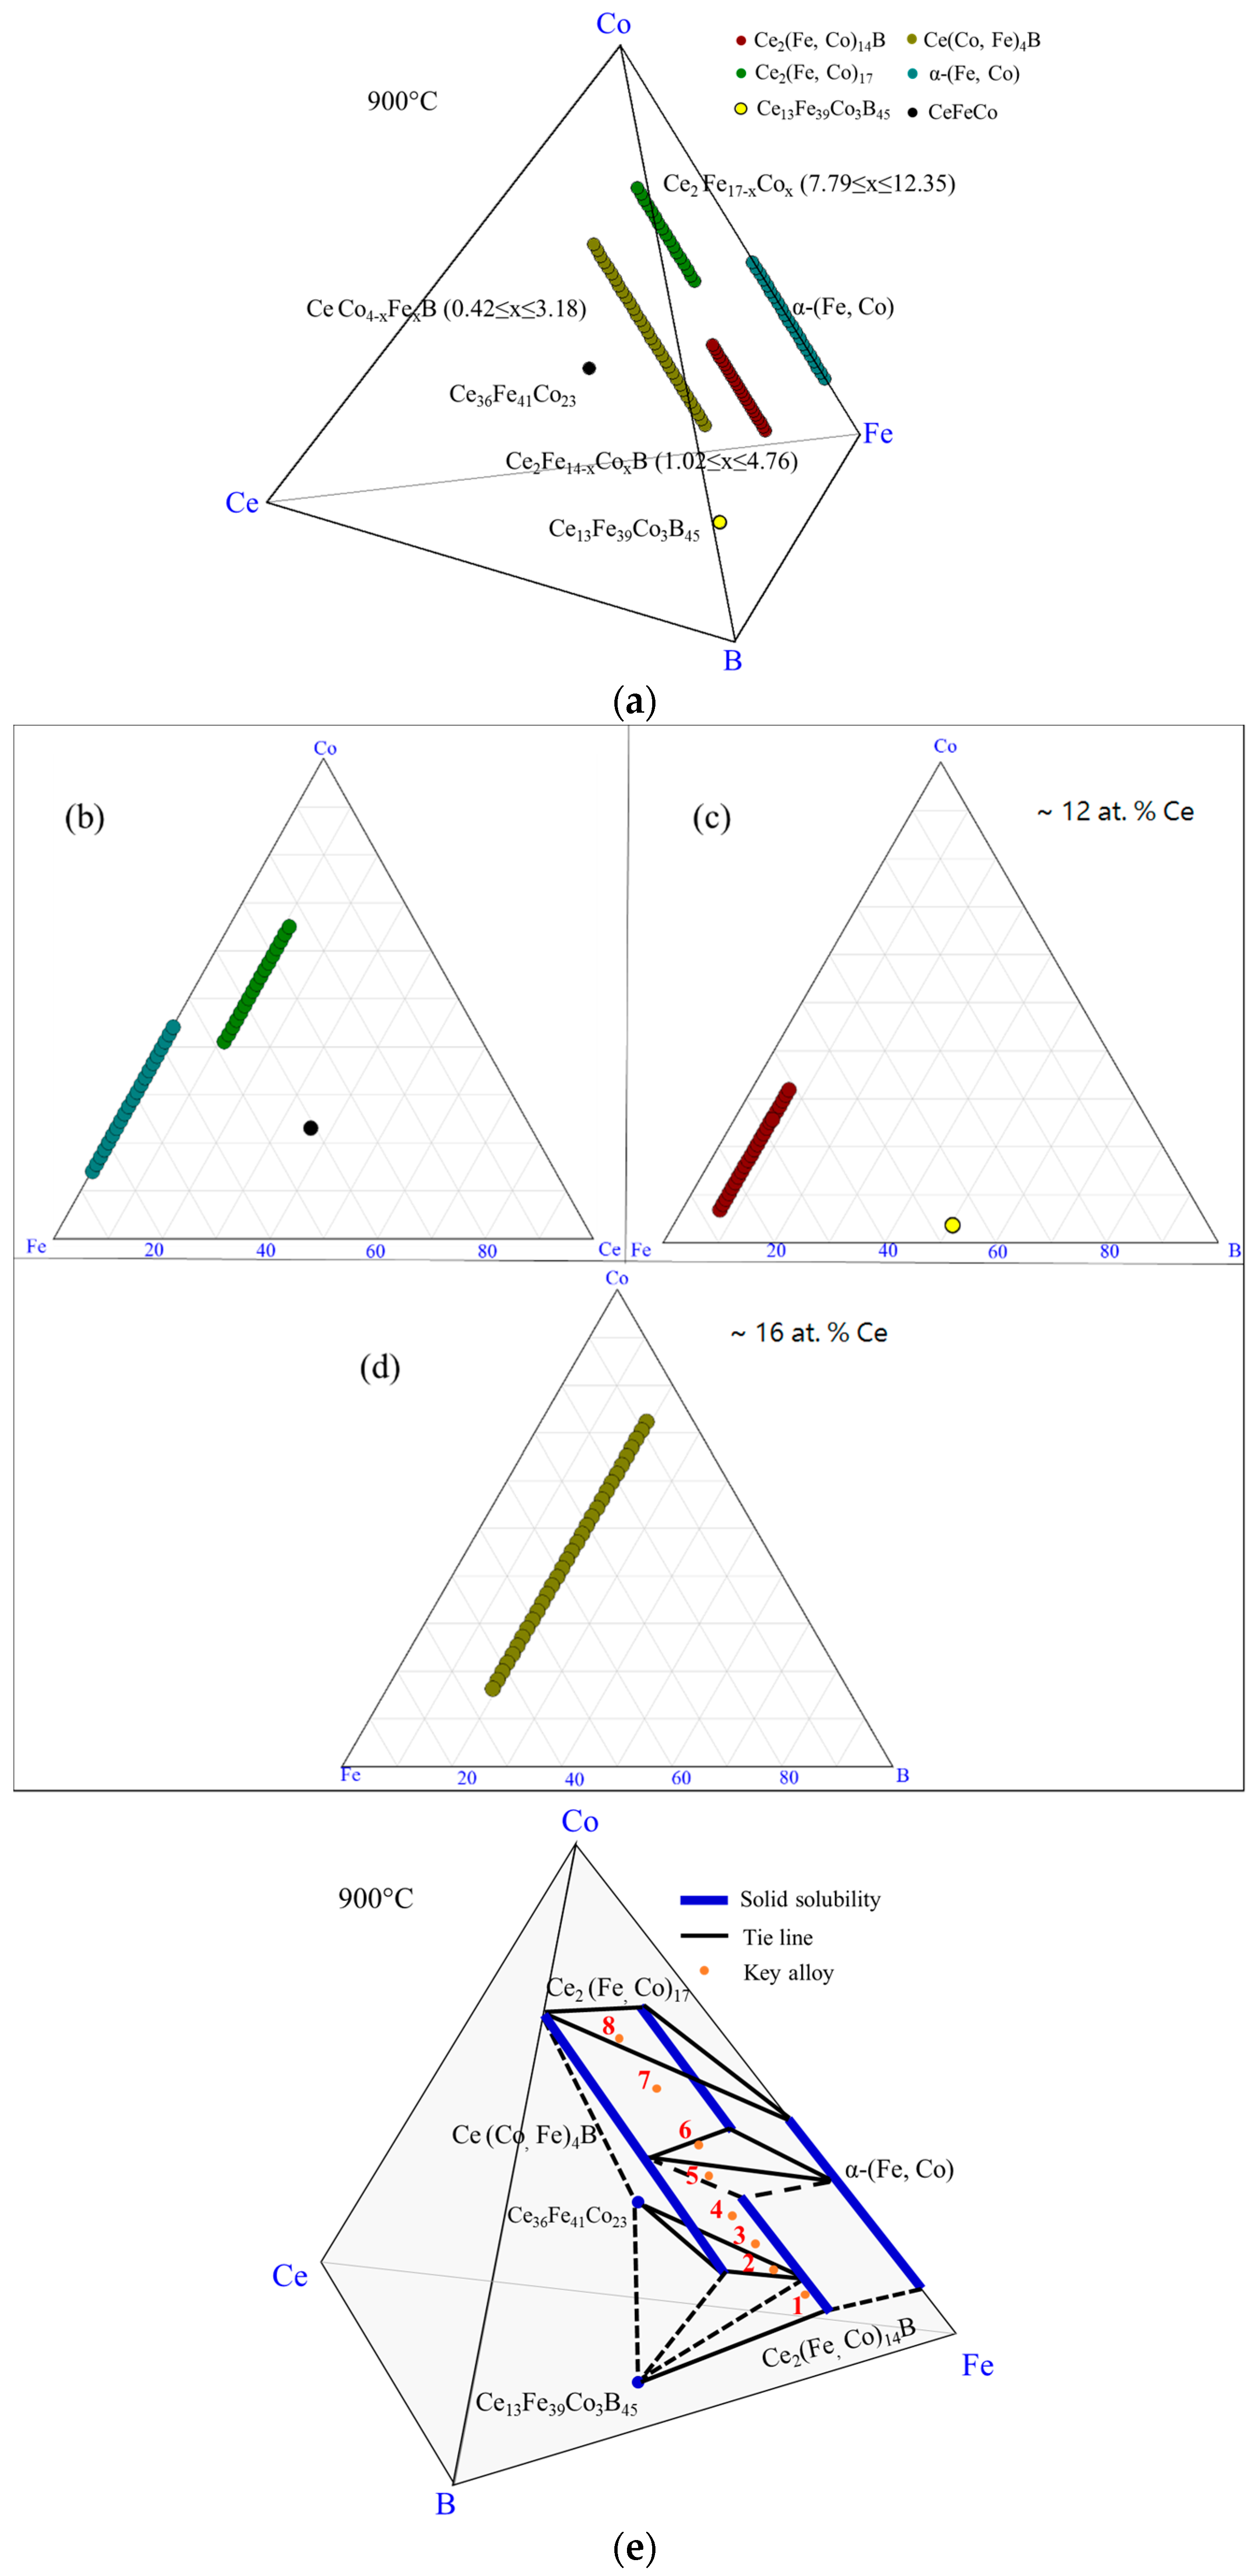
The experimental results of DC1 are summarized in the 3D view, as shown in Figure 6a. The phases which were detected in this diffusion couple are denoted by different colors. The ε1 and α-(Fe, Co) are illustrated on the Fe-Co-Ce ternary system in Figure 6b. Two pseudo ternary sections at 12 at. % and 16 at. % Ce are plotted in Figure 6c,d to enable better understanding of the phase relations in DC1. The phase relations obtained from DC1 are summarized in Figure 6e. Three three-phase regions, Ce2(Fe, Co)14B/α-(Fe, Co)/ε1, α-(Fe, Co)/ε1/Ce(Co, Fe)4B, and Ce(Co, Fe)4B/α-(Fe, Co)/CeFe2Co7, are established at the interfaces from layers 1–4 of DC1.
Ce13Fe80B7 and Co90Ce10 were selected as the end-members of DC2. By doing so, the diffusion path may cross several phase regions, and Fe/Co atomic exchange in Ce2(Fe, Co)14B can be further understood. The Ce2(Fe, Co)14B phase was confirmed in DC2 and solid solubility was measured as 22 at. % Co which was greater than DC1. Two layers of Ce(Co, Fe)4B were observed in DC2, with solid solubility of 17–27 at. % Fe and 1–6 at. % Fe. From SEM/WDS analysis, as listed in Table 1, a single α-(Fe, Co) layer (layer 3) formed in between of two Ce(Co, Fe)4B layers (layers 2 and 4) which could hinder the Co/Fe atomic exchange in Ce(Co, Fe)4B. This is why two layers of this solid solution were obtained instead of a continuous Ce(Co, Fe)4B layer. Ce2(Co, Fe)17 and γ-(Fe, Co) two-phase equilibrium was observed and confirmed in layer 5 of DC2, as presented in Table 1. By analyzing DC3, Ce3(Co, Fe)11B4 and Ce(Co, Fe)12B6 were found to form in this quaternary system at 900 °C and their solid solubilities were measured as 5–21 at. % Fe and 11 at. % Fe, respectively, as can be seen in Table 1. Later, these two phases were all confirmed by DC4.
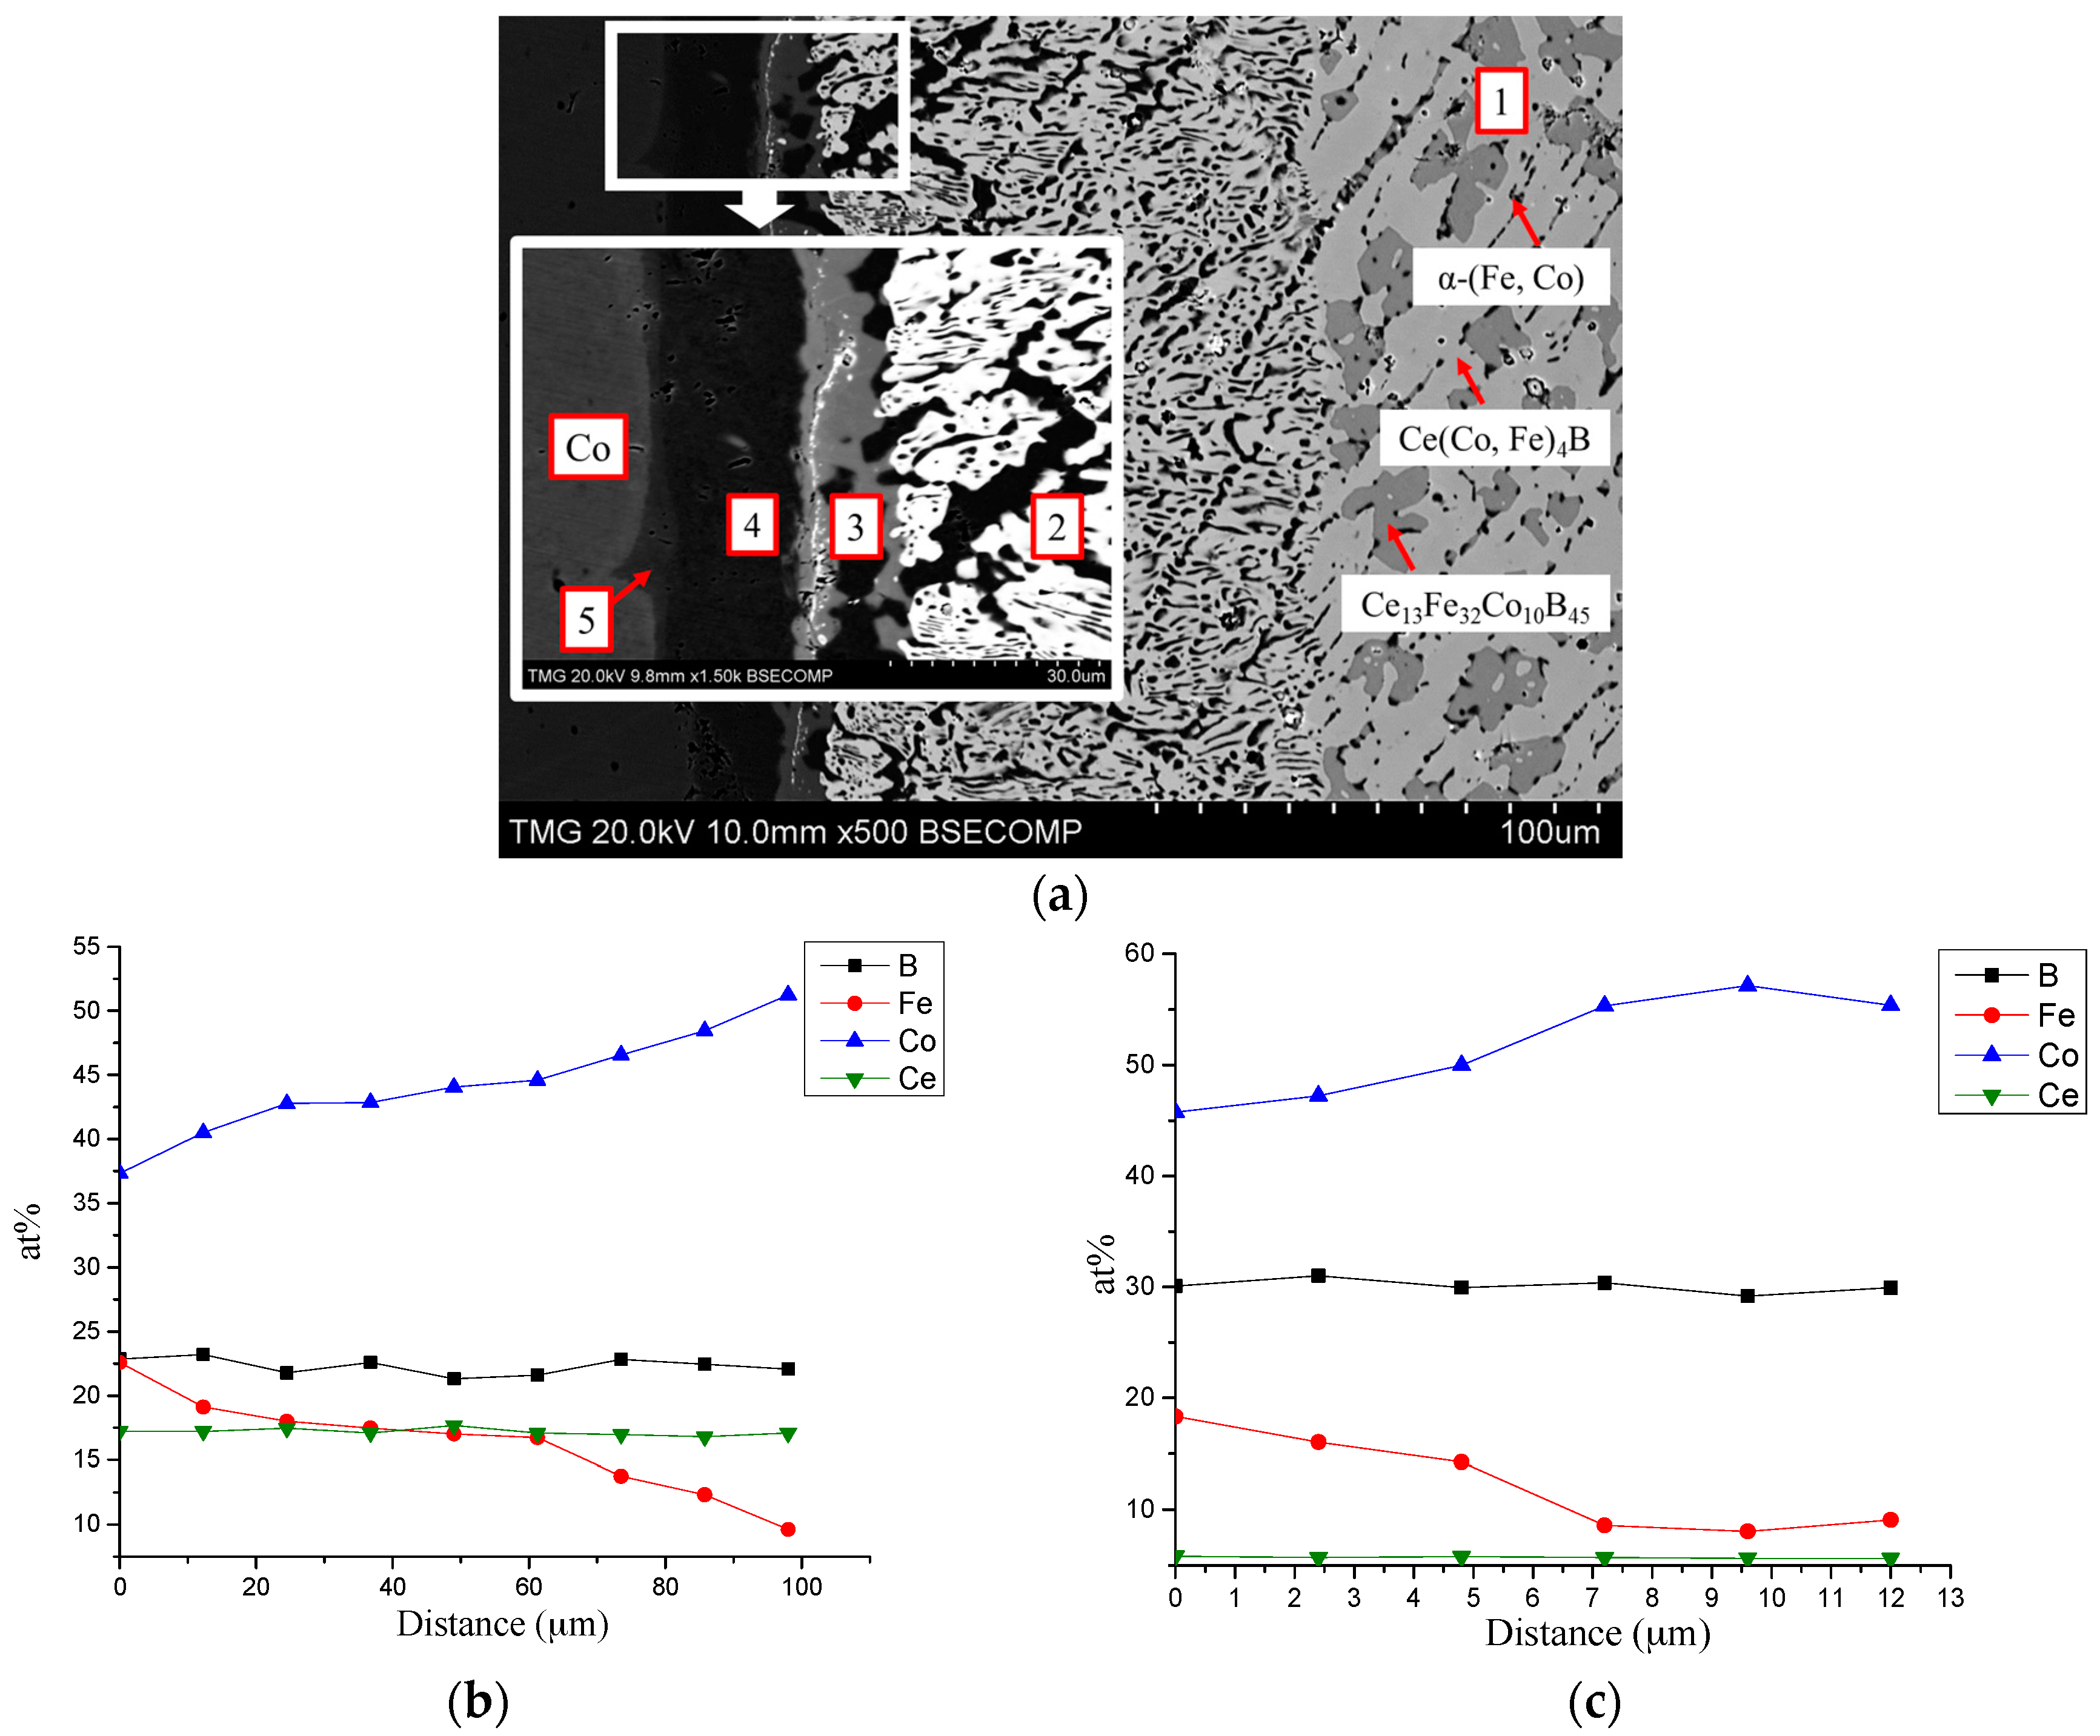
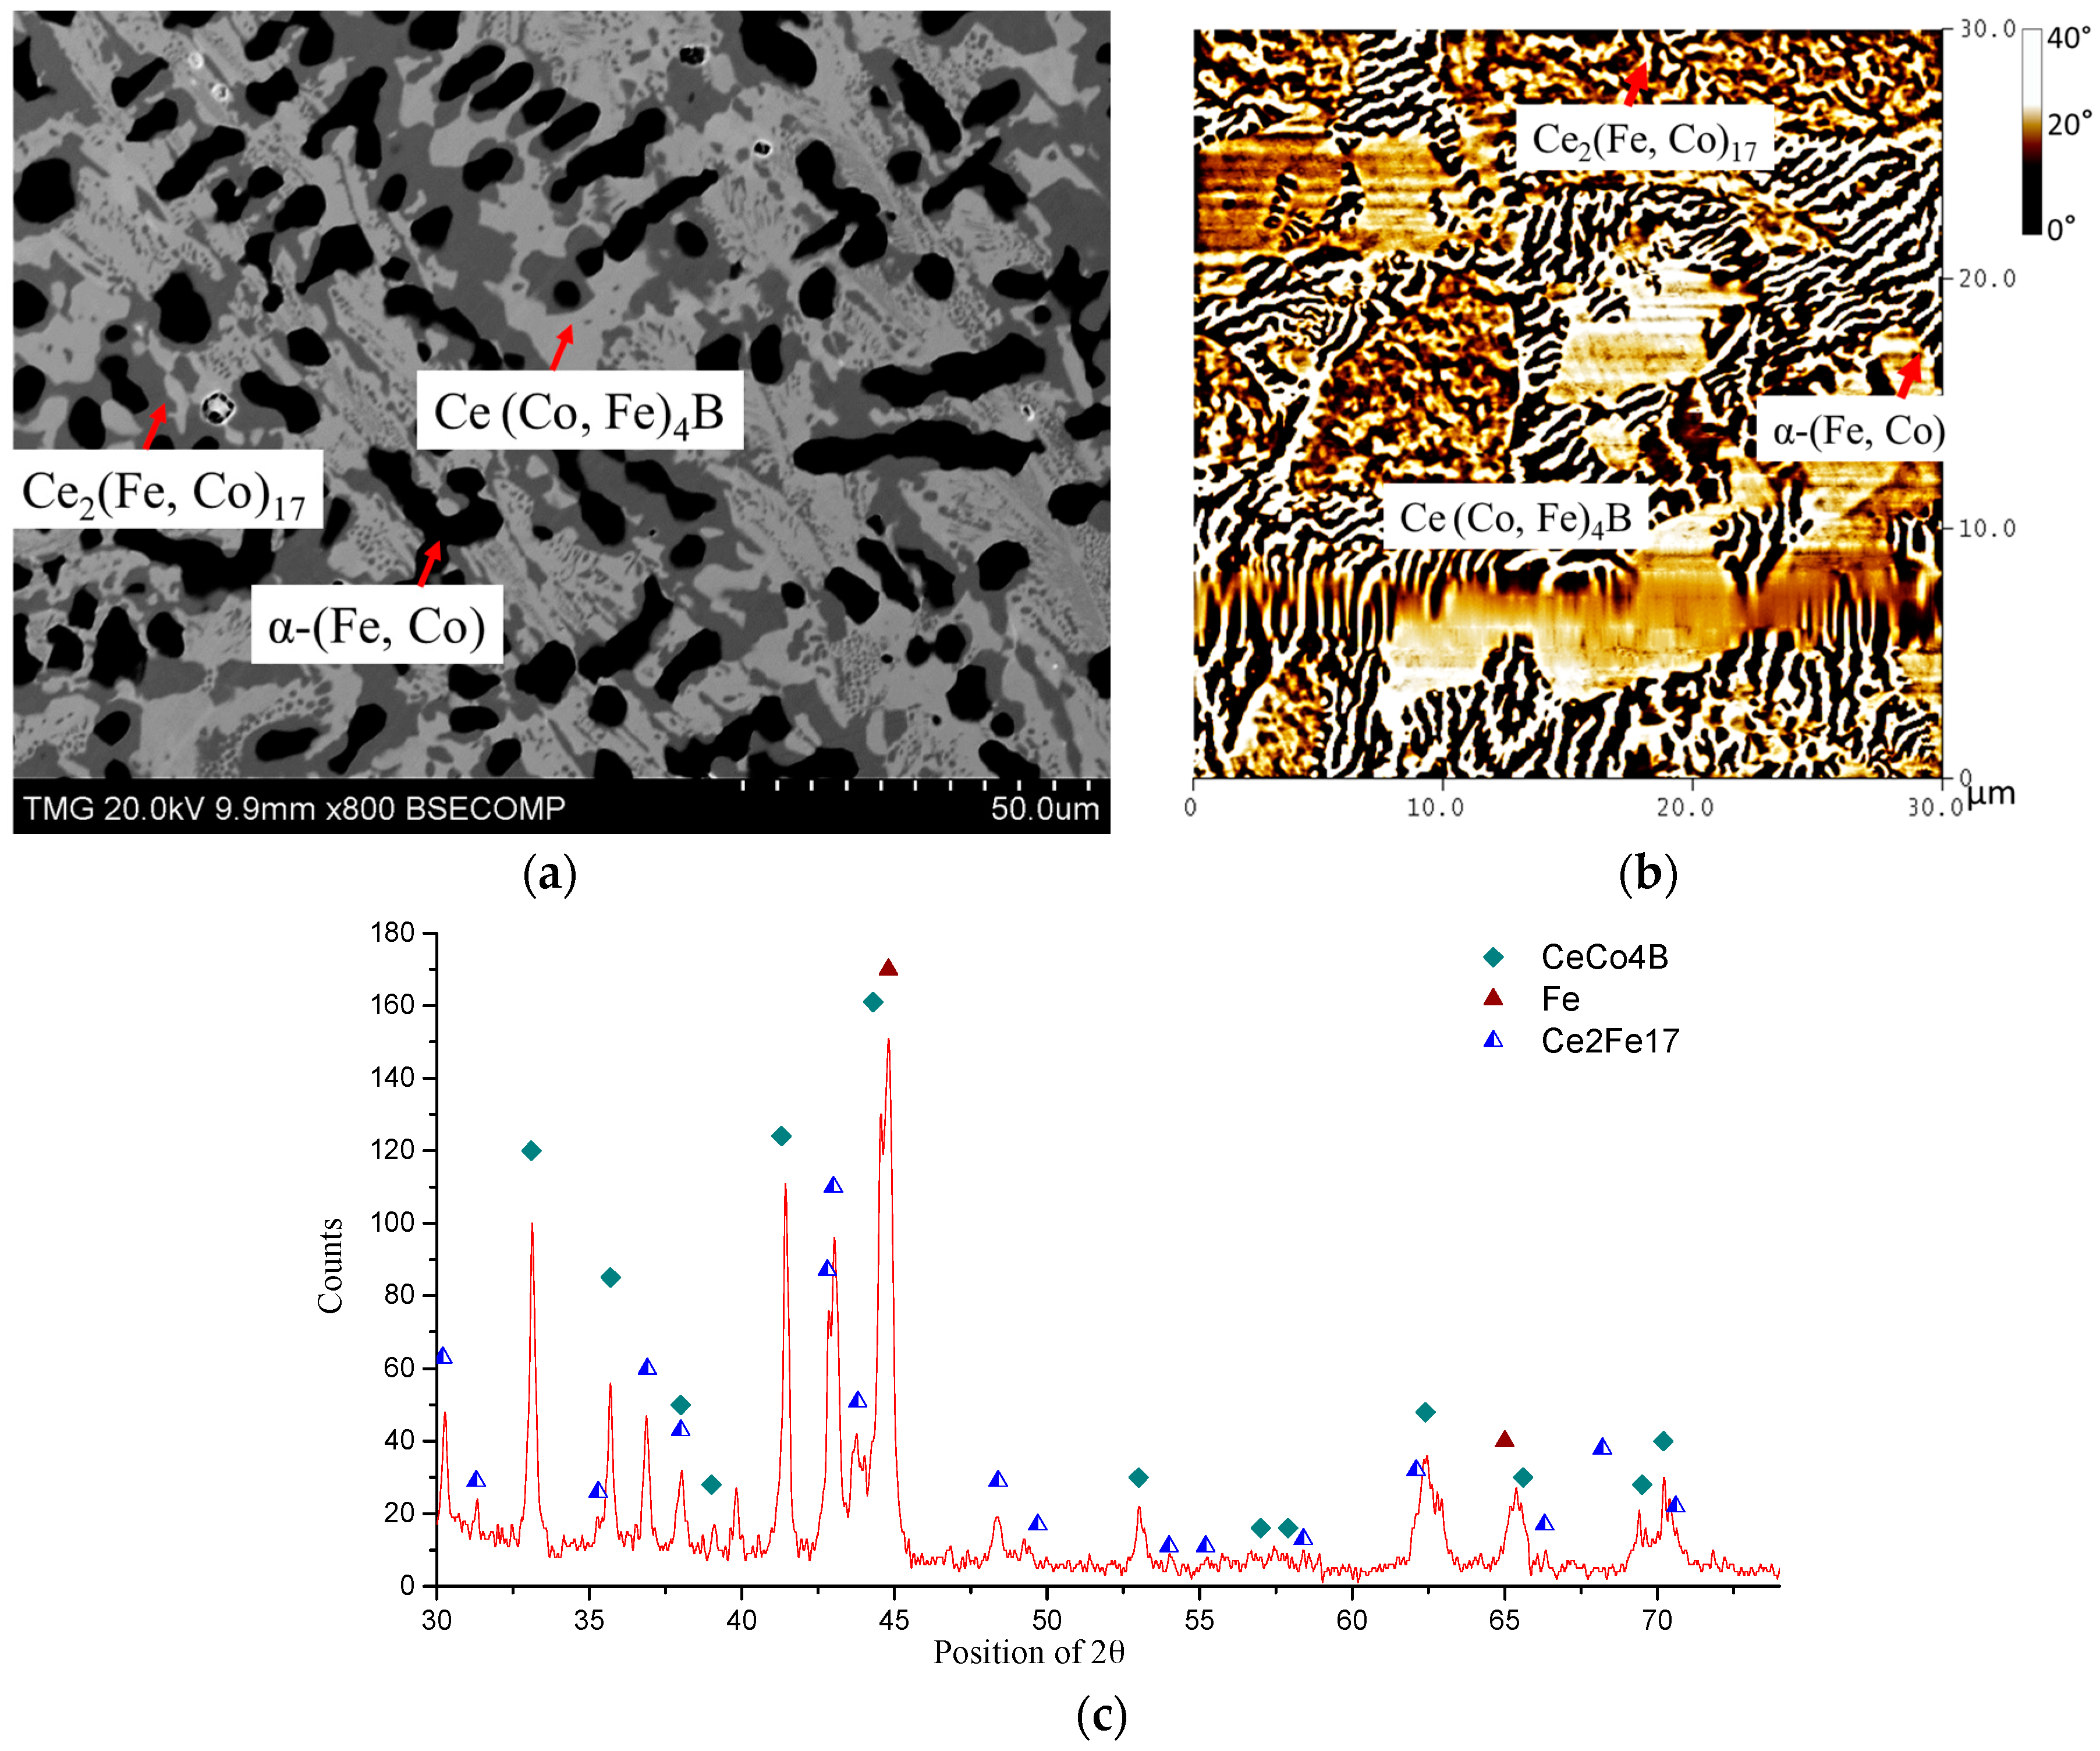
DC4 was designed by combining relatively high Co content Ce15Fe43Co19B23 alloy with a pure Co piece. It is impossible to control the diffusion path of diffusion couples. Therefore, it is very essential to select the proper end-members of diffusion couples in order to cross a large number of phase regions, so that more phase equilibria results could be revealed. The BSE image of DC4 is presented in Figure 7a, the Ce15Fe43Co19B23 end-member was found to be in the Ce13Fe32Co10B45/Ce(Co, Fe)4B/α-(Fe, Co) three-phase region. The homogeneity range of Ce(Co, Fe)4B was determined as 40–45 at. % Fe. A new boron-rich compound, Ce13Fe32Co10B45, was found and more studies have been performed by key alloys to further analyze this compound which will be discussed in the next section. As shown in the enlarged inset of Figure 7a, four diffusion layers are present. From WDS analysis, the composition of the white phase in layer 2 was measured as Ce17Fe23–9Co37–51B23, as presented in the WDS compositional profile in Figure 7b. Similar to DC3, this phase was identified as Ce3(Co, Fe)11B4, which was also confirmed by key alloys. Layer 3 mainly contained a Ce(Co, Fe)12B6 phase which had Ce6Fe18–9Co46–55B30 composition. The results of WDS compositional analysis of layer 3 are plotted in Figure 7c. From DC3 and DC4, a Ce(Co, Fe)12B6 phase is confirmed. Key alloys are used to measure its maximum solubility at 900 °C. A thick layer number 4, which contained α-(Fe, Co) with Fe31Co69 composition, formed in this diffusion couple.
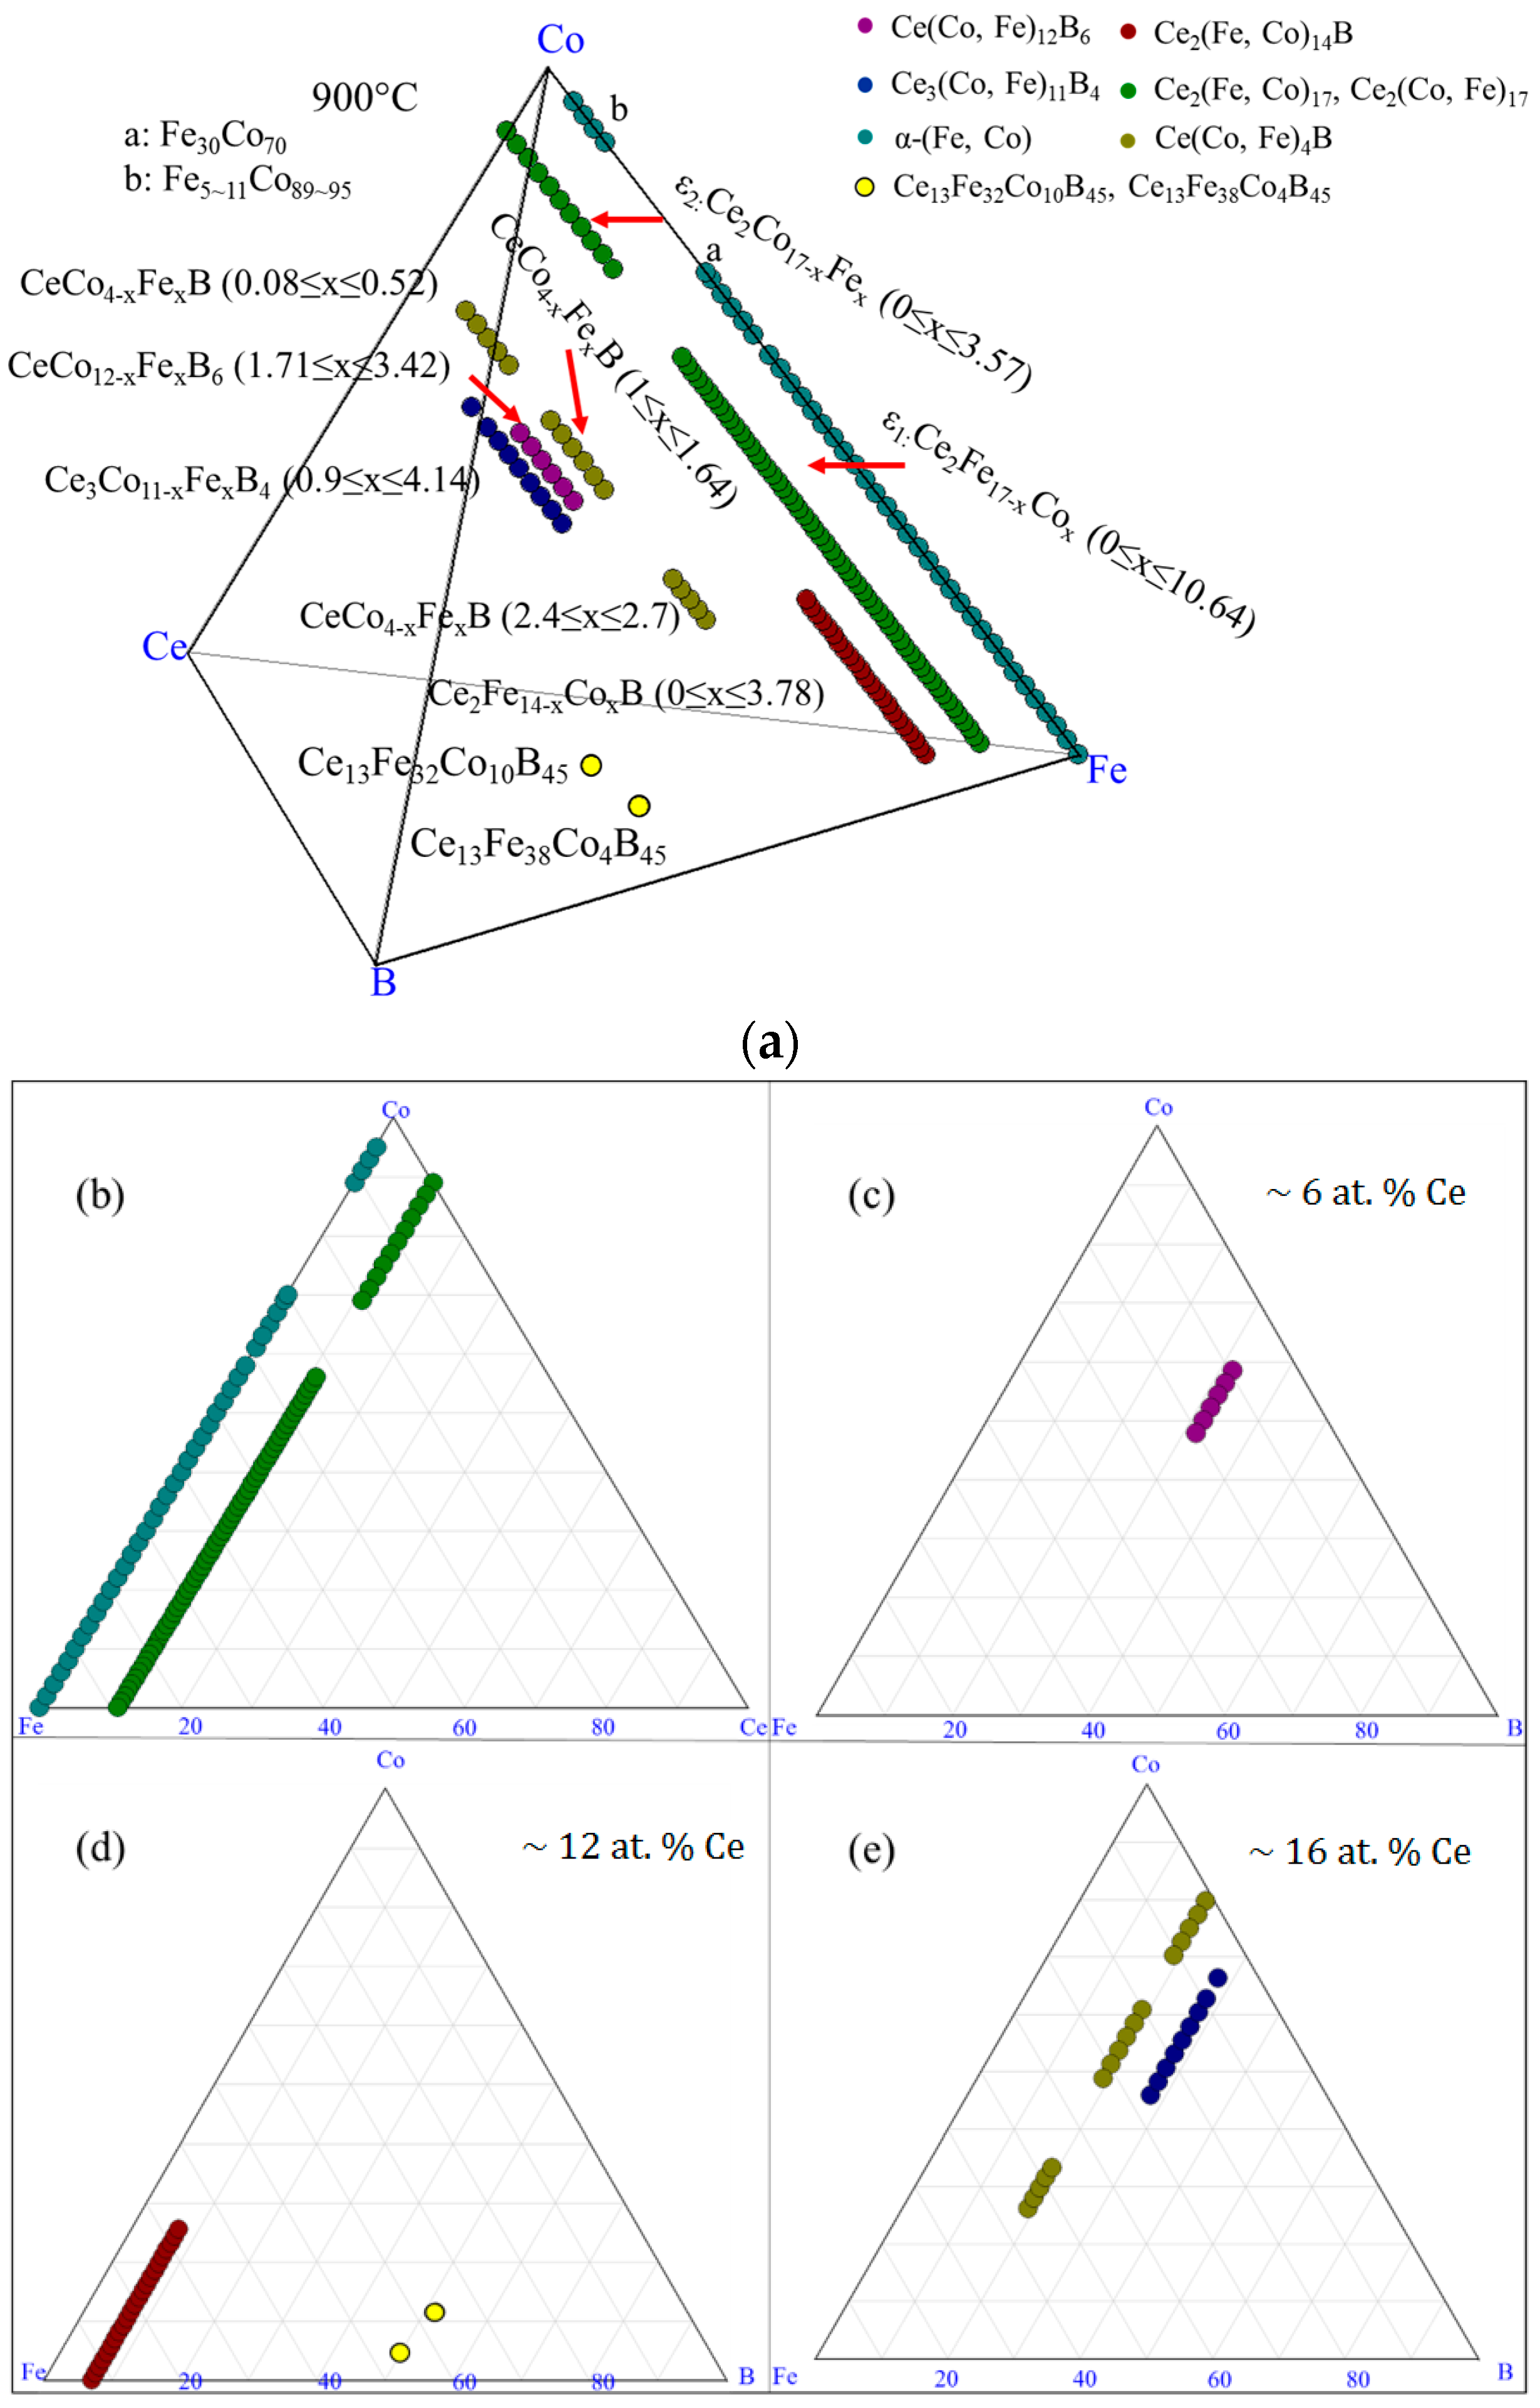
The experimental results of DC4 are summarized in the 3D view shown in Figure 8a. Different phases are demonstrated by different colors. The α-(Fe, Co) phase is projected on a Fe-Co-Ce ternary system in Figure 8b. The phases detected from this diffusion couple are illustrated by three pseudo ternary sections at 6 at. %, 12 at. %, and 16 at. % Ce, which are shown in Figure 8c–e. The phase relations in DC4 are plotted in Figure 8f. Solid lines represent the phase regions established from DC4 and dotted lines indicate possible phase equilibria among detected phases.
By combining the results of all the diffusion couples, the detected phases in the Ce-Fe-Co-B system at 900 °C are plotted in Figure 9a. The phases present in the Fe-Co-Ce system are presented in Figure 9b. Three pseudo ternary sections at around 6 at. %, 12 at. %, and 16 at. % Ce are also shown in Figure 9c–e, respectively. So far, Ce2(Fe, Co)14B was found to have solid solubility of 22 at. % Co and presented as Ce2Fe14−xCoxB (0 ≤ x ≤ 3.78). Solid solubility of Ce(Co, Fe)4B was measured from the diffusion couples. Further analysis will be performed using key alloys to measure its solubility limit and will be discussed below. Ce(Co, Fe)12B6 and Ce3(Co, Fe)11B4 were found to form in the Ce-Fe-Co-B system at 900 °C. They are denoted as CeCo12−xFexB6 (1.7 ≤ x ≤ 3.42) and Ce3Co11−xFexB4 (0.9 ≤ x ≤ 4.14), respectively. Two solid solutions, namely, ε1 and ε2, with the same crystal structure, were found to form between Ce2Co17 and Ce2Fe17 in the Ce-Fe-Co ternary system at 900 °C, as shown in Figure 9a,b. Fujii et al. [28] studied the Ce-Fe-Co system and reported the Ce2Co13Fe4 compound. Although this compound is not observed in the current work, its composition is very close to the solubility limit of ε2 that has the Ce2Co13.4Fe3.6 formula. Therefore, it could be that the compound reported in the work of Fujii et al. [28] refers to the solubility limit of ε2.
4.2. MFM Study on Diffusion Couples
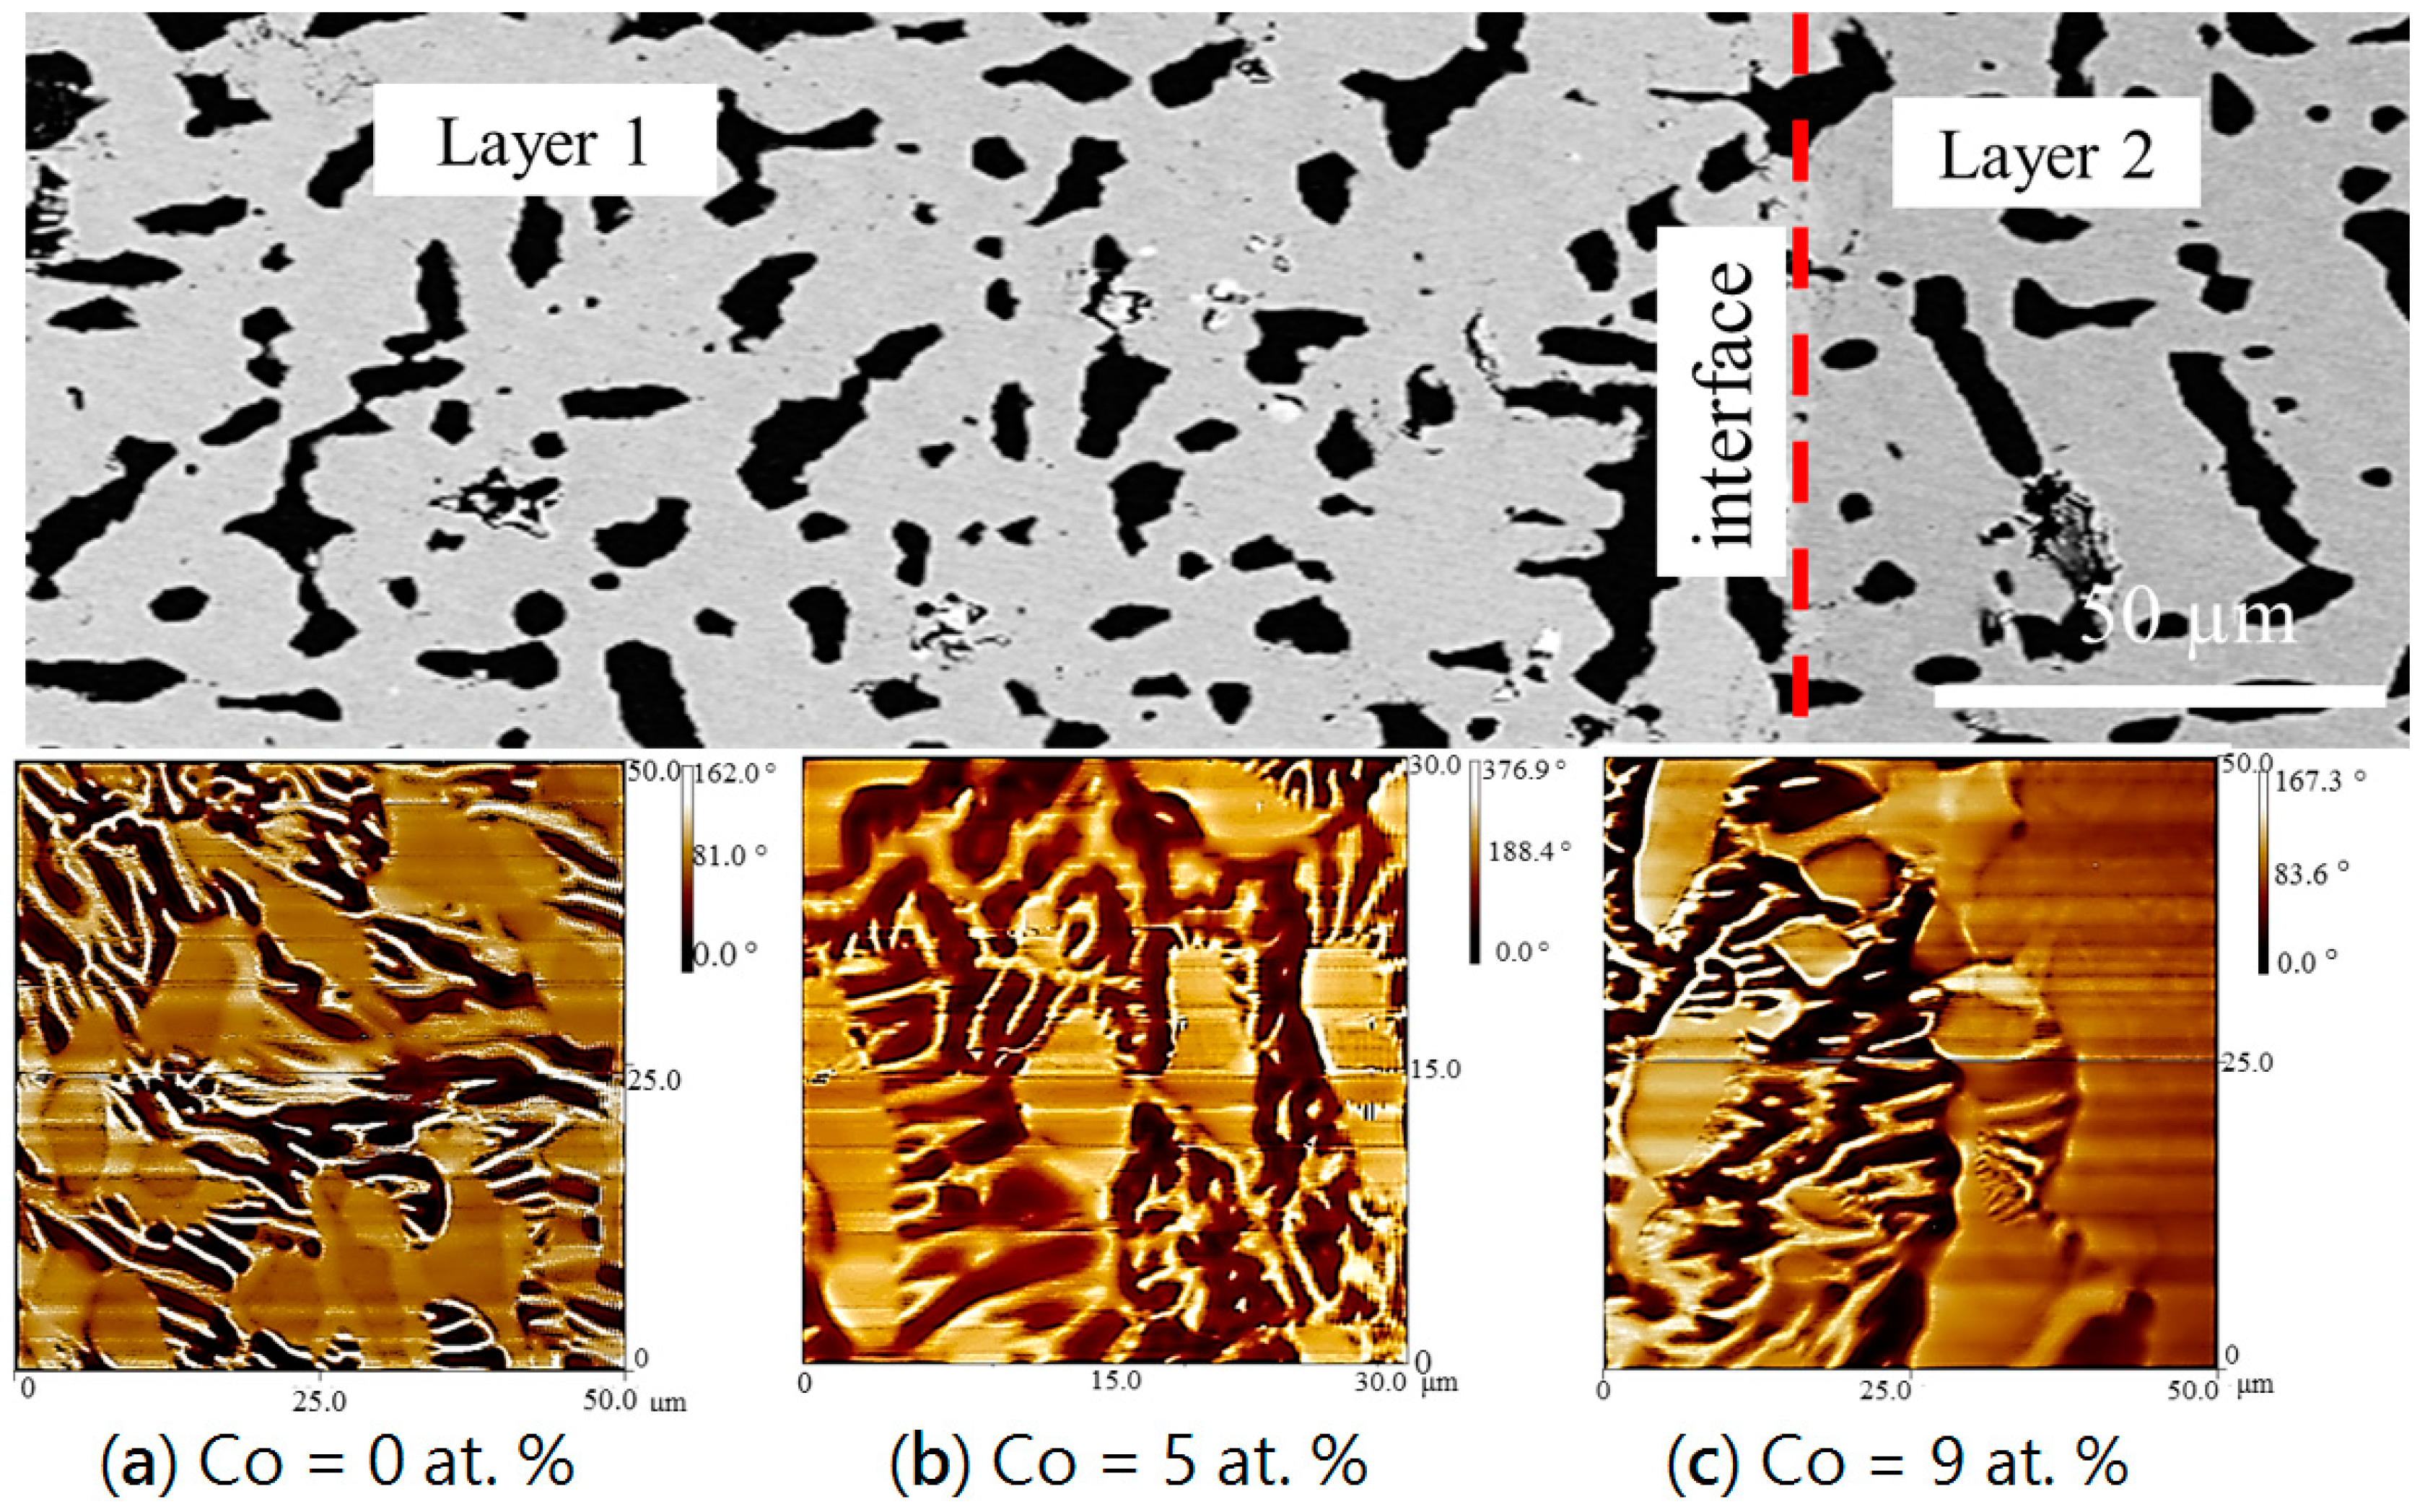
The strength of the near-surface stray fields is sensitive to the crystal orientation [29]. Since the investigated samples are non-oriented, various types of domain patterns are present. Diffusion layers of diffusion couple 1 were investigated using MFM. A stripe domain pattern of Ce2Fe14−xCoxB (0 ≤ x ≤ 1.54) in layer 1 was obtained and shown in Figure 10. Three tests were performed starting from the edge of layer 1 to the interface between layers 1 and 2. As presented in Figure 10, three MFM images positively indicate that Ce2Fe14−xCoxB (0 ≤ x ≤ 1.54) is magnetic along its homogeneity range. Figure 10c shows the MFM image taken at the interface of layers 1 and 2. The magnetic domain pattern of Ce12Fe73Co9B6 (Ce2Fe14−xCoxB (x = 1.54)) is shown on the left side of Figure 10c; strong magnetic contrast is detected. Comparatively, magnetic interaction of ε1 was weak and no strong magnetic contrast can be seen on the right side of Figure 10c.
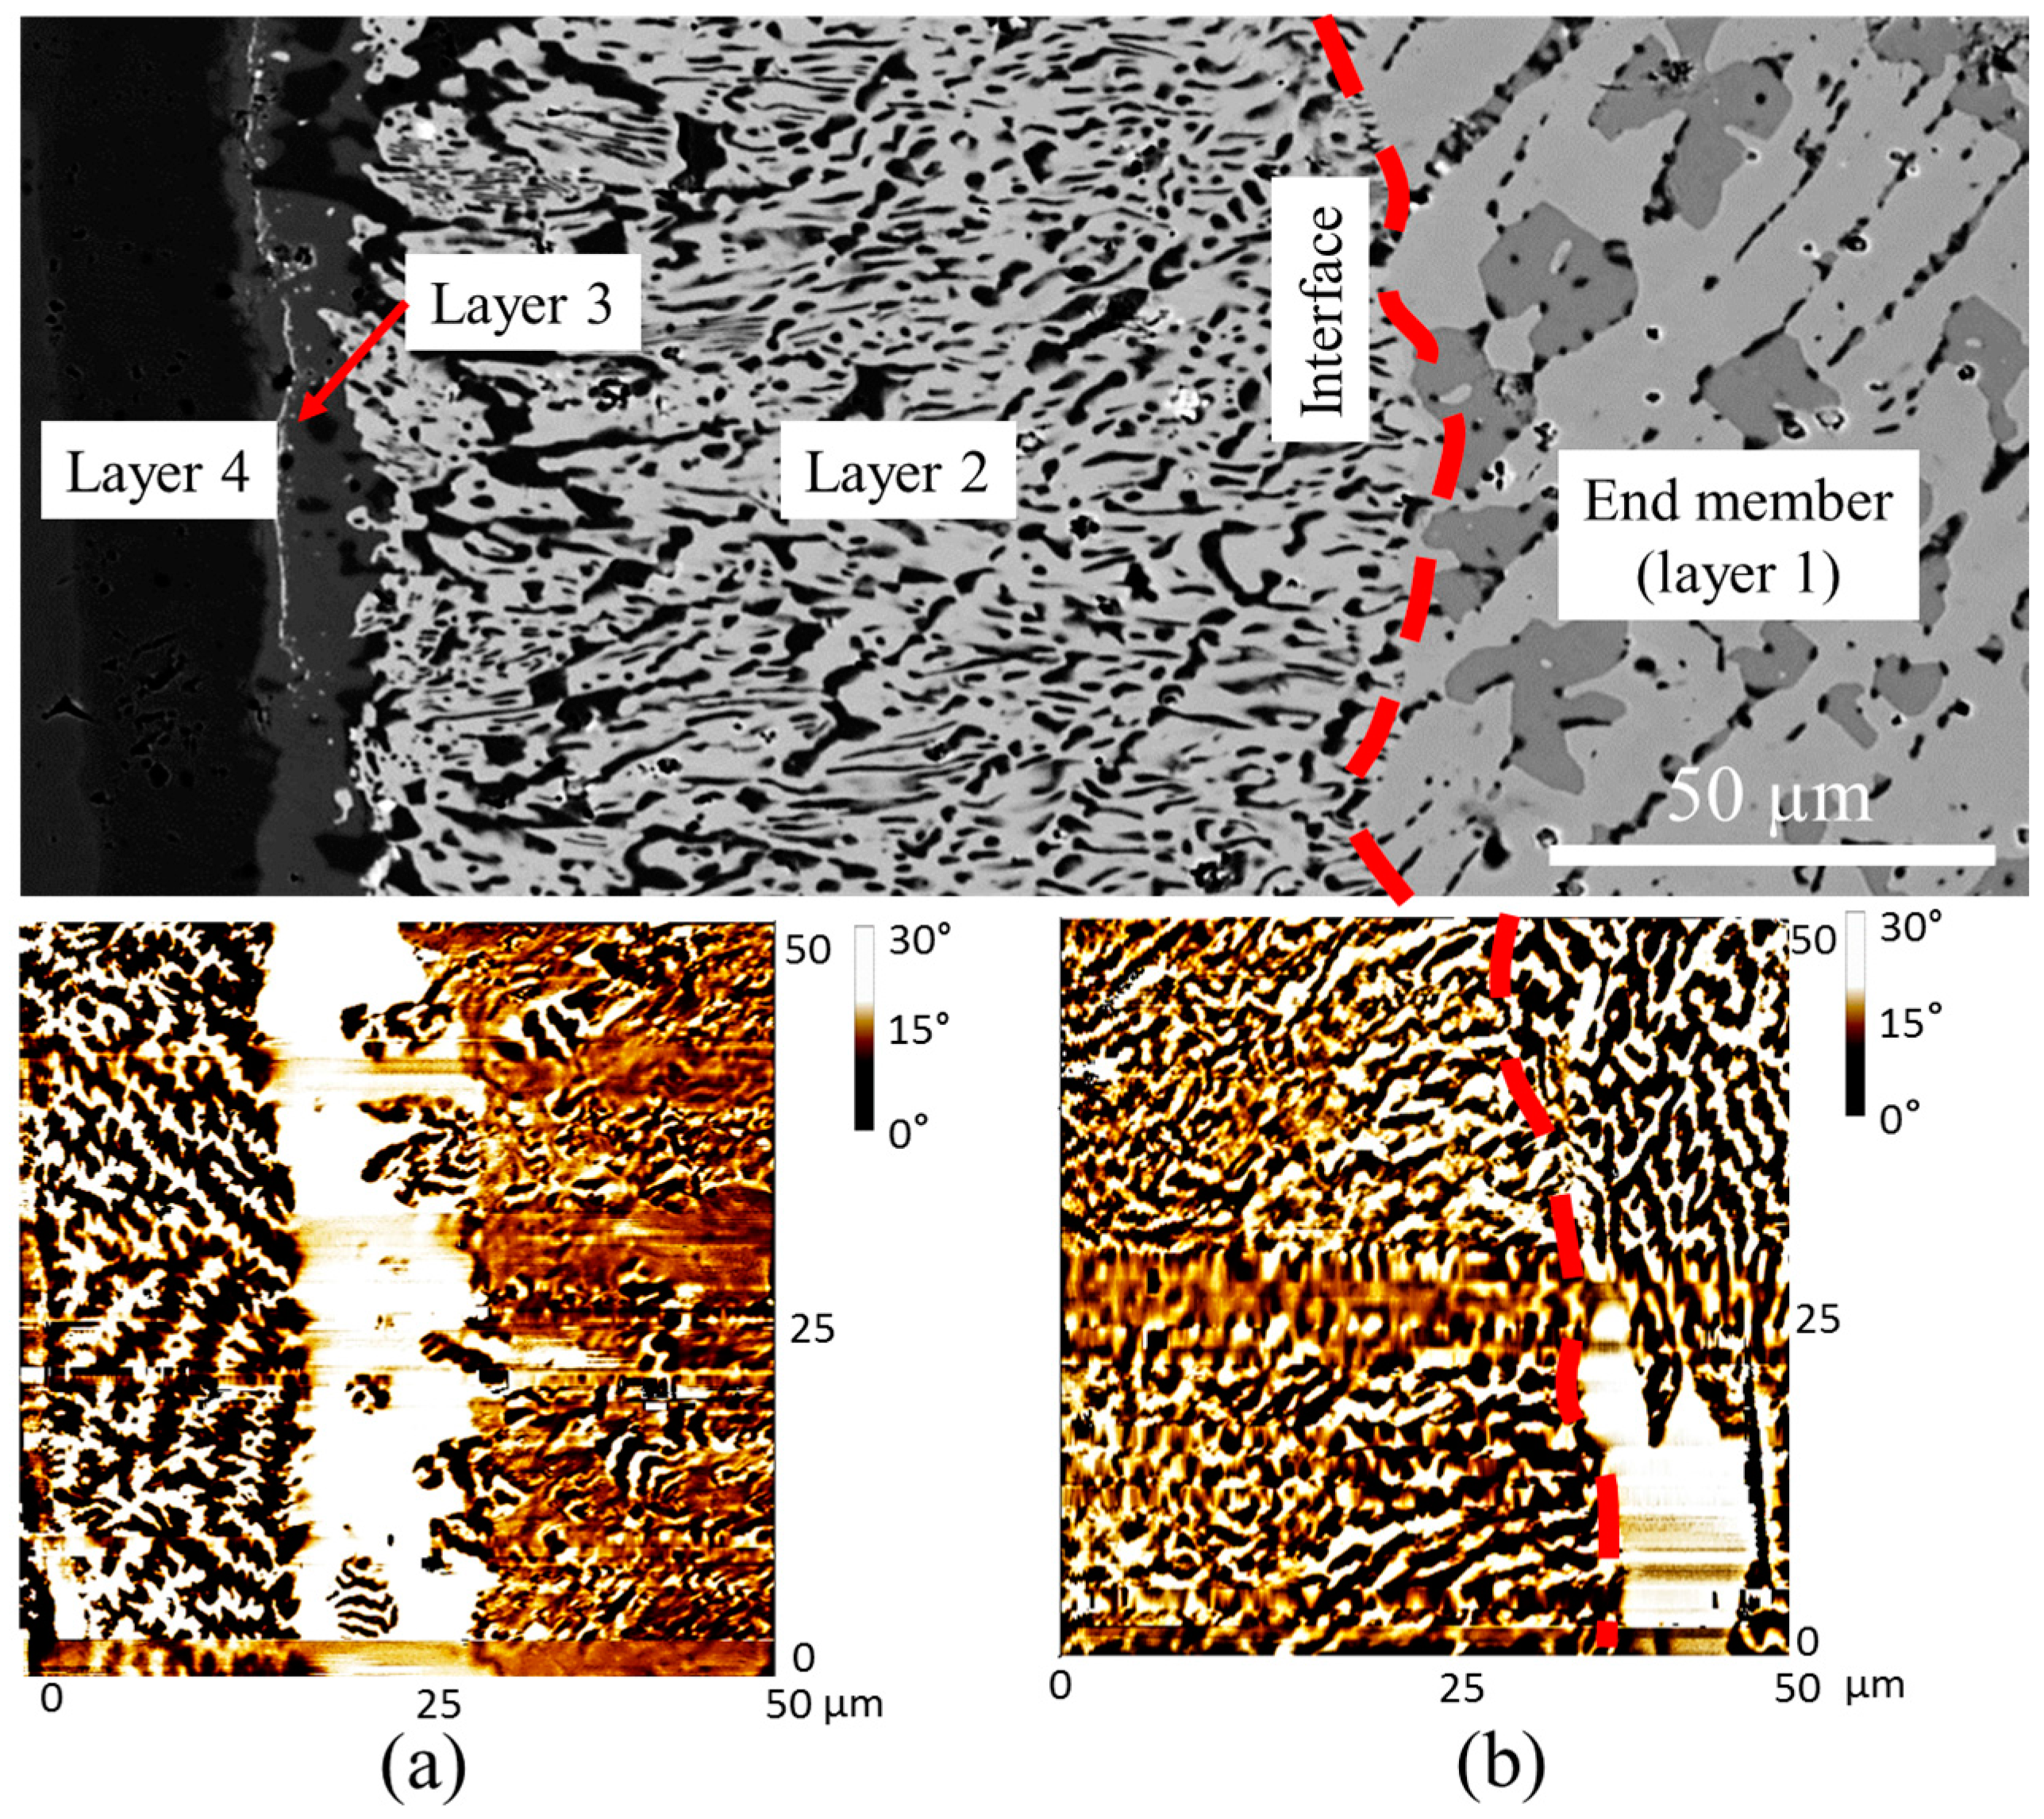
An MFM study was also performed on DC4. Two tests were selected to examine the regions of layers 1 and 2, and layers 2–4 as shown in Figure 11. From the MFM results illustrated in Figure 11a, magnetic contrasts of layers 2–4 were captured. On the left side, α-(Fe, Co) with the Fe31Co69 composition is found to be magnetic and the stripe domain pattern is clearly observed. Also, Ce(Co, Fe)12B6 in layer 3 is non-magnetic, because no magnetic contrast can be seen in the MFM analysis. Figure 11b is the MFM image at the interface between the end-member (Ce15Fe43Co19B23) and layer 2; stronger magnetic contrast was observed at the end-member side (Ce(Co, Fe)4B), which has a mixture of stripe and closure magnetic domain patterns. Comparatively, a similar domain pattern is observed in layer 2 (Ce3(Co, Fe)11B4), but the magnetic interaction is weaker. The boron-rich phase, Ce13Fe32Co10B45, in the end-member is non-magnetic. Complete analysis of the effect of Co solubility on the intrinsic magnetic properties of the observed phases will soon be reported elsewhere.
4.3. Key Alloys Study
4.3.1. Homogeneity ranges of Ce2(Fe, Co)14B and Ce(Co, Fe)4B
From diffusion couple studies, Ce2(Fe, Co)14B and Ce(Co, Fe)4B exhibited extended homogeneity ranges in the Ce-Fe-Co-B system at 900 °C. Eight key alloys were prepared along the homogeneity range of Ce2(Fe, Co)14B by substituting a different amount of Fe with Co, as listed in Table 2. The actual global compositions of the samples were determined by EDS area mapping. Three maps were taken for each sample. Also, the differences in the three scans were less than 2 at. % for all the elements. All key alloys were annealed at 900 °C for 25 days. Phase equilibria obtained from the key alloys are also presented in Table 2.
Two phases formed in KA 1 (Ce14Fe73Co7B6) after annealing at 900 °C for 25 days, as shown in Figure 12a. The solid solubility of the dominating Ce2(Fe, Co)14B was measured as 6 at. % Co. A boron-rich compound (Ce13Fe39Co3B45) with similar chemical composition, which is found in the diffusion-couple study, is also observed in this key alloy. From the MFM test, as presented in Figure 12b, dominating stripe magnetic domain patterns with some dispersed non-magnetic plates were observed. Comparing the phase morphology between SEM and MFM images, it is concluded that the dominating Ce2(Fe, Co)14B phase is magnetic, and non-magnetic regions belong to Ce13Fe39Co3B45. In Figure 12c, Ce2(Fe, Co)14B is positively identified in the XRD pattern of KA 1. However, the crystal structure prototype of Ce13Fe39Co3B45 has not been reported, hence this compound cannot be verified by XRD analysis. A number of unlabeled peaks, marked by “?” in Figure 12c, may belong to Ce13Fe39Co3B45.
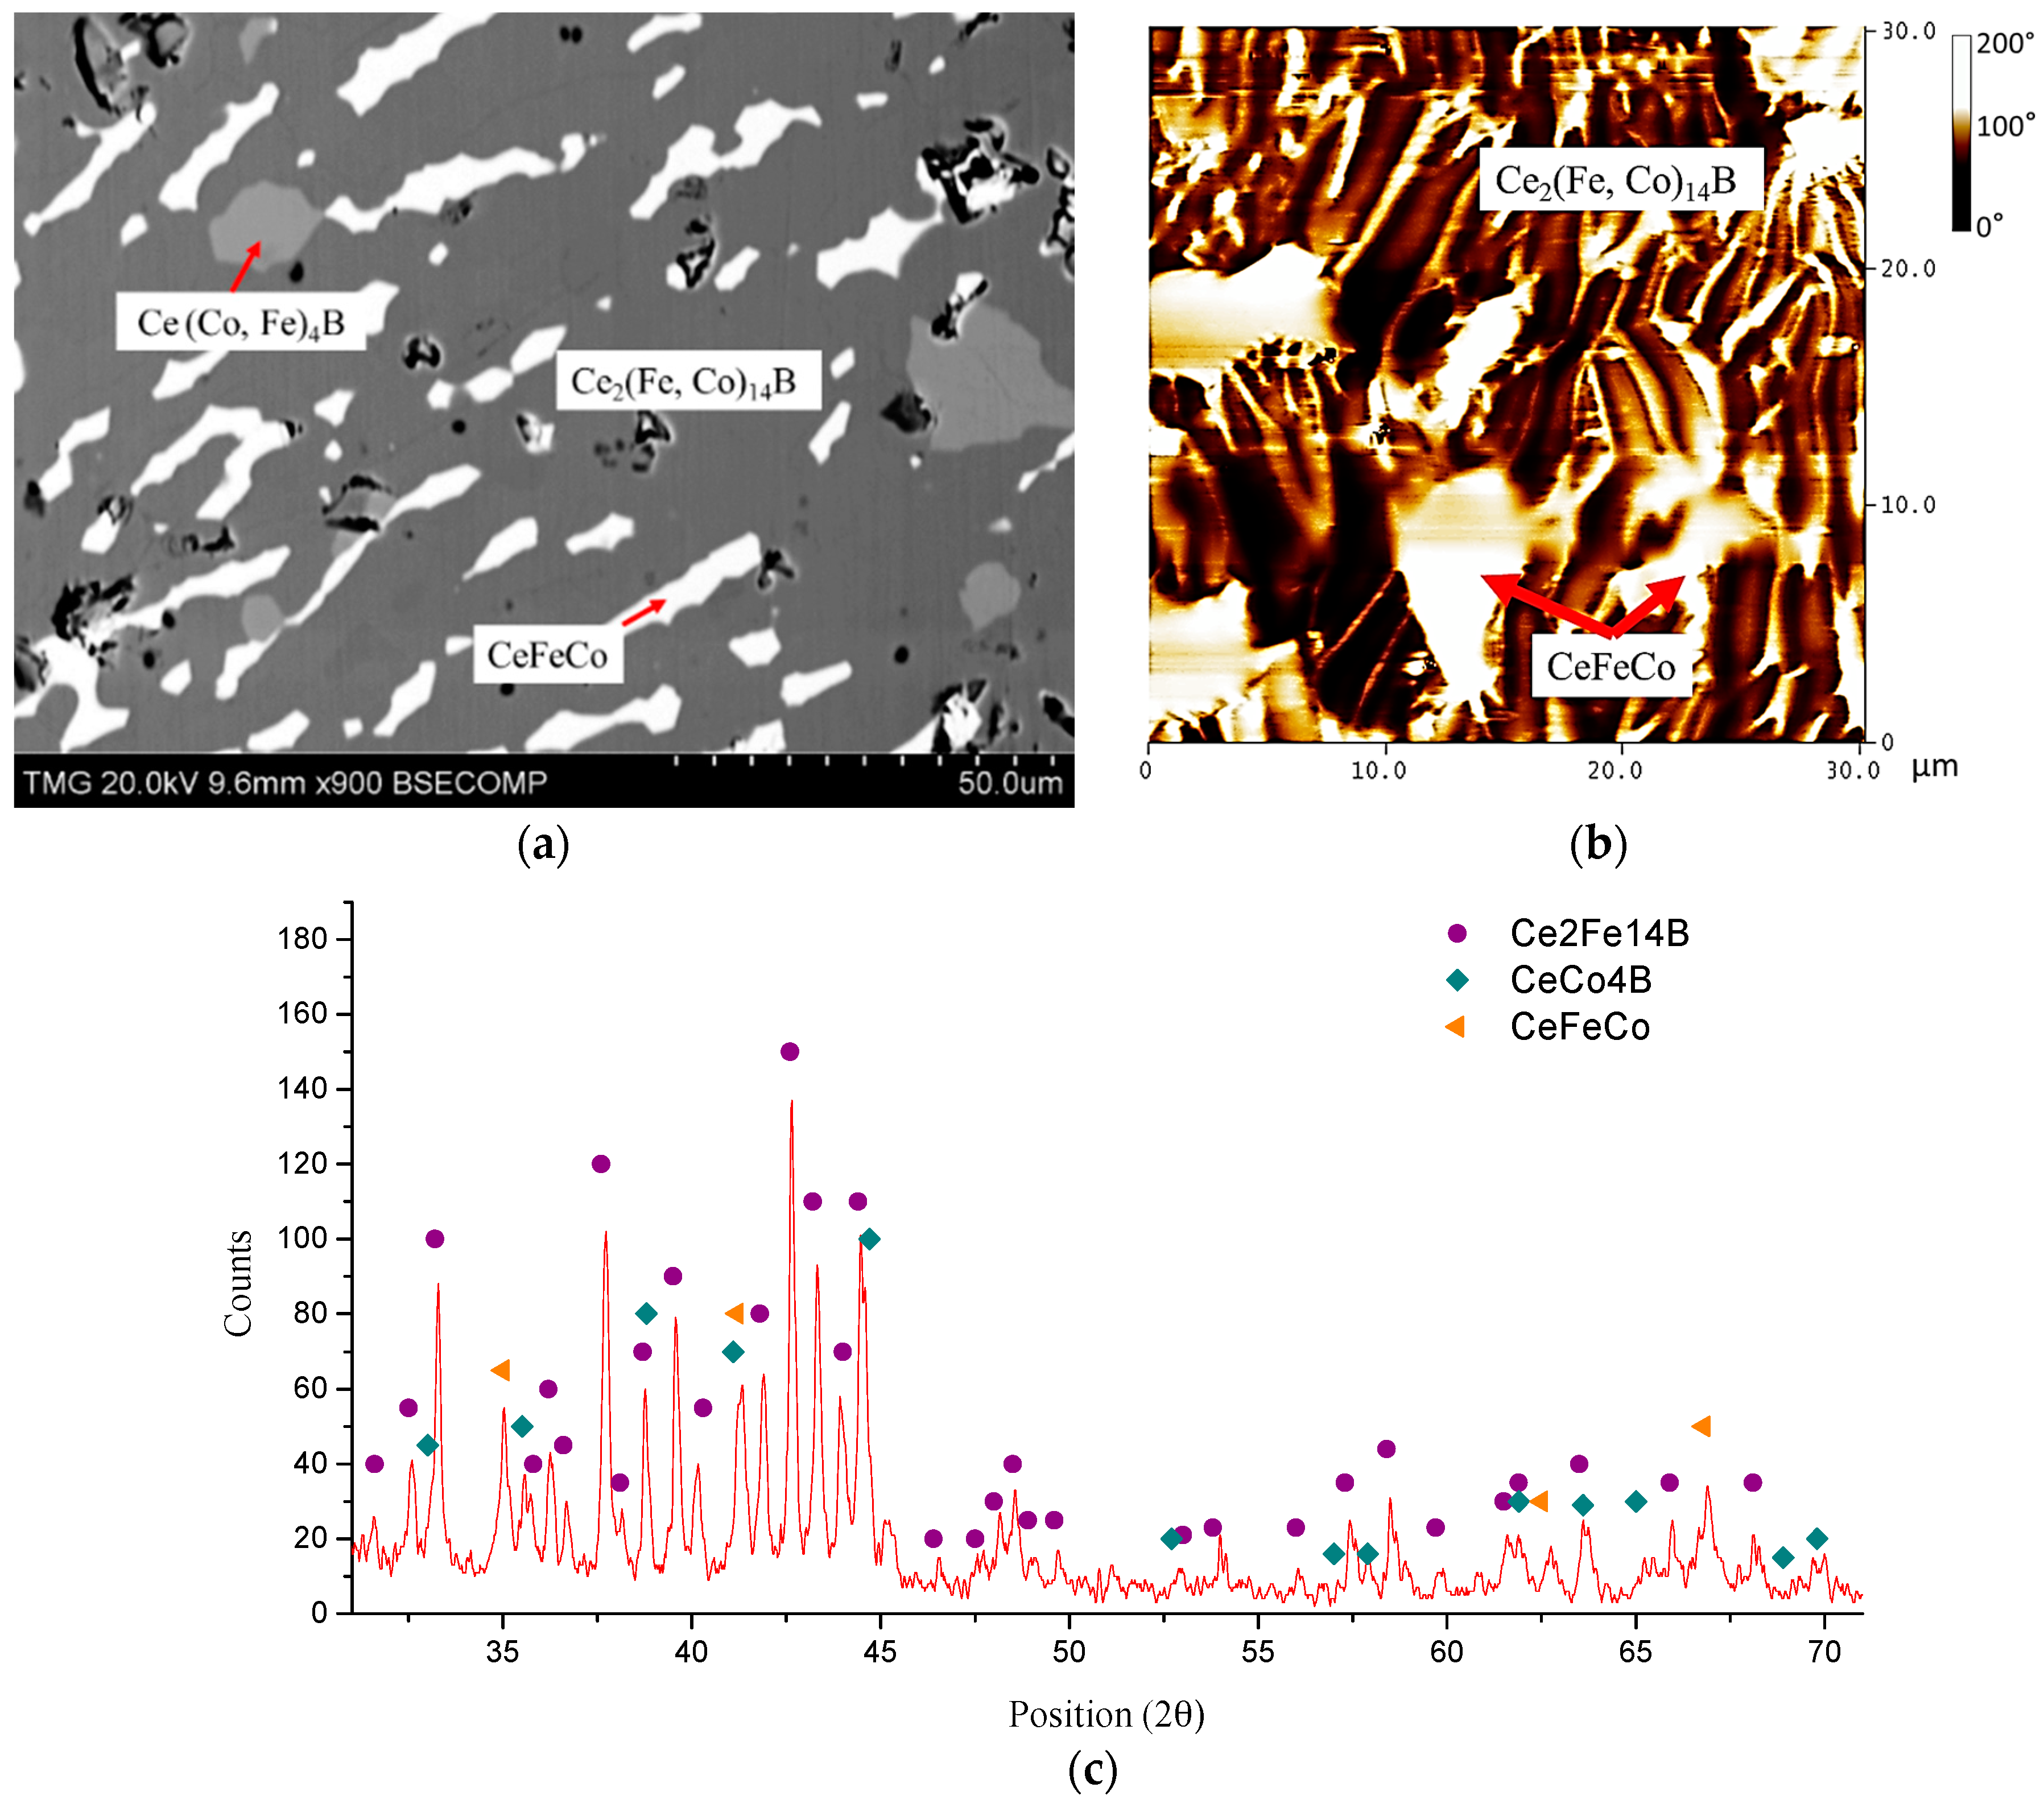
When the concentration of Co in the global composition increased from 7 at. % in KA 1–12 at. % in KA 2, three-phase equilibrium between Ce2(Fe, Co)14B, Ce(Co, Fe)4B, and CeFeCo occurred, as shown in Figure 13a. Unlike in KA 1, the boron-rich phase is not observed in KA 2. Instead, a limited quantity of Ce(Co, Fe)4B started to form when the Co content was increased. XRD analysis also confirmed the phase constituents, as shown in Figure 13c. The solid solubility limit of Ce(Co, Fe)4B was measured as 54 at. % Fe, which can be considered as the maximum solid solubility of this phase in the Ce-Fe-Co-B system at 900 °C. In the MFM image, as shown in Figure 13b, it is clear that the magnetic domain pattern corresponds to the dominating Ce2(Fe, Co)14B. However, Ce(Co, Fe)4B cannot be easily distinguished from this image, which could be due to its relatively small amount. Another possibility is that Ce(Co, Fe)4B and Ce2(Fe, Co)14B have a similar magnetic domain pattern, which makes it difficult to distinguish them from each other. By comparing the morphology of CeFeCo in Figure 13a with non-magnetic islands in Figure 13b, this non-magnetic phase belongs to the CeFeCo compound.
Ce2(Fe, Co)14B formed through peritectic solidification. Due to the sluggish kinetics of the peritectic reaction, the transformation of α-(Fe, Co) and CeFeCo to Ce2(Fe, Co)14B and Ce(Co, Fe)4B takes a very long time. Therefore, two-phase equilibrium was established between Ce2(Fe, Co)14B and Ce(Co, Fe)4B in KAs 3, 4, and 5. In KA 3, Co dissolved in Ce2Fe14B was measured as 18 at. %. With global Co concentrations increased in KAs 4 and 5, the solid solubility of Co in Ce2Fe14B was also further extended. Dominating Ce2(Fe, Co)14B was found in KA 4 (Ce15Fe54Co24B7), as shown in Figure 14a. Solid solubility of Ce2(Fe, Co)14B was measured as 22 at. % Co, which is consistent with the results obtained from DC2. However, with an increase in Co content to 32 at. % in KA 5 (Ce14Fe46Co32B8), Ce2(Fe, Co)14B was still found to form in this alloy, and solid solubility was measured as 28 at. % Co. The BSE image of KA 5 is presented in Figure 14b. Magnetic domains of Ce2(Fe, Co)14B can still be observed in both samples based on the MFM study, as can be seen in Figure 14c. KAs 6, 7, and 8 were prepared in the Co-rich region. The compositions of the detected phases are listed in Table 2. When Co content in KA 6 (Ce12Fe42Co40B6) reached 40 at. %, the Ce2(Fe, Co)14B phase disappeared. Whereas, Ce(Co, Fe)4B became the dominating phase and Ce2(Co, Fe)17 started to form in KA 6. KAs 7 and 8 confirmed the phase equilibria obtained from KA 6. In the XRD spectrum of KA 6 in Figure 15c, all three phases were confirmed by XRD. Three-phase regions Ce(Co, Fe)4B, α-(Fe, Co), and Ce2(Co, Fe)17 were established from these samples, as presented in Figure 16e. Moreover, the dominating Ce(Co, Fe)4B was found to be magnetic, as shown in Figure 15b. Compared to the MFM images of the Ce2(Fe, Co)14B phase in KAs 1–5, the magnetic contrast of Ce(Co, Fe)4B is significantly lower. The magnetic contrast of Ce(Co, Fe)4B in Figure 15b is in the range of 0–40 degree; whereas, the magnetic contrast of Ce2(Fe, Co)14B in KAs 1–5 is in the range of 0–180 degrees or higher. This indicates that the magnetization of Ce(Co, Fe)4B is weaker than that of Ce2(Fe, Co)14B. In KA 6, there is a number of weaker closure domain patterns at the top and middle of Figure 15b, which belong to Ce2(Co, Fe)17. The non-magnetic regions were considered as α-(Fe, Co) which were consistent with the MFM studies of other key alloys. The MFM results are only considered as indications of the effect of composition on the magnetic domains. A detailed study of the intrinsic magnetic properties of these phases will soon be published elsewhere.
From the key alloys study, the homogeneity ranges of Ce2(Fe, Co)14B and Ce(Co, Fe)4B were measured as 28 at. % Co and 54 at. % Fe, respectively. They were presented by Ce2Fe14−xCoxB (1.02 ≤ x ≤ 4.76) and CeCo4−xFexB (0.42 ≤ x ≤3.18) formulae. The experimental results of eight key alloys are summarized in Figure 16a. Solid solubility of ε1 (Ce2(Fe, Co)17) observed in the diffusion couples was confirmed by key alloys 6, 7, and 8. The Co dissolved in ε1 was found to extend further, up to 65 at. % in Ce2(Fe, Co)17, as presented by the Ce2Fe17−xCox (7.79 ≤ x ≤ 12.35) formula and shown in Figure 16. In the current study, it is found that Ce(Co, Fe)4B only formed in an Fe-rich region when Co content is greater than 10 at. %. When Co content is below 10 at. %, the boron-rich phase, Ce13Fe39Co3B45, started to form. Moreover, Ce(Co, Fe)4B might be a weaker magnetic phase compared to Ce2(Fe, Co)14B, based on the MFM results. The phases formed in the Fe-Co-Ce system are presented in Figure 16b. Two pseudo ternary sections at 12 at. % and 16 at. % Ce were used to demonstrate the locations of Ce2(Fe, Co)14B, and Ce(Co, Fe)4B, respectively, which can be seen in Figure 16c,d. The phase equilibria obtained from eight key alloys are presented in Figure 16e. The dotted lines indicate the possible phase equilibria between the detected phases. Two three-phase equilibria (Ce2(Fe, Co)14B/Ce(Co, Fe)4B/CeFeCo and Ce(Co, Fe)4B/α-(Fe, Co)/Ce2(Fe, Co)17) were established.
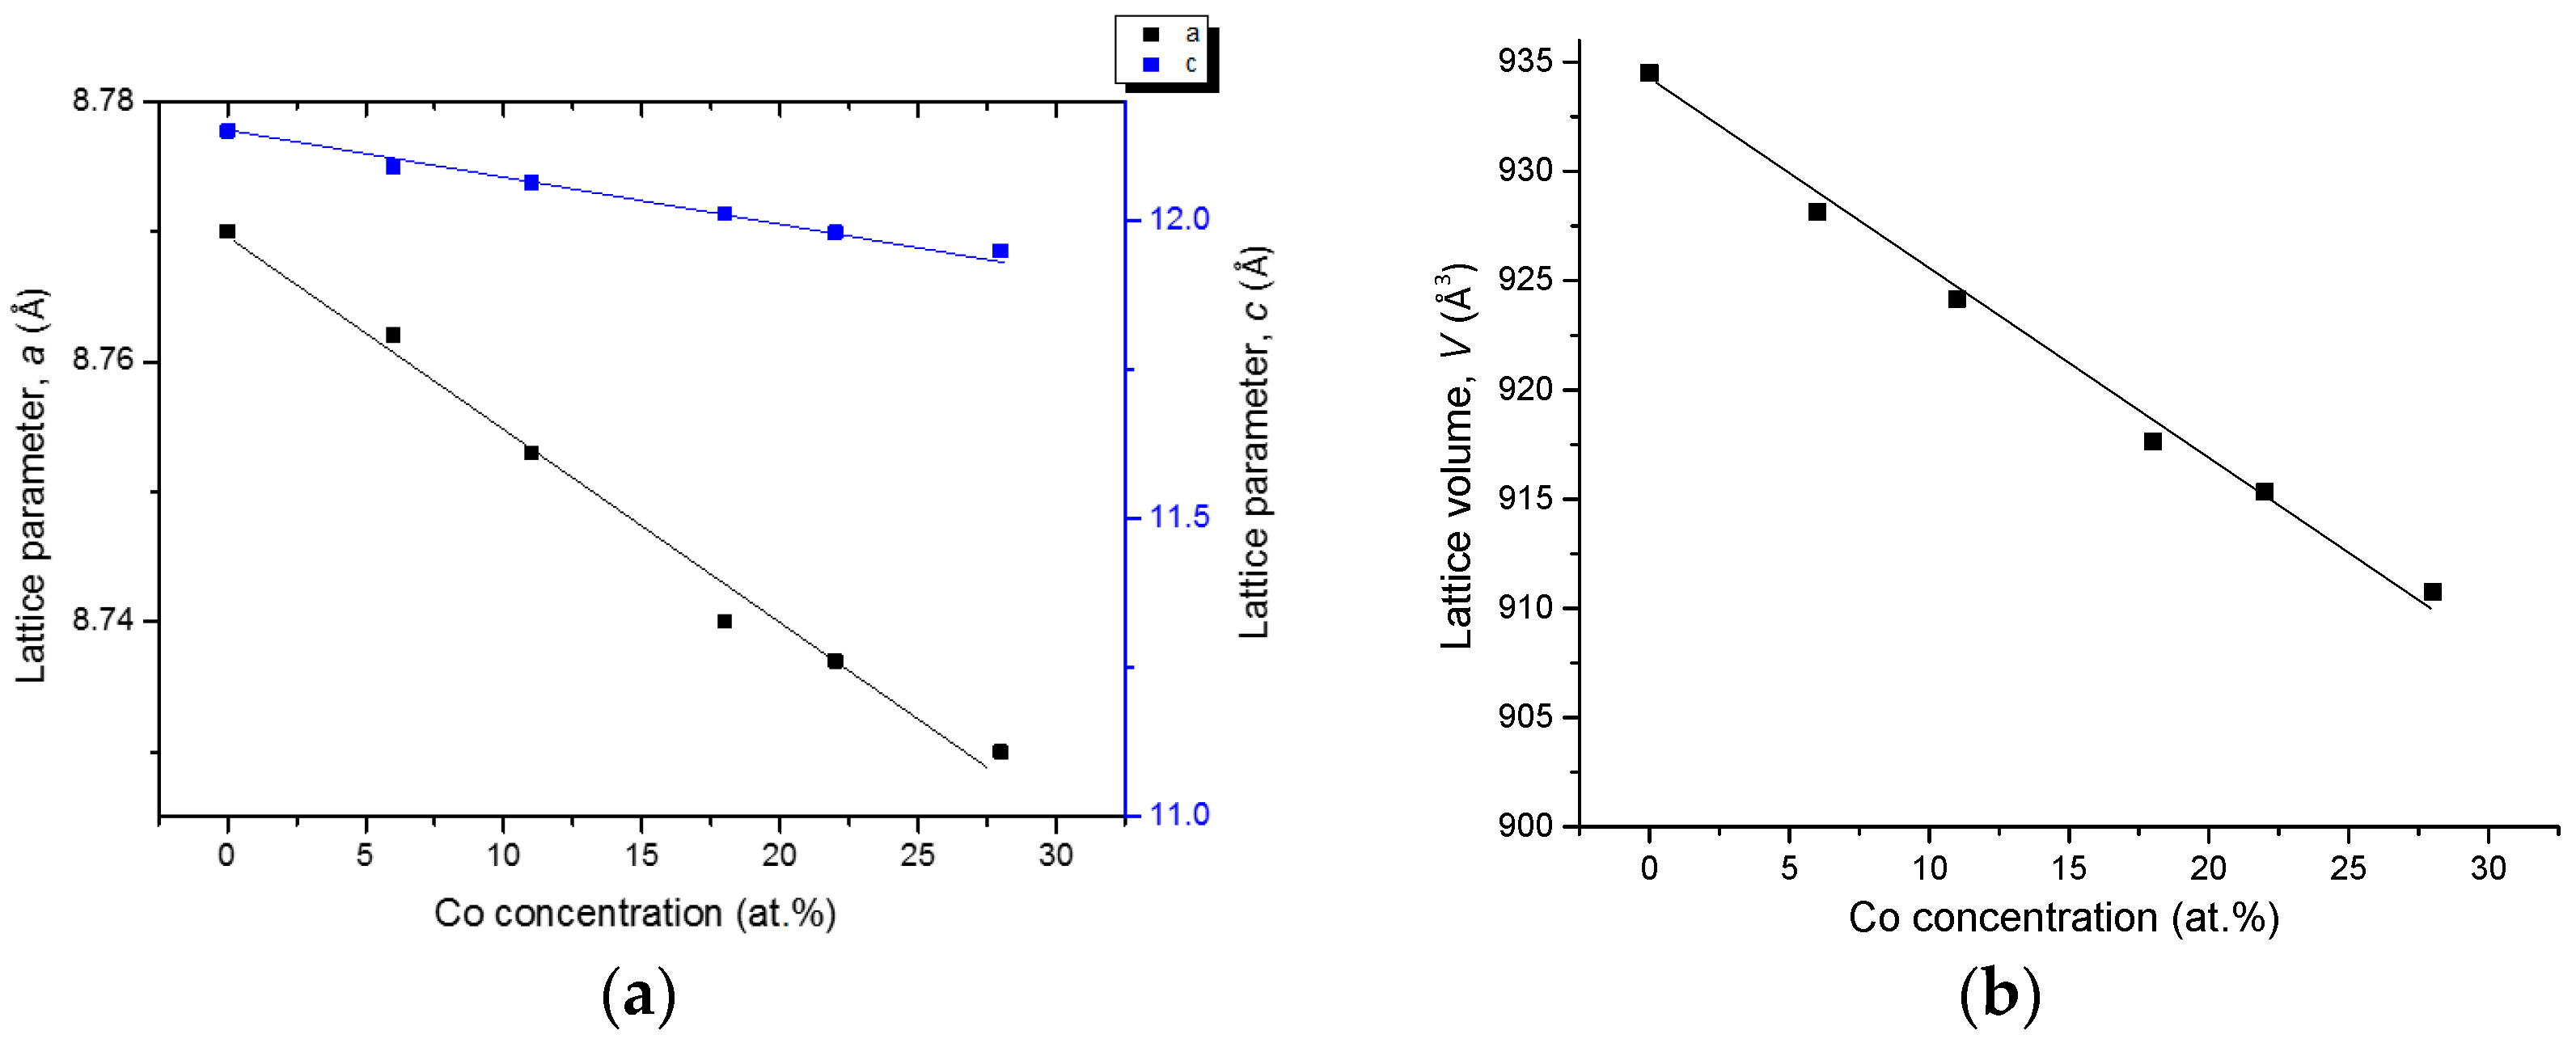
Ce2(Fe, Co)14B forms a substitutional solid solution in this quaternary system, where Co substitutes for Fe atoms, while Ce and B contents remain constant as 12 at. % and 6 at. %, respectively. The maximum solid solubility of Ce2(Fe, Co)14B has been determined by SEM/WDS as 28 at. % Co in KA 5 at 900 °C. All XRD data has shown that this solid solution, in KAs 1–5, crystallized in a tetragonal structure with a P42/mnm (68) space group and an Nd2Fe14B prototype. Figure 17 shows the cell parameters variations with Co concentration in the selected key alloys. The peak positions shift to a higher angle with increasing Co content. The substitution of Fe with Co, which has a smaller atomic radius, decreases the unit cell parameters and lattice volumes. This is confirmed by the increase in 2θ values of the peak positions from KAs 1–5 due to the increasing Co concentration. The linear relation between the lattice parameters, lattice volume, and Co concentration obey Vegard’s law [30], indicating clearly the occurrence of substitution solid solubility in the Ce2(Fe, Co)14B, as plotted in Figure 17.
The unit cell parameters of Ce(Co, Fe)4B from KAs 2–6 are plotted in Figure 18. Similar to Ce2(Fe, Co)14B, CeCo4B also forms a substitutional solid solution in this quaternary system, while Ce and B contents remain constant as 16 at. % and 17 at. %, respectively. The substitution of Co with Fe, which has a larger atomic radius, increases the unit cell parameters. Cell lengths a and c reach maximum when CeCo4B has the maximum quaternary solid solution of 54 at. % Fe in KA 2 at 900 °C. When Fe content in CeCo4B is reduced, the cell parameters are also decreased. This is confirmed by the increase in the 2θ values of the peaks positions from the KAs 2–8 due to the decreases in the Fe concentration. The XRD results have demonstrated that Ce(Co, Fe)4B crystallized in a hexagonal structure with a P6/mnm (191) space group and a CeCo4B prototype. The linear relation between the lattice parameters, lattice volume, and Co concentration obey Vegard’s law [30], indicating again the occurrence of substitution solid solubility in the Ce(Co, Fe)4B, as plotted in Figure 18.
4.3.2. Homogeneity ranges of Ce(Co, Fe)12B6 and Ce3(Co, Fe)11B4
Solid solubilities of Ce(Co, Fe)12B6 and Ce3(Co, Fe)11B4 were measured as 18 at. % Fe and 23 at. % Fe at 900 °C in the diffusion couple analysis. Seven key alloys were designed to verify the results obtained from the diffusion couples and determine the solubility limits of these two phases in the Ce-Fe-Co-B system at 900 °C. The chemical compositions of the key alloys prepared for this purpose are listed in Table 3. Phase equilibria determined from these key alloys are also summarized in Table 3. The actual global compositions of the samples were determined by EDS area mapping. Three maps were taken for each sample, and the differences in three scans were less than 2 at. % for all the elements.
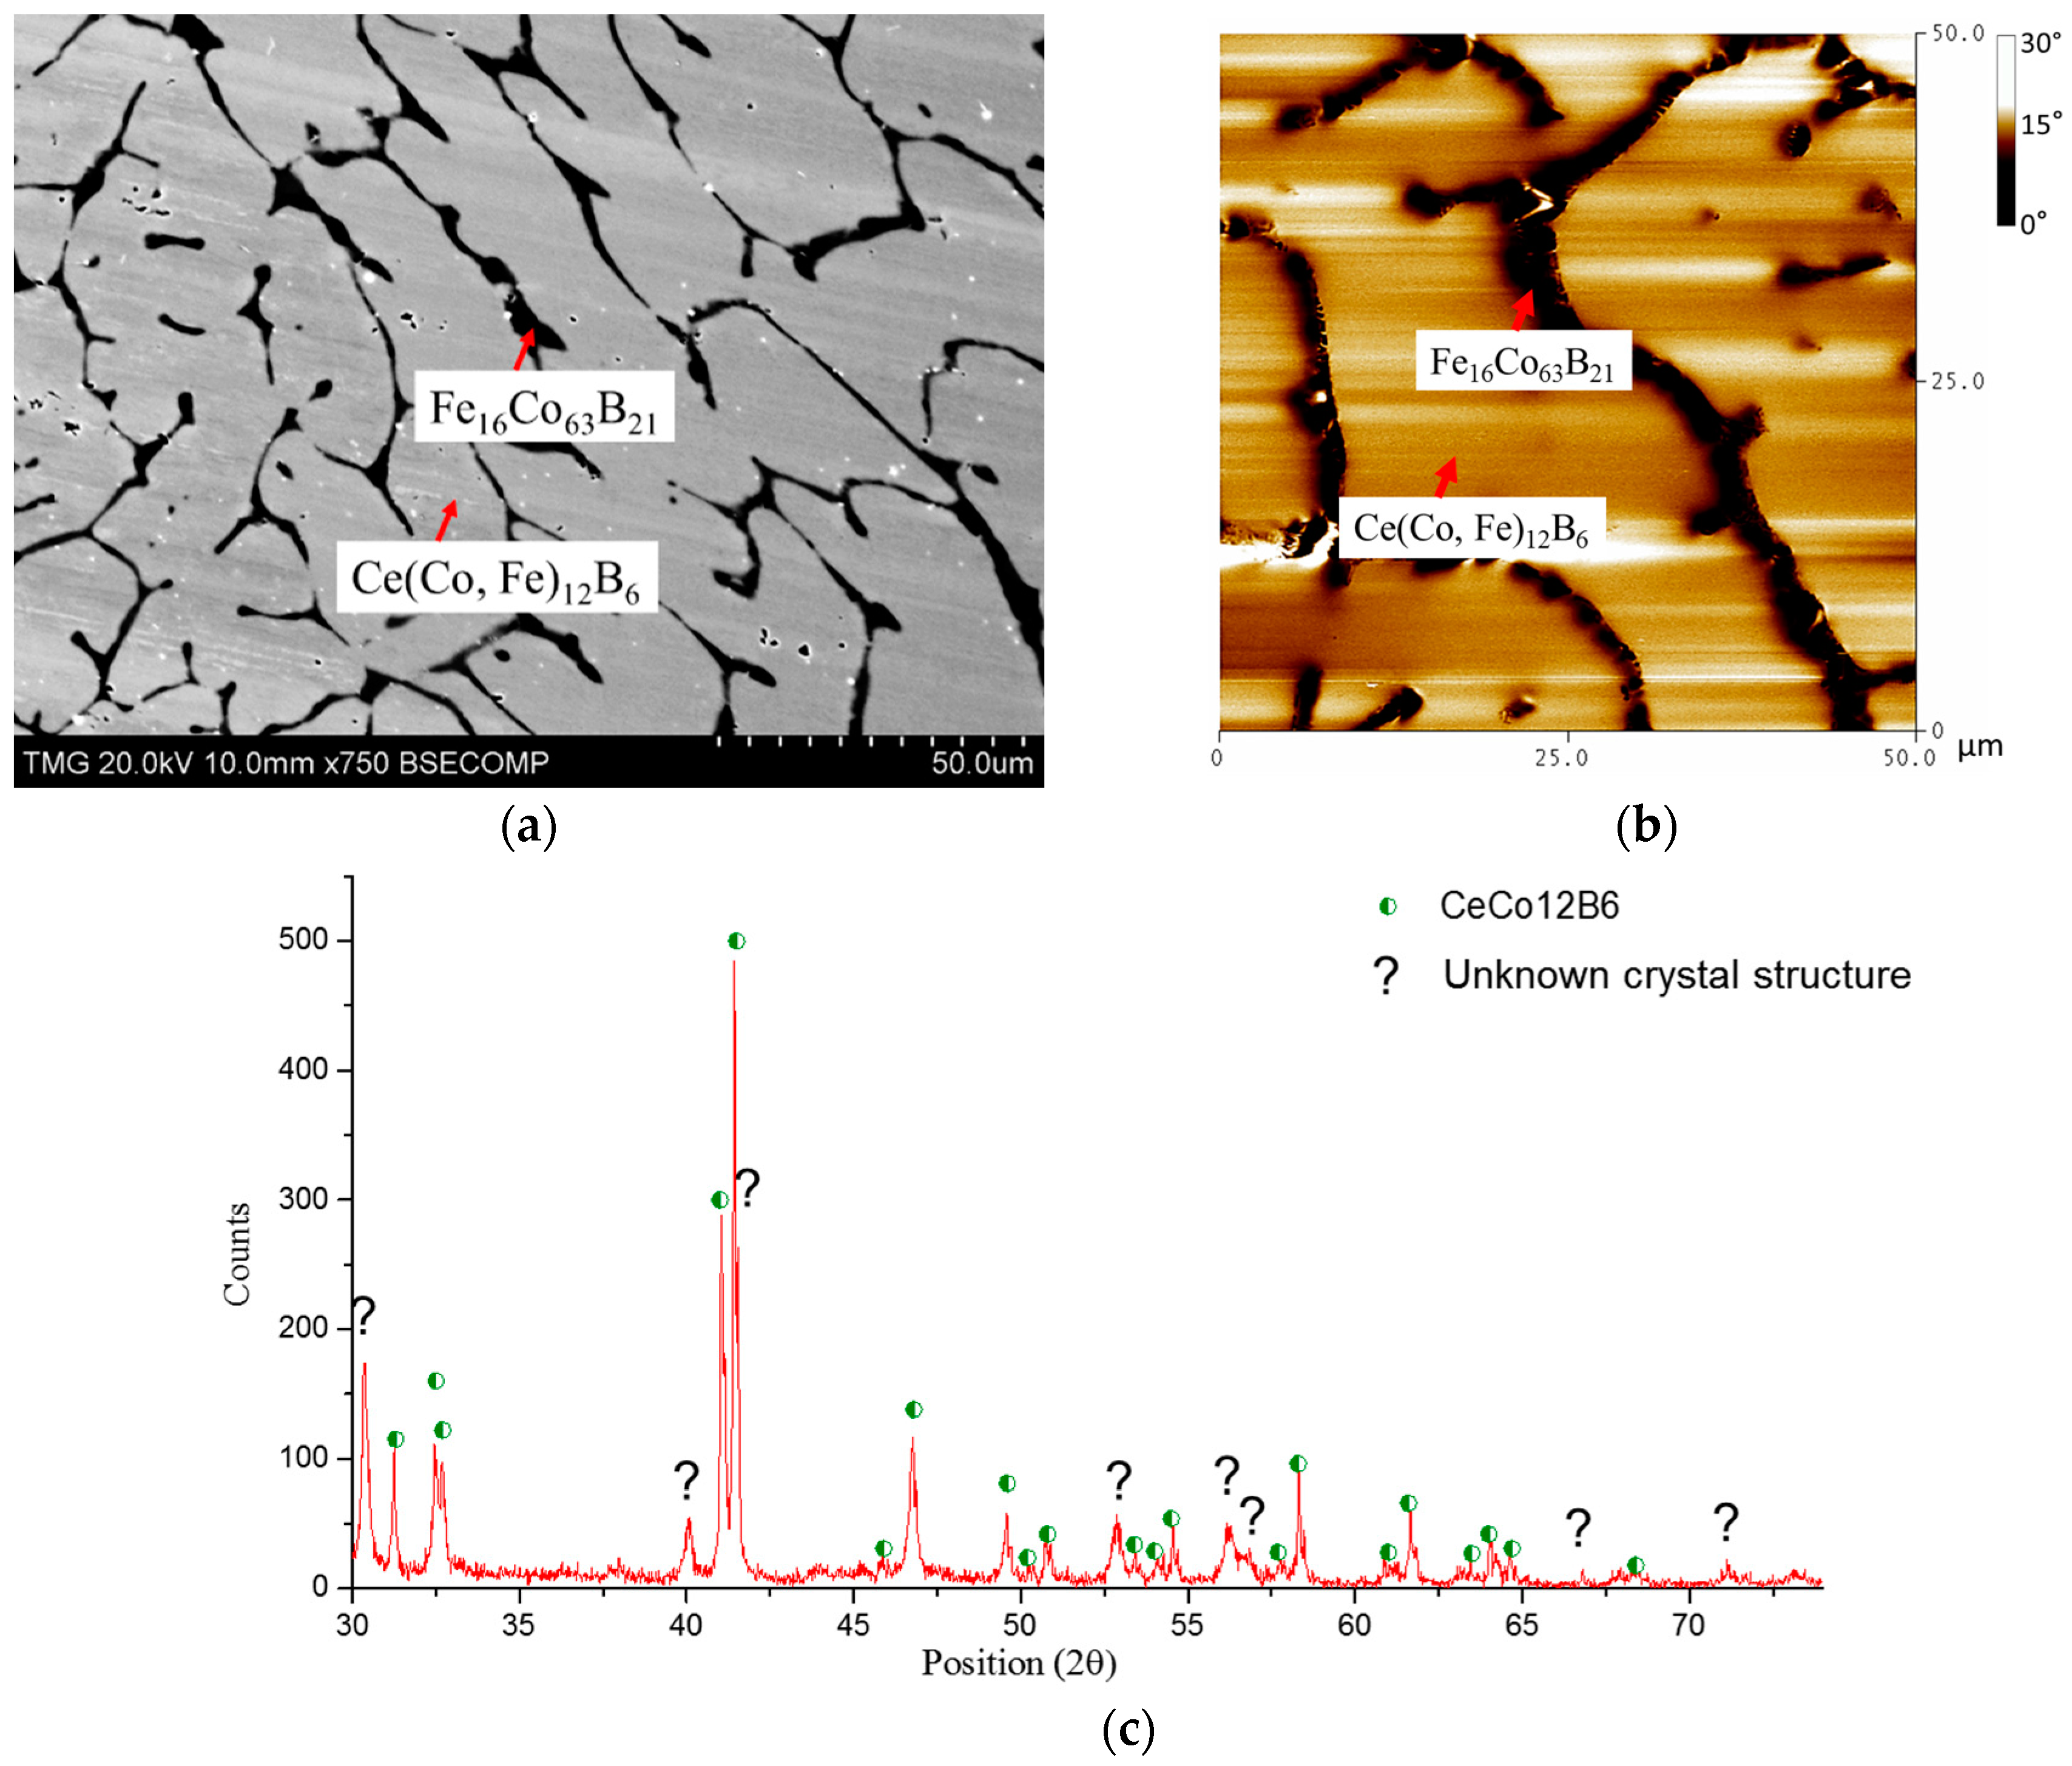
Ce(Co, Fe)12B6 was first found in the diffusion couple study and the homogeneity range was measured as 9–18 at. % Fe. KA 9 was prepared in the Co-rich side with Ce6Fe6Co58B30 chemical composition. After annealing at 900 °C for 25 days, the dominating Ce(Co, Fe)12B6 was obtained and some precipitates with Fe16Co63B21 chemical composition were also observed, as shown in Figure 19a. Fe dissolved in CeCo12B6 was determined as 4 at. %. From the MFM image in Figure 19b, the dominating phase was found to be non-magnetic, which is also consistent with the MFM result of DC4. The magnetic domain found in this image belongs to Fe16Co63B21. Based on the XRD analysis shown in Figure 19c, the dominating Ce(Co, Fe)12B6 phase was positively identified. However, the crystal structure prototype of Fe16Co63B21 is not available in the literature. Therefore, this phase cannot be verified by XRD analysis. Moreover, there are some unlabeled peaks, marked with “?” in Figure 19c, which may belong to Fe16Co63B21.
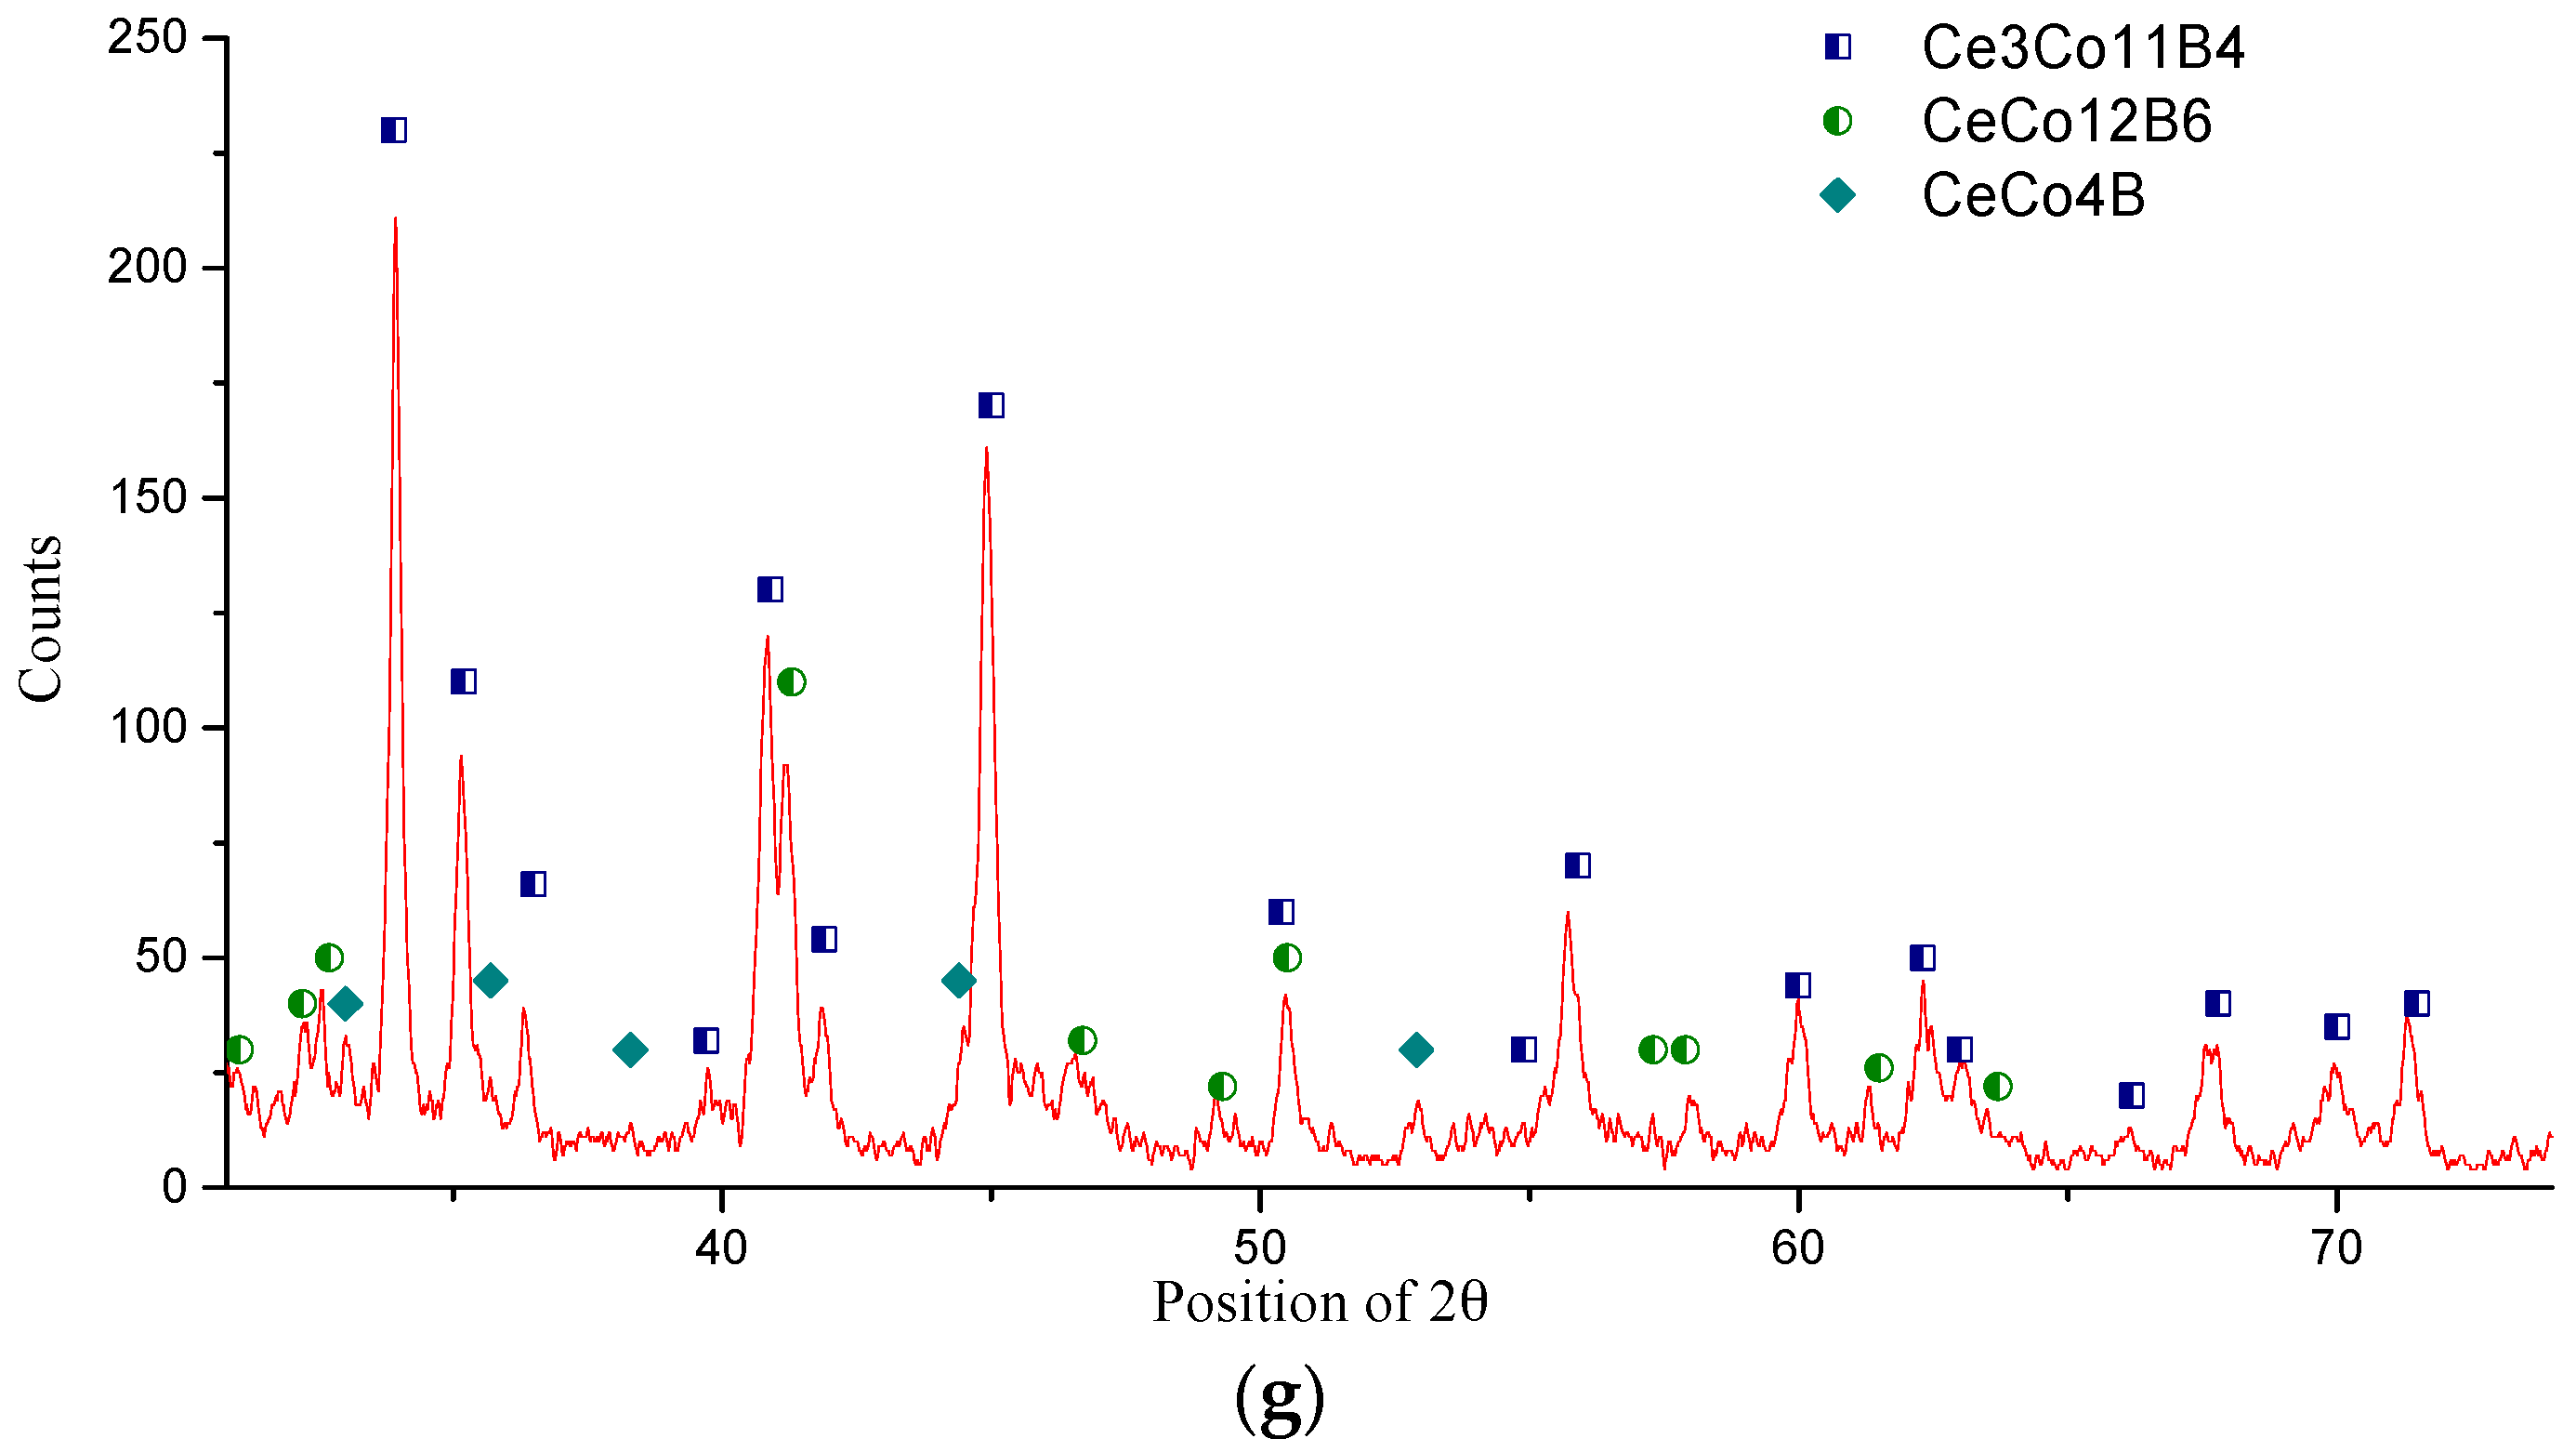
KAs 10–14 were selected to measure the maximum solid solubility of Ce(Co, Fe)12B6 and Ce3(Co, Fe)11B4. These five key alloys were prepared along the homogeneity range of Ce3(Co, Fe)11B4 by substituting a different amount of Fe with Co, which were presented by the formulae Ce3Co11 − xFexB4 with x = 1.44, 3.24, 5.94, 7.38, and 9.00. The phase relations between Ce3(Co, Fe)11B4, Ce(Co, Fe)12B6, and Ce(Co, Fe)4B were investigated. As shown in Figure 20a, two-phase equilibrium between Ce3(Co, Fe)11B4 and Ce(Co, Fe)12B6 was established from KA 11. The dominating Ce3(Co, Fe)11B4 phase was identified and the black precipitates in Figure 20a were found to be Ce(Co, Fe)12B6. When the global Fe concentration in KA 12 was increased to 33 at. %, a small amount of the Ce(Co, Fe)4B phase appeared, as can be seen in Figure 20b. Fe dissolved in Ce3(Co, Fe)11B4 and Ce(Co, Fe)12B6 was measured as 28 at. % and 46 at. %, respectively. The detected phases were all confirmed by XRD, as presented in Figure 20g. As Fe content reached 42 at. % in KA 13, Ce(Co, Fe)12B6 disappeared and Ce(Co, Fe)4B became the dominating phase, along with a limited amount of Ce3(Co, Fe)11B4.
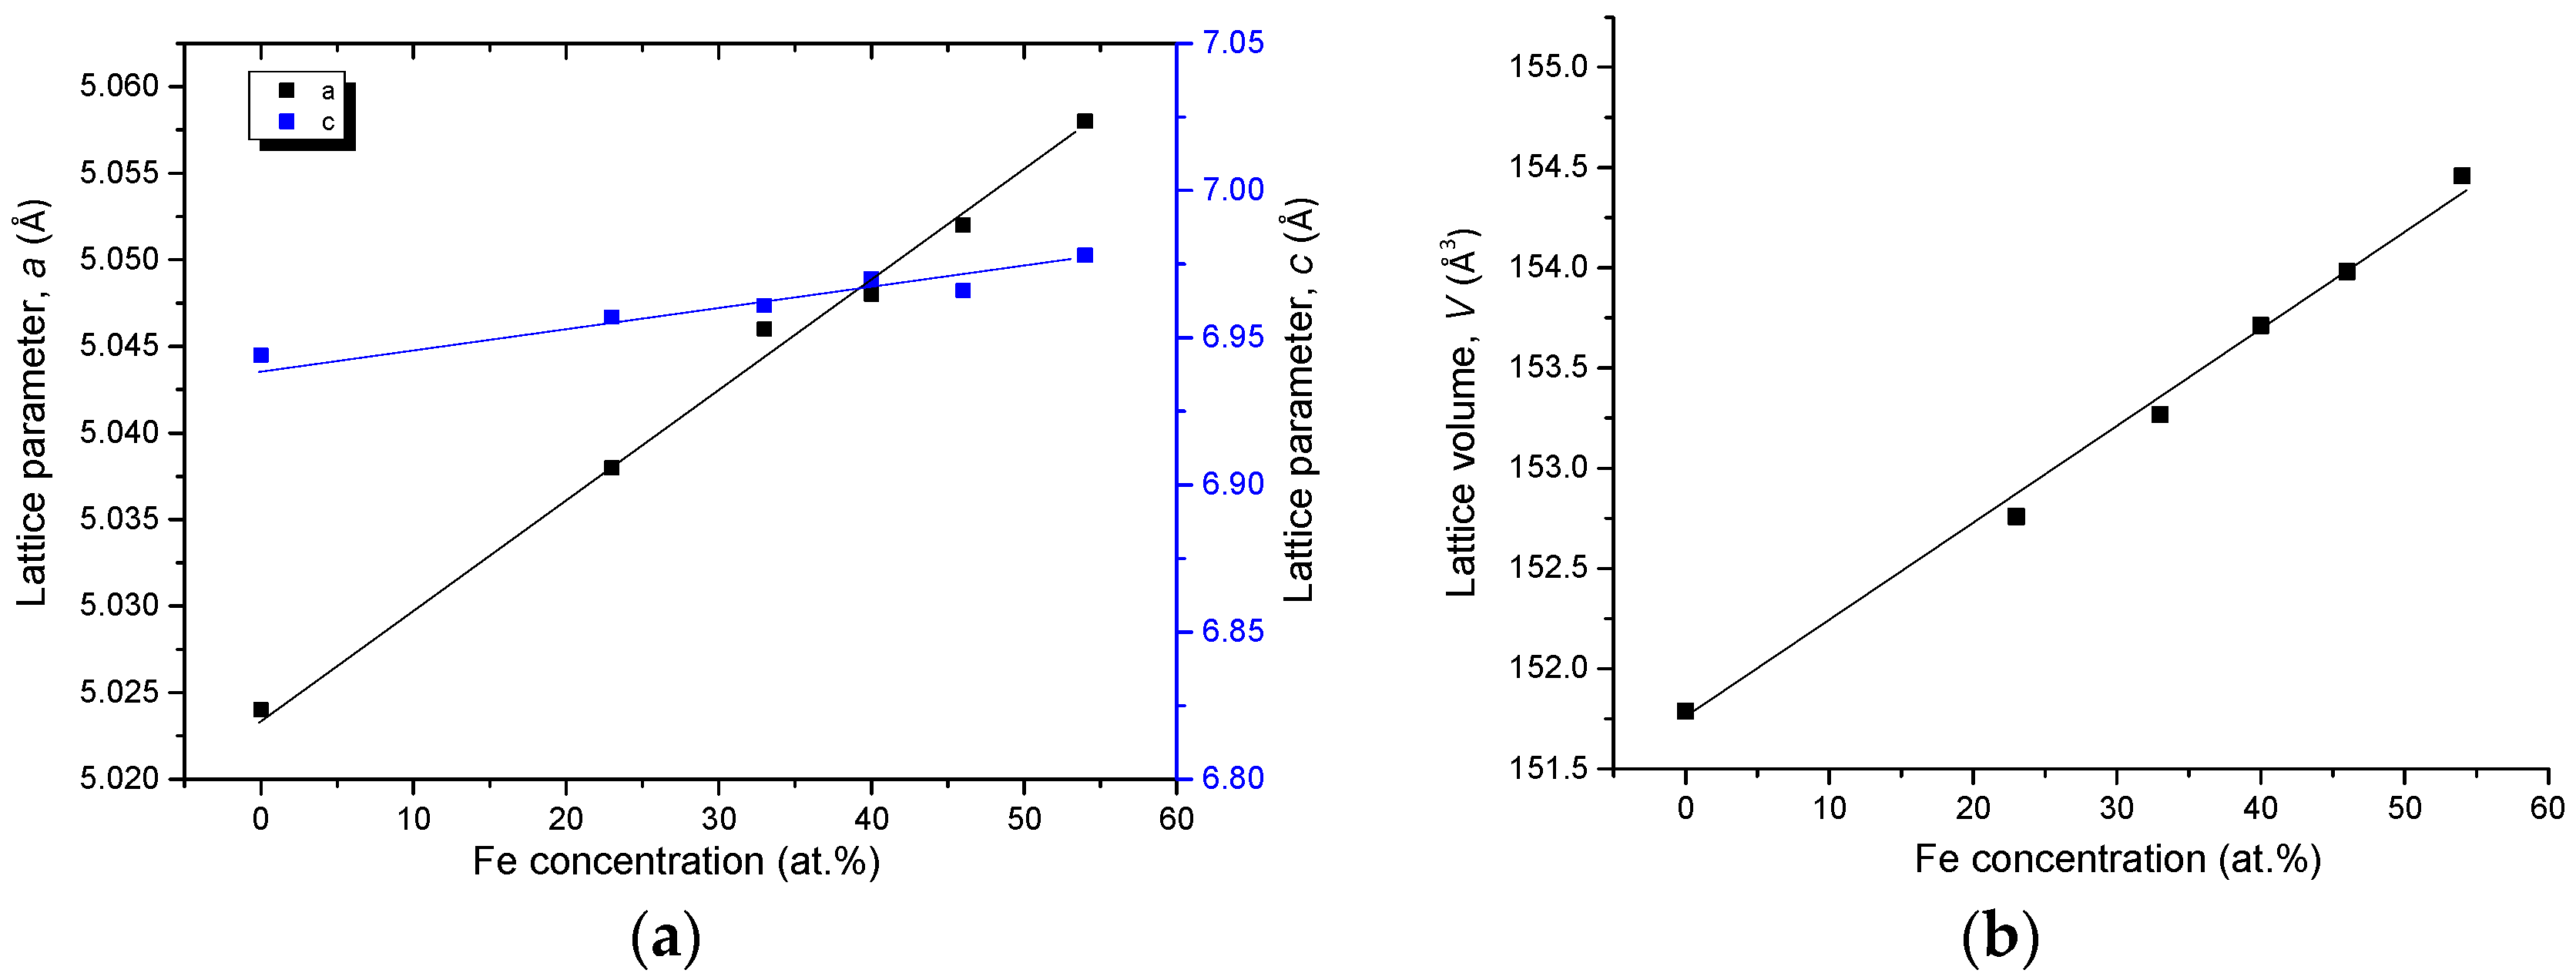
When Fe content was increased to 50 at. % in KA 14, Ce3(Co, Fe)11B4 completely disappeared and three-phase equilibrium Ce(Co, Fe)4B, Ce13Fe37Co5B45, and CeFeCo was established. Maximum solid solubility of Ce3(Co, Fe)11B4 was measured as 37 at. % Fe in KA 13. From the MFM results, as shown in Figure 20e,f, a mixture of stripe and closure domain patterns is observed, indicating that the dominating Ce3(Co, Fe)11B4 dissolving 14 at. % Fe and 28 at. % Fe, respectively, is a magnetic phase. Magnetic Ce3(Co, Fe)11B4 was first found in DC4, and is now confirmed by the MFM study of the key alloys. The substitution of Co with Fe in Ce3(Co, Fe)11B4 is also studied by XRD. Compared to Co, Fe has a larger atomic radius, which could increase the unit cell parameters. As can be seen in Figure 21, cell length a and lattice volume V reach maximum when Ce3(Co, Fe)11B4 has the maximum quaternary solid solubility of 37 at. % Fe in KA 13 at 900 °C. However, when Fe concentration in Ce3(Co, Fe)11B4 was increased, the cell parameter c decreased to some extent. Nevertheless, the volume of the unit cell increased with Fe content, indicating the overall effect of larger atom substitution. The XRD results have demonstrated that Ce3(Co, Fe)11B4 crystallizes in a hexagonal structure with a P6/mnm (191) space group and a Ce3Co11B4 prototype. The linear relation between the lattice parameters, lattice volume, and Co concentration indicates the occurrence of substitution solid solubility, according to the Vegard’s law [30], as shown in Figure 21.
In KAs 13 and 14, a boron-rich phase with Ce13Fe34Co8B45 and Ce13Fe37Co5B45 chemical compositions was identified. This phase was first observed in DCs 3 and 4, with Ce13Fe38Co4B45 and Ce13Fe32Co10B45, respectively. Similar results were also obtained from KA 1, but with Ce13Fe39Co3B45 composition. Analyzing these compositions reveals that Ce and B contents are consistent and the compositional difference was due to Fe/Co atomic exchange. Moreover, the unidentified peaks in the XRD spectra of KAs 1, 13, and 14 were repeatable, but no reported crystal structure prototype could be found for this phase. Thus, we consider this boron-rich phase, Ce13FexCoyB45 (32 ≤ x ≤ 39, 3 ≤ y ≤ 10), as a new quaternary solid solution in the Ce-Fe-Co-B system at 900 °C.
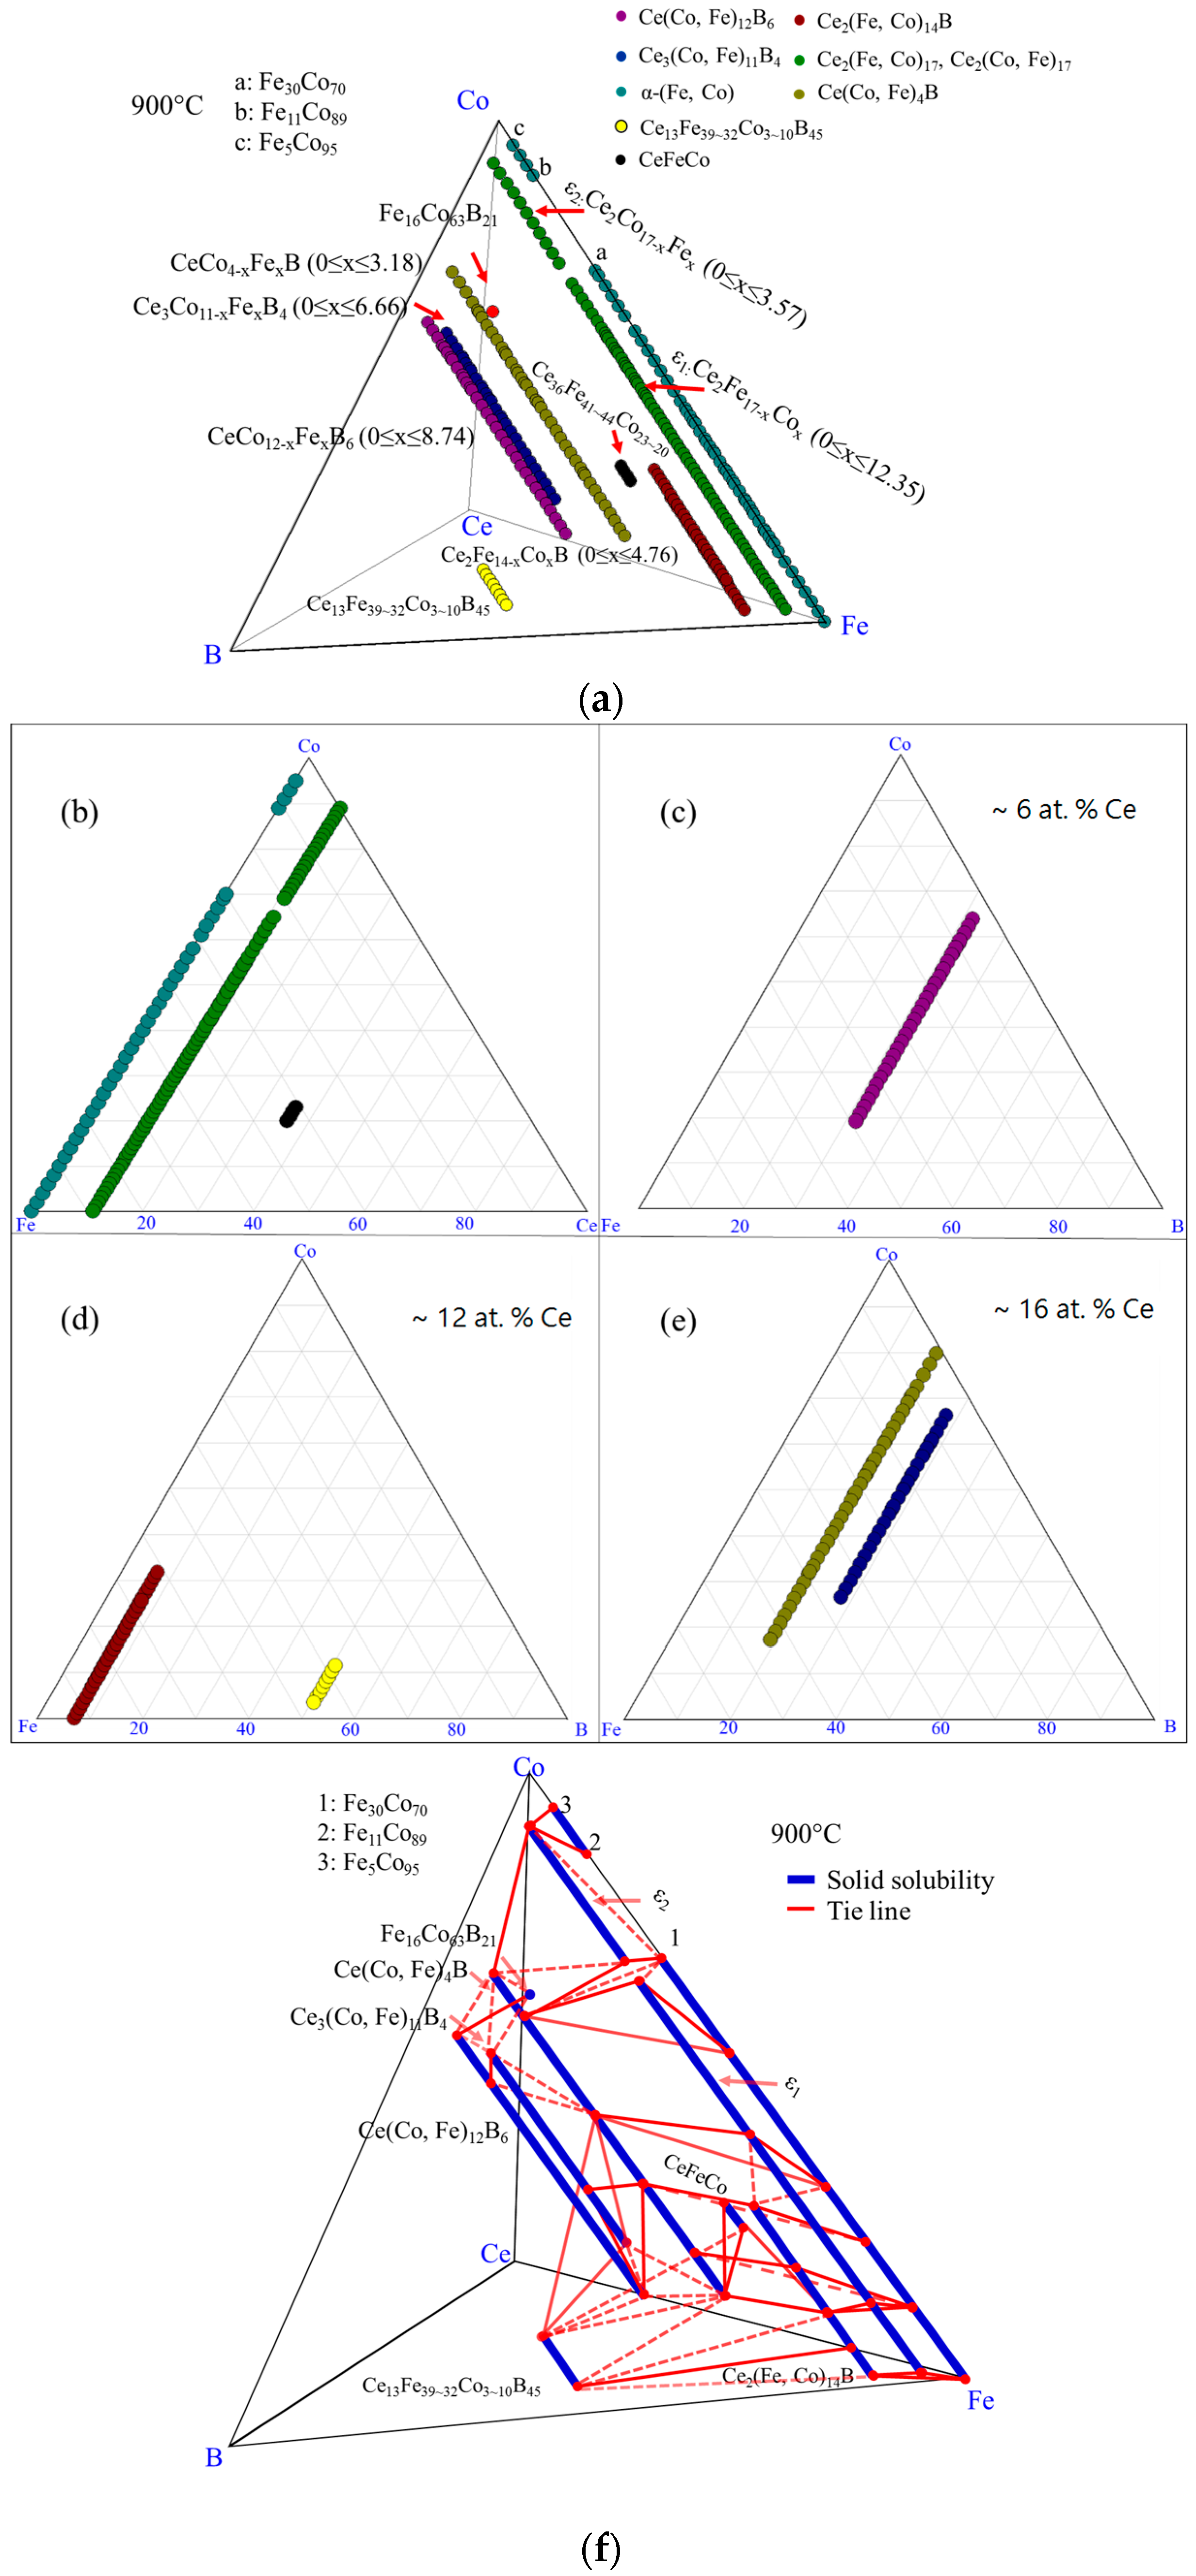
The experimental results of KAs 9–15 are summarized in Figure 22a. Solid solubilities of magnetic Ce3(Co, Fe)11B4 and non-magnetic Ce(Co, Fe)12B6 were first measured by diffusion couples as 23 at. % Fe and 18 at. % Fe, respectively. During the key alloy study, it has been proven that these two phases further extended into this system. And the solubility limits were measured as 46 at. % Fe and 37 at. % Fe, respectively. They can be presented as CeCo12−xFexB6 (0.76 ≤ x ≤ 8.74) and Ce3Co11−xFexB4 (0.9 ≤ x ≤ 5.04), as illustrated in Figure 22a. Two pseudo ternary sections at 6 at. % and 16 at. % Ce were used to demonstrate the locations of Ce(Co, Fe)12B6 and Ce3(Co, Fe)11B4, respectively, in Figure 22b,c. In Figure 22d, solid lines are the phase equilibria determined from key alloys, and dotted lines indicate the possible phase equilibria of detected phases.
Combining the results which were obtained from the diffusion couples with those attained from the key alloys, the phases which were detected in the Ce-Fe-Co-B system in the Fe-Co rich region at 900 °C were plotted in Figure 23a. Seven three-phase equilibria were established as: α-(Fe, Co)/Ce2(Fe, Co)14B/Ce2(Fe, Co)17; Ce2(Fe, Co)14B/Ce(Co, Fe)4B/CeFeCo; Ce2(Fe, Co)17/Ce(Co, Fe)4B/α-(Fe, Co); Ce3(Co, Fe)11B4/Ce(Co, Fe)12B6/Ce(Co, Fe)4B; Ce3(Co, Fe)11B4/Ce(Co, Fe)12B6/α-(Fe, Co); Ce3(Co, Fe)11B4/Ce(Co, Fe)4B/Ce13Fe34Co8B45, and Ce3(Co, Fe)11B4/Ce(Co, Fe)4B/α-(Fe, Co). The phase relations of the Ce-Fe-Co-B system in the Fe-rich corner at 900 °C were plotted, as shown in Figure 23f. Solid lines are the tie-lines determined in this study and dotted lines represent the possible phase relations. Among those detected phases, Ce2(Fe, Co)14B, Ce(Co, Fe)4B, and Ce3(Co, Fe)11B4 were magnetic phases in this system, which was proven by the MFM study. Also, Ce(Co, Fe)12B6 was identified as non-magnetic. The phases formed in the Fe-Co-Ce system are plotted in the triangle, as shown in Figure 23a. Three pseudo ternary sections at around 6 at. %, 12 at. % and 16 at. % Ce were constructed to demonstrate the locations and phase relations of Ce(Co, Fe)12B6, Ce2(Fe, Co)14B, Ce(Co, Fe)4B, and Ce3(Co, Fe)11B4.
5. Conclusions
A high-throughput screening method was found to be effective in studying the phase equilibria in the Ce-Fe-Co-B system while exploring potential magnetic phases. Phase equilibria and homogeneity ranges have been determined in the Fe-Co rich side of the Ce-Fe-Co-B system at 900 °C. Three magnetic phases are observed which are presented as Ce2Fe14−xCoxB (0 ≤ x ≤ 4.76), CeCo4−xFexB (0 ≤ x ≤ 3.18), and Ce3Co11−xFexB4 (0 ≤ x ≤ 6.66). Ce2(Fe, Co)14B exhibited stronger magnetic interaction than Ce(Co, Fe)4B and Ce3(Co, Fe)11B4 during the MFM analysis. Moreover, a non-magnetic CeCo12−xFexB6 (0 ≤ x ≤ 8.74) was found to form in this system at 900 °C. A boron-rich solid solution with Ce13FexCoyB45 (32 ≤ x ≤ 39, 3 ≤ y ≤ 10) chemical composition was observed in this quaternary system. The crystal structure of this phase has not been reported in the literature. In addition, two solid solutions ε1 (Ce2Fe17−xCox (0 ≤ x ≤ 12.35)) and ε2 (Ce2Co17−xFex (0 ≤ x ≤ 3.57)) were found to form between Ce2Fe17 and Ce2Co17 in the Ce-Fe-Co ternary system at 900 °C.
Acknowledgments
Financial support from General Motors of Canada Ltd., and the Natural Sciences and Engineering Research Council of Canada through the CRD grant program is gratefully acknowledged. The authors thank Frederick Pinkerton for the useful discussions on the methodology of this work. The authors also would like to thank TMG members, especially Ahmad Mostafa for his help and Kayode Orimoloye for his support during the experimental work.
Author Contributions
M.M. initiated the project. M.M., D.K. and T.W. conceived and designed the experiments. T.W. carried out the experiments. M.M., D.K. and T.W. interpreted the results. M.M. and T.W. wrote the manuscript.
Conflicts of Interest
The authors declare no conflict of interest.
References
- Buschow, K.H.J. New permanent magnet materials. Mater. Sci. Rep. 1986, 1, 1–64. [Google Scholar] [CrossRef]
- Herbst, J.F.; Meyer, M.S.; Pinkerton, F.E. Magnetic hardening of Ce2Fe14B. J. Appl. Phys. 2012, 111, 1–3. [Google Scholar] [CrossRef]
- Skoug, E.J.; Meyer, M.S.; Pinkerton, F.E.; Tessema, M.M.; Haddad, D.; Herbst, J.F. Crystal structure and magnetic properties of Ce2Fe14−xCoxB alloys. J. Alloys Compd. 2013, 574, 552–555. [Google Scholar] [CrossRef]
- Bilonizhko, N.S.; Yu, B.; Kuz’ma, N.S. Ce-Fe-B system. Izv. Akad. Nauk SSSR Neorg. Mater. 1972, 8, 183–184. [Google Scholar]
- Dub, O.M.; Kuz’ma, Y.B. Ternary borides with the Nd2Fe14B structure. Soviet Powder Metall. Met. Ceram. 1986, 25, 572–575. [Google Scholar]
- Bezinge, A.; Braun, H.F.; Muller, J.; Yvon, K. Tetragonal rare earth (R) iron borides, R1+xFe4B4 (x ≈ 0.1) with incommensurate rare earth and iron substructures. Solid State Commun. 1985, 55, 131–135. [Google Scholar] [CrossRef]
- Dub, O.M.; Chaban, N.F.; Kuz’ma, Y.B. New borides of Pr5−xCo2+xB6-type structure. J. Less-Common Met. 1986, 117, 297–303. [Google Scholar] [CrossRef]
- Raghavan, V.; Raynor, G.V.; Rivlin, V.G. Phase Diagrams of Ternary Iron Alloys; ASM International: Materials Park, OH, USA, 1987; Part 3; pp. 297–300. [Google Scholar]
- Rogl, P.; Schuster, J.C.; Nowotny, H. Phase equilibrium and compound formation in Fe-M(metal)-B-X(non-metal) systems. In Boron in Steel Proceeding of the International Symposium; Metallurgical Society of AIME: Milwaukee, WI, USA, 1979; pp. 33–43. [Google Scholar]
- Pradelli, G.; Gianoglio, C.; Quadrini, E. The Co-Fe-B system in the presence of liquid. Met. Ital. 1981, 73, 351–355. [Google Scholar]
- Van Loo, F.J.J.; van Beek, J.A. Reactions and phase relations in the Fe-Ni-B and Fe-Co-B dystems. Z. Metallkd. 1989, 80, 245–250. [Google Scholar]
- Liu, Y.Q.; Zhao, X.S.; Yang, J.; Shen, J.Y. Thermodynamic optimization of the Boron-Cobalt-Iron system. J. Alloys Compd. 2011, 509, 4805–4810. [Google Scholar] [CrossRef]
- Bilonizhko, H.C.; Kuz’ma, N.S.; Yu, B. Cerium-cobalt-boron system. Izv. Akad. Nauk SSSR Neorg. Mater. 1974, 10, 265–269. [Google Scholar]
- Kuz’ma, Y.B.; Bilonizhko, N.S.; Mykhalenko, S.I.; Stepanchikova, G.F.; Chaban, N.F. The interaction of transition and rare earth metals with boron. J. Less-Common Met. 1979, 67, 51–57. [Google Scholar] [CrossRef]
- Jurczyk, M. Crystallographic and magnetic characteristics of the Ce3Co20B compound. Phys. Status Solidi A 1987, 100, K173–K176. [Google Scholar] [CrossRef]
- Kuz’ma, Y.B.; Chernyak, G.V.; Chaban, N.F. New borides of rare-earth metals with the structure of SrNi12B6 type. Dopov. Akad. Nauk Ukr. RSR Ser. A 1981, 12–80. [Google Scholar]
- Dub, O.M.; Skolozdra, R.V.; Kuz’ma, Y.B.; Dubenko, N.S. Magnetic and electrical parameters of ternary rare-earth borides containing cobalt and nickel. Inorg. Mater. 1990, 26, 1034–1037. [Google Scholar]
- Critchley, J.K. Low melting point alloys of cerium with iron, cobalt and plutonium. U.K. At. Energy Auth. Harwell Lab. Memo AERE-M 1959, 488, 1–7. [Google Scholar]
- ASM Alloy Phased Diagram Database. Available online: http://www1.asminternational.org/AsmEnterprise/APD/BrowseAPD.aspx (accessed on 3 November 2015).
- Su, X.; Zhang, W.J.; Du, Z.M. A thermodynamic modelling of the Co-Ce system. J. Alloys Compd. 1998, 267, 121–127. [Google Scholar] [CrossRef]
- Mansey, R.C.; Raynor, G.V.; Harris, I.R. Rare-earth intermediate phases VI. Pseudo-binary systems between cubic laves phases formed by rare-earth metals with iron, cobalt, nickel, aluminum and rhodium. J. Less-Common Met. 1968, 14, 337–347. [Google Scholar] [CrossRef]
- Harris, I.R.; Longworth, G. X-ray and Mössbauer studies of the pseudo-binary system Ce(Fe1−xNix)2. J. Less-Common Met. 1976, 45, 63–77. [Google Scholar] [CrossRef]
- Longworth, G.; Harris, I.R. Mössbauer effect study of the pseudo-binary system Ce(Fe1−xCox)2. J. Less-Common Met. 1975, 41, 175–185. [Google Scholar] [CrossRef]
- Putz, H.; Brandenburg, K. Pearson’s Crystal Data, Crystal Structure Database for Inorganic Compounds, CD-ROM Software Version 1.3; ASM International: Materials Park, OH, USA, 2007.
- Wang, T.; Kevorkov, D.; Mostafa, A.; Medraj, M. Experimental investigation of the phase equilibria in the Al-Mn-Zn system at 400 °C. J. Mater. 2014, 2014, 451587. [Google Scholar] [CrossRef]
- X’Pert HighScore Plus, version 2.2b (2.2.2); PANalytical: Almelo, The Netherlands, 2006.
- Hartmann, U. Magnetic Force Microscopy. Annu. Rev. Mater. Sci. 1999, 29, 53–87. [Google Scholar] [CrossRef]
- Fujii, H.; Satyanarayana, M.V.; Wallace, W.E. Magnetic and crystallographic properties of substituted Ce2Co17−xTx compounds (T = Ti, V, Cr, Mn, Fe, Cu, Zr, and Hf). J. Appl. Phys. 1982, 53, 2371–2373. [Google Scholar] [CrossRef]
- Yang, L.; Dayal, K. Effect of lattice orientation, surface modulation, and applied fields on free-surface domain microstructure in ferroelectrics. Acta Mater. 2011, 59, 6594–6603. [Google Scholar] [CrossRef]
- Denton, A.R.; Ashcroft, N.W. Vegard’s Law. Phys. Rev. A 1991, 43, 3161–3164. [Google Scholar] [CrossRef] [PubMed]
Figure 1.
Isothermal section of Ce-Fe-B system at 700 °C [8].
Figure 1.
Isothermal section of Ce-Fe-B system at 700 °C [8].

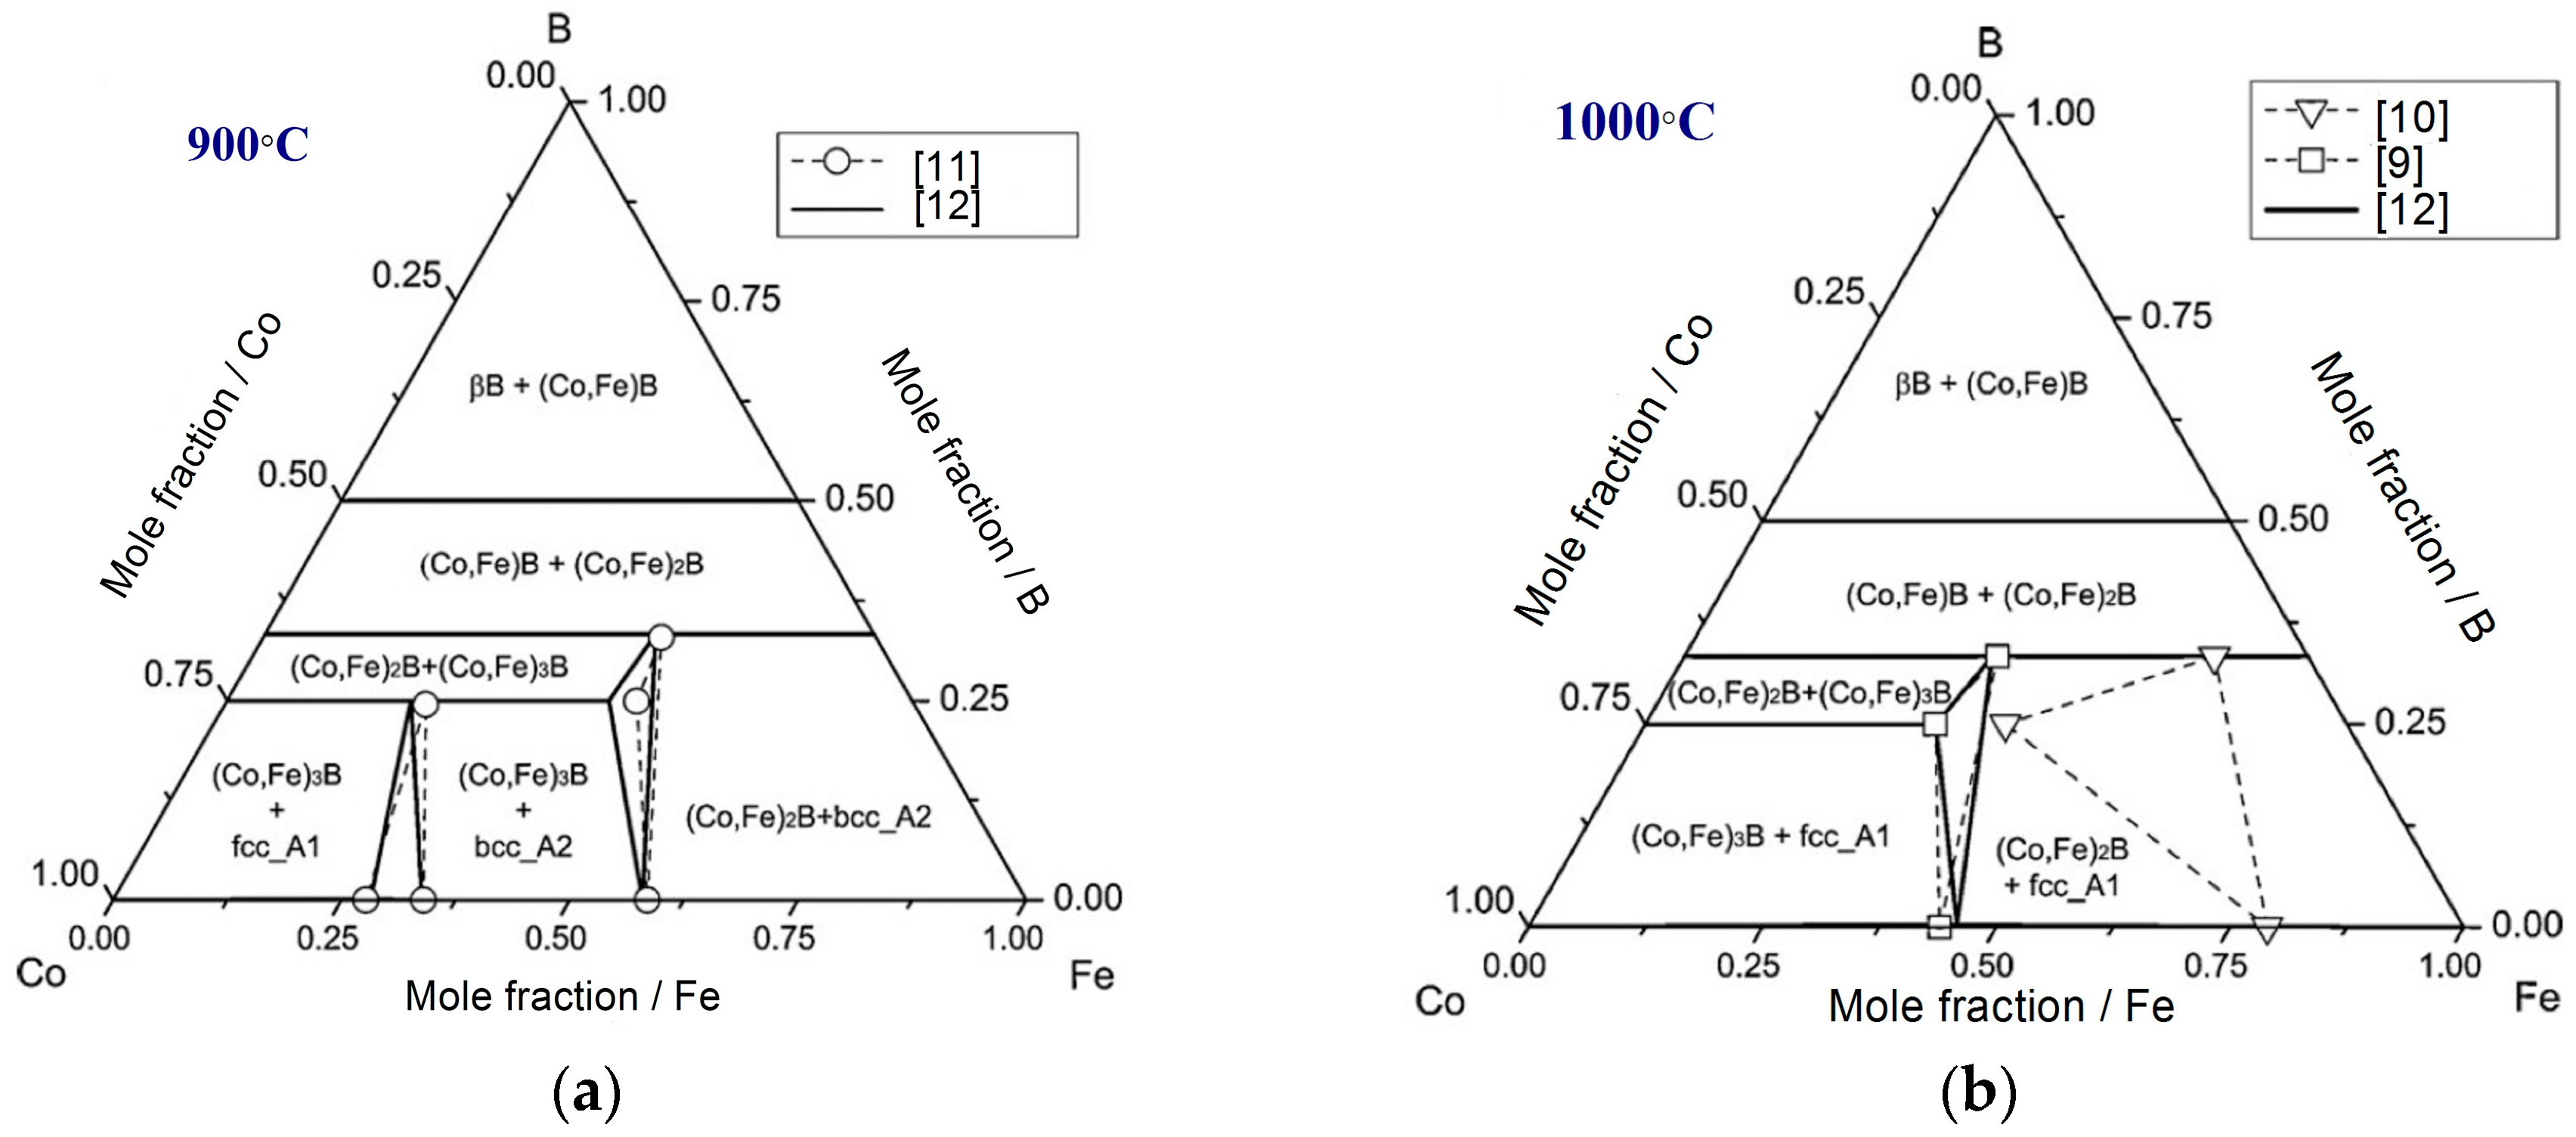
Figure 3.
Isothermal section of B-Ce-Co ternary system at (a) 800 °C and (b) 400 °C redrawn from [13].
Figure 3.
Isothermal section of B-Ce-Co ternary system at (a) 800 °C and (b) 400 °C redrawn from [13].

Figure 4.
(a) Partial liquidus projection of Ce-Co-Fe system [18]; (b) partial isothermal section of Ce-Co-Fe system at 450 °C [18].

Figure 5.
(a) BSE image of DC1; (b) WDS compositional profile of Ce2(Fe, Co)14B in layer 1; (c) WDS compositional profile of Ce2(Fe, Co)17 in layer 2.
Figure 5.
(a) BSE image of DC1; (b) WDS compositional profile of Ce2(Fe, Co)14B in layer 1; (c) WDS compositional profile of Ce2(Fe, Co)17 in layer 2.
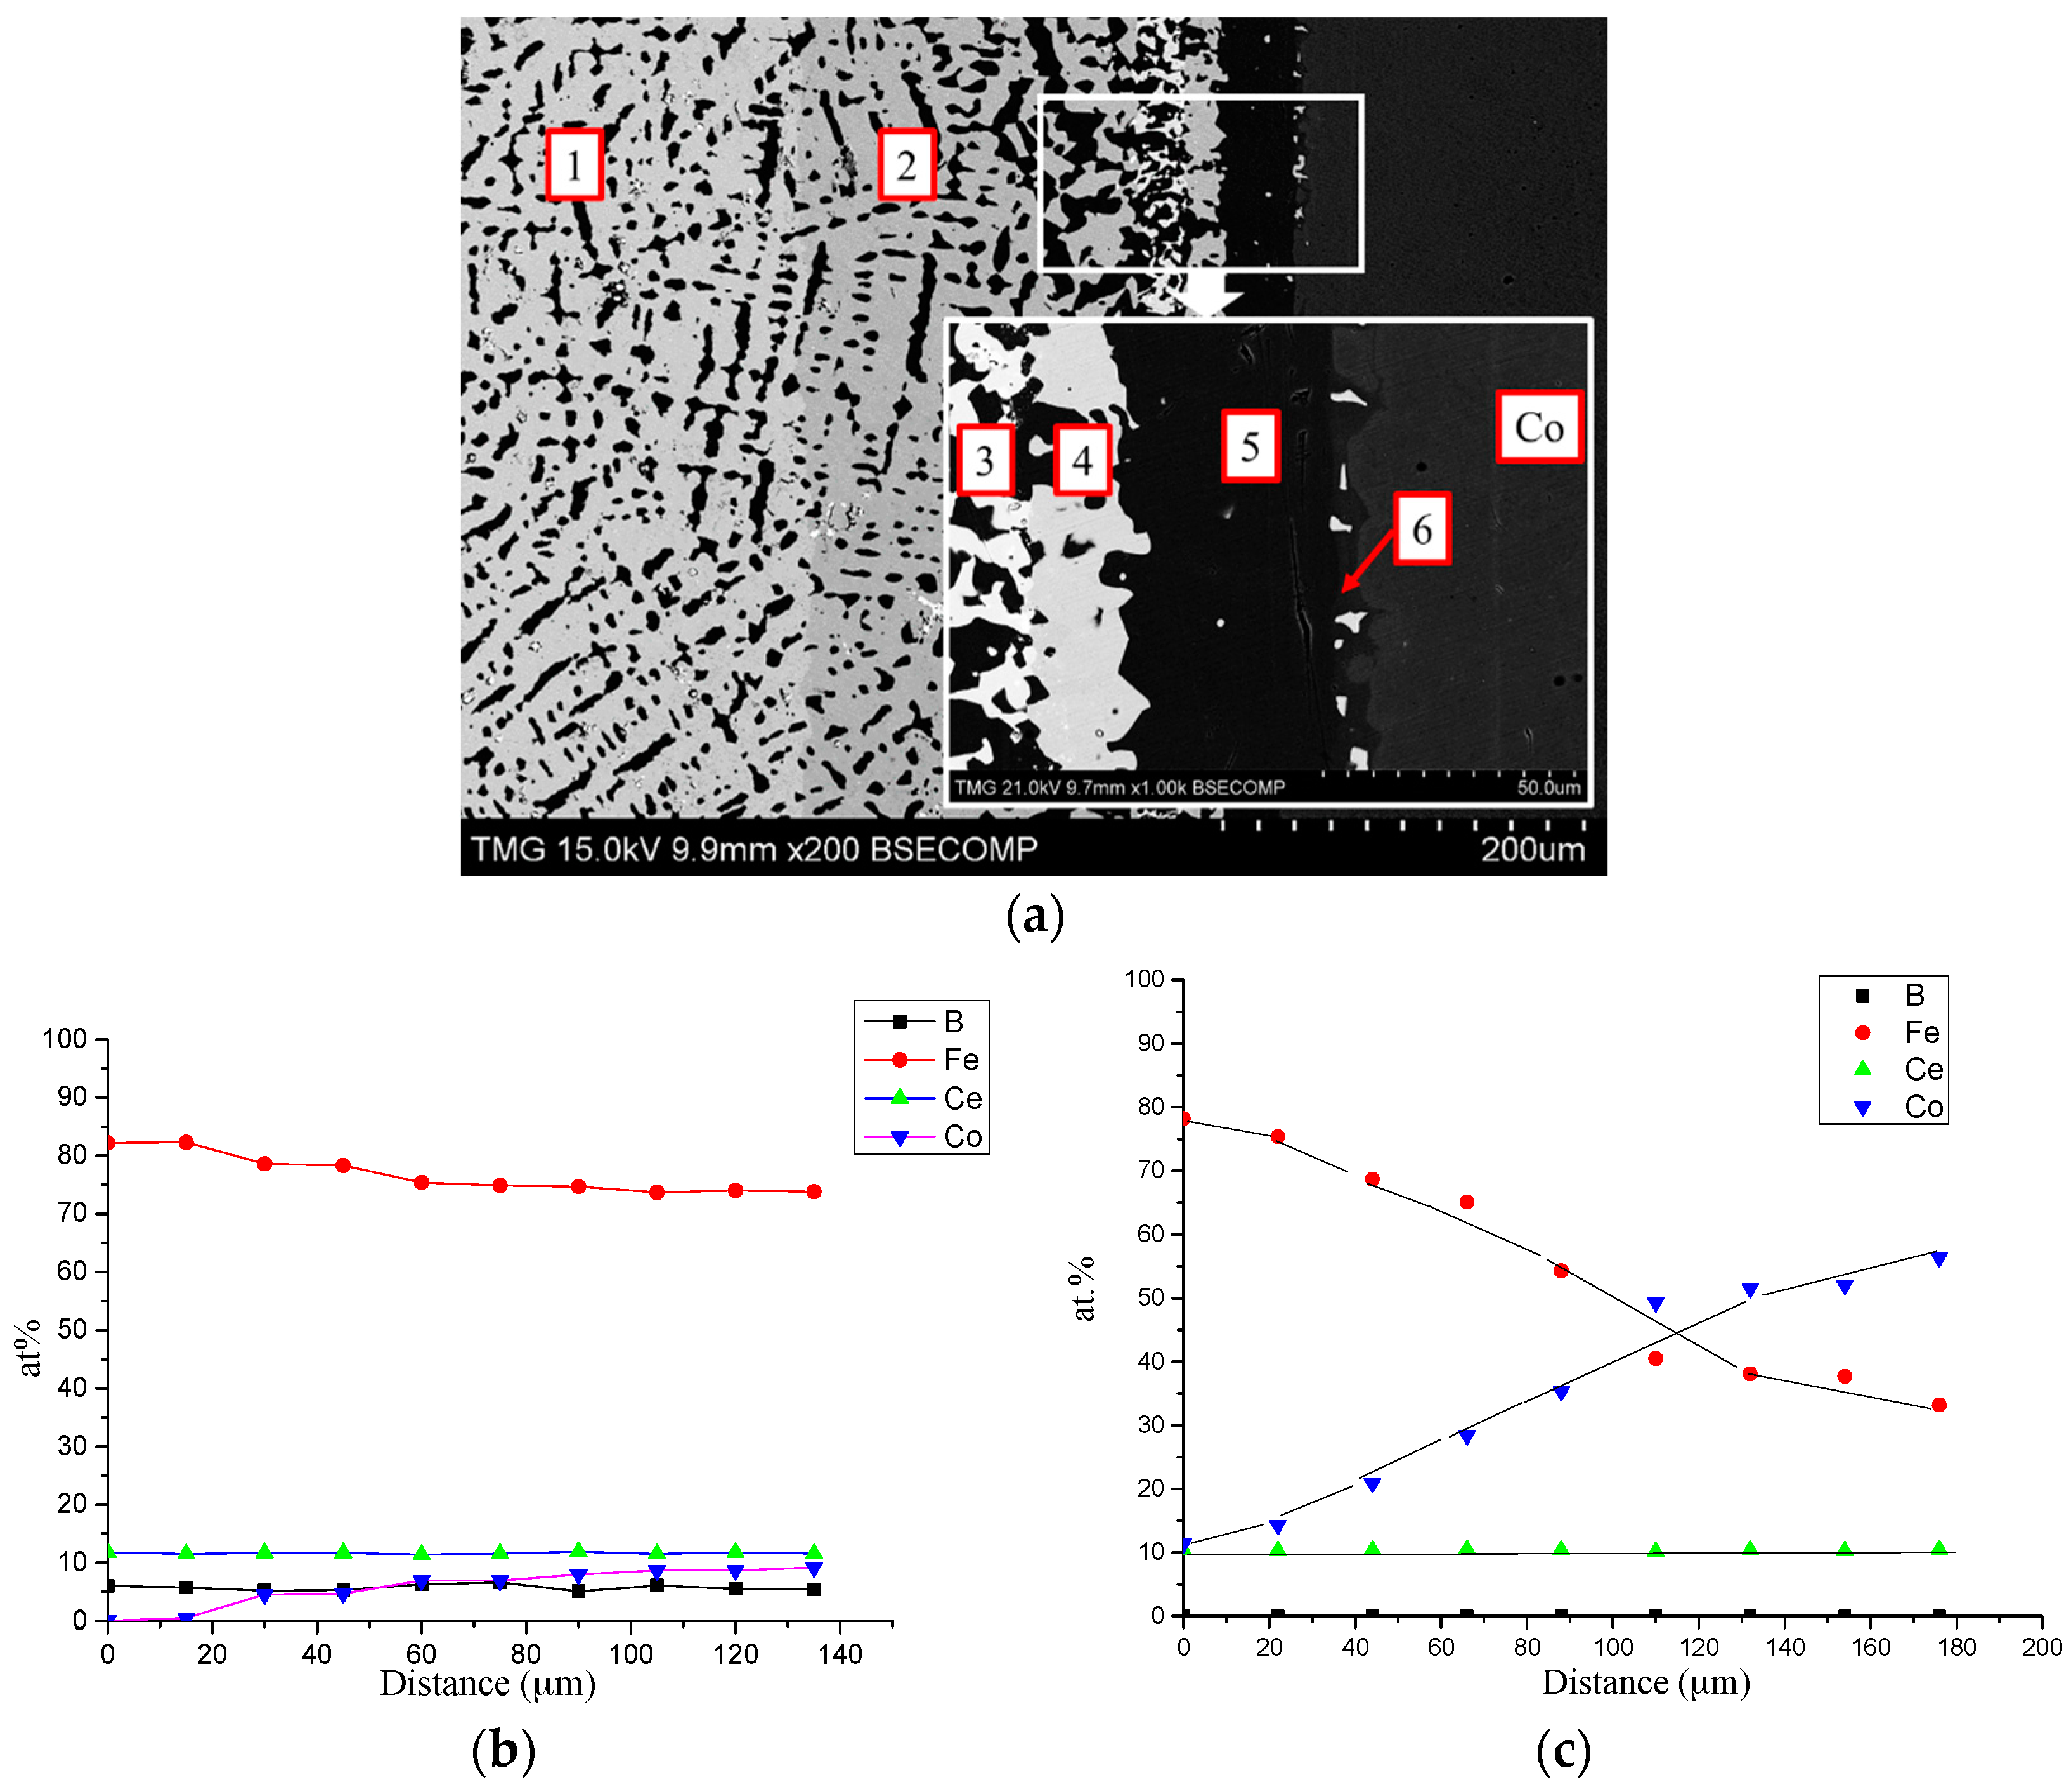
Figure 6.
The results of the diffusion couple 1 at 900 °C: (a) 3D presentation of the experimental results; (b) Fe-Ce-Co ternary system; (c) pseudo ternary section at ~12 at. % Ce; (d) pseudo ternary section at ~16 at. % Ce; (e) phase relations obtained from DC1.
Figure 6.
The results of the diffusion couple 1 at 900 °C: (a) 3D presentation of the experimental results; (b) Fe-Ce-Co ternary system; (c) pseudo ternary section at ~12 at. % Ce; (d) pseudo ternary section at ~16 at. % Ce; (e) phase relations obtained from DC1.


Figure 7.
(a) BSE image of DC4; (b) WDS compositional profile of Ce3(Co, Fe)11B4 in layer 2; (c) WDS compositional profile of Ce(Co, Fe)12B6 in layer 3.
Figure 7.
(a) BSE image of DC4; (b) WDS compositional profile of Ce3(Co, Fe)11B4 in layer 2; (c) WDS compositional profile of Ce(Co, Fe)12B6 in layer 3.

Figure 8.
The results of the diffusion couple 4 at 900 °C: (a) 3D presentation of the experimental results; (b) Fe-Ce-Co ternary system; (c) pseudo ternary section at ~6 at. % Ce; (d) pseudo ternary section at ~12 at. % Ce; (e) pseudo ternary section at ~16 at. % Ce; (f) phase relations obtained from DC4.

Figure 9.
The diffusion couples results of the Ce-Fe-Co-B system at 900 °C: (a) 3D presentation of the experimental results; (b) Fe-Ce-Co ternary system; (c) pseudo ternary section at ~6 at. % Ce; (d) pseudo ternary section at ~12 at. % Ce; (e) pseudo ternary section at ~16 at. % Ce.
Figure 9.
The diffusion couples results of the Ce-Fe-Co-B system at 900 °C: (a) 3D presentation of the experimental results; (b) Fe-Ce-Co ternary system; (c) pseudo ternary section at ~6 at. % Ce; (d) pseudo ternary section at ~12 at. % Ce; (e) pseudo ternary section at ~16 at. % Ce.

Figure 10.
Microstructure (top) and three MFM images (a–c) obtained from layer 1 to the interface with layer 2 of DC1.
Figure 10.
Microstructure (top) and three MFM images (a–c) obtained from layer 1 to the interface with layer 2 of DC1.

Figure 11.
Microstructure (top) and two MFM images: (a) MFM test on layers 2–4 of DC4; (b) MFM test on the interface between layers 1 and 2 of DC4.
Figure 11.
Microstructure (top) and two MFM images: (a) MFM test on layers 2–4 of DC4; (b) MFM test on the interface between layers 1 and 2 of DC4.

Figure 12.
(a) BSE image of KA 1; (b) MFM image of KA 1; (c) XRD spectrum of KA 1.
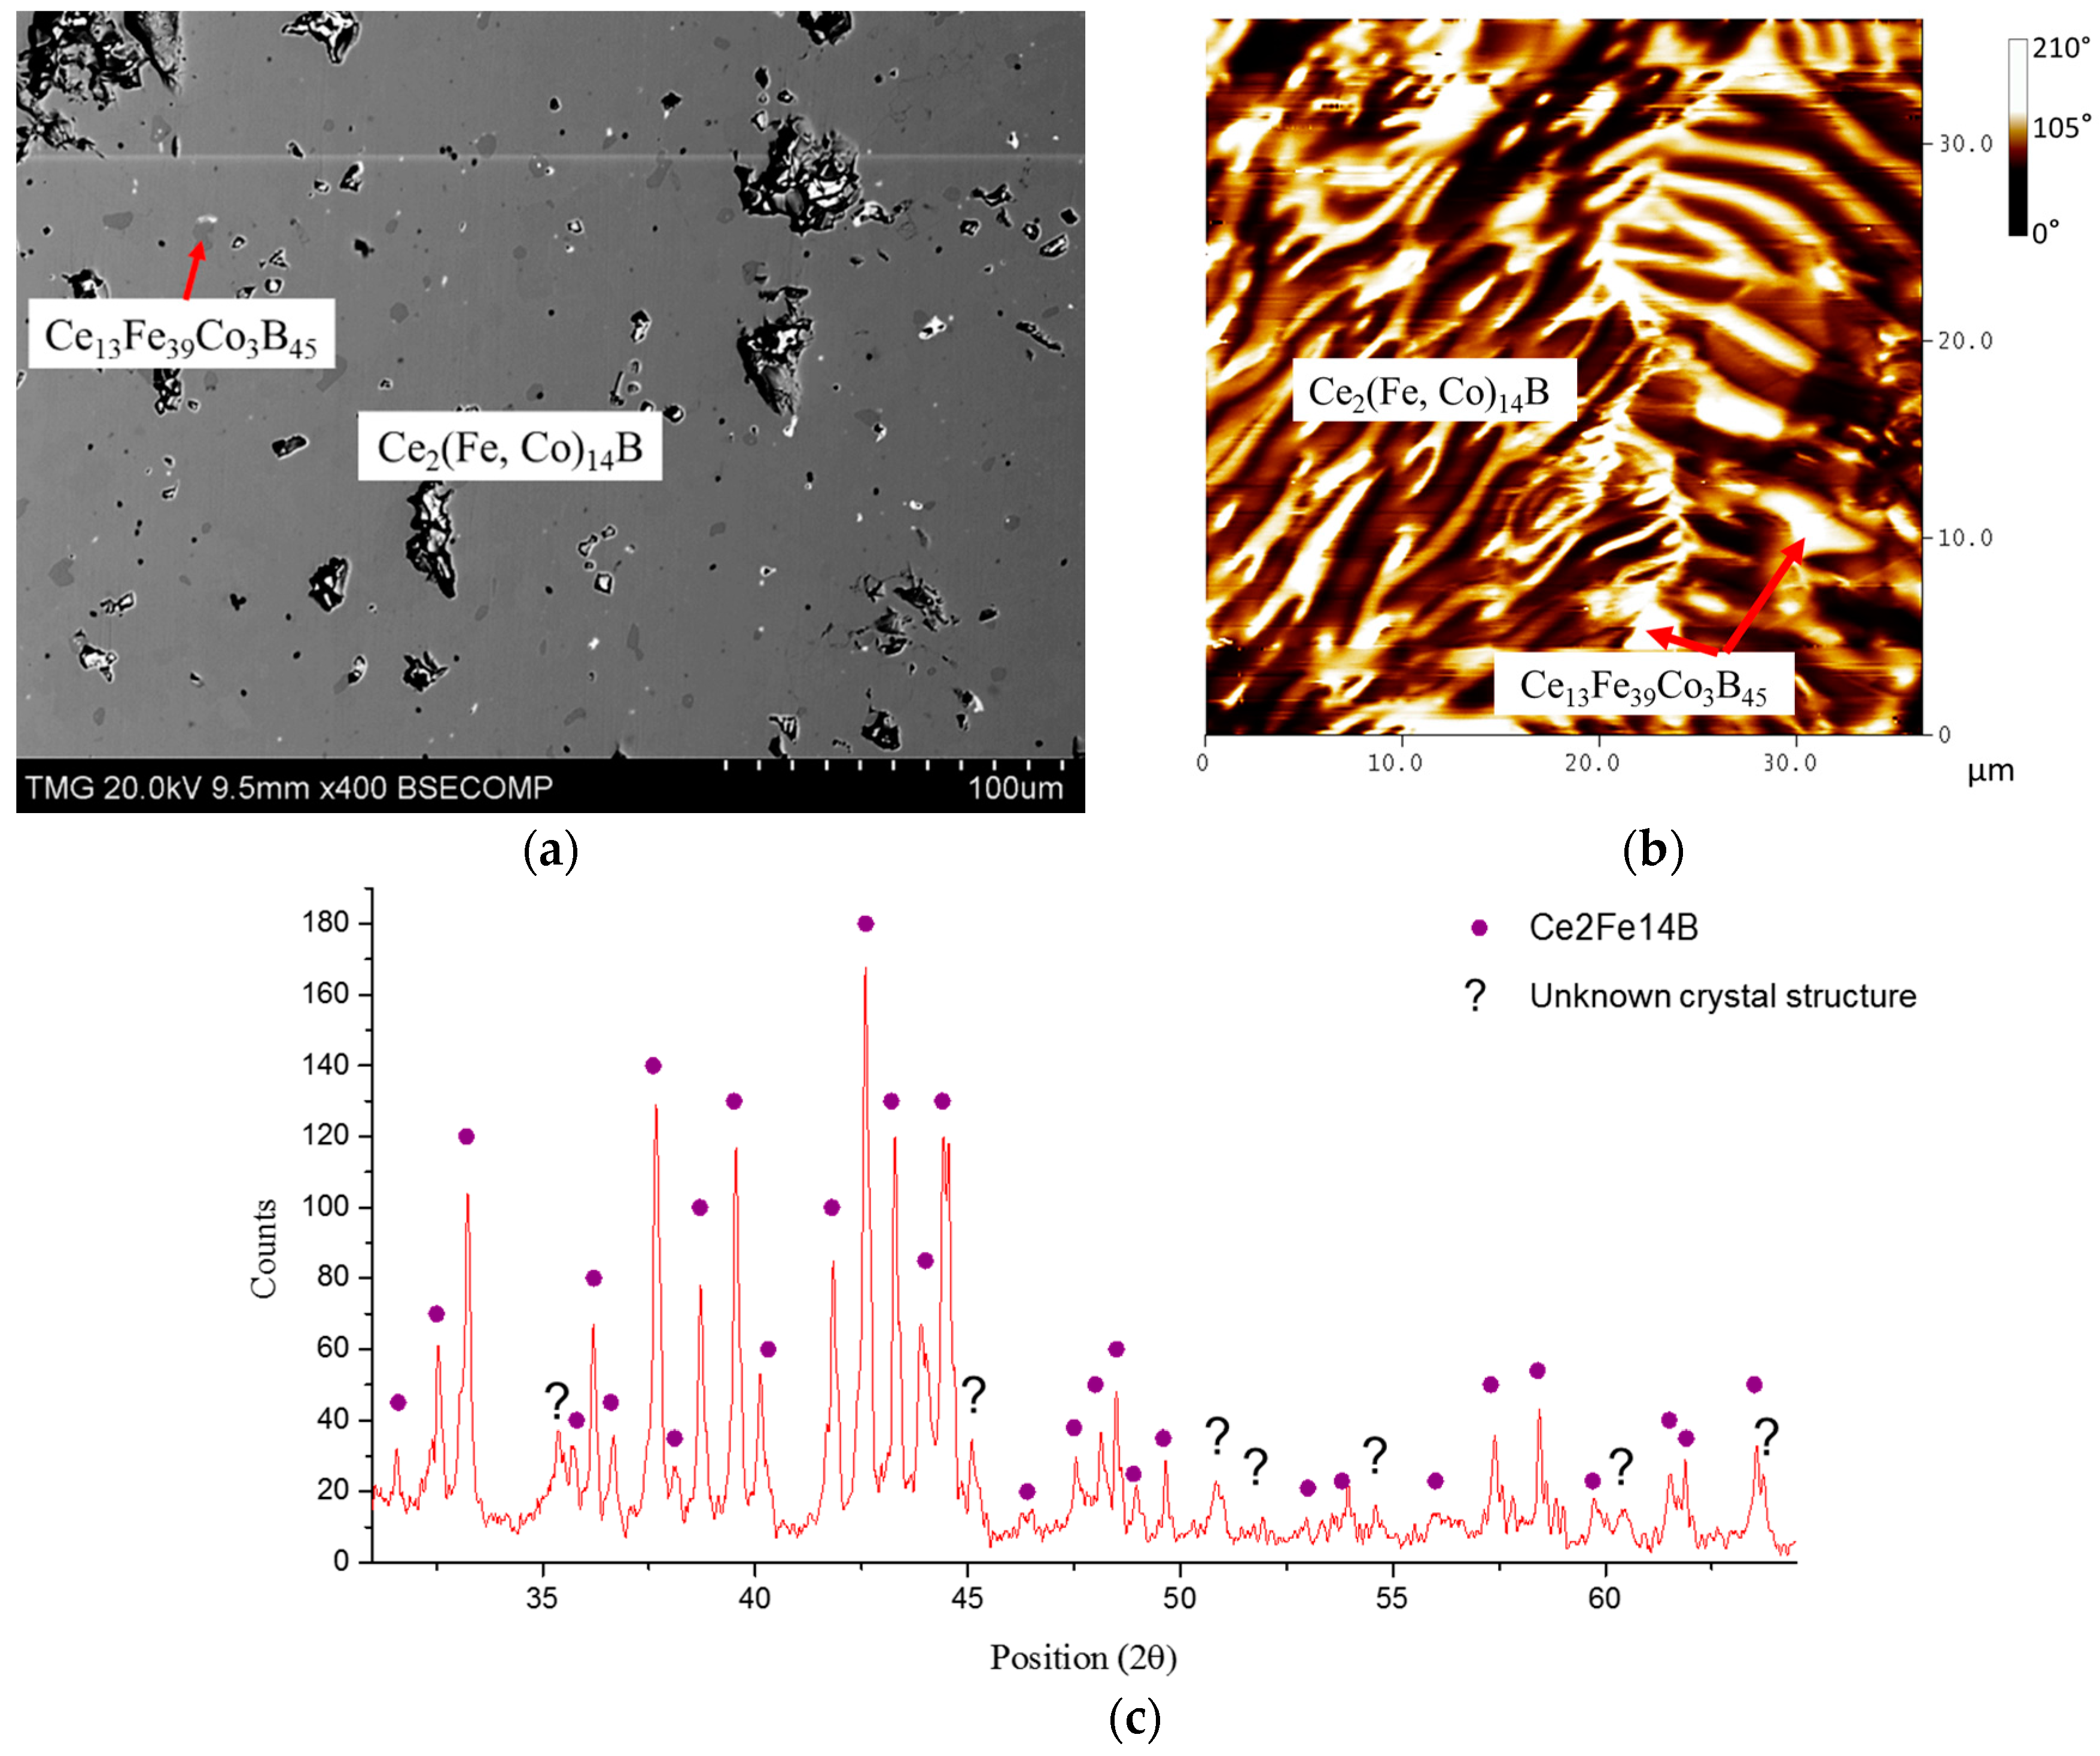
Figure 13.
(a) BSE image of KA 2; (b) MFM image of KA 2; (c) XRD spectrum of KA 2.

Figure 14.
(a) BSE image of KA 4; (b) BSE image of KA 5; (c) MFM image of KA 5.
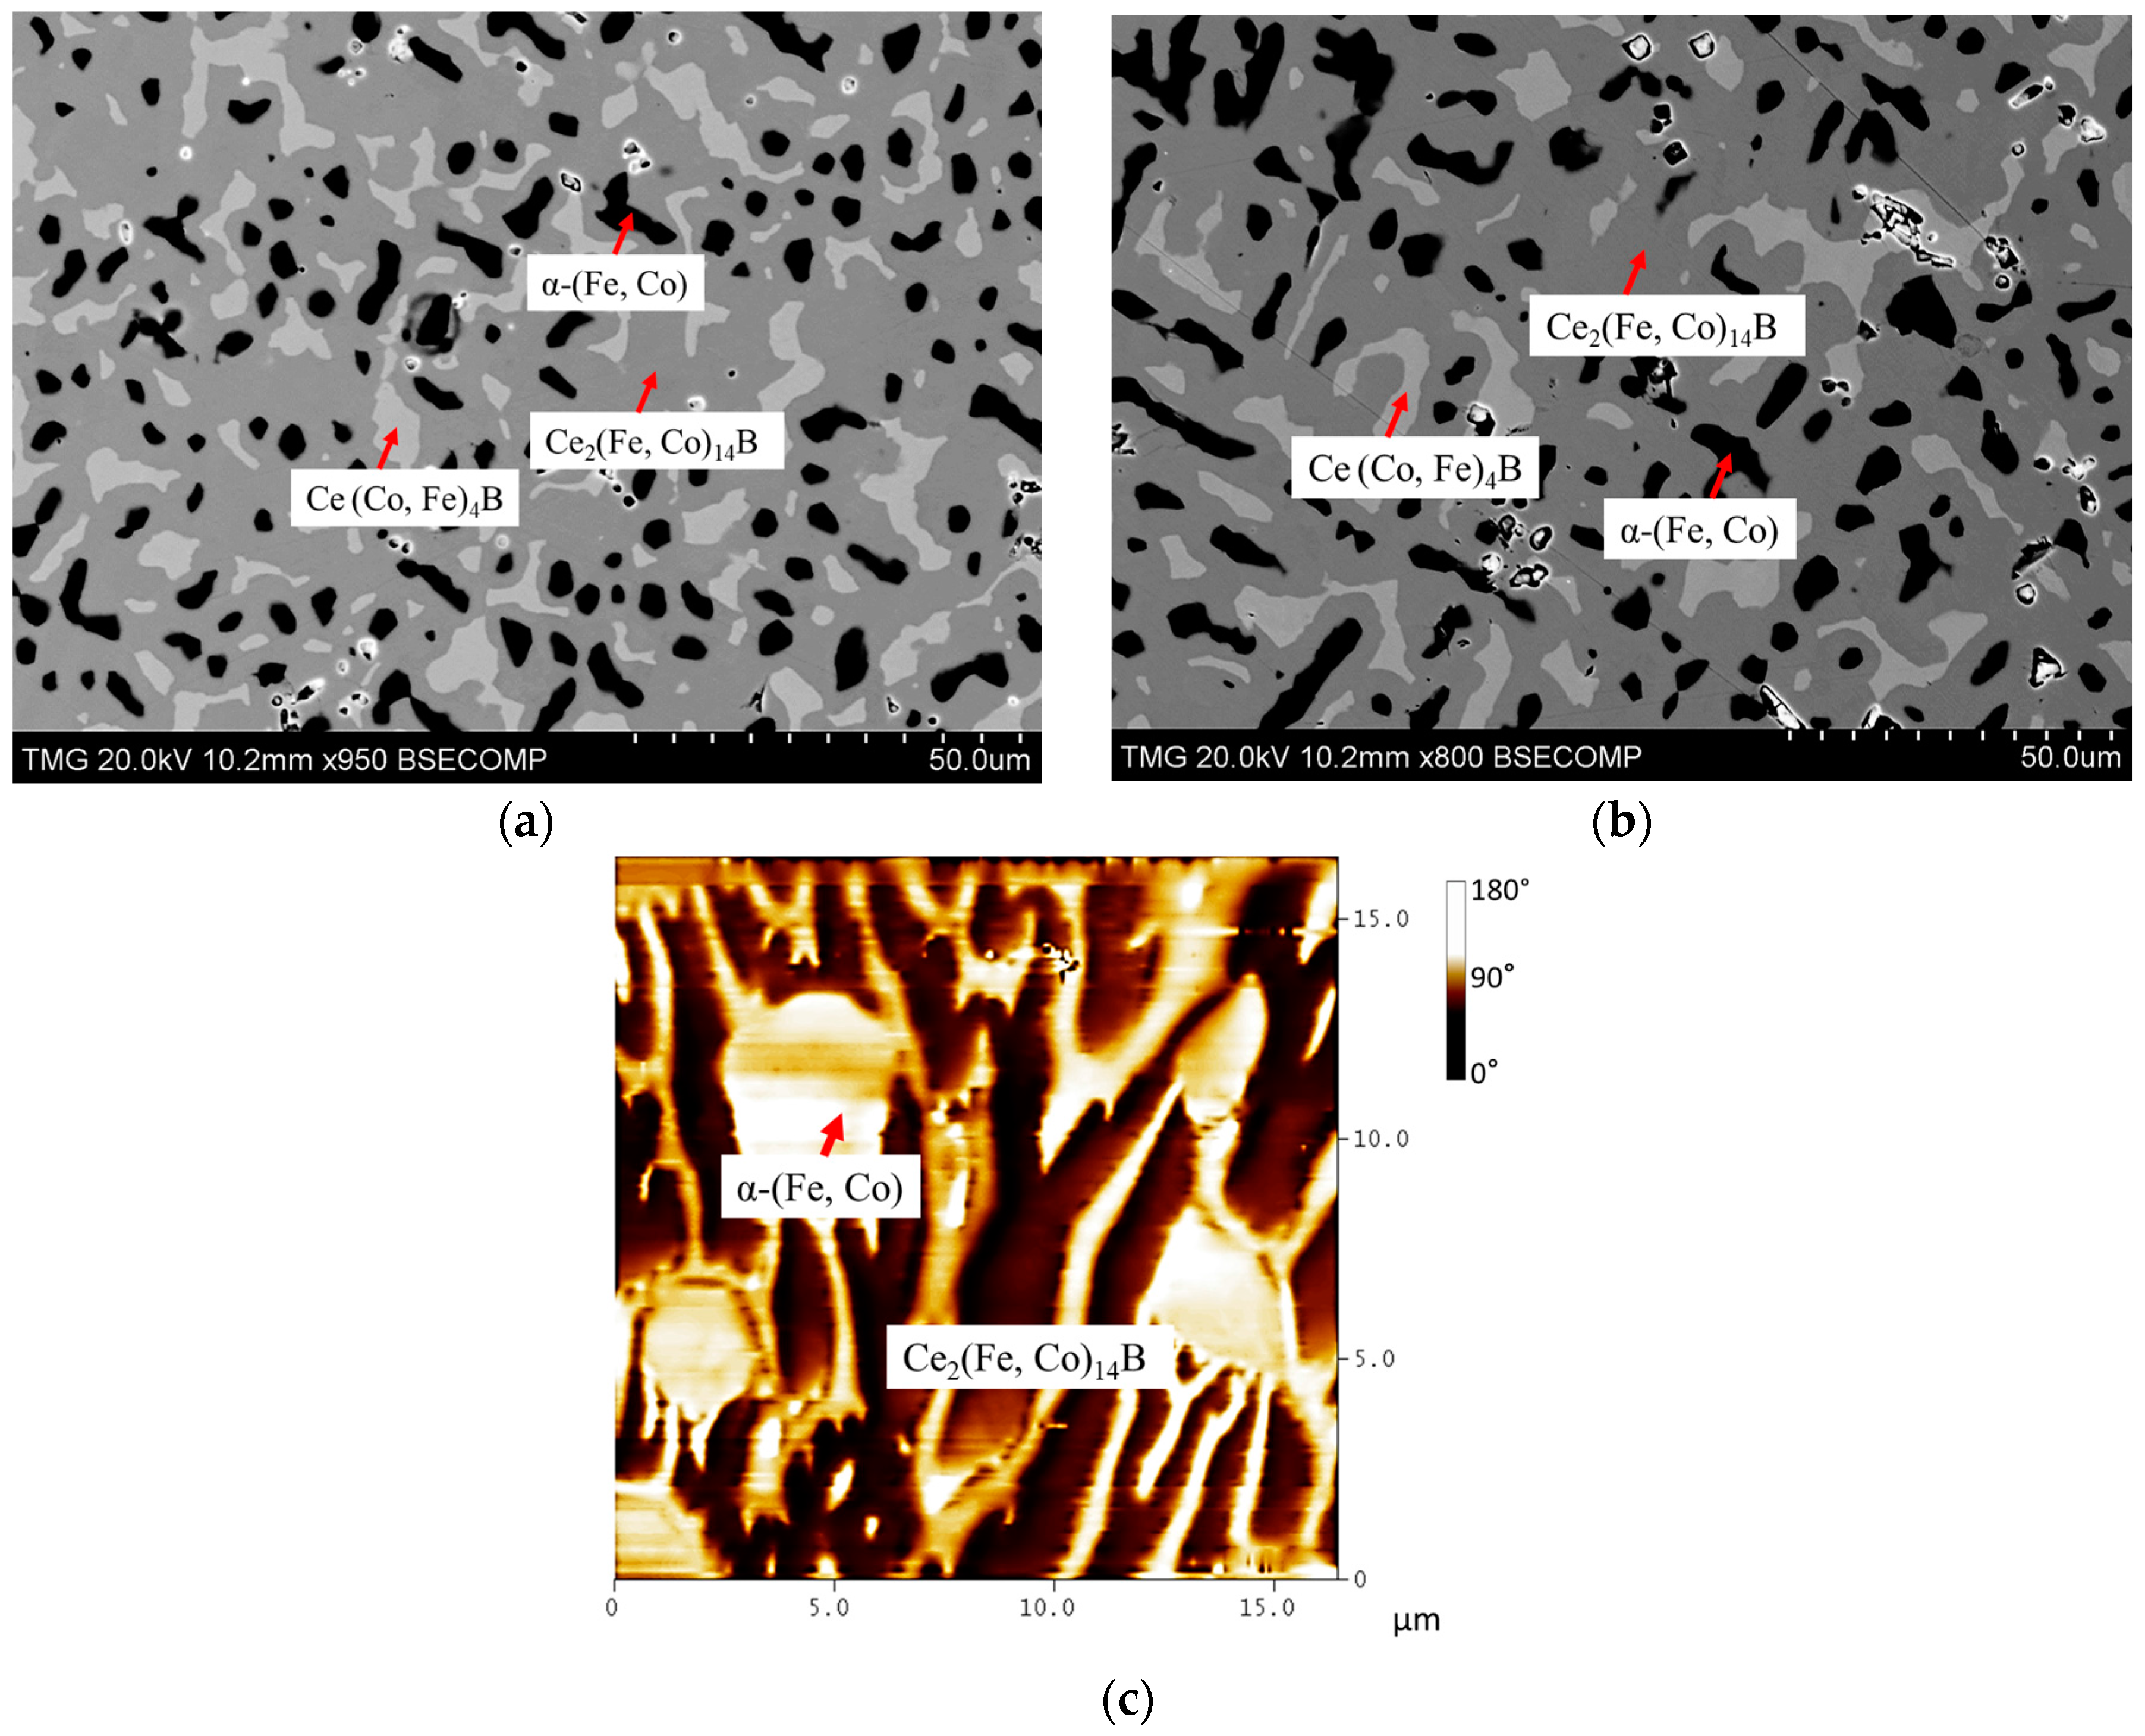
Figure 15.
(a) BSE image of KA 6; (b) MFM image of KA 6; (c) XRD spectrum of KA 6.

Figure 16.
Homogeneity ranges of Ce2(Fe, Co)14B, and Ce(Co, Fe)4B obtained from key alloys: (a) 3D presentation of the experimental results; (b) Fe-Ce-Co ternary system; (c) pseudo ternary section at ~12 at. % Ce; (d) pseudo ternary section at ~16 at. % Ce; (e) phase relations obtained from KAs 1–8.

Figure 17.
Cell parameters a and c (a) and lattice volume V (b) with Co concentration for the Ce2(Fe, Co)14B from KAs 1–5.
Figure 17.
Cell parameters a and c (a) and lattice volume V (b) with Co concentration for the Ce2(Fe, Co)14B from KAs 1–5.

Figure 18.
Cell parameters a and c (a) and lattice volume V (b) with Co concentration for the Ce(Co, Fe)4B from KAs 2–6.
Figure 18.
Cell parameters a and c (a) and lattice volume V (b) with Co concentration for the Ce(Co, Fe)4B from KAs 2–6.

Figure 19.
(a) BSE image of KA 9; (b) MFM image of KA 9; (c) XRD spectrum of KA 9.

Figure 20.
(a) BSE image of KA 11; (b) BSE image of KA 12; (c) BSE image of KA 13; (d) BSE image of KA 14; (e) MFM image of KA 11; (f) MFM image of KA 12; (g) XRD spectrum of KA 12.
Figure 20.
(a) BSE image of KA 11; (b) BSE image of KA 12; (c) BSE image of KA 13; (d) BSE image of KA 14; (e) MFM image of KA 11; (f) MFM image of KA 12; (g) XRD spectrum of KA 12.
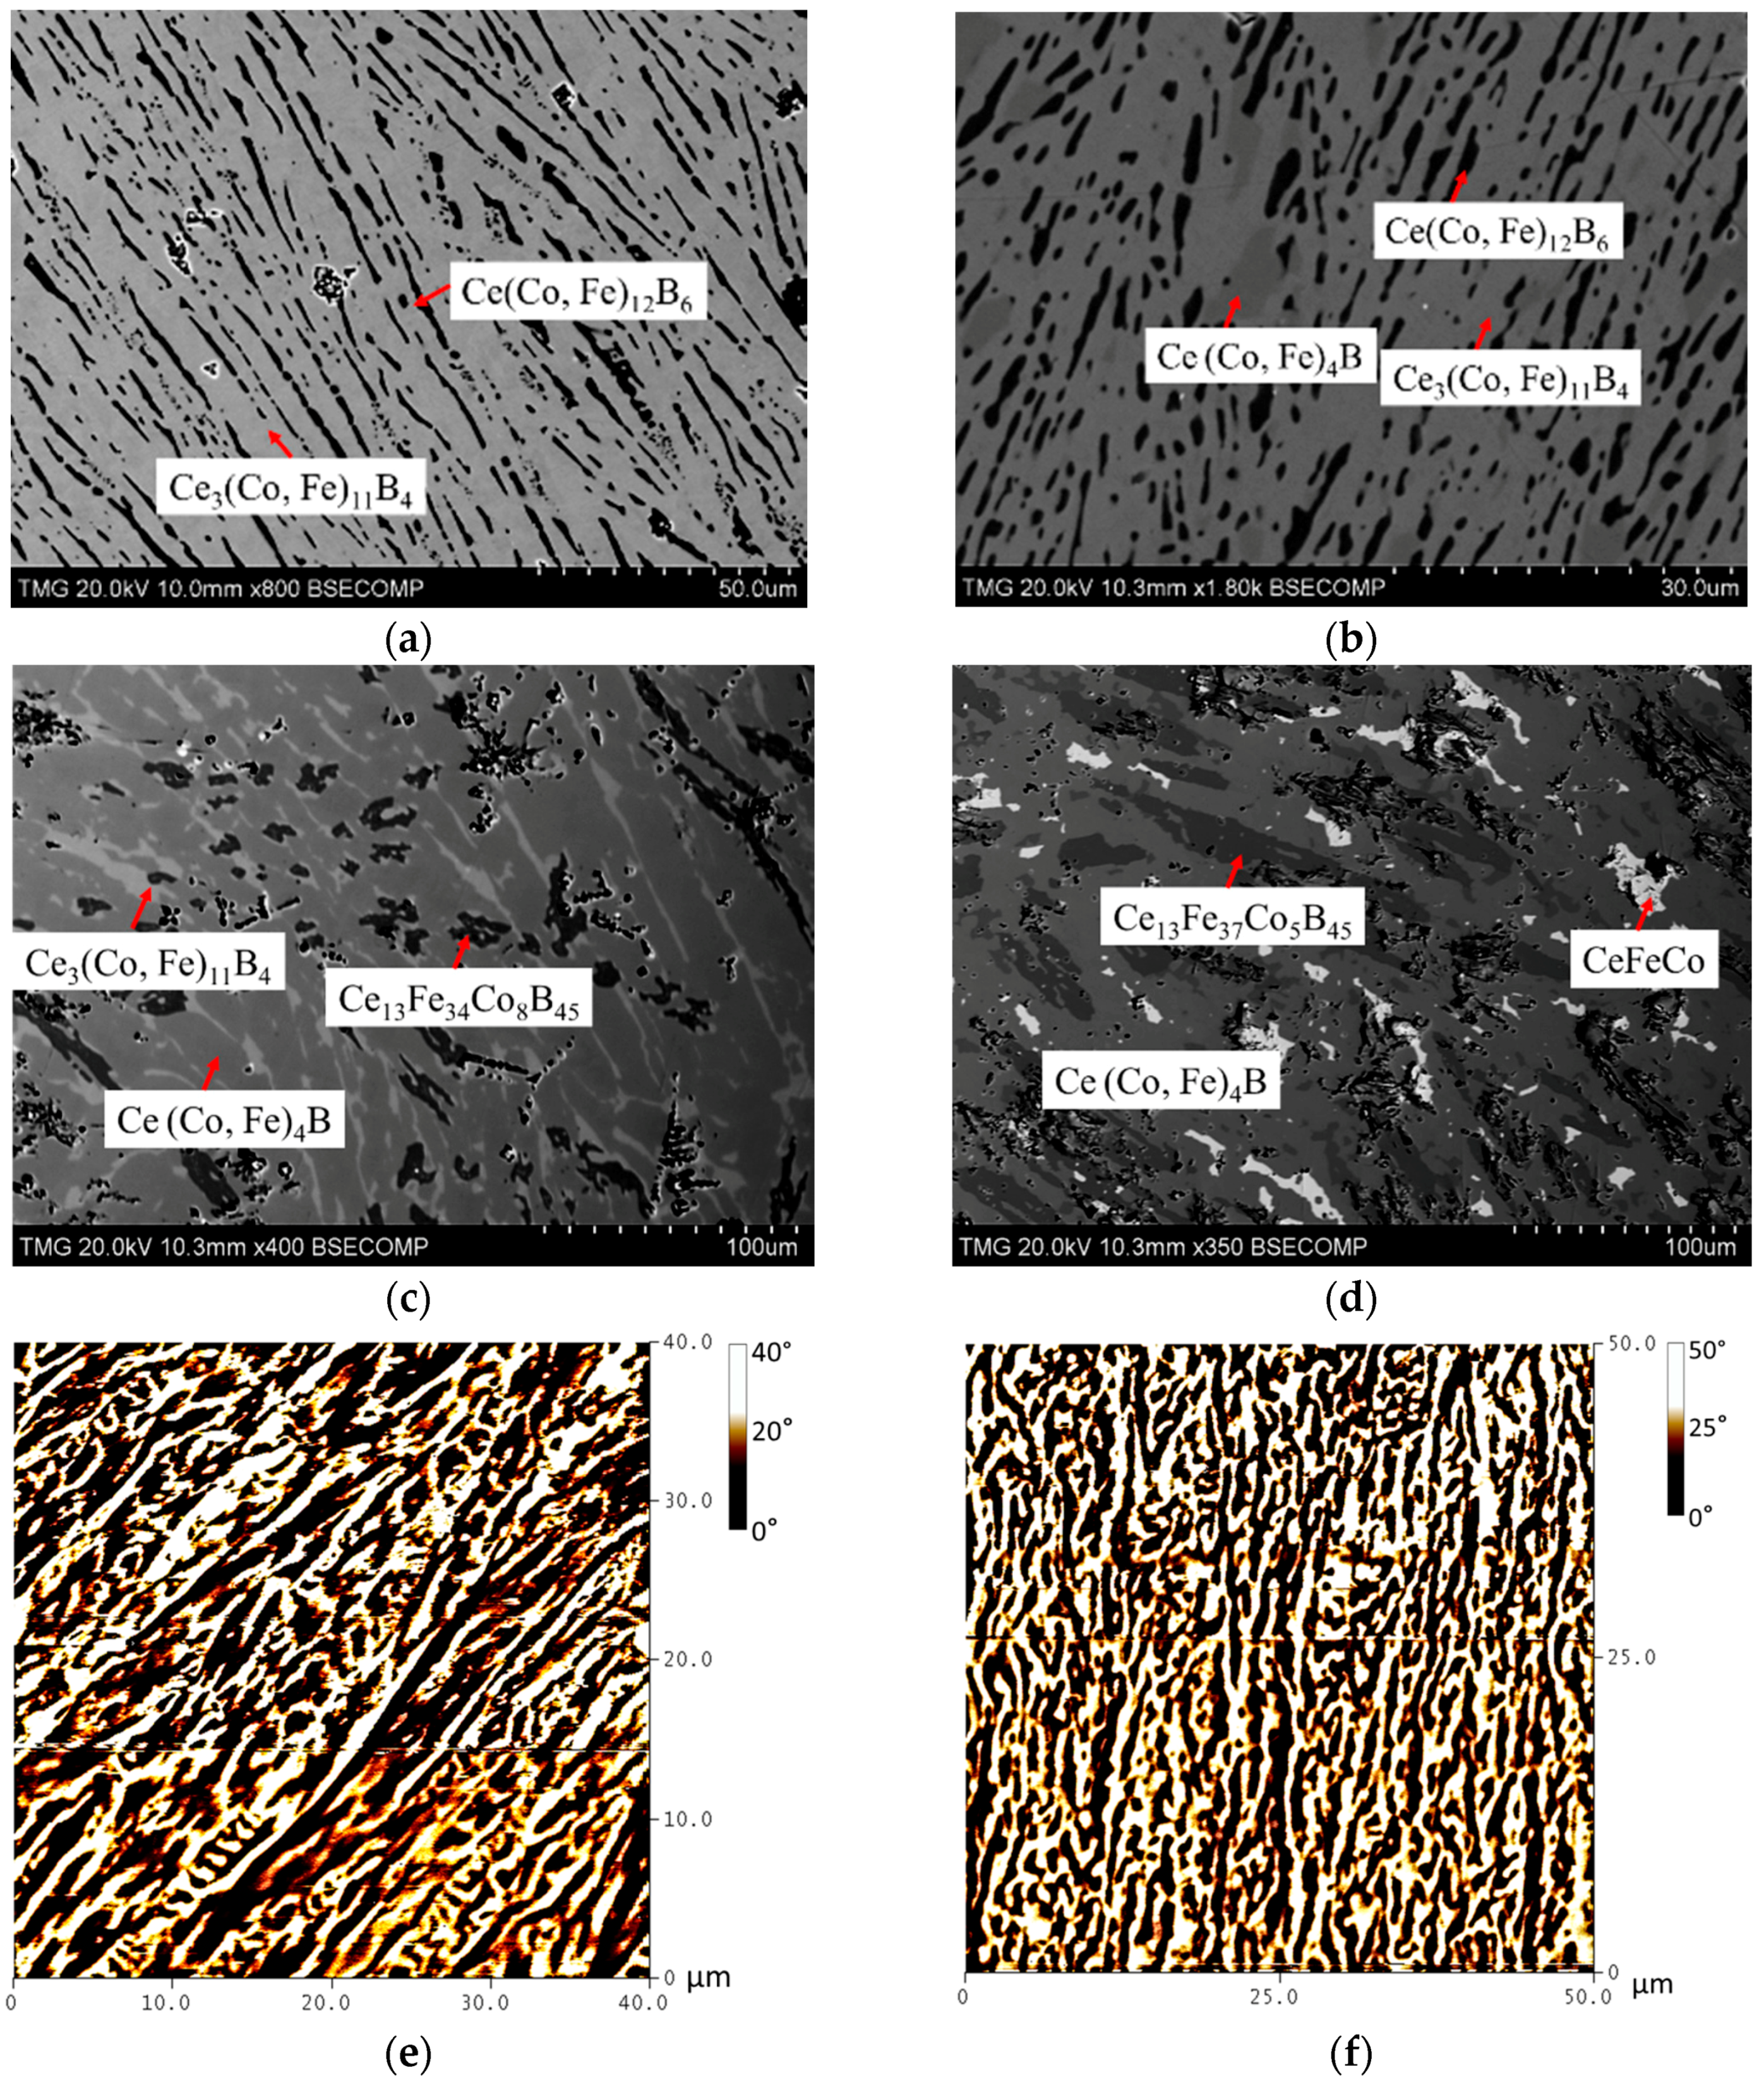

Figure 21.
Cell parameters a and c (a) and lattice volume V (b) with Co concentration for the Ce3(Co, Fe)11B4 from KAs 10–13.
Figure 21.
Cell parameters a and c (a) and lattice volume V (b) with Co concentration for the Ce3(Co, Fe)11B4 from KAs 10–13.
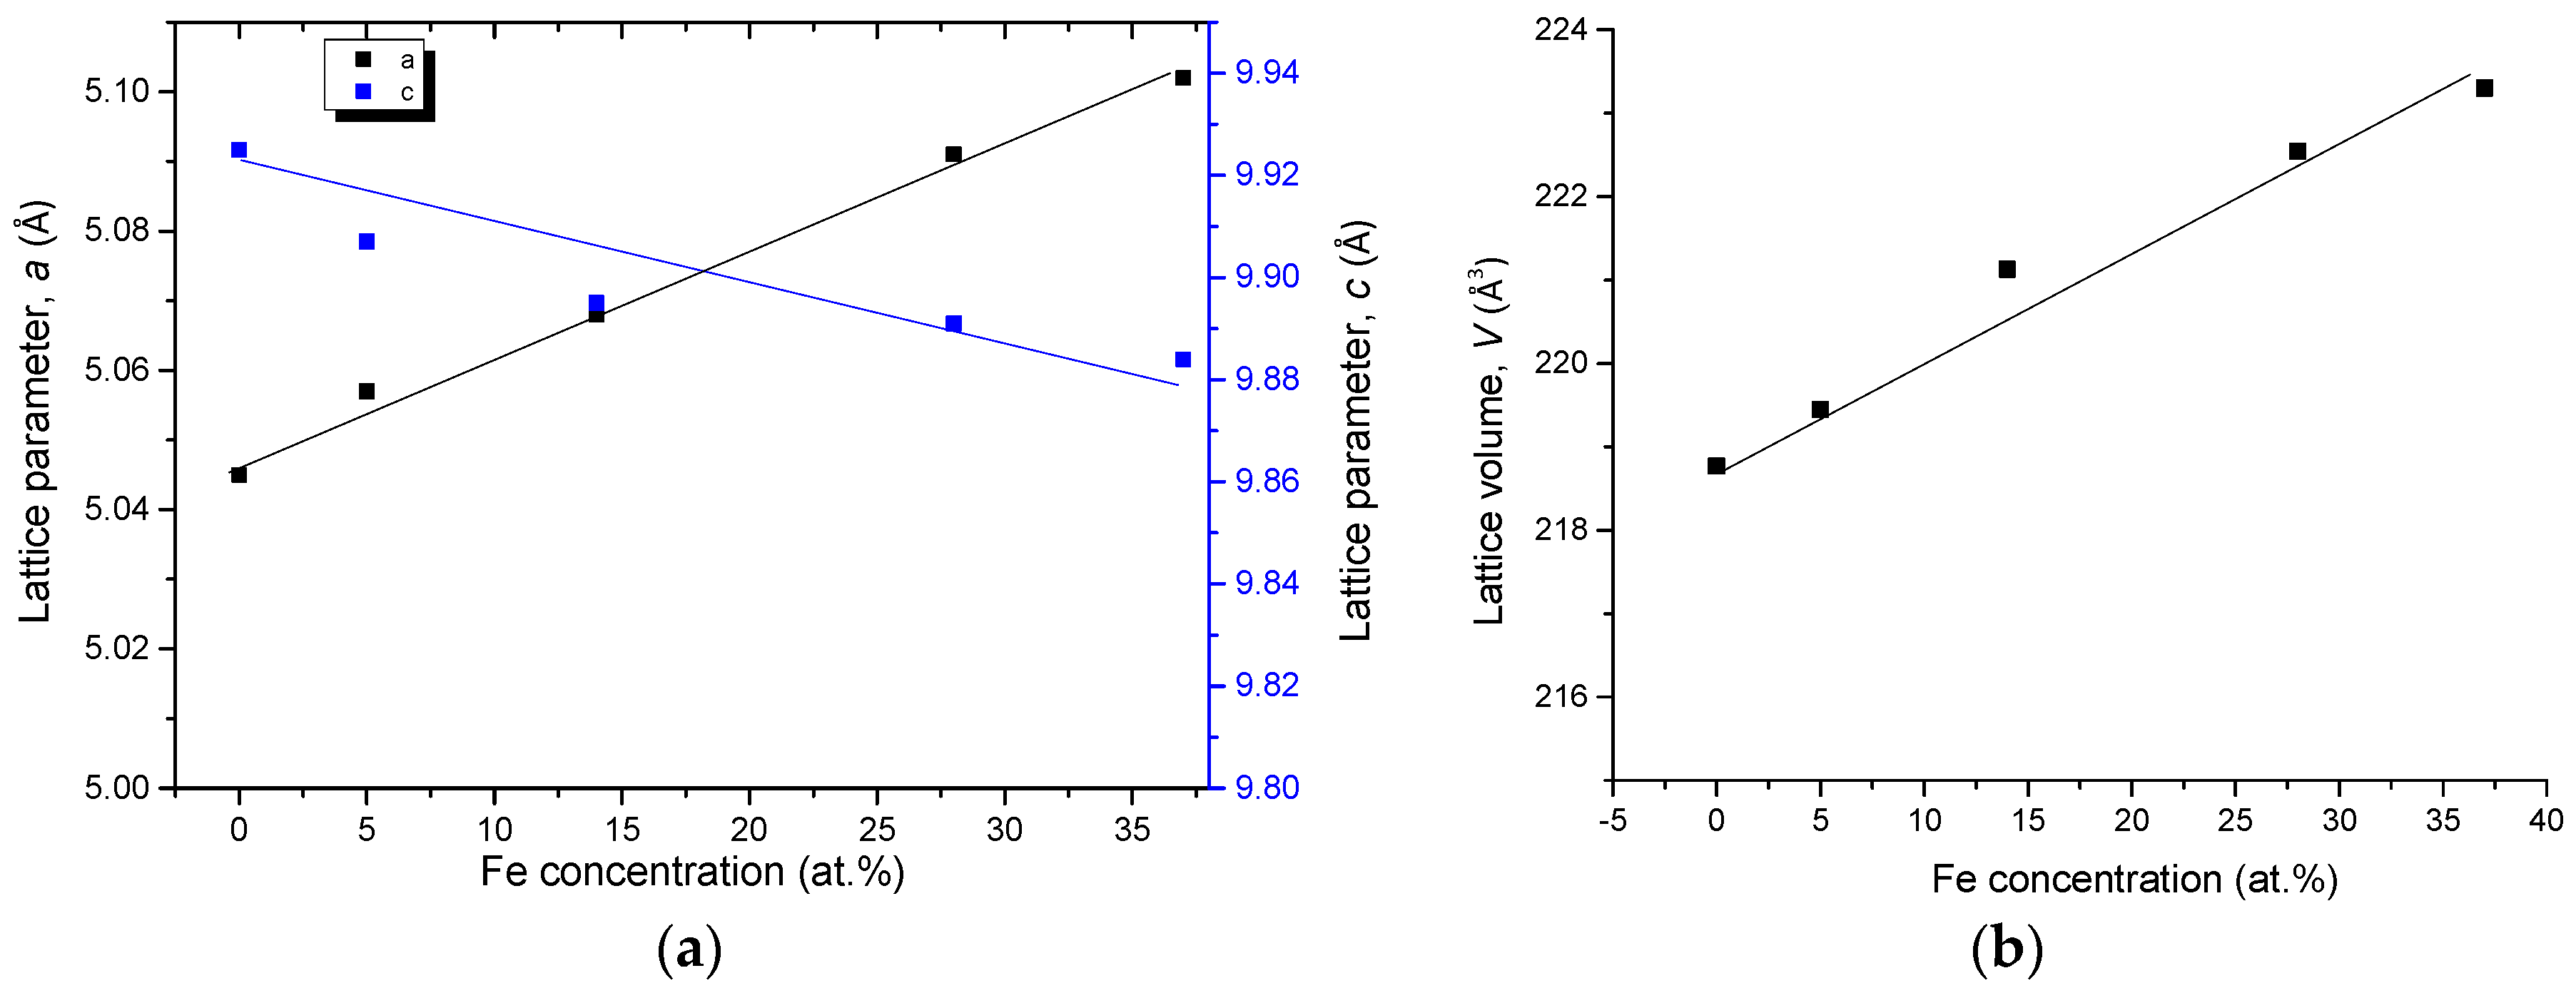
Figure 22.
Homogeneity ranges of Ce3(Co, Fe)11B4 and Ce(Co, Fe)12B6 obtained from key alloys: (a) 3D presentation of the experimental results; (b) pseudo ternary section at ~6 at. % Ce; (c) pseudo ternary section at ~16 at. % Ce; (d) phase relations obtained from the key alloys.
Figure 22.
Homogeneity ranges of Ce3(Co, Fe)11B4 and Ce(Co, Fe)12B6 obtained from key alloys: (a) 3D presentation of the experimental results; (b) pseudo ternary section at ~6 at. % Ce; (c) pseudo ternary section at ~16 at. % Ce; (d) phase relations obtained from the key alloys.
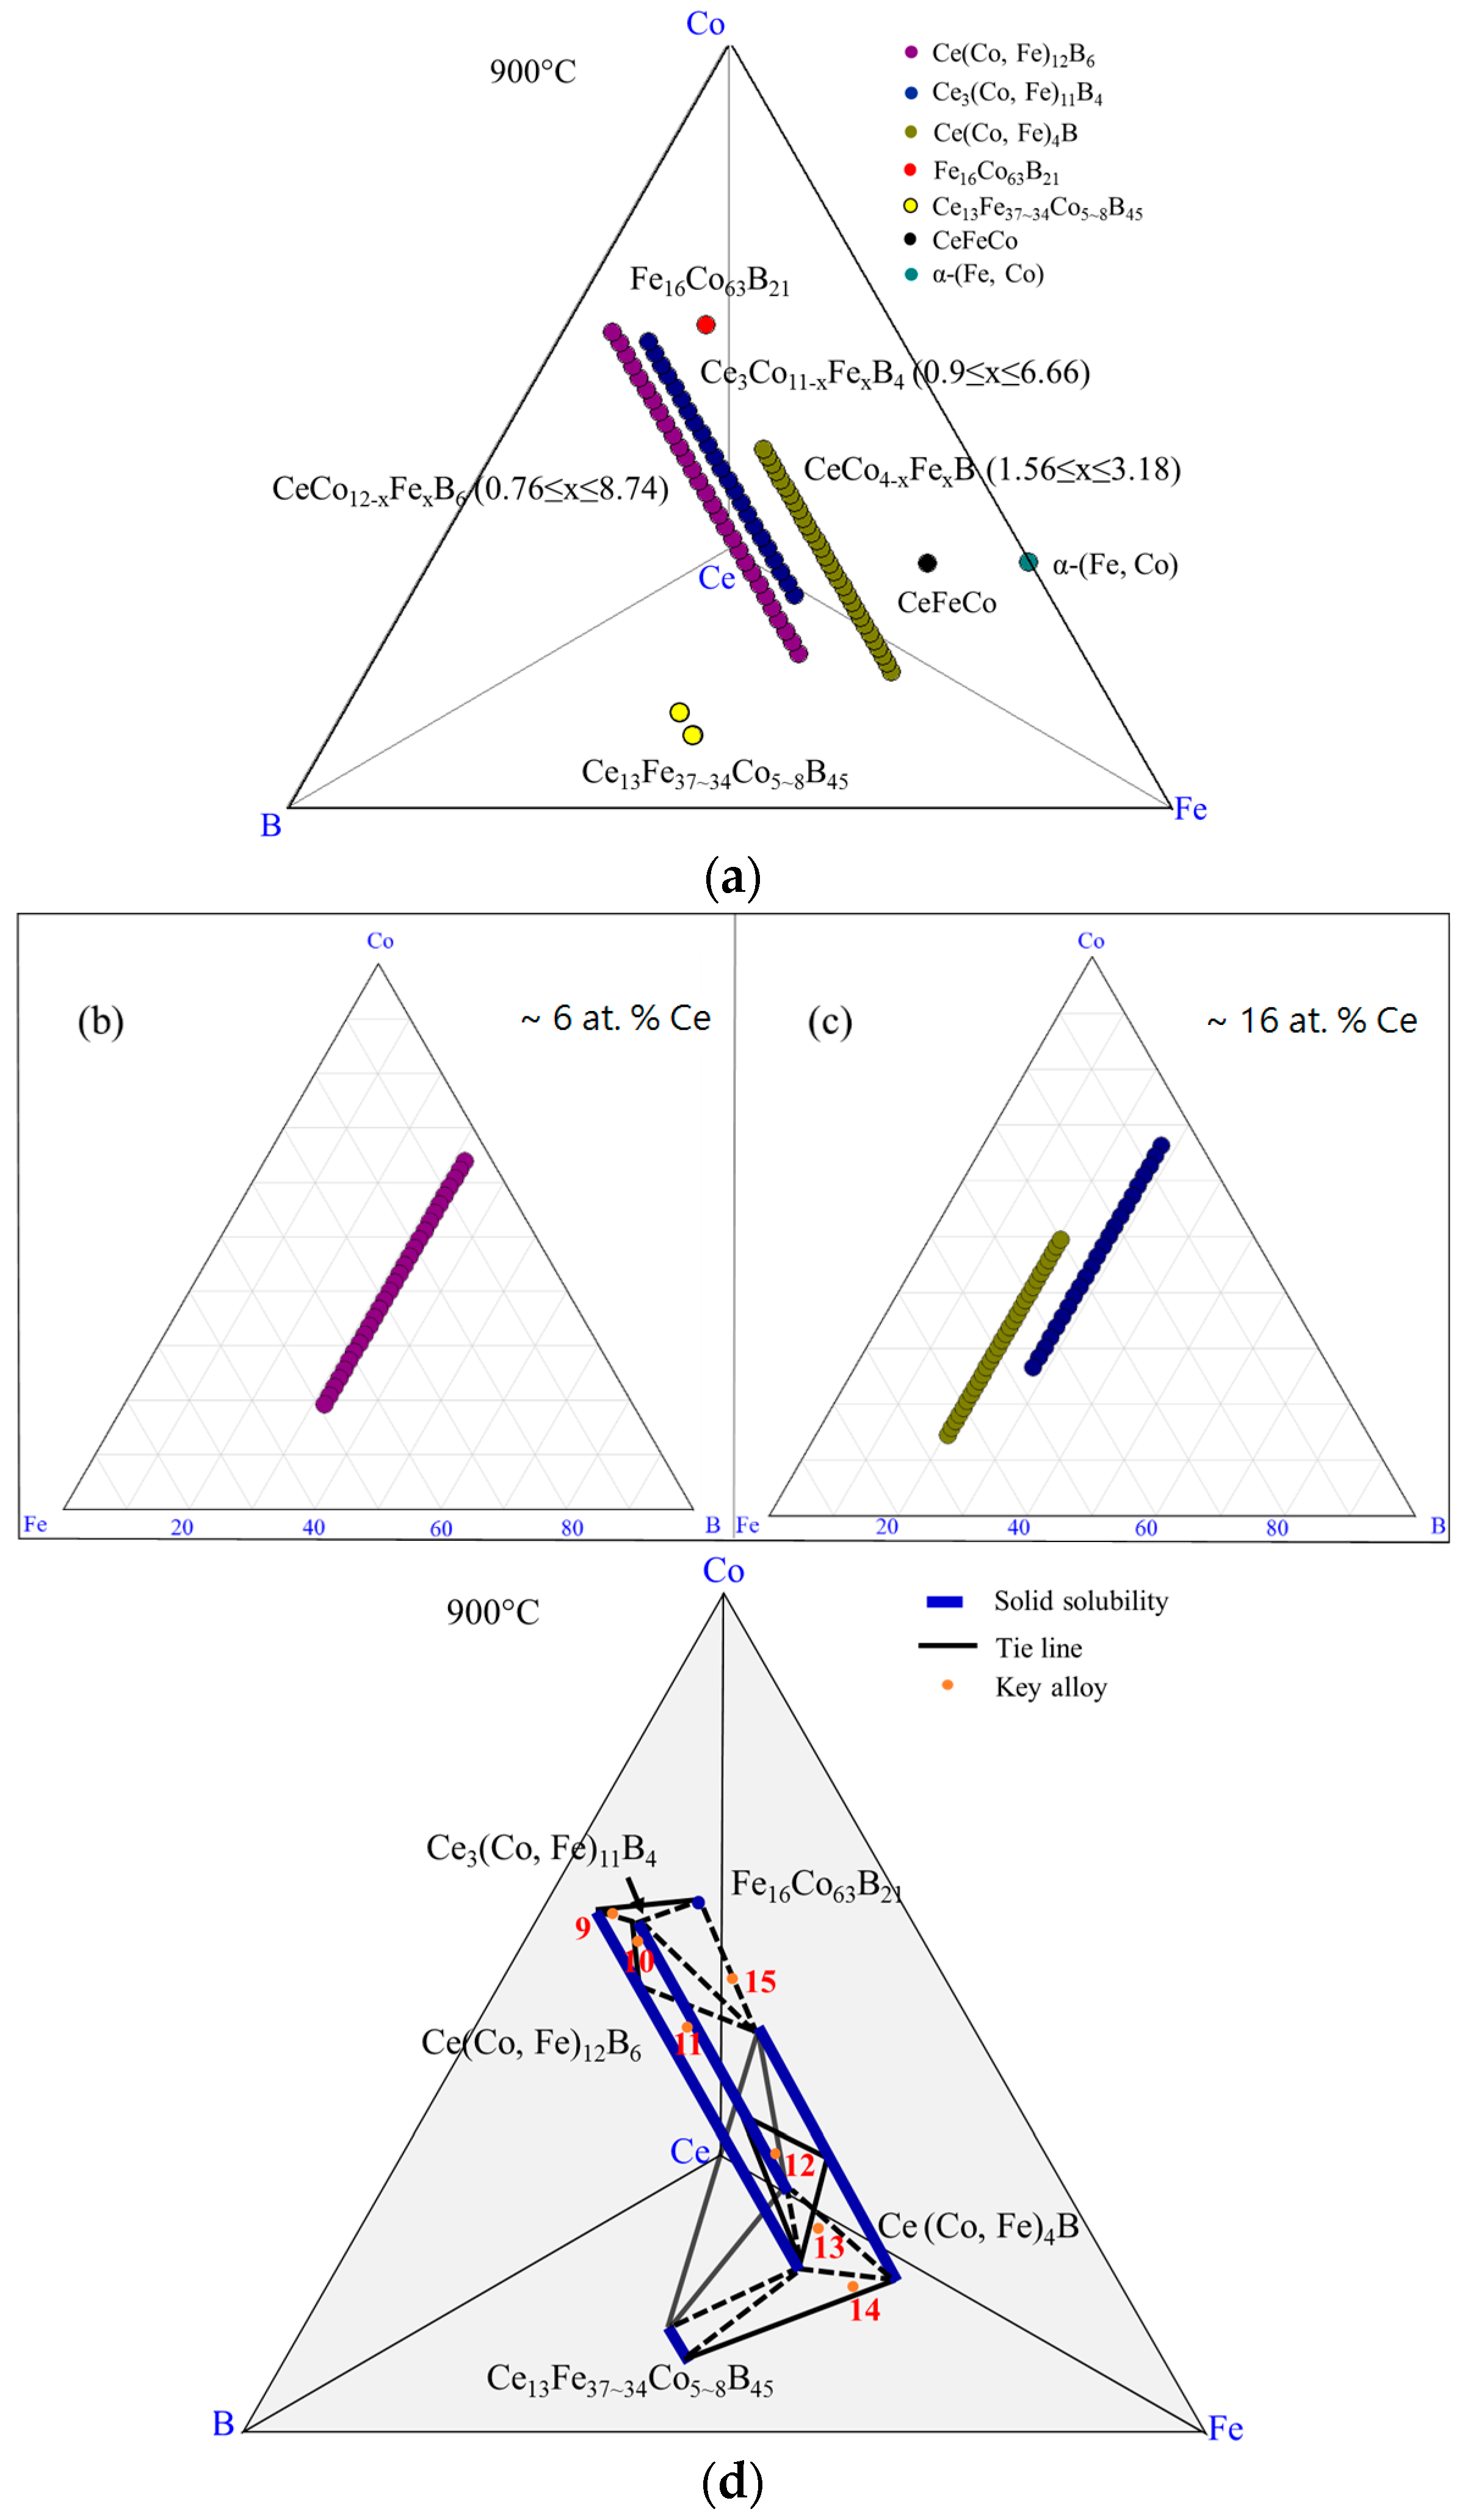
Figure 23.
Combined experimental results of diffusion couples and key alloys in the Ce-Fe-Co-B system at 900 °C: (a) 3D presentation of the experimental results; (b) Fe-Ce-Co ternary system; (c) pseudo ternary section at ~6 at. % Ce; (d) pseudo ternary section at ~12 at. % Ce; (e) pseudo ternary section at ~16 at. % Ce; (f) phase relations in the Fe-rich region of the Ce-Fe-Co-B system at 900 °C.


| Diffusion Couple | Layer | Composition (at. %) | Corresponding Phase | |||
|---|---|---|---|---|---|---|
| Ce | Fe | Co | B | |||
| DC1 (Ce2Fe14B/Co) | 1 | 12 | 82–73 | 0–9 | 6 | Ce2(Fe, Co)14B |
| 0 | 100–93 | 0–7 | 0 | α-(Fe, Co) | ||
| 2 | 11 | 79–34 | 10–55 | 0 | Ce2(Fe, Co)17 | |
| 0 | 93–57 | 7–43 | 0 | α-(Fe, Co) | ||
| 3 | 16 | 9 | 59 | 16 | Ce(Co, Fe)4B | |
| 0 | 57–39 | 43–61 | 0 | α-(Fe, Co) | ||
| 4 | 11 | 19 | 70 | 0 | Ce2(Co, Fe)17 | |
| 0 | 39 | 61 | 0 | α-(Fe, Co) | ||
| 5 | 0 | 35–30 | 65–70 | 0 | α-(Fe, Co) | |
| 6 | 0 | 12 | 88 | 0 | γ-(Fe, Co) | |
| 11 | 2 | 87 | 0 | Ce2(Co, Fe)17 | ||
| DC2 (Ce13Fe80B7/Co90Ce10) | 1 | 12 | 82–60 | 0–22 | 6 | Ce2(Fe, Co)14B |
| 0 | 100–82 | 0–18 | 0 | α-(Fe, Co) | ||
| 2 | 15 | 27–17 | 42–52 | 16 | Ce(Co, Fe)4B | |
| 0 | 82–37 | 18–63 | 0 | α-(Fe, Co) | ||
| 3 | 0 | 35–33 | 65–67 | 0 | α-(Fe, Co) | |
| 4 | 16 | 6–1 | 63–68 | 15 | Ce(Co, Fe)4B | |
| 11 | 14 | 75 | 0 | Ce2(Co, Fe)17 | ||
| 5 | 0 | 11–0 | 89–100 | 0 | γ-(Fe, Co) | |
| 11 | 14–0 | 75–89 | 0 | Ce2(Co, Fe)17 | ||
| DC3 (Ce10Fe75B15/Co) | 1 | 12 | 82–65 | 0–17 | 6 | Ce2(Fe, Co)14B |
| 0 | 100–70 | 0–30 | 0 | α-(Fe, Co) | ||
| 13 | 38 | 4 | 45 | Ce13Fe38Co4B45 | ||
| 2 | 16 | 21–5 | 40–56 | 23 | Ce3(Co, Fe)11B4 | |
| 0 | 70–44 | 30–56 | 0 | α-(Fe, Co) | ||
| 3 | 6 | 11 | 53 | 30 | Ce(Co, Fe)12B5 | |
| 4 | 0 | 33–30 | 67–70 | 0 | α-(Fe, Co) | |
| DC4 (Ce15Fe43Co19B23/Co) | 1 | 16 | 45–40 | 23–28 | 16 | Ce(Co, Fe)4B |
| 0 | 17 | 83 | 0 | α-(Fe, Co) | ||
| 13 | 32 | 10 | 45 | Ce13Fe32Co10B45 | ||
| 2 | 17 | 23–9 | 37–51 | 23 | Ce3(Co, Fe)11B4 | |
| 0 | 65–53 | 35–47 | 0 | α-(Fe, Co) | ||
| 3 | 6 | 18–9 | 46–55 | 30 | Ce(Co, Fe)12B5 | |
| 0 | 53 | 47 | 0 | α-(Fe, Co) | ||
| 4 | 0 | 31 | 69 | 0 | α-(Fe, Co) | |
| 5 | 0 | 14–11 | 86–89 | 0 | γ-(Fe, Co) | |
| Key Alloys Number | Actual Global Composition (at. %) | WDS Composition (at. %) | Corresponding Phases | |||||||
|---|---|---|---|---|---|---|---|---|---|---|
| Ce | Fe | Co | B | Ce | Fe | Co | B | By WDS | By XRD | |
| KA 1 | 14 | 73 | 7 | 6 | 12 | 76 | 6 | 6 | Ce2(Fe, Co)14B | Ce2(Fe, Co)14B |
| 13 | 39 | 3 | 45 | Ce13Fe39Co3B45 | N/A * | |||||
| KA 2 | 15 | 66 | 12 | 7 | 12 | 71 | 11 | 6 | Ce2(Fe, Co)14B | Ce2(Fe, Co)14B |
| 16 | 54 | 15 | 15 | Ce(Co, Fe)4B | Ce(Co, Fe)4B | |||||
| 36 | 41 | 23 | 0 | CeFeCo | CeFeCo | |||||
| KA 3 | 14 | 58 | 20 | 8 | 12 | 64 | 18 | 6 | Ce2(Fe, Co)14B | Ce2(Fe, Co)14B |
| 16 | 46 | 23 | 15 | Ce(Co, Fe)4B | Ce(Co, Fe)4B | |||||
| 0 | 86 | 14 | 0 | α-(Fe, Co) | α-(Fe, Co) | |||||
| KA 4 | 15 | 54 | 24 | 7 | 12 | 60 | 22 | 6 | Ce2(Fe, Co)14B | Ce2(Fe, Co)14B |
| 16 | 40 | 28 | 16 | Ce(Co, Fe)4B | Ce(Co, Fe)4B | |||||
| 0 | 80 | 20 | 0 | α-(Fe, Co) | α-(Fe, Co) | |||||
| KA 5 | 14 | 46 | 32 | 8 | 12 | 54 | 28 | 6 | Ce2(Fe, Co)14B | Ce2(Fe, Co)14B |
| 16 | 33 | 35 | 16 | Ce(Co, Fe)4B | Ce(Co, Fe)4B | |||||
| 0 | 76 | 24 | 0 | α-(Fe, Co) | α-(Fe, Co) | |||||
| KA 6 | 12 | 42 | 40 | 6 | 11 | 48 | 41 | 0 | Ce2(Fe, Co)17 | Ce2(Fe, Co)17 |
| 16 | 23 | 45 | 16 | Ce(Co, Fe)4B | Ce(Co, Fe)4B | |||||
| 0 | 66 | 34 | 0 | α-(Fe, Co) | α-(Fe, Co) | |||||
| KA 7 | 12 | 32 | 50 | 6 | 11 | 37 | 52 | 0 | Ce2(Fe, Co)17 | Ce2(Fe, Co)17 |
| 17 | 13 | 54 | 16 | Ce(Co, Fe)4B | Ce(Co, Fe)4B | |||||
| 0 | 57 | 43 | 0 | α-(Fe, Co) | α-(Fe, Co) | |||||
| KA 8 | 12 | 22 | 60 | 6 | 11 | 24 | 65 | 0 | Ce2(Fe, Co)17 | Ce2(Fe, Co)17 |
| 17 | 7 | 60 | 16 | Ce(Co, Fe)4B | Ce(Co, Fe)4B | |||||
| 0 | 56 | 44 | 0 | α-(Fe, Co) | α-(Fe, Co) | |||||
* Not available: Unknown crystal structure which could not be confirmed by XRD.
| Key Alloys Number | Actual Global Composition (at. %) | WDS Composition (at. %) | Corresponding Phases | |||||||
|---|---|---|---|---|---|---|---|---|---|---|
| Ce | Fe | Co | B | Ce | Fe | Co | B | By WDS | By XRD | |
| KA 9 | 9 | 7 | 56 | 28 | 6 | 4 | 60 | 30 | Ce(Co, Fe)12B6 | Ce(Co, Fe)12B6 |
| 0 | 16 | 63 | 21 | Fe16Co63B21 | N/A * | |||||
| KA 10 | 16 | 8 | 51 | 25 | 17 | 5 | 55 | 23 | Ce3(Co, Fe)11B4 | Ce3(Co, Fe)11B4 |
| 6 | 14 | 51 | 29 | Ce(Co, Fe)12B6 | Ce(Co, Fe)12B6 | |||||
| KA 11 | 17 | 18 | 43 | 22 | 17 | 14 | 46 | 23 | Ce3(Co, Fe)11B4 | Ce3(Co, Fe)11B4 |
| 6 | 32 | 32 | 30 | Ce(Co, Fe)12B6 | Ce(Co, Fe)12B6 | |||||
| KA 12 | 17 | 33 | 27 | 23 | 17 | 28 | 32 | 23 | Ce3(Co, Fe)11B4 | Ce3(Co, Fe)11B4 |
| 6 | 46 | 18 | 30 | Ce(Co, Fe)12B6 | Ce(Co, Fe)12B6 | |||||
| 17 | 39 | 27 | 17 | Ce(Co, Fe)4B | Ce(Co, Fe)4B | |||||
| KA 13 | 17 | 42 | 18 | 23 | 17 | 37 | 23 | 23 | Ce3(Co, Fe)11B4 | Ce3(Co, Fe)11B4 |
| 16 | 47 | 20 | 17 | Ce(Co, Fe)4B | Ce(Co, Fe)4B | |||||
| 13 | 34 | 8 | 45 | Ce13Fe34Co8B45 | N/A * | |||||
| KA 14 | 17 | 50 | 10 | 23 | 16 | 55 | 12 | 17 | Ce(Co, Fe)4B | Ce(Co, Fe)4B |
| 13 | 37 | 5 | 45 | Ce13Fe37Co5B45 | N/A * | |||||
| 35 | 45 | 20 | 0 | CeFeCo | CeFeCo | |||||
| KA 15 | 15 | 20 | 49 | 16 | 17 | 16 | 44 | 23 | Ce3(Co, Fe)11B4 | Ce3(Co, Fe)11B4 |
| 16 | 26 | 42 | 16 | Ce(Co, Fe)4B | Ce(Co, Fe)4B | |||||
| 0 | 68 | 32 | 0 | α-(Fe, Co) | α-(Fe, Co) | |||||
* Not available: Unknown crystal structure which could not be confirmed by XRD.
© 2016 by the authors. Licensee MDPI, Basel, Switzerland. This article is an open access article distributed under the terms and conditions of the Creative Commons Attribution (CC-BY) license ( http://creativecommons.org/licenses/by/4.0/).
Share and Cite
MDPI and ACS Style
Wang, T.; Kevorkov, D.; Medraj, M. Phase Equilibria and Magnetic Phases in the Ce-Fe-Co-B System. Materials 2017, 10, 16. https://doi.org/10.3390/ma10010016
AMA Style
Wang T, Kevorkov D, Medraj M. Phase Equilibria and Magnetic Phases in the Ce-Fe-Co-B System. Materials. 2017; 10(1):16. https://doi.org/10.3390/ma10010016
Chicago/Turabian StyleWang, Tian, Dmytro Kevorkov, and Mamoun Medraj. 2017. "Phase Equilibria and Magnetic Phases in the Ce-Fe-Co-B System" Materials 10, no. 1: 16. https://doi.org/10.3390/ma10010016
Note that from the first issue of 2016, this journal uses article numbers instead of page numbers. See further details here.