1. Introduction
Energetic efficiency is, nowadays, a major concern in the manufacturing industry [
1,
2] and among household appliances producers in particular [
3,
4,
5]. In this direction, resistive cooktops and gas fueled burners are being replaced by induction cooktops as a general trend in many areas. Over the years, important efforts have been undertaken in order to optimize not only the efficiency, but also the heating speed and safety of domestic induction heating appliances [
5,
6].
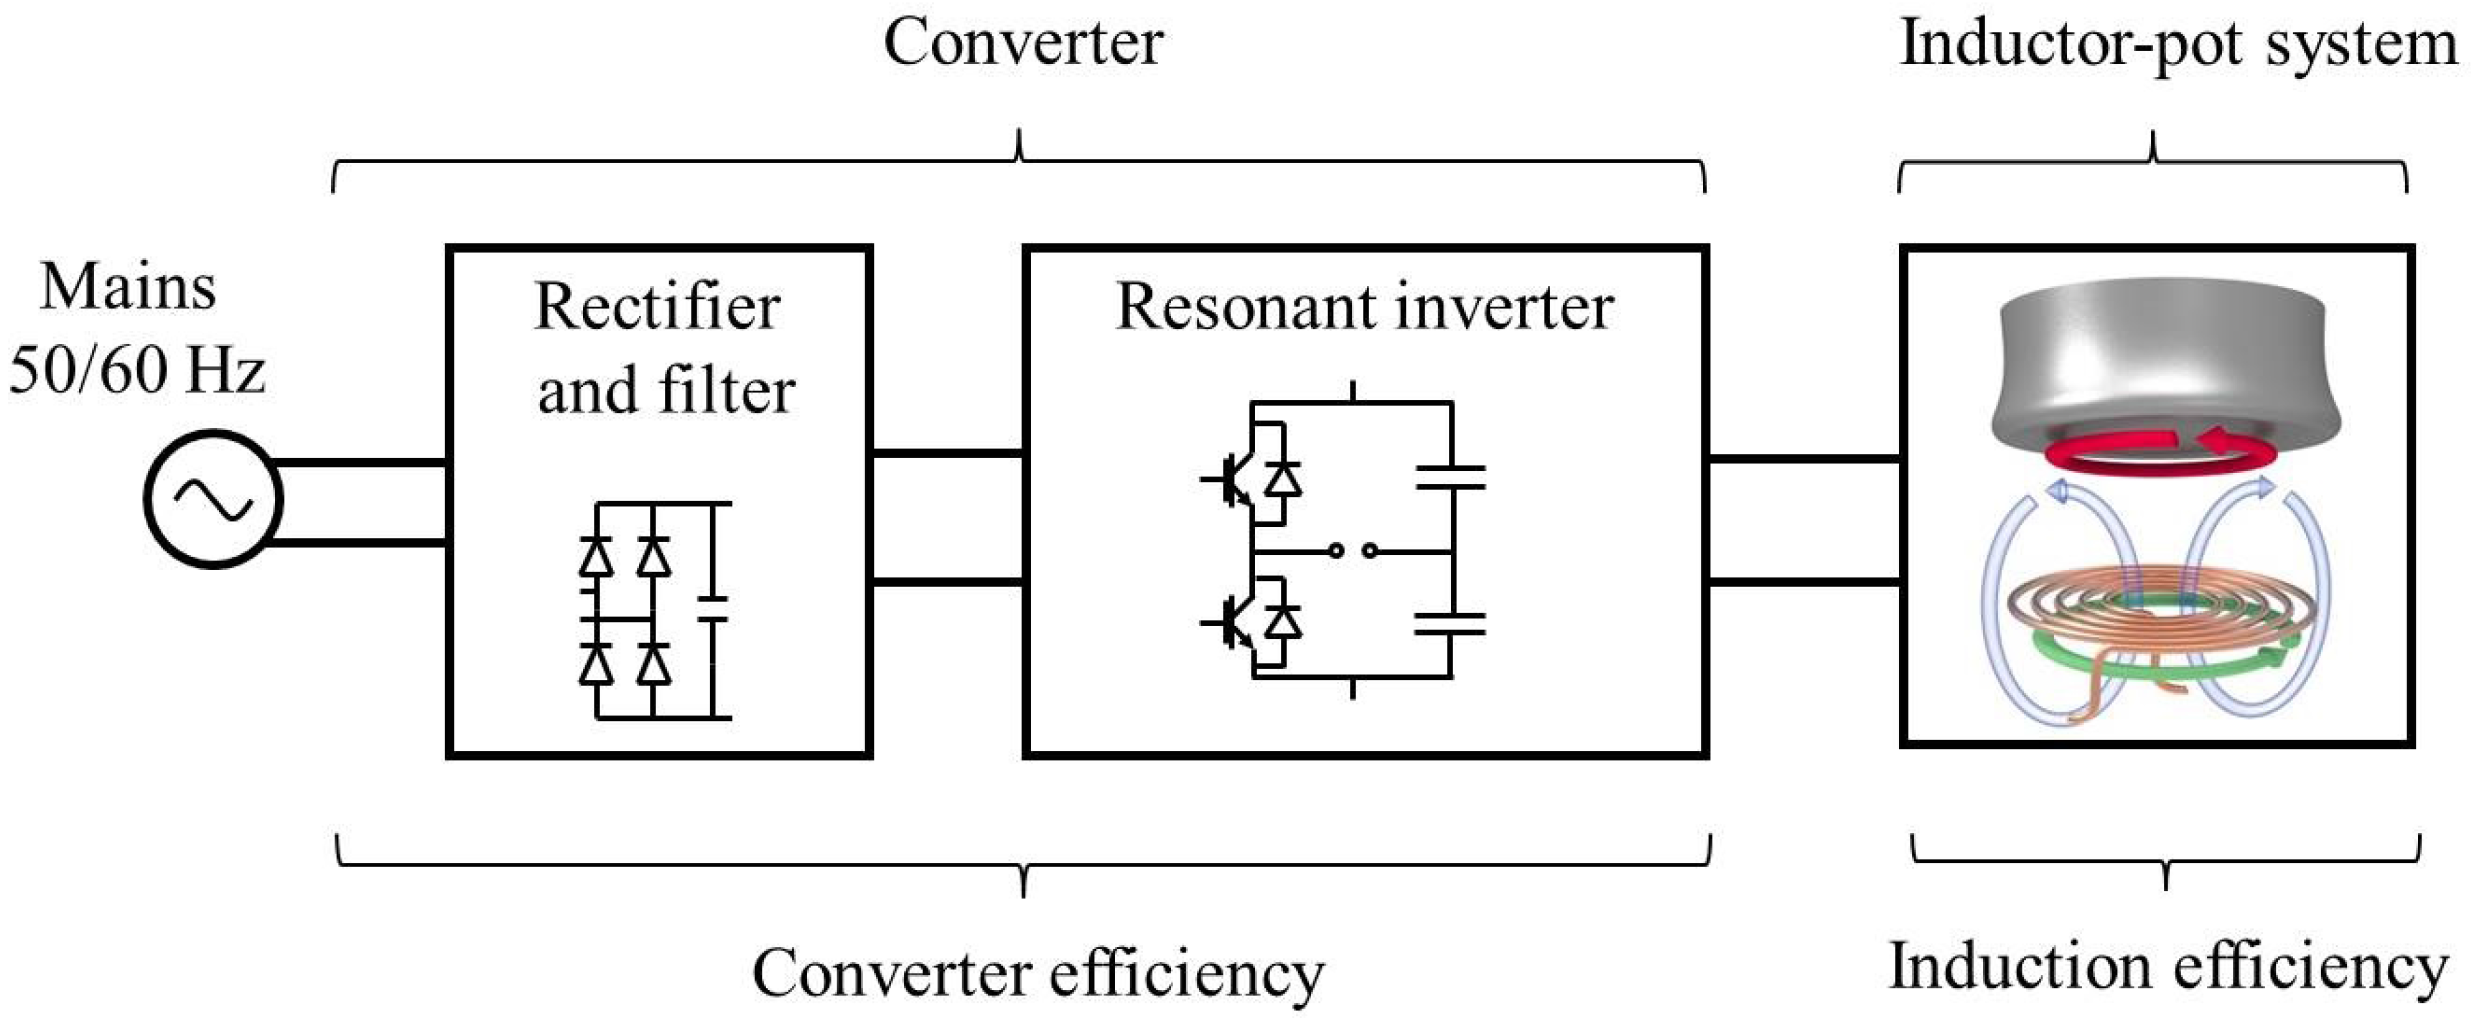
An induction cooktop is powered by the mains (50/60 Hz), which is rectified and filtered. Then, an inverter is employed to generate a 20 to 100 kHz square wave voltage which acts as excitation for the inductor. The resulting current through the inductor generates a magnetic field that reaches the base of the pot and dissipates power due to induced currents and hysteresis. This system is represented in
Figure 1. Throughout the process, losses take place at every conversion stage. Intensive research has been carried out in the optimization of the converter with new topologies [
7] and digital modulation strategies [
8,
9]. The efficiency in the converter is defined, as usual, as the output power divided by the input power. This efficiency can be measured by using conventional instruments as oscilloscopes or power analyzers.
In the case of the inductor-pot system, an expression of the energy transfer efficiency can be derived in terms of electrical resistances. Each resistance represents the dissipated power in a different element (winding, pot, etc.). In the past, efforts were focused on achieving an electromagnetic model to obtain an equivalent impedance of the inductor-pot pair, including the aforementioned resistances [
10]. The model was successfully verified by means of small-signal analyzers, however, such measurements do not reflect the actual impedance under real working conditions due to the signal-level dependence of the pot material (5 to 15 Amperes) and the temperature rise (up to 150 °C). As a consequence, efficiency measurement in real working conditions still presents an important challenge [
11,
12,
13].
Due to the significant inaccuracy inherent to high-frequency power measurement, calorimetric methods are widely used to measure the efficiency of power applications and devices [
14,
15,
16,
17]. In this work, a calorimetric method is proposed in order to measure the efficiency of an induction system. The main definitions and concepts regarding induction efficiency and energy balance in induction systems are presented in
Section 2. In
Section 3 the calorimetric method is proposed.
Section 4 presents the design and implementation of the measurement station. The calibration of the test-bench is presented in
Section 5.
Section 6 shows the experimental results and the efficiency measurements under real working conditions. Finally, in
Section 7 the main conclusions are drawn.
2. Induction Efficiency and Energy Balance
2.1. Induction Efficiency
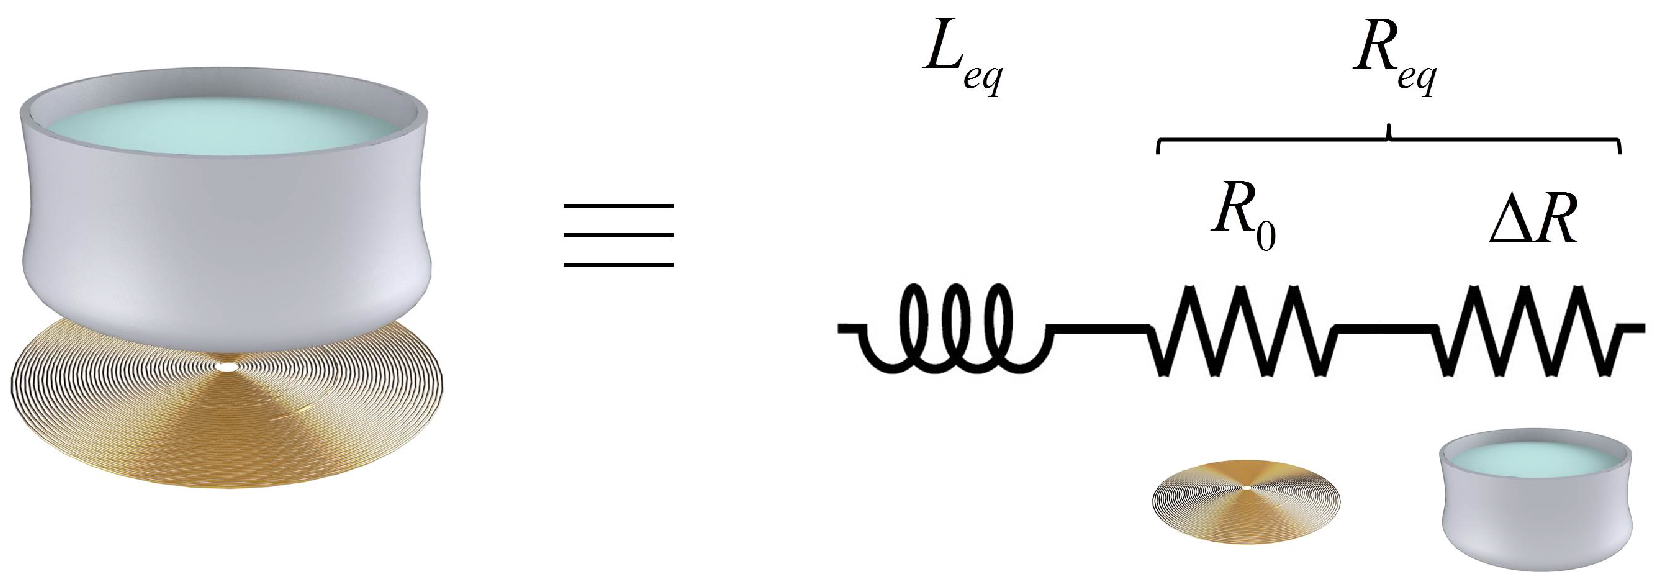
As commented above, the inductor-pot system is usually modeled by an equivalent impedance, which acts as the load of the resonant inverter. This impedance, as shown in
Figure 2, consists of a series connection of a resistance,
, and an inductance,
. The equivalent resistance, in turn, can be divided into the winding resistance,
, and the resistive contribution of the pot caused by the strong coupling,
. While the first represents the power losses in the winding, the second represents the power dissipation in the pot.
According to the previous definitions, the efficiency of the induction system is given by
The main challenge to perform this calculation lies on the strong relation between the variables
and
, as they both depend on the magnitude and direction of the magnetic field [
18]. As a consequence,
varies depending on the absence or presence of a pot and its material. From this, a clear conclusion can be drawn: both variables cannot be measured independently.
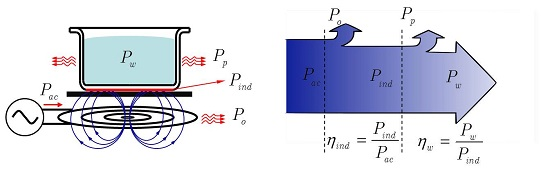
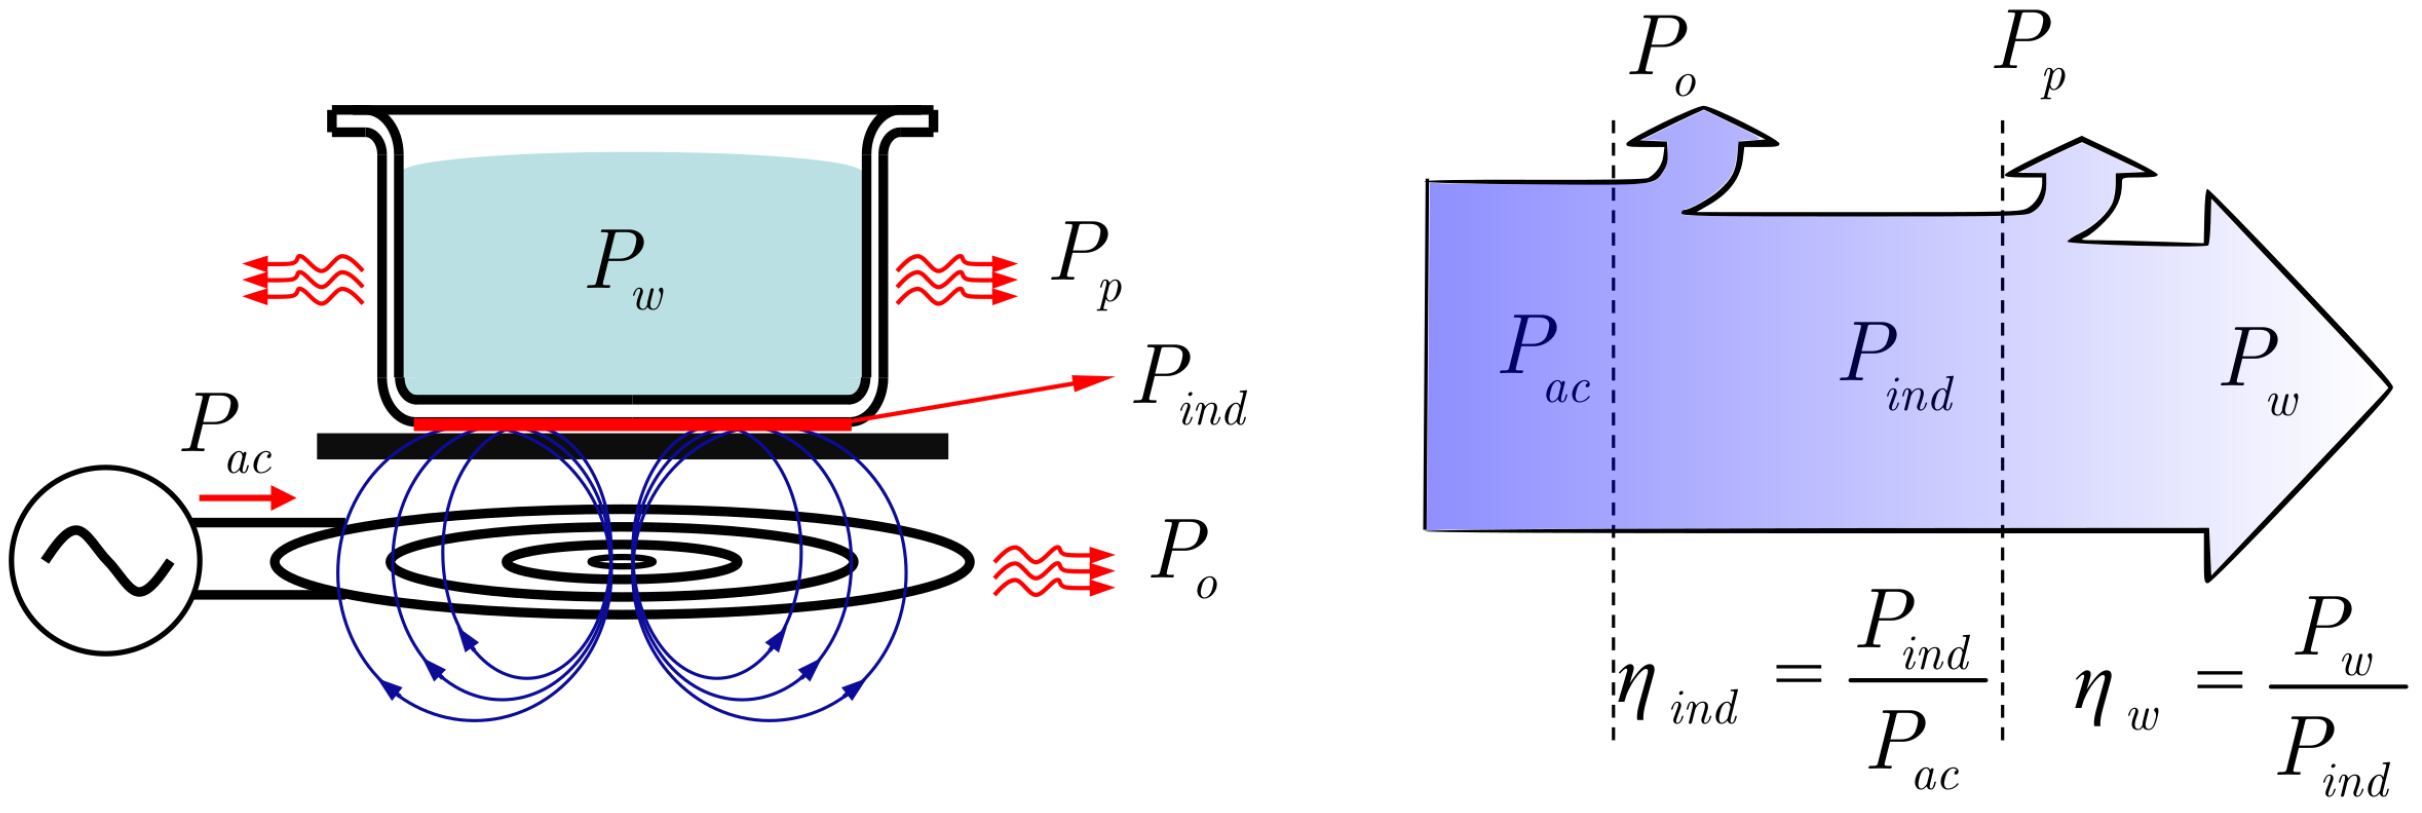
2.2. Energy Balance
As the variables involved in the induction efficiency are not separable from the electromagnetic point of view, a calorimetric approach becomes of interest in order to separate the delivered power from the wasted power.
Figure 3 represents the energy balance in an induction system, where
denotes the converter output power,
is the power dissipated in the base of the pot and
is the wasted power, which is dissipated in the inductor. Therefore,
Following with the defined variables, the induction efficiency can be calculated as a ratio of powers which are related to their corresponding resistances.
Moreover, not all the power delivered to the pot is effectively transferred to the water. As shown in
Figure 3,
represents the power that reaches the water while
is the power lost into the surroundings due to conduction and convection. This can be expressed as:
and consequently, the thermal efficiency of the pot is given by
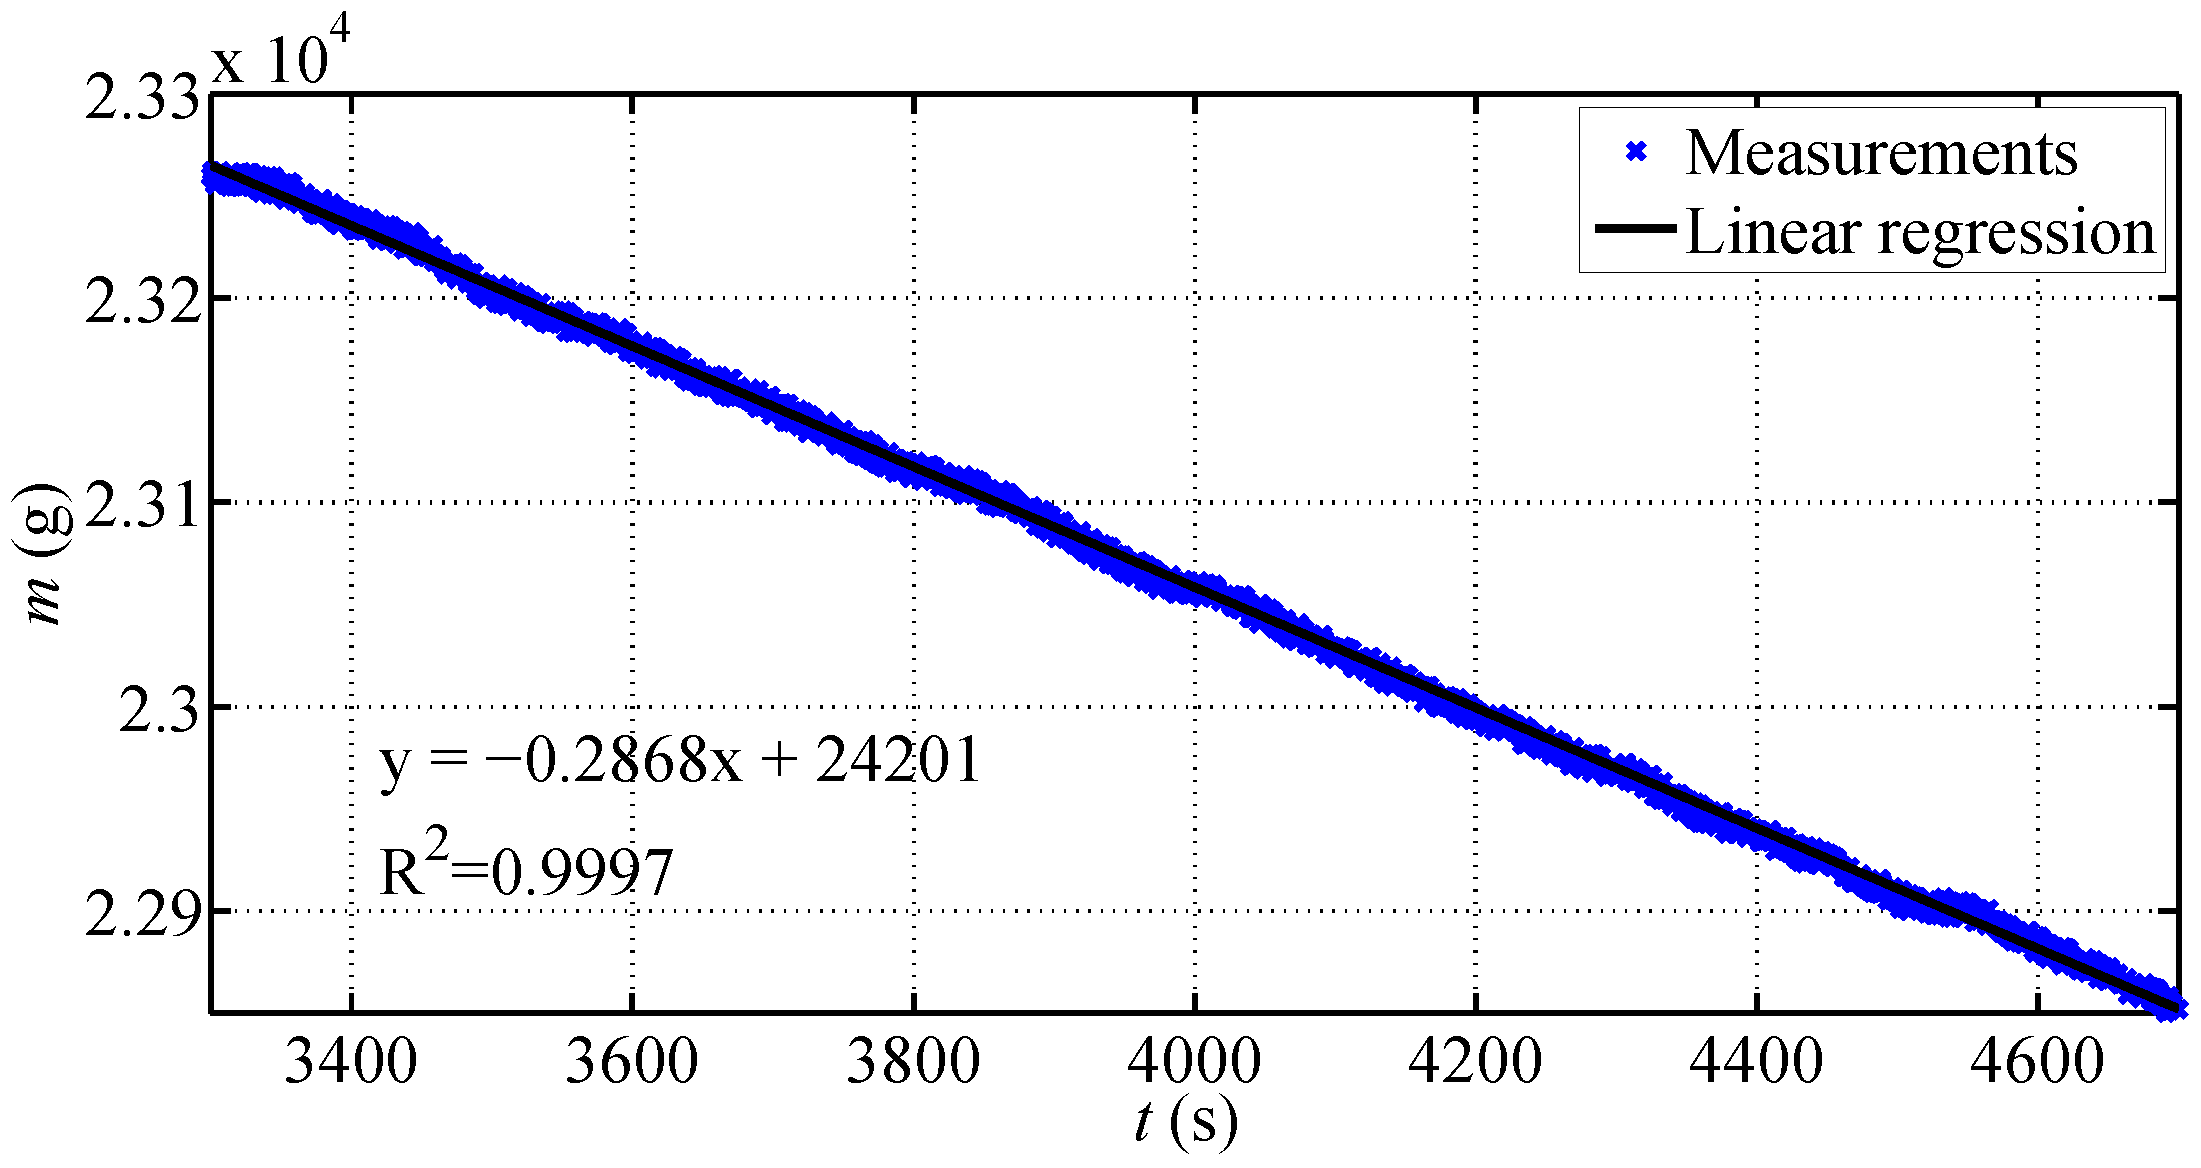
The power which actually heats up the water, , can be obtained by two different methods. On the one hand, the temperature rise can be measured and used to calculate the causing power. On the other hand, the water can be brought to boiling point, and then the boiled mass can be measured. For convenience, steady state boiling conditions are preferred as they keep a constant temperature (373 K), and, therefore, the heat flowing to the environment can be assumed constant.
In such conditions,
can by calculated as
where
is the boiled mass rate and
is the heat of vaporization of water.
Introducing in Equation (
6) the relationships contained in Equations (
3) and (
4), the following relationship is obtained:
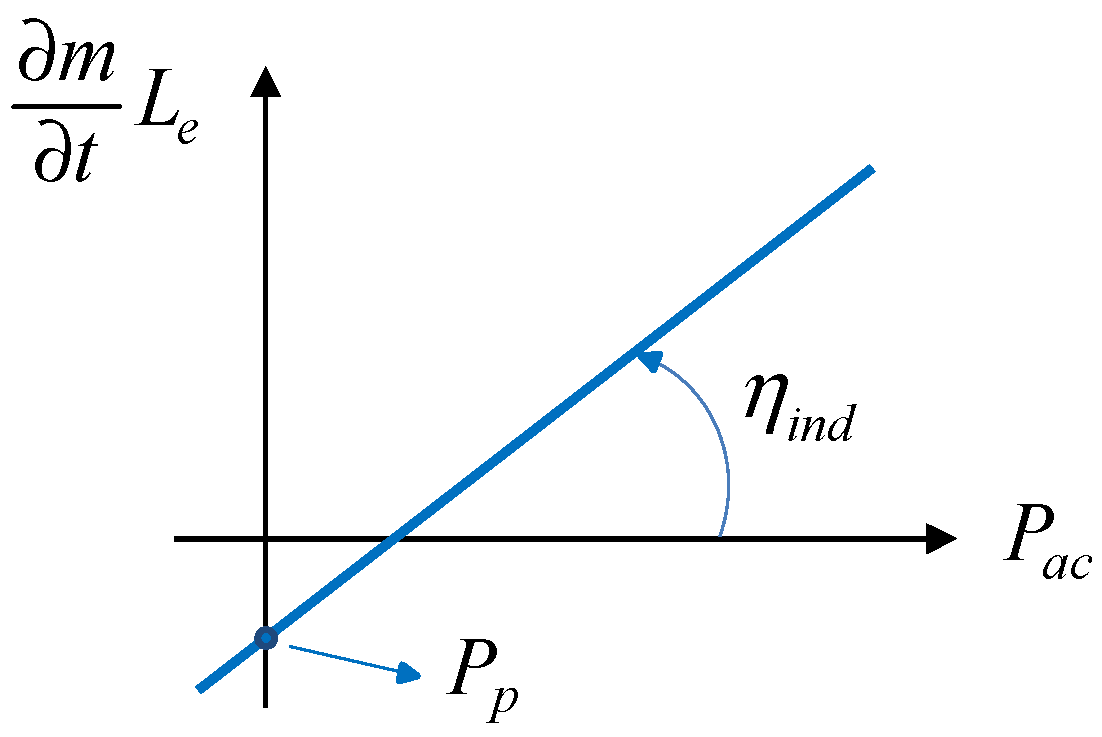
It is important to note that, except for the induction efficiency, all the involved variables in Equation (
7) are measurable. The boiled mass rate,
, can be directly weighted with load cells,
can be obtained with a conventional power analyzer, and
is the necessary power to keep the water boiling. At this point,
can be calculated as the slope when representing the boiled mass rate with respect to the consumed electric power. This is graphically represented in
Figure 4.
2.3. Accuracy in Power Measurements
As seen in the previous sections, the converter output power,
needs to be measured. This can be achieved with a conventional power analyzer. However, induction cooktops work with high currents and voltages, which can reach hundreds of volts and tens of amps respectively, at switching frequencies,
, ranging from 20 to 100 kHz. Moreover, signals are composed of several harmonics and a
over 1 kV/
s. Besides, low-signal measurements and large signal simulations of usual litz-wire windings show efficiencies above 94% [
10]. Therefore, the accuracy of the method needs to be high enough to compare windings and pots with an efficiency in the range of 94 to 99%.
Is this assembly, the
Yokogawa PZ400 power analyzer has been tested as an alternative to measure
. The accuracy of the instrument is given by the manufacturer [
19]:
where
and
are the current and power shown in the display,
is the selected measurement range,
f is the frequency of the first harmonic and
is the angle between the voltage and current waveforms. A typical situation is shown in the following example: for an induction system working at
f = 59 kHz,
= 1302 W and
= 0.53, the error given by Equation (
8) is
. In this case, the error is around 3% which is a limiting factor for the global accuracy when calculating
, and therefore, the method based on Equation (
7) should be avoided.
3. Differential Method: Boiling Rate as Measurable Comparator
Due to the high-accuracy requirements of the problem, the error introduced by Equation (
8) must be bypassed. Alternatively, a differential method is proposed: the method consists on comparing the boiled mass rate in two different situations. In the first scenario, which will be referred as (
out), the inductor is placed, as usually, beneath the pot. In this case,
reaches the pot, while
is dissipated in the inductor and evacuated to the air. In the second scenario (
in), the inductor is placed inside the pot. As the winding is immersed in water, the power losses are also transferred to the water. In this case, the efficiency of the system is
.
According to Equation (
7), the energy balance for scenarios
out and
in an be expressed as
where
is assumed constant as steady state conditions are preserved.
By combining Equations (
9) and (
10),
can be eliminated leading to
where
is a constant of extremely small value as compared to the boiling rates, i.e.,
. Moreover, the value of
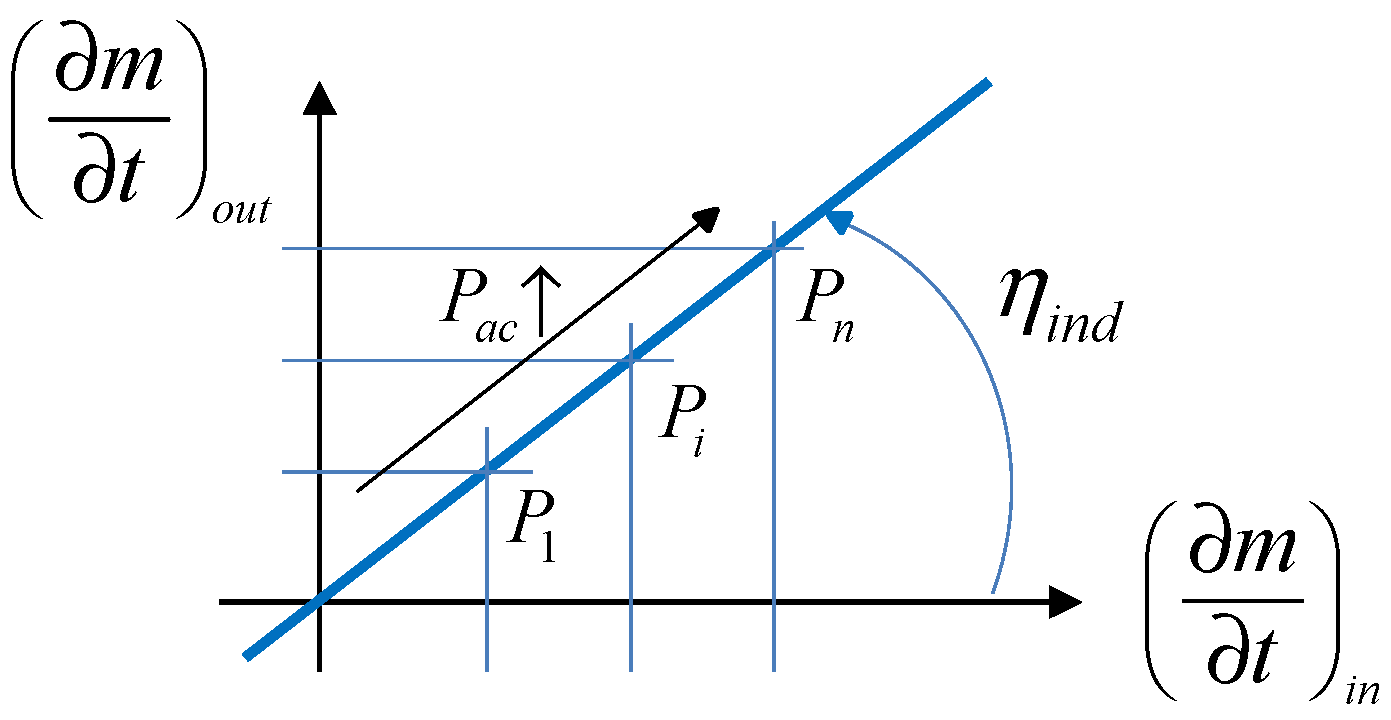
is beyond the resolution of the measuring system. For these reasons, this term was neglected leading to the simplified expression
At this point, the efficiency can be obtained by representing the boiling rate in scenario
out,
, with respect to the boiling rate in scenario
in,
. This is graphically represented in
Figure 5.
The proposed method requires identical conditions in both scenarios, i.e., steady state conditions (water is continuously boiling), the same switching frequency and system geometry. In order to fulfill these conditions, a specific setup has been designed and assembled.
4. Design of the Test-Bench
The test-bench consists of an inductor-pot system, a weight measurement system, a half bridge resonant inverter, and a control system including the acquisition unit.
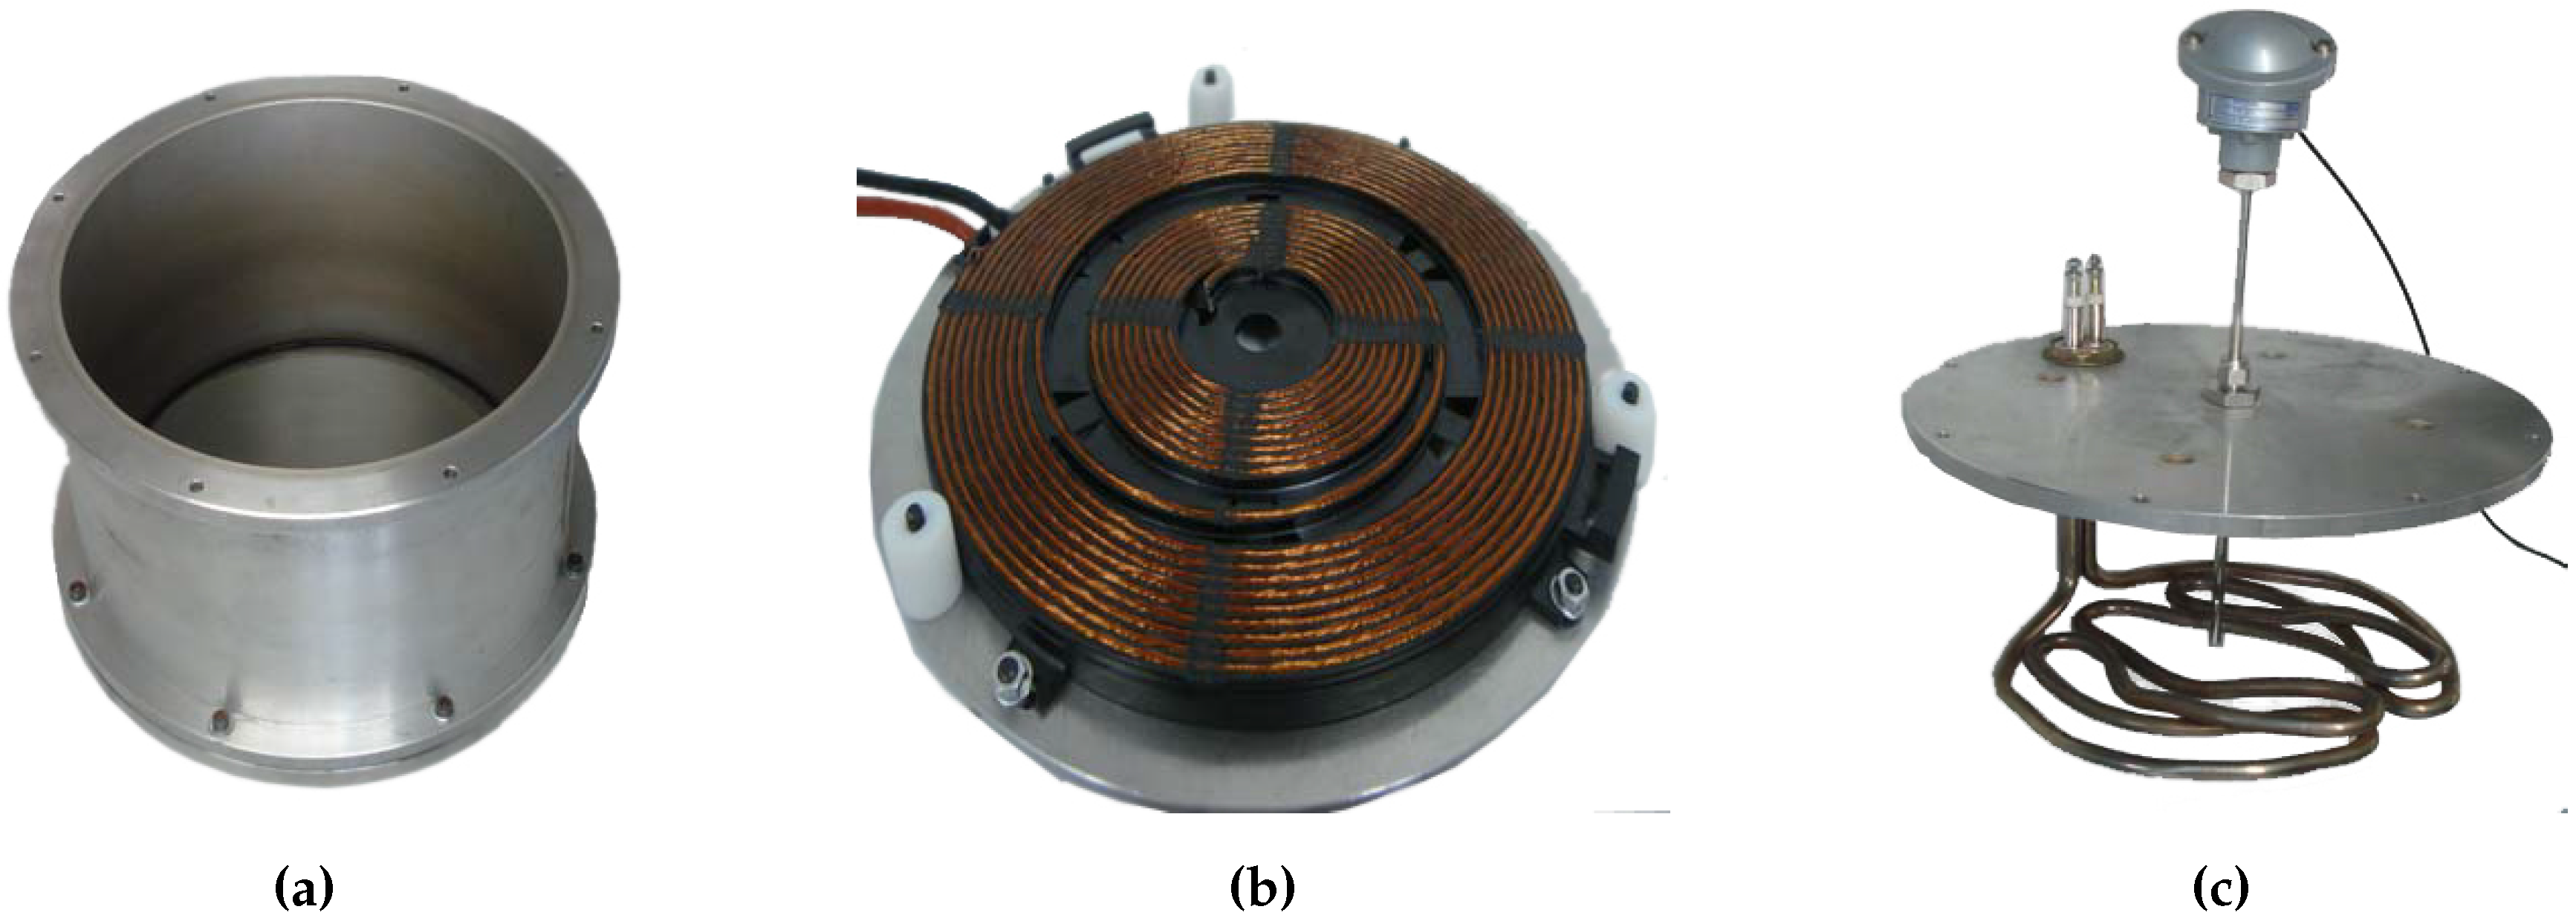
4.1. Inductor-Pot System
The designed pot has a reversible base to which the inductor is attached. This allows to flip the base in order to immerse the winding in the water in a way that the distance between the inductor and the pot remains constant. Moreover, in order to preserve the same thermal boundary conditions in both scenarios, two inductors are attached to the base, one at each side. The base is sealed to the pot’s body by a ring-shaped rubber. Additionally, a DC-fed 17 Ω resistor is placed inside the pot in order to keep the water boiling when
is not sufficient and serves as calibration reference. This resistor is supplied by an
Argantix XDS 100-100 DC source. The aforementioned elements are shown in
Figure 6.
The 300 mm diameter pot base is made of ferromagnetic steel while the body is made of aluminum. The tested winding has a diameter of and it is intended to work from 40 kHz to 70 kHz with a maximum power of 3500 W. Other accessory elements are the ferrites, which increase the coupling between the inductor and the pot, and an aluminum shielding tray. The whole set was extracted from a commercial cooktop and installed on the test-bench in their original positions.
4.2. Sensors
In order to accurately measure the weight, the inductor-pot system and the accessory elements were placed on a polycarbonate panel. The panel rested over three load cells which were screwed to the measuring station in such a way that the pot mass is given by the sum of the three measurements. The load cells were equipped with soft absorbers significantly reducing vibrations. The assembly is shown in
Figure 7.
A
Yokogawa MW100 acquisition unit registered the measured data which, according to the manufacturers manual, has an accuracy of at least 1 g. The temperature was sensed by a
Pt100/3W thermometer (
Figure 6c) which was also connected to the acquisition unit.
4.3. Power Supply
As seen before, the method requires of several measurements at different power levels while keeping a constant frequency. This collides with the standard power control strategies in commercial cooktops, which use a resonant series half-bridge inverter to control the power by varying the switching frequency. In this case, a variable-frequency power control strategy must be ruled out.
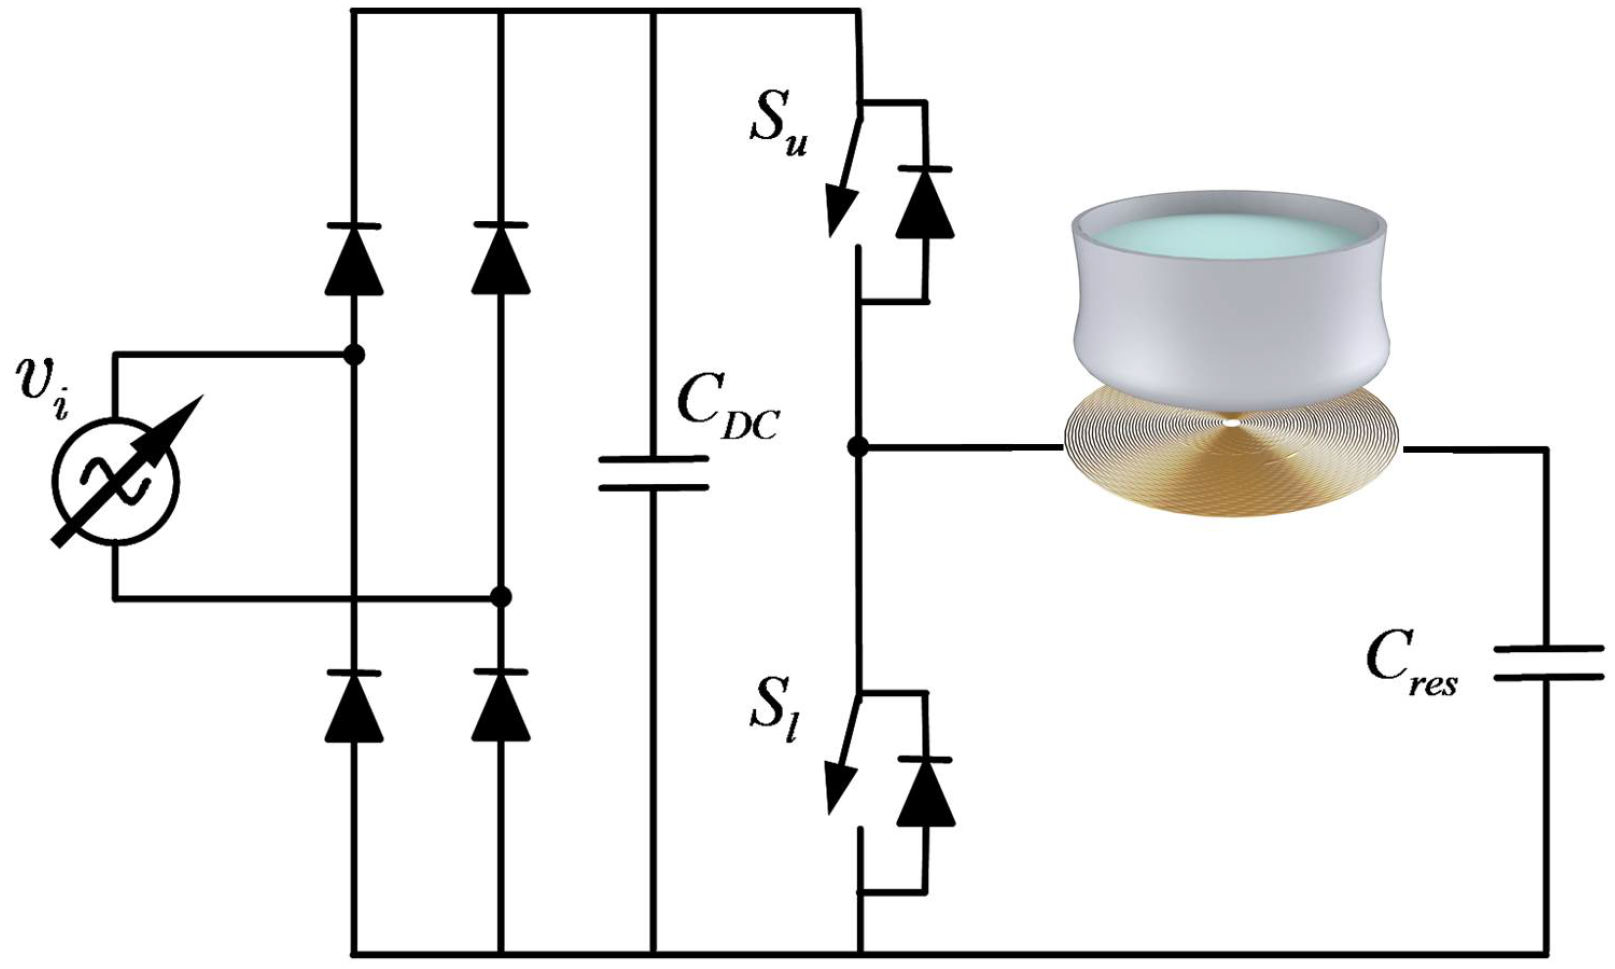
Alternatively, a
California 5001 ix AC source was employed to power the system instead of the mains. This provides a variable and controllable
voltage, with which the supplied power
can be controlled. The schematic including the AC source, the diode rectifier, bus capacitor and the half-bridge inverter is shown in
Figure 8.
4.4. Control Unit
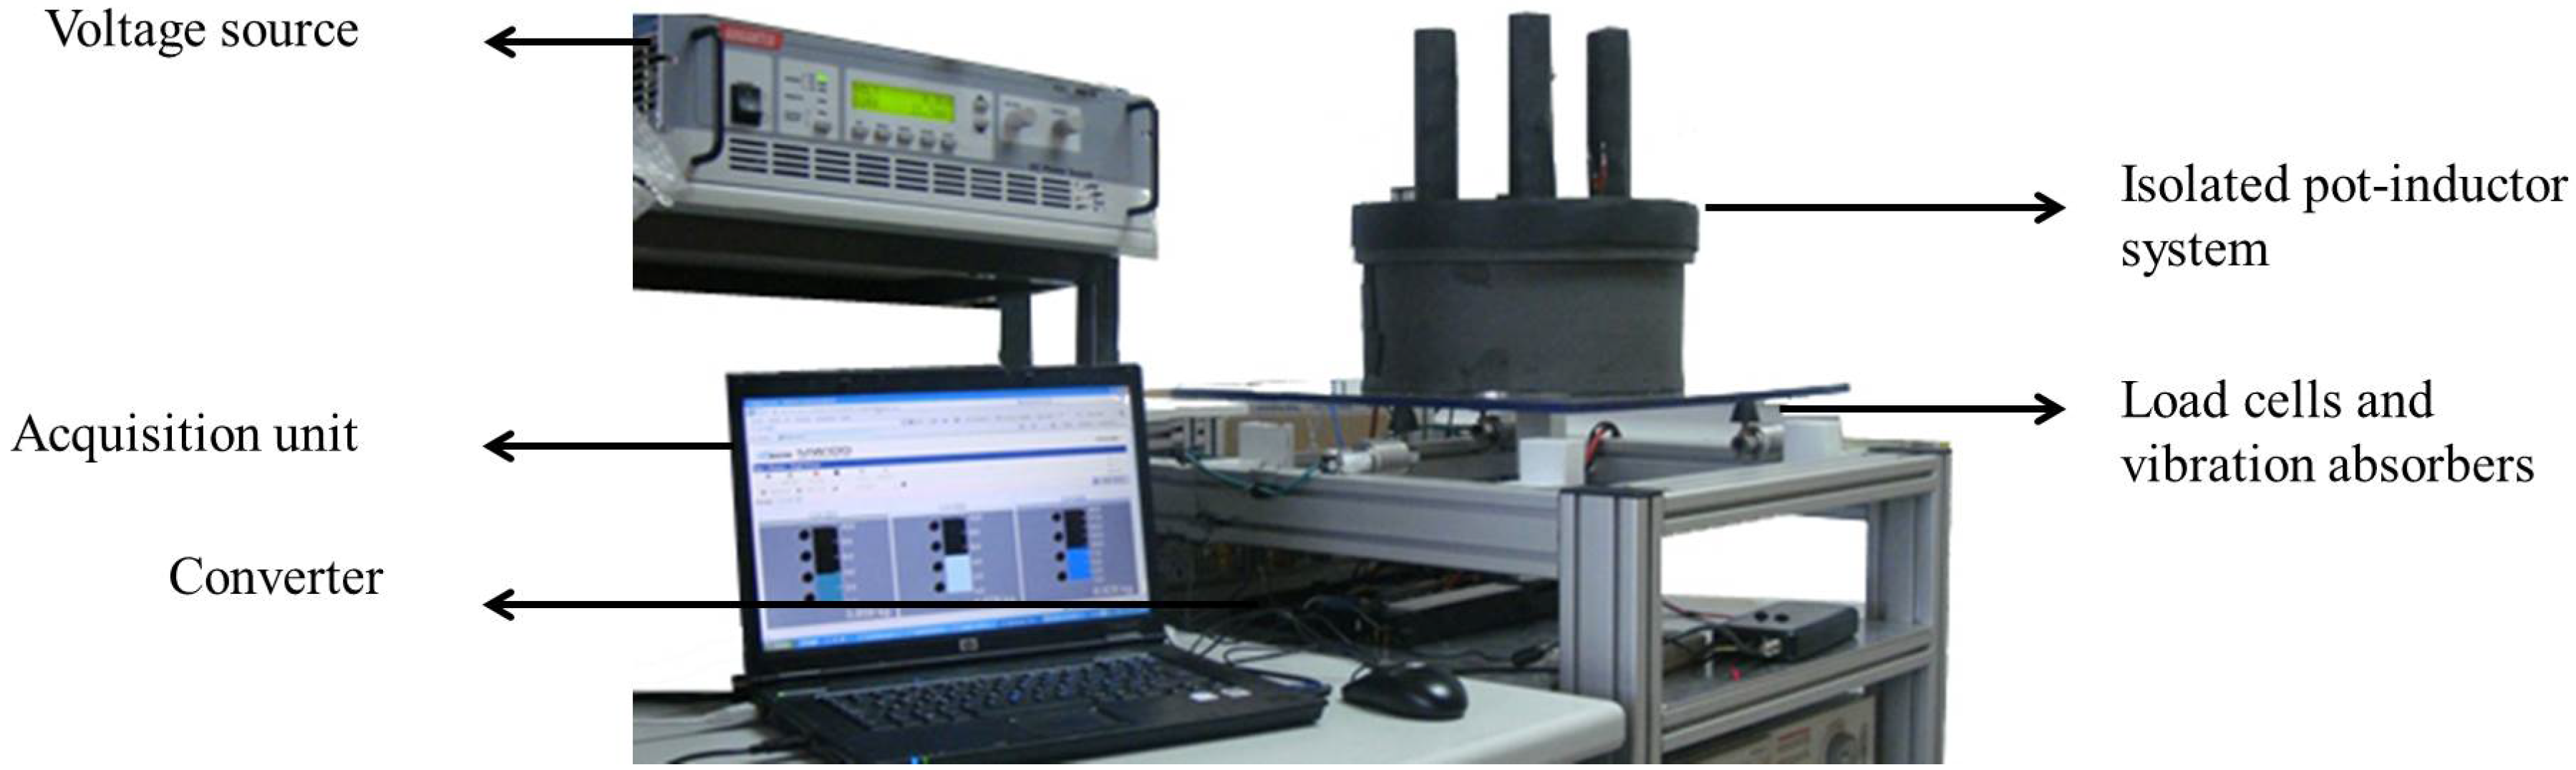
The measuring station is controlled by a MATLAB script with its respective interface. The measured data is sent in real time to the computer, which processes them and controls the delivered power and the inverter switching frequency. This allows to pre-set a number of tests to be run autonomously while the process can be monitored and supervised on the computer interface. The complete test-bench is shown in
Figure 9.
5. Test-Bench Calibration
An important part of the efficiency estimation relies on the weight measurements accuracy. Therefore, the correct calibration of the load cells before every set of experiments becomes essential. For calibration purposes, a particular scenario with known solution will be measured.
Lets consider the inductor-pot system with the external resistance immersed in the water. The inductor is turned off, i.e.,
, so the only input power in the system comes from the resistor,
. Under such conditions,
keeps the water boiling and
is lost by convection to the air. This can be expressed as:
Several experiments were carried out at different power levels in order to obtain the boiling rate. For instance,
Figure 10 shows the weight of the system with respect to time when supplying 592 W.
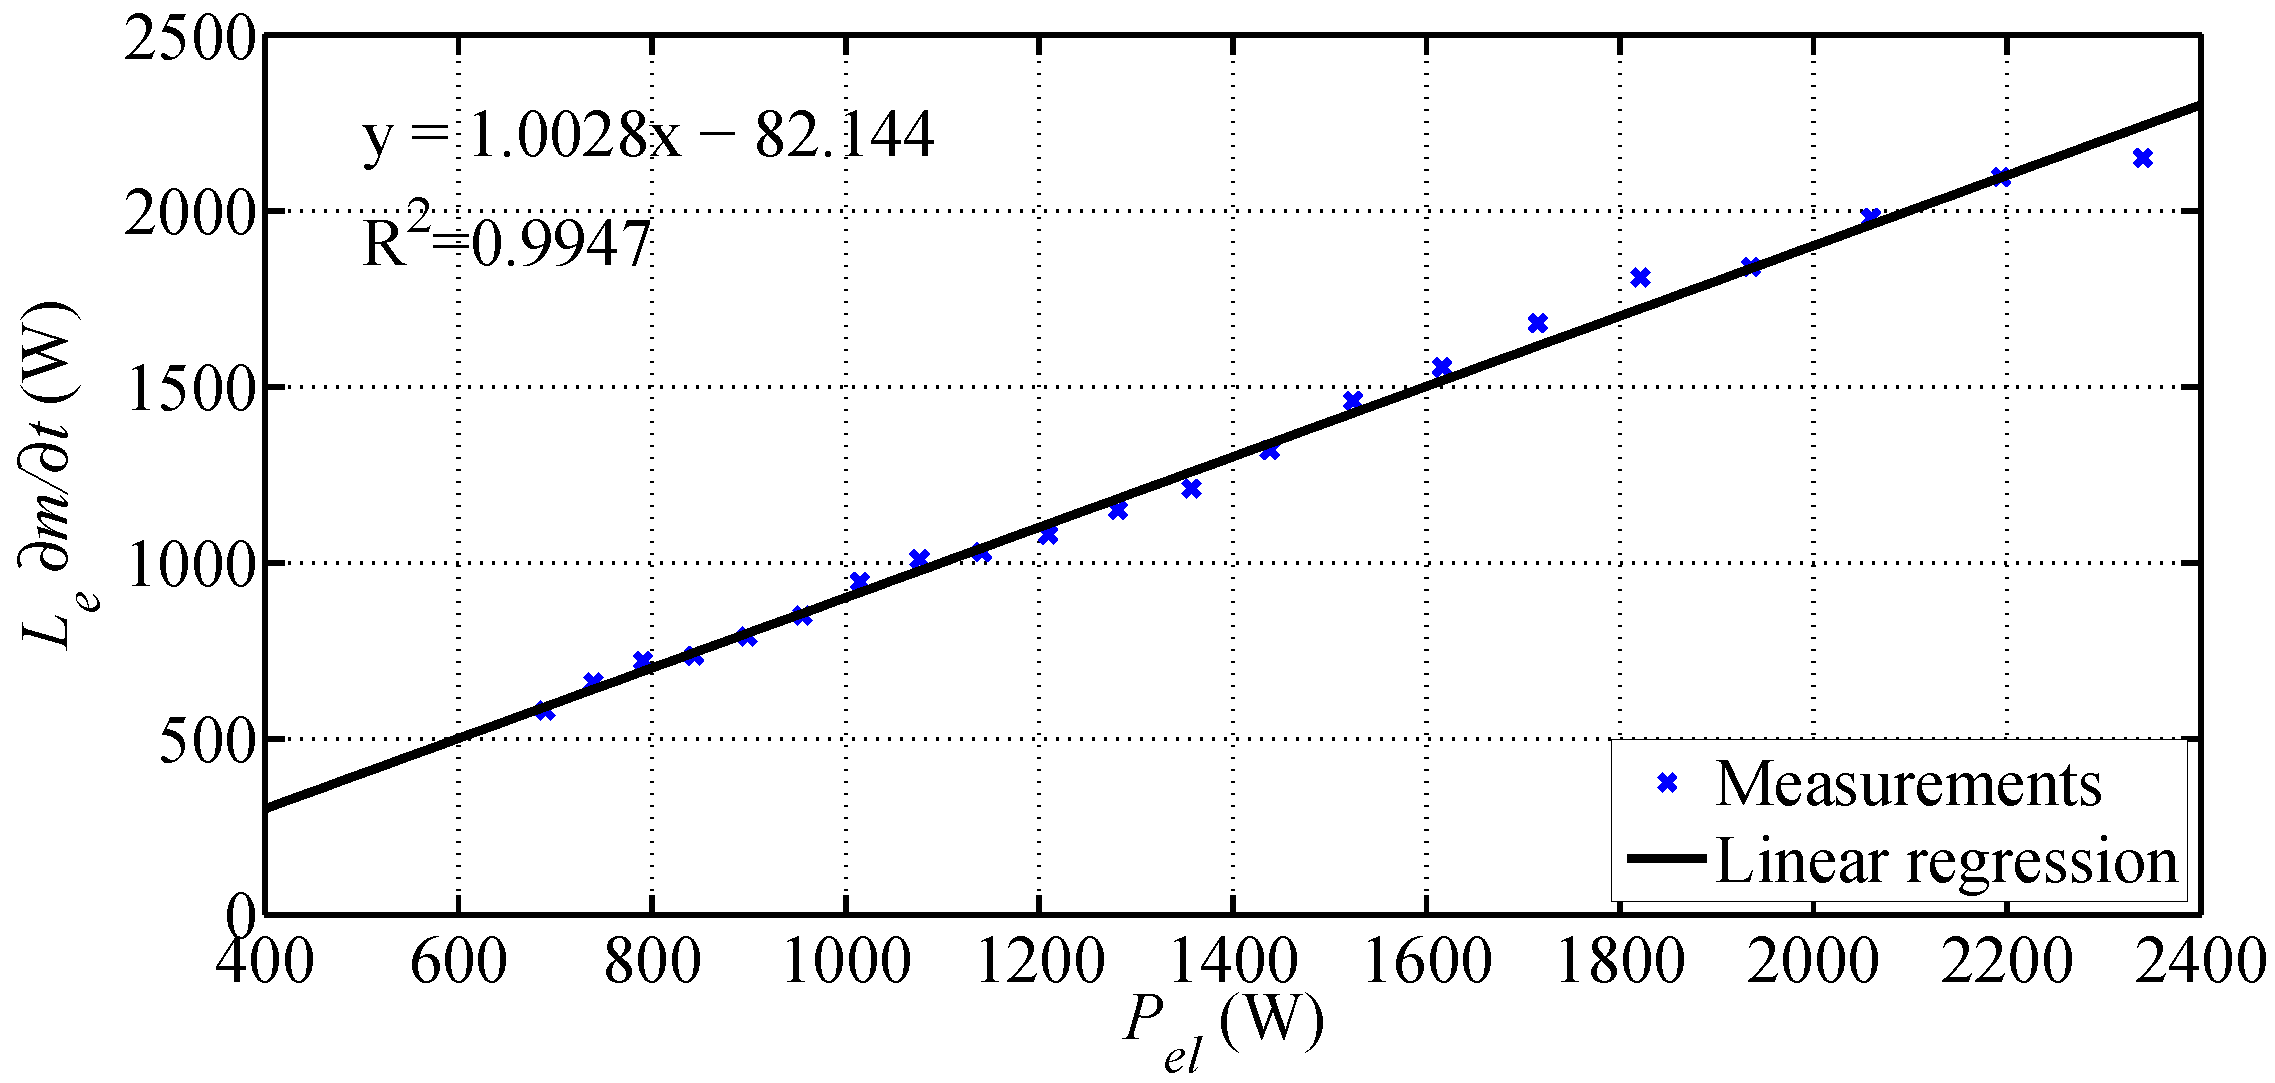
By repeating this experiment with several power levels,
can be represented with respect to
. Analogously to
Figure 4, the slope of the linear regression is the efficiency, which in this case is known. As the resistance is immersed in the water, the efficiency must be equal to 1. This known solution serves as calibrating reference. The results of a calibration test are shown in
Figure 11. In this example, an efficiency of 100.28% is measured, which indicates a 0.28% error. Moreover, the value of the heat flow to the air is given by the linear regression offset,
W. After several calibration tests with similar results, we can conclude that an accuracy of at least
is ensured as the calibration experiments show high reproducibility with small errors.
6. Experimental Results
In this section, the main experimental results will be presented. The differential method will be applied on a commercial induction system in order to obtain the induction efficiency at different excitation frequencies. With this purpose, four sets of measurements will be carried out, one for each explored frequency: 40 kHz, 50 kHz, 60 kHz, 70 kHz. Firstly, the partial results for each frequency will be presented and then, the resulting induction efficiency will be shown.
Induction Efficiency
Losses in AC-fed windings largerly depend on the frequency of the driven current [
20]. Therefore, considering a specific application, the winding can be optimized for a certain frequency by the correct choice of the number and diameter of strands [
21]. For this set of measurements a commercial inductor has been employed. The winding was designed to work between 35 and 75 kHz with optimal operation at 40 kHz. The inductor-pot system efficiency has been measured in this range of frequencies in order to study its frequency dependence.
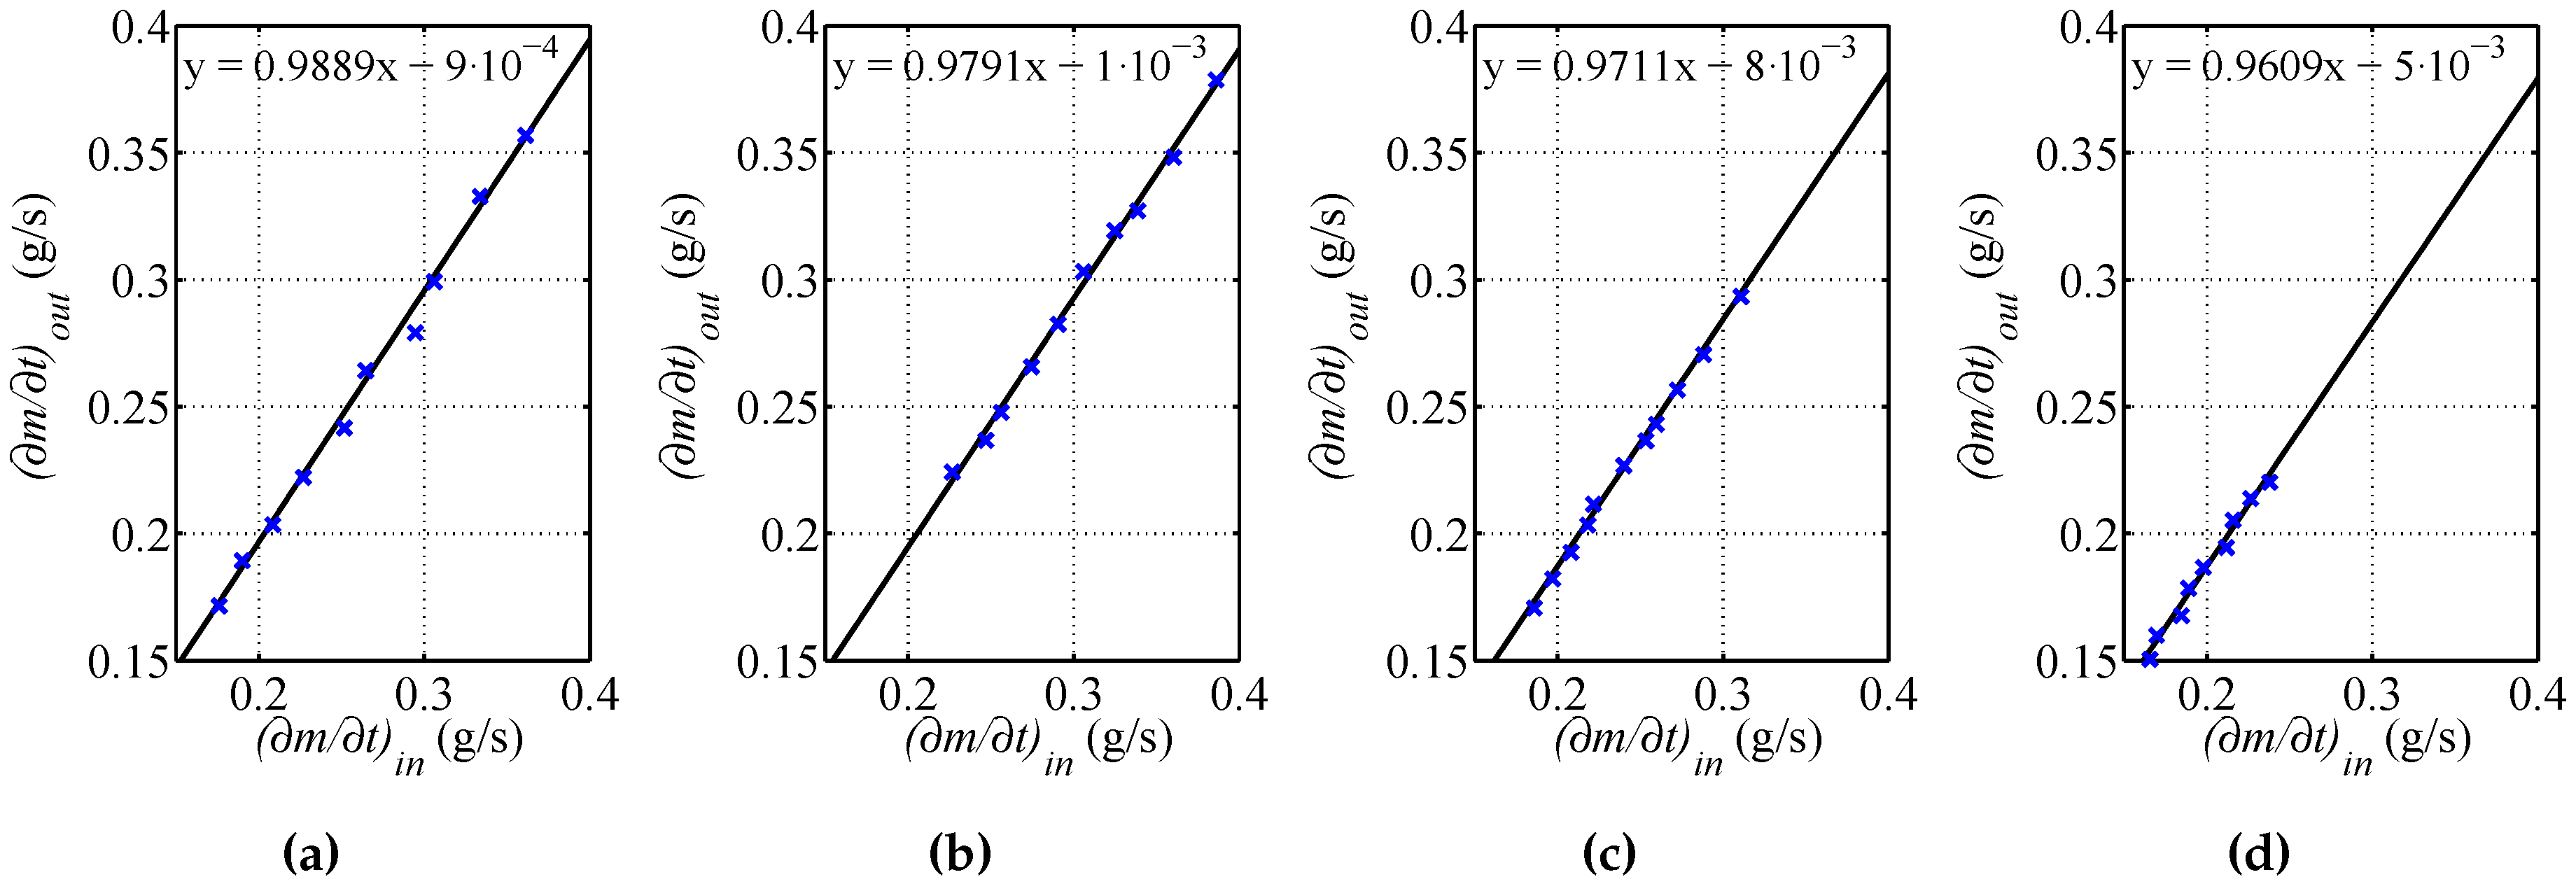
As seen above (
Figure 8), the chosen converter topology for this setup is a half-bridge inverter with a variable voltage source,
. With such arrangement, the switching frequency can remain constant while supplying different power levels. Several experiments have been run feeding the inverter with different voltage levels at each frequency. The obtained boiling rates in both scenarios (
in and
out) are shown in
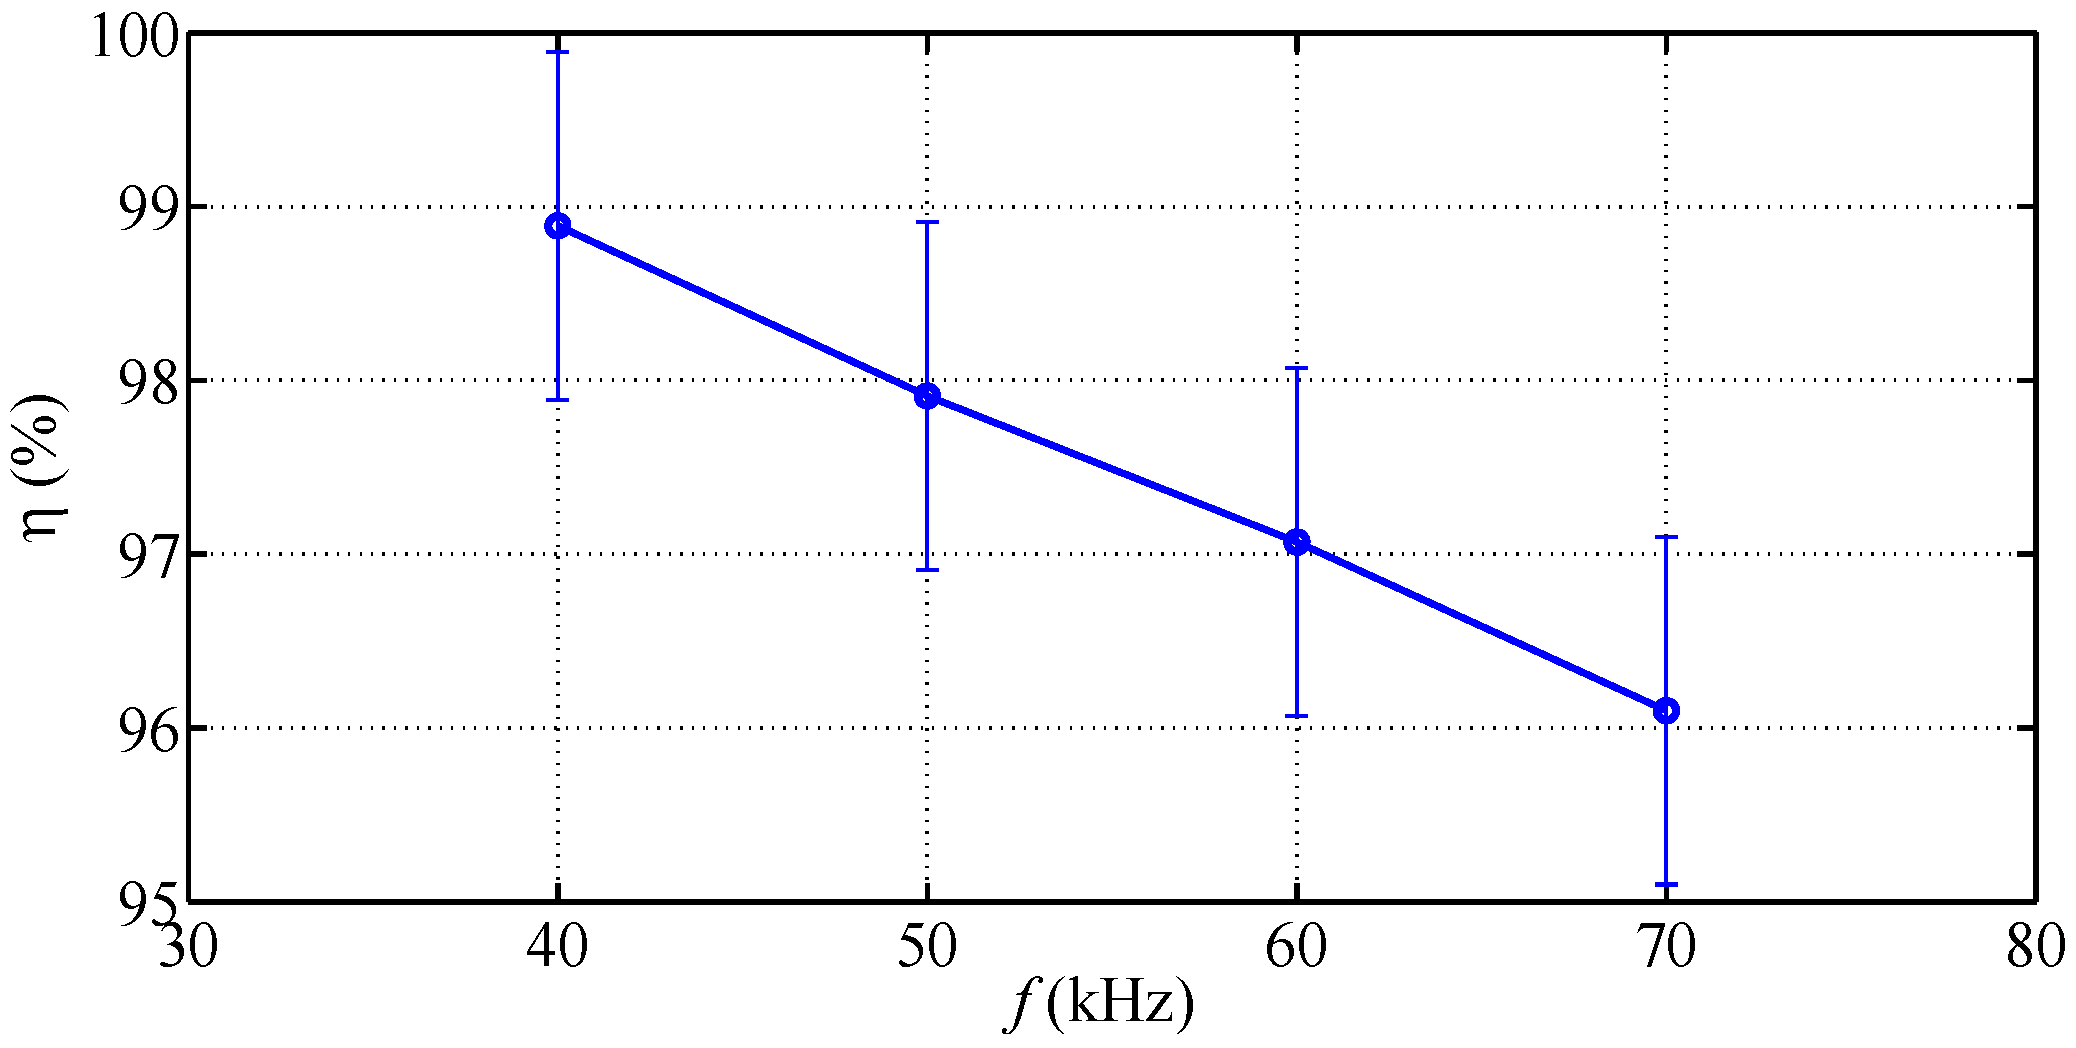
Figure 12. As expected, the results fall onto a straight line whose slope represents the efficiency at the tested switching frequency. The resulting frequency-dependent efficiency is shown in
Figure 13.
The measured efficiencies are consistent as they fall within the expected range (95% to 99%) and have a decreasing trend with frequency since the tested winding is optimized for a frequency of 40 kHz. The measurement of lower frequencies is limited by the commercial inverter.
7. Conclusions
In this work, a method for measuring the efficiency in domestic induction heating appliances is proposed. The method is based on the energy balance in an inductor-pot system in steady-state operation and avoids the use of electrical power analyzers which, at high frequencies, produce a significant error in the measurements. Alternatively, a differential method is proposed. This procedure compares the boiling rate of a certain induction system to the boiling rate of a 100% efficient system. The boiling rate of the commercial induction system is always smaller, and the lower efficiency (less power reaches the water) is the underlying reason for this.
An experimental setup was designed, built and tested. The test-bench consists on a inductor-pot system in which the pot base can be reversed, immersing the inductor in water. This provides a 100% efficient system as the losses in the winding are also transmitted to the water. The system is assembled on a weighting system formed by three load cells and an acquisition unit, which records the boiling rate. Moreover, the whole setup is automatized and run autonomously by a control unit.
The measuring station was tested with a commercial cooktop. The converter and inductor were integrated into the test-bench and measured. The obtained efficiency is consistent with the expected results and are proven to have an accuracy of at least , while the avoided electrical power analyzers add a error at the range of frequencies of the application.
The constructed setup constitutes a useful tool for the efficiency characterization of inductors for domestic induction heating appliances. The method is systematic and provides a rigorous measurement of the designed inductors in the same conditions in order to find the most efficient design in early stages of the product development process.
Acknowledgments
This work was partly supported by the Spanish Ministry of Economy and Competitiveness (MINECO) under Projects TEC2013-42937-R and RTC-2014-1847-6, by the DGA-FSE, and by the BSH Home Appliances Group.
Author Contributions
Jesús Acero, Rafael Navarro and Claudio Carretero designed and performed the experiments; Javier Serrano, Ignacio Lope and José Miguel Burdío analyzed and processed the data and wrote the paper.
Conflicts of Interest
The authors declare no conflict of interest. The founding sponsors had no role in the design of the study; in the collection, analyses, or interpretation of data; in the writing of the manuscript, and in the decision to publish the results.
References
- Thollander, P.; Palm, J. Industrial Energy Management Decision Making for Improved Energy Efficiency Strategic System Perspectives and Situated Action in Combination. Energies 2015, 8, 5694–5703. [Google Scholar] [CrossRef]
- Nishant, R.; Teo, T.S.H.; Goh, M. Energy Efficiency Benefits: Is Technophilic Optimism Justified? IEEE Trans. Eng. Manag. 2014, 61, 476–487. [Google Scholar] [CrossRef]
- Parasiliti, F.; Villani, M.; Castello, M. PM Brushless DC Motor with exterior rotor for high efficiency household appliances. In Proceedings of the 2014 International Conference Electrical Machines (ICEM), Berlin, Germany, 2–5 September 2014; pp. 623–628.
- Arsov, L.; Mircevski, S.; Iljazi, I.; Arsova, I.; Cundeva, M. Energy efficiency of the new household appliances. In Proceedings of the 2013 15th European Conference on Power Electronics and Applications (EPE), Lille, France, 2–6 September 2013; pp. 1–9.
- Acero, J.; Burdío, J.; Barragán, L.; Navarro, D.; Alonso, R.; Garcia, J.; Monterde, F.; Hernandez, P.; Llorente, S.; Garde, I. The domestic induction heating appliance: An overview of recent research. In Proceedings of the Twenty-Third Annual IEEE Applied Power Electronics Conference and Exposition (APEC 2008), Austin, TX, USA, 24–28 February 2008; pp. 651–657.
- Lucía, O.; Maussion, P.; Dede, E.; Burdío, J. Induction Heating Technology and Its Applications: Past Developments, Current Technology, and Future Challenges. IEEE Trans. Ind. Electron. 2014, 61, 2509–2520. [Google Scholar] [CrossRef]
- Pantic, Z.; Bai, S.; Lukic, S.M. ZCS LCC-Compensated Resonant Inverter for Inductive-Power-Transfer Application. IEEE Trans. Ind. Electron. 2011, 58, 3500–3510. [Google Scholar] [CrossRef]
- Lucía, O.; Burdío, J.; Millán, I.; Acero, J.; Barragán, L. Efficiency-Oriented Design of ZVS Half-Bridge Series Resonant Inverter With Variable Frequency Duty Cycle Control. IEEE Trans. Power Electron. 2010, 25, 1671–1674. [Google Scholar] [CrossRef]
- Du, Y.; Lukic, S.M.; Jacobson, B.S.; Huang, A.Q. Modulation Technique to Reverse Power Flow for the Isolated Series Resonant DC/DC Converter With Clamped Capacitor Voltage. IEEE Trans. Ind. Electron. 2012, 59, 4617–4628. [Google Scholar] [CrossRef]
- Lope, I.; Acero, J.; Carretero, C. Analysis and Optimization of the Efficiency of Induction Heating Applications With Litz-Wire Planar and Solenoidal Coils. IEEE Trans. Power Electron. 2016, 31, 5089–5101. [Google Scholar] [CrossRef]
- Wei, X.; Wang, Z.; Dai, H. A Critical Review of Wireless Power Transfer via Strongly Coupled Magnetic Resonances. Energies 2014, 7, 4316–4341. [Google Scholar] [CrossRef]
- Wang, Z.; Wei, X.; Dai, H. Design and Control of a 3 kW Wireless Power Transfer System for Electric Vehicles. Energies 2016, 9, 10. [Google Scholar] [CrossRef]
- Puccetti, G.; Reggiani, U.; Sandrolini, L. Experimental Analysis of Wireless Power Transmission with Spiral Resonators. Energies 2013, 6, 5887–5896. [Google Scholar] [CrossRef]
- Cao, W.; Bradley, K.J.; Ferrah, A. Development of a High-Precision Calorimeter for Measuring Power Loss in Electrical Machines. IEEE Trans. Instrum. Meas. 2009, 58, 570–577. [Google Scholar] [Green Version]
- Blaabjerg, F.; Pedersen, J.K.; Ritchie, E. Calorimetric measuring systems for characterizing high frequency power losses in power electronic components and systems. In Proceedings of the 37th IAS Annual Meeting. Conference Record of the Industry Applications Conference, Pittsburgh, PA, USA, 13–18 October 2002; Volume 2, pp. 1368–1376.
- Lee, M.Y.; Lee, H.S.; Won, H.P. Characteristic Evaluation on the Cooling Performance of an Electrical Air Conditioning System Using R744 for a Fuel Cell Electric Vehicle. Energies 2012, 5, 1371–1383. [Google Scholar] [CrossRef]
- Forest, F.; Huselstein, J.J.; Faucher, S.; Elghazouani, M.; Ladoux, P.; Meynard, T.A.; Richardeau, F.; Turpin, C. Use of opposition method in the test of high-power electronic converters. IEEE Trans. Ind. Electron. 2006, 53, 530–541. [Google Scholar] [CrossRef]
- Carretero, C.; Acero, J.; Alonso., R. TM-TE Decomposition of Power Losses in Multi-Stranded Litz-Wires used in Electronic Devices. Prog. Electromagn. Res. 2012, 123, 83–103. [Google Scholar] [CrossRef]
- Yokogawa Electric Corporation. PZ4000 Power Analyzer User’s Manual; Yokogawa Electric Corporation: Tokyo, Japan, 2000. [Google Scholar]
- Sullivan, C.R. Computationally efficient winding loss calculation with multiple windings, arbitrary waveforms, and two-dimensional or three-dimensional field geometry. IEEE Trans. Power Electron. 2001, 16, 142–150. [Google Scholar] [CrossRef]
- Sullivan, C. Optimal choice for number of strands in a litz-wire transformer winding. IEEE Trans. Power Electron. 1999, 14, 283–291. [Google Scholar] [CrossRef]
© 2016 by the authors; licensee MDPI, Basel, Switzerland. This article is an open access article distributed under the terms and conditions of the Creative Commons Attribution (CC-BY) license (http://creativecommons.org/licenses/by/4.0/).


 ,
, 