Article

Hysteresis Characteristic in the Hump Region of a Pump-Turbine Model

1
School of Energy Science and Engineering, Harbin Institute of Technology, Harbin 150001, China
2
Waterpower Laboratory, Norwegian University of Science and Technology, Trondheim 7491, Norway
3
State Key Laboratory of Hydro-Power Equipment, Harbin Institute of Large Electrical Machinery, Harbin 150040, China
*
Author to whom correspondence should be addressed.
Energies 2016, 9(8), 620; https://doi.org/10.3390/en9080620
Submission received: 15 April 2016 / Revised: 25 June 2016 / Accepted: 29 July 2016 / Published: 5 August 2016

Abstract

:
The hump feature is one of the major instabilities in pump-turbines. When pump-turbines operate in the hump region, strong noise and serious fluctuations can be observed, which are harmful to their safe and stable operation and can even destroy the whole unit as well as water conveyance system. In this paper, a low specific speed (nq = 36.1 min−1) pump-turbine model was experimentally investigated. Firstly, the hump characteristic was obtained under 19 mm guide vane opening conditions. More interestingly, when the hump characteristic was measured in two directions (increasing and decreasing the discharge), characteristic hysteresis was found in the hump region. The analysis of performance characteristics reveals that the hump instability is the result of Euler momentum and hydraulic losses, and different Euler momentum and hydraulic losses in the two development processes lead to the hysteresis phenomenon. Then, 12 pressure sensors were mounted in the different parts of the pump-turbine model to obtain the time and frequency characteristics. The analysis of the corresponding fast Fourier transform confirms that the hump characteristic is related to low-frequency (0.04–0.15 times rotational frequency) vortices. The occurrence and cessation of vortices depend on the operating condition and measurement direction, which contribute to the hysteresis feature. Finally, the type of the low-frequency vortices was analyzed through the cross power spectrum.

Graphical Abstract

1. Introduction

Due to dramatic increase in renewable energy source use, pumped storage power plants to balance the fluctuations of the electric grid have seen rapid development. As a consequence, pump-turbines need to be able to switch rapidly between the pump mode and turbine mode, which leads to frequent operation under off-design conditions.
Pump-turbines are usually designed prior to pump mode in consideration of the turbine mode, due to which the flow in pump mode is much more sensitive to flow separation and cavitation. Practical results prove this method could make most of the operating conditions in the high efficiency region. However, two instability features could be found under off-design operating conditions in pump-turbines. One occurs in the head-discharge curve under the high head and low discharge operating conditions in pump mode, which is well known as the hump characteristic. Another called S-shaped characteristic appears under turbine brake operating conditions.
With respect to the hump instability characteristic, although the engineers choose the normal operating range outside of the hump region, it is still not avoided when pump-turbines operate under the state of high level water of the reservoir or low frequency of the grid. Figure 1 presents a pump-turbine that undergoes the hump region during the start-up in pump mode. The pump-turbine starts from the 0 mm guide vane opening (GVO), and reaches point A at 11 mm GVO, and then point B at 13 mm GVO. When the GVO opens to 15 mm, the operating point should reach at point C, however, due to the vibration of the water pressure caused by the hump instability characteristic, the operating point jumps to point D. This process will delay the start-up of the pump-turbine in pump mode. Meanwhile, strong noise and serious fluctuations can be observed, which are significantly harmful to the stable and safe operation of pump-turbines.
In recent years, pump-turbines trend to higher head, higher specific speed and larger capacity. As a consequence, more and more researchers have focused on studies of the hump instability characteristic using experimental and numerical methods. The hump characteristic is mainly caused by the prerotation, recirculation [1], and suction surface cavitation [2] at the runner inlet, backflow and vortex motion [3], rotating stall [4,5], and secondary flow pattern [6] in the diffuser channels. Lots of achievements have been obtained, which provide a deep understanding of the hump characteristic.
Interestingly, several researchers found a hysteresis phenomenon in the hump region. When the hump characteristic was measured in the decreasing and increasing discharge directions, a hysteresis loop will be formed. Hysteresis, which is well known in physics, is the time-based dependence of a system’s output on present and past inputs. However, it has rarely been observed in hydraulic machinery. It is firstly described in 1997 by Kaupert and Staubli [7] referring to a high specific speed (ωs = 1.7 s−1) radial pump. When measured in two directions (decreasing or increasing discharge), performance characteristic (H-Q) appears different in the hump region. Then, they carried out a simulation based on experimental validation and concluded that the hysteresis loop is related to the recirculation at the runner inlet. However, this is not necessary condition to form a hysteresis loop. Based on the above research, the same authors continued to perform unsteady pressure fluctuation experiments, and proposed that the hysteresis characteristic which the pressure difference of the pump and impeller experiences is related to the occurrence and cessation of backflow at the impeller inlet and outlet [8,9].
In 2003, Iino et al. [10] presented experimental and numerical studies of a pump with/without fins on the upstream side of the impeller. They found that the pump with fins had a large hysteresis loop, while this phenomenon was not observed in the pump without fins. Through numerical analysis, they concluded that the difference in the hysteresis loop is caused by the existence of the fins, which suppress or promote the backflow at the impeller in the different directions.
In 2012, Ran et al. [11] confirmed this phenomenon also exists in a low specific speed pump-turbine. The same year, they [12] conducted simulations to predict this phenomenon. Numerical analysis shows this might come from the rotating stall in the vaneless space.
In 2015, Ješe also talked about the existence of a hysteresis phenomenon in pump-turbines in his doctoral thesis [13], however he did not carry out any related studies on formation mechanism of the hysteresis characteristic.
To the authors’ knowledge, there are no other papers or reports presenting this interesting phenomenon in hydraulic machinery. Hence, the authors carried out related experiments to investigate why this phenomenon occurs. Usually, the most obvious hump characteristic happens in the relatively small GVO. For the pump-turbine investigated in this research, the hump region under 19 mm GVO is much more obvious, so the hump margin in real operations was chosen according to this GVO to carry out further investigations. Firstly, performance characteristics were obtained under 19 mm GVO in a low specific speed (nq = 36.1 min−1) pump-turbine to validate the existing of the hysteresis phenomenon and find the causes of the hump characteristic. Then, pressure fluctuation measurements were carried out to find the reasons behind the formation of the hysteresis loop. Finally, detailed analysis of time and frequency characteristics was performed to analyze the type of unsteady sources.

2. Experimental Setup

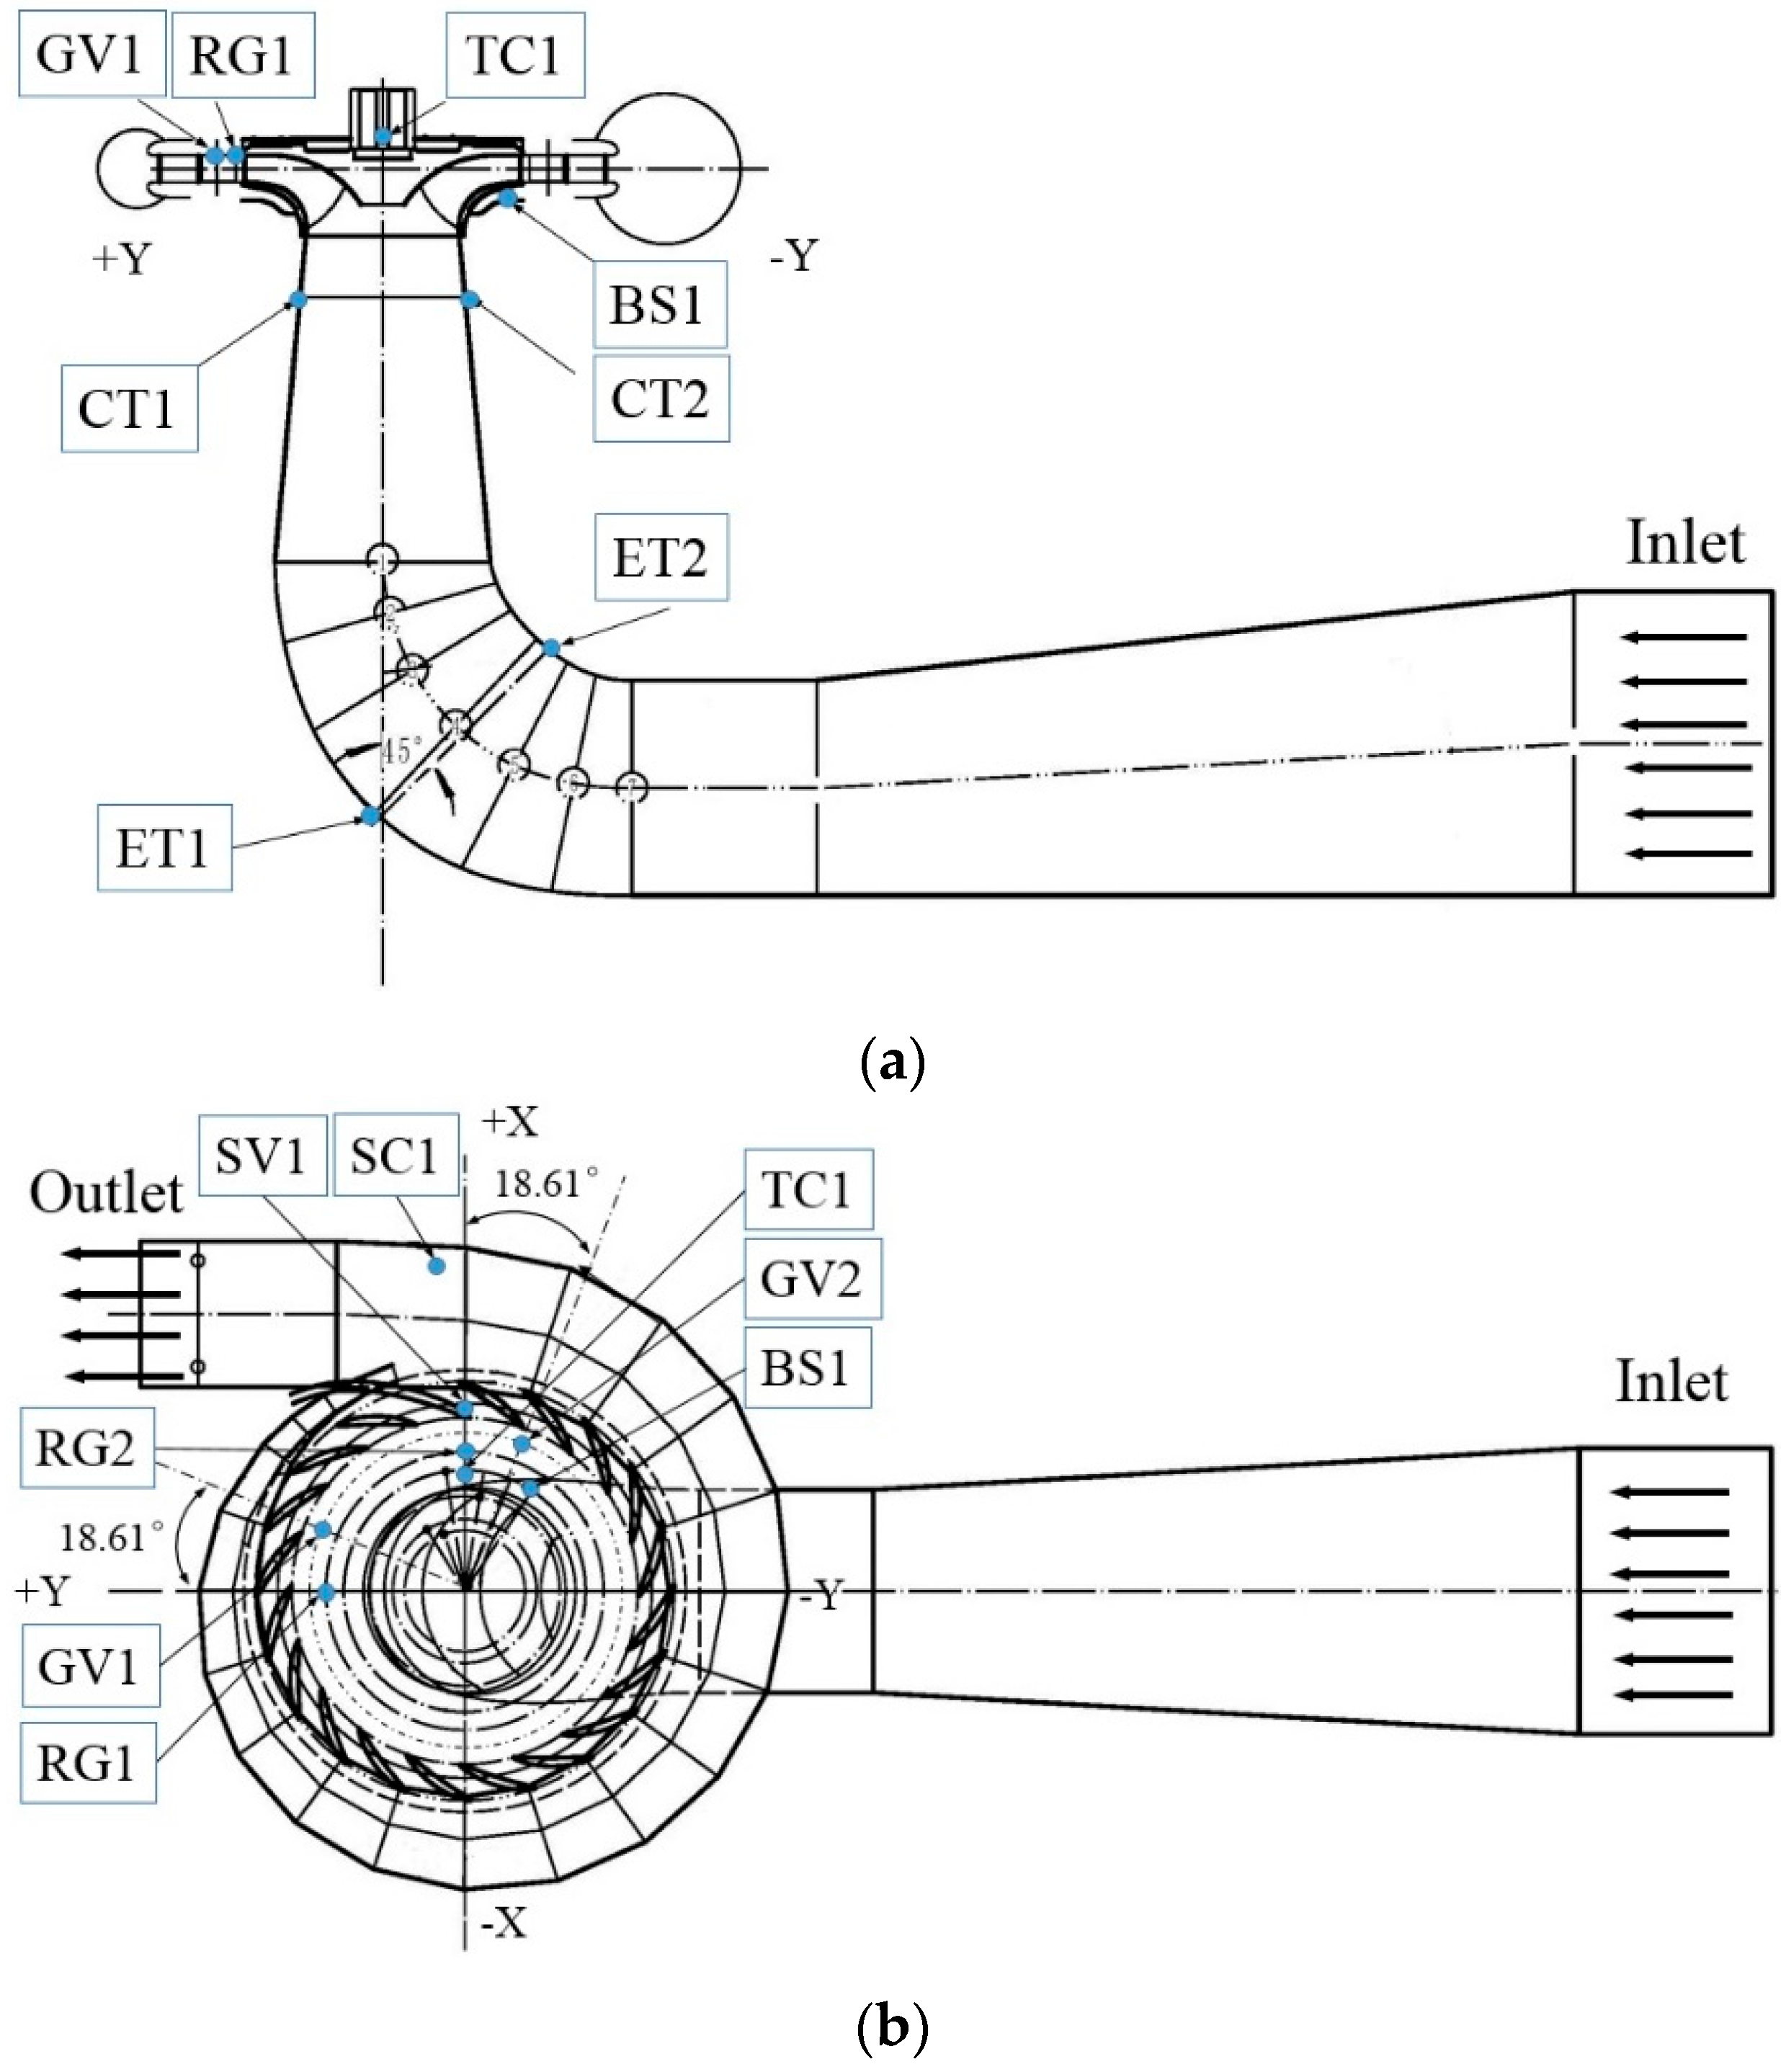
2.1. Pump-Turbine Specification
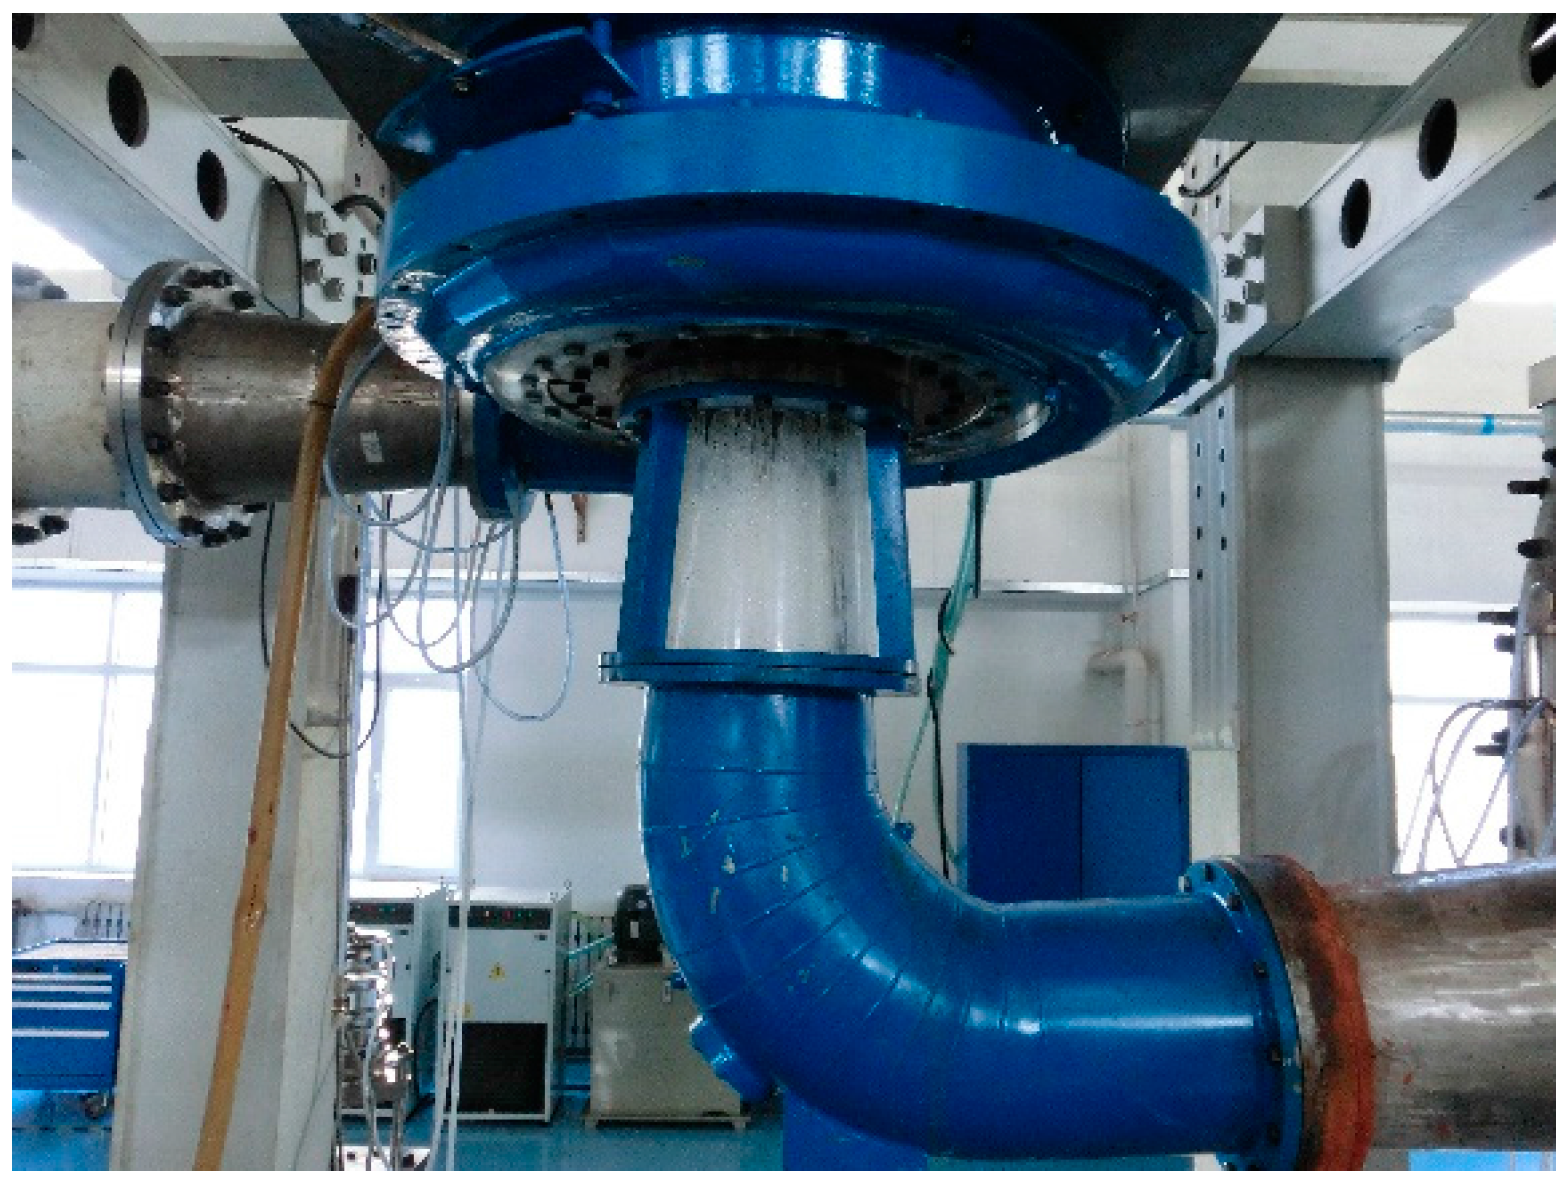
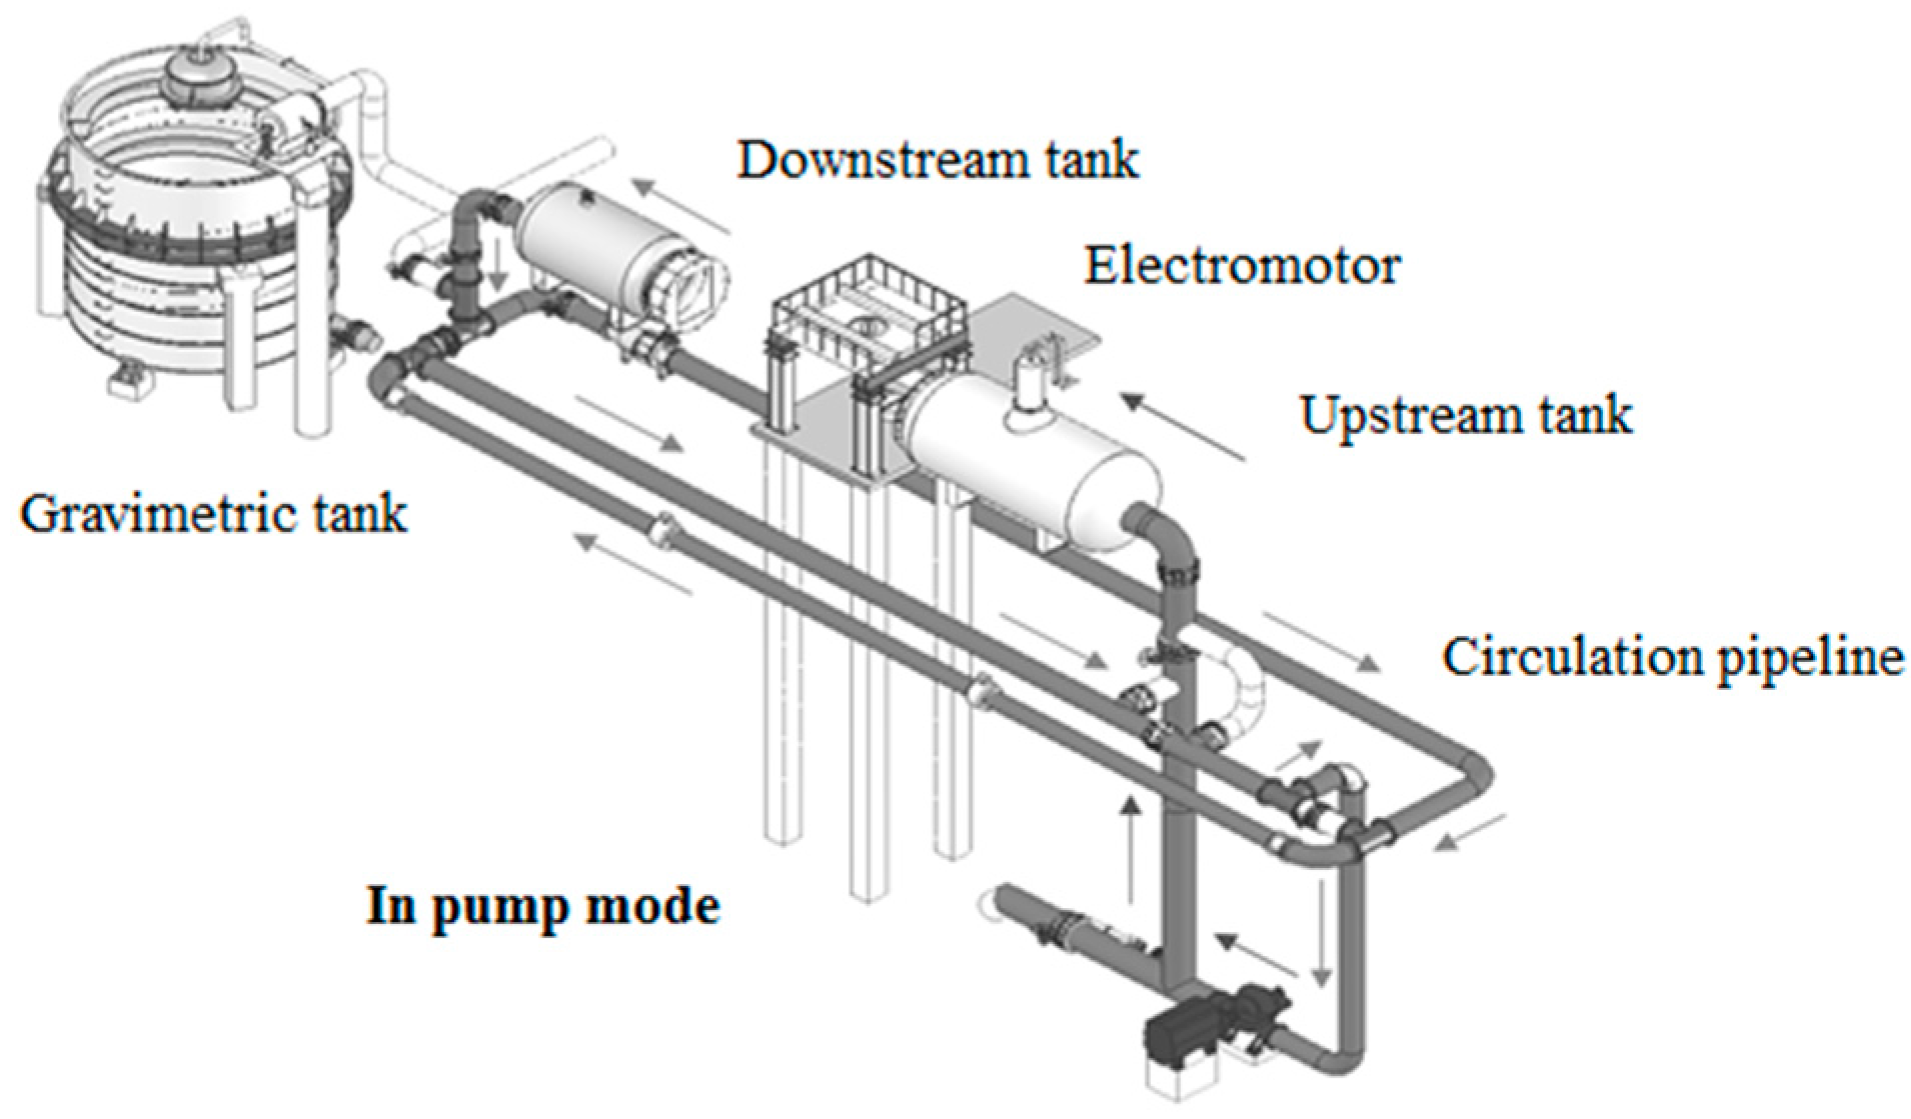
The investigated pump-turbine model is scaled down (1:9.24) from a prototype in a real pumped storage power plant in China. It is a single stage, vertical shaft, low specific speed (nq = 36.1 min−1), Francis pump-turbine. As shown in Figure 2, the pump-turbine consists of a runner with nine blades, 20 guide vanes, 20 stay vanes including a special one, a draft tube and a spiral casing. Detailed information about the main parameters is listed in Table 1.

2.2. Test Rig

The measurements in this research were carried out at the Harbin Institute of Large Electrical Machinery (HILEM), in which six test rigs are available for turbine, pump-turbine and pump performance assessment within an accuracy of 0.2% in a closed loop (maximum head = 80 m, maximum discharge = 0.8 m3·s). The sketch of the test rig is shown in Figure 3. In pump mode, the water from the basement was pumped using an addition water supply pump to the inlet pipe connected with the draft tube, and then passed through the runner, guide vanes, stay vanes, and the spiral casing, and finally back to the basement through the downstream tank. The measurement system was programed by LabVIEW 2014, and NI PXI platform with a PXI-8336 controller and a PXI-1042Q chassis was chosen. Digital, current and pressure signals could be measured with a high sampling rate. Detailed information for the measurement system has been described in [14].

3. Performance Measurements and Analysis

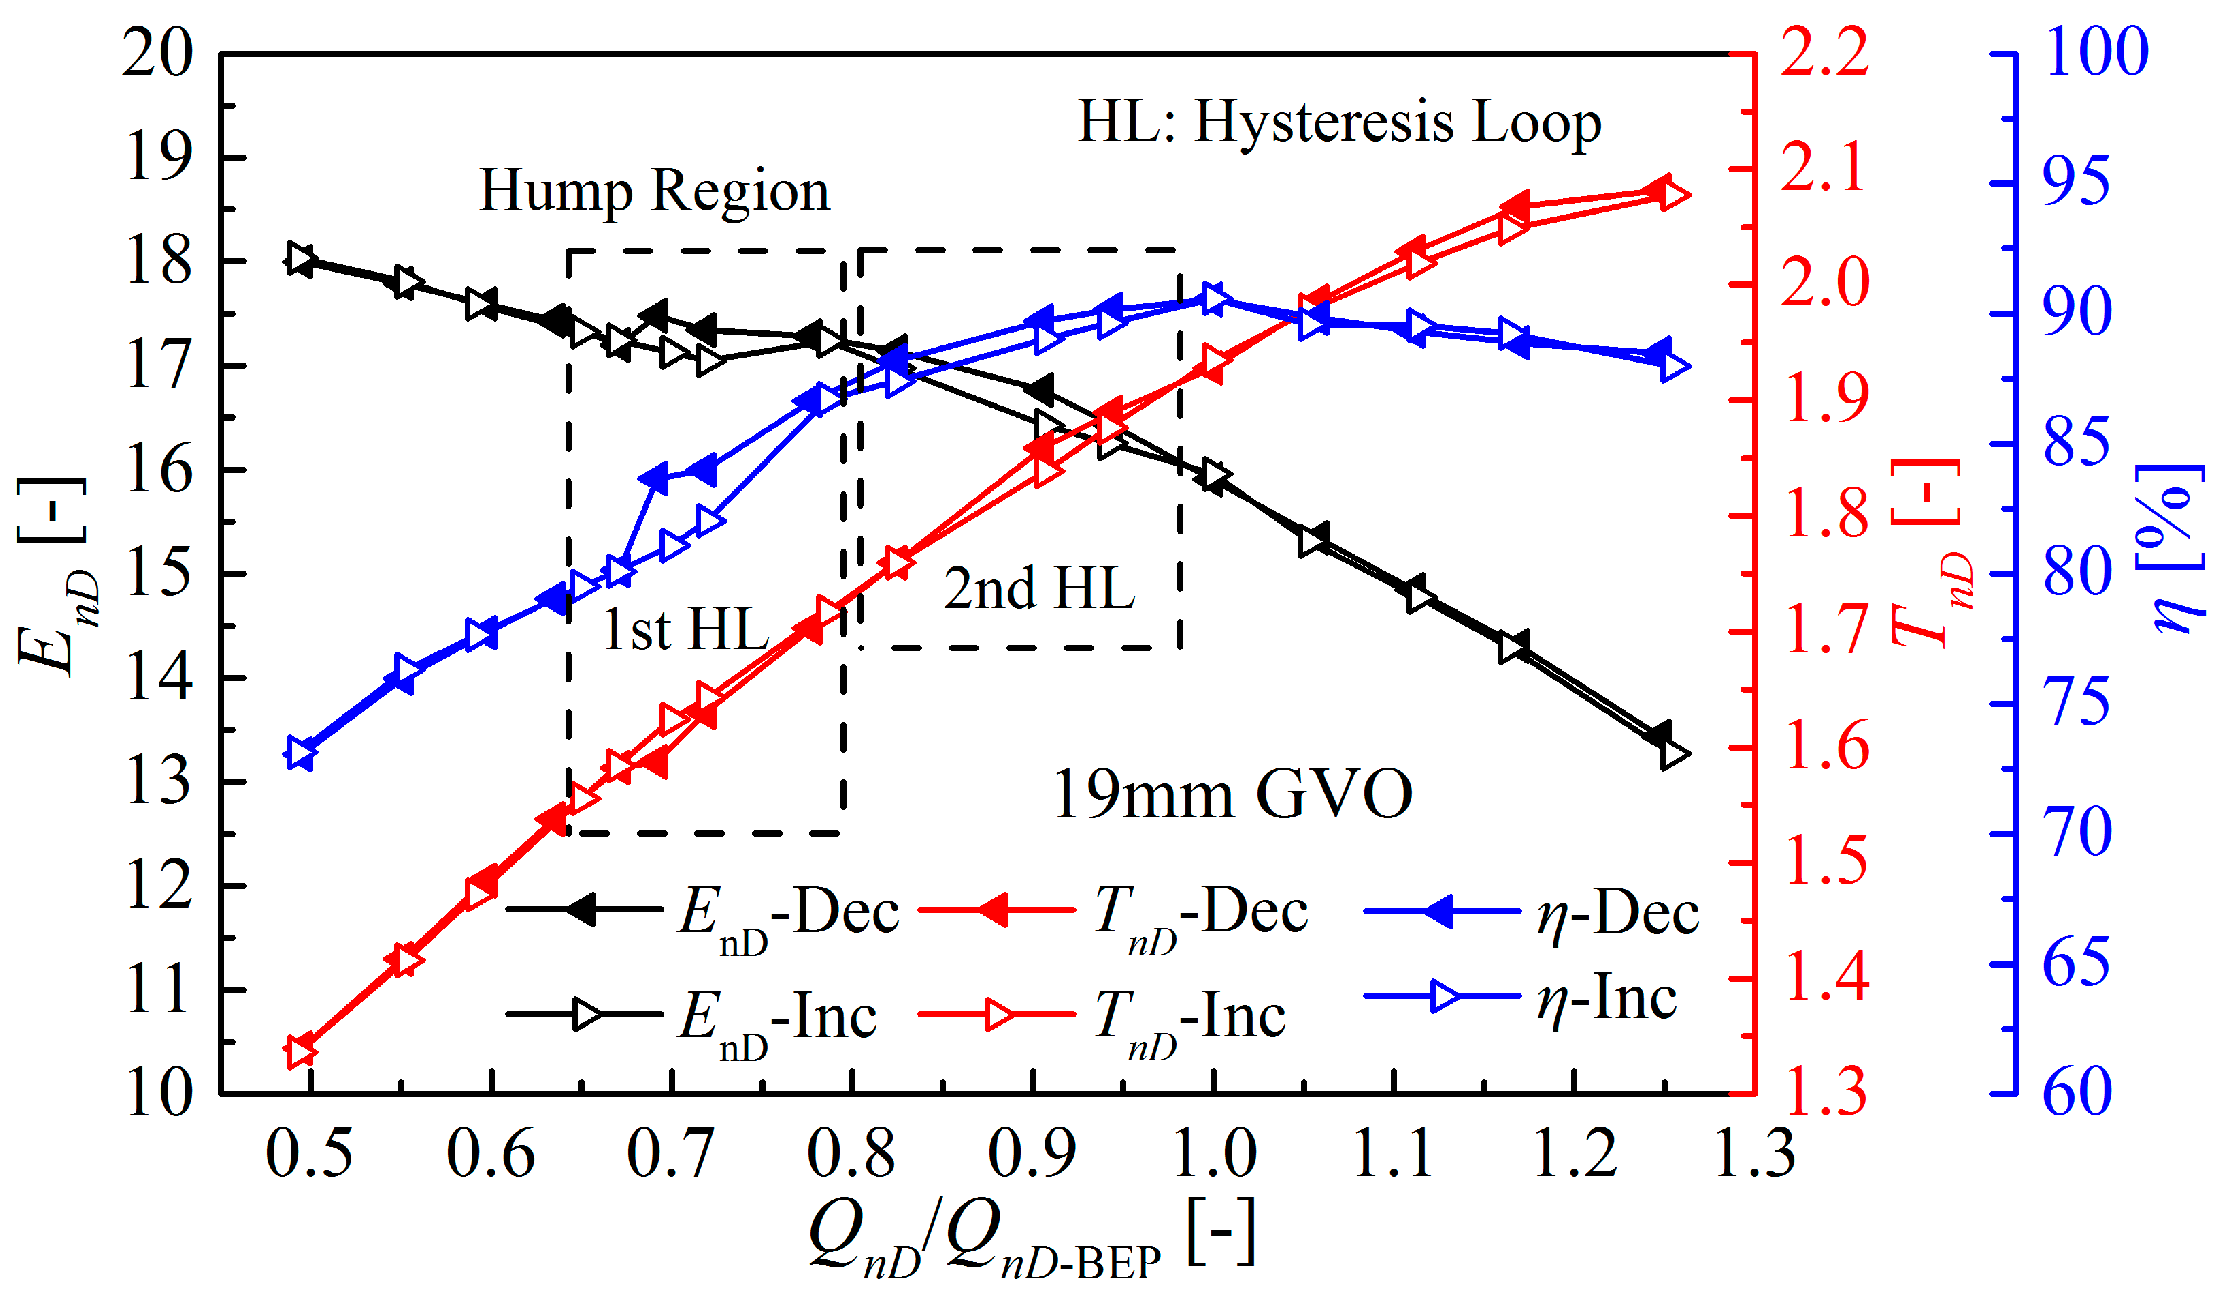
3.1. Performance Measurements

Energy characteristics of the pump-turbine in pump mode were determined under 19 mm GVO without consideration of cavitation, that is, in the measurements the cavitation coefficient was set higher than experimental facility coefficient to avoid the occurrence of the cavitation. The measurements firstly were started from the large discharge operating condition, and decreased the discharge step by step. Then, the measurements were repeated starting from the low discharge operating condition, and increased step by step until the initial state of the first process. All the measurements were processed strictly following the International Electrotechnical Commission (IEC) standards [15], and all the uncertainties are below 0.2%. Performance parameters are normalized according to the following equations [15]:
E n D = g H n 0 2 D 1 2
Q n D = Q n 0 D 1 3
T n D = T ρ n 0 2 D 1 5
Figure 4 depicts the performance characteristics (energy, torque and efficiency). In the figure an obvious hump region is observed in the EnD-QnD curve in the high energy (head) and low discharge region (0.63QBEP-0.78QBEP). More interestingly, an obvious hysteresis phenomenon is found during the hump region. Meanwhile, another small hump region (the energy coefficient shows a downtrend) is found from 0.78QBEP to 0.94QBEP, and a hysteresis loop could also be observed.
In the first hump region, when measured in the decreasing direction, the net energy coefficient begins to drop at the point 0.69QBEP, and a wave valley occurs at point 0.67QBEP. The drop of the net energy coefficient in the decreasing direction is 0.281. When measured in the increasing direction, the net energy coefficient begins to drop at point 0.78QBEP, and the wave valley happens at point 0.72QBEP. The drop in the increasing direction is 0.187. Furthermore, the drop of net energy coefficient between the wave peak point and the wave valley point in the decreasing direction is much higher than that in the increasing direction. However, the position of the occurrence shifts to a larger discharge operating condition in the increasing direction. As for the torque-discharge curve, only a small difference could be found in the obvious hump region, and no obvious hysteresis phenomenon could be observed. Hence, the influence of the torque is relatively small. More detailed analysis will be performed in the following section. The efficiency is the resultant of the torque and head, which also shows an obvious hysteresis phenomenon. Moreover, the efficiency displays a sharp drop from the wave peak point to the wave valley point, which is respectively 3.54% and 4.67% in the decreasing and increasing directions. In the second hump region, the net energy coefficient just shows a decreasing tendency. In the torque-discharge and efficiency-discharge curves, just a small hysteresis loop could be observed. The cause of the hysteresis loop seems to be different from that of the first one. This will be discussed in the next section.

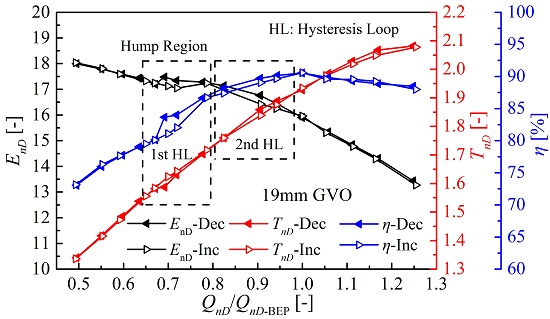
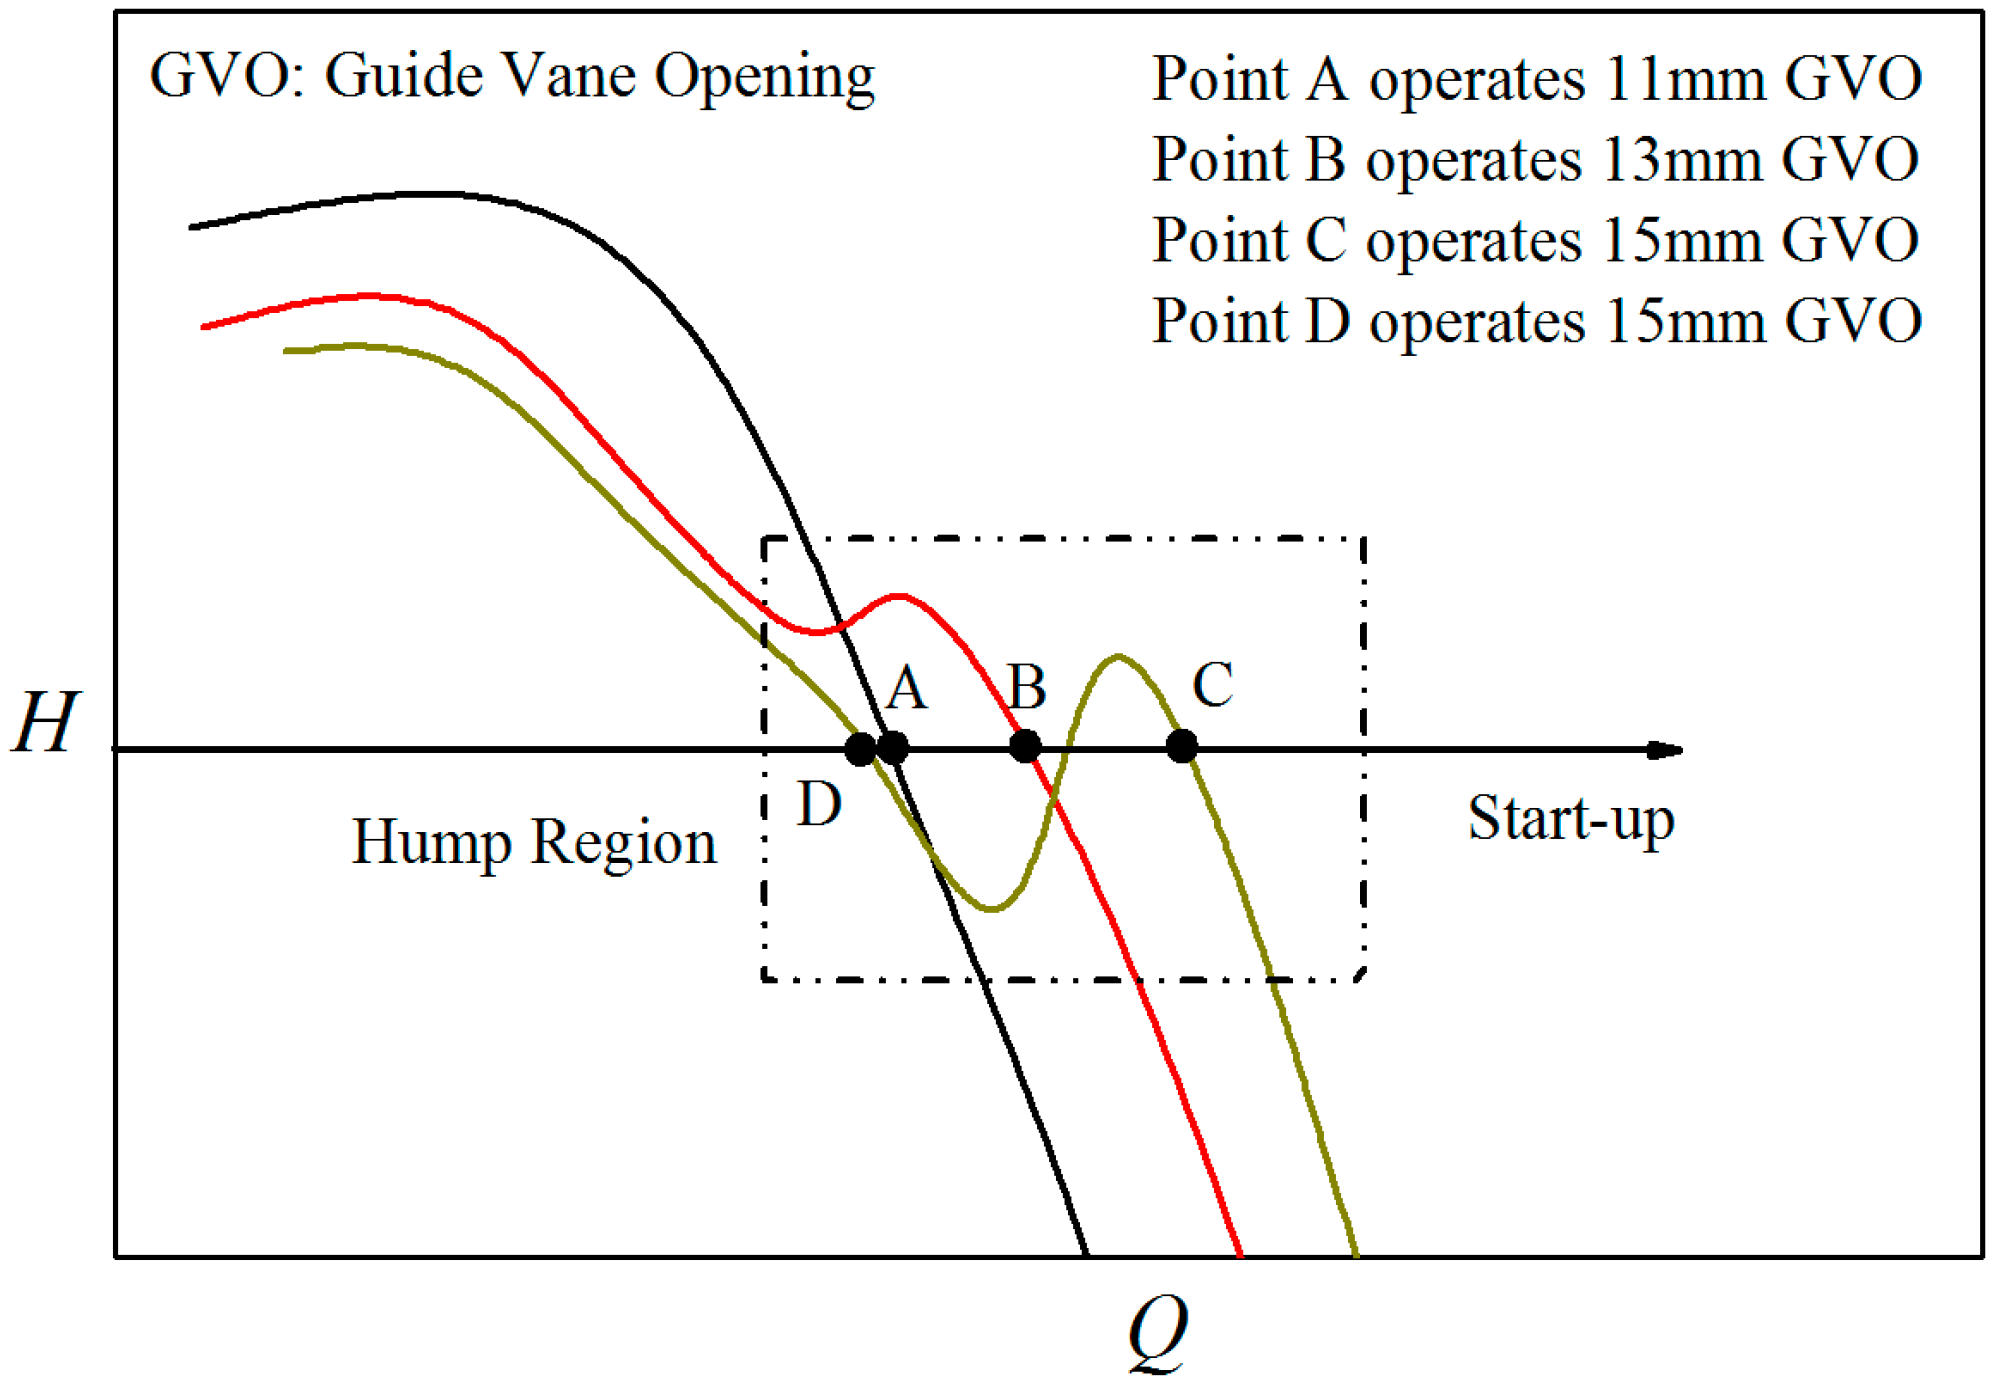
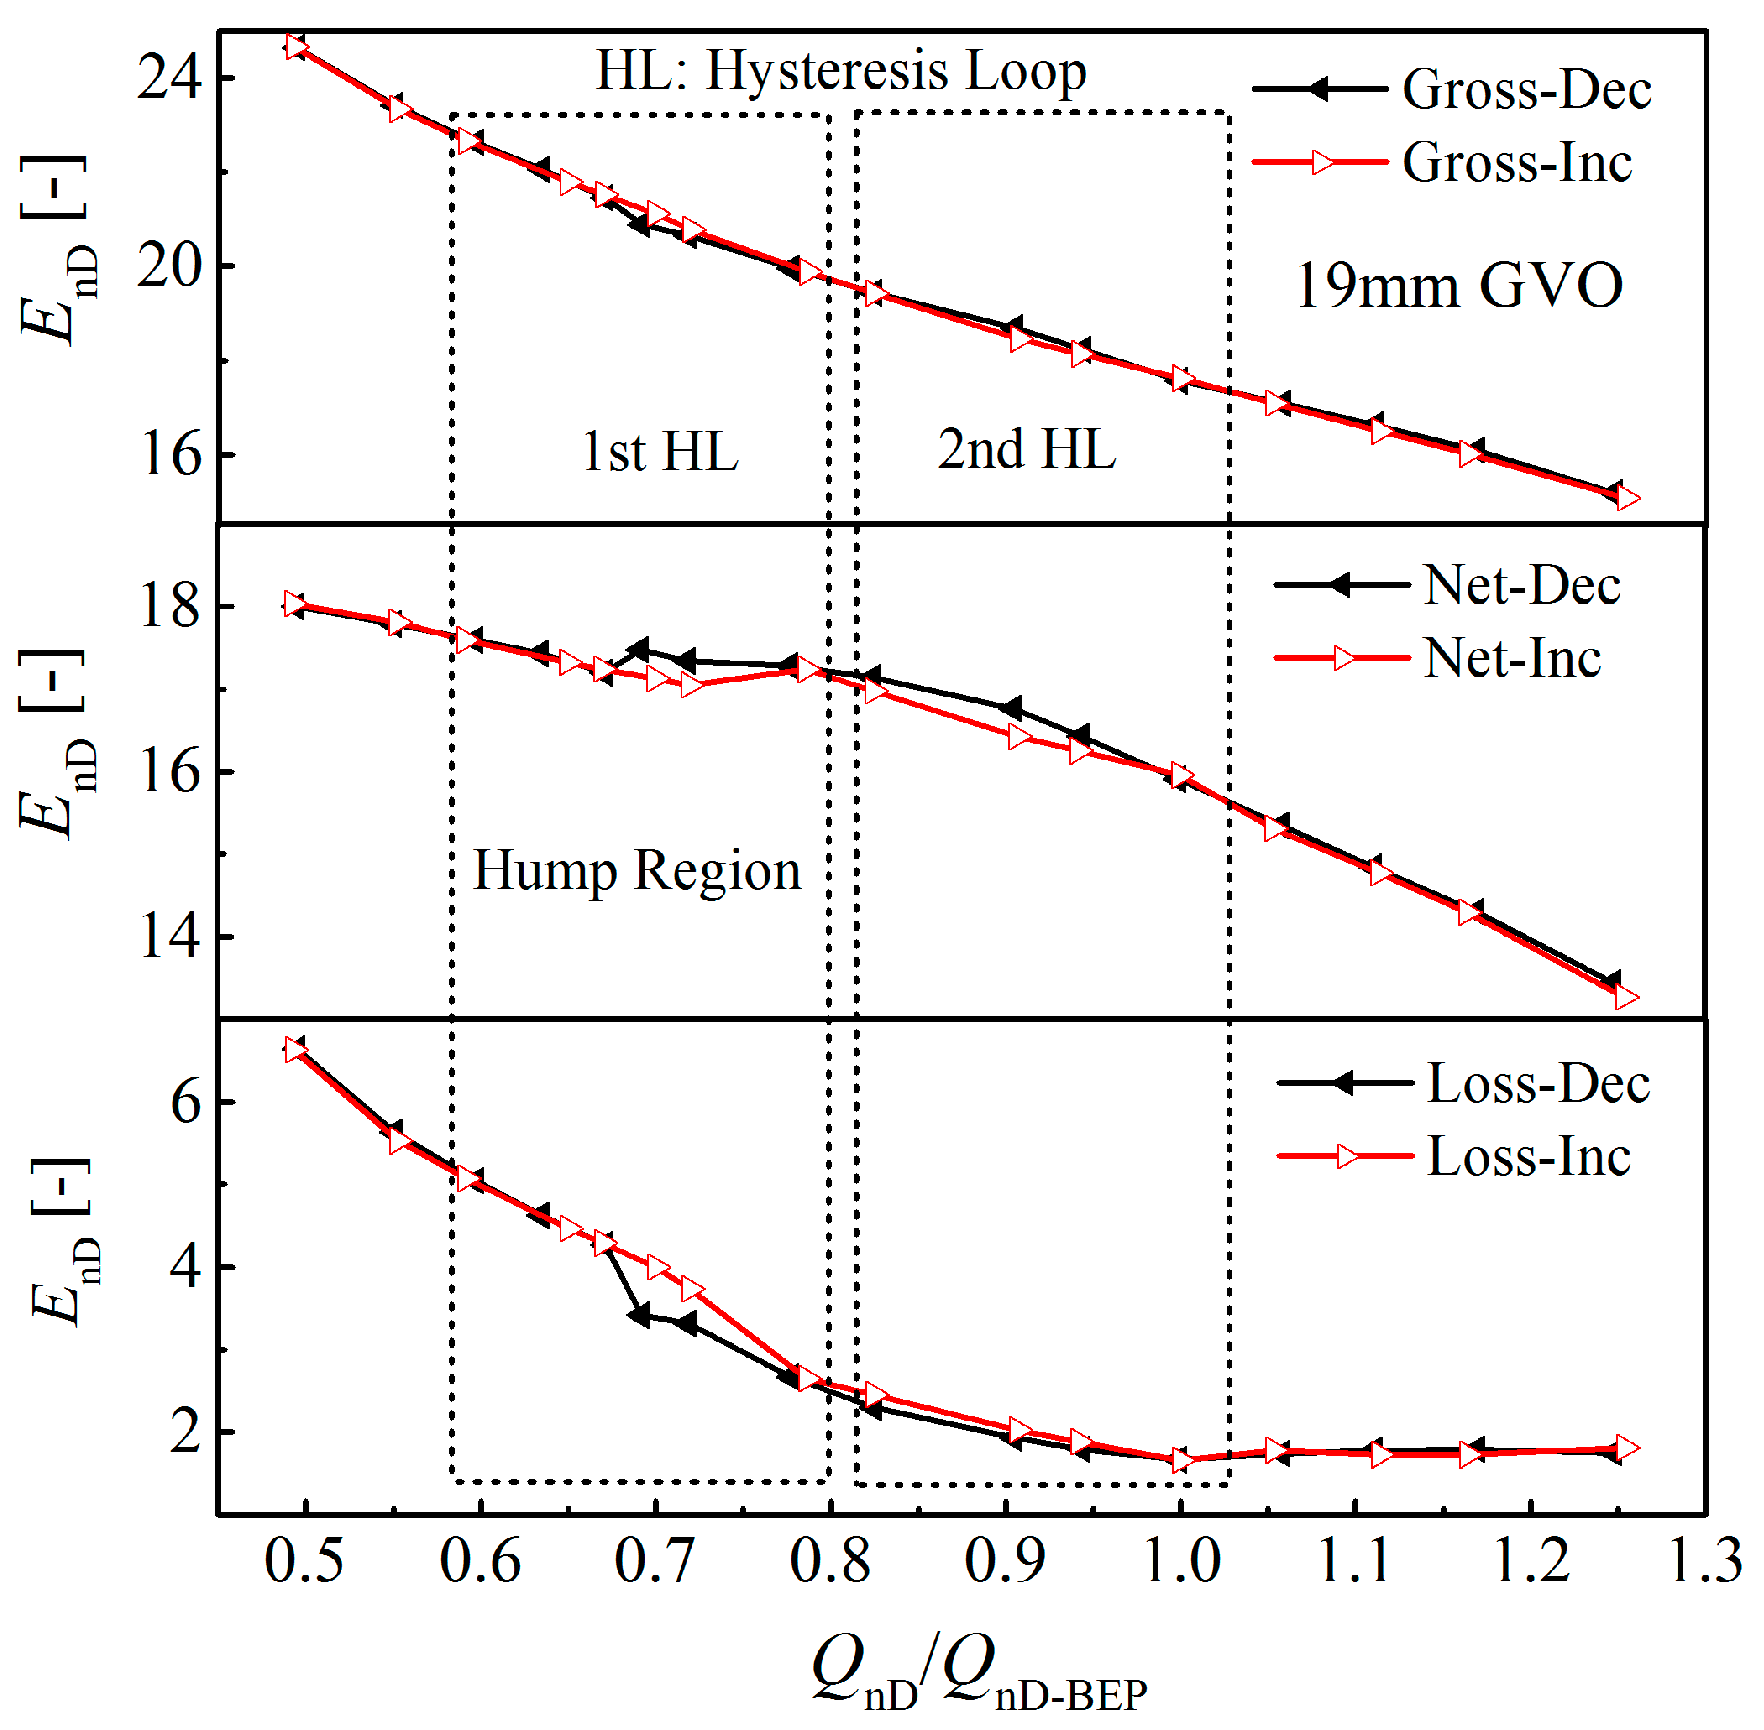
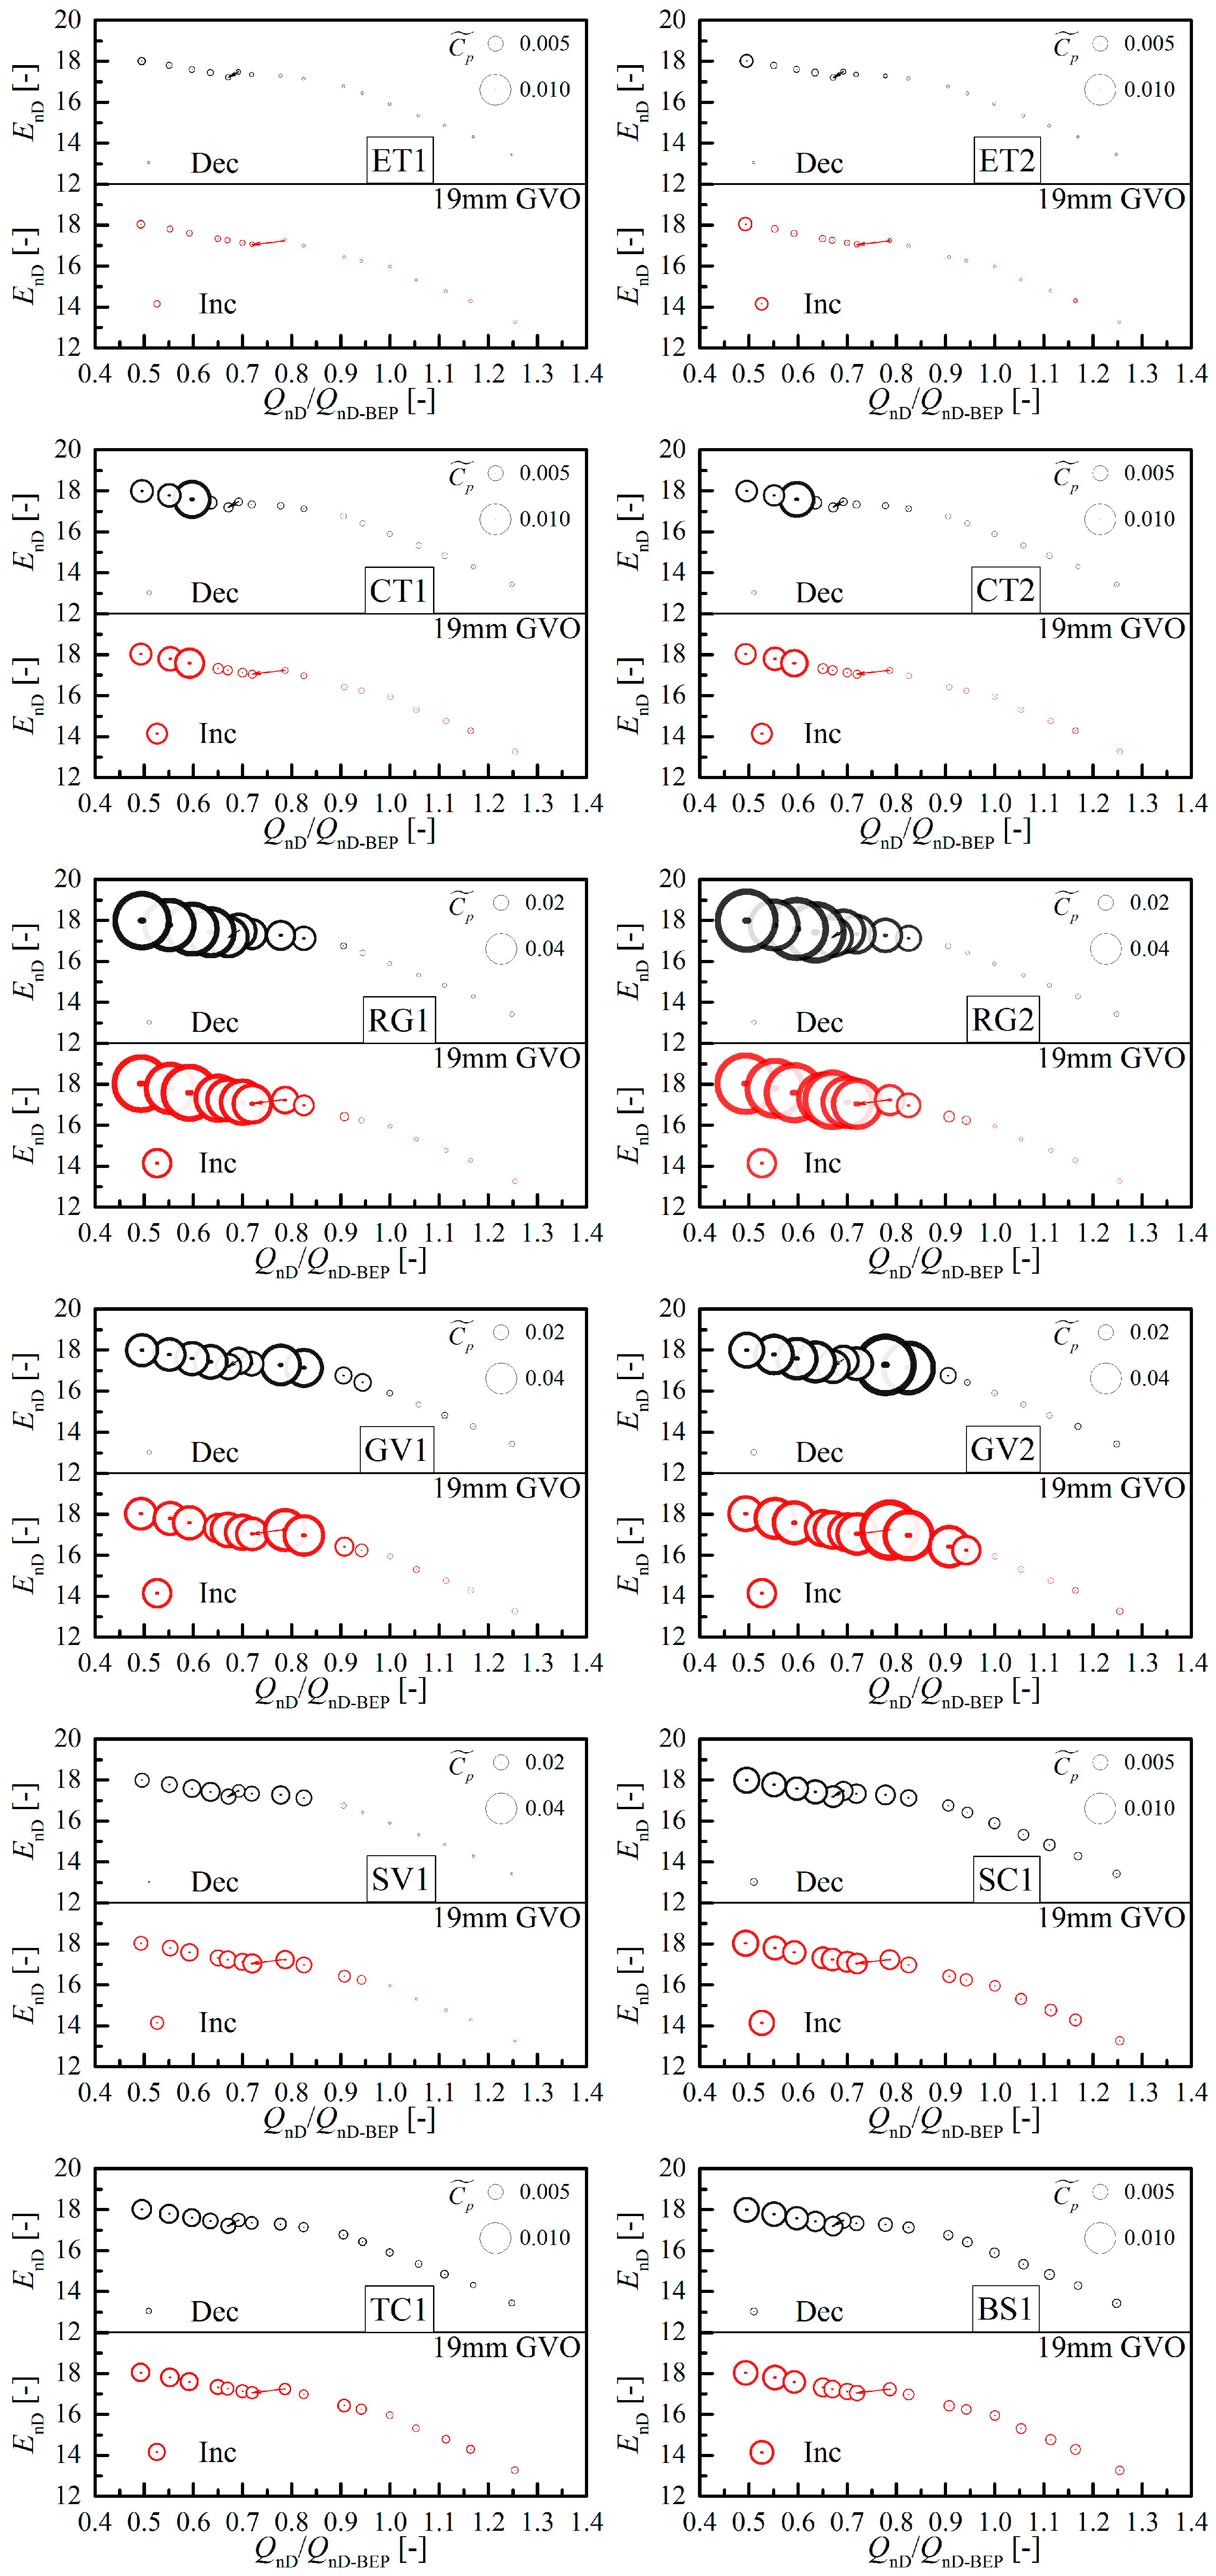
3.2. Analysis of Energy Drop

From the technical definition, there are two reasons for the energy drop. One is Euler momentum (the change of velocity momentum) of the fluid (Δcu·u), which is input for the hydraulic system and associated with the shape of the blades (inlet and outlet) giving rise to incidence and deviation effects. Another is hydraulic losses, including frictional losses, collision losses and losses induced by flow separation and unstable vortices.
Euler momentum (Δcu·u) is a function of incidence angle (cu1) at the inlet and the deviation angle at the exit (cu2). (Δcu·u) can be determined by Equations (4) and (5). For the experimental method, Equation (4) gives an approximate value of Euler torque [16]. Energy coefficients for hydraulic losses and gross energy obtained from the rotating runner could be calculated through the Equations (6) and (7).
Δcu·u = cu2·u2cu1·u1 = T·ω/(ρQ)
Δcu·u/g = Hnet + Hloss
EnD-gross = Δcu·u/(n02D12) = T·ω/(Qn02D12)
EnD-loss = EnD-grossEnD-net
The curves for different energy coefficients are shown in Figure 5. The variation of gross energy coefficients obtained from the rotating runner is almost the same in the two directions. However, some small differences could still be observed in the hysteresis loops.
In the first hysteresis loop, the gross energy coefficient in the increasing direction is a bit larger than the one in the decreasing direction. The largest drop is seen in the hydraulic loss energy coefficient, and a clear hysteresis phenomenon could be found. In the two directions, the hydraulic losses increase sharply from the wave peak point to the wave valley point. It is found that the high hydraulic losses last to the point 0.72QBEP in the increasing direction, while it occurs from the point 0.67QBEP in the decreasing direction. During the first hump region, inlet recirculation might exist in the both directions due to operating conditions far away with BEP [17], so the Euler momentum in the two direction are almost the same due to the influence of the inlet recirculation. Furthermore, the efficiency show a sharp decrease. Hence, the first hysteresis loop only results from the sharp increase of the hydraulic losses in the increasing direction.
In the second hysteresis loop, the gross energy coefficient in the increasing direction is a bit smaller than the one in the decreasing direction. In addition, the hydraulic loss energy coefficient in the increasing direction is just a little larger than the one in the decreasing direction, unlike the variation in the obvious hump region. Hence, the second hysteresis loop might result from the decrease of the Euler momentum and the increase of the hydraulic losses. Namely, the incidence angle, deviation angle or both are different in the two directions. This might exist recirculation during this region in the increasing direction due to the initial unstable patterns, but not in the decreasing direction. Inlet recirculation will lower the gross energy coefficient because it changes the incidence angle.
Energy coefficients analysis reveals the hump characteristic and associated hysteresis phenomenon is a result of the Euler momentum (input parameter) and hydraulic losses (dissipated parameter). In the first hump region far away from BEP the hysteresis characteristic mainly results from the difference of the hydraulic losses, while the second one might arise from the combined effect of Euler momentum and hydraulic losses. This needs further validation through the simulation.

4. Experiments and Analysis of Pressure Fluctuations

Hydraulic losses mainly come from the unstable vortex, flow separation and collision losses, which usually couple with pressure fluctuations. In order to find if there are some relations between high hydraulic losses and pressure fluctuations, measurements of pressure fluctuations were carried out. During the measurements, 12 high resolution pressure sensors (PCB-112A22) were mounted in the whole passage. As shown in Figure 6, one is in the spiral casing outlet (SC1), one in the stay vanes (SV1), two in the guide vanes (GV1 and GV2), two in the vaneless space between the runner outlet and guide vane inlet (RG1 and RG2), two in the cone of the draft tube (CT1 and CT2), two in the elbow of the draft tube (ET1 and ET2), one in the top cover (TC1) and one in the bottom shroud (BS1). All the pressure sensors were correctly calibrated before the measurements, and the fitting errors are below 0.4%. All the measurements were performed at constant rotational speed (1000 rpm). Sampling rate was set 4000, and every operating point was measured for 10 s (40,000 sample points). In such a case, the rotational frequency is 16.67 Hz and the frequency resolution is 0.1 Hz.

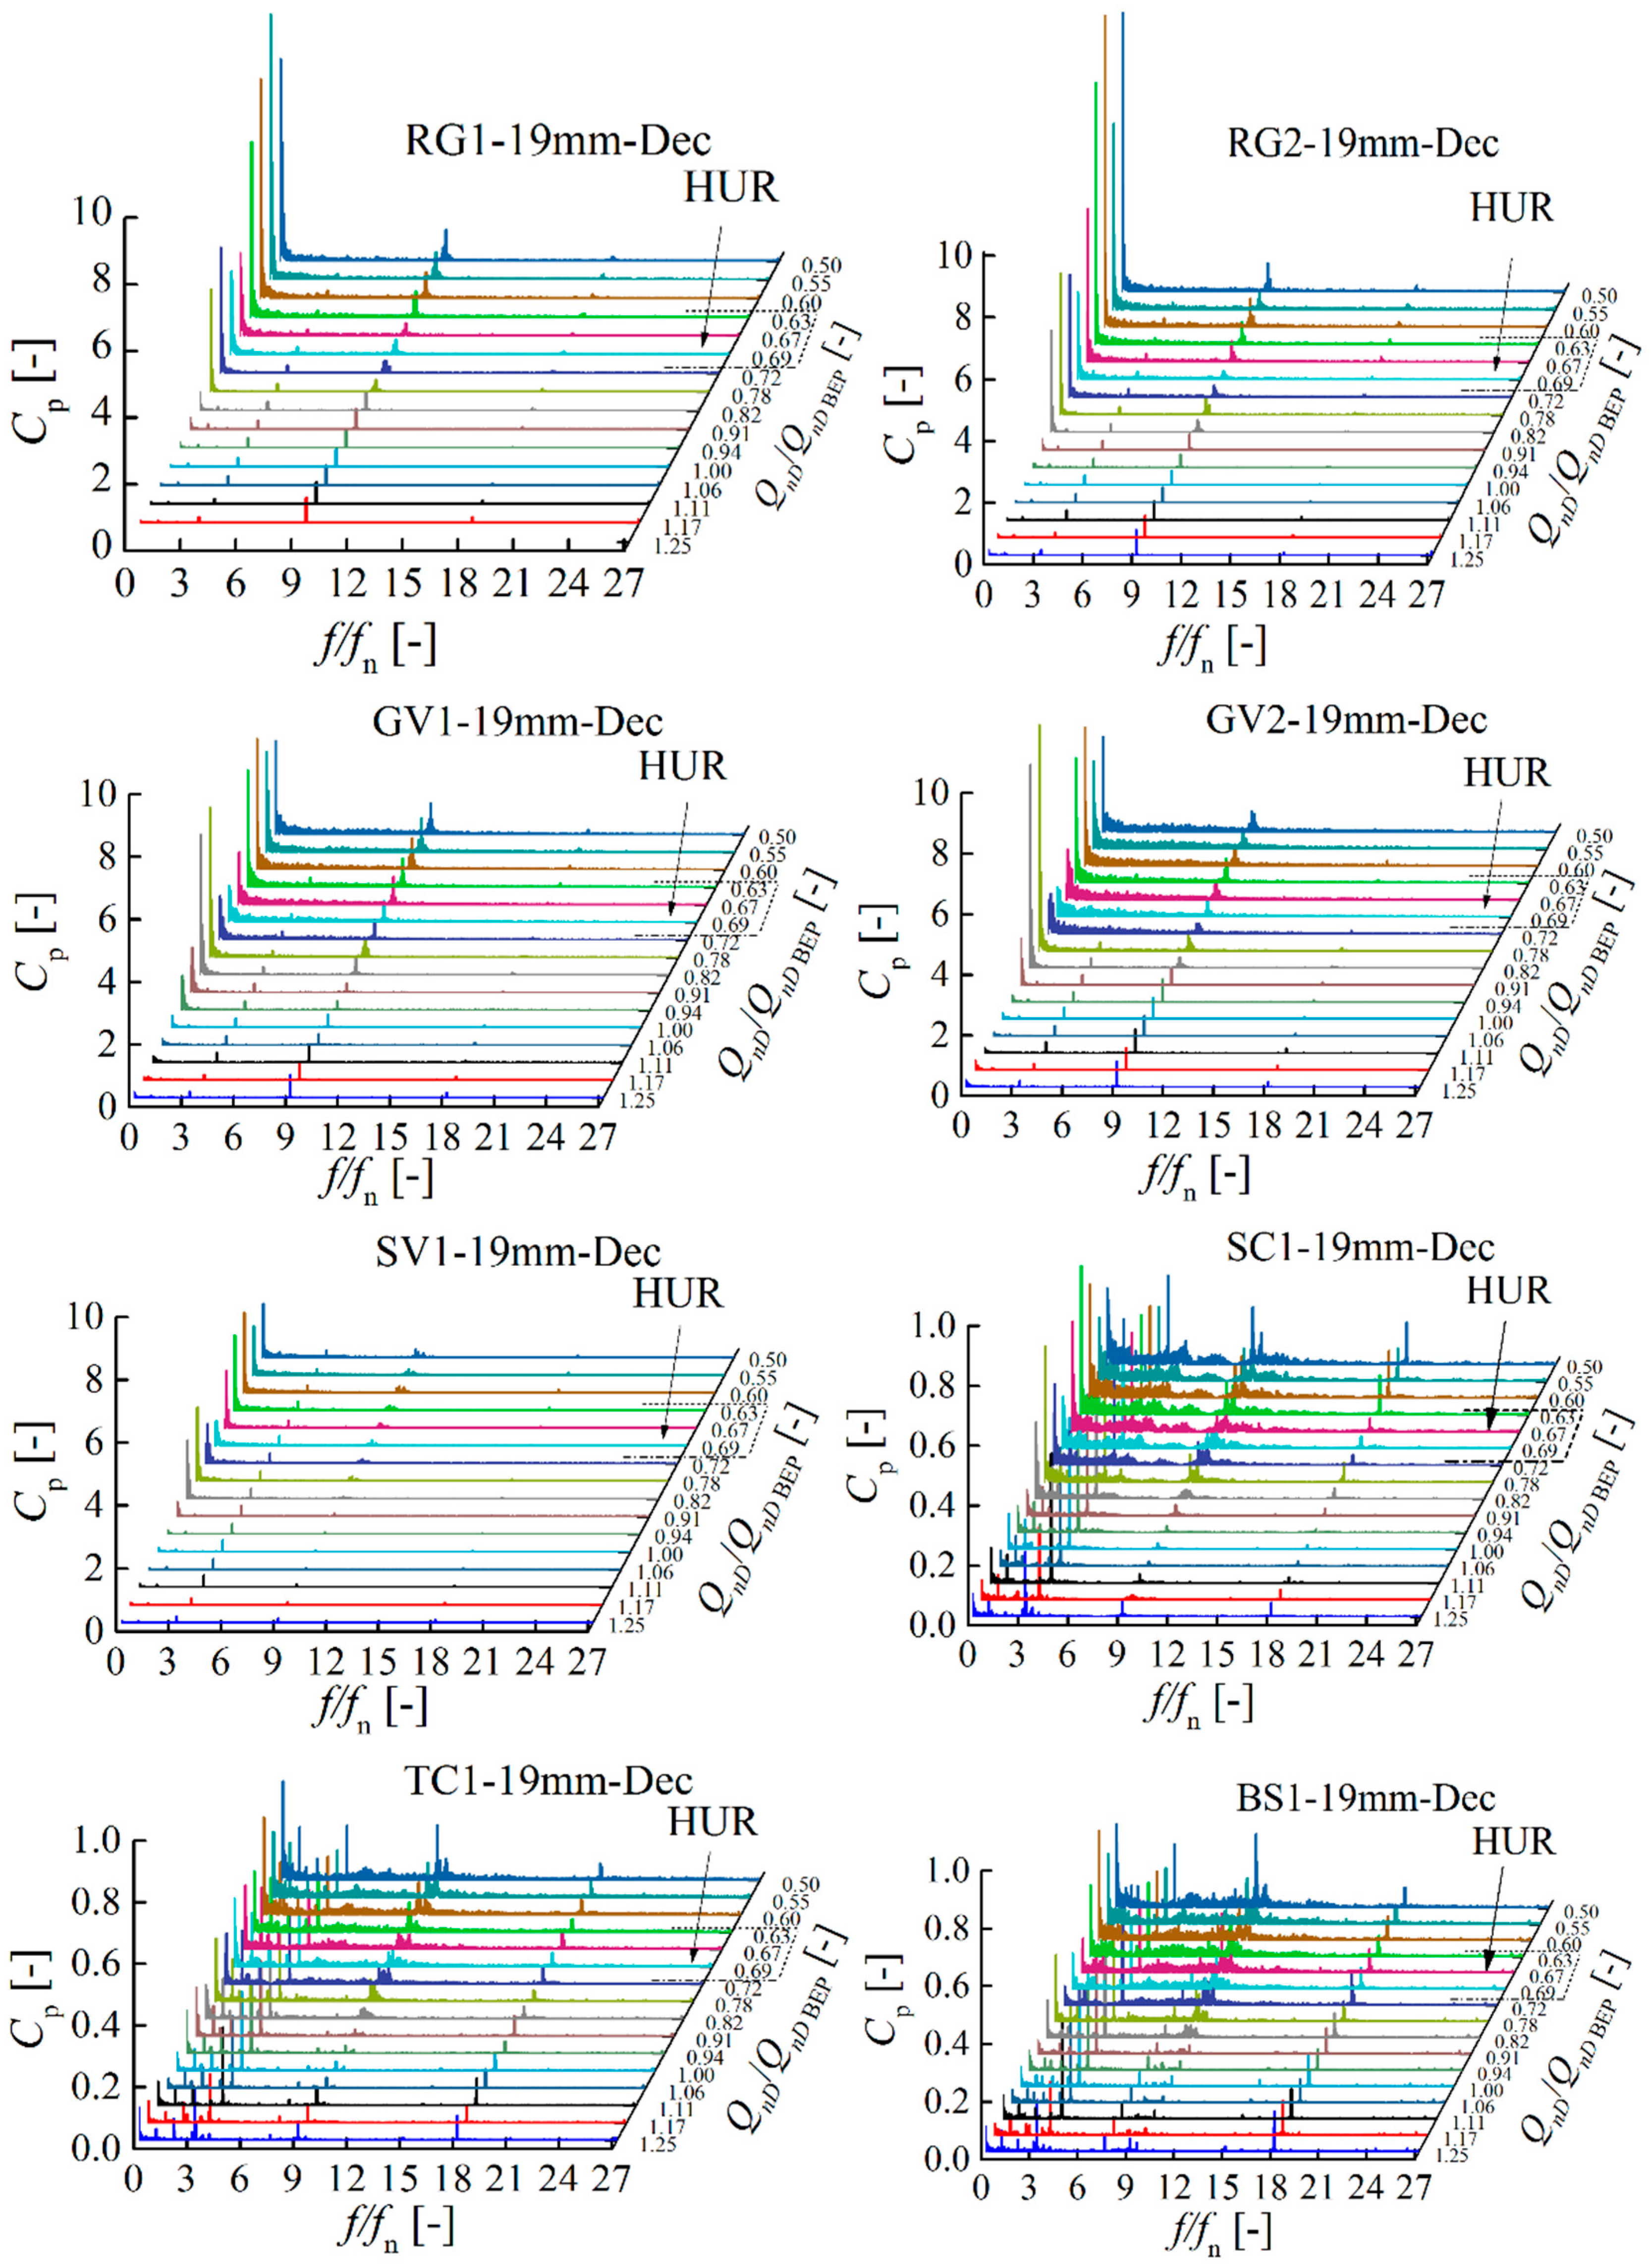
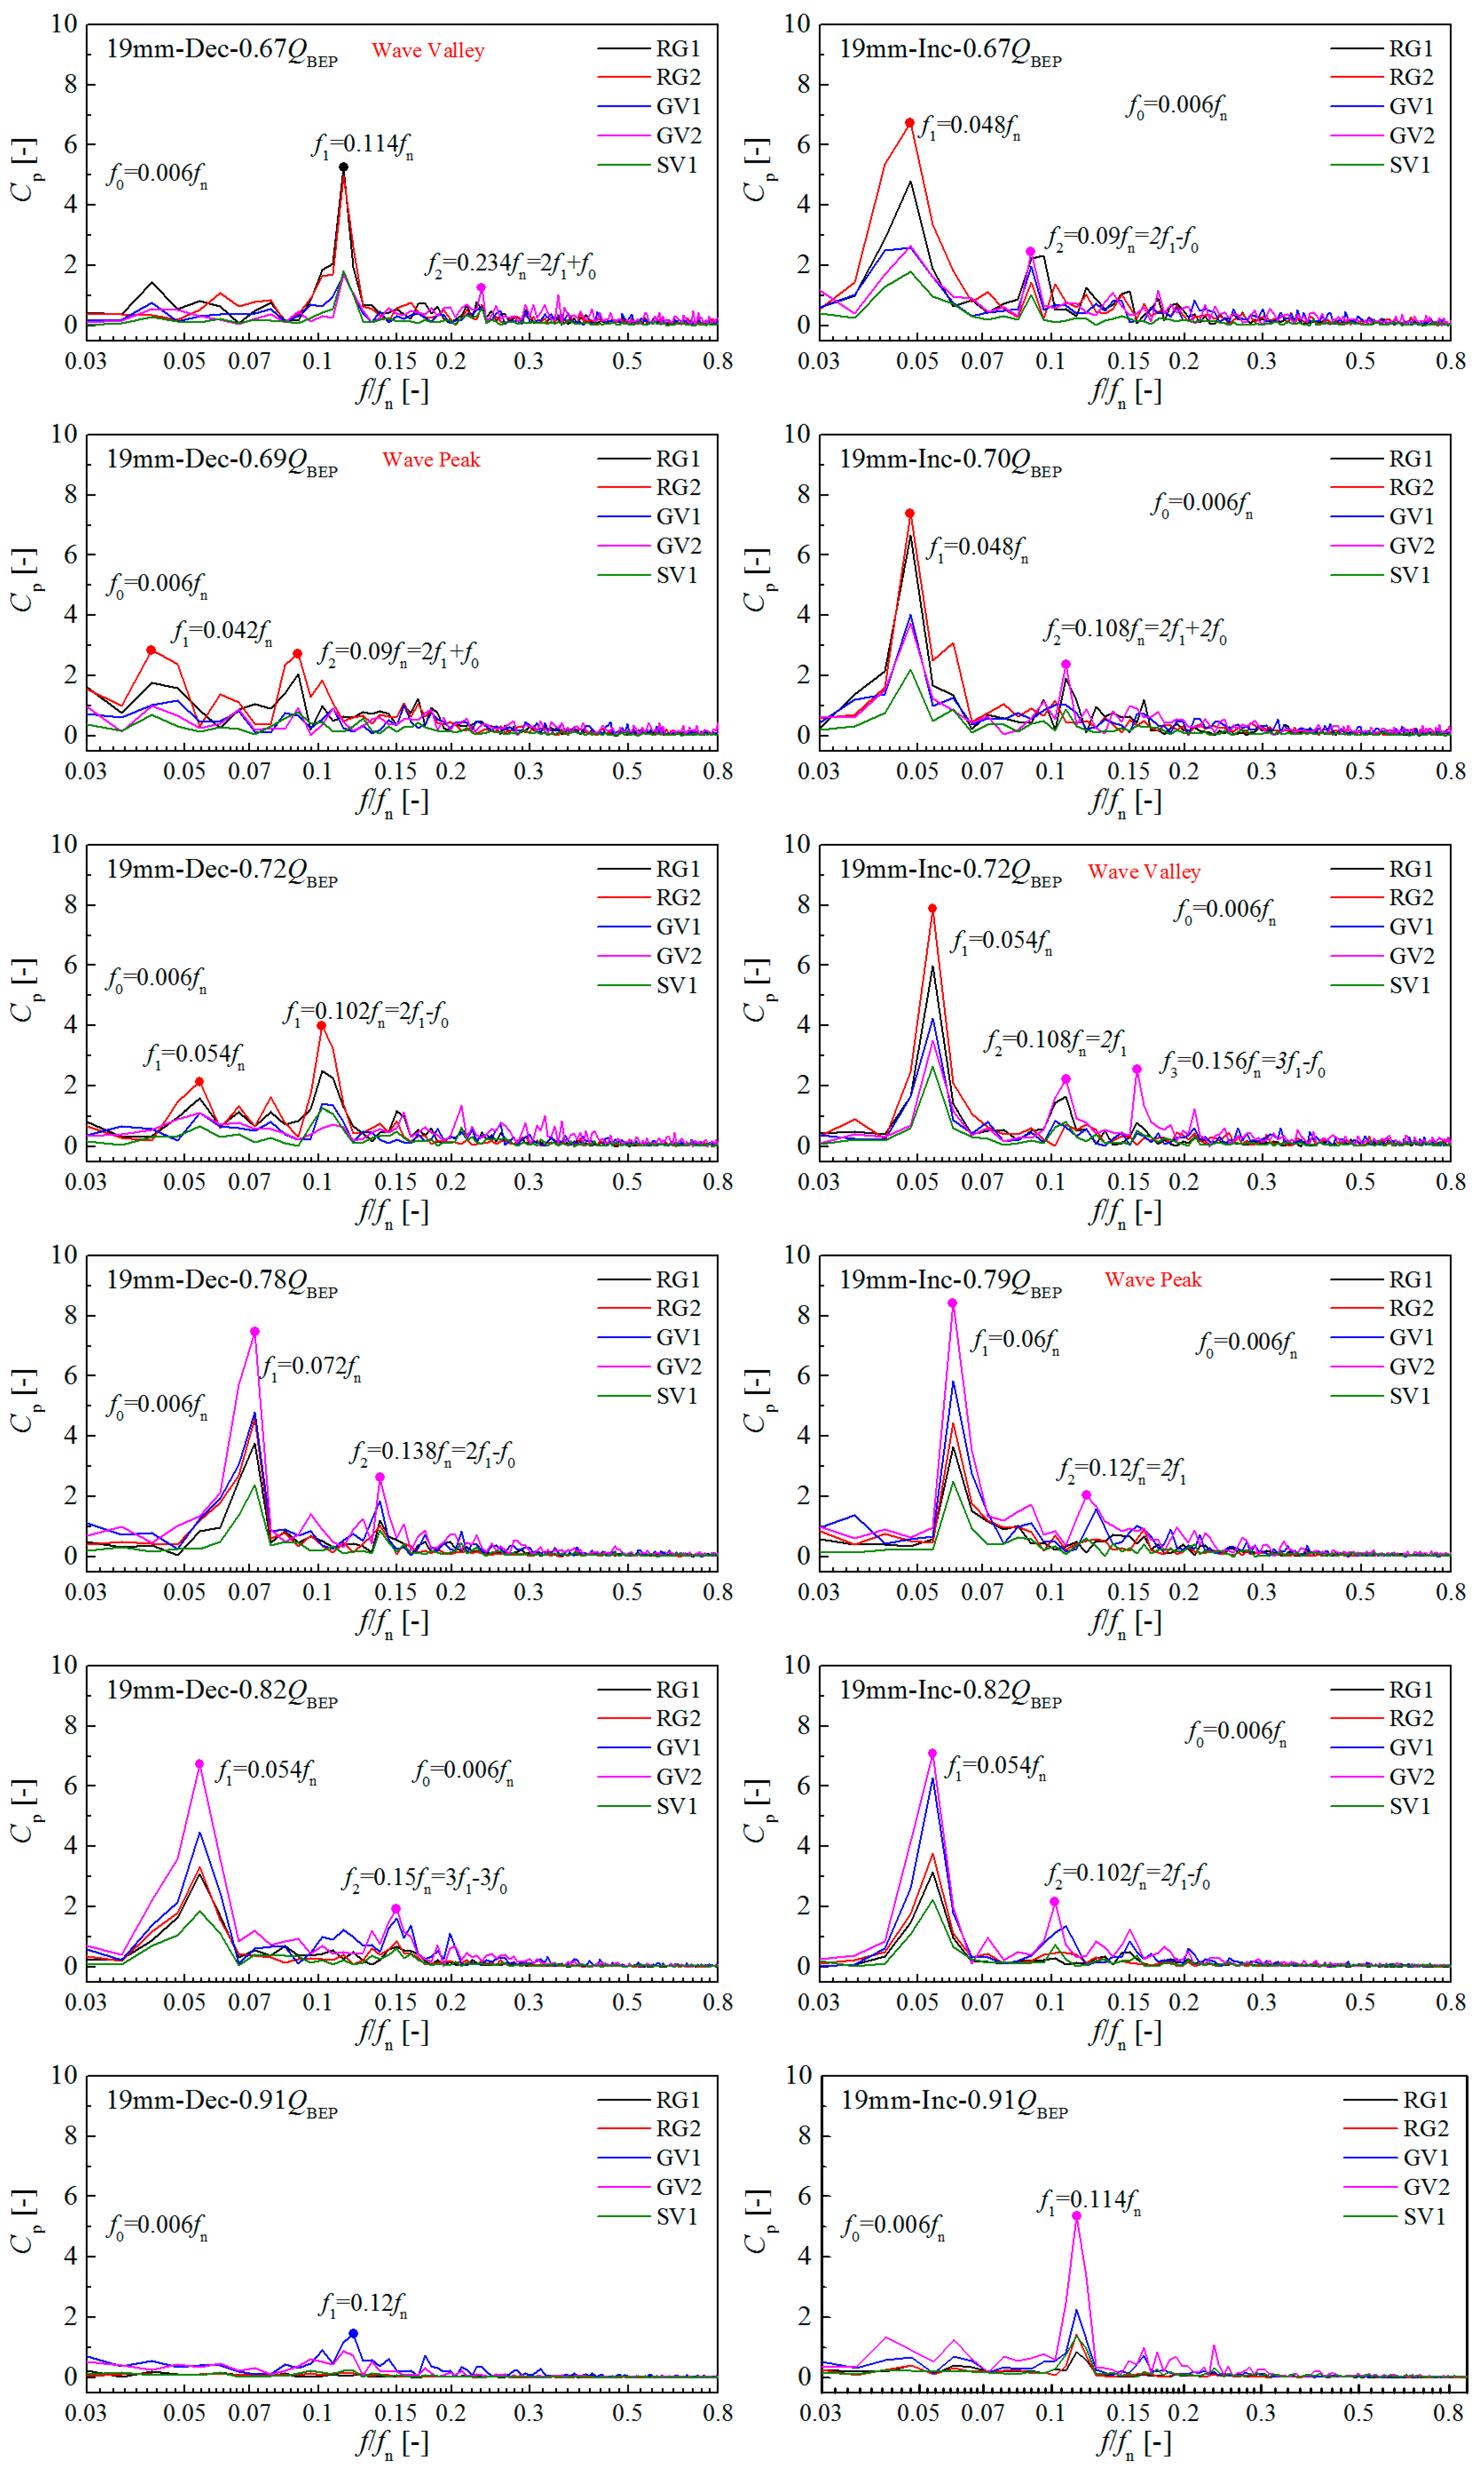
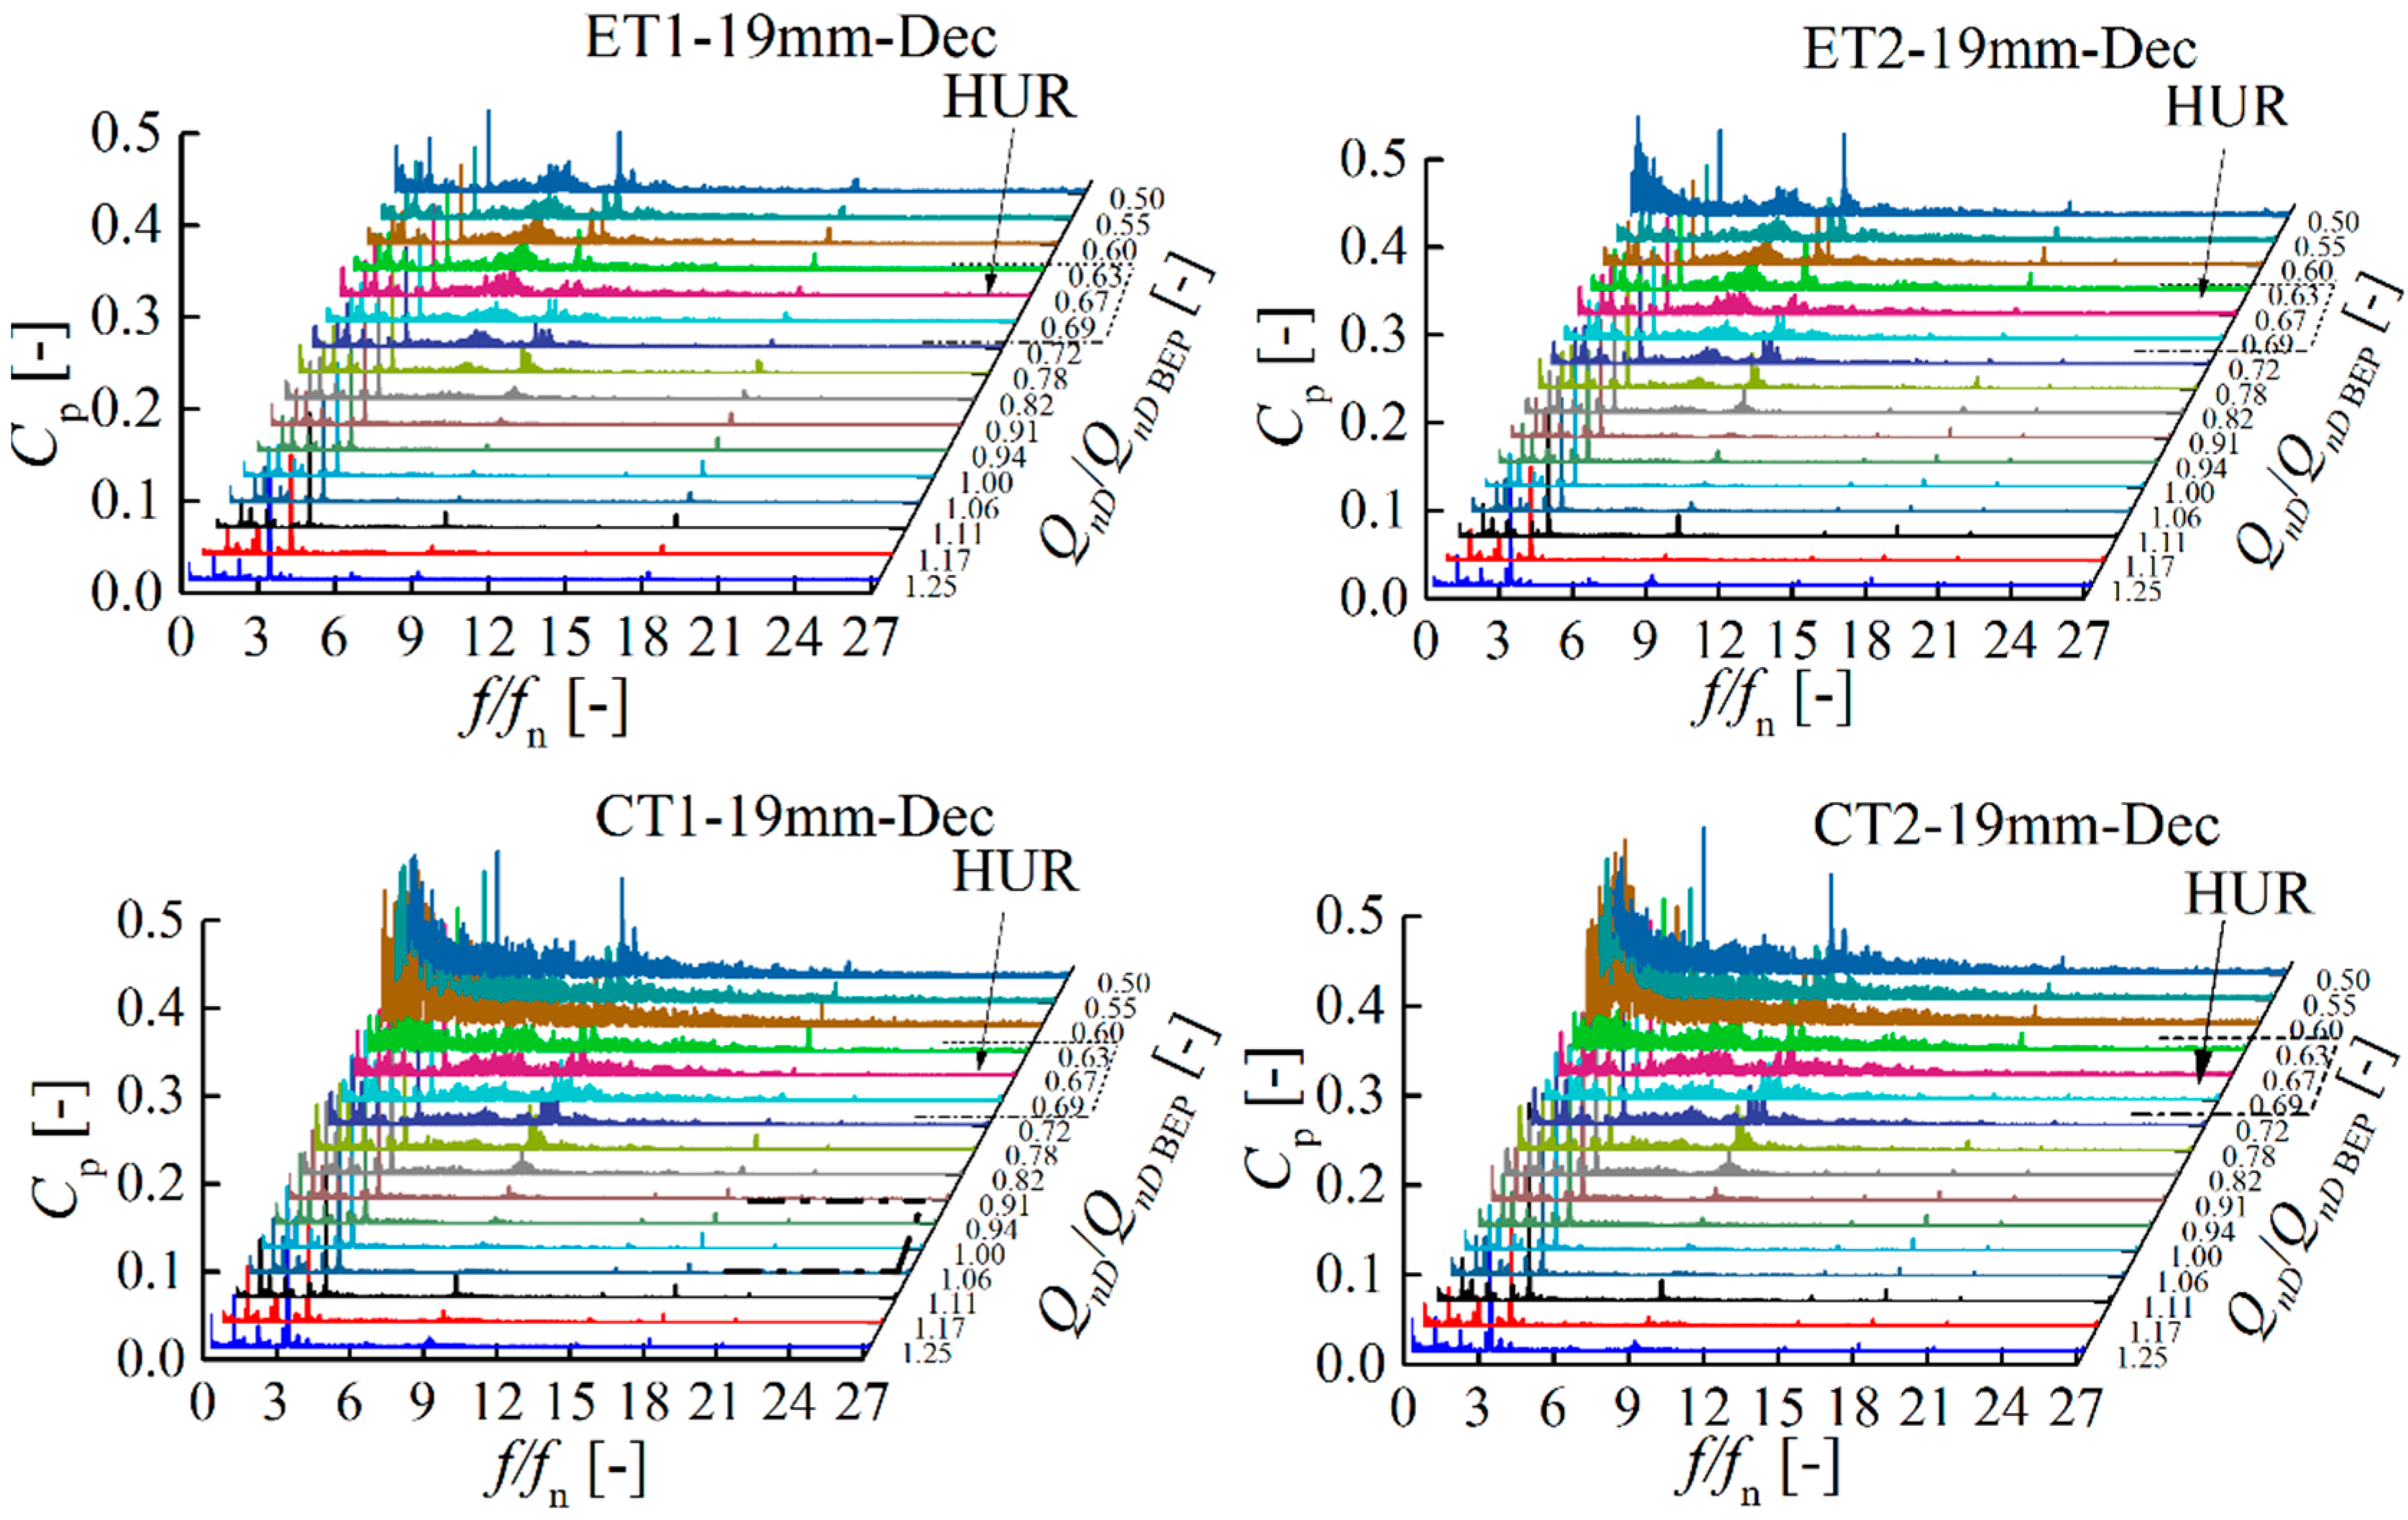
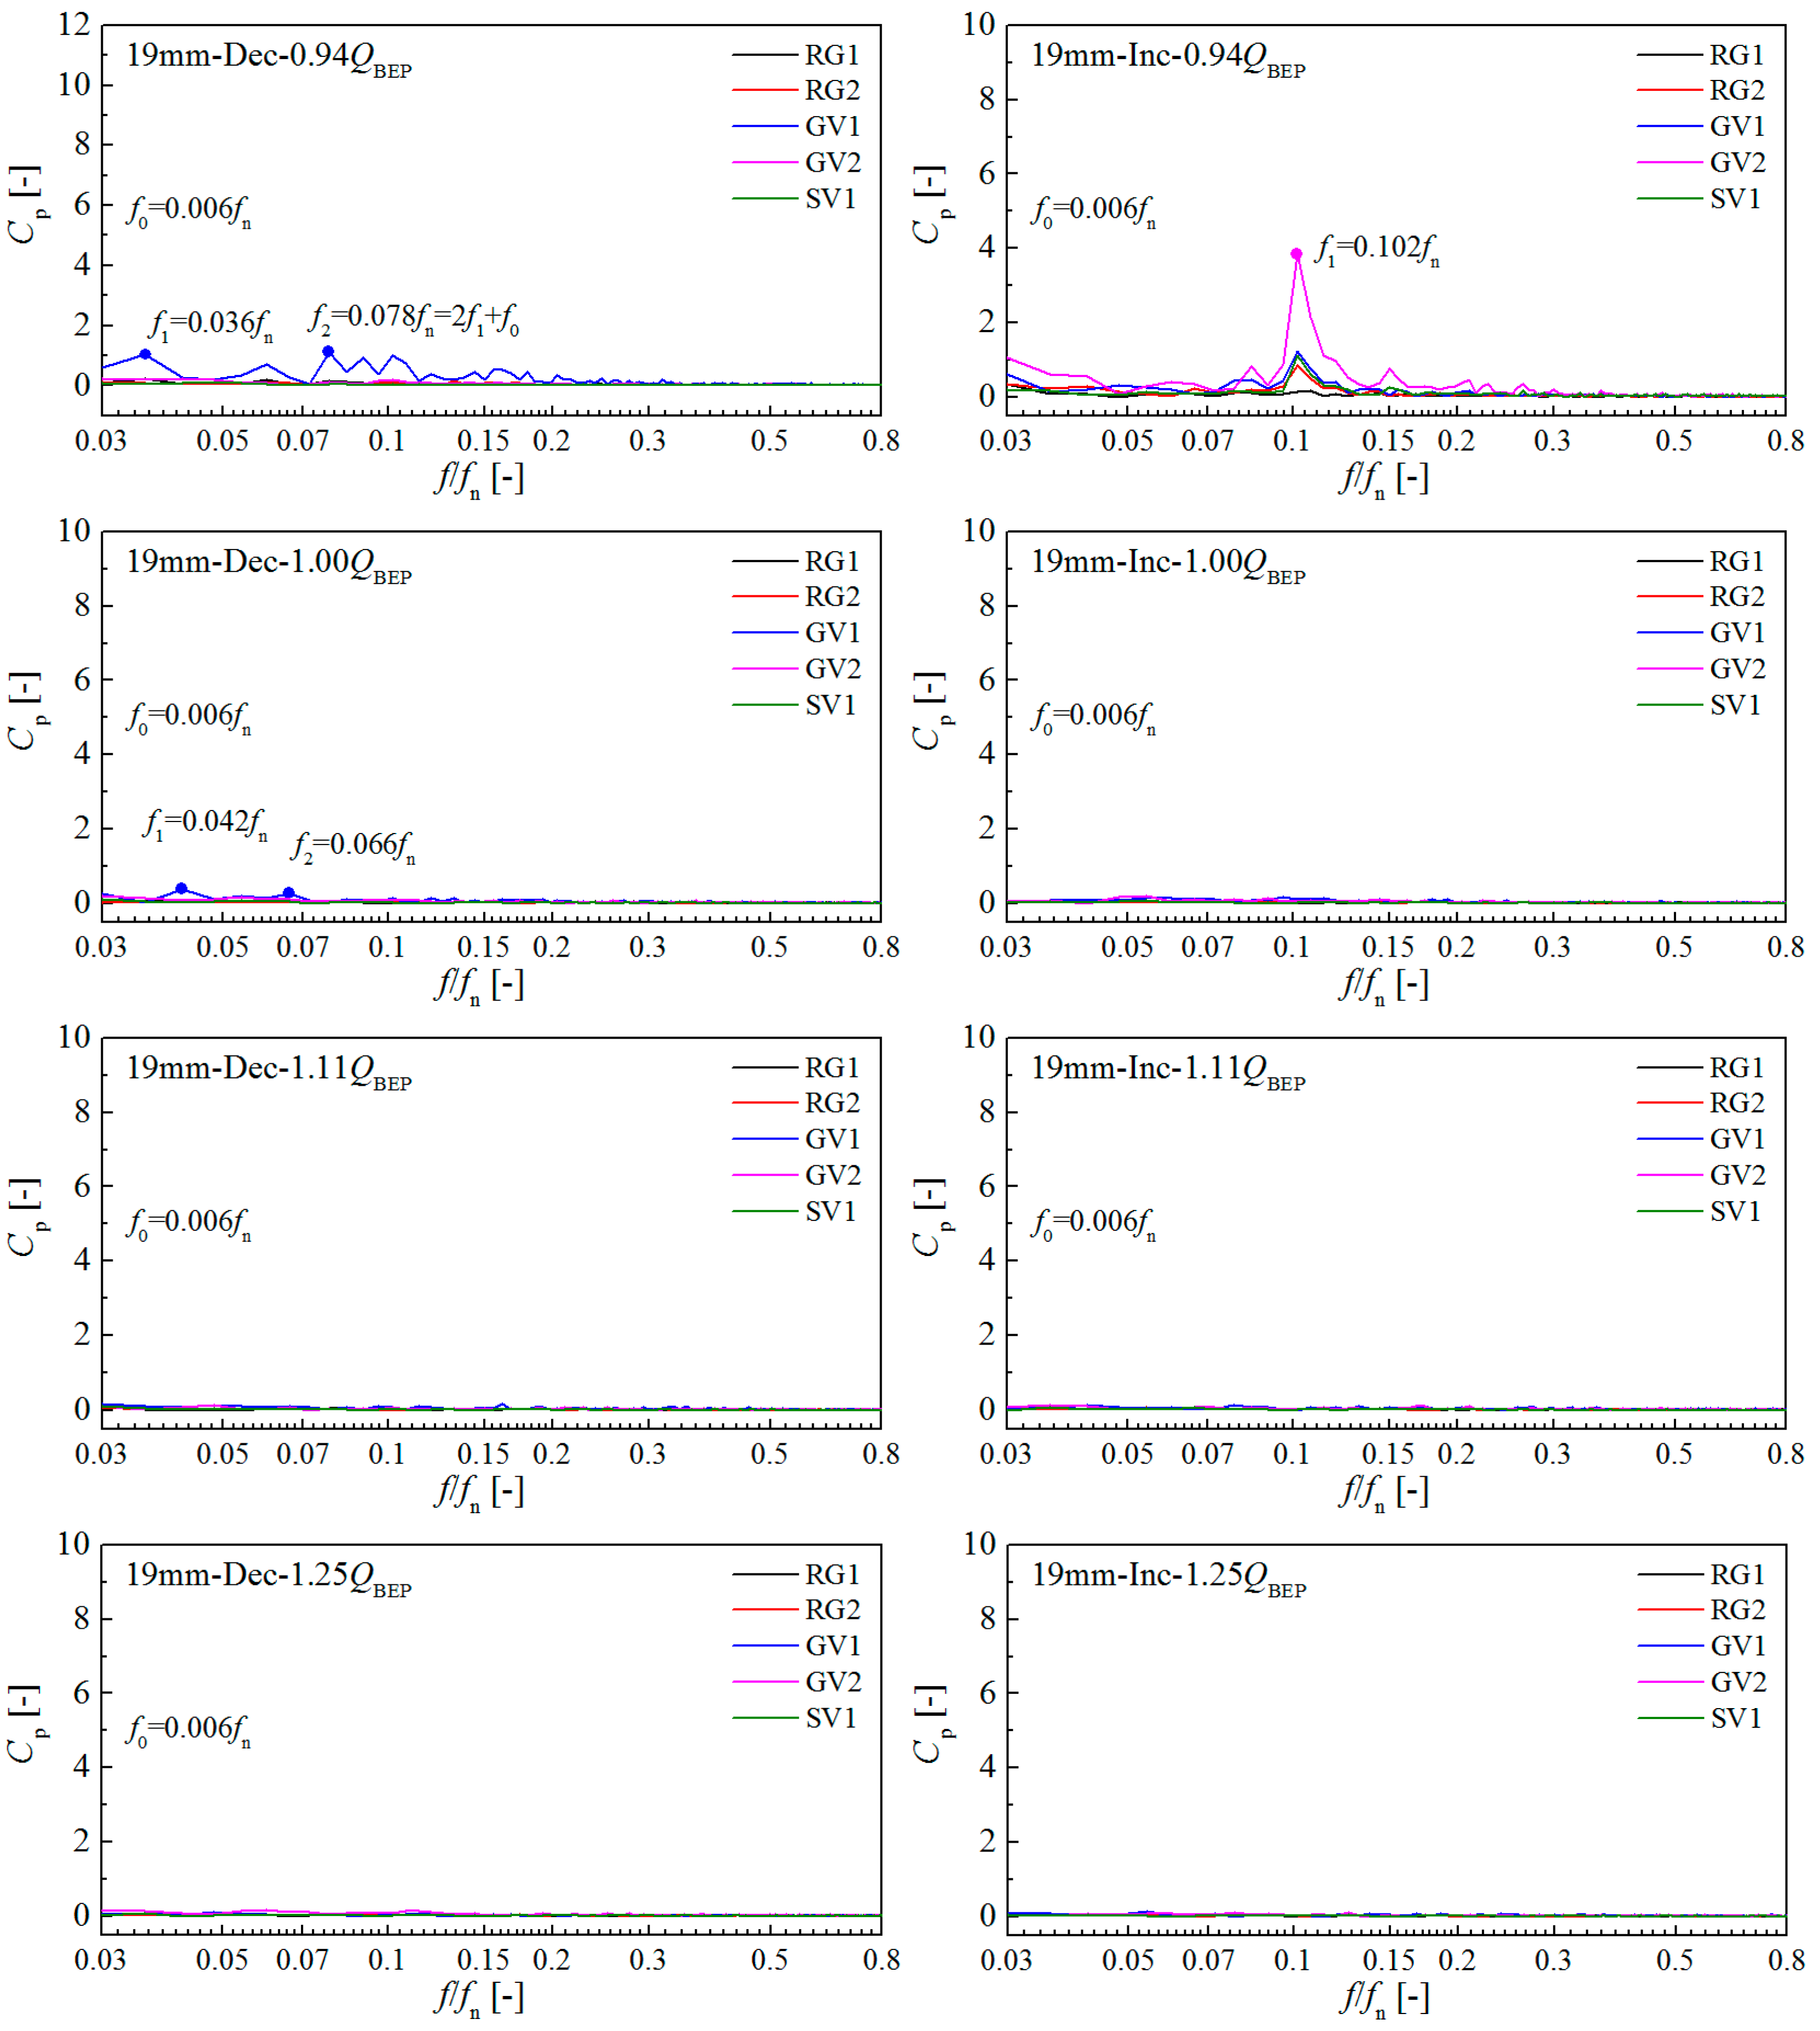
4.1. Analysis of Pressure Fluctuations

All the signals are unsteady and normalized according to Equation (8) as unsteady pressure coefficients. The intensity of pressure fluctuations is expressed as the standard deviation according to Equation (9):
C p = p p ¯ 1 2 ρ U 2 2 × 100 %
C p ˜ = 1 1 2 ρ U 2 2 1 N i = 1 N ( p i p ¯ ) 2
Figure 7 gives the standard deviation of pressure fluctuations for every monitoring point varying with the operating conditions in the two directions under 19 mm GVO. In Figure 7, the size of the circle indicates the magnitude of the standard deviation, due to which the values in the vaneless space, guide vanes and stay vanes are relatively high compared with other positions. The legend of the circle was amplified four times. It is found that the highest-level pressure fluctuations occur in the vaneless space, and the second highest are in the guide vanes.
Along the flow direction from the draft tube inlet to the spiral casing outlet, the pressure fluctuation intensity increases slowly from the elbow to the cone of the draft tube, and jumps sharply to the vaneless space, and then decreases slowly to the stay vanes, and finally shows a rapid decline at the spiral casing outlet. For every monitoring point, when the discharge is increased from the BEP, the pressure fluctuation intensity shows a small increase, while it increases sharply when the discharge is decreased from the BEP. In the first hump region, from the wave peak point to the wave valley point in the two directions, the intensity has a different level increase, whereas the highest-level increase occurs in the vaneless space. Additionally, the level of the intensity in the two directions is obviously different, and thus an obvious hysteresis phenomenon could be found. Hence, the first hysteresis loop might be related to the pressure fluctuations in the vaneless space and guide vanes, which lead to high hydraulic losses. In the second hump region, the pressure fluctuations in the two directions also show obviously differences, especially in the guide vanes (GV2). Hence, the increase of hydraulic losses in the increasing direction in the second hysteresis loop might result from high amplitude pressure fluctuations in the guide vanes.
To obtain the detailed frequencies, FFT analysis was performed in the decreasing direction. Figure 8 shows the frequencies varying with operating conditions for every monitoring point. In the draft tube, the amplitudes are relatively low for all the operating points, and some low frequency components (less than 3fn), BPF (9fn) and its harmonic frequencies (18fn, 27fn, …) could be observed. Only during the low load operating conditions, do the amplitudes of the low frequencies increase sharply. In the vaneless space, guide vanes and stay vanes, the amplitudes of low frequency components (less than 0.8fn) show an amazing jump (maximum more than 20-fold) around the hump region. Compared with the low frequency components, BPF and its harmonic frequencies do not appear so important. In addition, for all the positions, a 3.678fn frequency could be observed, whose amplitude gradually decreases from downstream spiral casing outlet to upstream draft tube inlet within the 0.4 and 0.1 range. The frequency remains unchanged with the variation of the operating conditions. This might result from an elastic fluctuation of the hydraulic system, or a pressure fluctuation generated by the water supply pump, which is not dependent on the operating conditions. Hence, this frequency has no direct relation with the hysteresis characteristics in this research.
Figure 9 depicts the detailed frequency spectrum at point 0.67QBEP. At the top cover (TC1) position two low frequency components (0.114fn and 1.002fn) are found. The first one (0.114fn) might come from the vaneless space. The second one might come from the runner, which may show a rotation stall at the runner or rotational frequency. Due to the lack of pressure sensors in the runner, this cannot be analyzed in the measurements. This needs further study through simulation. Nevertheless, the amplitudes of the two frequency components show that pressure fluctuations in the vaneless space are much larger than the ones in the runner. In the draft tube, these two frequency components are also observed. The first one might be related to the frequency in the vaneless space, and the second one might come from the runner.
Based on the variation of the frequencies, the hump characteristic might be related with low frequency components in the vaneless space, guide vanes and stay vanes. Hence, the detailed low frequency components in the vaneless space, guide vanes and stay vanes from 0.03-0.8fn in the two directions are shown in Figure 10.
In the decreasing direction, from 0.91QBEP to 1.25QBEP, no high amplitude low frequency components are found. From 0.78QBEP to 0.82QBEP, the highest amplitude low frequency components occur in the guide vanes, and the frequency increases with the decreasing of the discharge. As the discharge is reduced from 0.69QBEP, the highest amplitude low frequency components appear in the vaneless space. At the point 0.69QBEP (wave peak), low frequency components 0.042fn and 0.09fn appear, but the amplitudes are relatively low. When reduced to the point 0.63QBEP (wave valley), a higher amplitude low frequency component (0.114fn) occurs. As the discharge continues to decrease, the amplitudes of the low frequency components increase and the frequency decreases. From point 0.60QBEP to 0.49QBEP, the frequency and amplitudes of these low frequency components change with operating conditions. In the increasing direction, the low frequency components from 1.00QBEP to 1.25QBEP, and from 0.49QBEP to 0.59QBEP are totally the same with the ones in the decreasing direction. However, from 0.65QBEP to 0.91QBEP, the frequency components are extremely different. The highest low frequency components in the guide vanes occur from the point 0.79QBEP and last to the point 0.94QBEP. The amplitudes decrease slowly and the frequency increases. From the wave peak to the wave valley in this direction, the position of the highest amplitude low frequency components shifts from the guide vanes to the vaneless space. Furthermore, from the 0.70QBEP to 0.94QBEP, the amplitudes are obviously higher than the ones in the decreasing direction. This tendency is the same with the variation of the hydraulic losses, namely, the higher amplitudes of low frequency components are related with the higher hydraulic losses.
In this process, some other linear frequencies (2f1, 3f1) and nonlinear frequencies (2f1 + f0, 2f1f0, 3f1 + f0 and 3f1f0) could also be found, which are marked in the Figure 10. The first ones are harmonic frequencies from the highest frequency, while the second ones come from the interaction between the highest frequency and the basic frequency (minimum resolution frequency f0 = 0.006fn). Compared with the first dominant frequency (f1), the amplitudes of the other frequencies are relatively low. It can be concluded that the hysteresis characteristic is related to the hydraulic losses, which might be caused by low frequency pressure fluctuations. Moreover, the position and frequency of these low frequency components vary with the operating conditions.

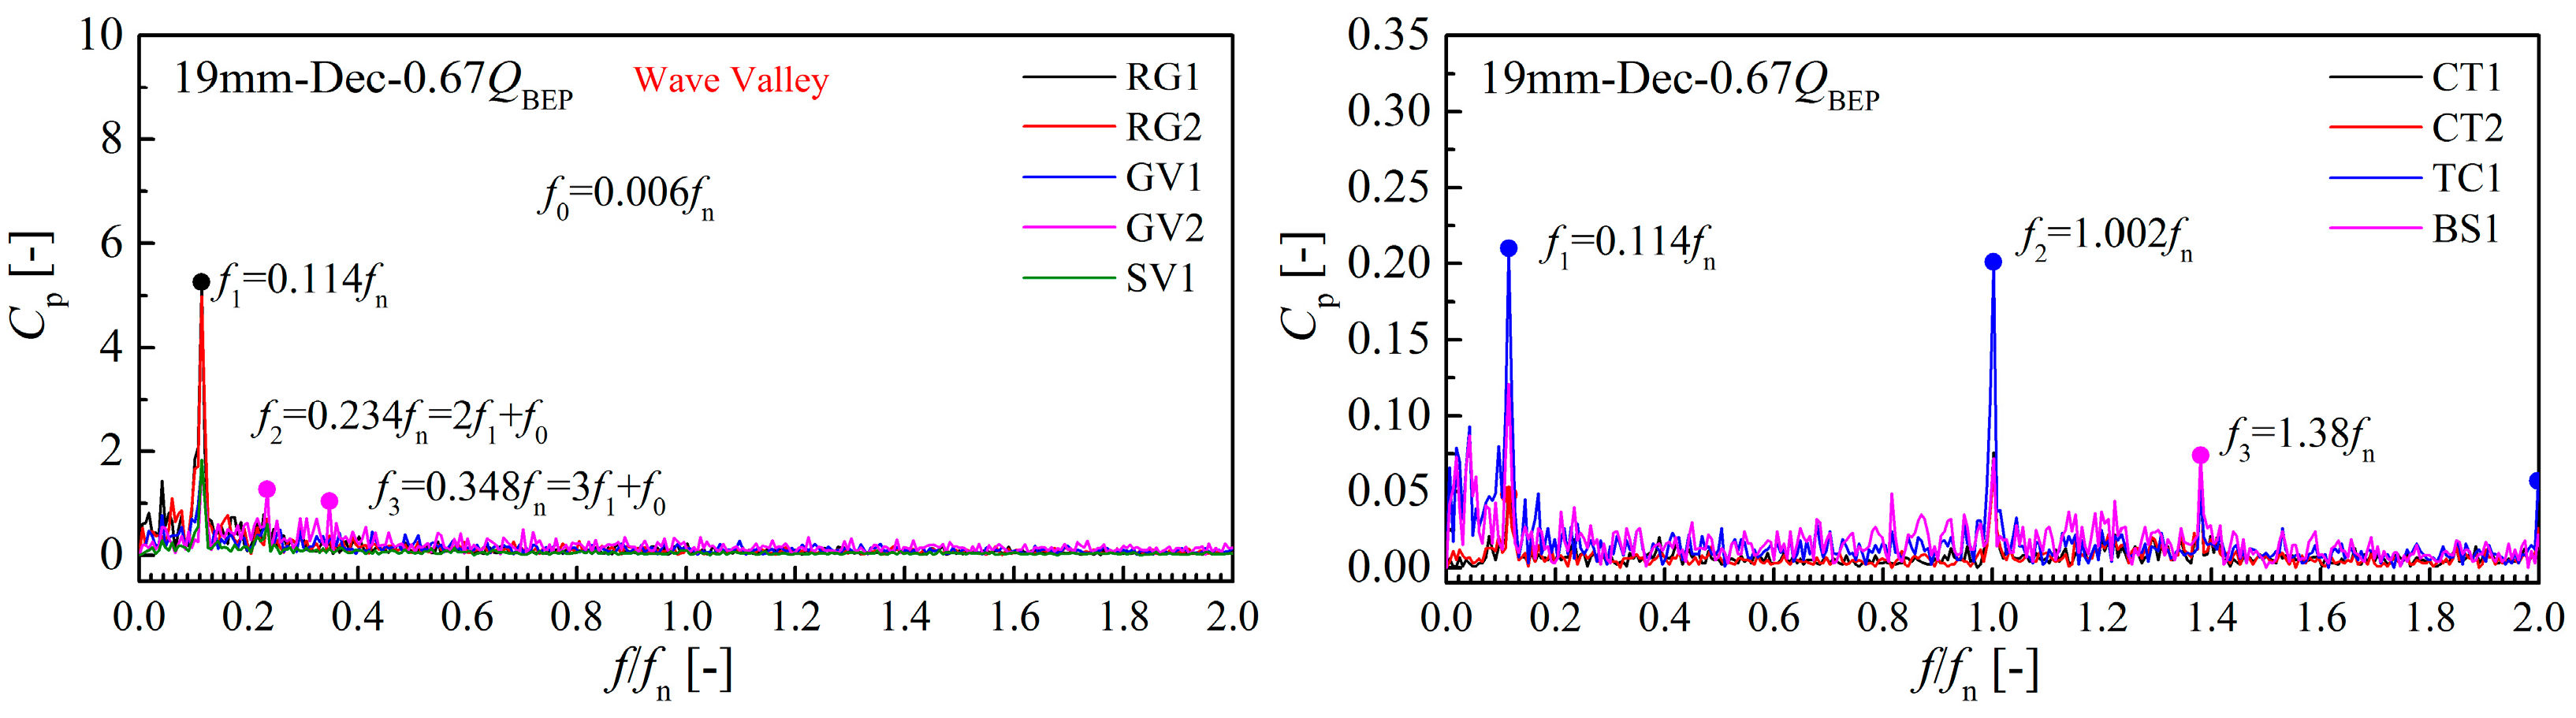
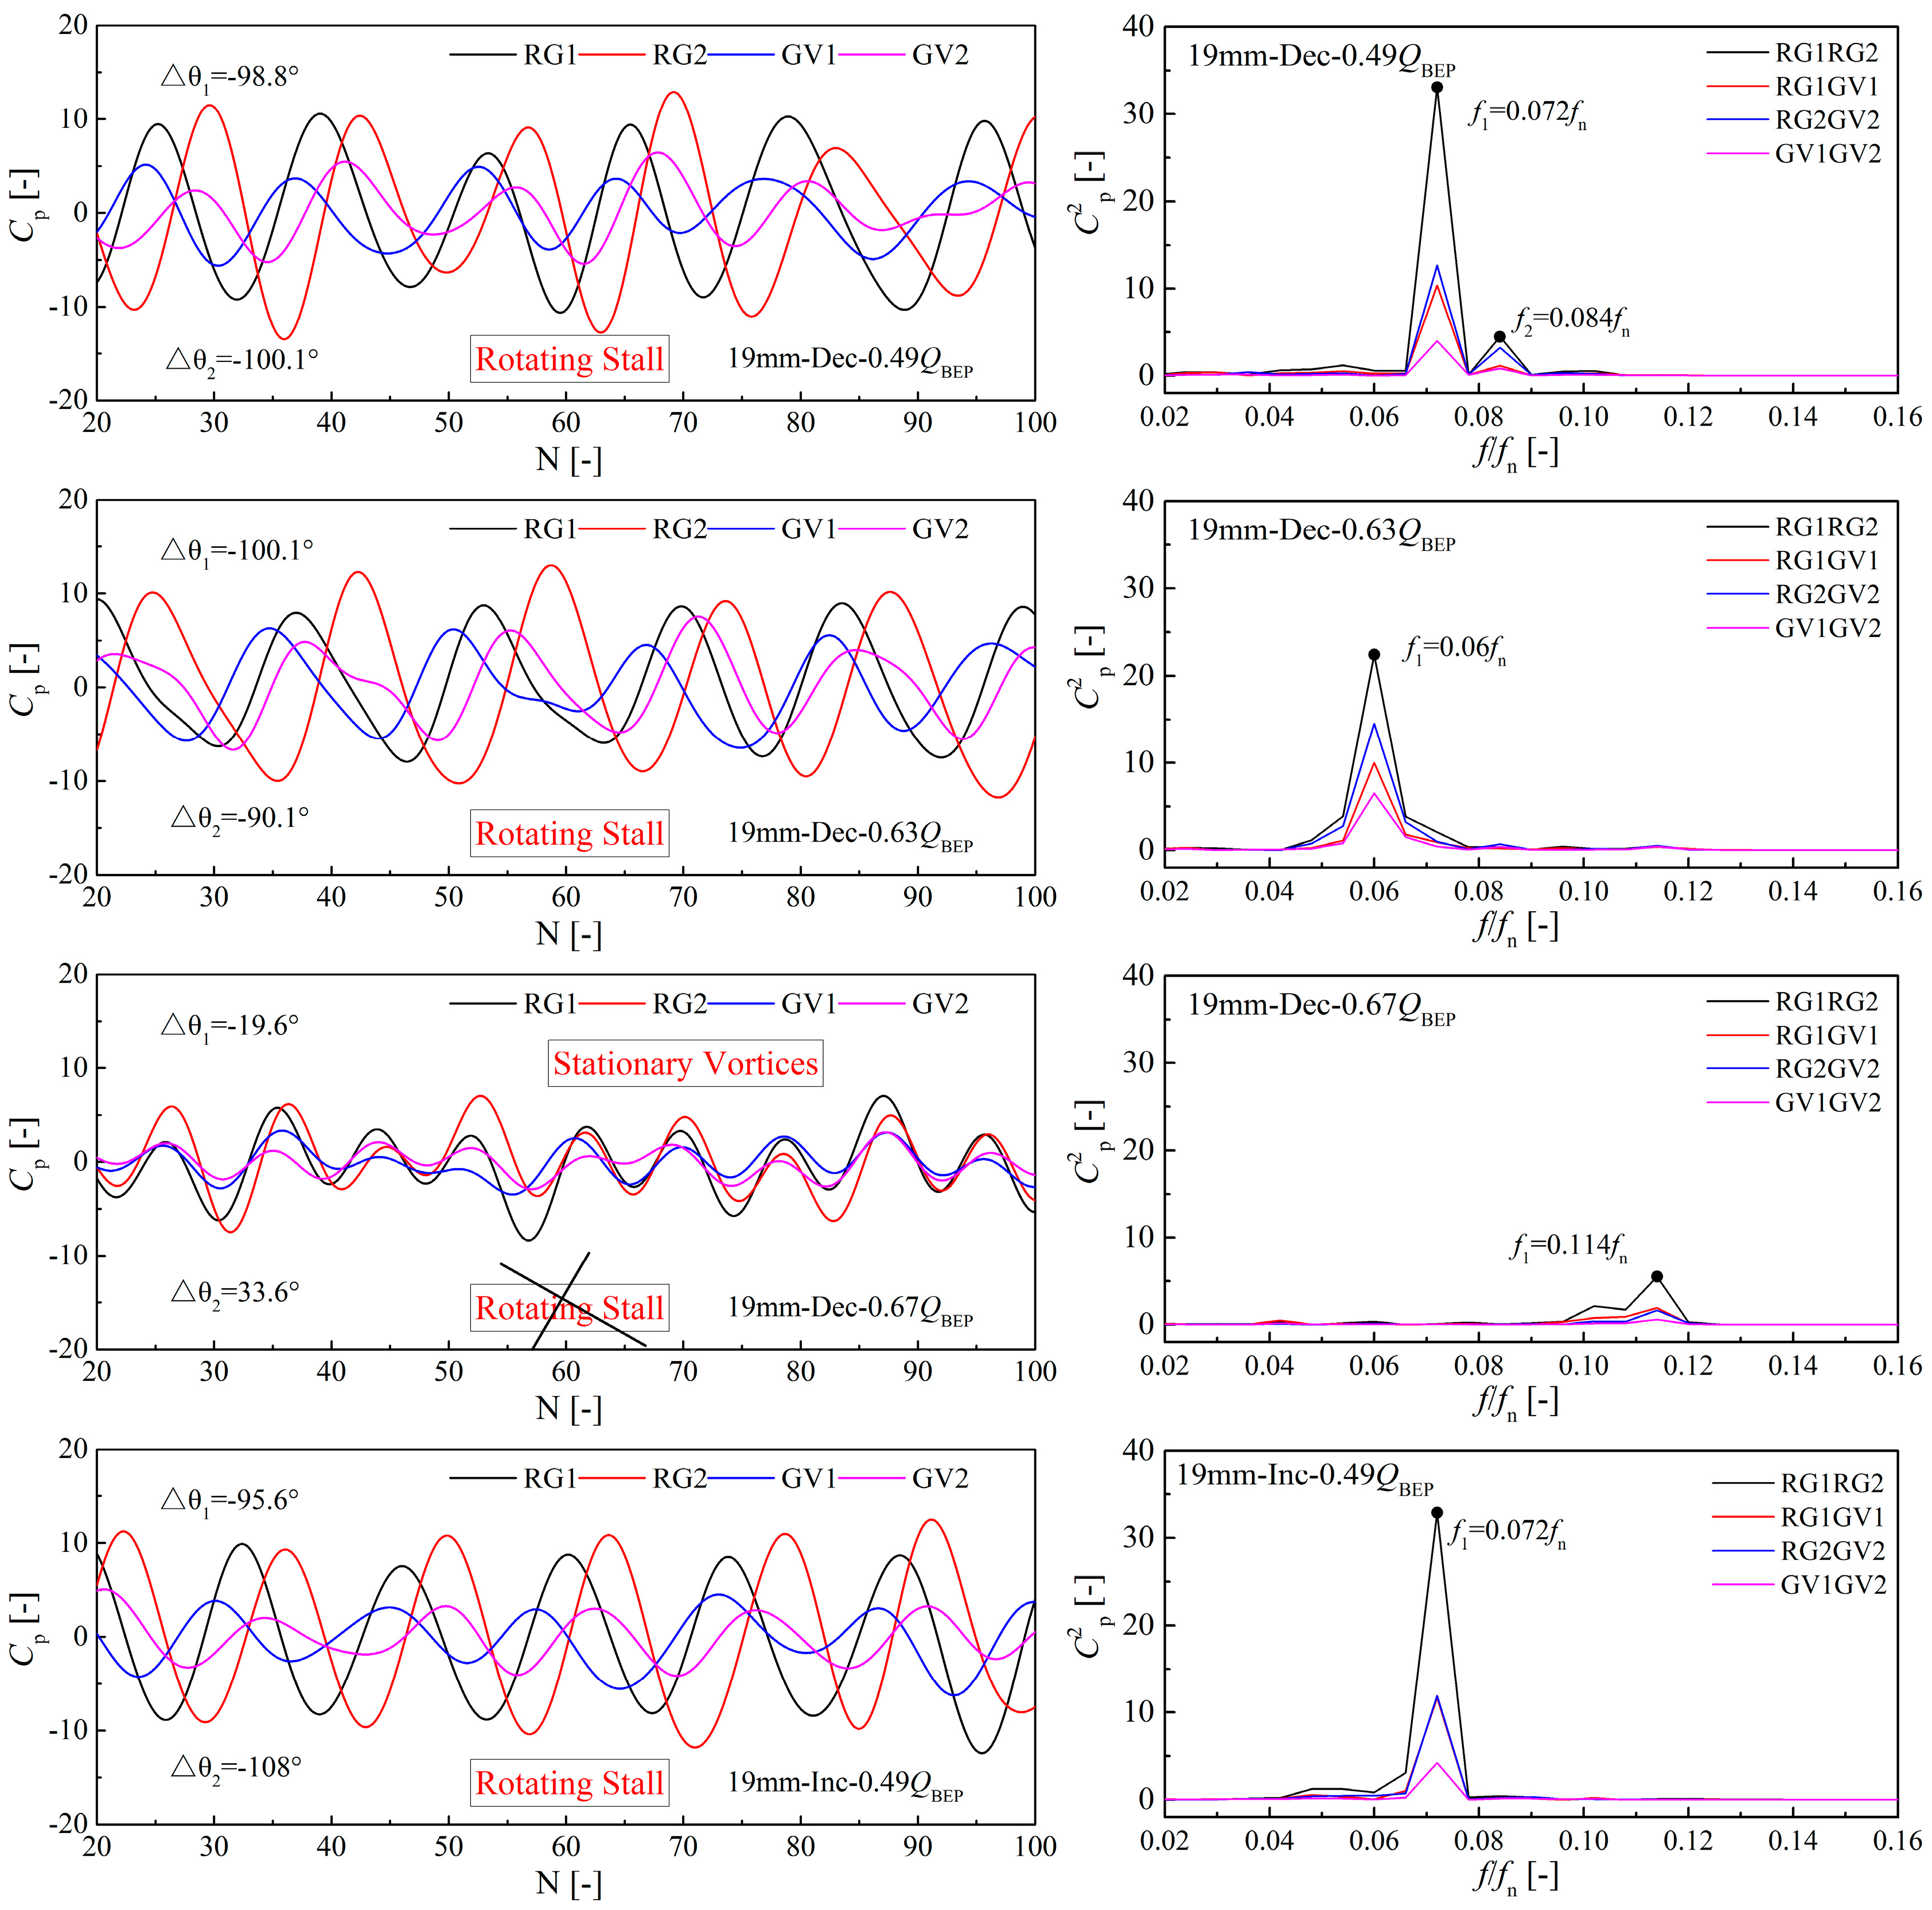
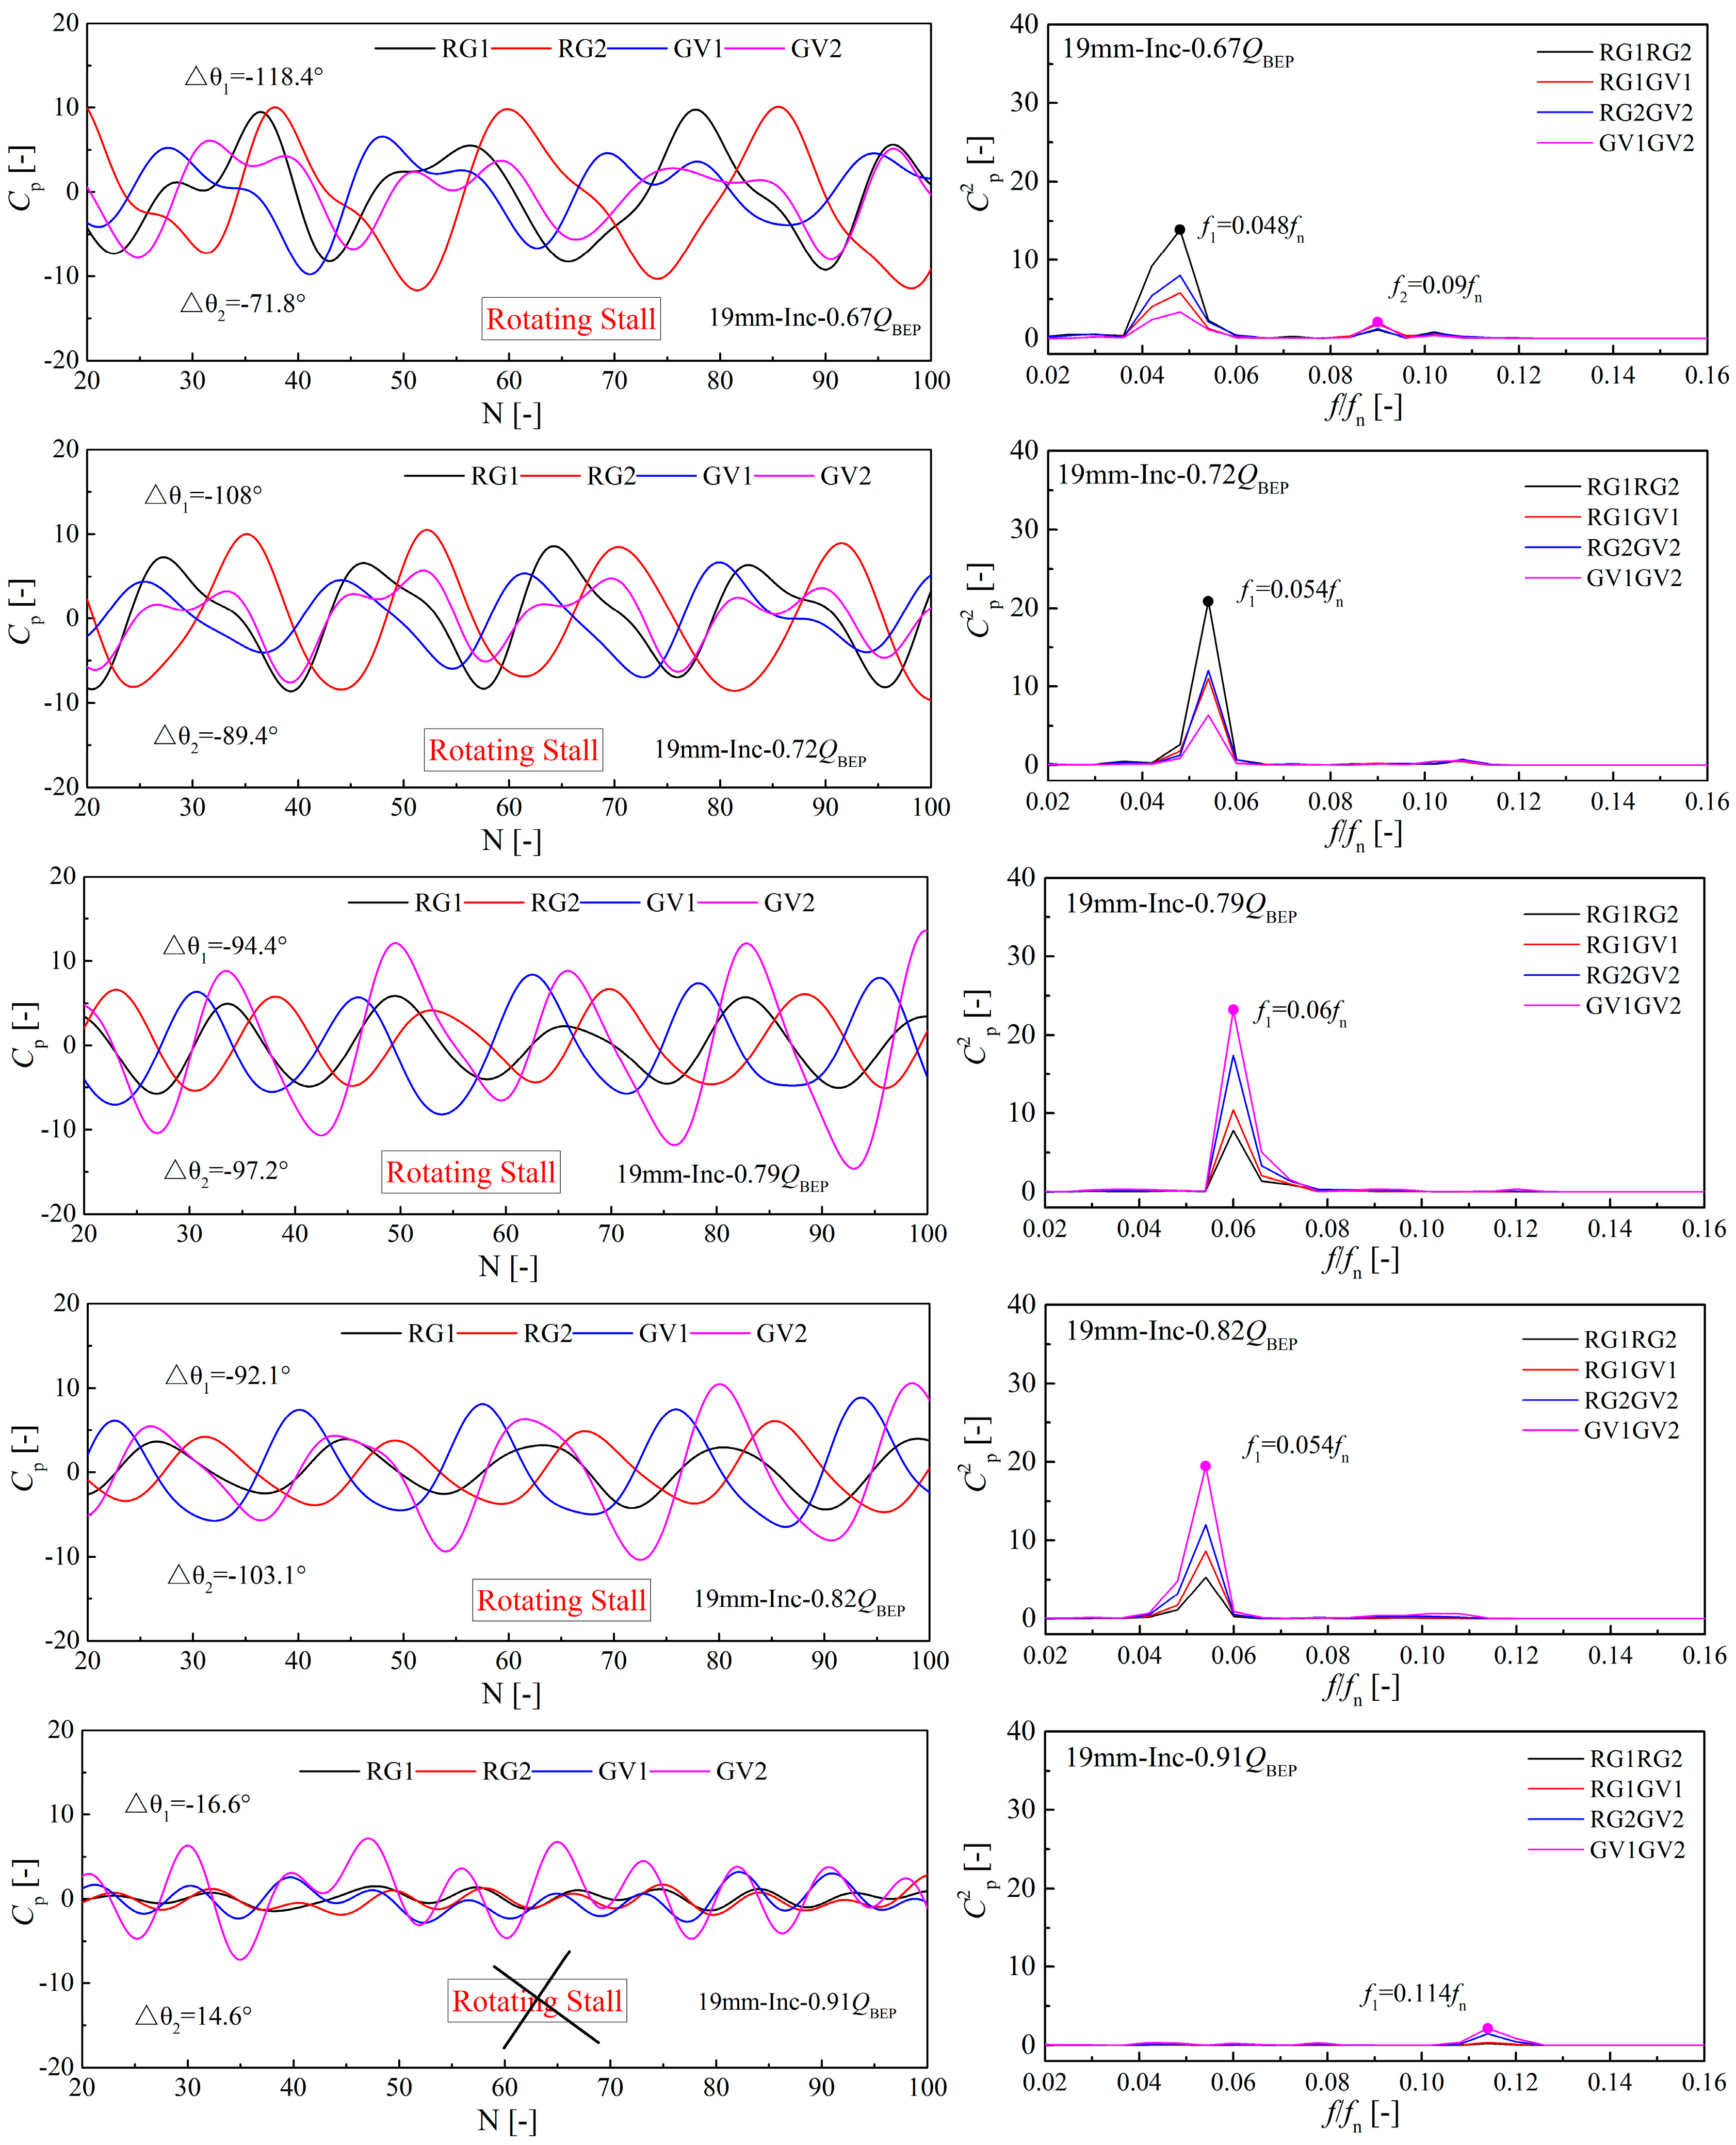
4.2. Analysis of Low-Frequency Vortices

Low frequency components in the pressure fluctuations in pump-turbines usually come from stationary vortex, unsteady vortex and rotating stall [18]. To analyze the type of these low frequency components, a low pass filter was used to obtain the time domain signals. In addition, the cross power spectrum between the different signals was determined in order to obtain the correlation and phase difference of different frequency components. As shown in Figure 6, points RG1 and RG2 are located on the same circumference with 90° difference, and the same is also true for points GV1 and GV2. Figure 11 shows the low pass filter signals and corresponding cross power spectrum of several operating points in the two directions.
In the decreasing direction, for point 0.49QBEP, averaged phase difference between RG1 and RG2 (Δθ1) is −98.8° and averaged phase difference between GV1 and GV2 (Δθ2) is −100.1°. Both are around 90° and the cross power spectrum shows extremely high correlation for these four signals. Hence, this low frequency component was considered as coming from the rotating stall, due to which the runner spins in the anticlockwise direction, and points RG1 and GV1 are upstream of the points RG2 and GV2; the negative sign indicates that the vortices rotate in the opposite direction from the runner.
Using the same method to analyze the rest operating points, it is found that low frequency component for point 0.67QBEP just originates from the unsteady vortex, due to the low correlation and lack of a consistent phase difference.
To summarize, from the Figure 11, in the decreasing direction, above the point 0.91QBEP, there is no low frequency component (no vortices); from the point 0.63QBEP to 0.91QBEP, the low frequency component comes from unsteady vortex, while below the point 0.63QBEP, unsteady vortices develop and become a rotating stall. In the increasing direction, below the point 0.82QBEP, all the low frequency components originate from the rotating stall. Then at the point 0.91QBEP, the rotating stall suddenly disappears, and only very low unsteady vortices could be found in the guide vanes.
In the decreasing direction, the flow patterns develop from initial good operating conditions as the discharge is reduced. Hence, the vortices develop from the stationary vortex, and then become an unsteady vortex and finally become a rotating stall, while in the increasing direction, the flow patterns begin from the bad operating condition (rotating stall), so the rotating stall slowly disappears and lasts to the point 0.91QBEP as the discharge is increased. When the operating condition is not suitable, the rotating stall suddenly breaks down. As a consequence, the processes in the two directions show differences, which leads to the different level hydraulic losses, and contribute to the hysteresis phenomenon in the first hump region.

5. Conclusions

Pump characteristics of a low specific speed (nq = 36.1 min−1) pump-turbine were experimentally studied in this paper. The hump characteristic under 19 mm GVO in particular was emphasized. When it was measured in the increasing and decreasing discharge directions, an interesting phenomenon (hysteresis characteristic) was found.
Firstly, the analysis of the performance characteristics reveals that the hump characteristic is the result of Euler momentum and hydraulic losses. Moreover, the first hysteresis loop far away from BEP mainly originates from hydraulic losses, while the second hysteresis loop results from the combined effect of the Euler momentum (recirculation inlet) and hydraulic losses. Due to the different development processes in the two directions, Euler momentum and hydraulic losses are different, which contributes to the hysteresis phenomenon.
Secondly, measurements of pressure fluctuations in the whole passage reveal that high amplitude low frequency components exist in the vaneless space or guide vanes. Moreover, the frequency and magnitudes of the low frequency components also show hysteresis characteristics, which indicate the high hydraulic losses might be related to the low frequency components.
Finally, the analysis of phase and cross power spectrum of the low frequency signals describes the development of the low frequency components. These low frequency components might come from the stationary vortices, or unsteady vortices, or a rotating stall. Vortices will develop and become a rotating stall when the operating conditions are suitable.
Due to the existing of the hysteresis characteristic, the hump instability region is increased. Hence, in the hydraulic model acceptance test, the hump characteristic should be measured in two directions, and the selection of the hump margin should consider the hysteresis characteristic. In this research, the hump characteristic and associated hysteresis phenomenon were investigated only through experiments. However, the flow mechanism is still not clear. Further studies through numerical methods should be performed to obtain a detailed formation mechanism. To avoid the hump characteristic and associated hysteresis phenomenon, the radical solution is to optimize the runner design of pump-turbines.

Acknowledgments

This work was supported by Foundation for Innovative Research Groups of the National Natural Science Foundation of China (Grant No. 51121004) and China Scholarship Council (CSC) (Grant No. 201506120168).

Author Contributions

This paper is part work of Ph.D. work of Deyou Li. Hongjie Wang is the Ph.D.-candidate’s supervisor. Torbjørn K. Nielsen and Daqing Qin are co-supervisors. Deyou Li programmed the measurement system, carried out measurements, performed the analysis and prepared the manuscript. Jinxia Chen is an engineer at the Harbin Institute of Large Electrical Machinery. She carried out the measurements together with Deyou Li. Hongjie Wang discussed with Deyou Li and proposed the structure of the manuscript and the method of the analysis. Torbjørn K. Nielsen, Daqing Qin and Xianzhu Wei provided a lot of suggestions and revised the manuscript.

Conflicts of Interest

The authors declare no conflict of interest.

Abbreviations

GVOGuide vane opening
BEPBest efficiency point
BPFBlade passing frequency
FFTFast Fourier transform
HILEMHarbin Institute of Large Electrical Machinery
IECInternational Electrotechnical Commission
QBEPDischarge at the best efficiency point under the 19 mm GVO
nqSpecific speed of the pump-turbine in pump mode, n q = n Q H 3 4 , min−1
ωspump dimensionless specific speed ω s = ω Q ( g H ) 3 4 , s−1
HPump head at the best efficiency point, m
QPump volume discharge at the best efficiency point, m3·s−1
THydraulic torque, N·m
gGravitational acceleration, m·s−2
ρDensity of the water, kg·m−3
D1Runner inlet diameter in pump mode, m
D2Runner outlet diameter in pump mode, m
B0Guide vane height, m
D0Guide vane distribution diameter, m
nRotational speed of the runner, rpm
n0Rotational speed of the runner, s−1
pInstantaneous pressure, pa
p ¯ Time averaged pressure of 10s for every position, pa
U2Circumferential velocity at the tip of the blades at the runner outlet, m·s−1
fnRotational frequency, Hz
f0Minimum frequency resolution, 0.0006fn, Hz
f1The first dominant frequency, Hz
Δθ1Phase difference between RG1 and RG2, °
Δθ2Phase difference between GV1 and GV2, °
EnDEnergy coefficient, E n D = g H n 0 2 D 1 2
QnDDischarge coefficient, Q n D = Q n 0 D 1 3
TnDTorque coefficient, T n D = T ρ n 0 2 D 1 5
uCircumferential velocity, m·s−1
CuComponent of the absolute velocity in the circumferential direction, m·s−1
Δcu·uEuler momentum (the change of velocity momentum), m2·s−2

Subscripts

1Runner inlet
2Runner outlet
netNet
grossGross
lossHydraulic losses

References

  1. Erne, S.; Edinger, G.; Doujak, E.; Bauer, C. Numerical and experimental investigation on unsteady inflow conditions of a pump-turbine at low load. In Proceedings of the ASME 2014 4th Joint US-European Fluids Engineering Division Summer Meeting and 12th International Conference on Nanochannels, Microchannels, and Minichannels, Chicago, IL, USA, 3–7 August 2014.
  2. Liu, J.T.; Liu, S.H.; Wu, Y.L.; Jiao, L.; Wang, L.Q.; Sun, Y.K. Numerical investigation of the hump characteristic of a pump–turbine based on an improved cavitation model. Comput. Fluids 2012, 68, 105–111. [Google Scholar] [CrossRef]
  3. Li, D.Y.; Wang, H.J.; Xiang, G.M.; Gong, R.Z.; Wei, X.Z.; Liu, Z.S. Unsteady simulation and analysis for hump characteristics of a pump turbine model. Renew. Energ. 2015, 77, 32–42. [Google Scholar]
  4. Yang, J.; Pravesi, G.; Yuan, S.; Cavazzini, G.; Ardizzon, G. Experimental characterization of a pump-turbine in pump mode at hump instability region. ASME J. Fluids Eng. 2015, 137, 1–11. [Google Scholar] [CrossRef]
  5. Ješe, U.; Fortes-Patella, R.; Dular, M. Numerical study of pump-turbine instabilities under pumping mode off- design conditions. In Proceedings of the ASME-JSME-KSME Joint Fluids Engineering Conference 2015, Seoul, Korea, 26–31 July 2015.
  6. Braun, O.; Kueny, J.L.; Avellan, F. Numerical analysis of flow phenomena related to the unstable energy-discharge characteristic of a pump-turbine in pump mode. In Proceedings of the 2005 ASME Fluid Engineering Division Summer Meeting and Exhibition, Houston, TX, USA, 19–23 June 2005.
  7. Kaupert, K.A.; Holbein, P.; Staubli, T. A first analysis of flow field hysteresis in a pump impeller. ASME J. Fluids Eng. 1996, 118, 685–691. [Google Scholar] [CrossRef]
  8. Kaupert, K.A.; Staubli, T. The unsteady pressure field in a high specific speed centrifugal pump impeller—Part I: Influence of the volute. ASME J. Fluids Eng. 1999, 121, 621–626. [Google Scholar] [CrossRef]
  9. Kaupert, K.A.; Staubli, T. The unsteady pressure field in a high specific speed centrifugal pump impeller—Part II: Transient hysteresis in the characteristic. ASME J. Fluids Eng. 1999, 121, 627–632. [Google Scholar] [CrossRef]
  10. Iino, M.; Tanaka, K.; Miyagawa, K.; Okubo, T. Numerical simulation of hysteresis on head/discharge characteristics of a centrifugal pump. In Proceedings of the ASME FEDSM 4th ASME_JSME Joint Fluids Engineering Conference, Honolulu, HI, USA, 6–10 July 2003.
  11. Ran, H.J.; Luo, X.W.; Zhu, L.; Zhang, Y.; Wang, X.; Xu, H.Y. Experimental study of the pressure fluctuations in a pump turbine at large partial flow conditions. Chin. J. Mech. Eng. 2012, 25, 1205–1209. [Google Scholar] [CrossRef]
  12. Ran, H.J.; Luo, X.W.; Chen, Y.L.; Xu, H.Y.; Farhat, M. Hysteresis phenomena in hydraulic measurement. IOP Conf. Ser. Earth Environ. Sci. 2012, 15, 062048. [Google Scholar] [CrossRef]
  13. Ješe, U. Numerical Study of Pump-Turbine Instabilities under Pumping Mode off-Design Conditions. Ph.D. Thesis, University Grenoble Alpes, Grenoble, France, 2015. [Google Scholar]
  14. Li, D.Y.; Wang, H.J.; Zhao, J.L.; Gong, R.Z.; Wei, X.Z.; Qin, D.Q. Optimization of testing system and experiment research for pump turbine model. IOP Conf. Ser. Mater. Sci. Eng. 2013, 52, 52023. [Google Scholar] [CrossRef]
  15. International Electrotechnical Commission. Hydraulic Turbines, STORAGE Pumps and Pump-Turbines—Model Acceptance Tests; International Electrotechnical Commission: Geneva, Switzerland, 1999. [Google Scholar]
  16. Li, D.Y.; Gong, R.Z.; Wang, H.J.; Fu, W.W.; Wei, X.Z.; Liu, Z.S. Fluid flow analysis of drooping phenomena in pump mode for a given guide vane setting of a pump-turbine model. J. Zhejiang Univ.-Sci. A (Appl. Phys. Eng.) 2015, 16, 851–863. [Google Scholar] [CrossRef]
  17. Li, D.Y.; Han, L.; Wang, H.J.; Gong, R.Z.; Wei, X.Z.; Qin, D.Q. Flow characteristics prediction in pump mode of a pump turbine using large eddy simulation. Proc. IMechE E J. Process. Mech. Eng. 2016. [Google Scholar] [CrossRef]
  18. Widmer, C.; Staubli, T.; Ledergerber, N. Unstable characteristic and rotating stall in turbine brake operation of pump-turbines. ASME J. Fluids Eng. 2011, 133, 41101. [Google Scholar] [CrossRef]
Figure 1. A pump-turbine undergoes the hump region during the start-up.
Energies 09 00620 g001
Figure 2. The pump-turbine model.
Energies 09 00620 g002
Figure 3. Schematic diagram of the test rig.
Energies 09 00620 g003
Figure 4. Performance characteristics under 19 mm GVO.
Energies 09 00620 g004
Figure 5. Energy coefficients for gross energy, net energy and hydraulic losses.
Energies 09 00620 g005
Figure 6. Monitoring points of pressure fluctuations in the measurements. (a) Monitoring points in front view; (b) Monitoring points in top view.
Energies 09 00620 g006
Figure 7. Standard deviation of pressure fluctuations for different monitoring points.
Energies 09 00620 g007
Figure 8. Frequency spectrum for different operating points in the decreasing direction.
Energies 09 00620 g008aEnergies 09 00620 g008b
Figure 9. Frequency spectrum in detail at point 0.67QBEP in the decreasing direction.
Energies 09 00620 g009
Figure 10. Comparison of low frequency components of pressure fluctuations in the two directions.
Energies 09 00620 g010aEnergies 09 00620 g010bEnergies 09 00620 g010c
Figure 11. Rotating stall confirmation for different operating points in two directions.
Energies 09 00620 g011aEnergies 09 00620 g011b
Table 1. Main parameters of the pump-turbine model.
ParameterSymbolValueDescription
Specific speednq36.1 min−1pump mode
Runner inlet diameterD10.250 mpump mode
Runner outlet diameterD20.450 mpump mode
Guide vane heightB00.04373 m
Guide vane disribution diameterD00.54117 m
Optium GVOGVOBEP25 mmPump mode
Investigated GVO 19 mmPump mode

