1. Introduction
With the development of economics, people pay more and more attention to environmental protection, and new energy vehicles have been irresistible traffic tools for human beings. Power batteries, as the energy source of electric vehicles (EVs), play important roles in the whole EV system. However, the small capacity and low voltage of a single battery cell cannot meet the needs of an EV; thus people generally group many new battery cells together to form a battery pack to provide enough power for the EV [
1]. Because of the differences in the characteristics, some of the batteries in a battery pack can easily be over-charged or over-discharged, or the potential of most batteries in a battery pack will not exhaust, which will affect the performance and service life of the whole battery pack. Moreover, the inconsistency of the batteries will make monitoring and management of the states, such as estimating the state of charge (SOC) [
2,
3] and the state of health (SOH) [
4,
5] of the battery pack, much more difficult. Therefore, it is very important to choose a suitable battery grouping method to assemble batteries with similar characteristics into a pack by a serial and/or parallel connection.
At present, there are three types of battery grouping methods as follows: single characteristic based battery grouping, multiple characteristics based battery grouping, and dynamic characteristics based battery grouping.
In general, the characteristics used for battery grouping include the battery terminal voltage, internal resistance, static capacity, self-discharge rate, etc. The single characteristic based battery grouping methods choose only one of these characteristics as the grouping criteria. For example, the cell capacity is usually used as the criteria for battery grouping, i.e., batteries with similar capacities are grouped together to form a battery pack. Internal resistance is another widely considered characteristic to build battery packs [
6]. People may also consider thermal characteristics for building a battery pack [
7]. Unfortunately, a single characteristic is generally too limited to present the performance of the battery; therefore, single characteristic based battery grouping methods commonly have poor performance.
Multiple characteristics based battery grouping methods combine several characteristics together as the grouping criteria. Multiple characteristics can better characterize the battery; thus, the performance of this grouping method is often greatly improved compared with single characteristic based grouping methods. For example, many battery manufactories in China combine the discharge open-circuit cutoff voltage and the charge static terminal voltage as the standard for battery grouping [
8]. However, generally speaking, battery characteristics are often assessed when the battery is in a stable state without consideration of the dynamic performance of the battery; thus, even the combination of multiple characteristics still does not completely reflect the battery performance, especially the dynamic performance.
Dynamic characteristics reflect the working performance of a battery; thus, dynamic characteristics based battery grouping methods have the best performance compared to the other two methods. One of the widely applied battery dynamic characteristics is electrochemical impedance spectroscopy (EIS) [
9], which has been used for battery SOC estimation [
10], battery grouping [
11], etc. The main problem of EIS is twofold. First, the EIS measurement needs special instruments and is time consuming. Second, the EIS measurement usually cannot be performed online.
Because many dynamic characteristics can be inferred from the continuous working charge/discharge sequence, in this paper, we utilize the continuous charge/discharge sequence of batteries when the battery is charged/discharged with a constant current for battery grouping. Actually, power batteries are usually processed with a formation procedure that often contains a number of alternate full charge and full discharge processes; these charge and discharge processes can be used for battery grouping.
Because the battery charge/discharge sequence is an ordered multidimensional data set, a charge/discharge sequence based battery grouping can actually be regarded as a time series clustering problem. There are two types of strategies for time series clustering. The first strategy is to extract some distinct features from the time series; the clustering can then be performed with this bag-of-features [
12]. The second strategy is to utilize the whole sequence directly for clustering. At present, there are many time series clustering methods in the literature, including the classical K-means algorithm [
13], the K-Nearest Neighbor (KNN) algorithm [
14], etc. The K-means and KNN need to specify the number of clusters in advance, and when the number of clusters is unknown, it is necessary to use a certain method to estimate the number of clusters. Another similar problem for time series clustering is time series classification, which classifies time series to different classes and is a supervised learning problem, while the time series clustering problem is an unsupervised problem. Commonly used methods for time series classification are the shapelet based method [
15], the recurrent neural network (RNN) based method [
16], etc. In fact, sometimes we can use the time series classification method to accomplish time series clustering.
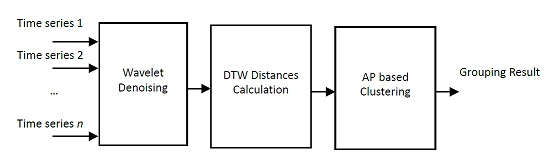
In this paper, we propose a battery grouping method according to the time series clustering methodology. The whole time series is utilized for clustering in this paper. The battery charge/discharge sequences are first denoised. The dynamic time warping (DTW) distances [
17] between different battery charge/discharge sequences are then calculated, followed by a normalization step to form a similarity matrix, which is utilized by the affinity propagation (AP) algorithm [
18] for clustering.
The paper is organized as follows. In
Section 2, we define the battery grouping problem. In
Section 3 we provide the framework of the proposed method and describe each part in detail. In
Section 4, we show the experimental results. Finally, conclusions are provided in
Section 5.
2. Problem Formulation
The purpose of battery grouping is to divide new batteries into different groups, with highest in-class characteristic similarities and lowest between-class characteristic similarities; this is a typical clustering problem. The only difference between the battery grouping problem and other common clustering problems is that the numbers of batteries in clusters for battery grouping problems are the same, but this is not a large problem. One can first cluster batteries with commonly used clustering algorithms, and then divide or merge clusters that have a different number of batteries other than the required number. This may not be an optimal solution, but it should be adequate. Therefore, in this paper, we regard the battery grouping problem as a common clustering problem.
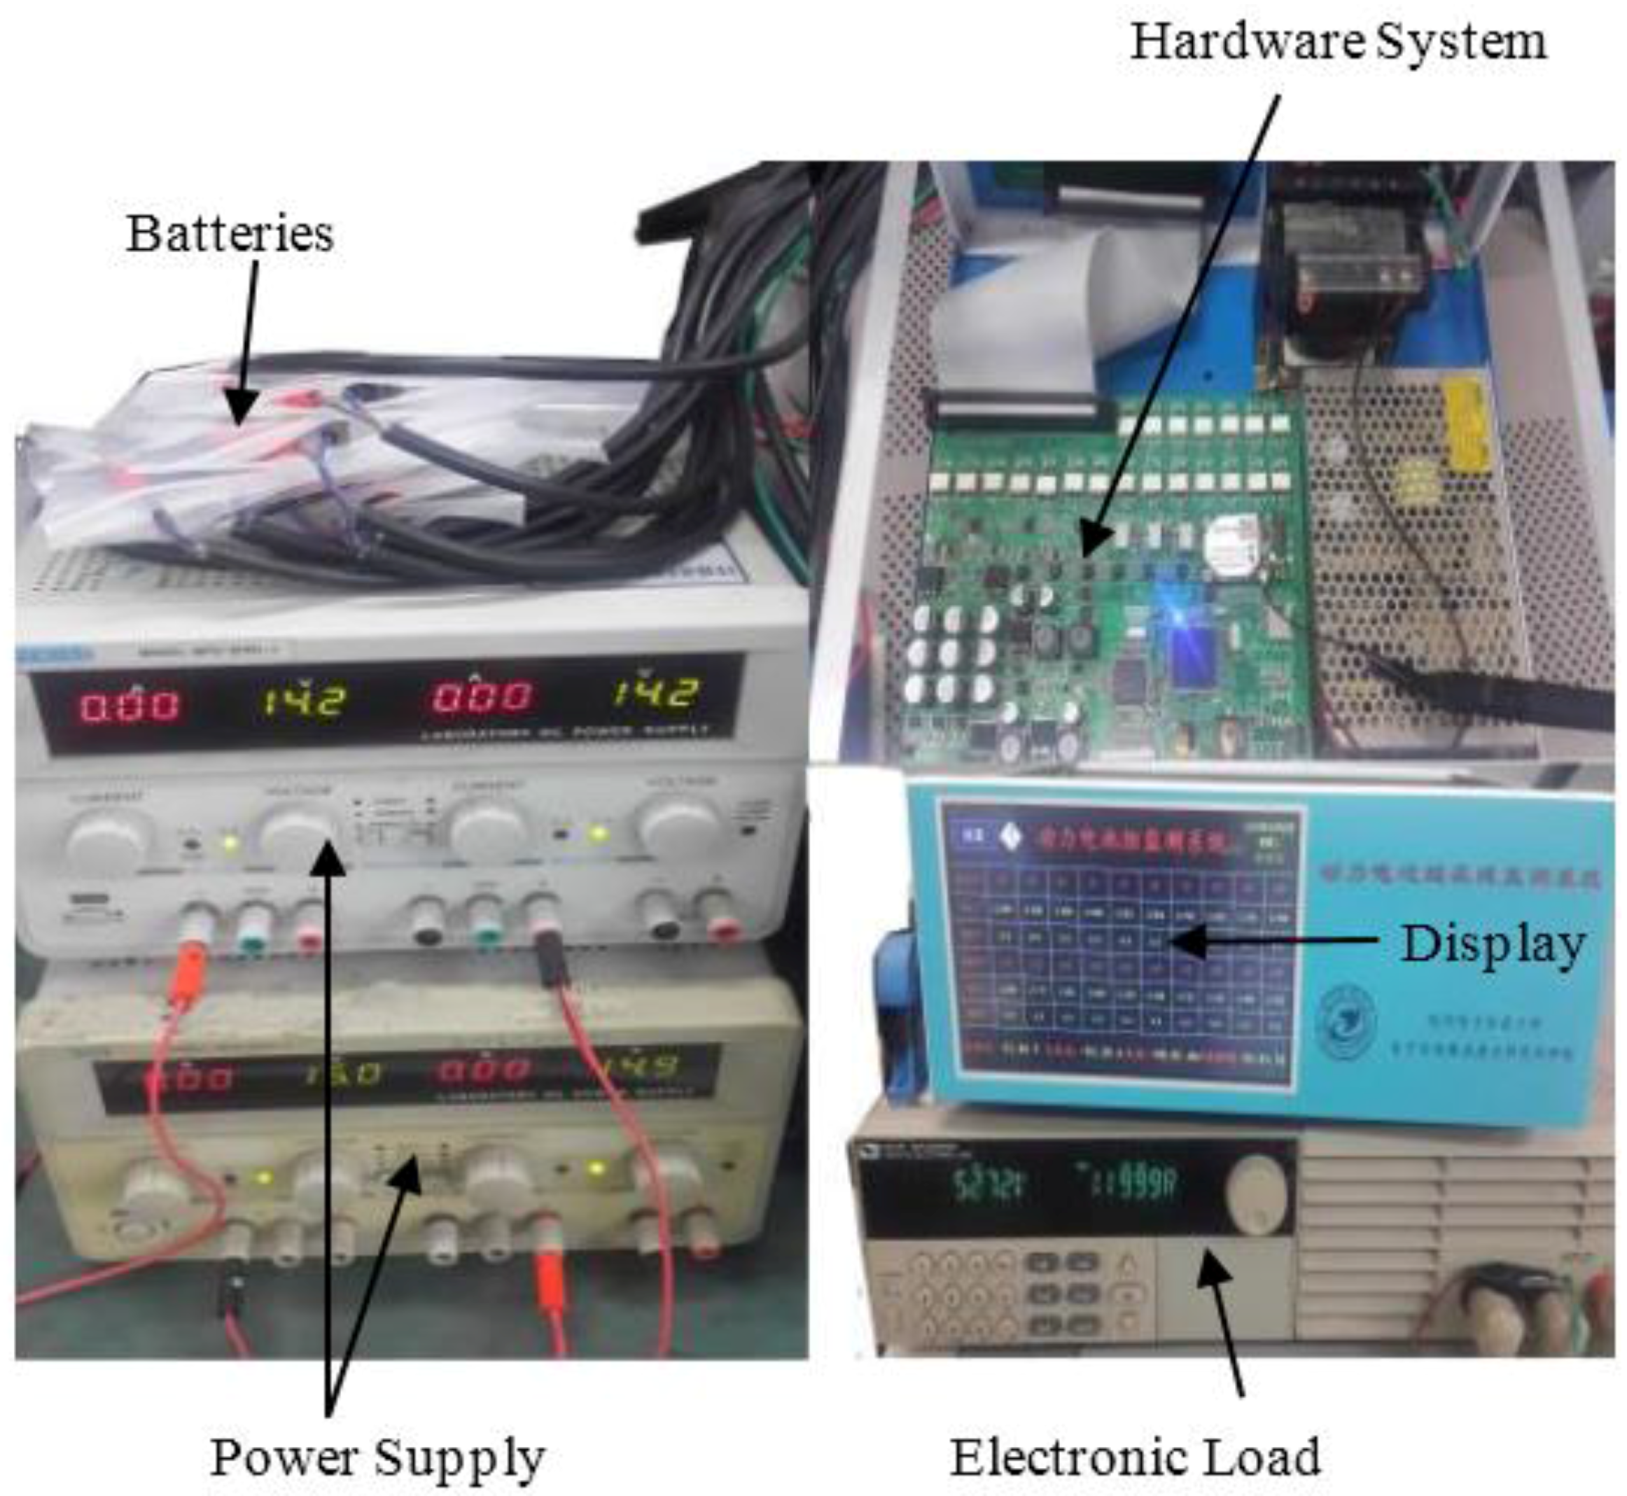
As mentioned before, in this paper we use the full charge and discharge series for battery grouping. To obtain these charge and discharge series, we build an embedded system that can simultaneously measure the terminal voltages, temperatures and currents for 20 batteries, as shown in
Figure 1.
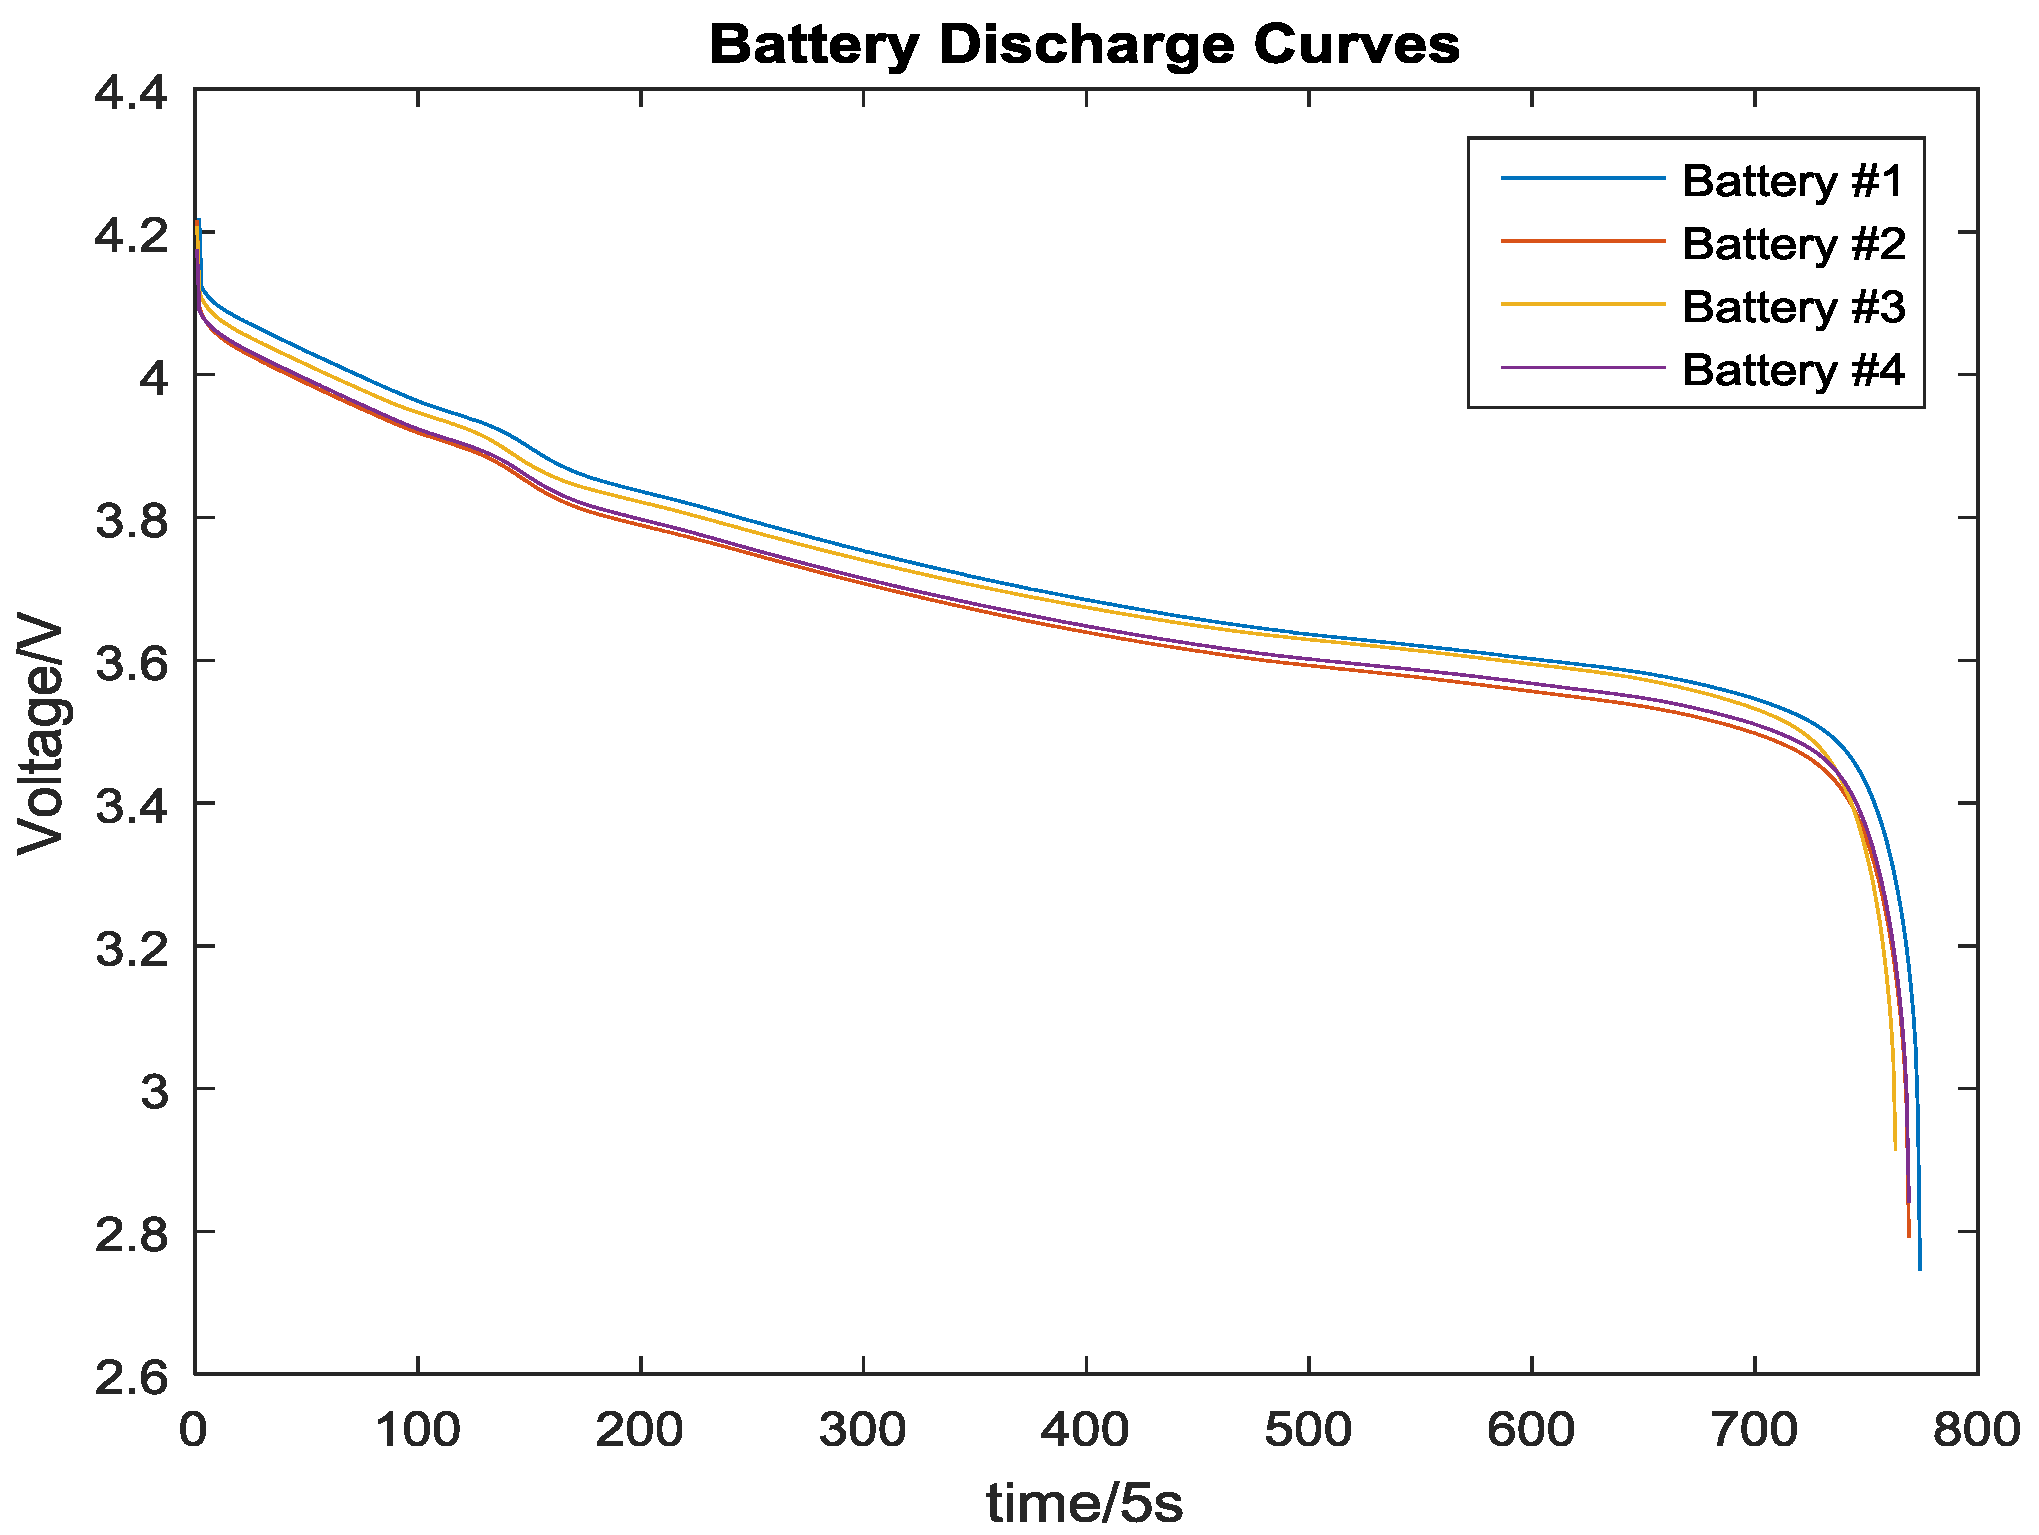
Typical battery discharge curves at a discharge rate of 0.6C for LiMn
2O
4 batteries are shown in
Figure 2. At first glance, battery #2 and #4 are close to each other. Actually, the DTW distances, which will be further explained in the following section, between different sequences are as follows:
d12 = 22.2572,
d13 = 4.6084,
d14 = 18.9139,
d23 = 11.8688,
d24 = 0.4057,
d34 = 8.5479. A successful clustering algorithm should classify battery #2 and battery #4 in one group and battery #1 should be classified to another group.
3. AP Based Battery Grouping with the DTW Distance
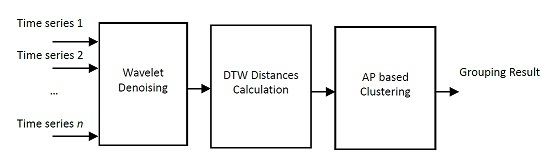
As mentioned before, we utilize the whole battery charge/discharge curve for battery grouping. For obtaining the battery charge curve, the battery is initially fully discharged, i.e., it has a state of charge of 0%, the battery is then charged with a constant current until it is fully charged. During this process, the battery terminal voltages are measured and saved to form the battery charge curve. The process for obtaining the battery discharge curve is similar. Because both the charge curve and discharge curve are time-related, we regard battery grouping as a time series clustering problem. There are three important issues that should be considered before conducting time series clustering. First, noise may exist in the obtained battery charge/discharge data even if the battery is charged/discharged with a constant current. Second, the number of data points may be different with different batteries; thus the lengths of the time series may not be the same. Third, the number of clusters is unknown beforehand. To solve the first issue, a data denoising process should be used. In this paper, we utilize a wavelet based signal denoising [
19] technology to smooth the battery charge/discharge data. Because the data lengths vary, the traditional distance metrics, such as the Euclidean distance, cannot be directly utilized. In this paper, we utilize the DTW distance to compute the similarities among different battery charge/discharge curves. Because the number of clusters is unknown, traditional data clustering methods, such as K-means and KNN cannot be directly utilized. For this reason, we use the AP algorithm to perform the time series clustering. The flow chart of the proposed method is shown in
Figure 3.
3.1. Wavelet Denoising
Suppose the underlying model for the noisy signal
is basically of the following form:
where
is Gaussian white noise with a zero mean and a standard variation of
. The wavelet denoising mainly consists of the following three procedures:
Decomposition of the noisy signal into levels and computation of the approximation coefficients of at level .
Denoising by thresholding the detail coefficients. In this step, a soft thresholding process is performed to the detail coefficients at levels 1 to .
Reconstruction. Compute the reconstructed signal based on the original approximation coefficients of level and the thresholded detail coefficients of levels from 1 to .
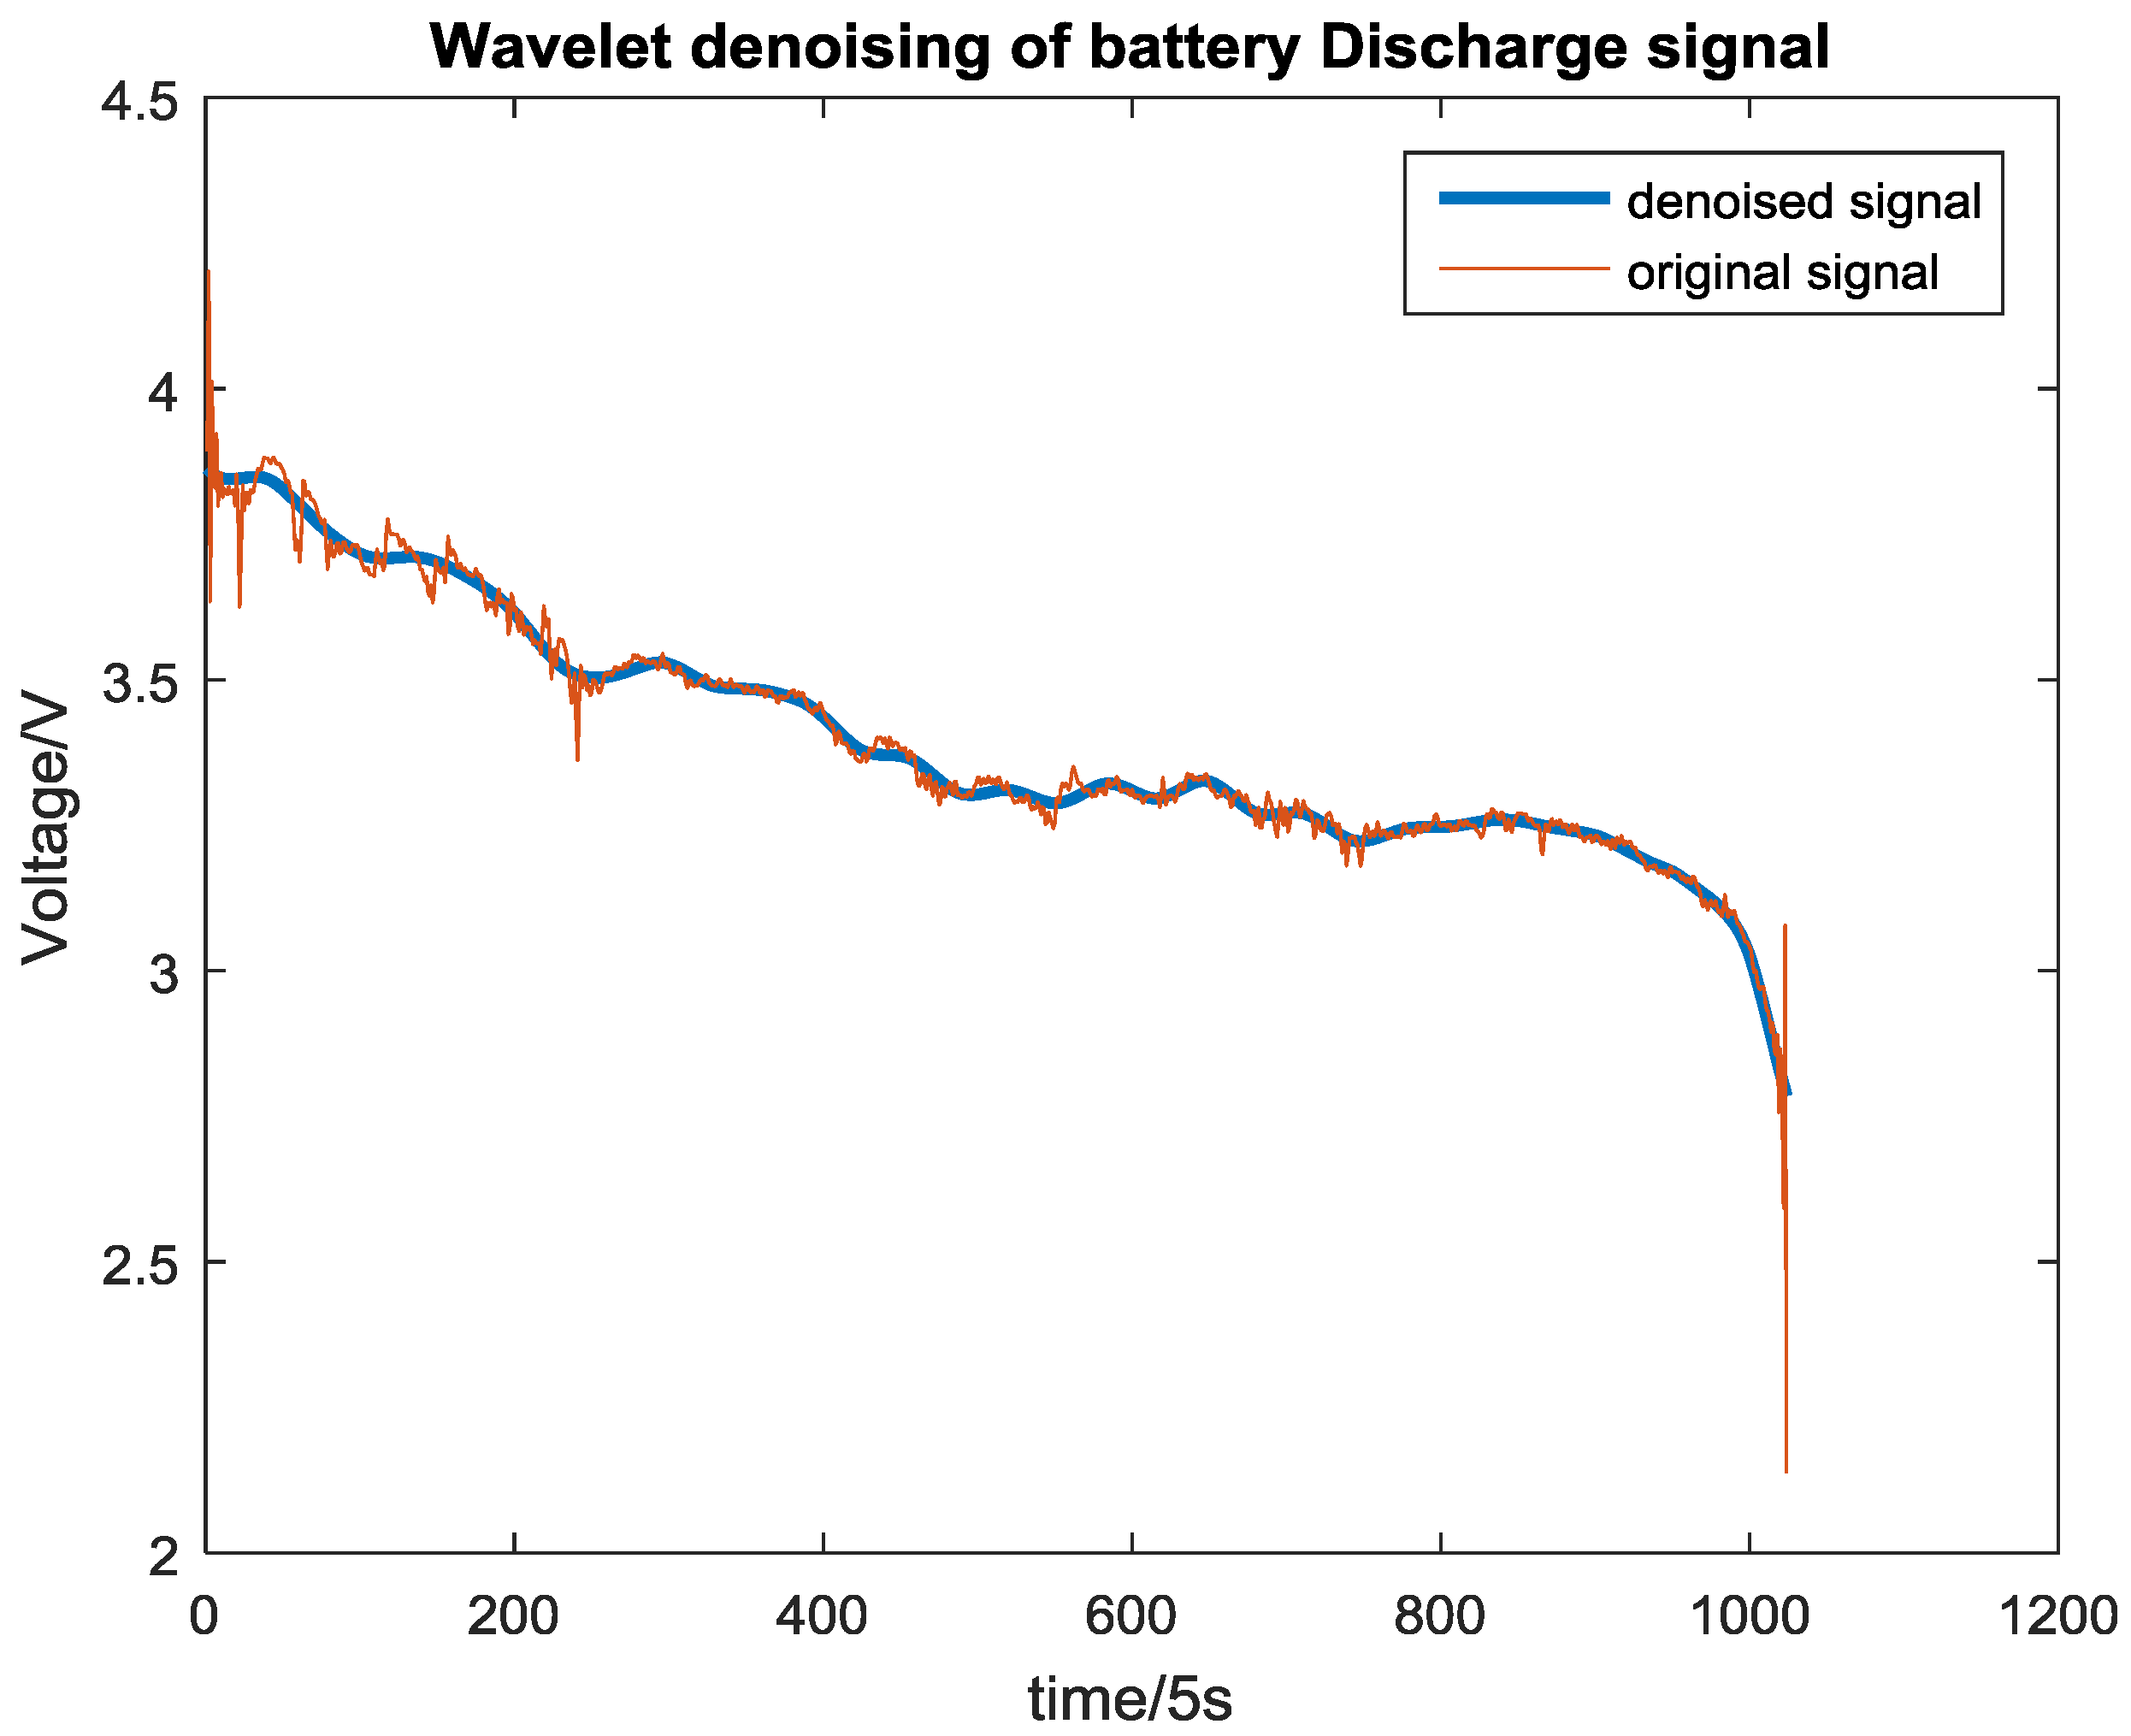
In this paper, we use the symlet wavelet “sym8” which is a compactly supported wavelet with the least asymmetry and the highest number of vanishing moments as the wavelet for signal decomposition. A total level of 5 is used.
Figure 4 shows an example of wavelet denoising. As observed from
Figure 3, the severe fluctuation of the original noisy signal has been successfully removed after denoising.
3.2. DTW Distance
The similarity between two sequences can be measured by their distance. Suppose we have two sequences,
and
. There are several methods to compute the distance between
and
. For example, if
, we can use the Euclidean distance, i.e.,
If
, a simple way to calculate the distance is to rescale one of the sequences with interpolation so that the two sequences have the same length. Then, we can use the Euclidean distance to measure the similarity. However, this may not be a good strategy for time series with varying time and speed. As shown in
Figure 5, two time series have similar shapes and the same length, but the feature points occur at different times. If we still use the Euclidean distance to measure the similarity between these two sequences, a large distance will be obtained, which may not be desired. For this situation, the DTW distance is a better choice to describe the similarity between them. In general, DTW is a method that calculates an optimal match between two sequences. The sequences are “time warped” non-linearly so that the key feature points can be properly aligned.
DTW utilizes dynamic programming to find the optimal mapping of points in two sequences and compute the distance between them. Detailed steps for computing the DTW distance can be found in several papers [
20,
21], and efficient algorithms can be found in [
17].
Suppose we have
sequences. After the computation of the DTW distances, we can obtain a distance matrix
, where
is the DTW distance between sequence
and sequence
. Suppose the largest distance is
and the smallest distance is
, we can then obtain the similarity matrix
, where
is the similarity of sequence
and sequence
and is computed as follows:
which is actually a normalization step.
According to the definition of distance,
is 0. We define
as the mean similarity of the data points that connects to data point
, i.e.,
3.3. AP Based Clustering
AP is a clustering algorithm based on the concept of “message passing” between data points. Unlike traditional clustering algorithms such as K-means and KNN, AP does not require the number of clusters to be determined or estimated beforehand. At the beginning, all data points (a data point in this paper is actually a sequence) are regarded as exemplars. Each data point competes to become the cluster center with two types of message passing, i.e., the responsibility and the availability. This mechanism can avoid the influence of a random selection of initial cluster centers and the specified number of clusters. The responsibility
represents the message passed from data point
to the candidate center
, which describes the appropriateness of data point
to be the cluster center of data point
. However, the availability
represents the message passed from the candidate cluster center
to data point
, which describes the appropriateness that data point
chooses data point
as its candidate center. The bigger the summation of
and
, the more possible it is for data point
to be a cluster center.
and
are initialized to be 0 at the beginning. After obtaining the similarity matrix
,
and
are then computed as follows:
The responsibility and the availability should then be updated with iterations as follows:
where
is the damping coefficient, which has a value in the range of 0.5 to 1. The iteration terminates when a maximum step is reached or the changes in values of
and
are not significant.
If for some battery we have , then battery is a cluster center, and we mark its corresponding element batteries.
More details on the AP algorithm can be found in [
18].
4. Experimental Results
In this part, two types of experiments were performed.
In the first experiment, the proposed battery grouping method was evaluated with real battery charge/discharge sequences. We obtained both the charge and discharge sequences for 94 new LiMn
2O
4 lithium-ion batteries with a nominal capacity of 2 Ah, though the proposed method can also be applied to other types of batteries. The charge curves were obtained when the batteries were charged with a constant current of 1.2 A until the charge cutoff voltage reached, and then charged under a constant voltage when the current dropped to 0.02 A. The discharge curves were obtained when the batteries were discharged at a constant current of 1.2 A. We then utilized the proposed AP based method for battery grouping. For a comparison, we also tested the K-means based spectral clustering method [
22]. We used the silhouette index [
23] to assess the performance of the methods.
The silhouette indexes, according to different numbers of clusters with different algorithms for the charge sequences, are given in
Table 1. According to the results in
Table 1, for the charge curve, the best number of clusters for the AP algorithm and the spectral clustering algorithm are both 6. The best silhouette index of the AP algorithm is larger than that of the spectral clustering algorithm.
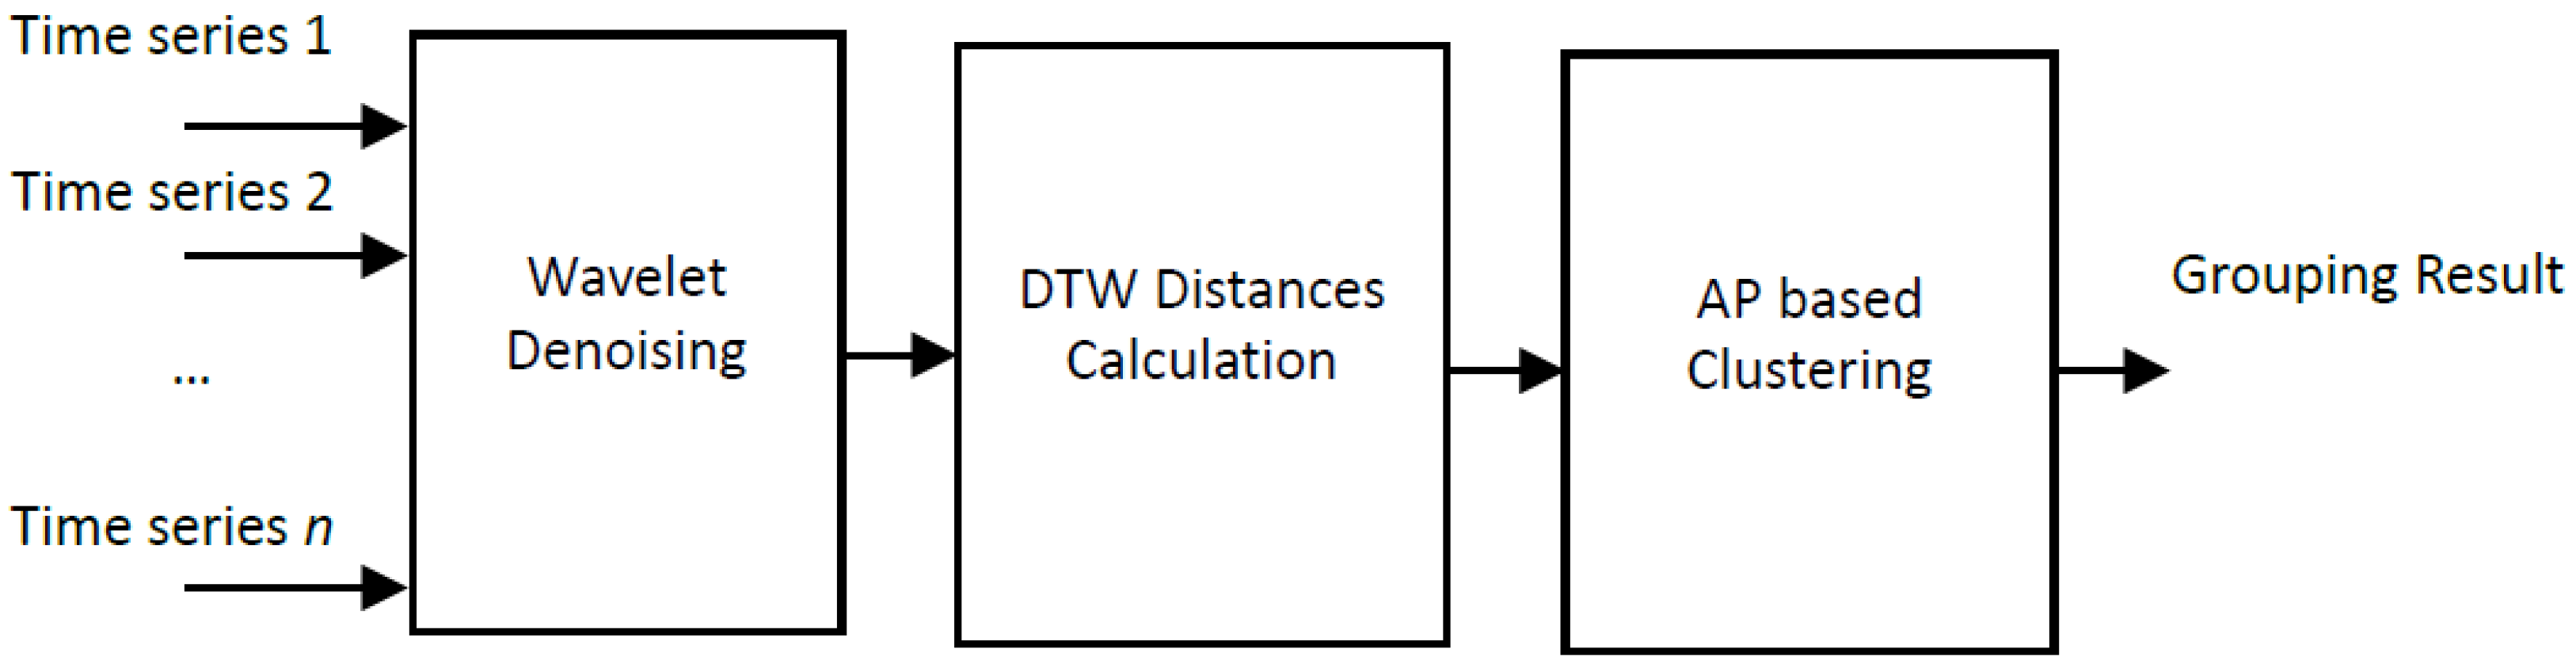
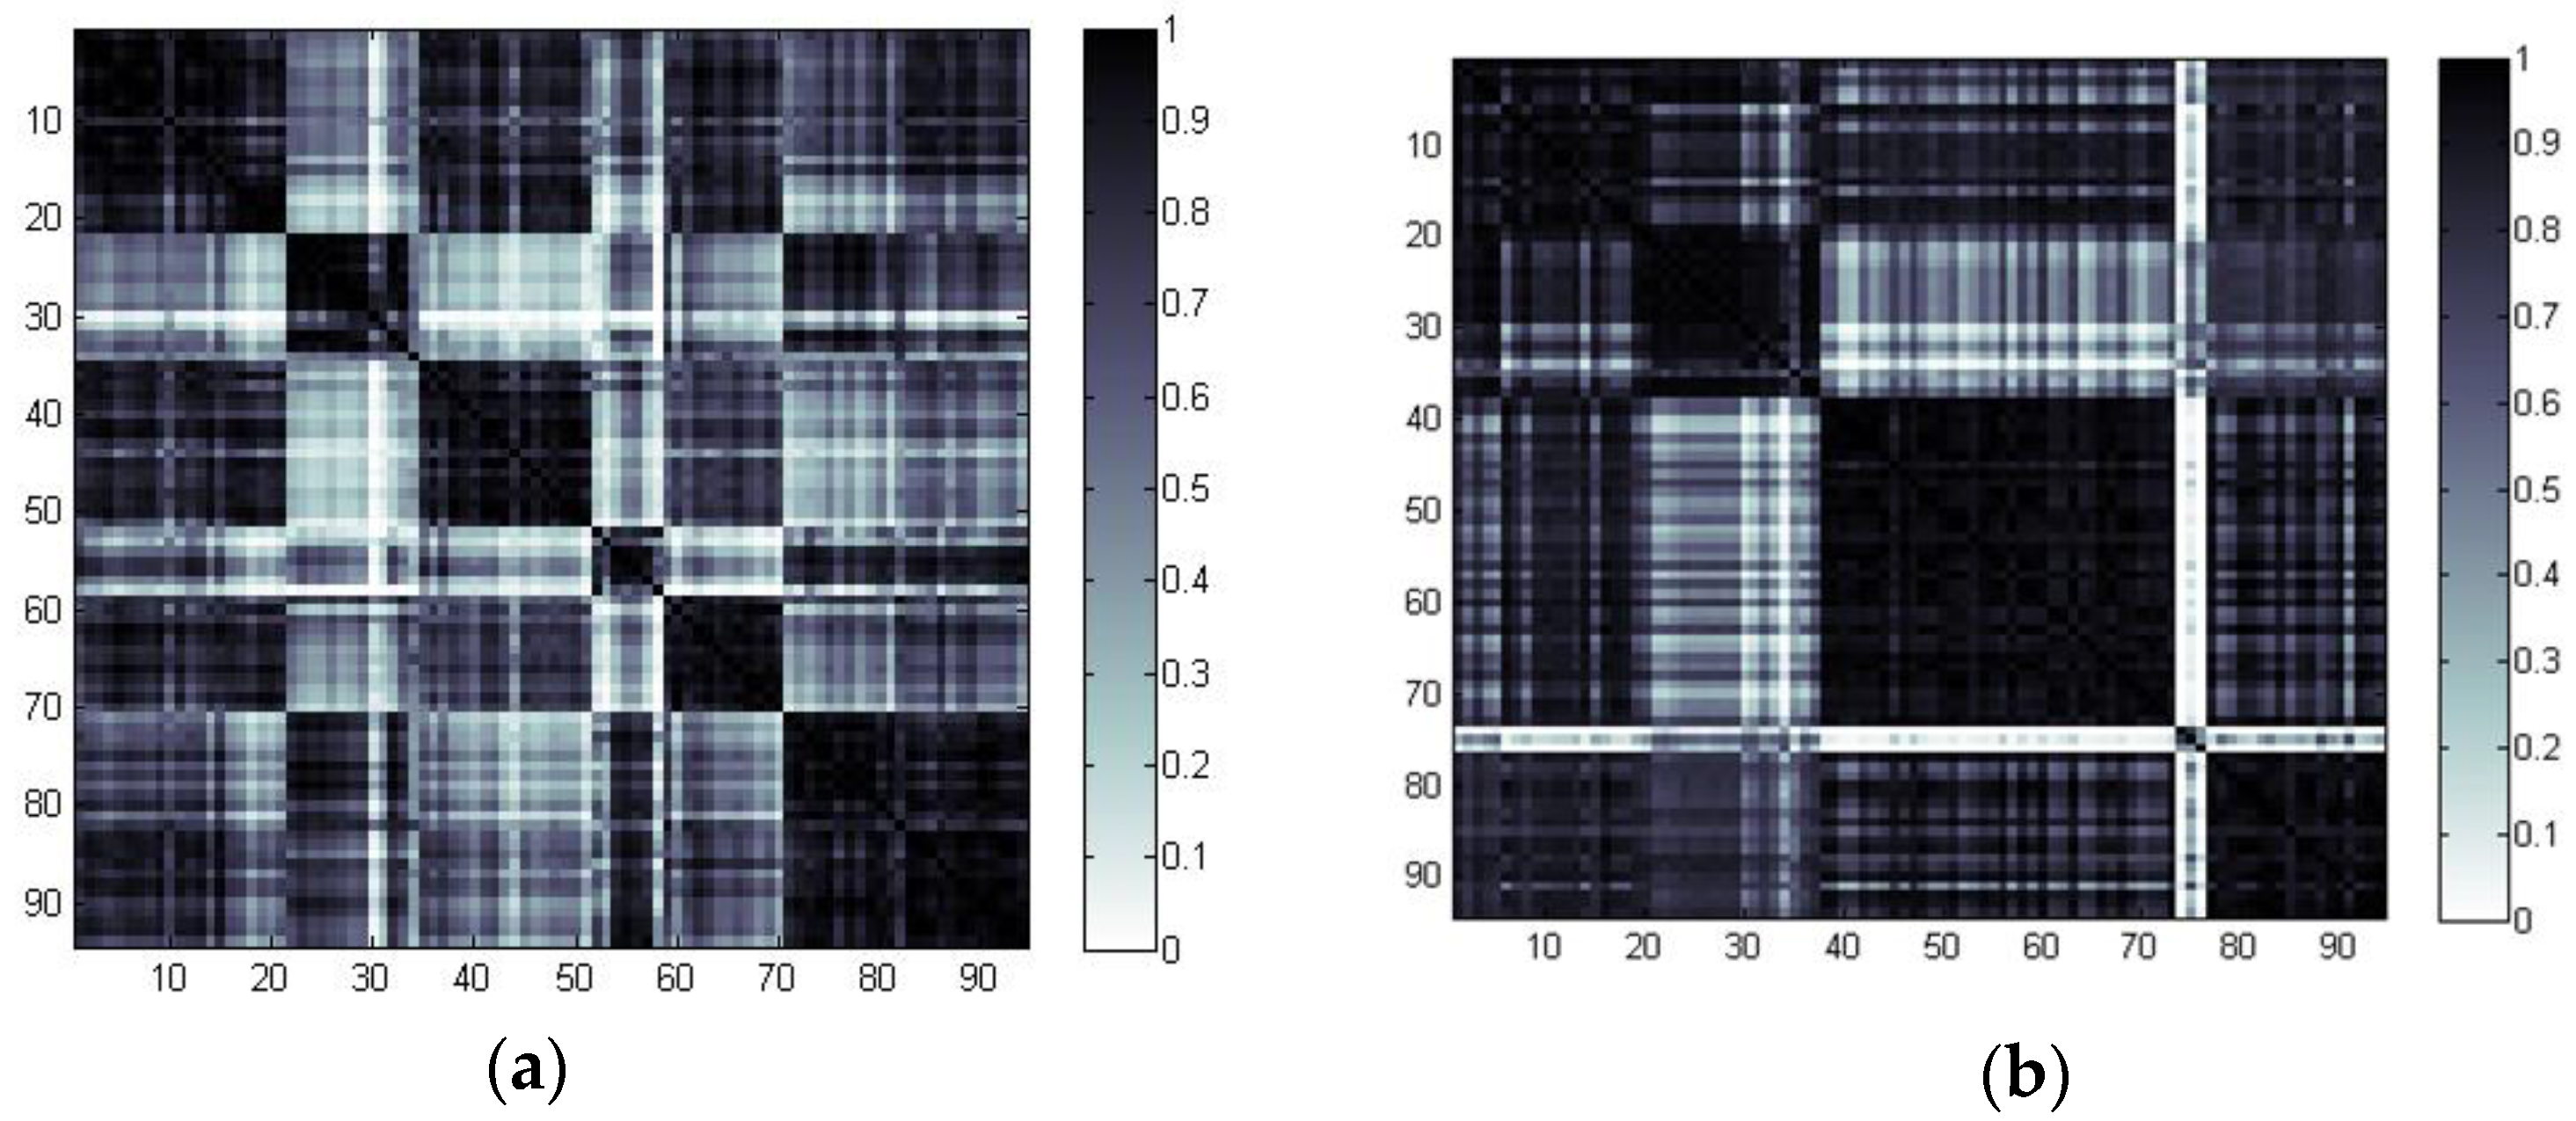
Figure 6 shows a visual display of the clustered similarity matrices when the charge curves are used for battery grouping. As observed from
Figure 6, the clustered similarity matrix for the AP algorithm is much more diagonalized than that of the spectral clustering algorithm. Both
Table 1 and
Figure 6 show better performance with the proposed AP based algorithm.
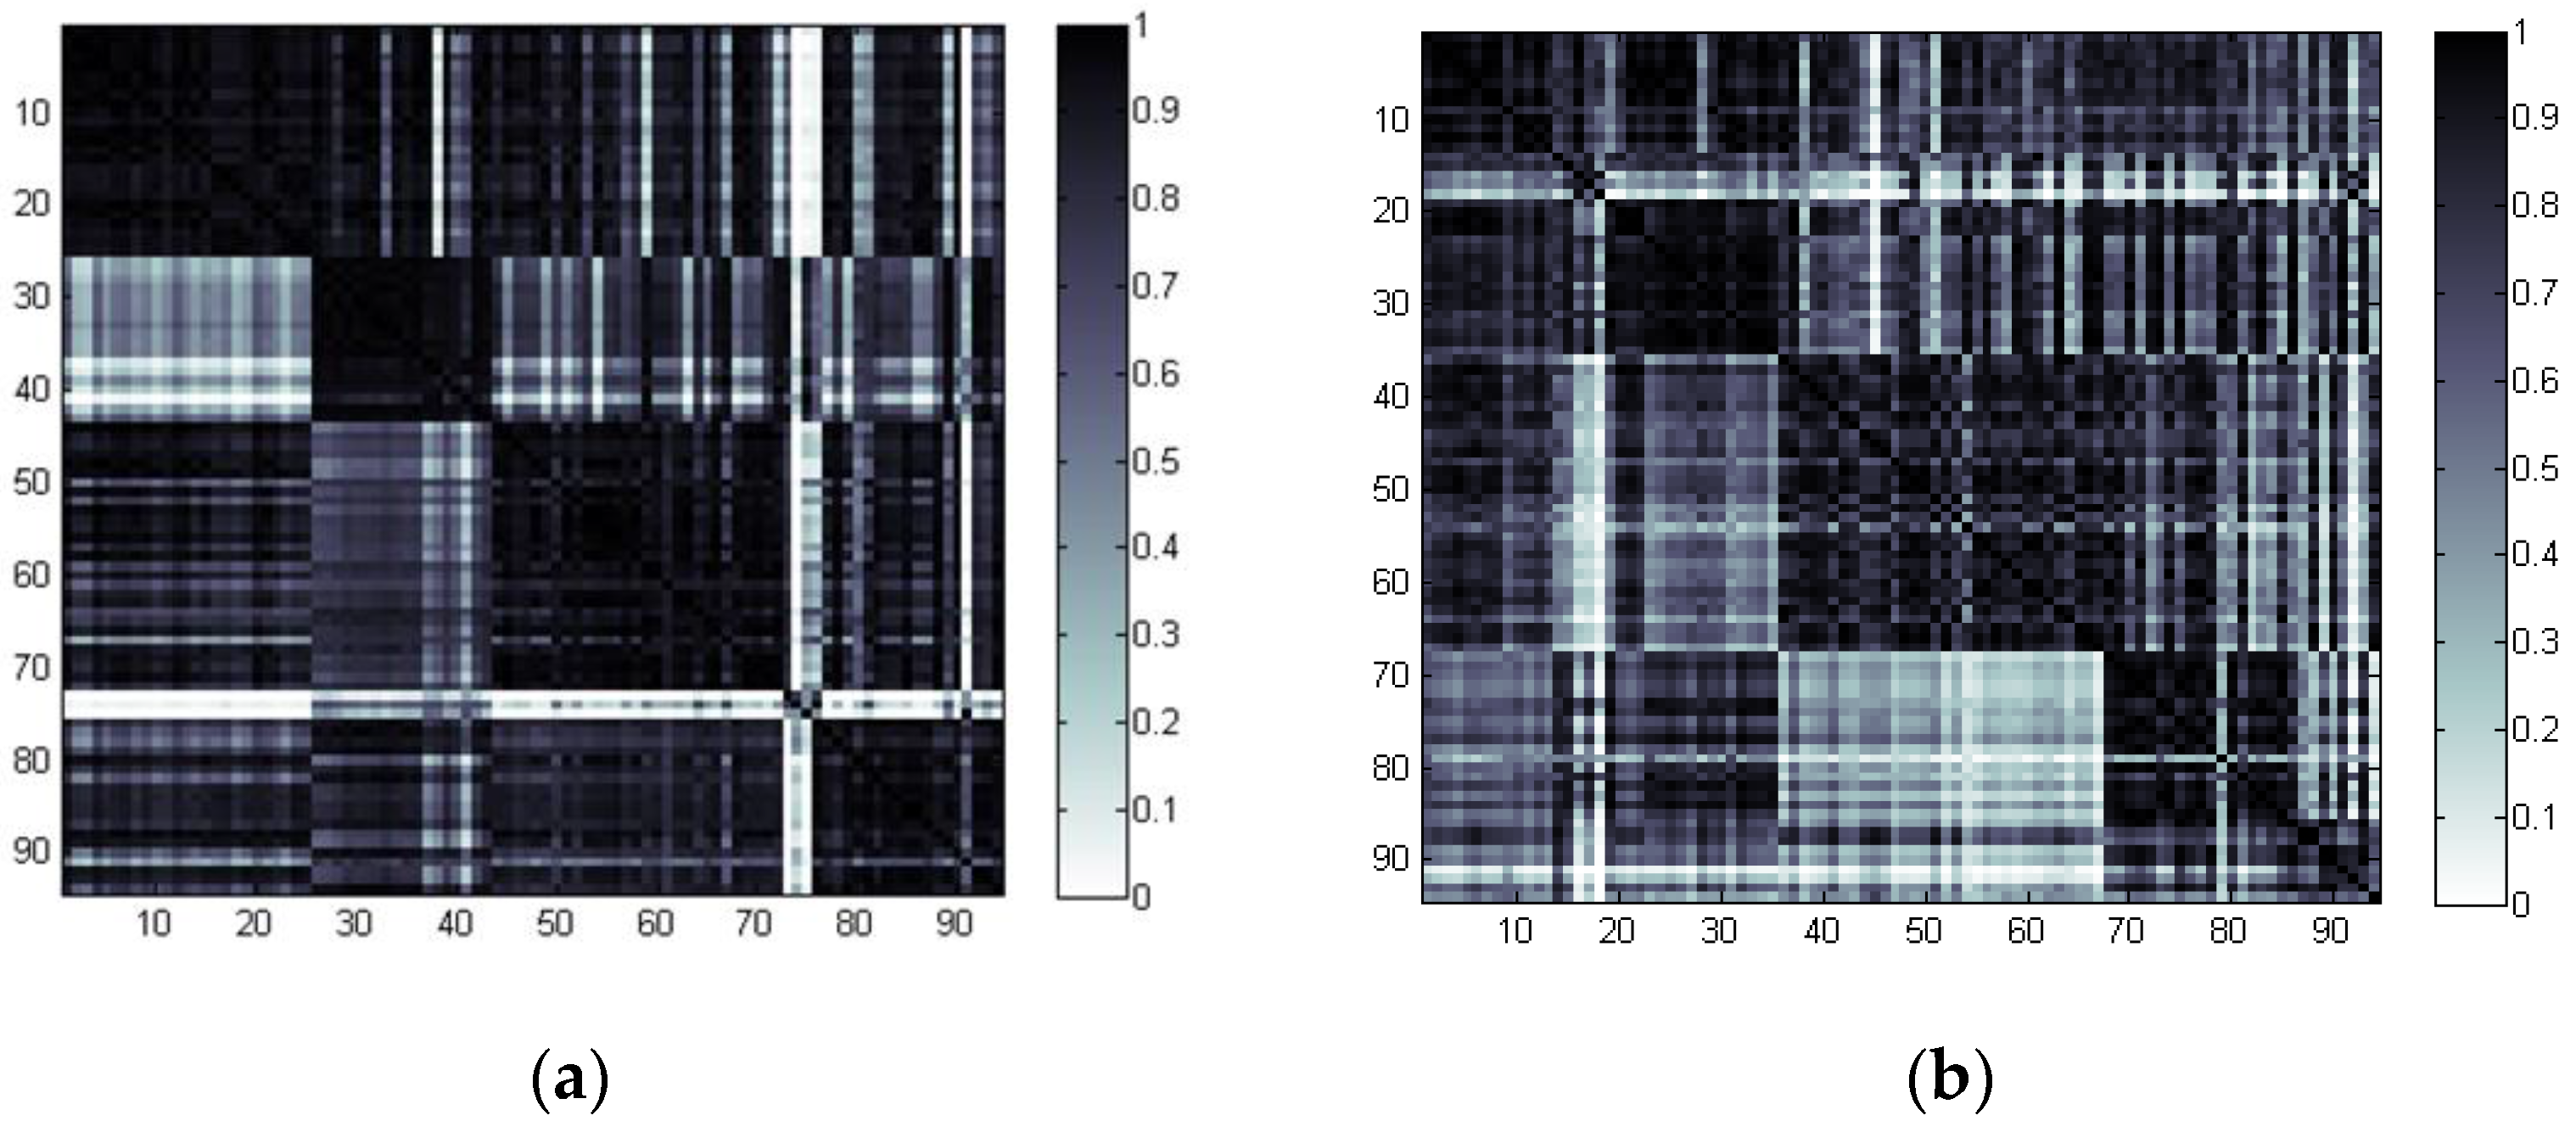
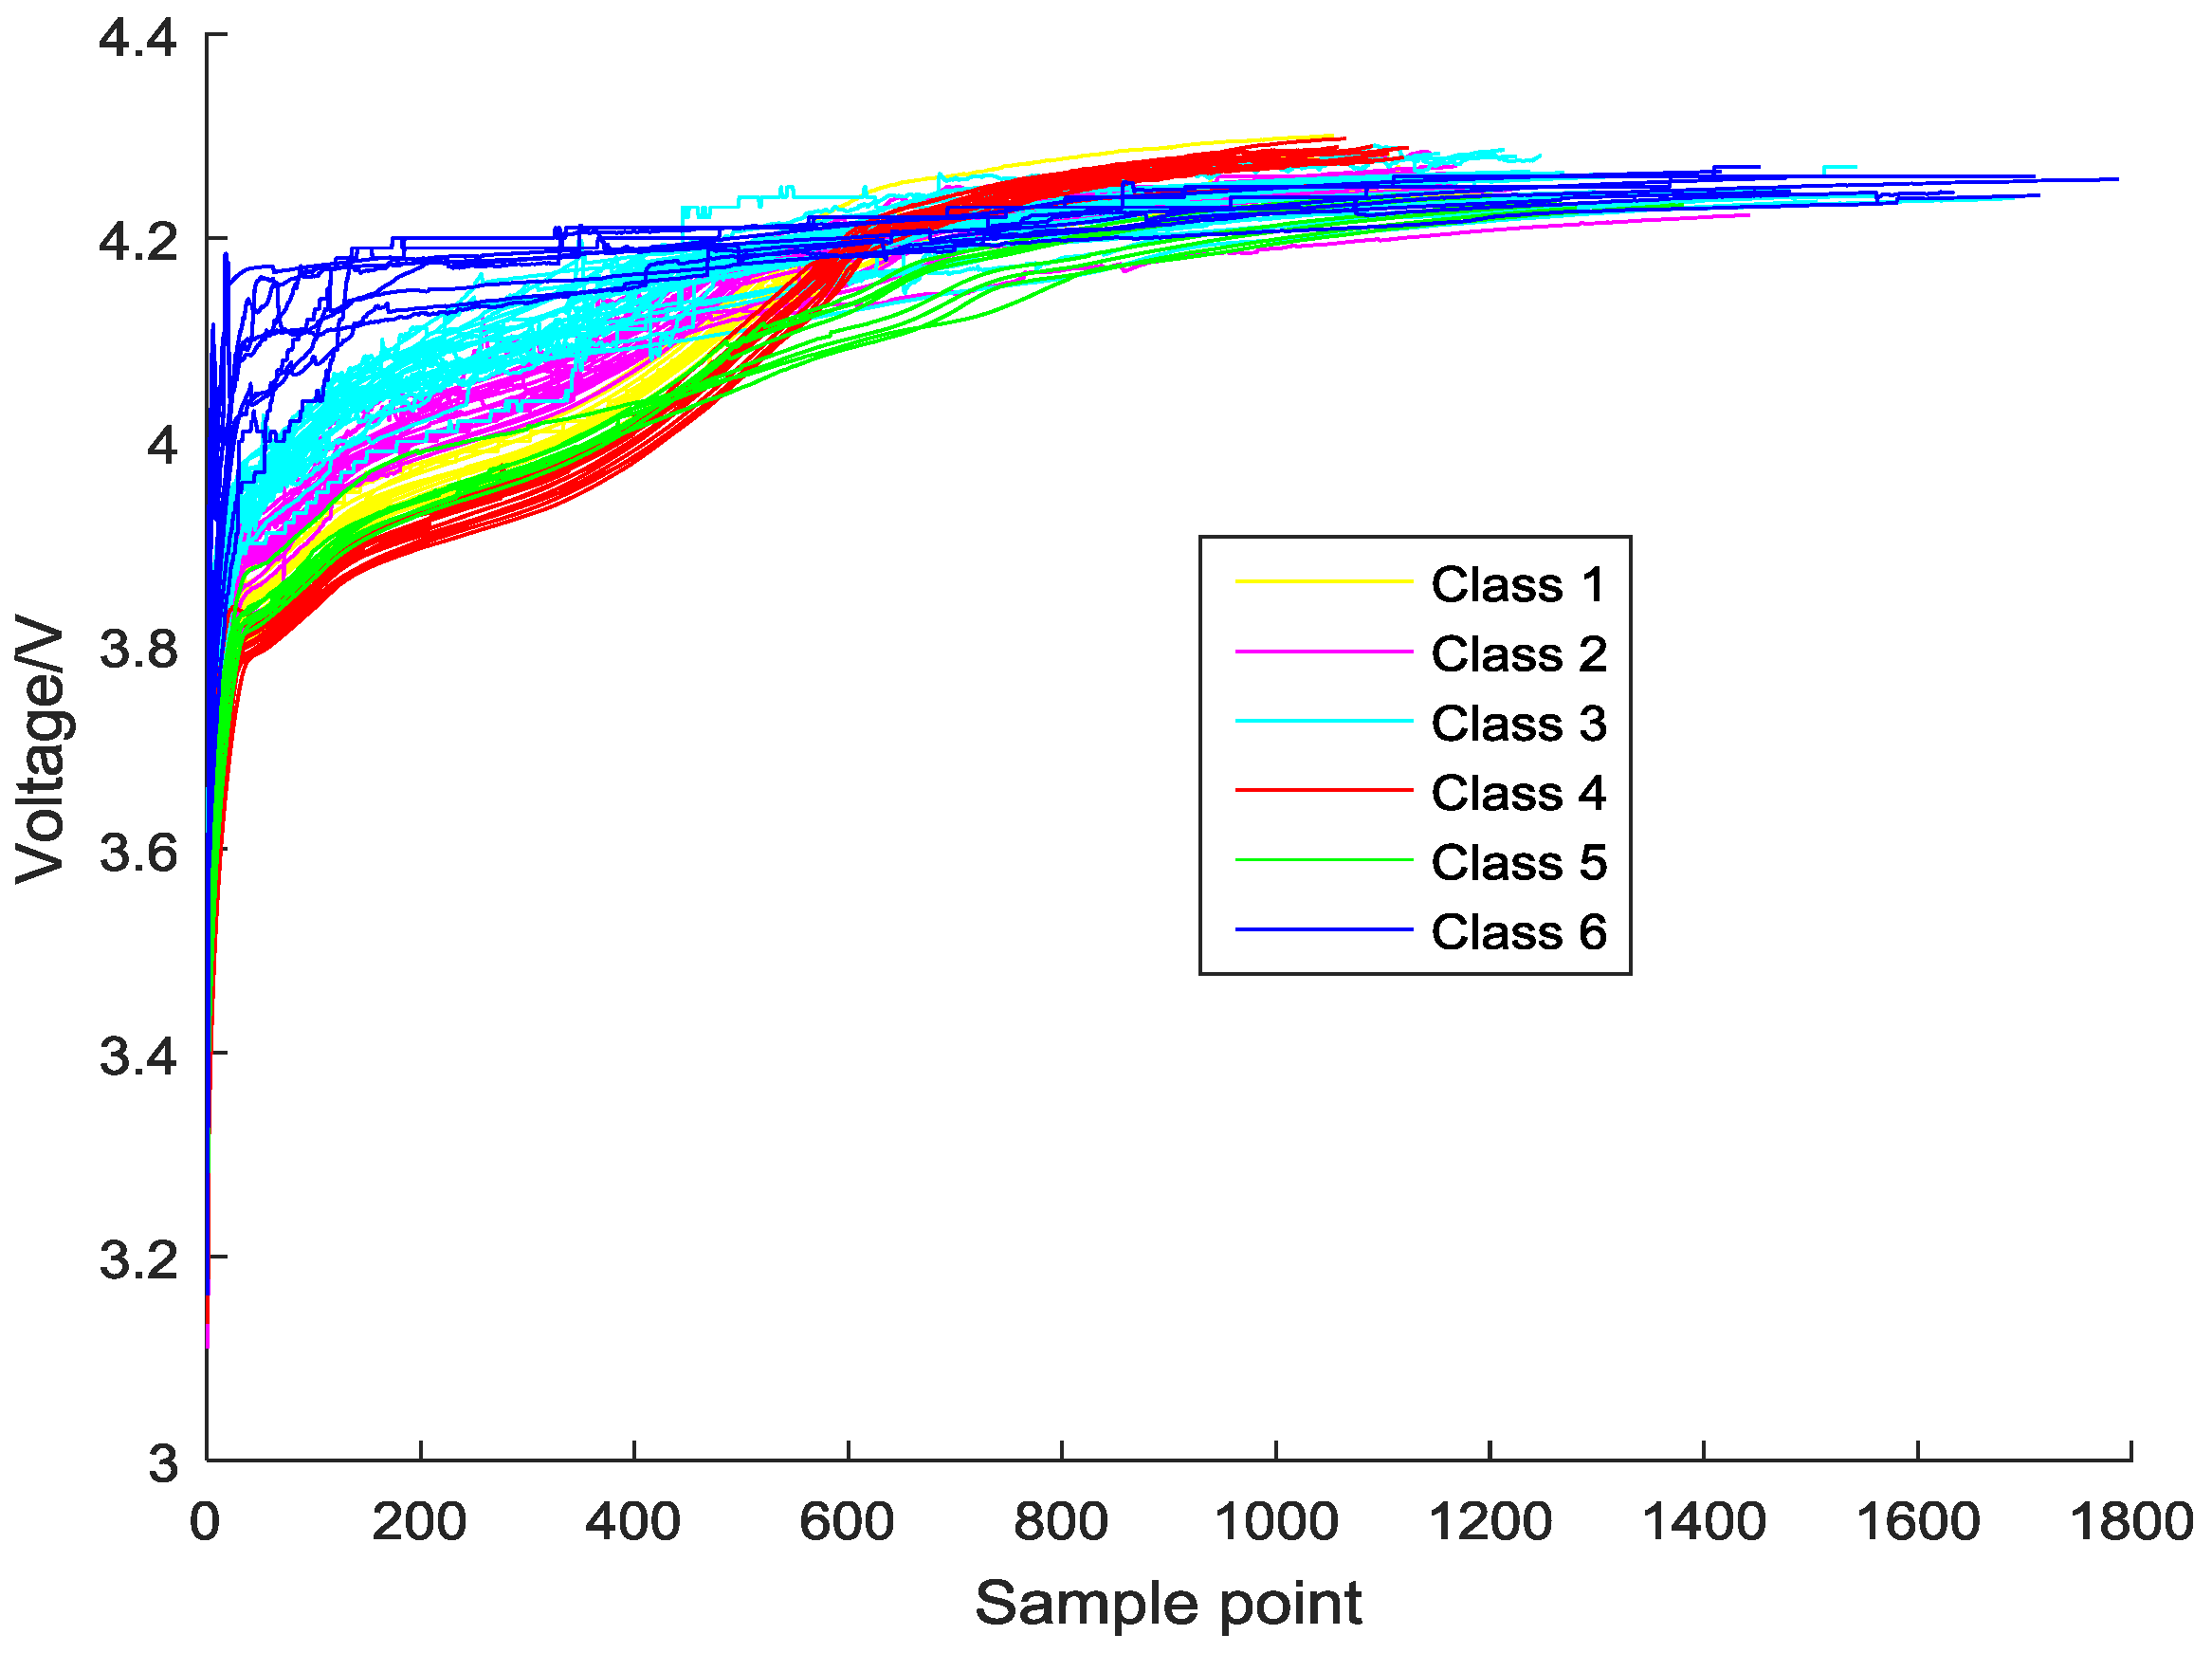
The clustering result for the charge curves based on the proposed AP based algorithm is shown in
Figure 7, which also shows the effectiveness of the proposed algorithm.
The silhouette indexes, according to the different numbers of clusters with different algorithms for the discharge sequences, are given in
Table 2. According to the results in
Table 2, for the discharge curves, the best number of clusters for the AP algorithm is 5, while the best number of clusters for the spectral clustering algorithm is 2. The best silhouette index of the AP algorithm is still larger than that of the spectral clustering algorithm.
Figure 8 shows a visual display of the clustered similarity matrices when the discharge curves are used for battery grouping. As observed from
Figure 8, the clustered similarity matrix for the AP algorithm is much more diagonalized than that of the spectral clustering algorithm. Both
Table 2 and
Figure 8 also show better performance with the proposed AP based algorithm.
The clustering result for the discharge curves based on the proposed AP based algorithm is shown in
Figure 9, which also shows the effectiveness of the proposed algorithm.
In the second experiment, we built two battery packs, both containing four new battery cells. The four battery cells in the first battery pack were chosen from one of the clusters obtained according to the proposed algorithm. The battery cells in the second battery pack had similar discharge cutoff terminal voltages and charge static terminal voltages as utilized by many manufacturers. The two battery packs were then charged and discharged for many cycles under the same condition.
Figure 10 shows the constant charge along with the voltage drop curve [
24] at the 300th cycle for the battery cells in different packs. As observed from the figure, the characteristics of the battery cells in the first pack remain consistent, while the characteristics of battery cells in the second pack are inconsistent. This shows that battery grouping with the whole charge series is superior to that with only two distinct voltage values.


