Article

A Laboratory Study of the Effects of Interbeds on Hydraulic Fracture Propagation in Shale Formation

1
Key Laboratory of Shale Gas and Geoengineering, Institute of Geology and Geophysics, Chinese Academy of Sciences, Beijing 100029, China
2
University of Chinese Academy of Sciences, Beijing 100049, China
*
Author to whom correspondence should be addressed.
Energies 2016, 9(7), 556; https://doi.org/10.3390/en9070556
Submission received: 18 April 2016 / Revised: 24 June 2016 / Accepted: 12 July 2016 / Published: 19 July 2016

Abstract

:
To investigate how the characteristics of interbeds affect hydraulic fracture propagation in the continental shale formation, a series of 300 mm × 300 mm × 300 mm concrete blocks with varying interbeds, based on outcrop observation and core measurement of Chang 7-2 shale formation, were prepared to conduct the hydraulic fracturing experiments. The results reveal that the breakdown pressure increases with the rise of thickness and strength of interbeds under the same in-situ field stress and injection rate. In addition, for the model blocks with thick and high strength interbeds, the hydraulic fracture has difficulty crossing the interbeds and is prone to divert along the bedding faces, and the fracturing effectiveness is not good. However, for the model blocks with thin and low strength interbeds, more long branches are generated along the main fracture, which is beneficial to the formation of the fracture network. What is more, combining the macroscopic descriptions with microscopic observations, the blocks with thinner and lower strength interbeds tend to generate more micro-fractures, and the width of the fractures is relatively larger on the main fracture planes. Based on the experiments, it is indicated that the propagation of hydraulic fractures is strongly influenced by the characteristics of interbeds, and the results are instructive to the understanding and evaluation of the fracability in the continental shale formation.

1. Introduction

Unconventional reservoirs usually exhibit very complex structures with ultra-low permeability and porosity. The fractures formed by fracturing stimulation can provide flow passage for these reservoirs. Therefore, hydraulic fracturing stimulation is one of the key technologies to produce oil and gas in an economical way [1]. Many scholars have undertaken much research on hydraulic fractures through physical experiments, numerical simulations and analytic criteria [2,3,4,5,6,7]. Particularly, conducting physical experiments is not only valuable for validating numerical simulations, but also an efficient way to understand the effects of various factors on fracture propagation. Blanton [2] and Beugelsdijk et al. [3] performed Hydraulic fracturing experiments to study fracture propagation under different stress conditions. Warpinski et al. [8,9] found that the growth and geometry of hydraulic fractures were affected by the stress, joints, faults, interfaces and layer material property. Sarmadivaleh et al. [10] investigated the influences of interface cohesion and approaching angle on the interaction between interfaces and hydraulic fractures. Another important influence factor of fracture propagation is the viscosity of injection fluid which was discussed by Ishida and Inui et al. [11,12] through some comparative experiments. In addition, the relationship between natural fractures and hydraulic fractures has been studied. The scholars from Delft University of Technology used tri-axial test system and acoustic monitoring to study fracture initiation and hydraulic fracture propagation in natural fractures [13,14]. Moreover, the situations of interaction between hydraulic and natural fractures were noted by Beugelsdijk et al. [3], Olson and Bahorich [4,5] and Warpinski [9]: crossing, arresting, offsetting, bypass and diversion. Van Eekelen et al. [15] studied the hydraulic fracture propagation in layered formation and analyzed the fracture arresting effects. Recently, we have learned that in shale hydraulic fracturing, the natural fractures and shale bedding contributed to form complex fractures [16].
Based on the literatures review, the studies above have mainly discussed the influences of different factors such as stress conditions, fracturing fluid and natural fractures et al. on hydraulic fractures. However, the effects of the characteristics of laminae or interbeds in the formation on hydraulic fracture propagation are rarely investigated. In addition, the shales discovered in the Ordos Basin, China, are generally characterized by silty laminae and interbeds, and a mass of natural gas also exists in silty laminae and interbeds [17,18]. At present, the research on this kind of shales is mainly focused on the gas production, physical and chemical properties of the shales with interbeds [19,20,21]. Therefore, it is necessary and significant to study the effects of laminae or interbeds on fracture propagation. In this paper, hydraulic fracturing experiments were conducted, and the induced fractures on surfaces and main fracture planes were observed and analyzed to clarify the effects of thickness and strength of interbeds on hydraulic fracture propagation.

2. Laboratory Experiment Design

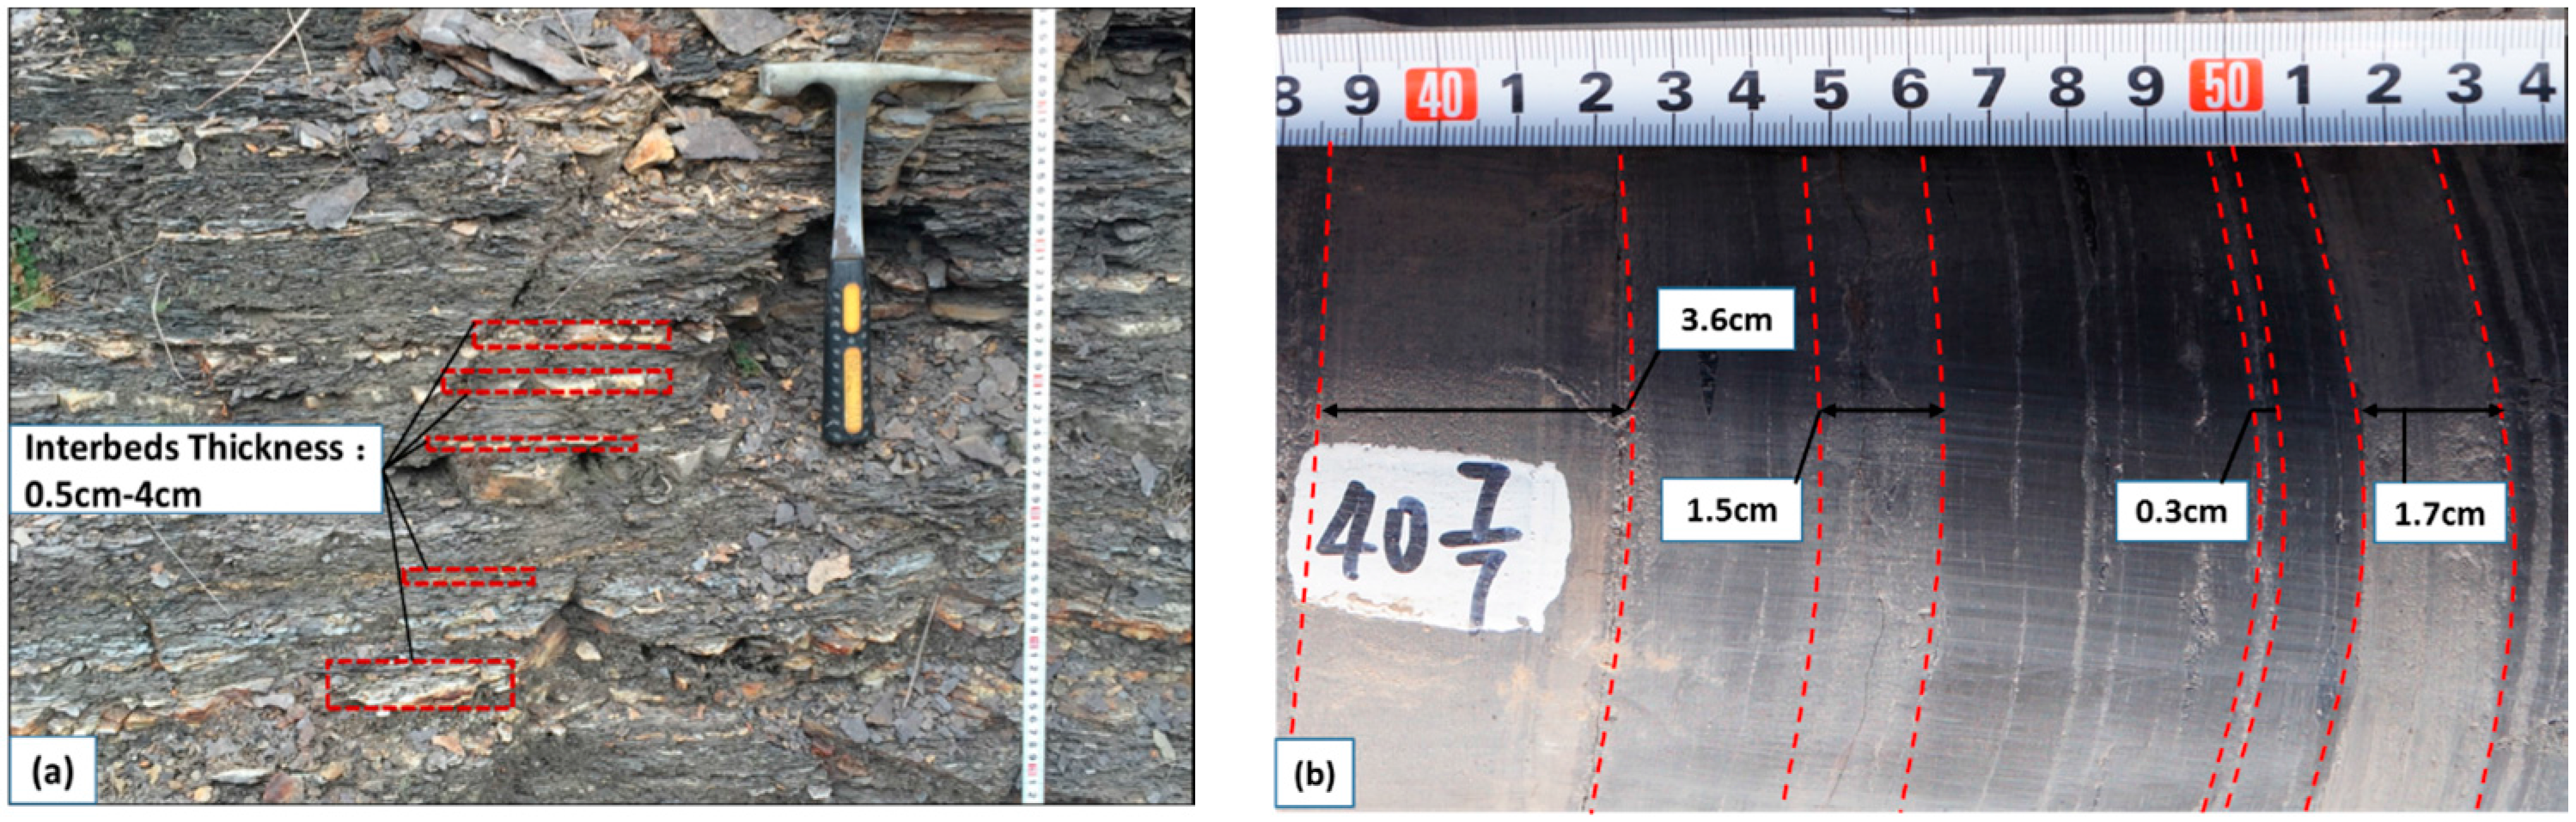
2.1. Basis of Model Block Preparation

The Ordos Basin is a huge basin located in the middle of northern China and rich in hydrocarbon. The basin contains oil and gas reservoir in the Upper Palaeozoic, the Ordovician and Triassic and Jurassic strata [22,23,24]. One of the main formations of the Ordos Basin is called Yanchang Formation, which can be subdivided into 10 members, from Chang 1 to Chang 10 [25]. In the Yanchang Formation, Chang 7, especially Chang 7-2, is an important exploration target for continental shale gas. Scientific research well called JK3 is located in Jin Suoguan, Shanxi province and the southeast of Ordos Basin. The depth of JK3 is about 125 m and the target of coring is Chang 7-2 which is located at 110 m.
The cores of Chang 7-2 obtained from well JK3 are mostly black shales characterized by nearly horizontal laminations and interbedded with sandstone with varying thickness. Similarly, the outcrop observations also show that Chang 7-2 shales are interbedded with varying thickness and are almost broken. According to outcrop and core observations, the thickness of interbeds and laminae are about from 0.1 cm to 4 cm, as shown in the Figure 1.
The outcrop observations of Chang 7-2 shale indicate that continental shales from outcrops are mostly broken and it is difficult to get complete cube shale specimens to conduct hydraulic fracturing experiments, so model block preparation imitates the characteristics of outcrops and cores of Chang 7-2 shale.

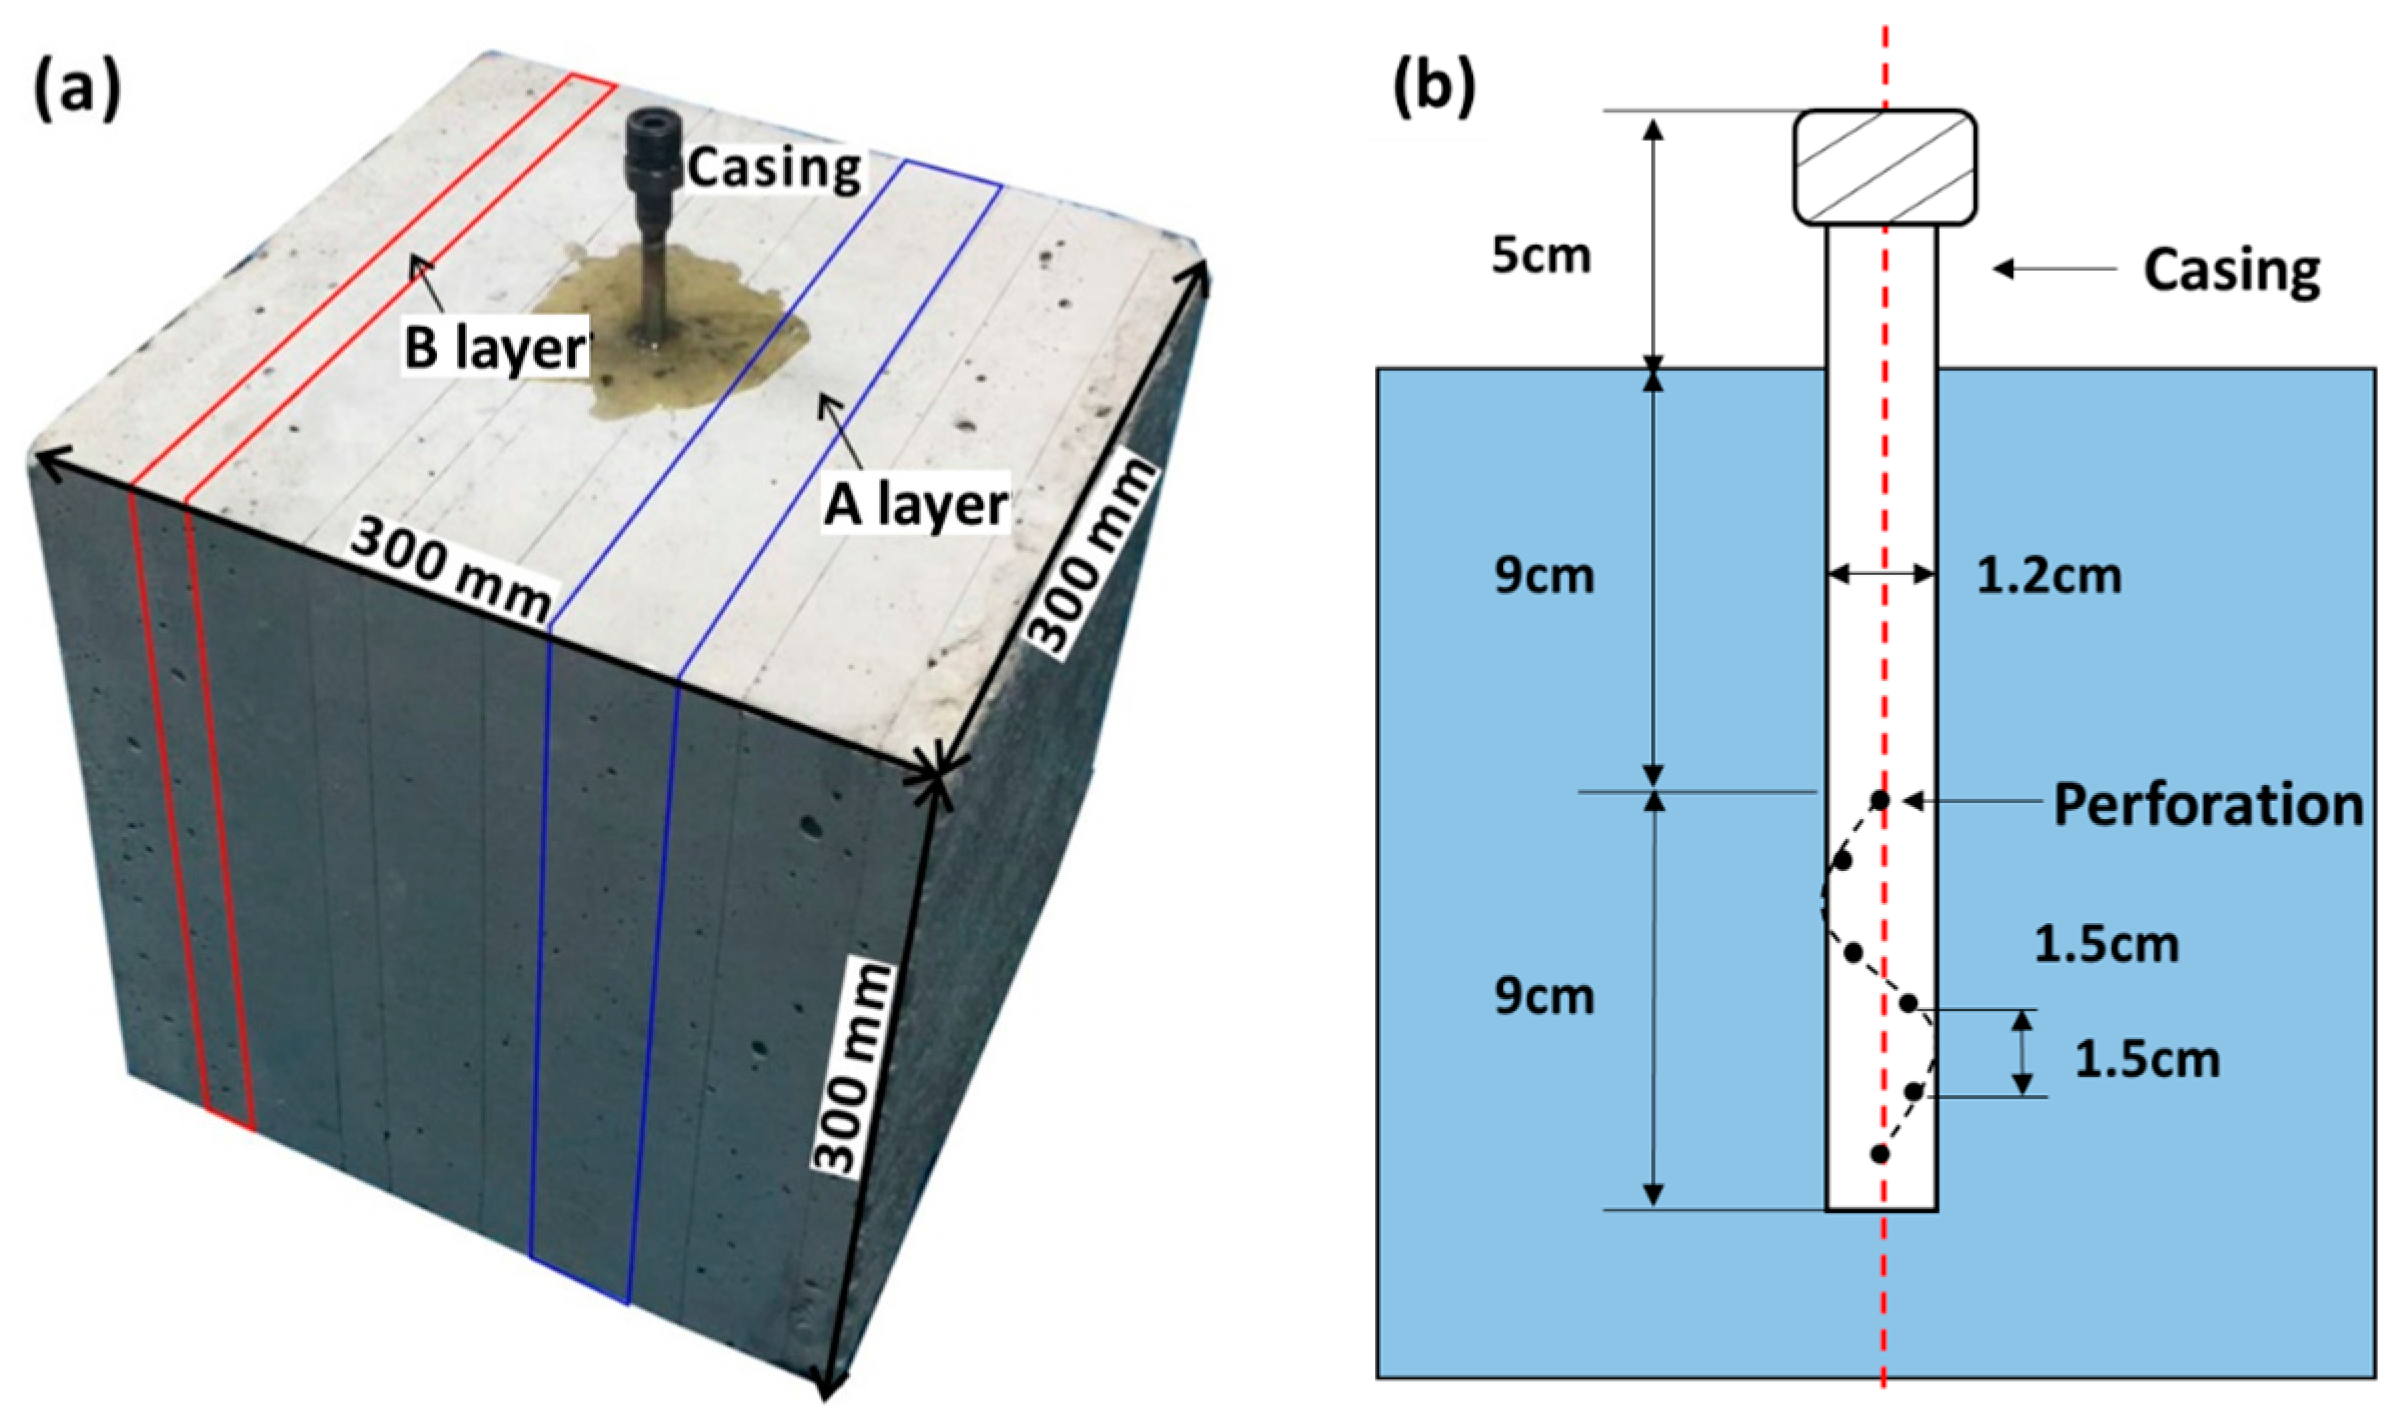
2.2. Model Block Preparation

Hydraulic fracturing experiments using concrete blocks were conducted by some scholars to study the influences of different factors on breakdown pressures and fractures [26,27,28]. Besides, concrete is easily available and simple to cast in different sizes [10]. Therefore, the model blocks for hydraulic fracturing are made from concrete A layers and B layers alternately. A layers stand for shales and B layers for silty interbeds in shales.
To prepare model blocks, the cement and sand were mixed in the different mass ratios shown in Table 1. The cement used in this experiment is No. 425, and the sand corresponds to a 20–40 mesh. To produce a full model block, a concrete A layer was casted first. The next concrete B layer was casted after the former concrete A layer that was initially set. The initial setting time is about 45 min. In this way, five cube model blocks with 300 mm length were made. Then these layered concrete blocks were cured around 28 days under a certain condition (temperature was about 20 °C and humidity was more than 95%). A hole parallel to the concrete layers was drilled in each concrete model block to simulate the wellbore. The diameter and depth of the hole are 1.2 cm and 18 cm, respectively. Afterwards, a special perforated casing was fixed into the hole with glue. A casted layered model block and the enlarged picture of casing are shown in Figure 2. The diameter and length of the casing are 1.2 cm and 23 cm, respectively. The perforation length was 9 cm with six holes which were spirally distributed, and the angle difference was 60°.
The thickness of the A layer is 4 cm and its average uniaxial compressive strength (UCS) is about 33.65 MPa which is close to shale average UCS 31.27 MPa in that area [26]. The thickness and strength of the A layer are constant so as to study the effects of thickness and strength of interbeds on fractures propagation. To make model blocks conveniently in laboratory, the thicknesses of the B layer are 1, 2 and 3 cm, respectively based on the interbeds thicknesses from outcrop and core observations of Chang 7-2. The average strength UCS of the B layer are 26.01, 22.17 and 13.78 MPa, respectively by changing the mass ratio of cement, sand and water (C:S:W). The specific parameters of the concrete matrix and bedding face are shown in Table 1 and Table 2, respectively.

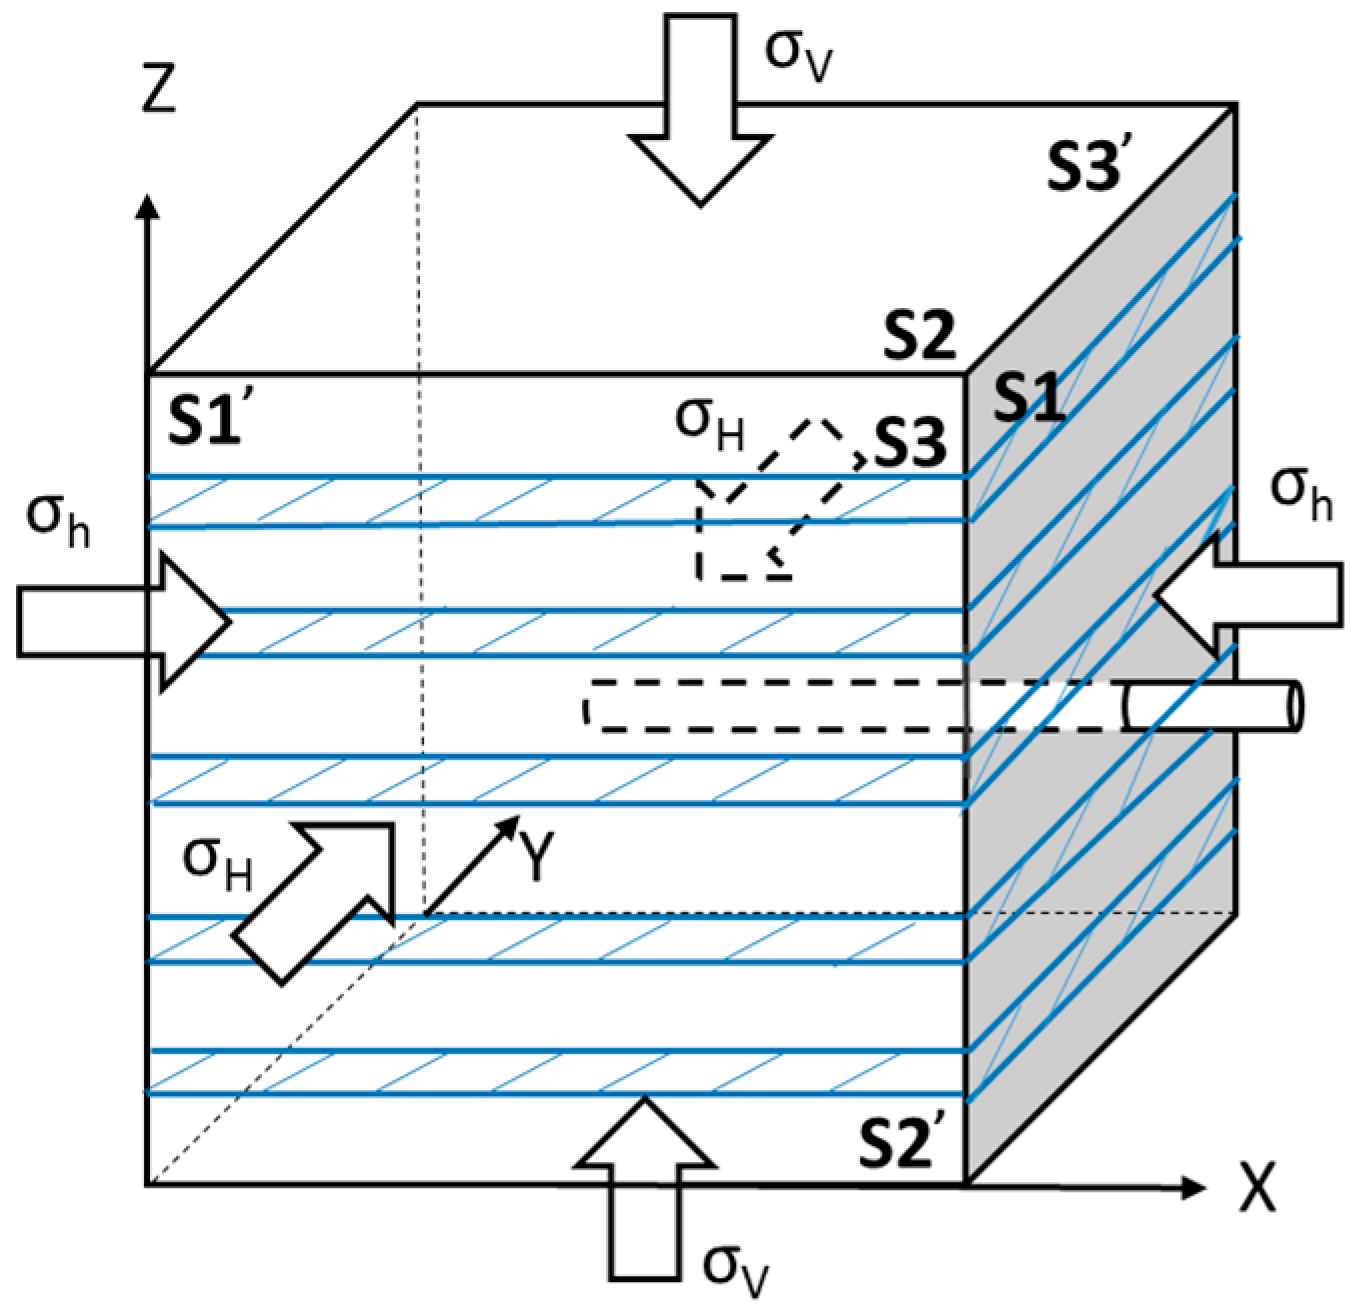
2.3. Experimental Setup

The Rock true tri-axial hydraulic fracturing test system built by Institute of Geology and Geophysics, Chinese Academy of Sciences was used to conduct hydraulic fracturing experiments. The test system that is controlled by the hydraulic servo system is mainly composed of loading system, pump system, measurement and control system. The stresses of three directions are 0–3000 kN and the pump pressure is 0–65 MPa, which meets the demand of experiments. Flow-time curve, pump pressure-time curve, and pump pressure-flow curve are real-time output to monitor the process of experiments.

2.4. Experiment Conditions

Hydraulic fracturing experiments need to simulate the formation conditions, and one of the significant factors is formation stress. The stresses applied to the concrete model block is shown in the Figure 3.
According to the geological conditions, the vertical stress was 2.9 MPa, which was perpendicular to concrete layers on the surfaces S2 and S2’, and was close to the shale formation in-situ field stress of Chang 7-2 shales at 110 m in well JK3 [29]. The effect of horizontal stress difference on hydraulic fractures was not discussed, so horizontal stress difference was kept constant at 1.1 MPa during the experiments. The maximum horizontal stress was on the surfaces S3, S3’ and the minimum horizontal stress was on the surfaces S1, S1’, and both of them were parallel to concrete layers.
In order to consider a hydraulic fracture field test being simulated in laboratory scale, scaling laws are to be applied to scale the fracturing fluid parameters. In the past, scaling laws for performing proper hydraulic fracture experiments were derived [30,31,32]. These laws scale the experiments in terms of energy rates associated with fluid flow, fracture opening and rock separation.
The fluid viscosity is one of the most significant factors that affects the field-scale hydraulic fractures over their propagation history [10]. So, in view of the low injection rate in the laboratory, it is necessary to use highly viscous fluids, and when using low viscous fluids, we should set a high injection rate. Therefore, water with red ink was used as fracturing fluid so that fractures induced by the hydraulic fracturing were visualized and fracture propagation was better tracked, and the flow rate was kept constant at 50 mL/min. Table 3 shows the specific experiment conditions.

3. Experimental Results and Analysis

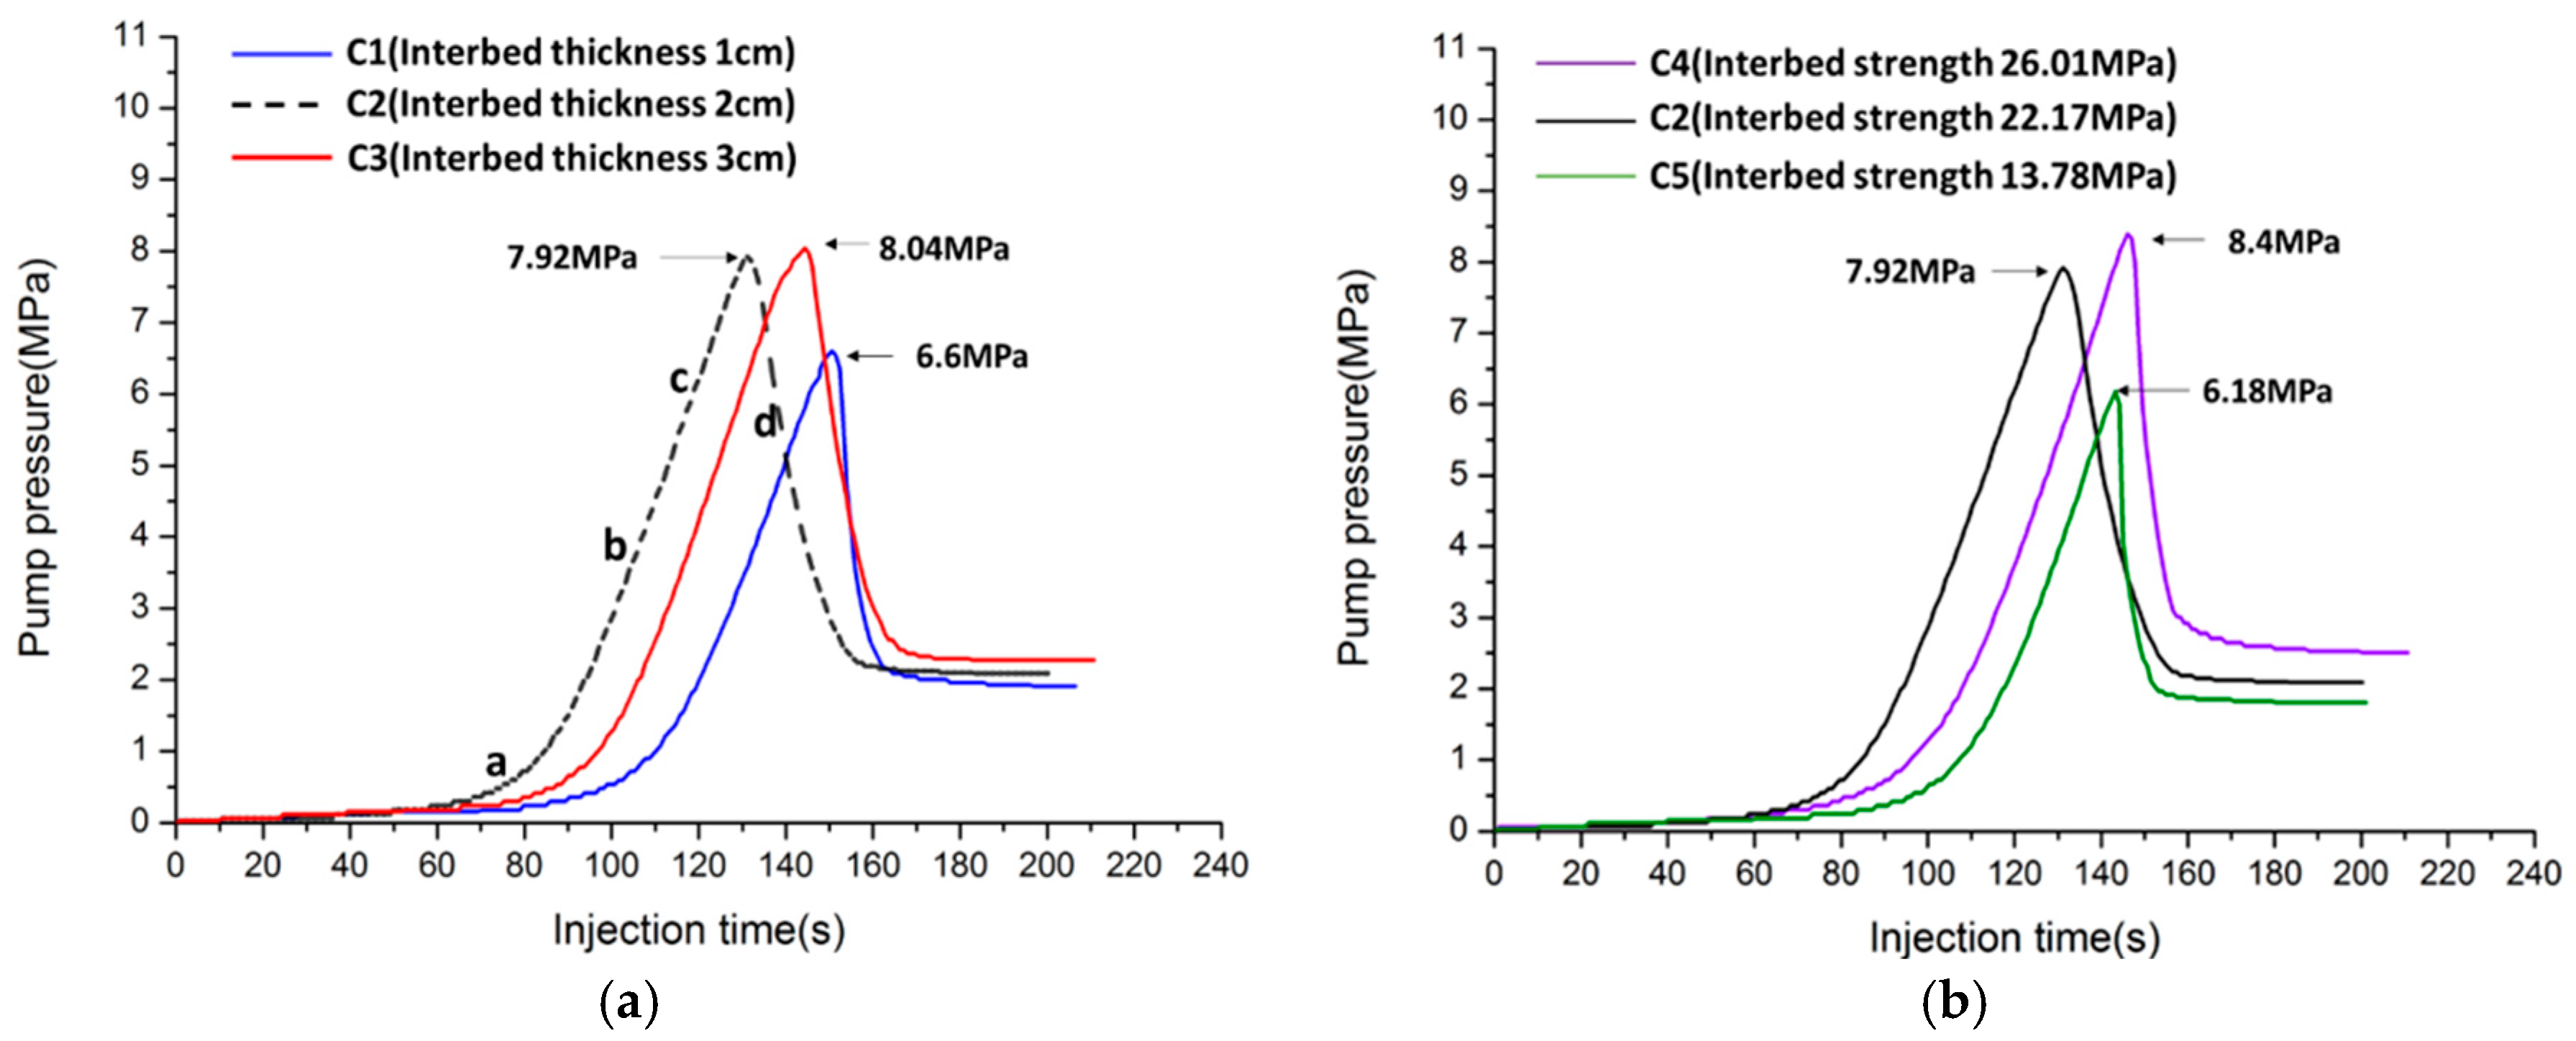
3.1. Pump Pressure-Injection Time Curve

The pump pressure-injection time curves of the five model blocks were recorded during hydraulic fracturing experiments, as shown in Figure 4. Taking C2 as an example, the curve mainly consists of four processes:
(a)
the fracturing fluid is injected and pumped;
(b)
the pump pressure increases and initial fractures generate;
(c)
the pumping pressure continues to increase and fractures propagate, until the pressure rises to the highest point; and
(d)
fractures extend within the model block and fracturing fluid filtrates into fractures, then pressure drops.
The breakdown pressure of each model block was obtained by measurement and control system and recorded by the pump pressure-injection time curve. Under the same condition of the strength of the B interbed, the breakdown pressure increases as the interbed thickness increases. Under the same condition of the thickness of the B interbed, the breakdown pressure has the same trend that it increases as the interbed strength increases.
The reasons for the experimental phenomena are that hydraulic fractures require more energy to cross the thicker interbeds compared with the thinner interbeds, so higher force is needed. Moreover, obviously, the strength of interbeds increases so that higher force is required to break the block under the same conditions.

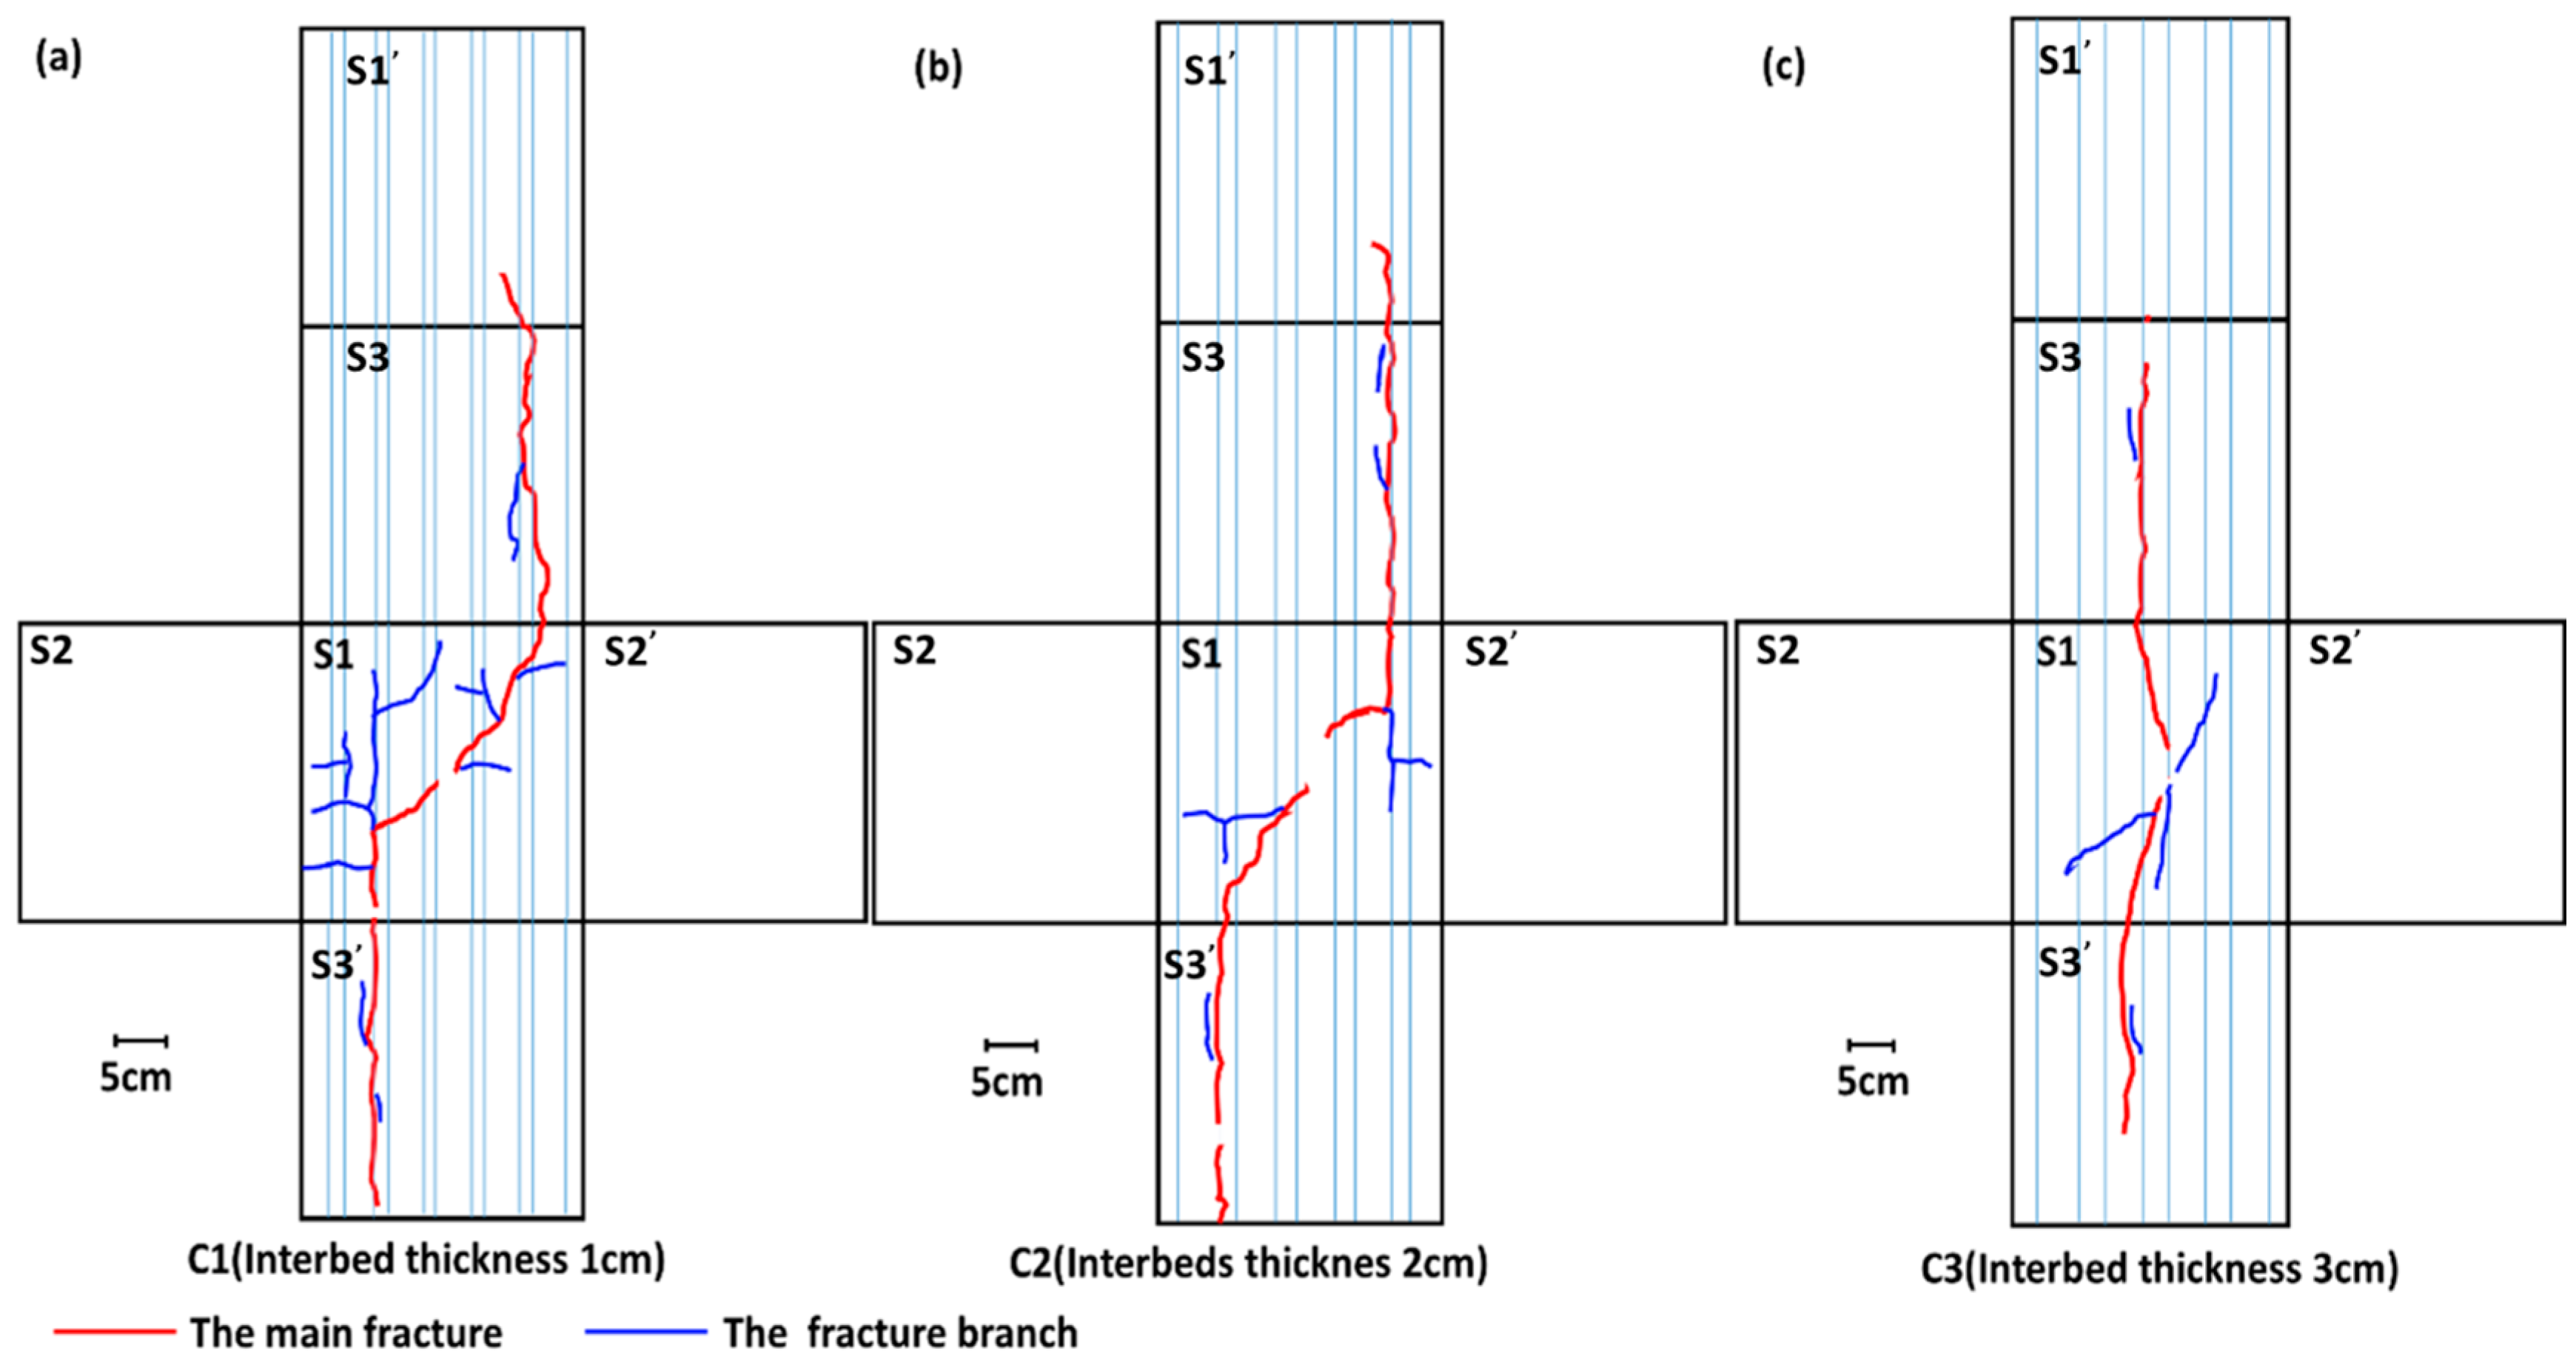
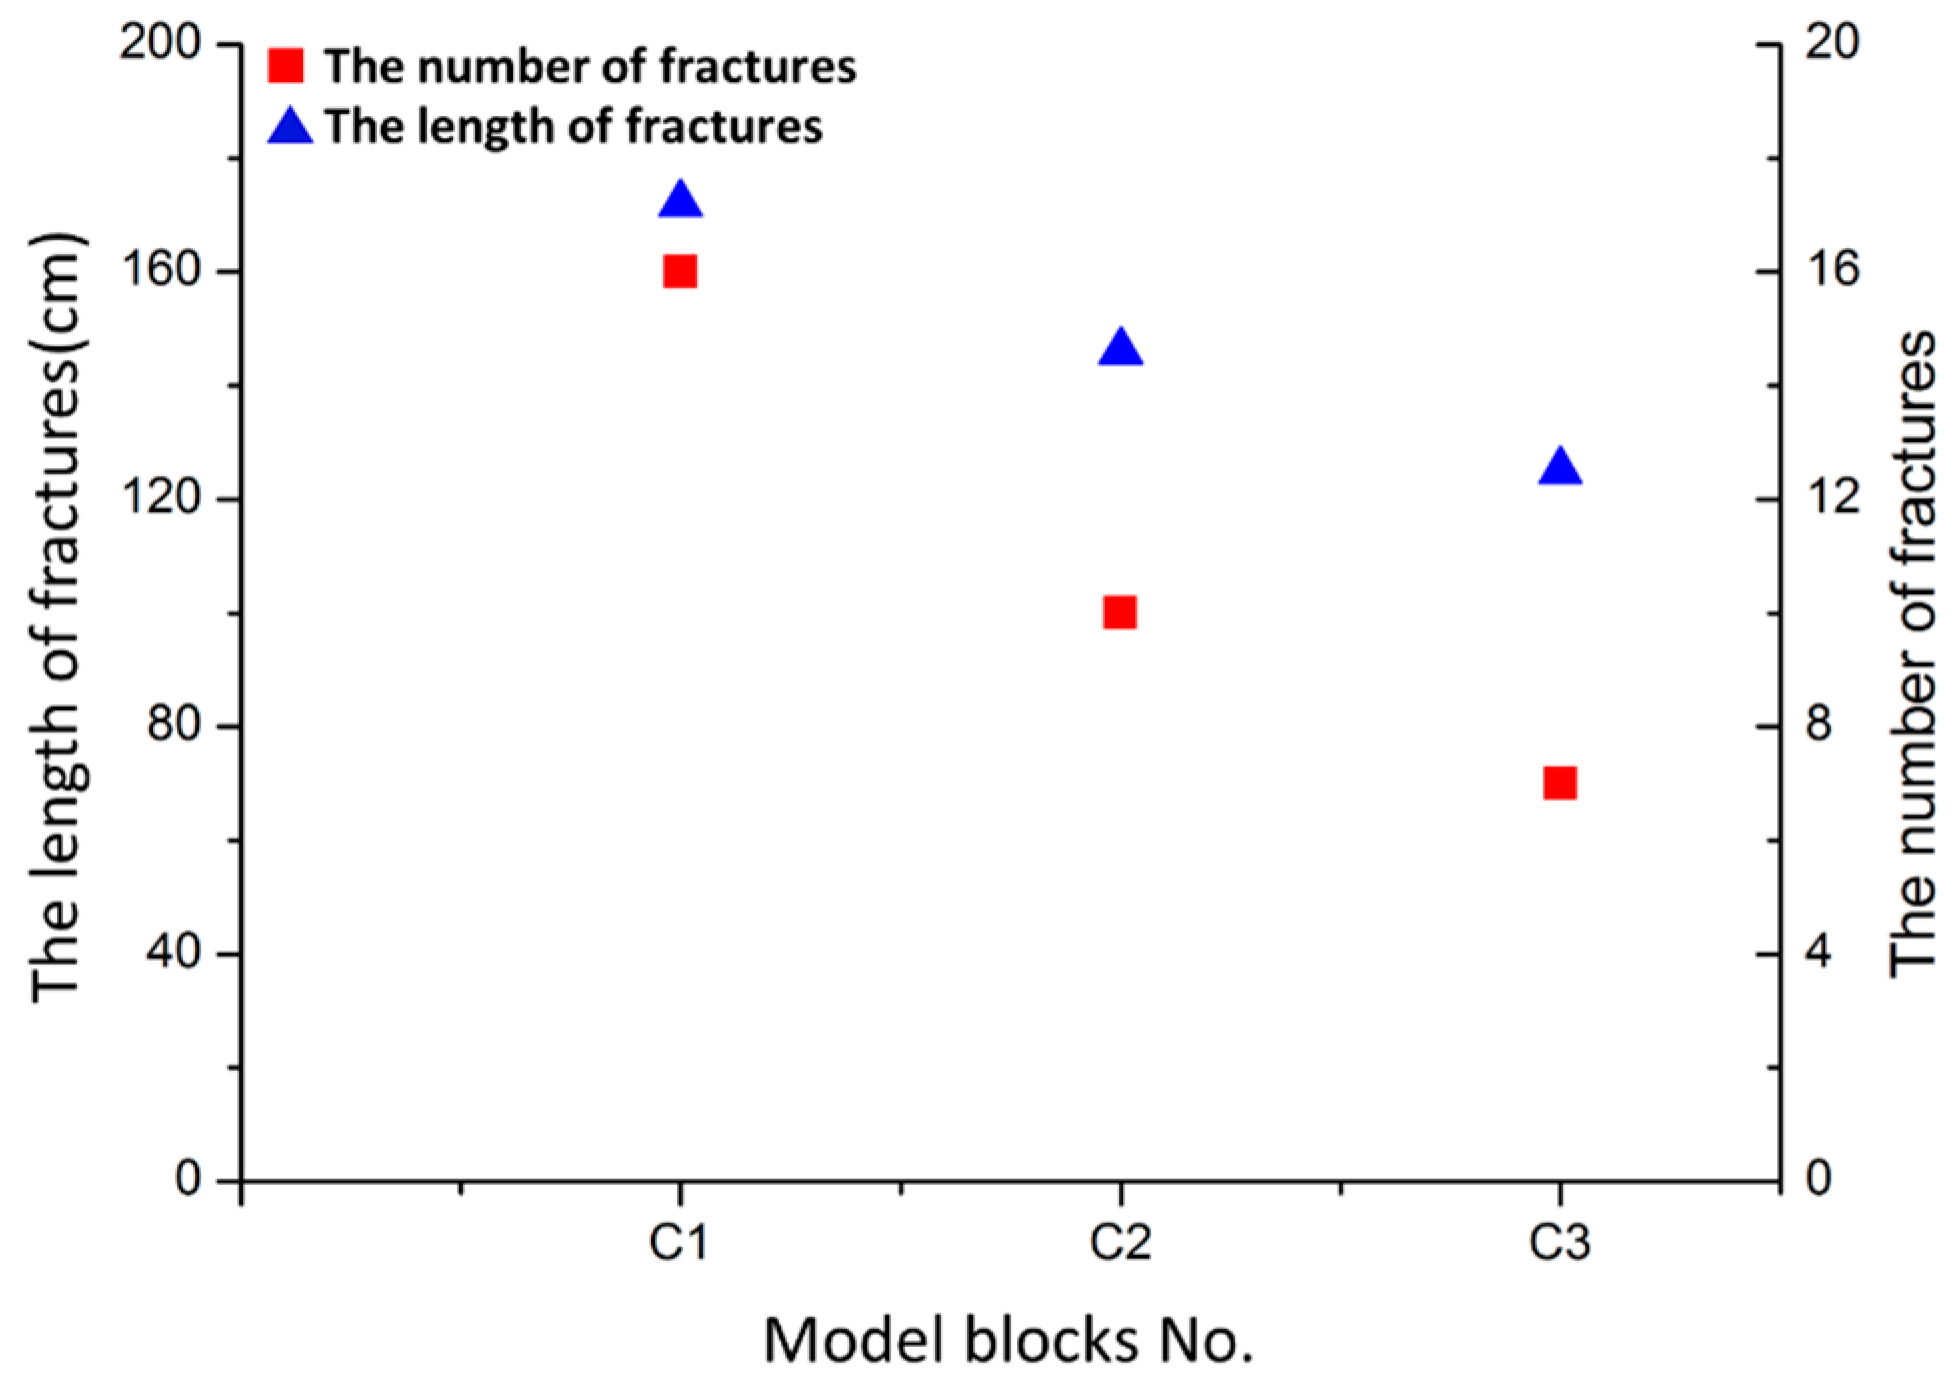
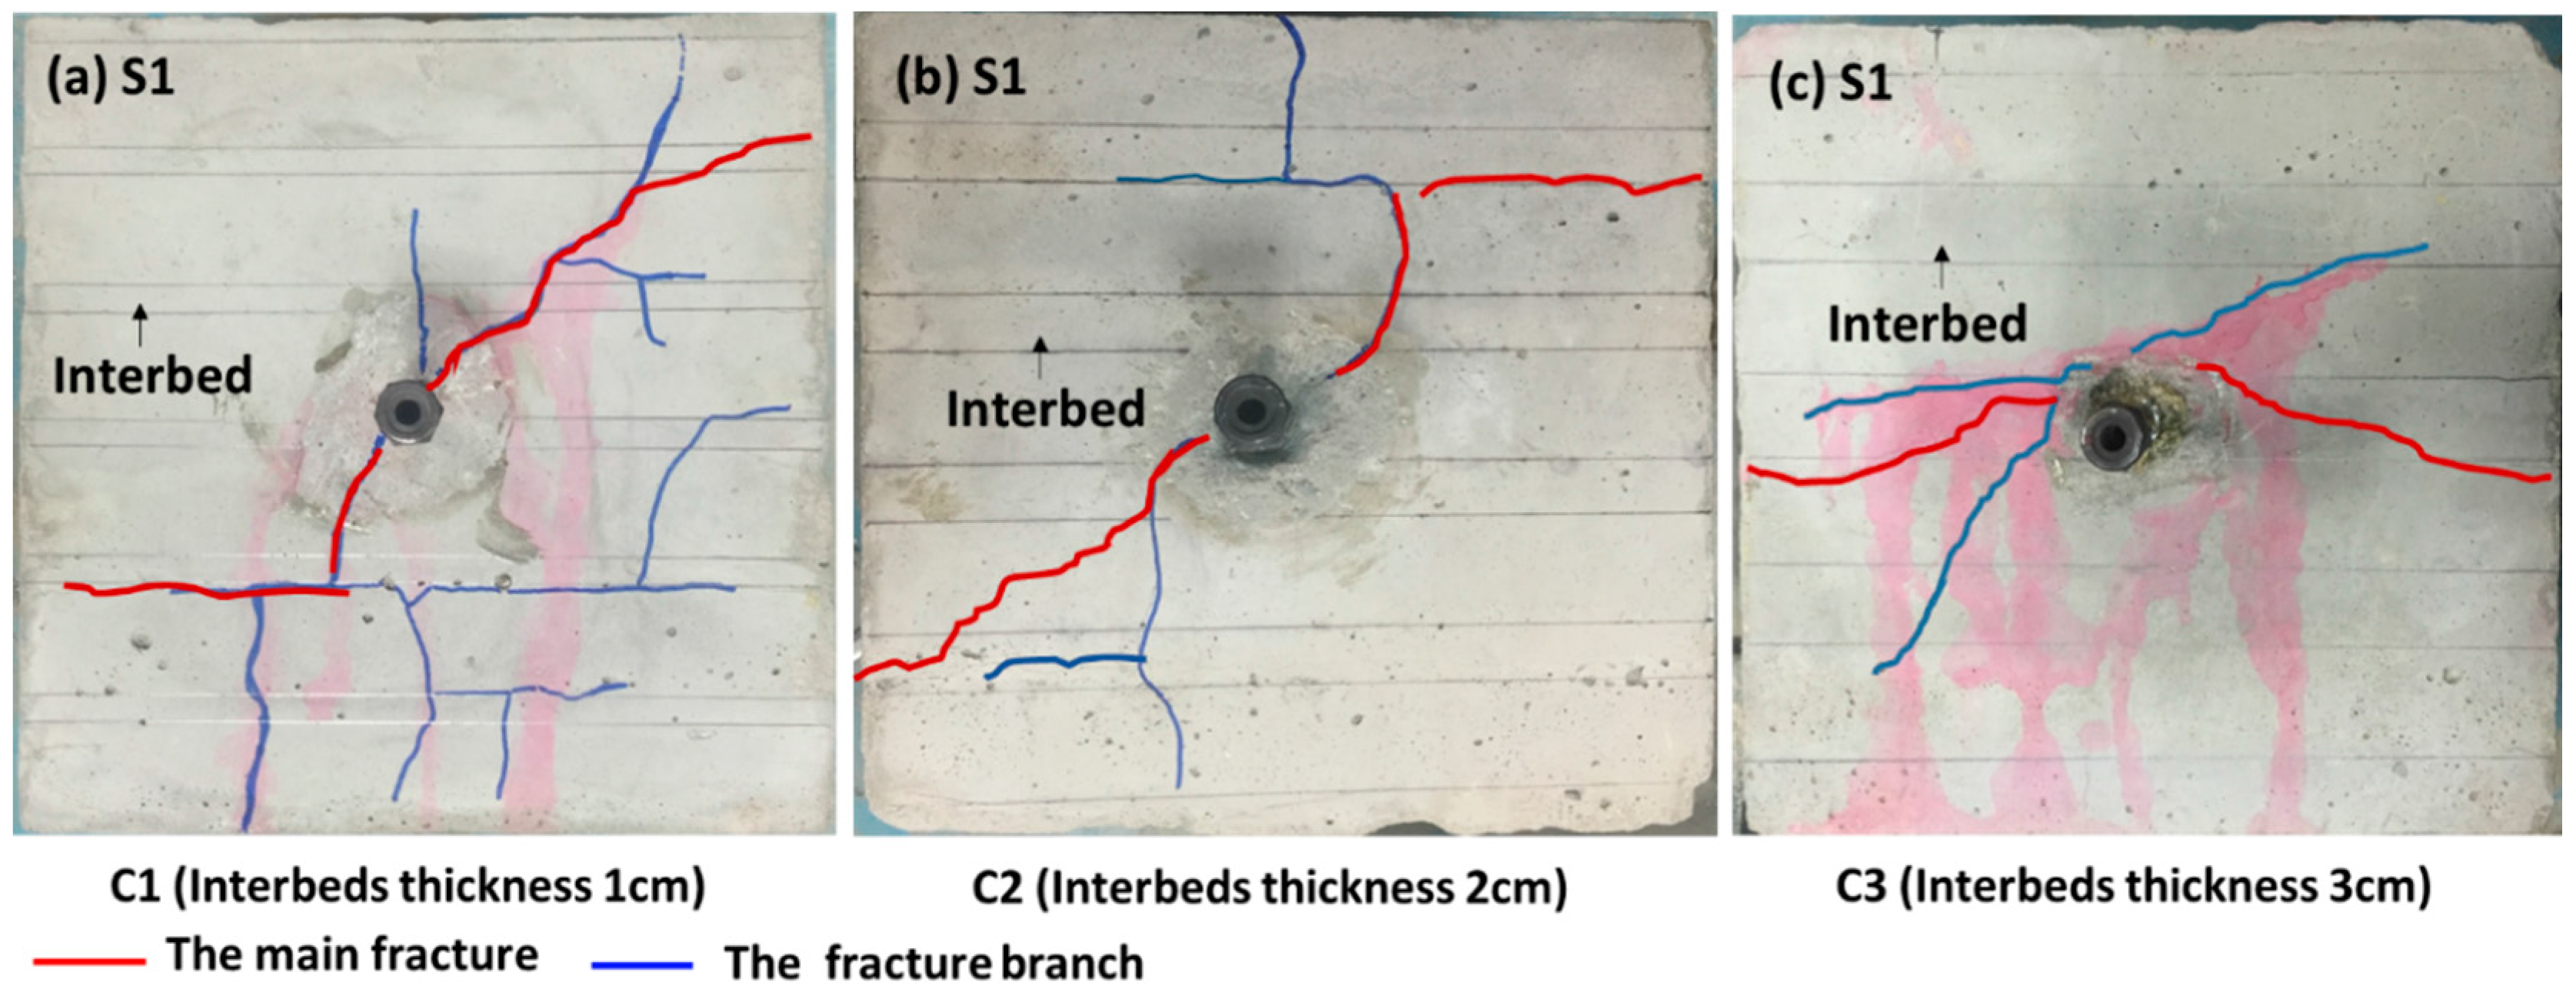
3.2. Effects of the Thickness of Interbeds on Fracture Propagation

To analyze the effects of the thickness of interbeds on hydraulic fracture propagation, the induced fractures on the surfaces of the model blocks C1, C2 and C3 with the same strength of interbeds were observed and sketched by naked eyes after hydraulic fracturing experiments. The interbed thickness of C1, C2 and C3 is 1 cm, 2 cm and 3 cm, respectively. Two parameters, the length of fractures and the number of fractures, were used so as to study the fractures better.
Figure 5 shows the hydraulic fractures on the surface S1 of the model blocks C1, C2 and C3. The red fractures are main fractures and the blue fractures are fracture branches. When the thickness of the B interbeds was 1 cm or 2 cm, the main fracture crossed the interbeds first, then it turned to the bedding face, propagating and breaking along the bedding face. However, when the thickness of the B interbeds was 3 cm, the main fracture propagated and broke mostly along the A layer, the B interbed and the bedding face around the drill hole.
Beugelsdijk and Sarmadivaleh [3,6] pointed out the main four situations of interaction between hydraulic fractures and natural interface which were crossing, arresting, opening and offsetting. Besides, it is well known that weak interfaces could contain fracture propagation [9,33]. In our experiments, the fracture propagation is correspondence with the interaction situations noted by the scholars. There are two main reasons for the two different propagation pathways. Under the same conditions of stress and flow rate, with the increase of the interbed thickness, the fractures are more difficult to cross the interbeds. Besides, the arresting effect of the interface between A layer and B layer results in diversion of hydraulic fractures.
According to investigate the fractures geometry on the surfaces of those three model blocks after hydraulic fracturing, the induced fractures were sketched carefully with naked eyes. Ishida [34] used this method to study the induced fractures geometry on the granite surfaces. Figure 6 shows the visible fractures on the unfolded surfaces of the model blocks. The surfaces of C1 generated many fracture branches and formed fracture network. The surfaces of C2 produced a tortuous main fracture with some branches. However, the main fractures of C3 were typical straight bi-wing fractures with a few branches. Figure 7 shows the length and the number of fractures on the surfaces of the three model blocks, which indicates that the length and the number of fractures decrease as the interbed thickness increases. Xu et al. [26] studied the relationship between laminated structure and hydraulic fractures, and noted that the effectiveness of hydraulic fracturing on the concrete block with thicker interbeds was better. Based on the experimental data, similar results are obtained and it is justified to state that the main fracture is prone to crossing the thinner interbeds, getting through more interbeds and the bedding faces, which results in more complex fractures.
The model blocks C1, C2 and C3 were cut into two parts along the main fracture after experiments to observe induced fractures on the main fracture planes. Some fractures can be seen by naked eyes, but most fractures are too tiny to be observed. Therefore, the microscope was used to study fracture propagation. The observation method is that the two main fracture planes are entirely scanned by the hand-held digital microscope with 200 magnification, then the fractures are imaged and observed on the computer. It takes almost more than 1 h to observe one plane. Because the length of fractures is difficult to measure on the main fracture planes, the width and number of fractures are used to analyze the induced fractures. Taking C3 as an example, there are many fractures on the main fracture planes, so some typical fractures are presented in Figure 8.
Based on the observations of the fractures on the main fracture planes of the model blocks C1, C2 and C3 by the microscope, both visible and micro fractures can be seen on the two main planes of those blocks, but most fractures are micro. Besides, the width of visible fractures on the main fracture planes of three blocks is from about 0.100–0.070 mm. Moreover, the width of the micro fracture is almost less than 0.060 mm. According to the statistics of fractures on the main fracture planes of the model blocks C1, C2 and C3, the number of fractures is 17, 15 and 10, respectively.
The number of fractures tends to decrease as the thickness of interbeds increases, which has the same tendency of the number of fractures on surfaces. The reason is that the main fracture crosses fewer interbeds as the thickness of interbeds increases, which leads to less visible fractures and micro fractures on the main fracture planes.

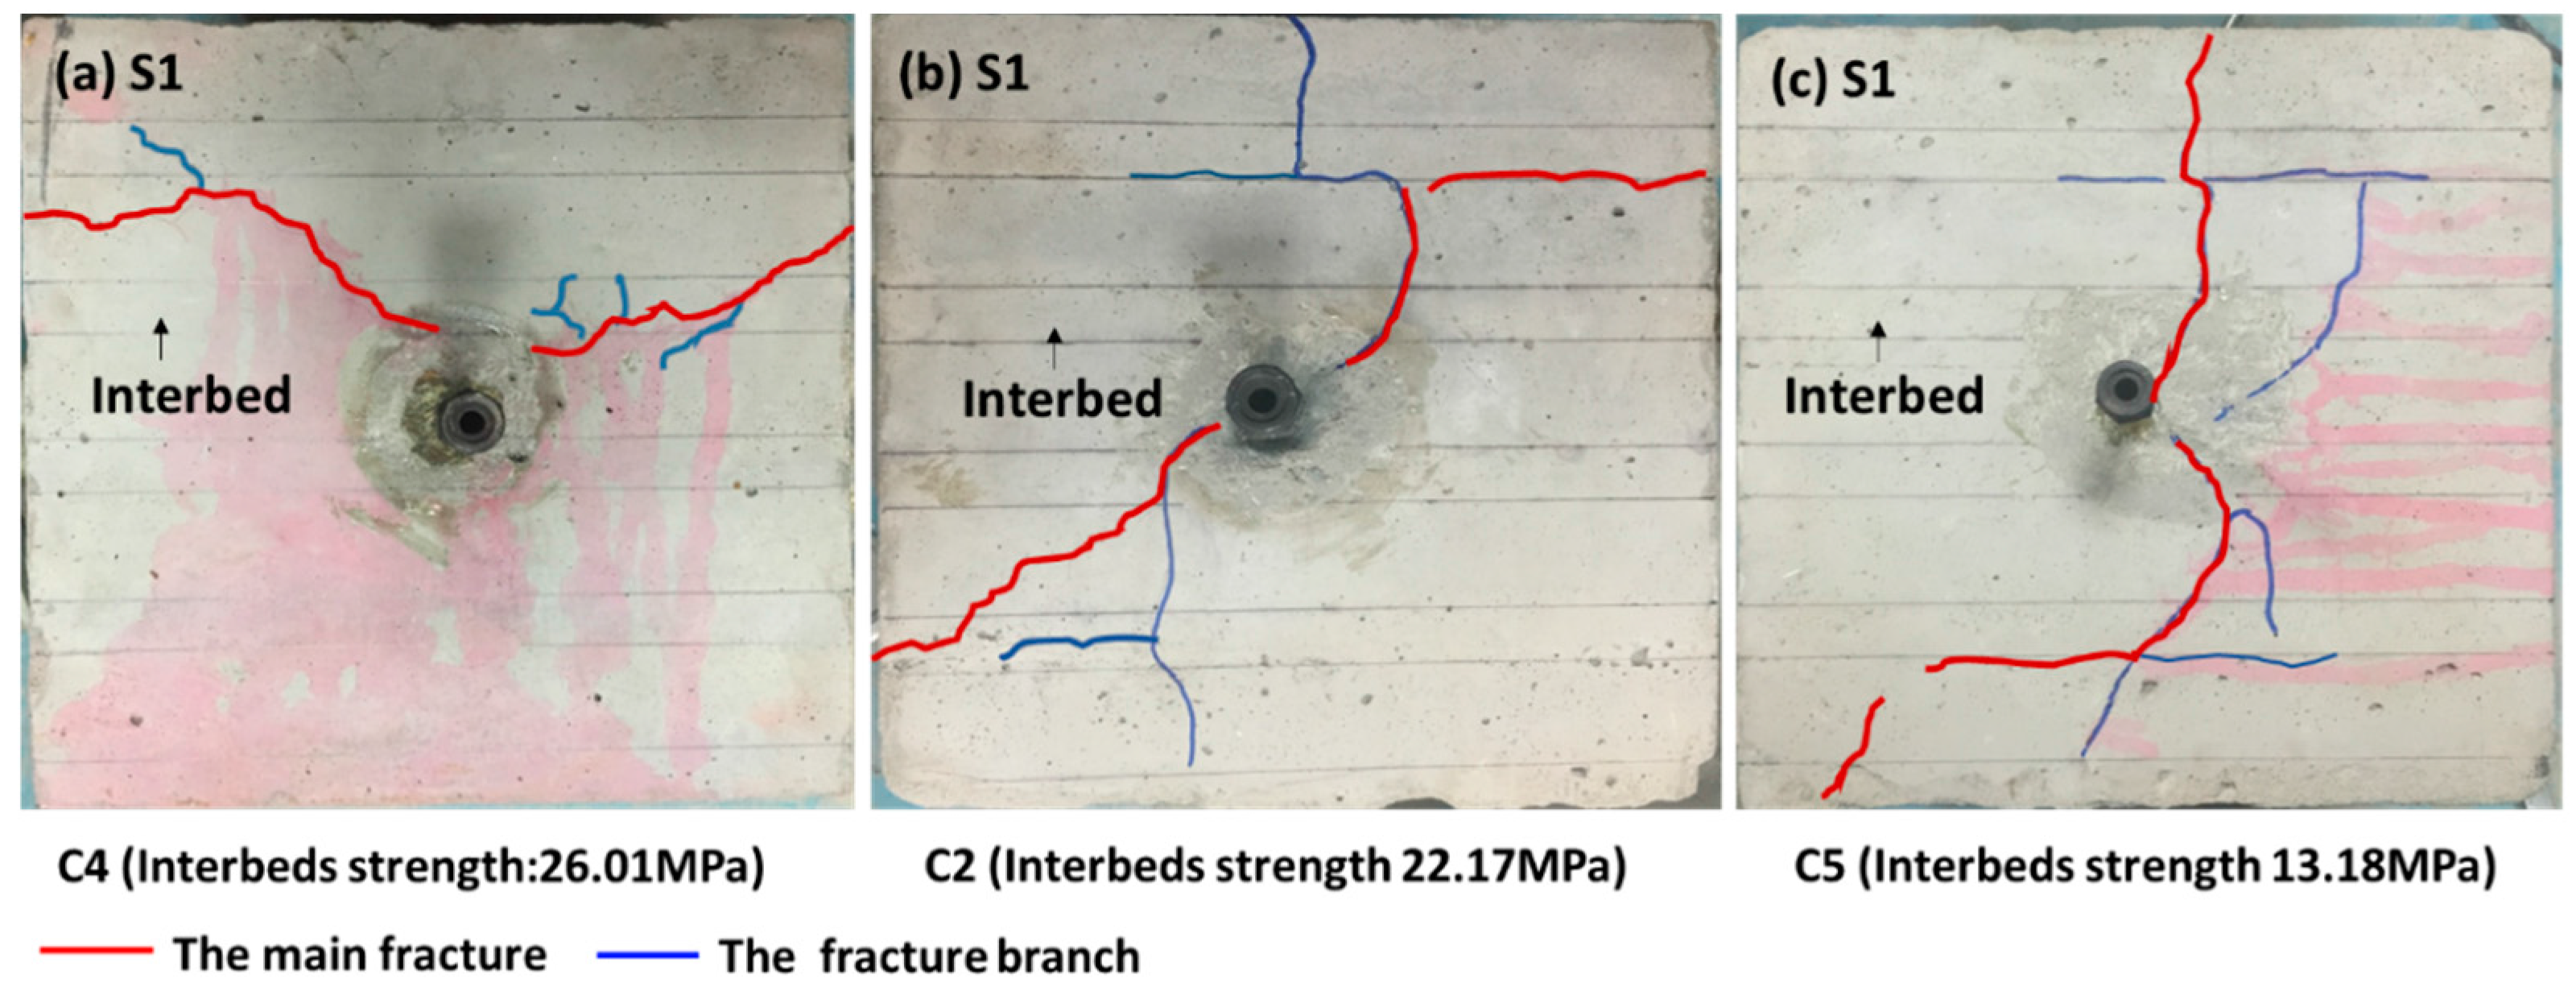
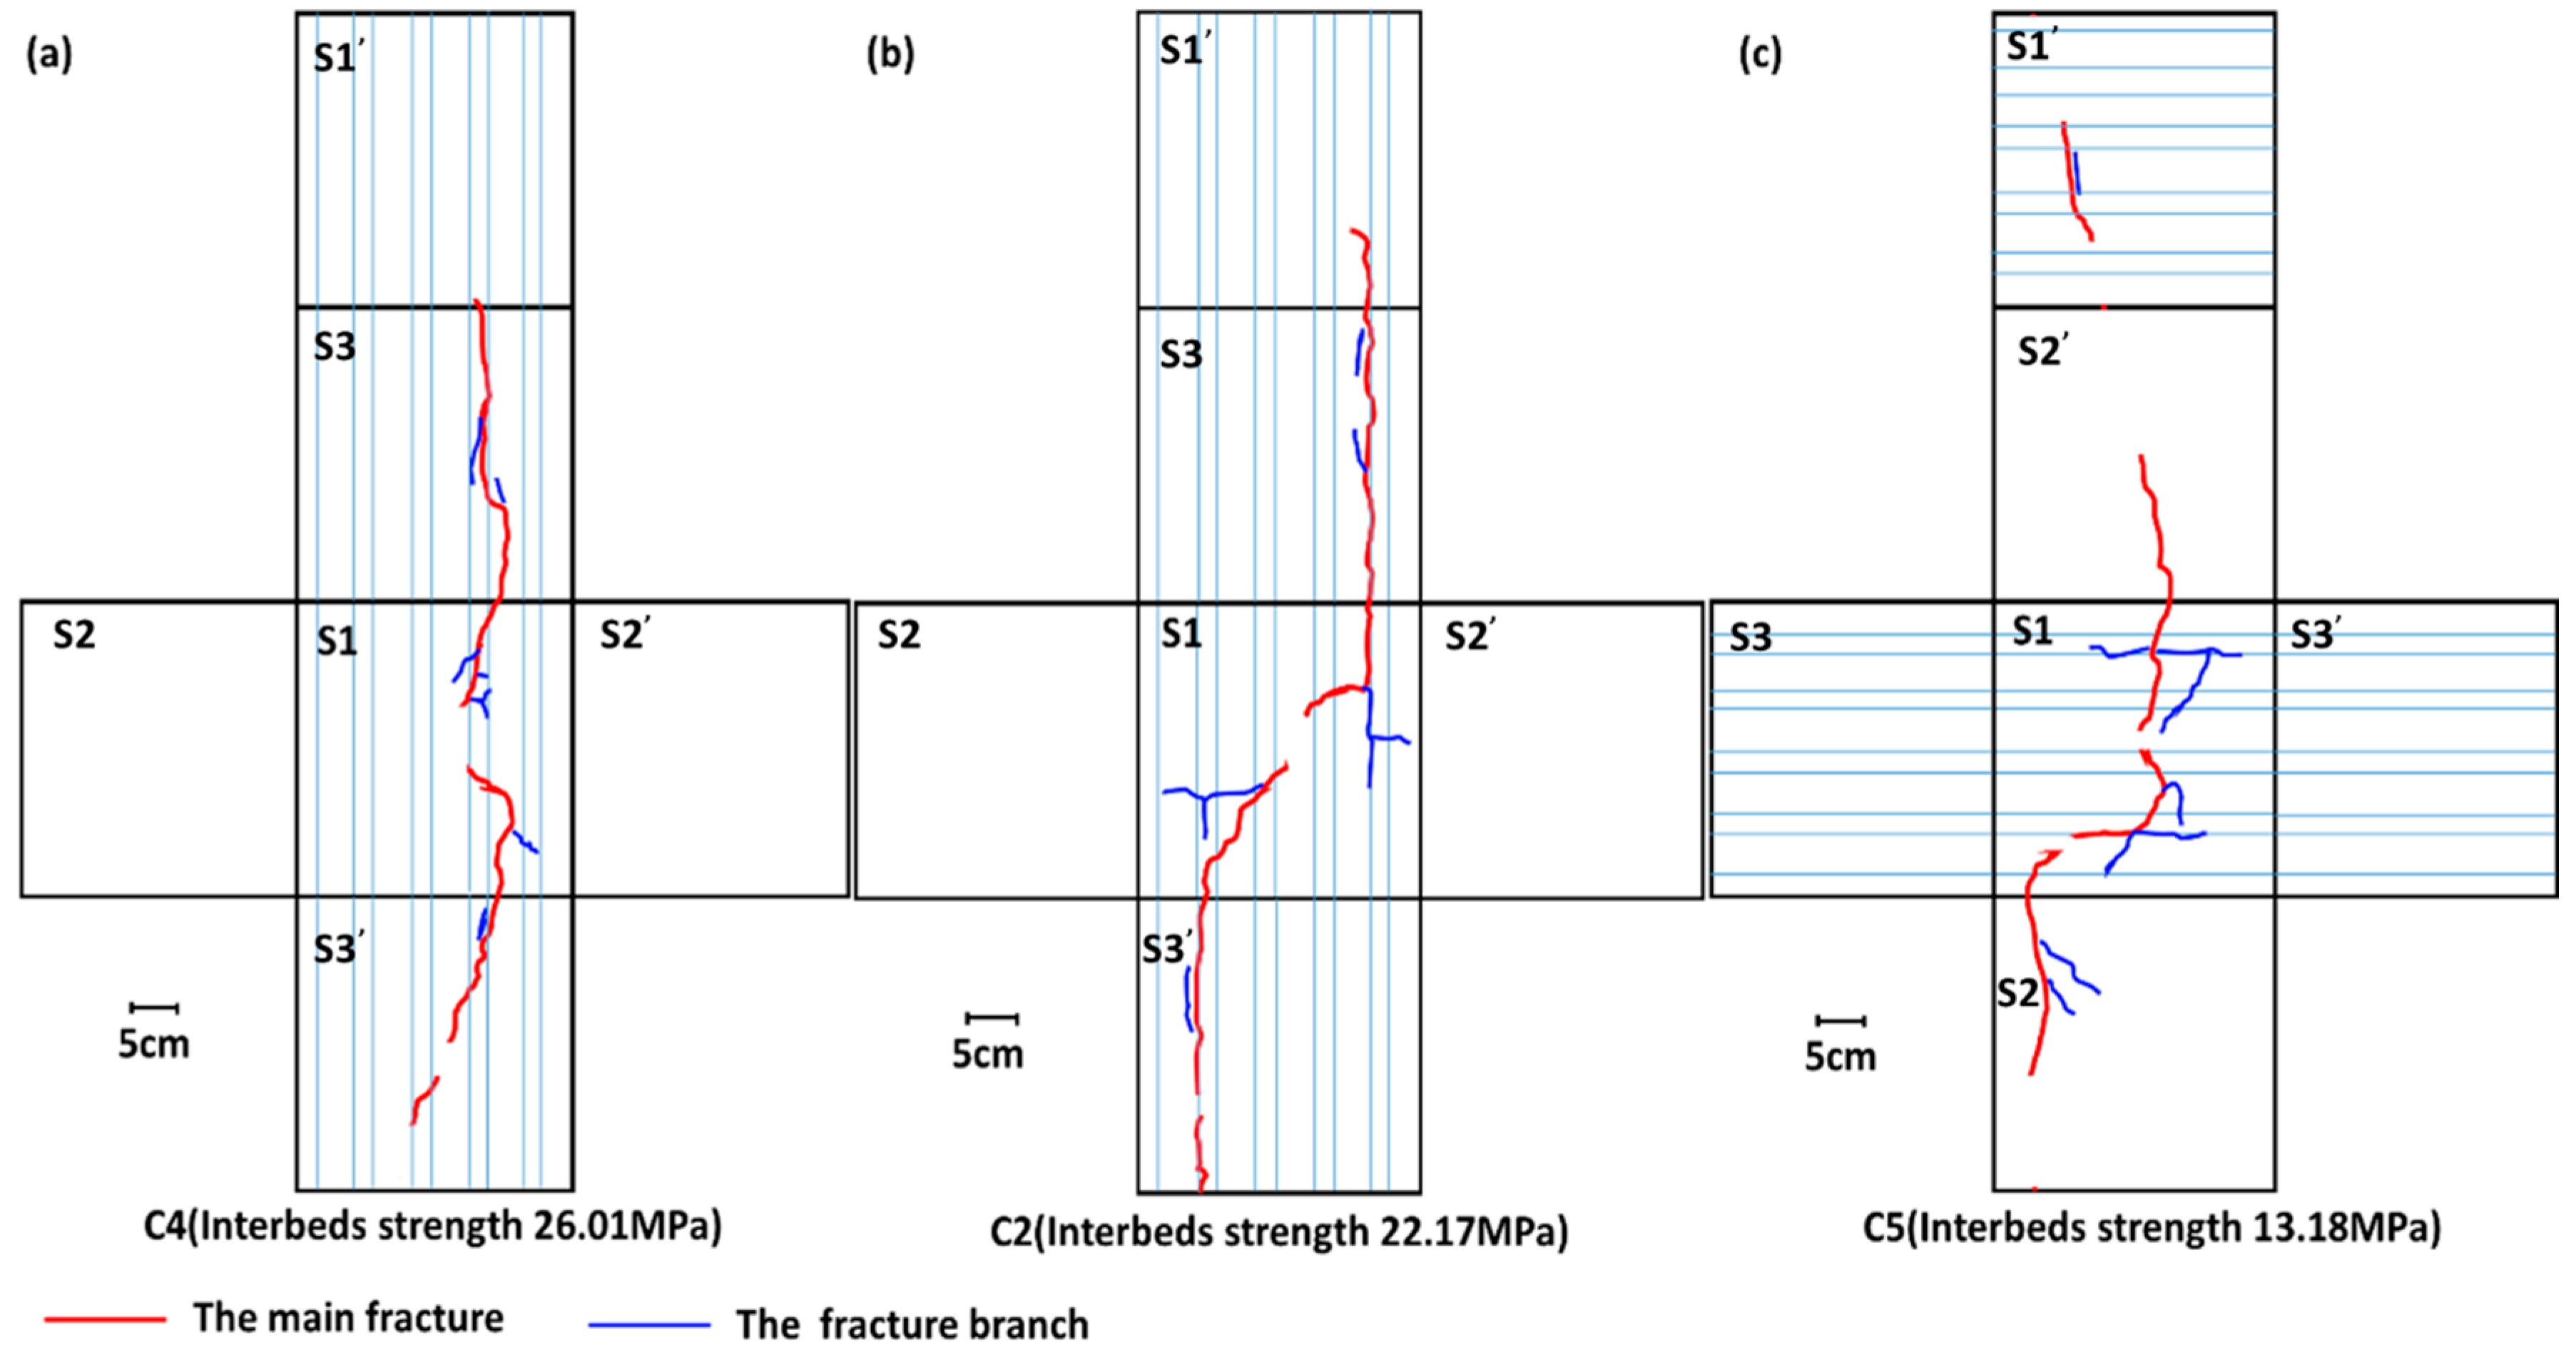
3.3. Effects of the Strength of Interbedson Fracture Propagation

To analyze the effects of strength of interbeds on hydraulic fracture propagation, the induced fractures on the surfaces of the model blocks C4, C2 and C5 with the same thickness of interbeds were observed and sketched by naked eyes after experiments. The interbed strength of the model blocks C4, C2 and C5 are 26.01, 22.17 and 13.78 MPa, respectively. Similarly, the length and the number of fractures on the surfaces were applied to better study the fractures.
Figure 9 shows the hydraulic fractures on the surface S1 of the model blocks C4, C2 and C5. The red fractures are main fractures and the blue fractures are fracture branches. When the strength of the B interbeds was relatively low (13.78 MPa), the main fracture crossed interbeds, extending along the bedding face, then getting through the A layers and the B interbeds. When the strength of the B interbeds increased (22.17 MPa), the main fracture crossed interbeds first, then turned to the bedding face, propagating and breaking along the bedding face. When the strength of the B interbeds rose to 26.01 MPa, the direction of main fracture mostly completely changed, propagating along the A layer and the B interbed around the drill hole.
Warpinski et al. [35] and Wright et al. [36] noted the layer material property could impact on the hydraulic fracture propagation and a material property interface could arrest the fracture growth. In the experiments, the three totally different propagation pathways of the main fracture, that are correspondence with the interaction situations pointed out by the scholars [5,6], mainly result from the varying interbed strength. The lower strength interbeds have small resistance to the propagation and extension of fractures under the same conditions of stress and flow rate, so fractures can cross the interbeds, which lead to produce long fractures. In addition, when the fracture extends to the interface, because of the arresting effect of the interface, the fracture propagates along the interfaces instead of crossing the high strength interbeds.
Figure 10 shows the visible fractures on the unfolded surfaces of the model blocks C4, C2 and C5. The main fracture of C4 was typical bi-wing fractures with some short branches, and the surfaces of C2 produced tortuous main fracture with branches. However, the surfaces of C5 generated fracture network with some long branches. Therefore, the interbed strength not only leads to different fracture geometry, but also affects the length of branches. Figure 11 shows the length and the number of fractures on the surfaces of the three model blocks, which indicates that, although the number of fractures on the surfaces of C2 is smaller than that of C4, the length of fractures decreases with the increase of the interbed strength. This is because lower strength interbeds make the propagation and extension of fractures more easy, and the main fracture tends to get through the interbeds and the bedding faces, which could produce long fractures and fracture branches.
The model blocks C4, C2 and C5 were cut into two parts along the main fracture after experiments to observe induced fractures on the main fracture planes by the microscope. Likewise, the width and number of fractures are used to analyze the induced fractures. Taking C4 as an example, some typical fractures are shown in Figure 12.
Based on observations of the main fracture planes of the model blocks C4, C2 and C5 by the microscope, two main fracture planes of each model block have visible and micro fractures, but there are much more micro fractures. Specifically, compared with the width of visible fractures of C4 and C2 that is about 0.080 mm, the width of visible fractures of C5 with low strength interbeds 13.78 MPa is mostly more than 0.100 mm and can be seen clearly by the naked eye. However, the width distribution range of micro fracture of the three model blocks is basically similar and is about from 0.010 mm to 0.050 mm. According to the statistics of fractures on the main fracture planes of the model blocks C4, C2 and C5, the number of fractures is 13, 15 and 18, respectively.
The number of fractures tends to increase as the interbed strength decreases, which is slightly different from the tendency of the number of fractures on surfaces. The analysis of the experimental datum implies that with decreasing interbed strength, the main fracture can cross more interbeds, generating more fractures, and visible fractures on the main fracture planes are wider. Therefore, the fracturing effectiveness is better.

4. Conclusions

In this study, the hydraulic fracturing experiments were conducted on 300 mm × 300 mm × 300 mm interbedded concrete model blocks to research the effects of thickness and strength of interbeds on hydraulic fractures propagation. Some main conclusions can be summarized as follows:
(1)
Pump pressure-injection time curves of the five model blocks were obtained under the same in-situ stress field and flow rate. The breakdown pressure increases with the decrease of the thickness and strength of interbeds. The cause of this result is that higher force is required to break the block with thick and high strength interbeds.
(2)
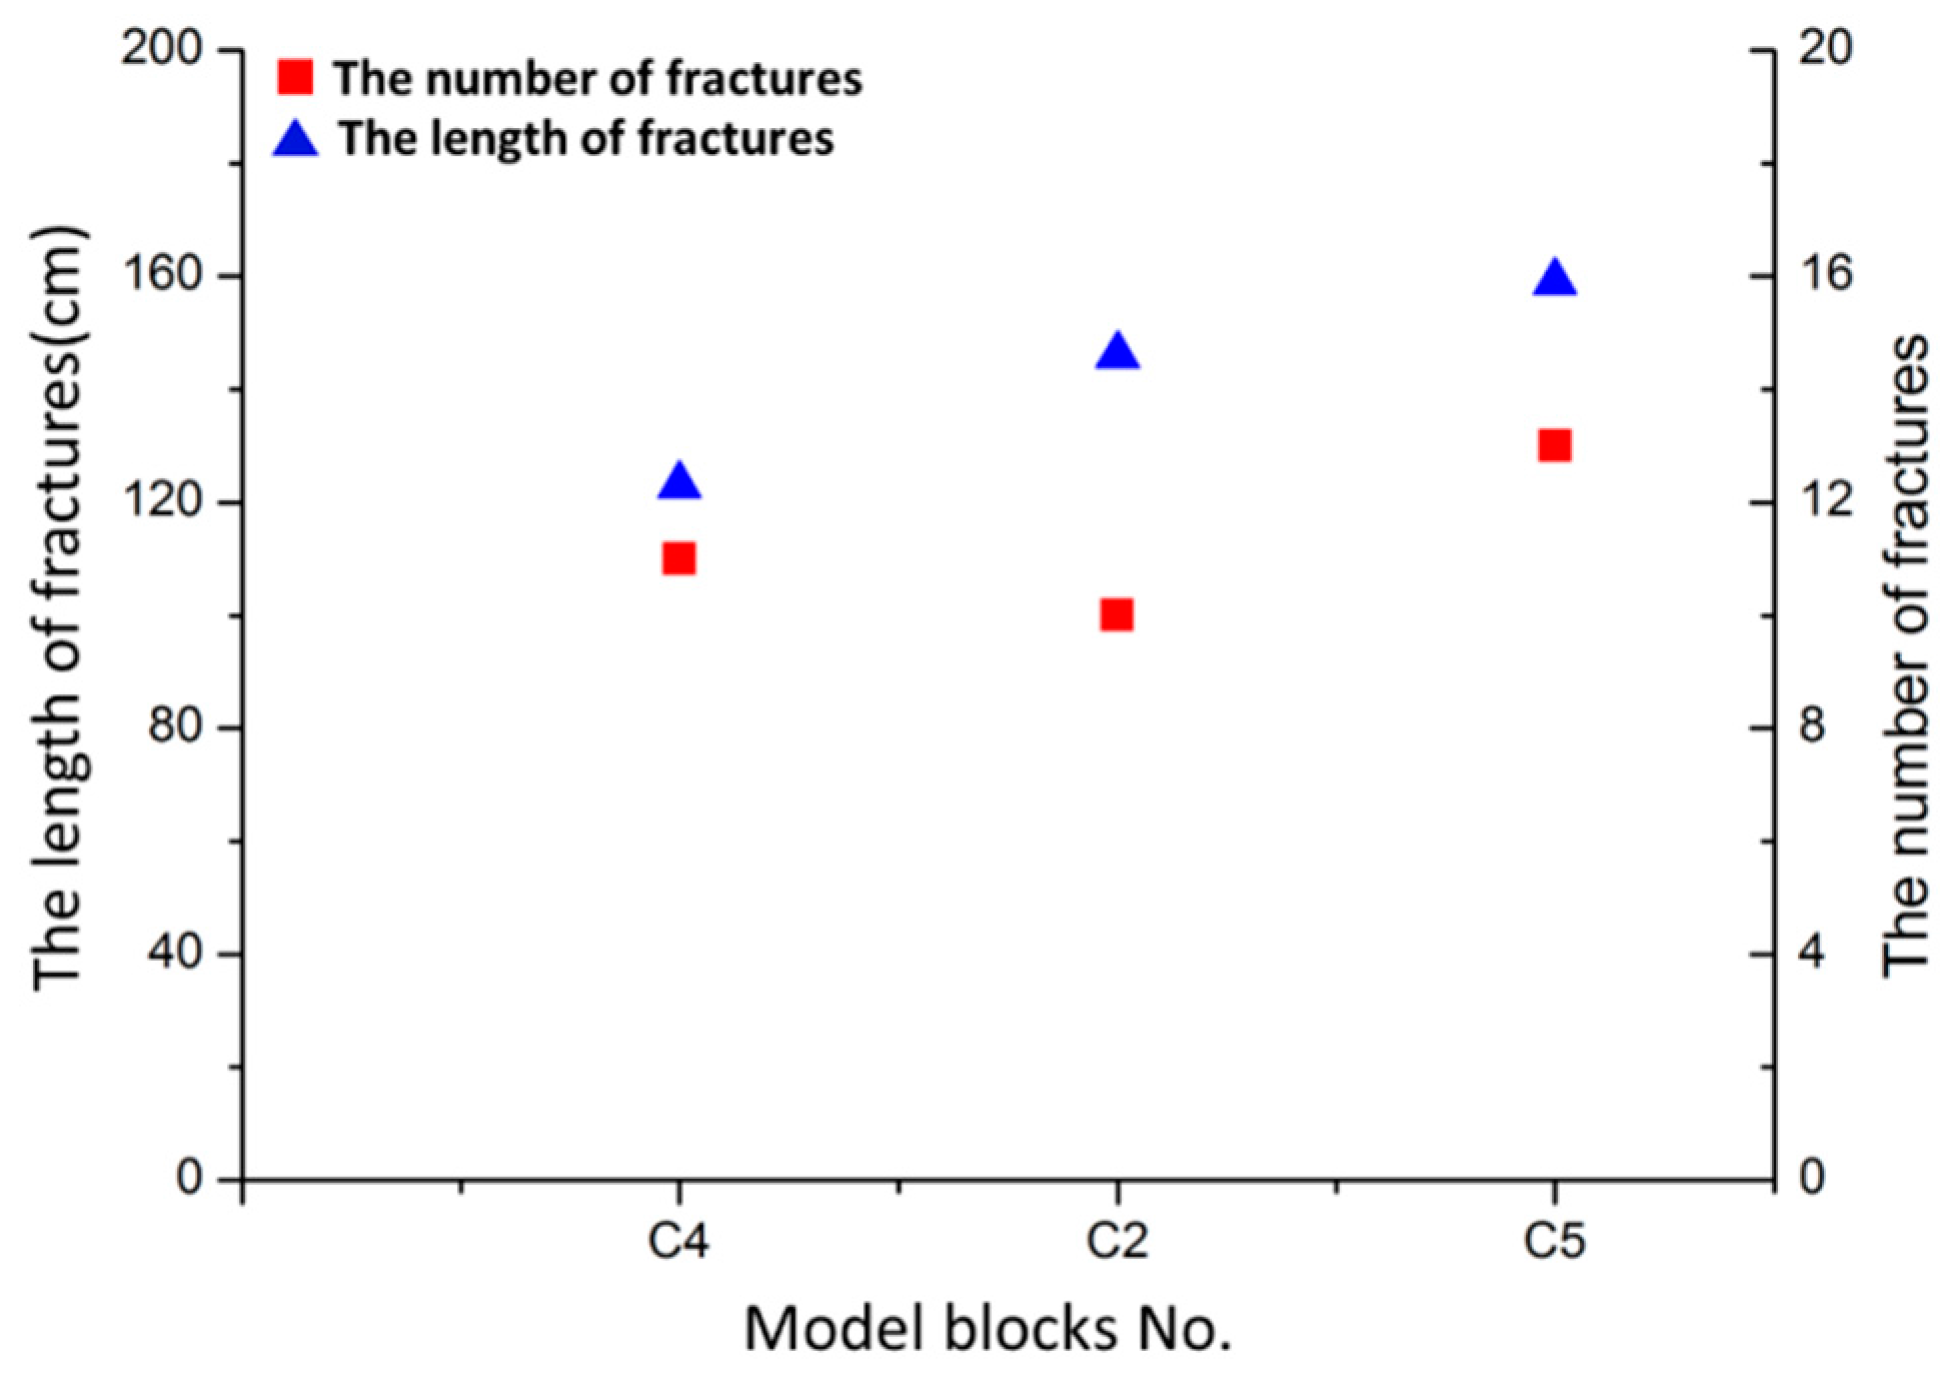
The main fracture has difficulty in crossing the interbeds of thick and high strength, and is prone to divert along the bedding faces. On the surfaces, the model block with lower strength interbeds could generate longer fracture, and the model block with thinner interbeds tends to produce more branches along the main fracture, which forms a complex fracture network.
(3)
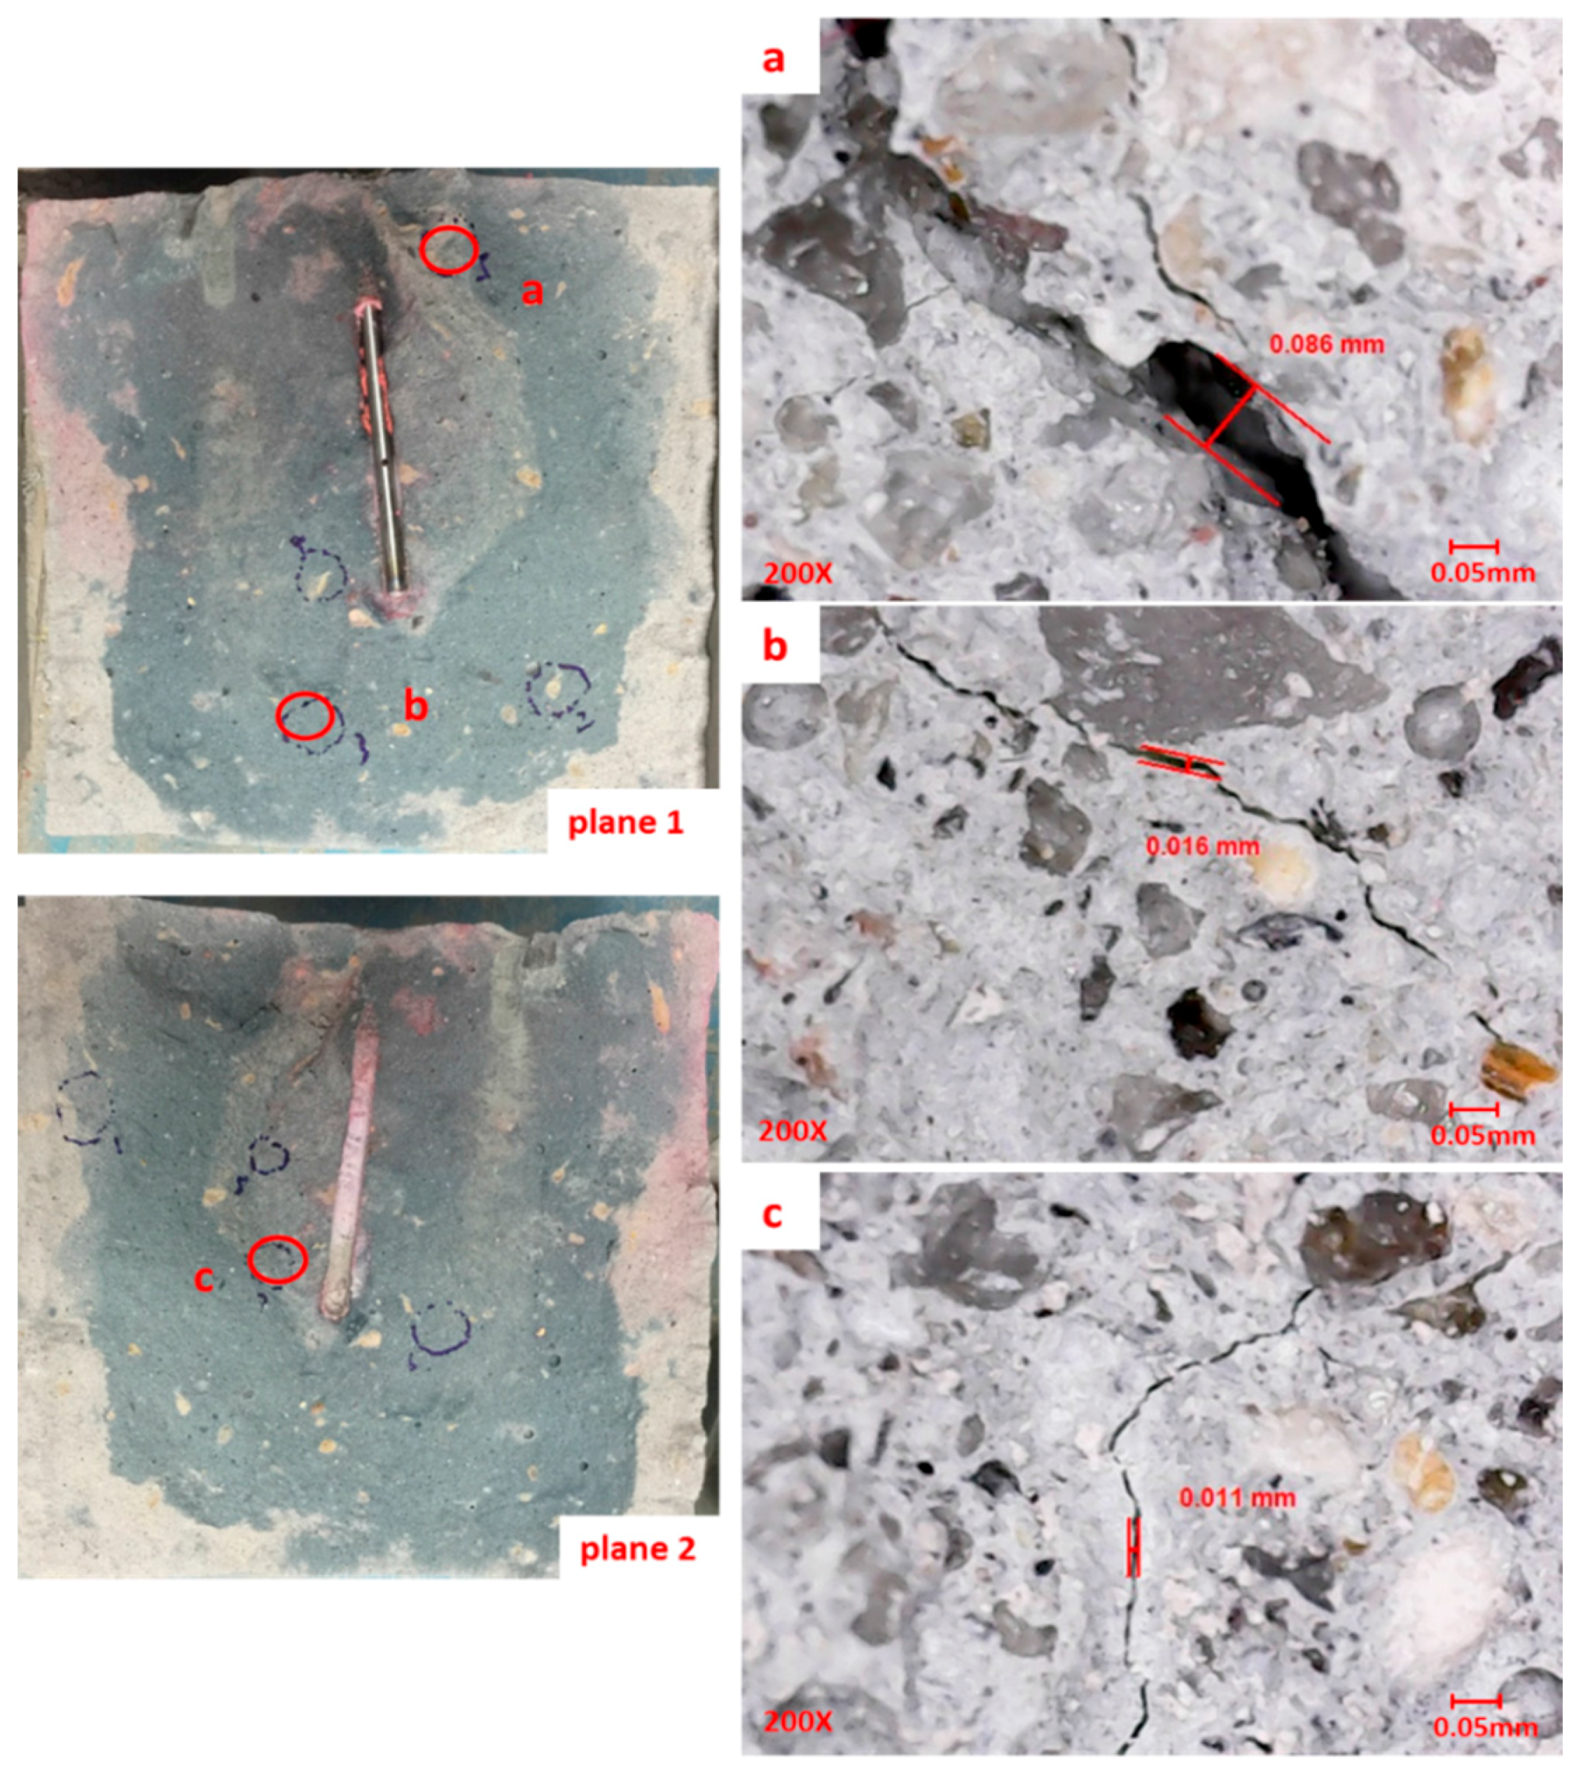
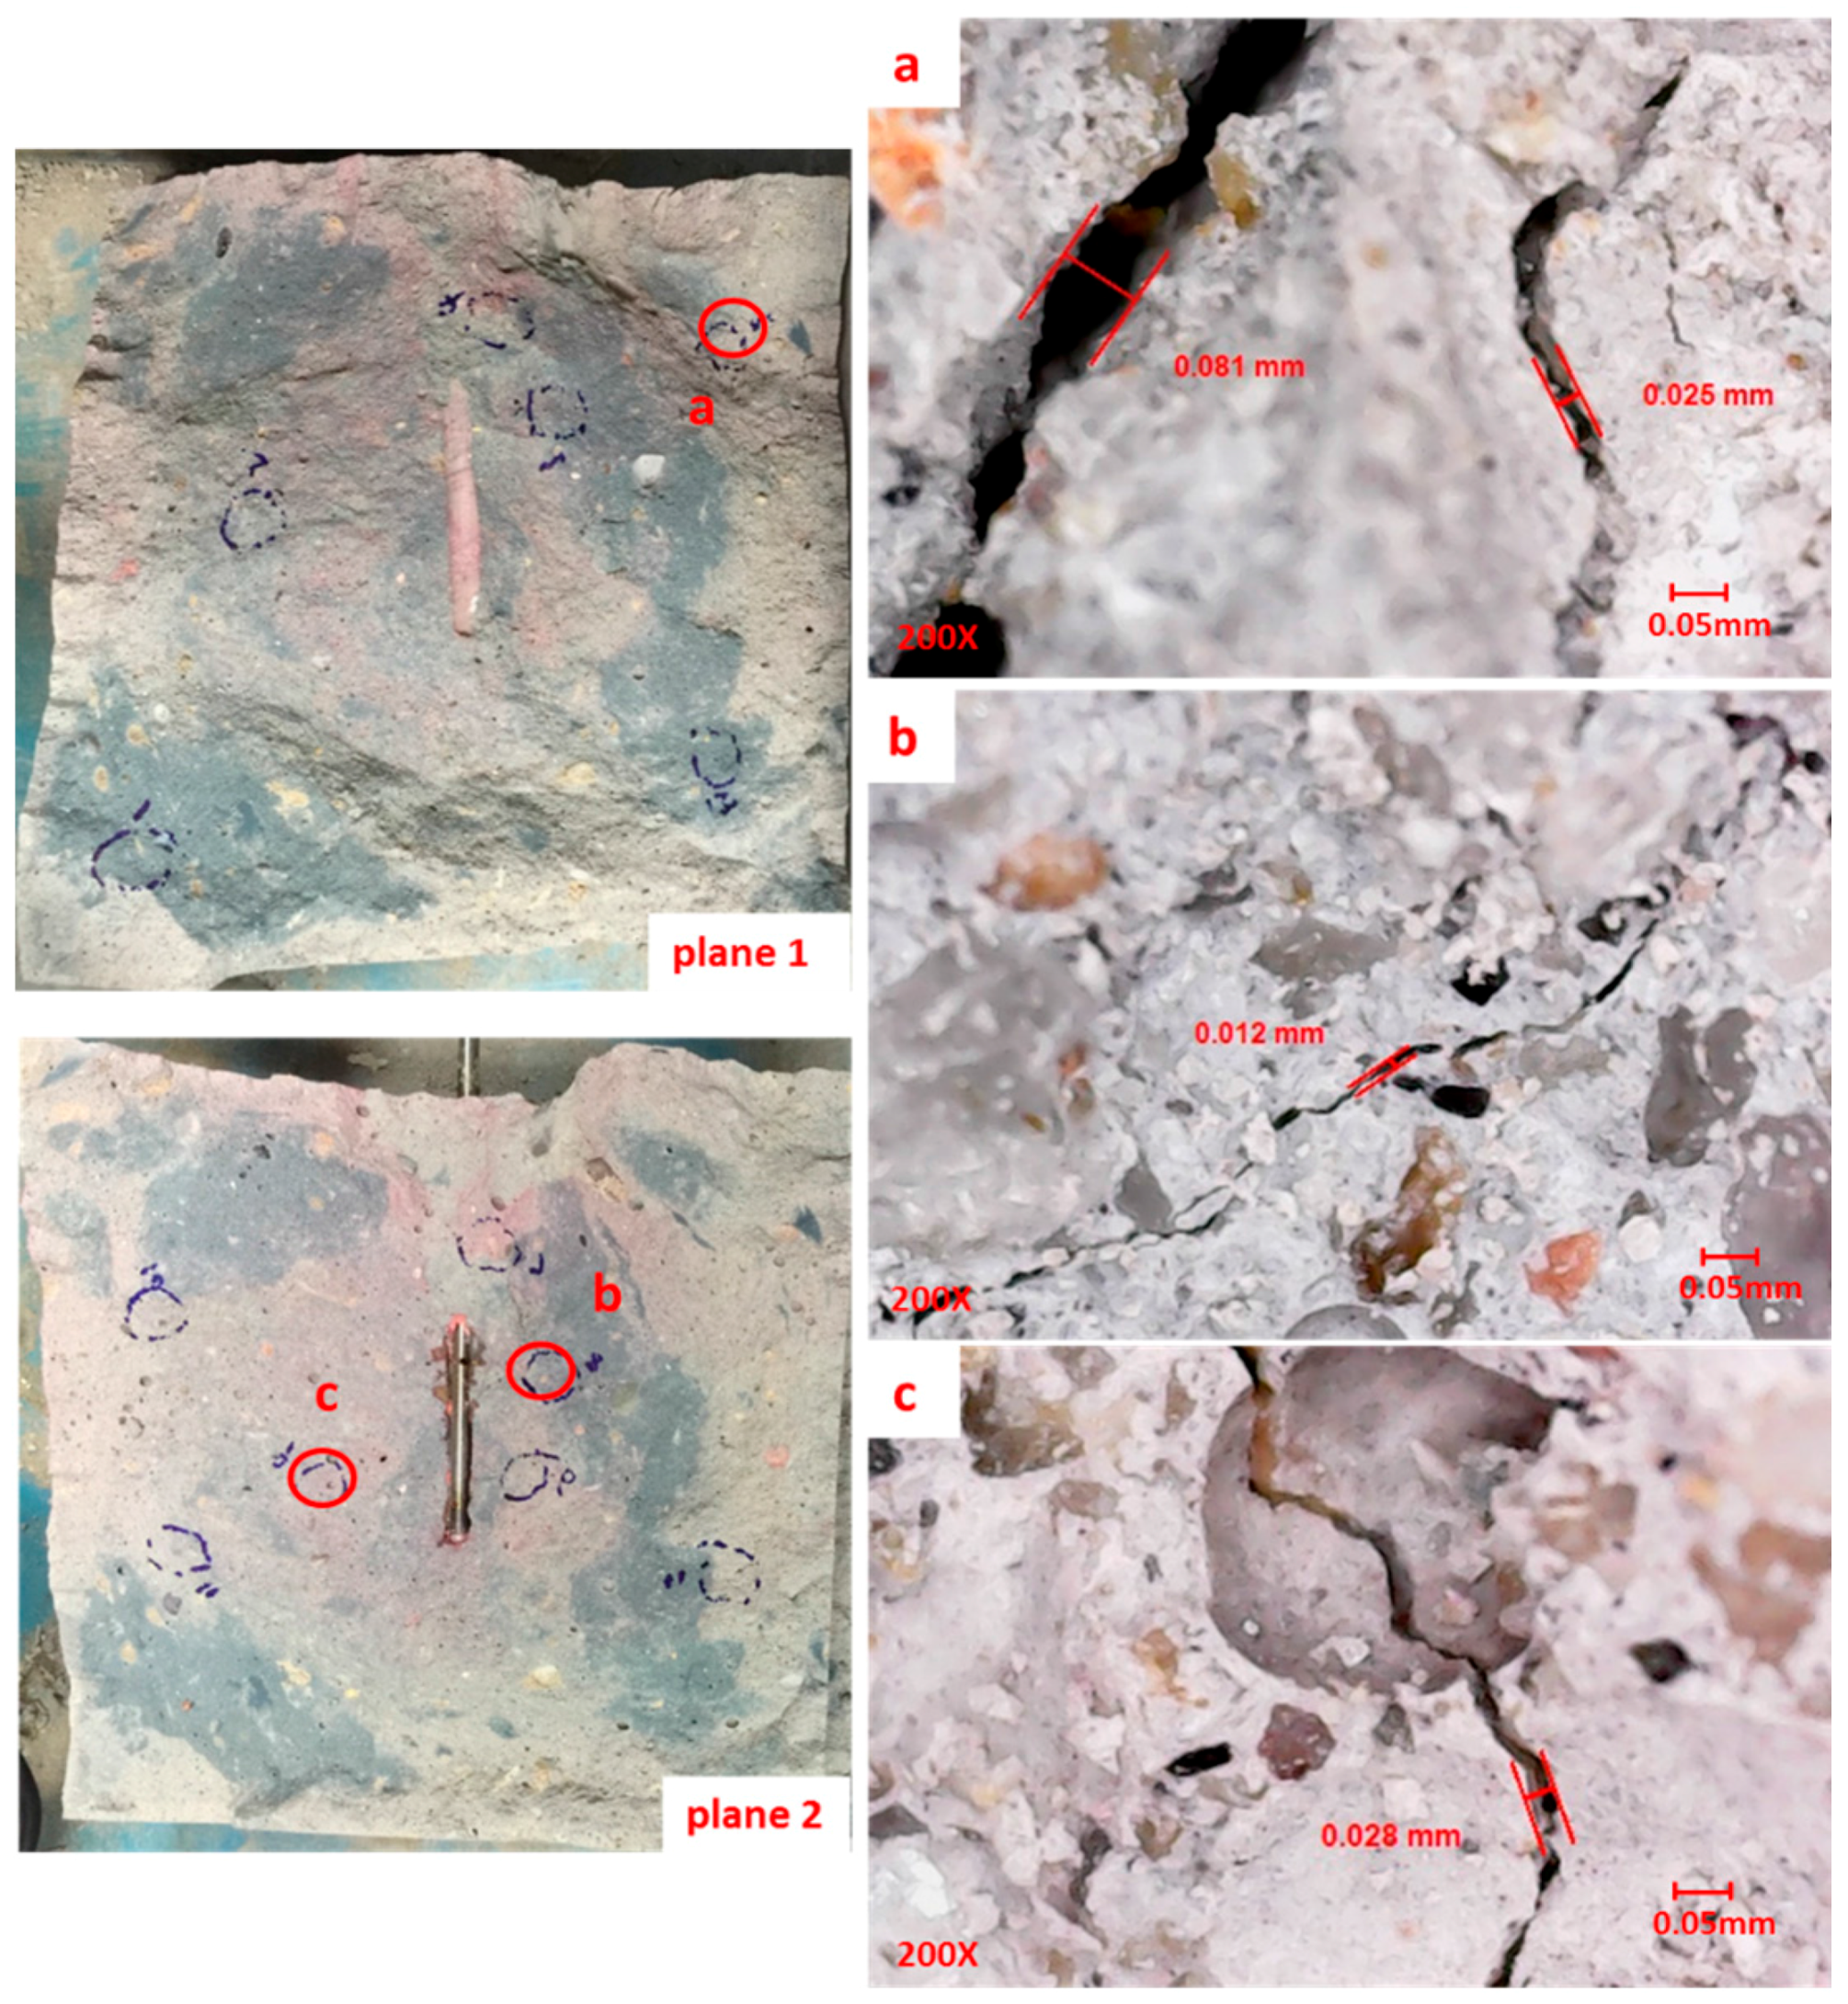
Both visible and micro-fractures can be observed on the main fracture planes by the microscope, but most fractures are tiny. The model block with thinner and lower strength interbeds tends to produce more fractures and the width of the visible fractures is relatively larger on the main fracture planes. Further experiments and simulation studies are needed to reveal the mechanism of fracture propagation in shales.

Acknowledgments

We thank the editors and the anonymous reviewers for their helpful and constructive suggestions and comments. This work was supported by the Strategic Priority Research Program of the Chinese Academy of Sciences (Grants Nos. XDB10030301, XDB10030304), and the National Natural Science Foundation of China (Grants No. 41502294).

Author Contributions

Zhiheng Zhao and Xiao Li designed the theoretical framework. Zhiheng Zhao conducted the hydraulic fracturing experiments and wrote the manuscript. Yu Wang and Bo Zheng participated in some experiments. Bo Zhang revised the figures.

Conflicts of Interest

The authors declare no conflict of interest.

References

  1. Yadav, H. Hydraulic Fracturing in Naturally Fractured Reservoirs and the Impact of Geomechanics on Microseismicity. Master’s Thesis, The University of Texas at Austin, Austin, TX, USA, December 2011. [Google Scholar]
  2. Blanton, T.L. Propagation of hydraulically and dynamically induced fractures in naturally fractured reservoirs. In Proceedings of the Society of Petroleum Engineers Unconventional Gas Technology Symposium, Louisville, KY, USA, 18–21 May 1986.
  3. Beugelsdijk, L.J.L.; De Pater, C.J.; Sato, K. Experimental hydraulic fracture propagation in a multi-fractured medium. In Proceedings of the Society of Petroleum Engineers Asia Pacific Conference on Integrated Modelling for Asset Management, Yokohama, Japan, 25–26 April 2000.
  4. Olson, J.E.; Bahorich, B.; Holder, J. Examining hydraulic fracture-natural fracture interaction in hydrostone block experiments. In Proceedings of the Society of Petroleum Engineers Hydraulic Fracturing Technology Conference, The Woodlands, TX, USA, 6–8 February 2012.
  5. Bahorich, B.; Olson, J.E. Examining the effect of cemented natural fractures on hydraulic fracture propagation in hydrostone block experiments. In Proceedings of the Society of Petroleum Engineers Annual Technical Conference and Exhibition, San Antonio, TX, USA, 8–10 October 2012.
  6. Sarmadivaleh, M. Experimental and Numerical Study of Interaction of a Pre-Existing Natural Interface and an Induced Hydraulic Fracture; Curtin University: Perth, Australia, 2012. [Google Scholar]
  7. Wang, Y.; Li, X.; Hu, R.L.; Ma, C.F.; Zhao, Z.H.; Zhang, B. Numerical evaluation and optimization of multiple hydraulically fractured parameters using a flow-stress-damage coupled approach. Energies 2016, 9, 325. [Google Scholar] [CrossRef]
  8. Warpinski, N.R.; Fnley, S.J.; Vollendorf, W.C.; O’Brien, M.; Eshom, E. The Interface Test Series: An In Situ Study of Factors Affecting the Containment of Hydraulic Fractures; Sandia National Laboratories Report SAND81-2408; Sandia National Laboratories: Albuquerque, NM, USA, February 1982. [Google Scholar]
  9. Warpinski, N.R.; Teufel, L.W. Influence of Geologic Discontinuities on Hydraulic Fracture Propagation. J. Pet. Technol. 1987, 39, 209–220. [Google Scholar] [CrossRef]
  10. Sarmadivaleh, M.; Rasouli, V. Test Design and Sample Preparation Procedure for Experimental Investigation of Hydraulic Fracturing Interaction Modes. Rock Mech. Rock Eng. 2015, 48, 93–105. [Google Scholar] [CrossRef]
  11. Ishida, T.; Chen, Q.; Mizuta, Y.; Roegiers, J.C. Influence of fluid viscosity on the hydraulic fracturing mechanism. Energy Resour. Technol. 2004, 126, 190–200. [Google Scholar] [CrossRef]
  12. Inui, S.; Ishida, T.; Nagaya, Y.; Nara, Y.; Chen, Y. AE monitoring of hydraulic fracturing experiments in Granite blocks using supercritical CO2, water and viscous oil. In Proceedings of the 48th US Rock Mechanics/Geomechanics Symposium, Minneapolis, MN, USA, 1–4 June 2014.
  13. Lhomme, T.P.; De Pater, C.J.; Helfferich, P.H. Experimental study of hydraulic fracture initiation in Colton sandstone. In Proceedings of the SPE/ISRM Rock Mechanics Conference, Irving, TX, USA, 20–23 October 2002.
  14. Meng, C.; De Pater, H.J. Hydraulic propagation in pre-fractured natural rocks. In Proceedings of the Society of Petroleum Engineers Hydraulic Fracturing Technology Conference, The Woodlands, TX, USA, 24–26 January 2011.
  15. Van Eekelen, H.A.M. Hydraulic fracture geometry: fracture containment in layered formations. Soc. Petrol. Eng. J. 1982, 22, 341–349. [Google Scholar] [CrossRef]
  16. Wang, Y.H.; Fu, H.F.; Liang, T.C.; Wang, X.; Liu, Y.Z.; Peng, Y.; Yang, L.F.; Tian, Z.H. Large-scale physical simulation experiment research for hydraulic fracturing in shale. In Proceedings of the Society of Petroleum Engineers Middle East Oil & Gas Show and Conference, Manama, Bahrain, 8–11 March 2015.
  17. Curtis, J.B. Fractured shale-gas systems. AAPG Bull. 2002, 86, 1921–1938. [Google Scholar]
  18. Zhang, J.C.; Jin, Z.Y.; Yuan, M.S. Reservoiring mechanism of shale gas and its distribution. Nat. Gas Ind. 2004, 5, 12–14. [Google Scholar]
  19. Zeng, W.T.; Zhang, J.C.; Ding, W.L. The Gas content of continental Yanchang Shale and its main controlling factors: A case study of liuping-171 well in Ordos Basin. Nat. Gas Geosci. 2014, 2, 291–301. [Google Scholar]
  20. Liu, X.J.; Xiong, J.; Liang, L.X. Investigation of pore structure and fractal characteristics of organic-rich Yanchang formation shale in central China by nitrogen adsorption/desorption analysis. J. Nat. Gas Sci. Eng. 2015, 22, 62–67. [Google Scholar] [CrossRef]
  21. Lei, Y.H.; Luo, X.R.; Wang, X.Z.; Zhang, L.X.; Jiang, C.F.; Yang, W.; Yu, W.X.; Cheng, M.; Zhang, L.K. Characteristics of silty laminae in Zhangjiatan Shale of southeastern Ordos Basin, China: Implications for shale gas formation. AAPG Bull. 2015, 4, 661–687. [Google Scholar] [CrossRef]
  22. Liu, Q.Y.; Jin, Z.J.; Wang, Y.; Han, P.L.; Tao, Y.; Wang, Q.C.; Ren, Z.L.; Li, W.H. Gas filling pattern in Paleozoic marine carbonate reservoir of Ordos Basin. Acta Petrol. Sin. 2012, 28, 847–858. [Google Scholar]
  23. Tang, X.; Zhang, J.; Shan, Y.; Xiong, J. Upper Paleozoic coal measures and unconventional natural gas systems of the Ordos Basin. Chin. Geosci. Front. 2012, 3, 863–873. [Google Scholar] [CrossRef]
  24. Luo, P.; Ji, L.M. Reservoir characteristics and potential evalution of continental shale gas. Nat. Gas Geosci. 2013, 5, 1060–1068. [Google Scholar]
  25. Tang, X.; Zhang, J.C.; Wang, X.Z.; Yu, B.S.; Ding, W.L.; Xiong, J.Y.; Yang, Y.T.; Wang, L.; Yang, C. Shale characteristics in the southeastern Ordos Basin, China: Implications for hydrocarbon accumulation conditions and the potential of continental shales. Int. J. Coal Geol. 2014, 128–129, 32–46. [Google Scholar] [CrossRef]
  26. Xu, D.; Hu, R.L.; Gao, W.; Xia, J.G. Effects of laminated structure on hydraulic fracture propagation in shale. Petrol. Explor. Dev. 2015, 4, 573–579. [Google Scholar] [CrossRef]
  27. De Pater, C.J.; Beugelsdijk, L.J.L. Experimental and numerical simulation of hydraulic fracturing in naturally fractured rock. In Proceedings of the 40th U.S. Symposium on Rock Mechanics of Alaska Rocks, Anchorage, AK, USA, 25–29 June 2005.
  28. Wang, W. Numerical Simulation and Experimental Research on the Oil Shale Hydraulic Fracturing; Jilin University: Changchun, China, 2014. [Google Scholar]
  29. Zhao, D.A.; Chen, Z.M.; Cai, X.L.; Li, S.Y. Analysis of distribution rule of geostress in China. Chin. J. Rock Mech. Sand Eng. 2007, 6, 1265–1271. [Google Scholar]
  30. Adachi, J.I. Fluid-Driven Fracture in Impermeable and Permeable Rock. Ph.D. Thesis, University of Minnesota, Minneapolis, MN, USA, 2001. [Google Scholar]
  31. De Pater, C.J.; Cleary, M.P.; Quinn, T.S.; Barr, D.T.; Johnson, D.E.; Weijers, L. Experimental verification of dimensional analysis for hydraulic fracturing. Soc. Petrol. Eng. 1994, 4, 230–238. [Google Scholar] [CrossRef]
  32. Berchenko, I.; Detournay, E.; Chandler, N.; Martino, J. An in-situ thermo-hydraulic experiment in a saturated granite I: Design and results. Int. J. Rock Mech. Min. Sci. 2004, 41, 1377–1394. [Google Scholar] [CrossRef]
  33. Jeffrey, R.G.; Byrnes, R.P.; Lynch, P.A.; Ling, D.J. An analysis of hydraulic fracture and mineback data for a treatment in the German creek coal seam. In Proceedings of the Society of Petroleum Engineers Rocky Mountain Regional Meeting, Casper, WY, USA, 18–21 May 1992.
  34. Ishida, T.; Niwa, T.; Aoyagi, K.; Yamakawa, A.; Chen, Y.; Fukahori, D.; Murata, S.; Chen, Q.; Nakayama, Y. AE monitoring of hydraulic fracturing laboratory experiment with supercritical and liquid state CO2. In Proceedings of the 2012 ISRM international Symposium, Stockholm, Sweden, 28–30 May 2012.
  35. Warpinski, N.R.; Branagan, P.T.; Peterson, R.E.; Wolhart, S.L. An interpretation of M-site hydraulic fracture diagnostic results. In Proceedings of the Society of Petroleum Engineers Rocky Mountain Regional/Low-Permeability Reservoirs Symposium, Denver, CO, USA, 5–8 April 1998.
  36. Wright, C.A.; Weijers, L.; Davis, E.J.; Mayerhofer, M. Understanding hydraulic fracture growth: Tricky but not hopeless. In Proceedings of the Society of Petroleum Engineers Annual Technical Conference and Exhibition, Houston, TX, USA, 3–6 October 1999.
Figure 1. The typical shale with interbeds and laminae from Chang 7-2 shale: (a) Outcrop of Chang 7-2 shale formation with typical interbeds; and (b) Core sample of Chang 7-2 shale formation with typical laminae).
Energies 09 00556 g001
Figure 2. A model block and schematic diagram of casing: (a) a casted layered model block; and (b) the enlarged picture of casing.
Energies 09 00556 g002
Figure 3. Stress conditions and the direction of borehole.
Energies 09 00556 g003
Figure 4. The pump pressure-injection time curves of five model blocks: (a) the pump Pressure-injection time curves of model blocks C1, C2, C3 and the breakdown pressures are 6.6, 7.29, 8.04 MPa, respectively; and (b) the pump pressure-injection time curves of model blocks C4, C2, C5 and the breakdown pressures are 8.4, 7.29 and 6.18 MPa, respectively.
Energies 09 00556 g004
Figure 5. Hydraulic fractures on the surface S1 of the model blocks C1, C2 and C3: (a) the main fracture changed the propagation direction and extended along the bedding face; (b) the main fracture also changed the propagation direction and extended along the bedding face; and (c) the main fracture extended along A layer, the B interbed and the bedding face.
Energies 09 00556 g005
Figure 6. Visible fractures on the unfolded surfaces of the model blocks C1, C2 and C3: (a) the tortuous main fracture with many fracture branches; (b) the tortuous main fracture with some fracture branches; and (c) the almost straight bi-wing main fracture with a few fracture branches.
Energies 09 00556 g006
Figure 7. The length and the number of fractures on the surfaces of the model blocks C1, C2 and C3.
Energies 09 00556 g007
Figure 8. The typical fractures observed by the microscope on the main fracture planes 1 and 2 of the model block C3 (the circles on the planes mean locations of fractures, and the pictures (ac) on the right are correspondent with the fractures in the red circles on the left).
Energies 09 00556 g008
Figure 9. Hydraulic fractures on the surface S1 of the model blocks C4, C2 and C5: (a) the main fracture extended along A layer, the B interbed and the bedding face; (b) the main fracture changed the propagation direction and extended along the bedding face; and (c) the main fracture also changed the propagation direction and extended along the bedding face.
Energies 09 00556 g009
Figure 10. The visible fractures on the unfolded surfaces of model blocks C4, C2 and C5: (a) the almost straight bi-wing mian fracture with some short fracture branches; (b) the tortuous main fracture with some fracture branches; and (c) the tortuous main fracture with some long fracture branches.
Energies 09 00556 g010
Figure 11. The length and the number of fractures on surfaces of model blocks C4, C2 and C5.
Energies 09 00556 g011
Figure 12. The typical fractures observed by the microscope on the main fracture planes 1 and 2 of model block C4 (the circles on the planes means locations of fractures, and the pictures (ac) on the right are correspondent with the fractures in the red circles on the left).
Energies 09 00556 g012
Table 1. Parameters of concrete A layers and B layers. UCS: uniaxial compressive strength; C:S:W: cement, sand and water.
Model Block No.Layers No.Thickness (cm)C:S:W (mass ratio)Average UCS (MPa)Average Tensile Strength (MPa)Average Young Modulus (GPa)Average Poisson Ratio
C1A41:3:0.533.653.4330.780.24
B11:4:0.622.172.4626.750.22
C2 (Base model)A41:3:0.533.653.4330.780.24
B21:4:0.622.172.4626.750.22
C3A41:3:0.533.653.4330.780.24
B31:4:0.622.172.4626.750.22
C4A41:3:0.533.653.4330.780.24
B21:2:0.426.014.0122.540.27
C5A41:3:0.533.653.4330.780.26
B21:6:0.713.782.0117.760.20
Table 2. Parameters of bedding face between A layer and B layer.
Model Block No.Layers No.Thickness (cm)C:S:W (Mass Ratio)Bedding Face Friction CoefficientBedding Face Cohesion (MPa)
C1A41:3:0.50.463.23
B11:4:0.6
C2 (Base model)A41:3:0.50.463.23
B21:4:0.6
C3A41:3:0.50.463.23
B31:4:0.6
C4A41:3:0.50.414.43
B21:2:0.4
C5A41:3:0.50.522.66
B21:6:0.7
Table 3. Experimental conditions for hydraulic fracturing experiments.
Fracturing FluidFlow Rate (mL/min)Stress Condition (MPa)Horizontal Stress Difference (MPa)
σHσhσv
Water502.112.91.1

