Article

Unconventional Gas: Experimental Study of the Influence of Subcritical Carbon Dioxide on the Mechanical Properties of Black Shale

1
School of Power and Mechanical Engineering, Wuhan University, Wuhan 430072, China
2
Key Laboratory of Hubei Province for Water Jet Theory & New Technology, Wuhan 430072, China
3
Deep Earth Energy Lab, Department of Civil Engineering, Monash University, Melbourne 3800, Australia
*
Author to whom correspondence should be addressed.
Energies 2016, 9(7), 516; https://doi.org/10.3390/en9070516
Submission received: 12 April 2016 / Revised: 24 June 2016 / Accepted: 27 June 2016 / Published: 7 July 2016

Abstract

:
An experimental study was performed to investigate the effect of subcritical carbon dioxide (CO2) adsorption on mechanical properties of shales with different coring directions. Uniaxial compressive strength (UCS) tests were conducted on shale samples with different CO2 adsorption time at a pressure of 7 MPa and a temperature of 40 °C. The crack propagation and the failure mechanism of shale samples were recorded by using acoustic emission (AE) sensors together with ARAMIS technology. According to the results, samples with parallel and normal bedding angles present reductions of 26.7% and 3.0% in UCS, 30.7% and 36.7% in Young’s modulus after 10 days’ adsorption of CO2, and 30.3% and 18.4% in UCS, 13.8% and 22.6% in Young’s modulus after 20 days’ adsorption of CO2. Samples with a normal bedding angle presented higher brittleness index than that with a parallel bedding angle. The strain distributions show that longer CO2 adsorption will cause higher axial strains and lateral strains. The AE results show that samples with a parallel angle have higher AE energy release than the samples with a normal angle. Finally, samples with longer CO2 adsorption times present higher cumulative AE energy release.

1. Introduction

With the spread of fracking techniques, shale gas production has increased rapidly in the past ten years. The greater consumption of natural gas could decrease the amount of coal used in fossil-fuel power plants, which is one of the main sources of greenhouse gas emissions. For example, based on the transition from coal to gas-fired electricity generation, the USA has reduced 15% of its total carbon dioxide emission from 2417 million metric tons in 2005 to 2053 million metric tons in 2013 [1]. However, the high demand for water for shale gas exploration is one of the biggest challenges for countries like China where the majority of shale reservoirs are located in arid areas. Carbon dioxide (CO2), which is one of the main components in greenhouse gases, has shown better drilling and fracturing ability than water and can be used for shale gas exploitation [2,3,4,5,6,7,8,9].
As characterized by the heterogeneity in composition and structure at all scales, shales are rocks with complex properties. Many studies have been conducted to analyse the mechanical properties of shale [10,11,12,13] and its adsorption/desorption abilities [14,15]. Gas adsorption/de-sorption which will cause swelling/shrinkage of the organic matters in coal has been well documented in many studies [16,17,18,19,20,21]. However, the structure of shale is significantly different from the coal. Shale is a kind of fine-grained, clay-rich sedimentary rock, while coal is a porous mixture of inorganic minerals and organic material in a complex, three-dimensional network [22]. Due to the relatively lower total organic carbon (TOC) (usually less than 10% in shale compared with about 50%–60% in coal) and the constraints from the framework rocks, the strain from the shrinkage/swelling of the organic matter due to gas desorption/adsorption is expected to be much lower in the shale formations as observed by the geo-mechanical communities [23,24,25,26].
Although shale has small swelling/shrinkage after gas adsorption/desorption, it will generate large variations in compressive strength. Choi and Song [27] stated that the adsorption of CO2 and water in shales leaded to significant decrease of compressive strength. Therefore, it is of great importance to investigate the effect of CO2 adsorption on mechanical behaviours of shale.
The relationship between shale strength and the chemical potential of an adsorbate can be expressed by Gibbs [28] (Equation (1)) and Griffith [29] (Equation (2)) theories, which has been used to analyse coal mass strength after adsorption [19].
d γ = ( Γ i d μ i )
σ = 2 γ E π l
where γ is the surface energy per unit crack length, Γi and dμi are the surface concentration and change in the chemical potential of the ith adsorbate component, respectively, σ is the tensile stress at an existing crack tip required to form a new crack surface, E is the Young’s modulus of the material and l is the crack half length.
According to Equation (1), surface energy will decrease due to the increase of the adsorbate’s chemical potential or replacement with a more reactive adsorbate with great chemical potential. Griffith’s equation (Equation (1)) states that tensile stress will decrease with lower surface energy. Thus, modifications that will decrease the surface energy in adsorbate–adsorbent system will weaken the material’s strength. The experimental results from Rebinder [30] and Likhtman et al. [31] collectively indicated that the CO2 adsorption induced a weakening effect in material summarized by Equations (1) and (2).
When CO2 is injected into shale reservoirs, it moves along the shale fracture systems and adsorbs onto the cores, replacing naturally existing CH4, as CO2 has a greater chemical potential. Since CO2 is more reactive than CH4, this process causes the overall strength of the shale to be reduced. A number of studies have explored the influence of CO2 adsorption on coal. Aziz and Li [32] observed an increase in CO2 adsorption-induced strength reduction of coal with increasing CO2 pressure. Brochard et al. [33,34] theoretically and numerically investigated the swell of microporous medium like coal after CO2 adsorption at a molecular level. The results showed that the adsorption of CO2 caused coal samples’ volumetrical strains to increase and cleat system to close. Viete and Ranjith [35] conducted uniaxial tests to examine the effect of CO2 saturation on coal strength. With a gas saturation pressure of 1Mpa for 3 days, the testing results showed that the reduction of uniaxial compressive strength (UCS) and Young’s modulus of the coal were around 13% and 26%, respectively. Perera, Ranjith [19] investigated the effects of subcritical and supercritical CO2 (SC-CO2) saturation on the mechanical properties of bituminous coal. According to the results, super-critical CO2 adsorption caused higher reduction of Young’s modulus and lower UCS compared to gaseous CO2 adsorption. Meanwhile, much research of water or salinities adsorption-induced strength reduction on shale has been done by scholars. Chenevert [36] tested montmorillonitic, illitic and chloritic shales reacted with fresh water. The adsorption results showed a significant compressive strength reduction. Hale et al. [37] demonstrated that compressive strength and mechanical properties of shale decreased upon water adsorption. Wong [38] conducted a series of experiments on La Biche shale samples with different salinities. The test results indicate that the Young’s modulus decreases with increasing swelling. Ghorbani et al. [39] demonstrated desiccation-driven hardening of clay-rock samples could increase the dynamic shear modulus when the degree of water saturation decreases in the range 0%–50%. Choi and Song [27] investigated the influence of SC-CO2, water and brine on the swelling of shale. The experimental results suggested that SC-CO2 has a greater effect on the swelling of the shale than pure water and brine. However, little consideration has been given to the influence of CO2 adsorption on shale strength. Meanwhile, shale strength is also influenced by the bedding angles. When the loading direction changes from parallel to normal to the bedding plane inclination, the shale strength will increase dramatically [40,41,42]. Therefore, the bedding angles for shale should also be considered while studying its mechanical properties.
In this study, we extend these previous works and investigate how subcritical CO2 saturation affects the mechanical properties of shale with coring angles parallel and normal to the beddings. The study involves an experimental program of UCS testing on shale samples saturated with subcritical CO2 at different durations. An acoustic emission (AE) system and ARAMIS technology are applied during the experiments.

2. Experimental Methodology

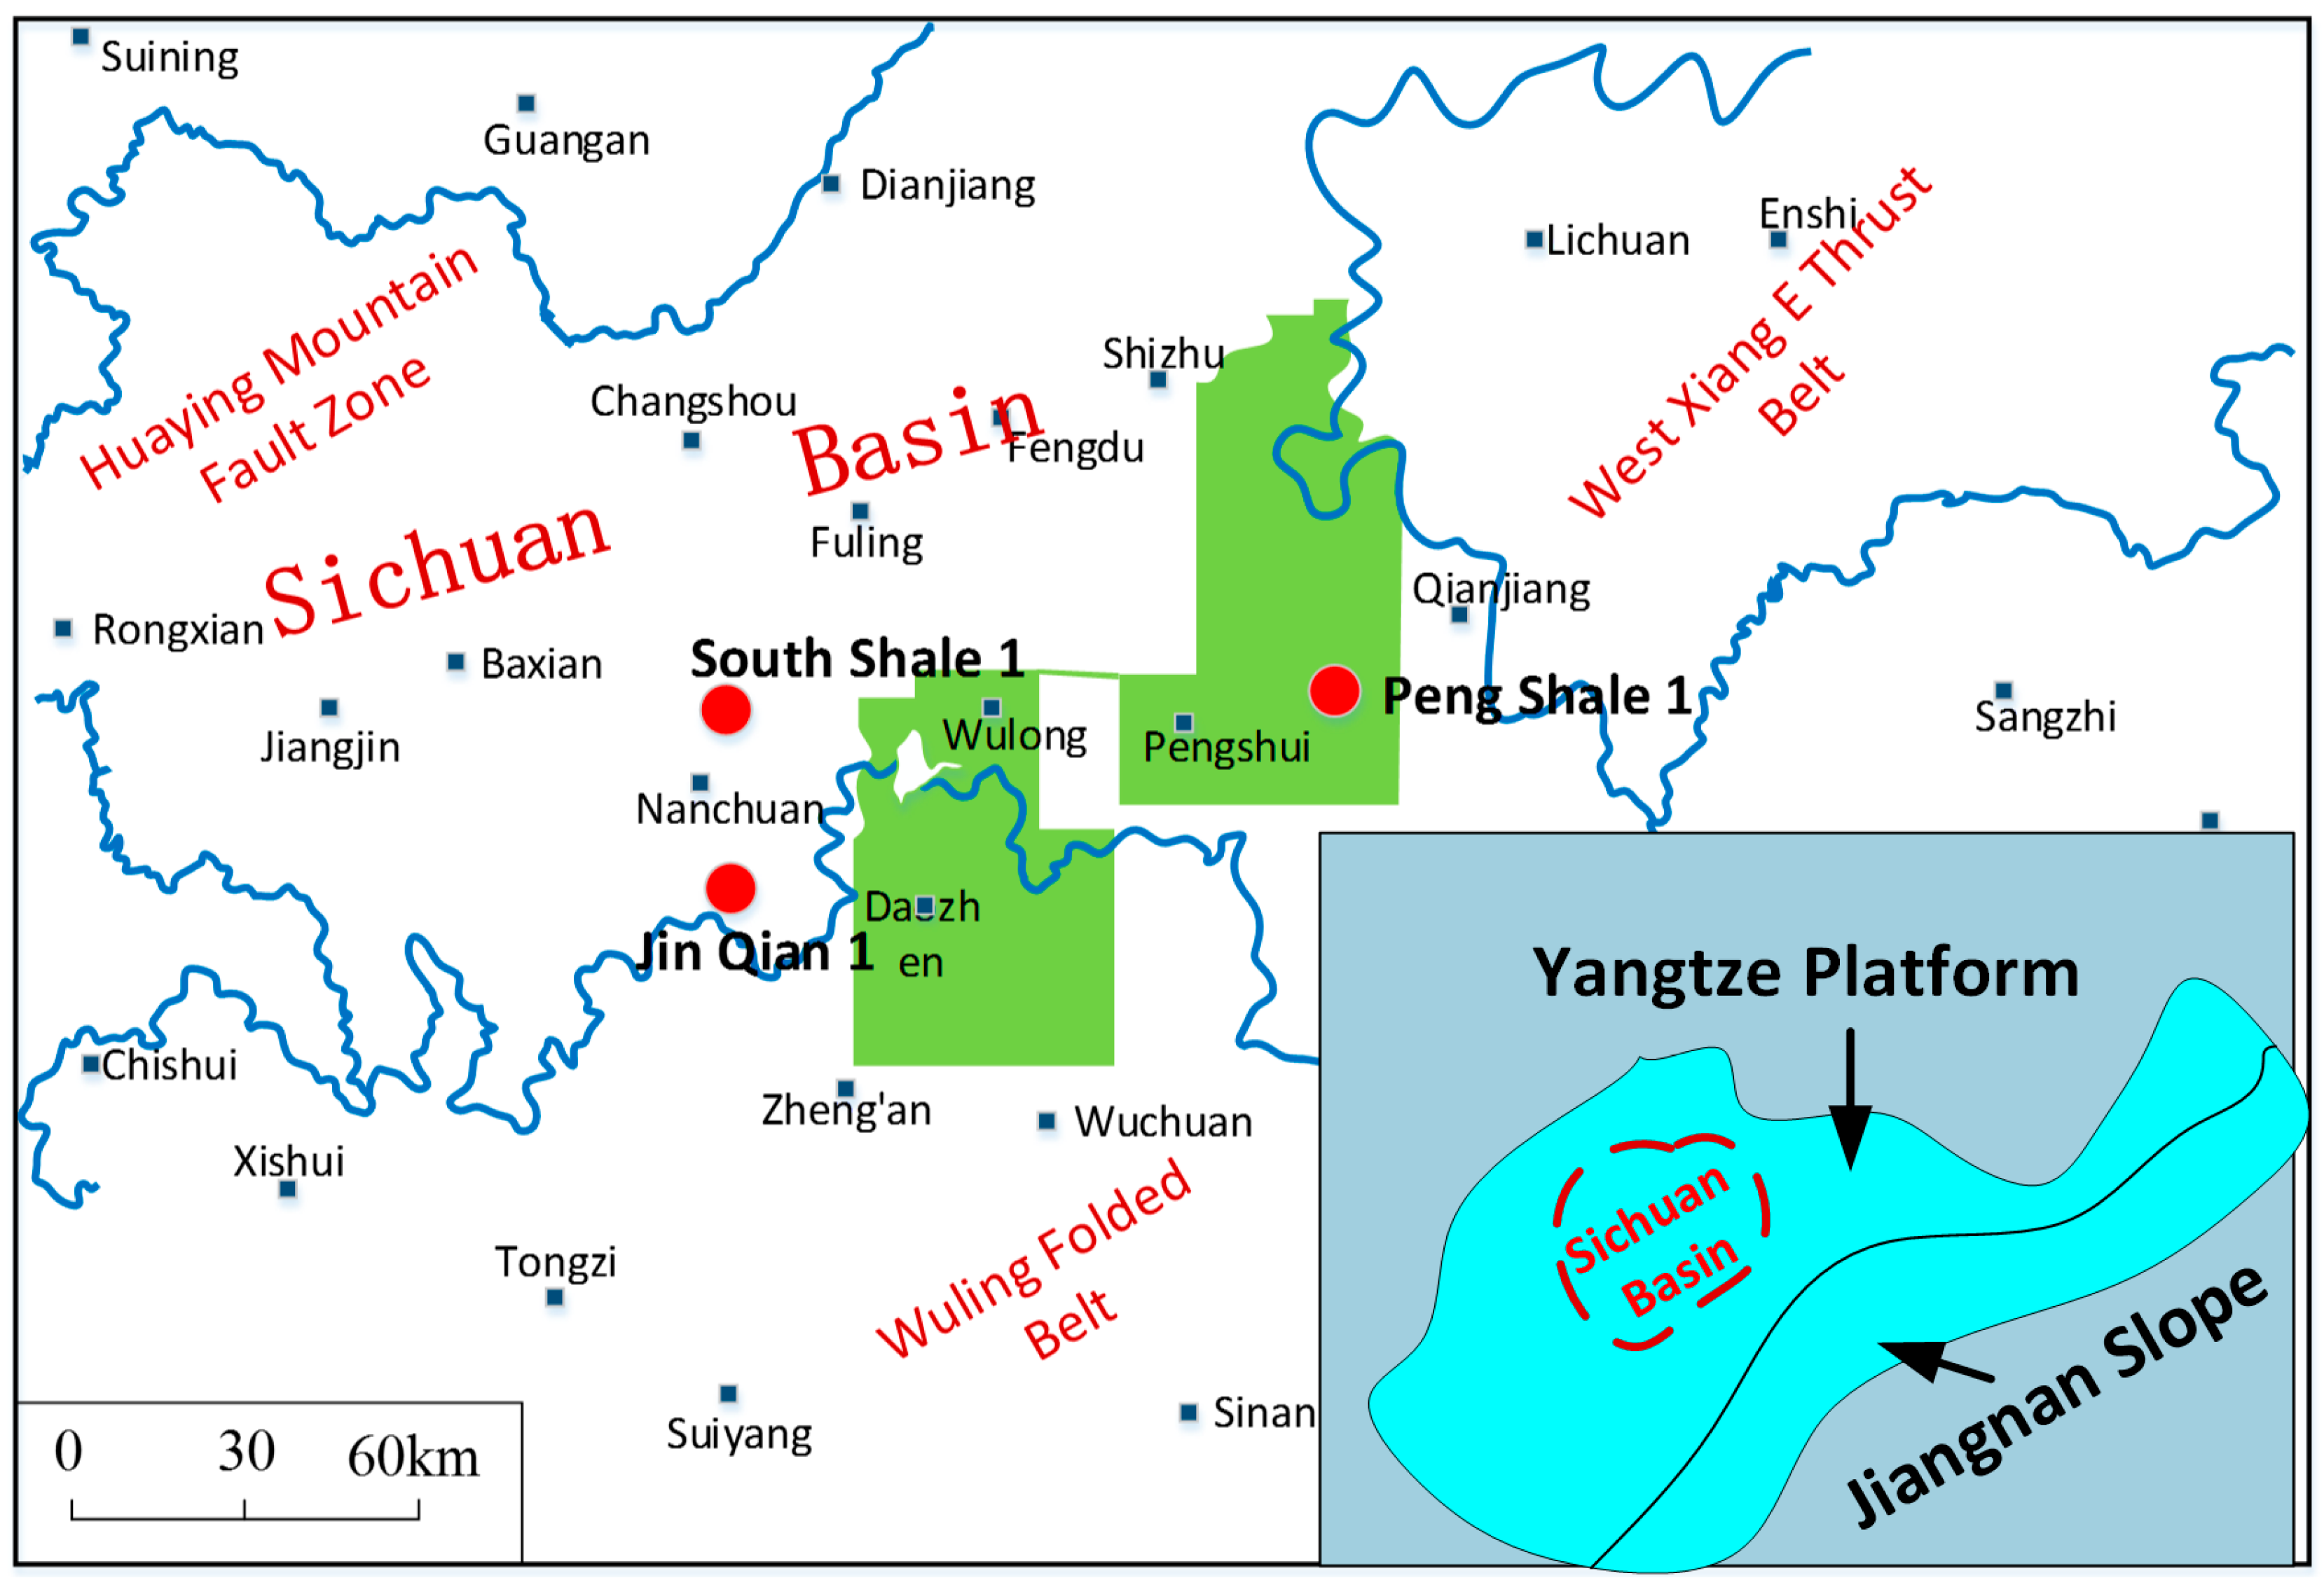
2.1. Sample Preparation

Shale samples used for the study were obtained from Sichuan basin, China. Figure 1 shows the paleogeographic and geological map of the location of the samples. This kind of Longmaxi shale has a moderate clay fraction of 40%. The initial water content and TOC content are 15% and 3.35%, respectively. The vitrinite reflection (Ro) is 2.1%. As a kind of outcrop shale, the samples have high moisture content. Referred to the ASTM standards, the specimens were cored with a diameter of 38 mm and a length of 78 mm. The top and bottom of the cored samples were ground to achieve smooth parallel surfaces for testing using a face grinder. These completed samples were double-sealed in polyethylene bags and stored in a fog room in Monash University.

2.2. Experimental Procedure

Before applying strength tests, samples were placed in a pressure cell which was filled with CO2. For the saturation process, the pressure cell with a newly developed high-pressure triaxial device was used, the details of which can be seen in [43]. With an advanced temperature control system, this device could offer a precise temperature of 40 °C.
While performing the saturation, samples were placed inside the pressure cell and then gas was injected into the cell until the target saturation pressure was achieved. CO2 adsorption of shale samples was conducted using a pressure of 7 MPa and adsorbing time of 10 days and 20 days. In addition, control tests were carried out on unsaturated shale samples with temperatures of 40 °C and 22 °C (room temperature). After the saturation period, the pressure cell was slowly depressurized to avoid any sudden change in pressure, which could damage the physical structure of the shale samples.
Then, UCS testing was carried out on the saturated samples. Axial load was applied at a constant strain rate of 0.24 mm/min until sample failure. Axial load and axial displacement were measured using a load cell. Axial and lateral strain were obtained by ARAMIS digital cameras. During the tests, an advanced acoustic emission (AE) system was used to detect energy release corresponding with the processes of fracture initiation, propagation and damage. The details of uniaxial compression machine, AE system and ARAMIS photogrammetry equipment are shown in [40].

3. Results and Discussion

Sixteen samples were tested; eight of them were compressed with a parallel direction to the beddings (group 1) and the others were tested with a normal direction (group 2). The axial stress and strain and AE response were recorded during the process. For each group, four unsaturated shale samples (two were heated by a temperature of 40 °C and the other were tested with a room temperature of 22 °C) were tested to compare with specimens with different sorption time. The experimental results will be discussed under three categories: (1) stress-strain characteristic; (2) acoustic emission response and (3) failure pattern.

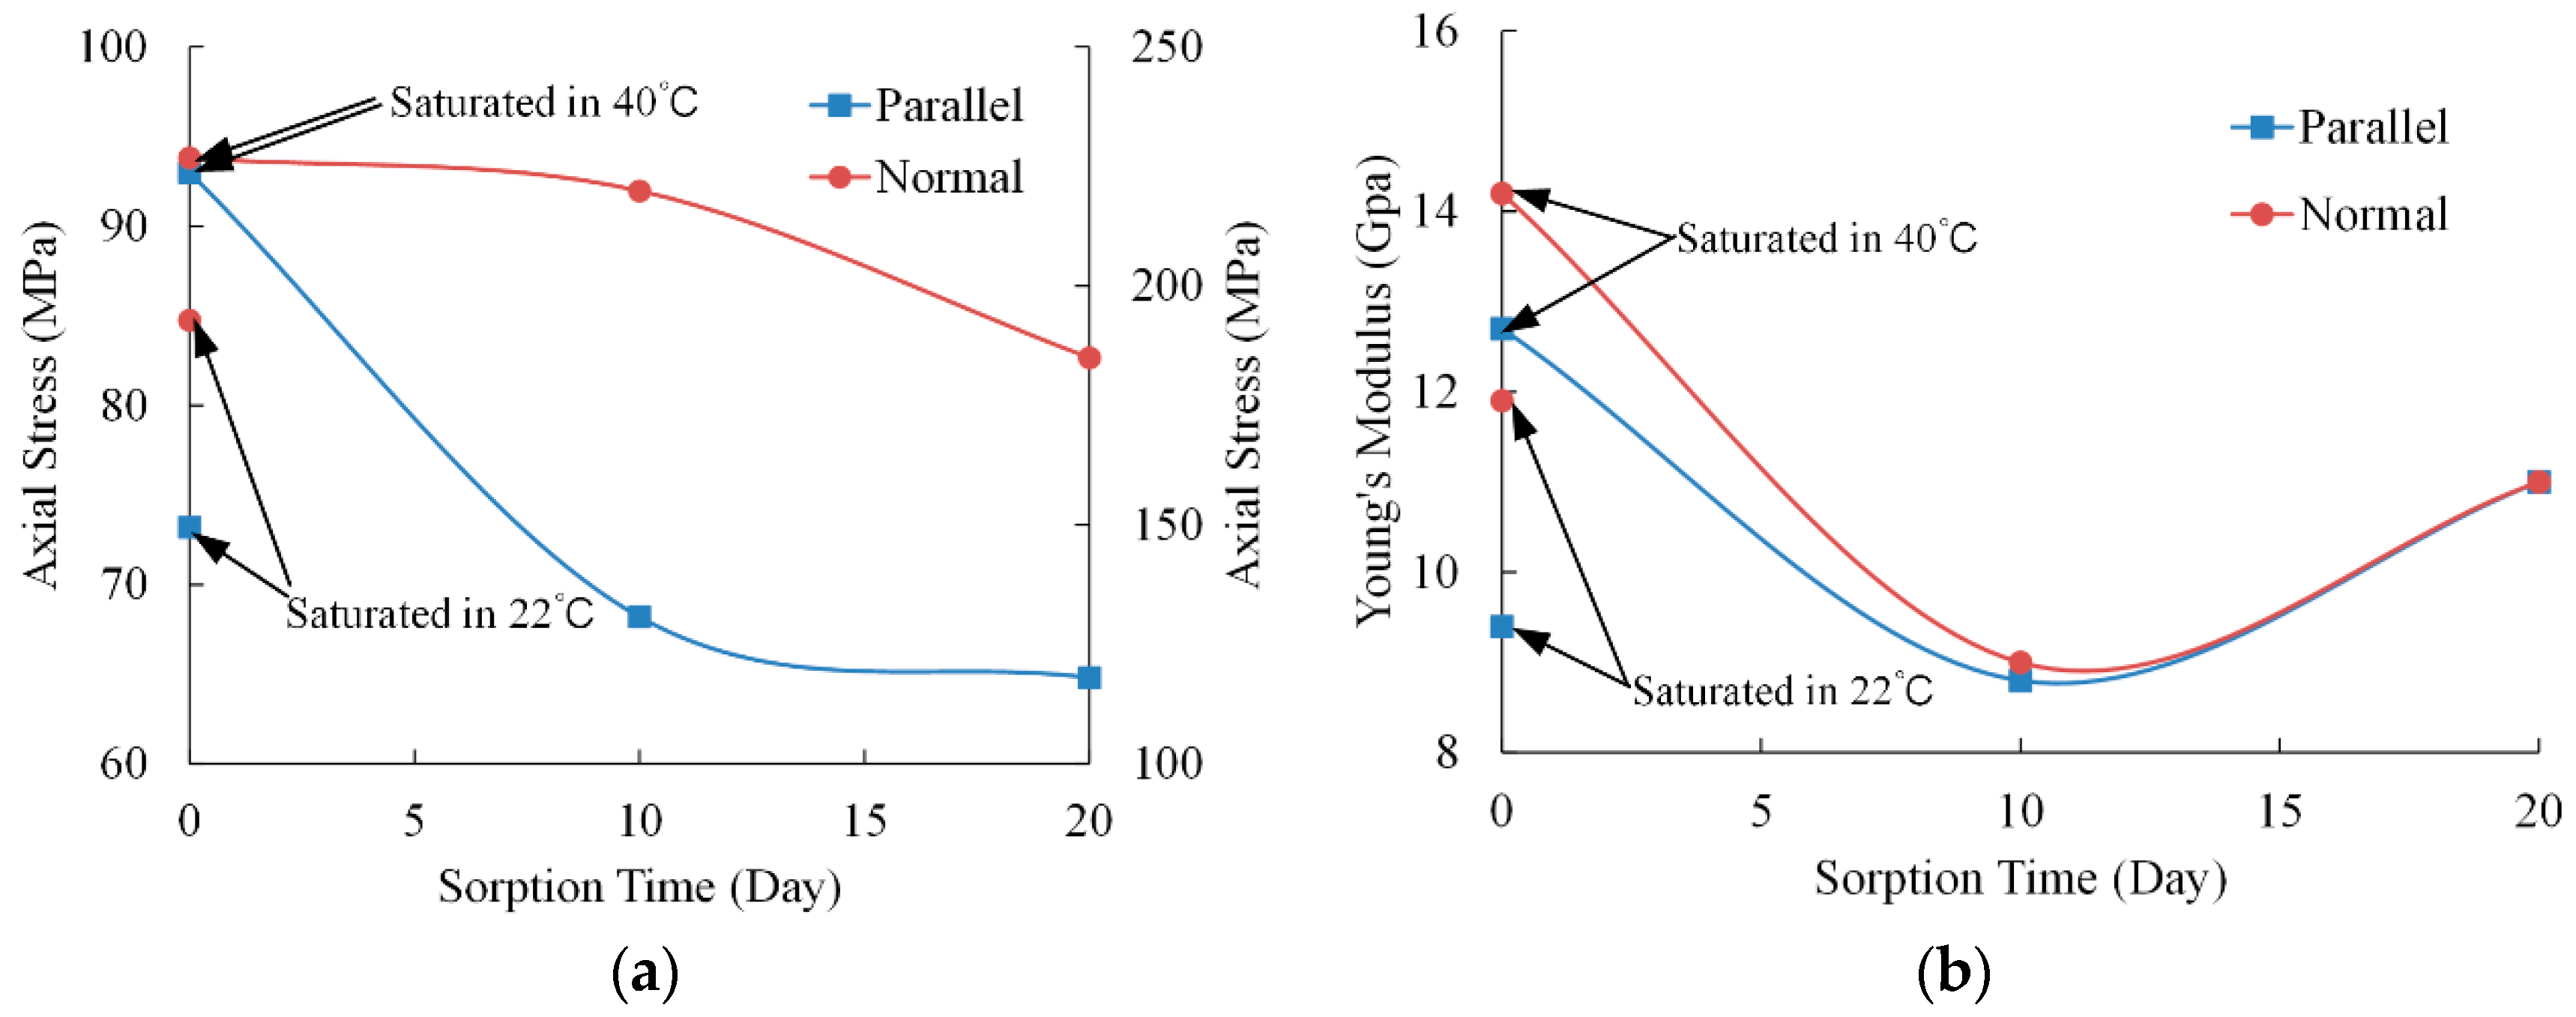
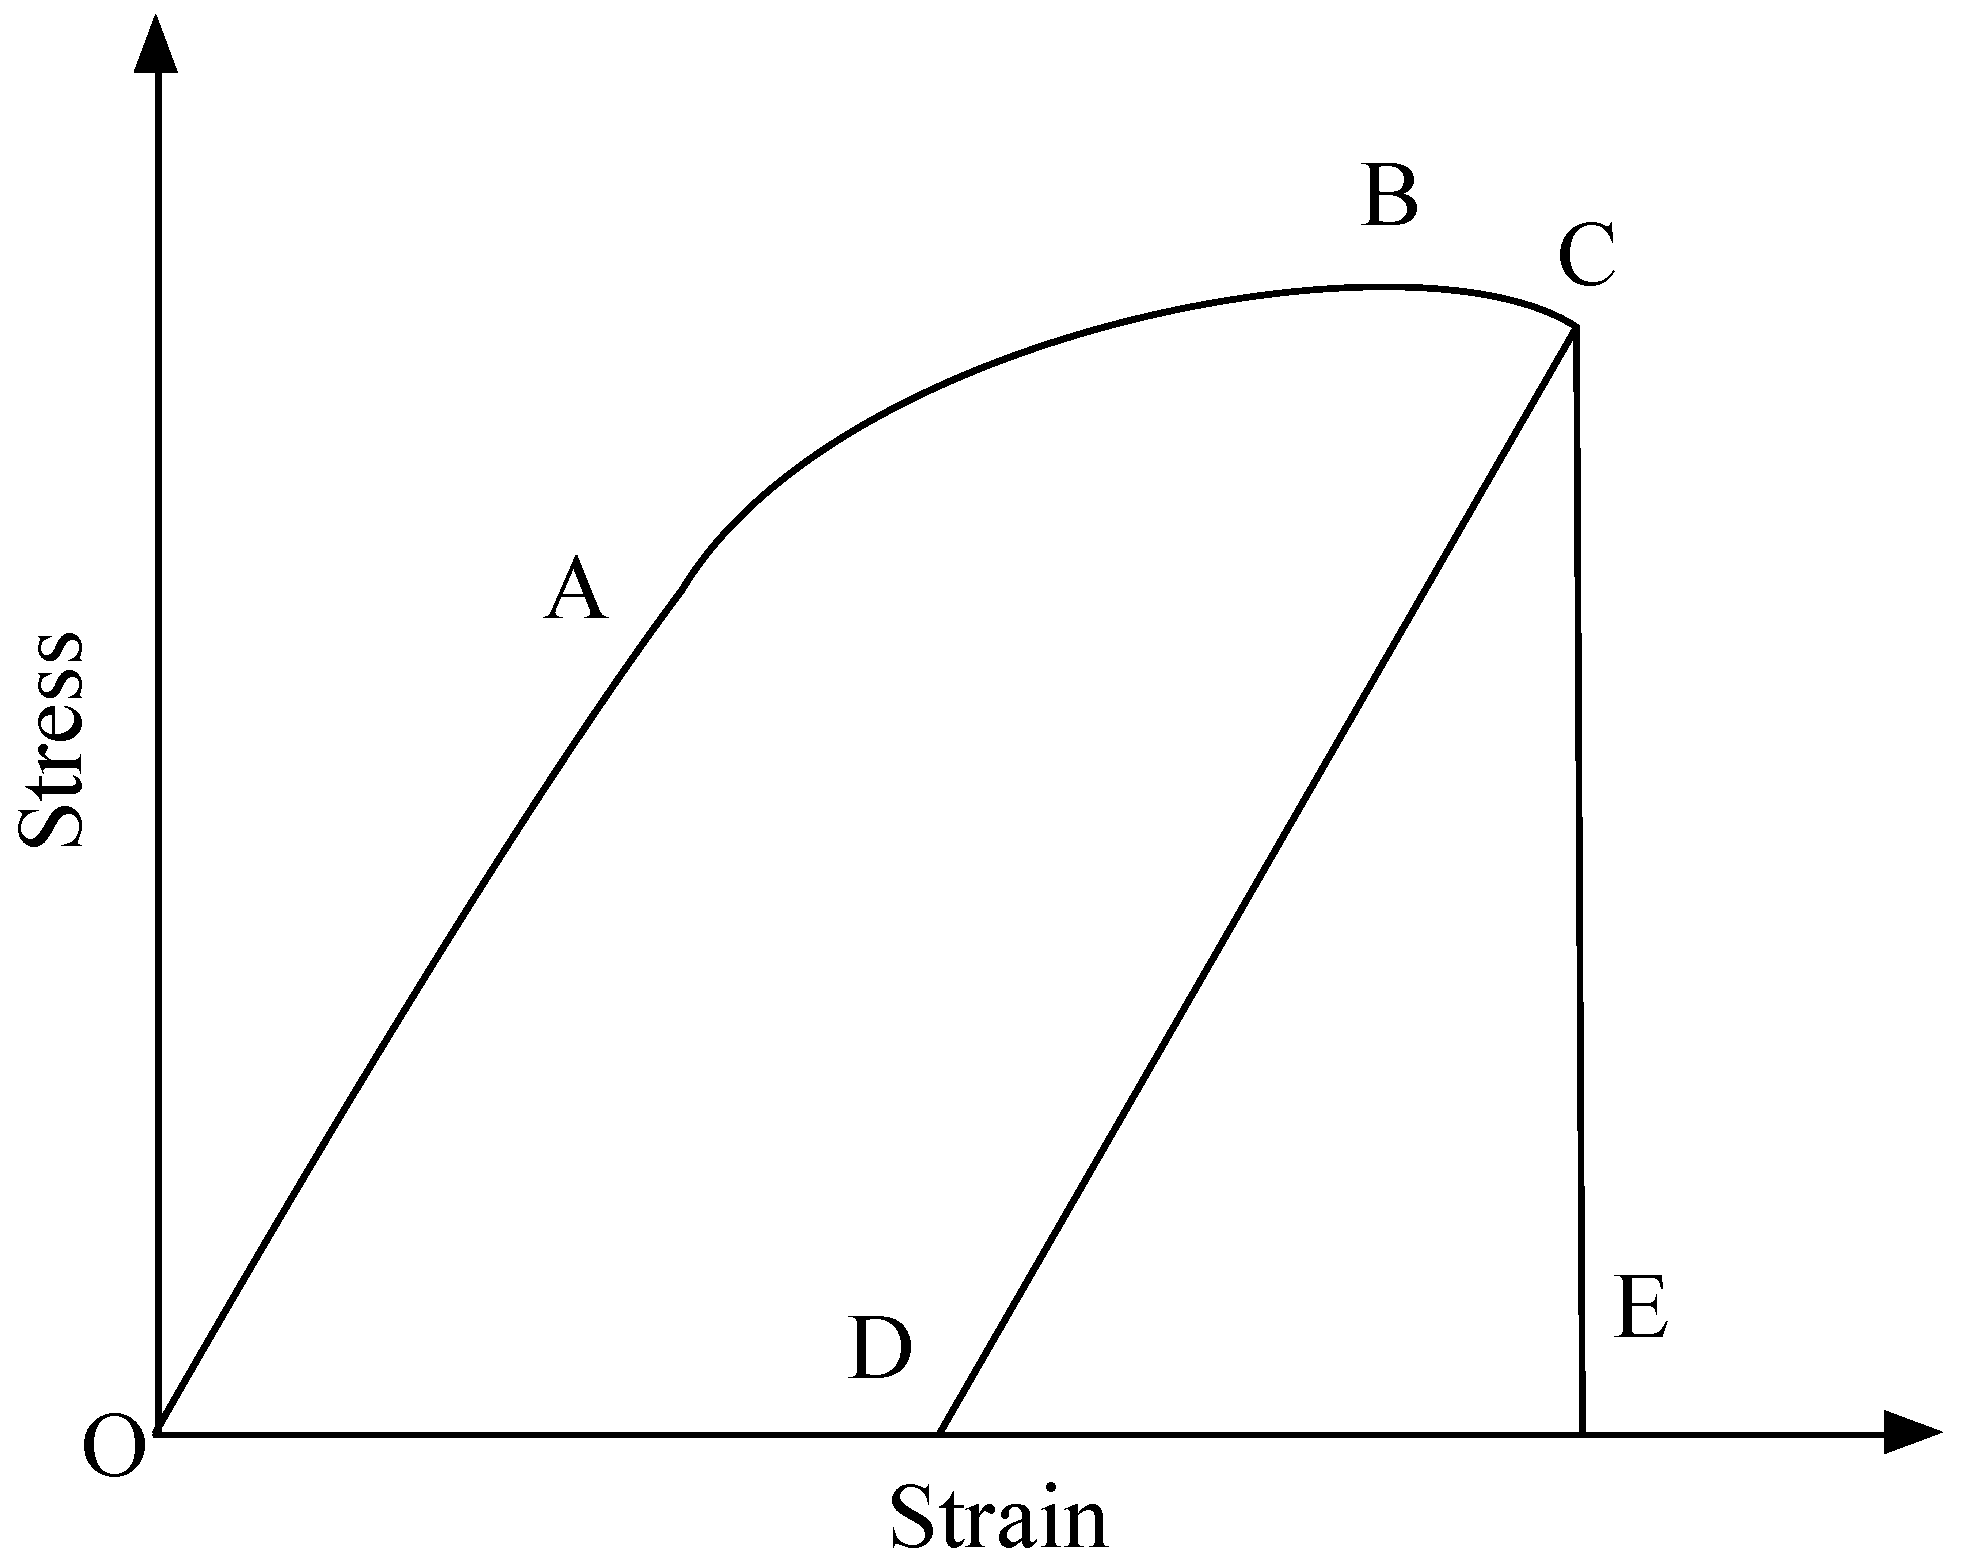
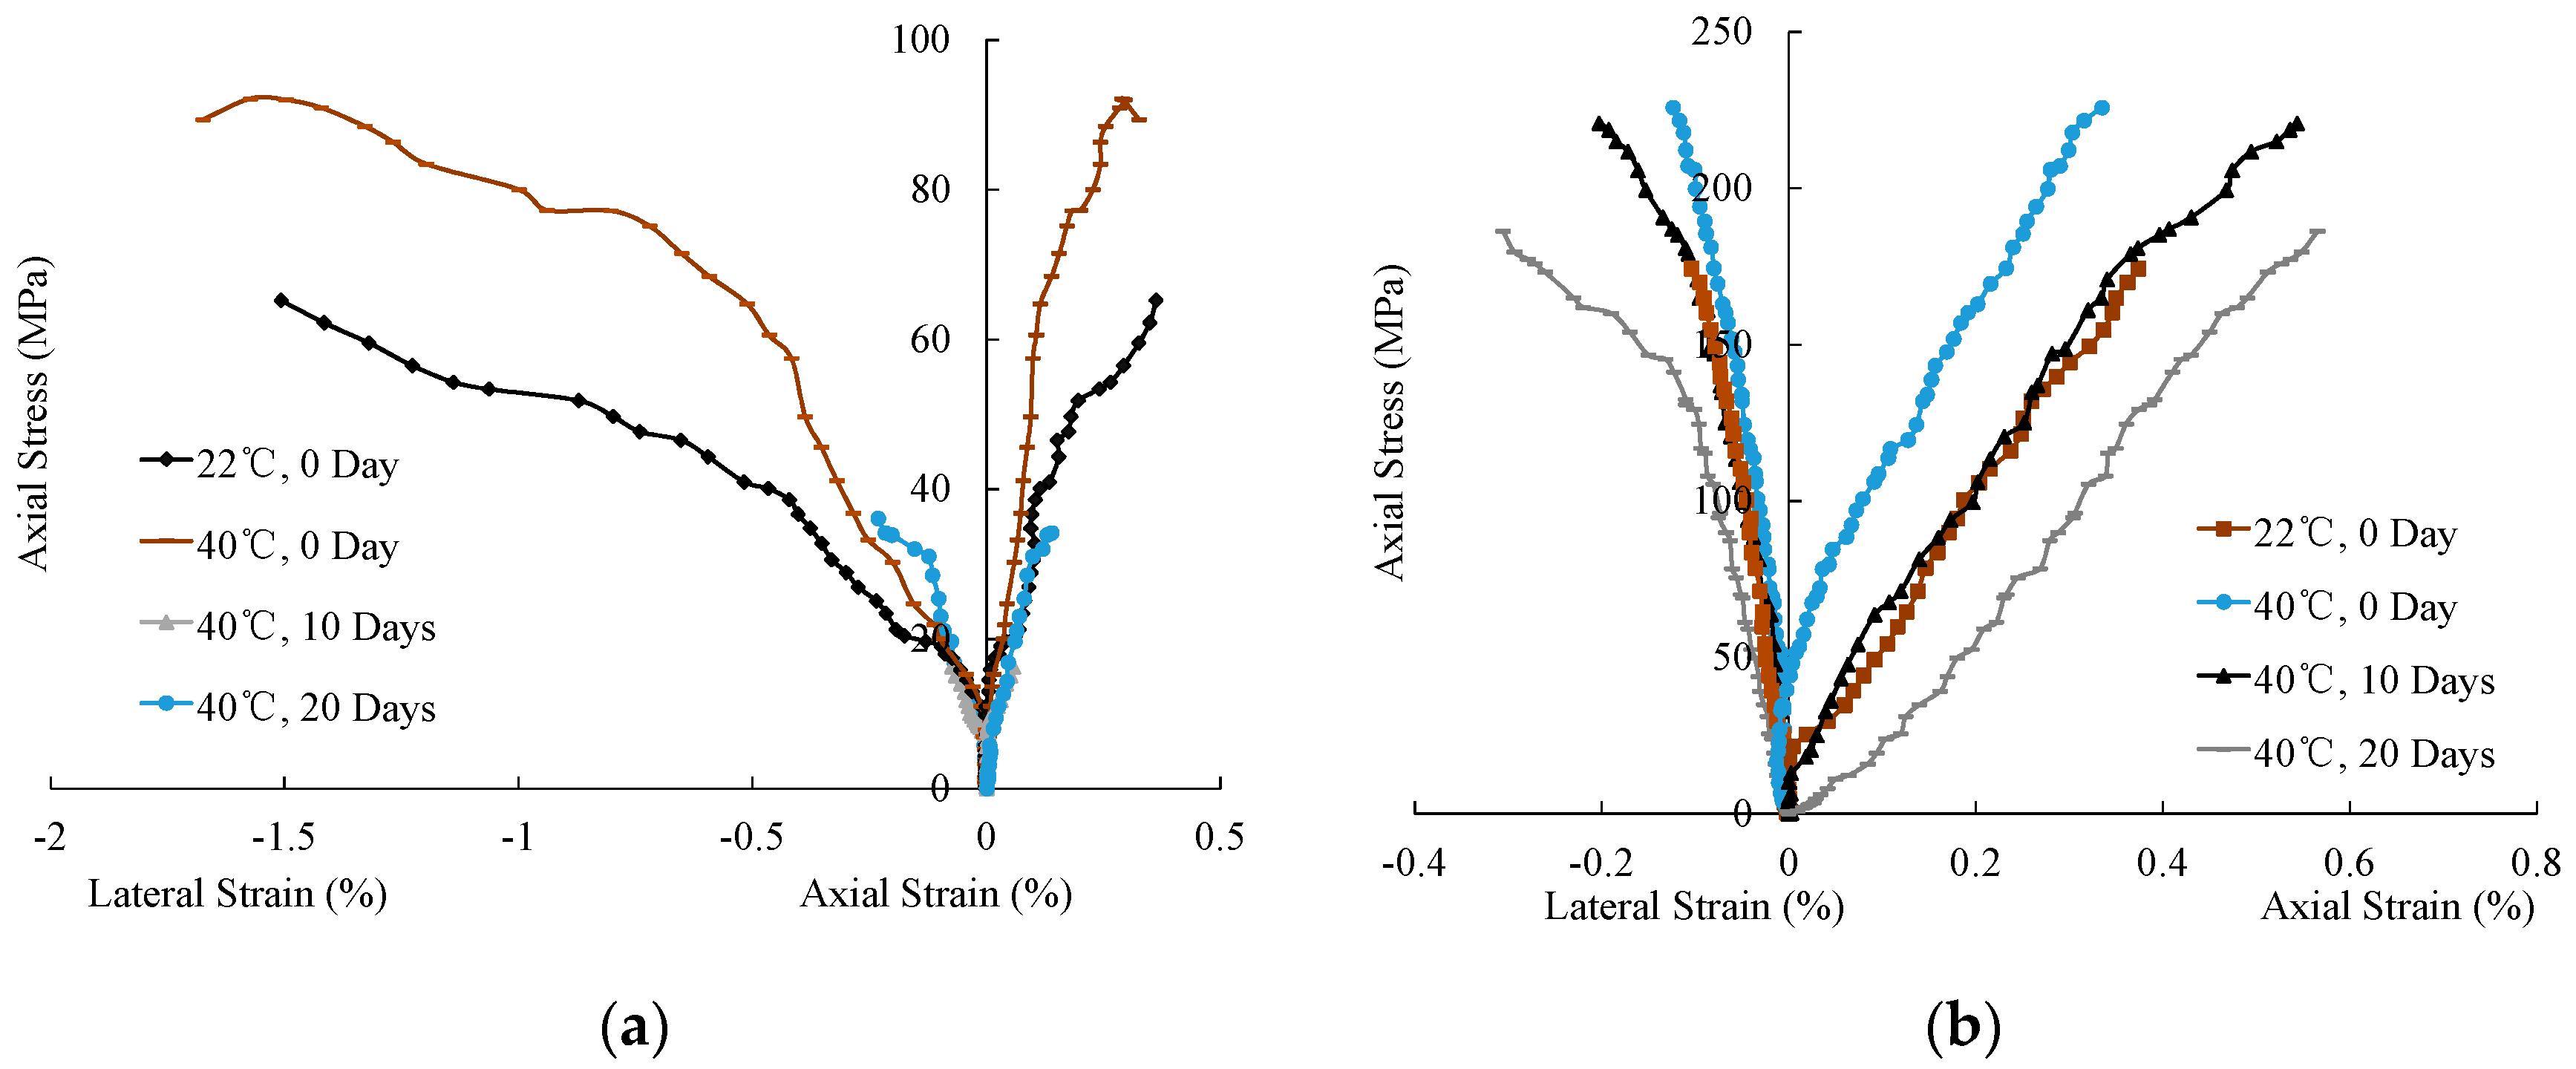
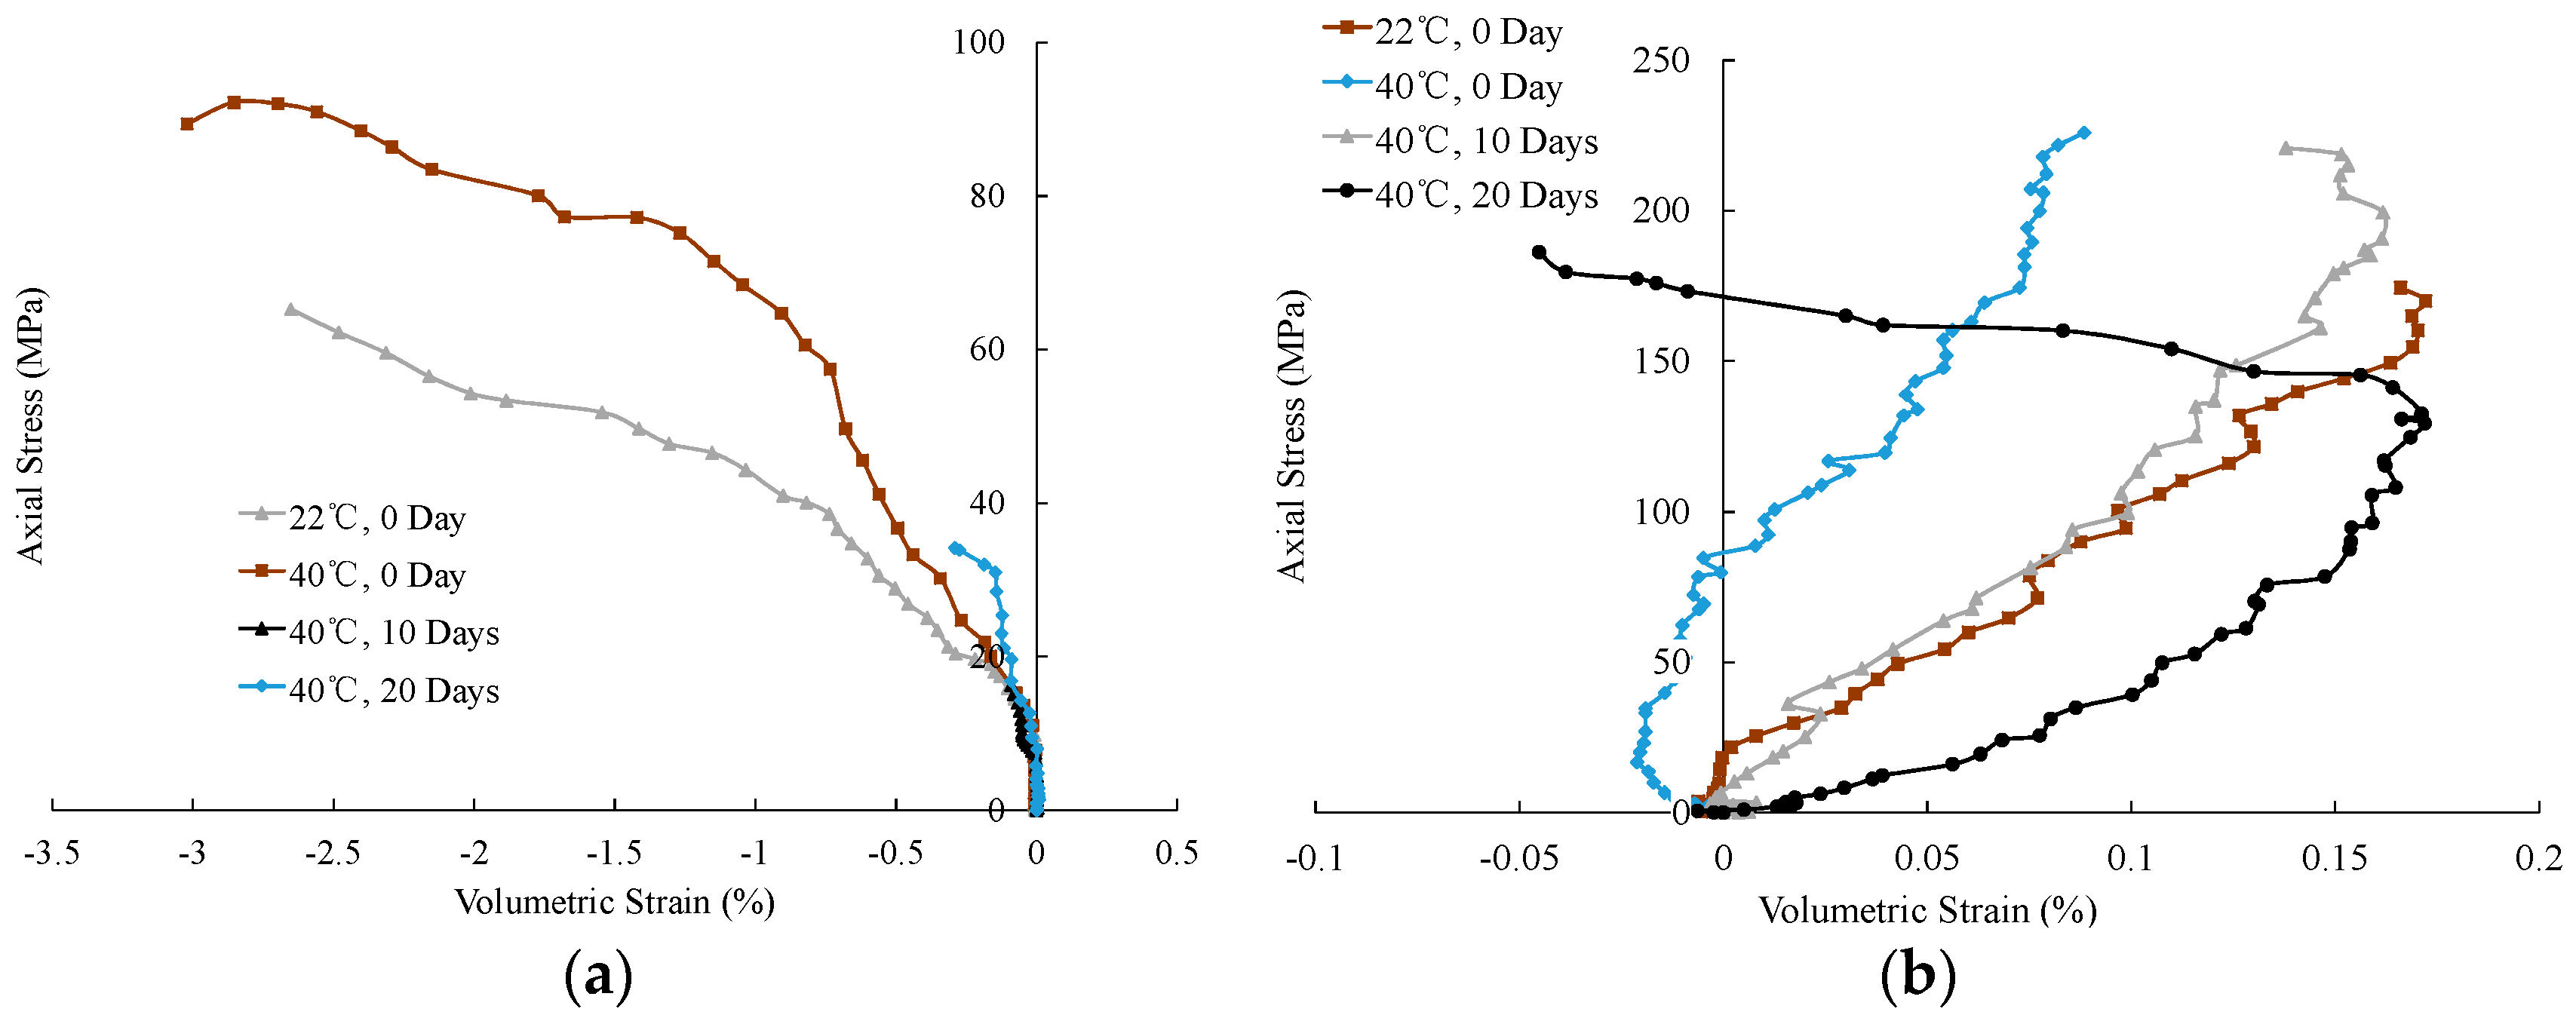
3.1. Mechanical Characteristics

Table 1 lists the UCS and Young’s modulus values obtained from the tests. The variations in the two parameters are presented in Figure 2. The Young’s modulus was calculated by choosing the average value among the half peak axial strength point on the stress-strain curves. As we can see from Table 1, the differences in values for mechanical properties between samples in each group (with same saturating condition) are minor. Thus, the tested samples are assumed to be uniform and close to their initial, intact condition. The average values of each group are considered in the following discussion as these results are suitable to represent the properties of samples under certain conditions.
According to Table 1 and Figure 2a, the UCS values of samples with a normal loading direction to beddings are much higher than that with a parallel direction. This is in accordance with the previous studies [40,41]. For the group with a parallel direction, when samples were heated in the oven with a temperature of 40 °C for 24 h, the UCS value increases from 73.2 MPa to 93.0 MPa. The reason for this strength enhancement is mainly because of the decrease of water content in shale samples after heating. Water content of shale is one of the main factors that will influence shale’s swelling potential and strength [44,45]. After 10 days’ CO2 adsorption within a temperature of 40 °C, the UCS value presents a reduction of 26.7% from 93.0 MPa to 68.2 MPa. While extending the adsorption time to 20 days, the UCS value continues to decrease and reaches 64.8 MPa. The decrease of water content after heating also causes the reduction of UCS value for samples compressed normal to the beddings. The values before and after heating are 192.8 MPa and 226.8 MPa, respectively. While adsorbing CO2 for 10 and 20 days, the strength decreases to 219.9 MPa and 185.0 MPa, respectively. According to Middleton and Carey [9], shale gas exists in natural fractures, porous matrix and kerogen. Methane, which is a major component of shale gas, has only 1/3 to 1/2 adsorptive capacity when compare to carbon dioxide [14]. The adsorption of carbon dioxide will cause shale swelling [46], and then the strength decreases. From Figure 2a, we can also see that, for samples tested parallel to the beddings, the uniaxial compressive strength decreases dramatically in the first 10 days, then the curve turns gentle in the second 10 days. However, for samples loading at a perpendicular angle, the large variation in strength happens at the second 10 days. This is because shale samples have a high level of permeability. Carbon dioxide first adsorbed by macro and micro fractures and porous matrix and it will take a long time for kerogen to capture CO2. In the first 10 days, CO2 is mainly adsorbed by fractures and matrix; the adsorption by kerogen mostly happens in the second 10 days. For samples with a parallel bedding angle, more axial splitting fractures appear when failures occur. While for samples with a normal bedding angle, the brittle break patterns are complex, seldom axial artificial fractures occur. Therefore, in the first 10 days, the swelling caused by the natural fractures and matrix has higher influence on the strength of shale samples with a parallel bedding angle.
The adsorption of subcritical carbon dioxide also creates a variation of Young’s modulus of shale samples, as shown in Table 1 and Figure 2b. According to Table 1 and Figure 2b, after 24 h’ heating, both the samples with parallel and normal angles present increasing trends on Young’s modulus. Specifically, the value for samples with a parallel bedding angle increases from 9.4 GPa to 12.7 GPa, while the normal one changes from 11.9 GPa to 14.2 GPa. It can be seen that water content will influence the plasticity of shale. Lower water content shows higher stiffness of shale samples. Within 10 days’ CO2 adsorption, the Young’s modulus of the parallel group decreases 30.7% to a value of 8.8 GPa, and the normal group presents a higher reduction of 36.7%. Interestingly, after 20 days’ adsorption, the two kinds of shale reach to the same value of Young’s modulus (11.0 GPa). The difference of Young’s modulus between samples with a parallel bedding angle and a perpendicular bedding angle is because samples with a perpendicular bedding angle have much higher UCS values, while the axial strains for the two kinds of shales are similar. With longer saturation time, more carbon dioxide will diffuse into pore network, which is absorbed on the surface of pores. The adsorption of CO2 will increase the volumetric strains of shale [34], and will decrease shale’s elasticity and enhance the stiffness. As the adsorption continues to a more sufficient level, the rearrangement of shale’s microstructure weakens the anisotropy. The increase of Young’s modulus for parallel bedding samples saturated in CO2 for 20 days may be caused by the swelling of samples extended the crack closure stage but shortened the unstabled crack propagation stage. During the linear elastic period, same axial strain needed more axial load.
From the testing results, it is clearly that carbon dioxide saturation has significant effect on shale strength, and samples with different coring directions have similar variation trends. However, the decrease of strength with CO2 saturation is obtained from insufficient saturation time. For carbon capture storage (CCS), the adsorption time should be much longer.
The axial/lateral strain-axial stress curves can be used to explain the difference of strain variations for shale samples with parallel and normal bedding angles before and after CO2 adsorption. The stress-strain behaviours of the two kinds of samples are shown in Figure 3. Because the artificial fractures appear on the surface of the samples with a parallel angle during the UCS tests, the ARAMIS camera cannot obtain enough data to draw the strain variations, while samples with a normal angle reach the failure suddenly, therefore the complete stress-strain curves are available. According to Figure 3, it is clear that, for samples with a normal bedding angle, the axial strains are higher than the lateral strains when the axial loadings and saturation conditions are the same. Meanwhile, for samples with a parallel bedding angle, the lateral strains are higher than the axial strains. Lyu and Ranjith [40] showed that, for samples with a parallel bedding angle, the axial stress will break the beddings or bend the beddings which will increase the lateral strain, while the variation of axial strain is very small. However, for samples having a normal bedding angle, the cracks between beddings is easily compressed. The closure of cracks will increase the axial strain while the lateral strain is hard to be changed. When the two kinds of samples are heated for 24 h, the axial and lateral strains will be smaller than the samples with room temperature. This is mainly because the loss of water in shale causes the sample shrinkage. During the compressing test, it will take more axial stress to bend beddings for samples with a parallel bedding angle and the cracks between beddings and fractures in samples with a normal bedding angle become smaller. Therefore, the strains of samples decrease after heating. When samples absorb CO2, the stress-strain variations will be different. As the lack of data for samples in the parallel group, we can only analyse the results of samples with a normal bedding angle. When the adsorption time is 10 days, the samples’ axial and lateral strains increase and the stress-strain curves are basically in coincidence with the results of samples at room temperature. After 20 days’ adsorption, shale samples have the highest axial and lateral strains among the specimens when the axial stress is the same. This is mainly due to the adsorbed CO2 changing the pore structures of shale samples, causing shale swelling.
During the UCS tests, the crack initiation, which can cause shale dilatancy, can be depicted by volumetric strain. For the calculation, we define the axial and lateral strains as positive for compression and negative for expansion [47].
The axial stress-volumetric strain curves for the two kinds of samples are shown in Figure 4. A positive value of volumetric strain means compaction and negative values present dilatancy. As shown in Figure 4a, all samples with a parallel bedding angle show dilatancy during the UCS tests. From Figure 4b, one can see that compaction is the main characteristic for sample with a normal angle. Specifically, for samples with room temperature, the volumetric strain increases with increasing axial stress. It reaches the maximum value when the stress is about 155 MPa, then the volumetric strain begins to decrease. Similar trend happens to samples absorbed 10 days of CO2 which have an inflection point under an axial stress of 195 MPa. For samples just heated for one day, dilatancy happens at the beginning of compression. When the loading increases to 90 MPa, the volumetric strain is equal to the value before compression, and then samples present compaction characteristics. As samples saturated in CO2 for 20 days, the maximum volumetric strain occurs when the axial stress is 130 MPa. Then, the strain begins to decrease and ends with a negative value. The results show that CO2 adsorption can enhance the dilatancy of shale samples in UCS tests, especially for samples with a normal bedding angle.
There are several methods that can be used to measure the brittleness index of rocks, like the strain based approach, reversible energy based approach, Mohr’s envelope based approach, strength ratio based approach, special test based approach and petrophysical interpretation [48,49]. In this study, the strain based approach which is defined by [50] is shown in Figure 5.
The brittleness can be calculated by the following equation [50]
B I = R e v e r s i b l e   s t r a i n T o t a l   s t r a i n = D E O E
The brittleness indices for all groups of samples were calculated from the stress-strain curves, as listed in Table 2. From Table 2, we can see that, samples with a normal bedding angle have higher brittleness index than that with a parallel bedding angle. This is in accordance with the results that samples with a normal bedding angle have higher UCS values than that with a parallel bedding angle, while the strains for the two kinds of samples are similar. More interestingly, temperature change and CO2 adsorption have little effect on the brittleness of shale samples with a normal bedding angle. This is mainly because the brittleness for such shale samples is ultrahigh and stable. The change of adsorbing conditions can only produce a very small fluctuation which could be ignored as errors in experiments and the anisotropy of samples. However, for samples with a parallel bedding angle, the increase of temperature causes a decrease of brittleness index from 64.31% to 57.92%. This may be because the loss of water when temperature increases leads to shale shrinkage. The cracks in the samples become smaller and the ductility increases. When samples adsorbed CO2 for 10 and 20 days, the brittle index increased to 62.98% and 70.26%, respectively. This tendency is caused by the swelling of shale after absorbing CO2.

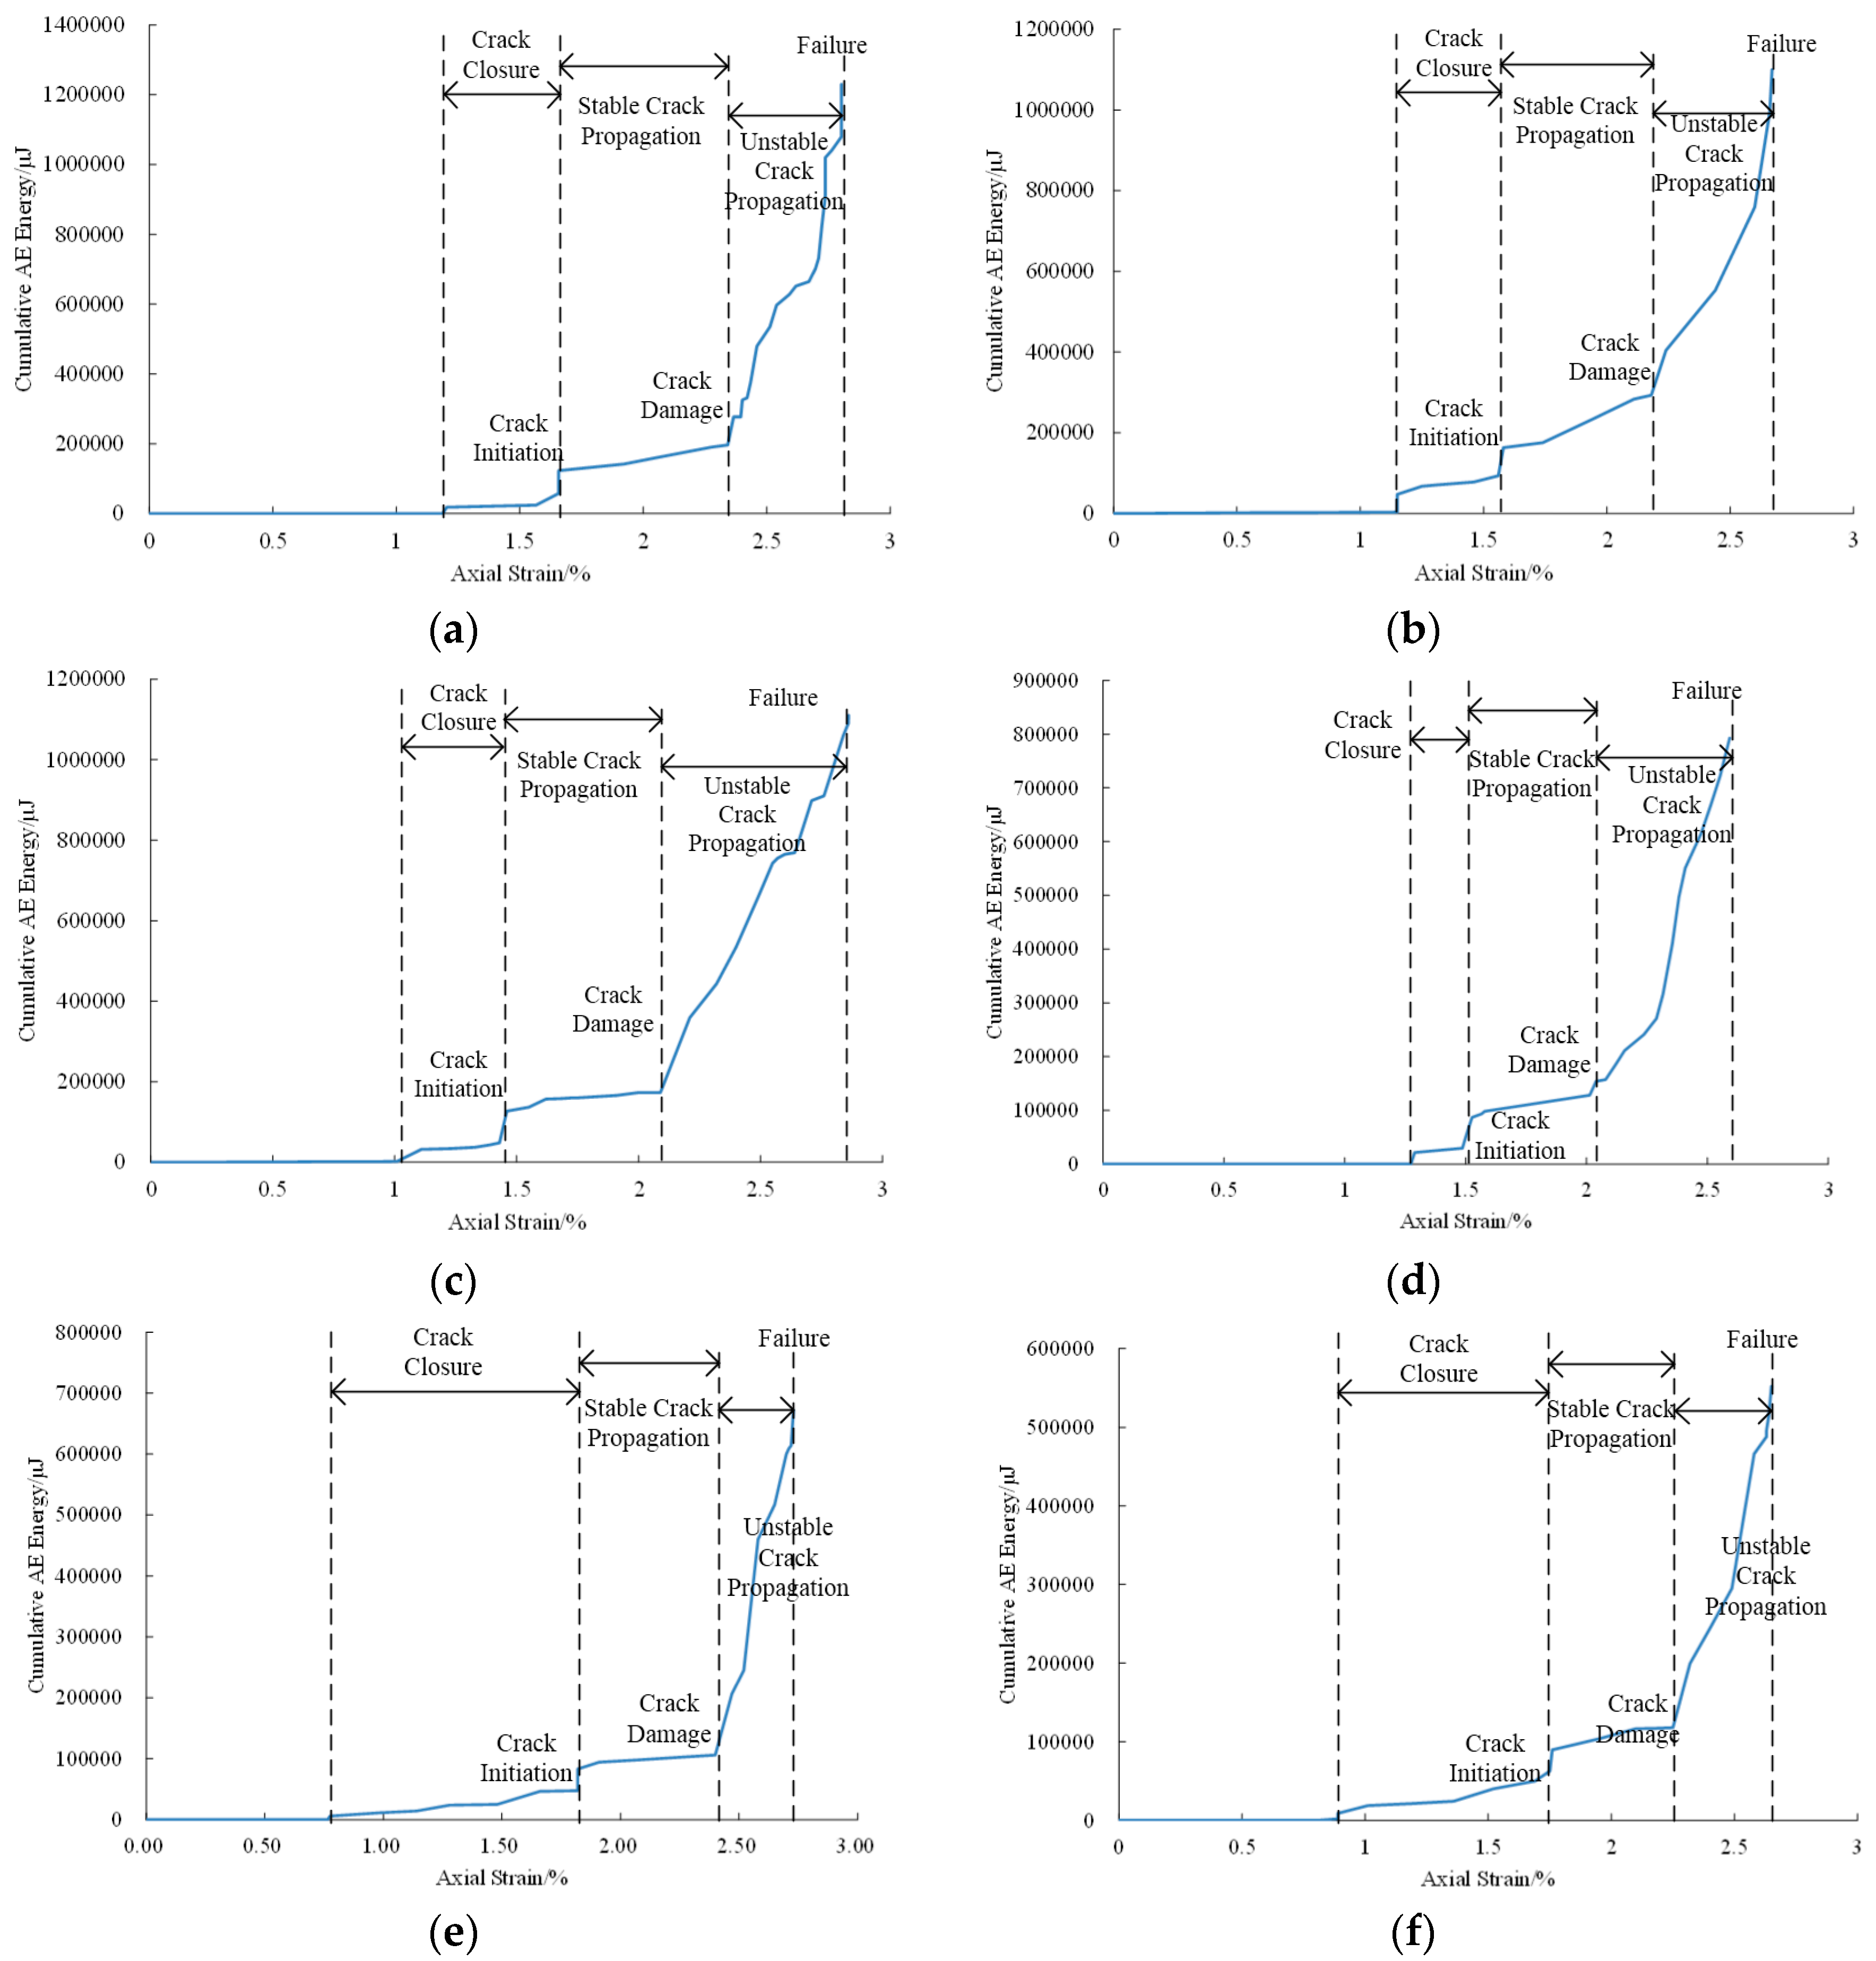
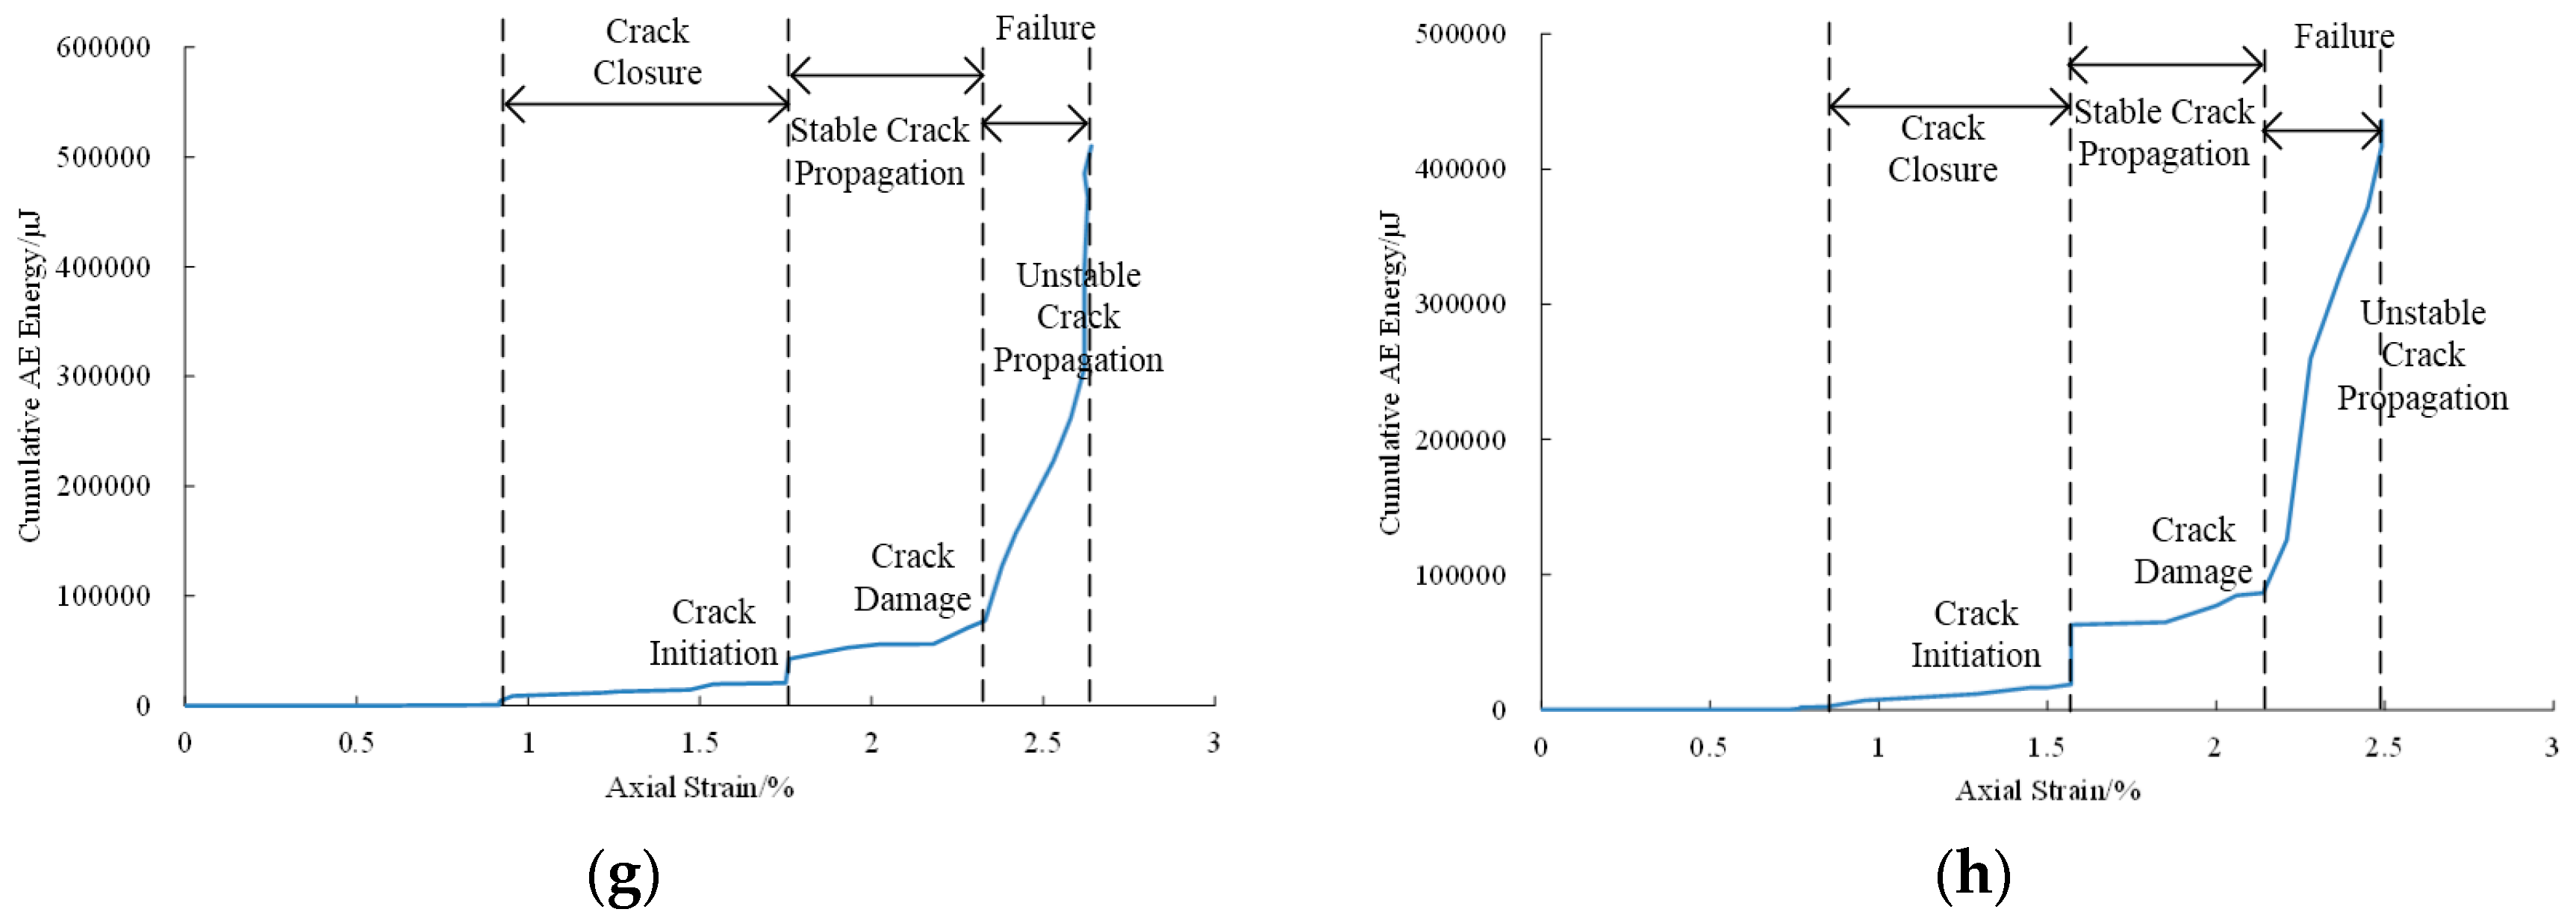
3.2. Acoustic Emission Response

AE technology is used to identify the fracture propagation during the uniaxial compressive strength tests. Based on the previous study, the compression of brittle rocks can be divided into three stages: crack closure, stable crack propagation and unstable crack propagation [19,40,51]. The rock sample in the crack closure stage shows no significant AE energy release. Then, as the axial loading increases gradually, the AE released energy will increase at the same time and the rock mass goes into the second stage- stable crack propagation. When the sample comes into the unstable crack propagation stage, the AE energy release will increase exponentially until the failure occurs. The cumulative AE energy versus axial strain of samples with parallel and normal bedding angles under different saturation conditions are shown in Figure 6. The strain variations in the first and last stages and the peak cumulative AE energy release are listed in Table 3.
According to Figure 6 and Table 3, for each kind of bedding direction, samples adsorbed CO2 for 20 days have the highest cumulative AE energy, while the no-adsorption but heated samples have the lowest values. Samples with room temperature have the similar cumulative AE energy release to samples adsorbed 10 days’ CO2 with a temperature of 40 °C. The results show that the decrease of water content will reduce the total released AE energy and the adsorption of CO2 will enhance the AE energy release. This is mainly because water in fractures and pores contributes the conductivity of acoustic emissions. Meanwhile, hydrocarbons created by the combination of CO2 and water enhance the AE energy conductivity, even small acoustic emissions can be obtained by the AE sensors. Also, the crumbling of hydrocarbons can create more AE energy. Moreover, lower brittleness index means higher plasticity. Samples with a parallel bedding angle can bear loading after the peak axial strength, and the counts and acoustic energy keep increasing, while samples with a perpendicular bedding angle fail after the peak UCS value. This can also be seen from the ARAMIS results in Table 4.
When comparing the AE results between samples with a parallel angle and a normal angle, we can see that the parallel group has higher AE energy release than the normal group. Considering the fractures created by the uniaxial compression, as shown in Table 4, it is clear that samples with a parallel bedding angle exhibit more fractures than those with a normal angle. The appearance of fractures can produce much AE energy release. This is why the paralleled samples have higher AE energy release. Because of the anisotropic of the shale samples, the strain regions of samples with the same bedding angles have no obvious regulation in crack closure stage and unstable crack propagation stage. However, for samples with different bedding angles, the gaps are considerable. Samples with a parallel bedding angle have narrower strain variations in the crack closure stage and wider strain variations in the unstable crack propagation stage than the samples with a normal bedding angle. When the loading direction is normal to the beddings, the cracks between beddings will close in the crack closure stage. For samples with a parallel bedding angle, this kind of crack will exist even if the failure occurs. Therefore, the first stage for samples with a normal bedding angle is much wider. When samples are in the unstable crack propagation stage, many fractures will appear for samples with a parallel bedding angle, while the normal angle samples will reach the failure suddenly, as shown in Table 4. Thus, samples with a parallel bedding angle will spend a longer time in the unstable crack propagation stage.

3.3. Failure Pattern

ARAMIS digital image technology was used in the study to investigate the failure mechanism of specimens saturated in different conditions. Table 4 shows the ARAMIS images of the strain distribution and failure mechanism of samples at failures during UCS tests. According to Table 4, samples with a parallel bedding angle have much more fractures than the samples with a normal bedding angle, and most of the fractures appear on the weakest parts of the samples and have the same direction as the beddings. The fractures through the whole sample show that samples with a parallel bedding angle have an axial splitting failure pattern. Samples with a normal bedding angle all broke into pieces when failure occurred. Therefore, it is difficult to define their failure patterns. The effect of CO2 saturation on shale samples’ failure patterns is not significant. This may be because the images only show the macro fractures of the surface, and the micro fractures inside the samples cannot be obtained. Moreover, the bedding angles have much more influence on the failure patterns on samples than the CO2 adsorption.

4. Conclusions

The influence of subcritical carbon dioxide on the mechanical properties of shale obtained from the Sichuan basin in China was investigated by a series of uniaxial compressive strength tests together with AE technology and an ARAMIS photogrammetry system. Some essential conclusions can be drawn as follows:
Samples with a normal bedding angle have much higher UCS values than the samples with a parallel bedding angle. When compared to samples heated by a temperature of 40 °C, samples with parallel and normal bedding angles at a room temperature of 22 °C showed a reduction of 21.3% and 15.0% in uniaxial compressive strength, and 26.0% and 15.9% in Young’s modulus, respectively. A 10-day CO2 adsorption with a temperature of 40 °C and pressure of 7 MPa caused 26.7% uniaxial compressive strength reduction, and 30.7% Young’s modulus reduction for samples with a parallel bedding angle, respectively. When the adsorption time was extended to 20 days, both the values saw reductions of 30.3% and 13.8%, respectively. For samples with a normal bedding angle, reductions of 3.0% and 18.4% for uniaxial compressive strength and 36.7% and 22.6% for Young’s modulus were observed after 10 days and 20 days’ adsorptions, respectively. The mechanical properties weakening is partially due to the temperature changing and causing water content variation and the swelling caused by CO2 adsorption, which created hydrocarbons. The increase of Young’s modulus from 10-day adsorption to 20-day adsorption is mainly because the penetration of CO2 into pores weakens the elasticity and enhances the stiffness of shale.
For samples with a normal bedding angle, the axial strains were higher than the lateral strain when the axial loading and saturation conditions were the same, while for samples with a parallel bedding angle, the lateral strain was higher. Meanwhile, longer CO2 adsorption caused higher axial strains and lateral strains for the two kinds of samples under the same loadings. The adsorption of CO2 also enhanced the occurrence of dilatancy for shale samples in UCS tests. Samples with a normal bedding angle presented a higher brittleness index than those with a parallel bedding angle. The increase of temperature and adsorption of CO2 have no effect on the brittleness values of samples with a normal bedding angle. However, for samples with a parallel bedding angle, the brittleness value decreases with the increase of temperature and increases with increasing adsorption time.
AE tests results showed that samples with a parallel angle had higher AE energy release than the samples with a normal angle, and samples with longer CO2 adsorption times presented higher cumulative AE energy release. This is due to the hydrocarbons in shale samples, which increase the acoustic emission conductivity and create more AE energy while being crumbled. The strain distribution and failure mechanism obtained from ARAMIS cameras showed that CO2 adsorption has no significant effect on shale failure pattern. Samples with a parallel bedding angle presented splitting breaks and more fractures appeared on the surface, while samples with a normal angle broke into piece instantaneously and few fractures occurred during the compression.
The results of this study showed that the mechanical properties of shale are influenced by the adsorption time of subcritical carbon dioxide. However, for carbon dioxide capture and storage, the adsorption time should be much longer, and carbon dioxide with a supercritical phase should also be considered as it is much closer to the real underground environment.

Acknowledgments

All the work reported in the study was financially supported by the National Key Basic Research Program of China (Grant No.: 2014CB239203).

Author Contributions

Qiao Lyu performed the experiments, data analyses and manuscript writing; Xinping Long and Yong Kang prepared the samples and designed the experiments; Ranjith PG helped to analyse the results and design the experiments.

Conflicts of Interest

The authors declare no conflict of interest.

References

  1. Energy Information Administration. Lower Electricity-Related CO2 Emissions Reflect Lower Carbon Intensity and Electricity Use, 2014. Available online: https://www.eia.gov/todayinenergy/detail.cfm?id=18511 (accessed on 23 October 2014).
  2. Lv, Q.; Long, X.; Kang, Y.; Xiao, L.; Wu, W. Numerical investigation on the expansion of supercritical carbon dioxide jet. In Proceedings of the 6th International Conference on Pumps and Fans with Compressors and Wind Turbines, Beijing, China, 19–22 September 2013.
  3. Du, Y.; Wang, R.; Ni, H.; Huang, Z.; Li, M. Dynamical analysis of high-pressure supercritical carbon dioxide jet in well drilling. J. Hydrodyn. Ser. B 2013, 25, 528–534. [Google Scholar] [CrossRef]
  4. Li, G.; Wang, H.; Shen, Z.; Song, X.; Tang, G.; Hou, X. Experimental Study on the Efficiency of Cuttings Carrying with Supercritical CO2. In Proceedings of the IADC/SPE Asia Pacific Drilling Technology Conference and Exhibition, Tianjin, China, 9–11 July 2012.
  5. Du, Y.K.; Wang, R.H.; Ni, H.J.; Li, M.K.; Song, W.Q.; Song, H.F. Determination of Rock-Breaking Performance of High-Pressure Supercritical Carbon Dioxide Jet. J. Hydrodyn. 2012, 24, 554–560. [Google Scholar] [CrossRef]
  6. Kolle, J.J. Coiled-Tubing Drilling with Supercritical Carbon Dioxide. In Proceedings of the CIM International Conference on Horizontal Well Technology, Calgary, AB, Canada; 2000. [Google Scholar]
  7. Gupta, A.P.; Gupta, A.; Langlinais, J. Feasibility of supercritical carbon dioxide as a drilling fluid for deep underbalanced drilling operation. In Proceedings of the SPE Annual Technical Conference and Exhibition, Society of Petroleum Engineers, Dallas, TX, USA, 9–12 October 2005.
  8. Kolle, J.J.; Marvin, M.H. Jet-Assisted Drilling with Supercritical Carbon Dioxide; Tempress Technologies Inc.: Houston, TX, USA, 2000. [Google Scholar]
  9. Middleton, R.S.; Carey, J.W.; Currier, R.P.; Hyman, J.D.; Kang, Q.; Karra, S.; Jiménez-Martínez, J.; Porter, M.L.; Viswanathan, H.S. Shale gas and non-aqueous fracturing fluids: Opportunities and challenges for supercritical CO2. Appl. Energy 2015, 147, 500–509. [Google Scholar] [CrossRef]
  10. Yang, Y.; Aplin, A.C. Permeability and petrophysical properties of 30 natural mudstones. J. Geophy. Res. Solid Earth 2007, 112. [Google Scholar] [CrossRef]
  11. Sarout, J.; Detournay, E. Chemoporoelastic analysis and experimental validation of the pore pressure transmission test for reactive shales. Int. J. Rock Mech. Min. Sci. 2011, 48, 759–772. [Google Scholar] [CrossRef]
  12. Josh, M.; Esteban, L.; Delle Piane, C.; Sarout, J.; Dewhurst, D.; Clennell, M. Laboratory characterisation of shale properties. J. Pet. Sci. Eng. 2012, 88, 107–124. [Google Scholar] [CrossRef]
  13. Britt, L.K.; Schoeffler, J. The geomechanics of a shale play: What makes a shale prospective. In Proceedings of the SPE Eastern Regional Meeting, Charleston, WV, USA, 23–25 September 2009.
  14. Heller, R.; Zoback, M. Adsorption of methane and carbon dioxide on gas shale and pure mineral samples. J. Unconv. Oil Gas Resour. 2014, 8, 14–24. [Google Scholar] [CrossRef]
  15. Chareonsuppanimit, P.; Mohammad, S.A.; Robinson, R.L., Jr.; Gasem, K.A. High-pressure adsorption of gases on shales: Measurements and modeling. Int. J. Coal Geol. 2012, 95, 34–46. [Google Scholar] [CrossRef]
  16. Cui, X.; Bustin, R.M.; Chikatamarla, L. Adsorption-induced coal swelling and stress: Implications for methane production and acid gas sequestration into coal seams. J. Geophys. Res. Solid Earth 2007, 112. [Google Scholar] [CrossRef]
  17. Bustin, R.M.; Cui, X.; Chikatamarla, L. Impacts of volumetric strain on CO2 sequestration in coals and enhanced CH4 recovery. AAPG Bull. 2008, 92, 15–29. [Google Scholar] [CrossRef]
  18. Connell, L.; Detournay, C. Coupled flow and geomechanical processes during enhanced coal seam methane recovery through CO2 sequestration. Int. J. Coal Geol. 2009, 77, 222–233. [Google Scholar] [CrossRef]
  19. Perera, M.S.A.; Ranjith, P.G.; Viete, D.R. Effects of gaseous and super-critical carbon dioxide saturation on the mechanical properties of bituminous coal from the Southern Sydney Basin. Appl. Energy 2013, 110, 73–81. [Google Scholar] [CrossRef]
  20. Perera, M.S.A.; Ranjith, P.G.; Choi, S.K.; Airey, D. The effects of sub-critical and super-critical carbon dioxide adsorption-induced coal matrix swelling on the permeability of naturally fractured black coal. Energy 2011, 36, 6442–6450. [Google Scholar] [CrossRef]
  21. Verma, A.K.; Sirvaiya, A. Comparative analysis of intelligent models for prediction of Langmuir constants for CO2 adsorption of Gondwana coals in India. Geomech. Geophys. Geo-Energy Geo-Resour. 2016, 2, 97–109. [Google Scholar] [CrossRef]
  22. White, C.M.; Smith, D.H.; Jones, K.L.; Goodman, A.L.; Jikich, S.A.; LaCount, R.B.; DuBose, S.B.; Ozdemir, E.; Morsi, B.I.; Schroeder, K.T. Sequestration of carbon dioxide in coal with enhanced coalbed methane recovery a review. Energy Fuels 2005, 19, 659–724. [Google Scholar] [CrossRef]
  23. Liu, F.; Ellett, K.; Xiao, Y.; Rupp, J.A. Assessing the feasibility of CO2 storage in the New Albany Shale (Devonian–Mississippian) with potential enhanced gas recovery using reservoir simulation. Int. J. Greenhouse Gas Control 2013, 17, 111–126. [Google Scholar] [CrossRef]
  24. Kumar, A.; Noh, M.; Pope, G.; Sepehrnoori, K.; Bryant, S.; Lake, L. Reservoir simulation of CO2 storage in deep saline aquifers. In Proceedings of the SPE/DOE Symposium on Improved Oil Recovery, Tulsa, OK, USA, 17–21 April 2004.
  25. Li, X.; Feng, Z.; Han, G.; Elsworth, D.; Marone, C.; Saffer, D.; Cheon, D.-S. Breakdown pressure and fracture surface morphology of hydraulic fracturing in shale with H2O, CO2 and N2. Geomech. Geophys. Geo-Energy Geo-Resour. 2016, 2, 63–76. [Google Scholar] [CrossRef]
  26. Busch, A.; Bertier, P.; Gensterblum, Y.; Rother, G.; Spiers, C.J.; Zhang, M.; Wentinck, H.M. On sorption and swelling of CO2 in clays. Geomech. Geophys. Geo-Energy Geo-Resour. 2016, 2, 111–130. [Google Scholar] [CrossRef]
  27. Choi, C.S.; Song, J.J. Swelling and Mechanical Property Change of Shale and Sandstone in Supercritical CO2. In Proceedings of the 7th Asian Rock Mechanics Symposium, Seoul, Korea, 15–19 October 2012; International Society for Rock Mechanics: Seoul, Korea, 2012. [Google Scholar]
  28. Gibbs, J.W. On the equilibrium of heterogeneous substances. Am. J. Sci. 1878, III, 441–458. [Google Scholar] [CrossRef]
  29. Griffith, A.A. The phenomena of rupture and flow in solids. Philos. Trans. R Soc. Lond. Ser. A Contain. Pap. Math. Phys. Character 1921, 221, 163–198. [Google Scholar] [CrossRef]
  30. Rebinder, P. Influence of changes in the surface energy on cleavage, hardness, and other properties of crystals. In Proceedings of the Sixth Conference of Russian Physicists, Moscow, Russia; 1928. [Google Scholar]
  31. Likhtman, V.I.; Shchukin, E.D.; Rebinder, P.A. Physicochemical Mechanics of Metals; Israel Program for Scientific Translations: Jerusalem, Israel, 1964; p. 244. [Google Scholar]
  32. Aziz, N.I.; Ming-Li, W. The effect of sorbed gas on the strength of coal-an experimental study. Geotech. Geol. Eng. 1999, 17, 387–402. [Google Scholar] [CrossRef]
  33. Brochard, L.; Vandamme, M.; Pellenq, R.-M. Poromechanics of microporous media. J. Mech. Phys. Solids 2012, 60, 606–622. [Google Scholar] [CrossRef]
  34. Vandamme, M.; Brochard, L.; Lecampion, B.; Coussy, O. Adsorption and strain: the CO2-induced swelling of coal. J. Mech. Phys. Solids 2010, 58, 1489–1505. [Google Scholar] [CrossRef] [Green Version]
  35. Viete, D.; Ranjith, P. The effect of CO2 on the geomechanical and permeability behaviour of brown coal: Implications for coal seam CO2 sequestration. Int. J. Coal Geol. 2006, 66, 204–216. [Google Scholar] [CrossRef]
  36. Chenevert, M.E. Shale alteration by water adsorption. J. Pet. Technol. 1970, 22, 1141–1148. [Google Scholar] [CrossRef]
  37. Hale, A.H.; Mody, F.K.; Salisbury, D.P. Experimental investigation of the influence of chemical potential on wellbore stability. In Proceedings of the IADC/SPE Drilling, New Orleans, LA, USA, 18–21 February 1992.
  38. Wong, R. Swelling and softening behaviour of La Biche shale. Can. Geotech. J. 1998, 35, 206–221. [Google Scholar] [CrossRef]
  39. Ghorbani, A.; Zamora, M.; Cosenza, P. Effects of desiccation on the elastic wave velocities of clay-rocks. Int. J. Rock Mech. Min. Sci. 2009, 46, 1267–1272. [Google Scholar] [CrossRef]
  40. Lyu, Q.; Ranjith, P.; Long, X.; Kang, Y.; Huang, M. Effects of coring directions on the mechanical properties of Chinese shale. Arabian J. Geosci. 2015, 8, 10289–10299. [Google Scholar] [CrossRef]
  41. Meier, T.; Rybacki, E.; Backers, T.; Dresen, G. Influence of bedding angle on borehole stability: A laboratory investigation of transverse isotropic oil shale. Rock Mech. Rock Eng. 2015, 48, 1535–1546. [Google Scholar] [CrossRef]
  42. Li, Y.; Fu, Y.; Tang, G.; She, C.; Guo, J.; Zhang, J. Effect of weak bedding planes on wellbore stability for shale gas wells. In Proceedings of the IADC/SPE Asia Pacific Drilling Technology Conference and Exhibition, Tianjin, China, 9–11 July 2012.
  43. Ranjith, P.G.; Perera, M.S.A. A new triaxial apparatus to study the mechanical and fluid flow aspects of carbon dioxide sequestration in geological formations. Fuel 2011, 90, 2751–2759. [Google Scholar] [CrossRef]
  44. Emadi, H.; Soliman, M.; Samuel, R.; Ziaja, M.; Moghaddam, R.; Hutchison, S. Experimental study of the swelling properties of unconventional shale oil and the effects of invasion on compressive strength. In Proceedings of the SPE Annual Technical Conference and Exhibition, New Orleans, LA, USA, 30 September–2 October 2013.
  45. Lyu, Q.; Ranjith, P.; Long, X.; Kang, Y.; Huang, M. A review of shale swelling by water adsorption. J. Nat. Gas Sci. Eng. 2015, 27, 1421–1431. [Google Scholar] [CrossRef]
  46. de Jong, S.M.; Spiers, C.J.; Busch, A. Development of swelling strain in smectite clays through exposure to carbon dioxide. Int. J. Greenhouse Gas Control 2014, 24, 149–161. [Google Scholar] [CrossRef]
  47. Lajtai, E. Microscopic fracture processes in a granite. Rock Mech. Rock Eng. 1998, 31, 237–250. [Google Scholar] [CrossRef]
  48. Rickman, R.; Mullen, M.J.; Petre, J.E.; Grieser, W.V.; Kundert, D. A practical use of shale petrophysics for stimulation design optimization: All shale plays are not clones of the Barnett Shale. In Proceedings of the SPE Annual Technical Conference and Exhibition, Denver, CO, USA, 24–24 September 2008.
  49. Gong, Q.; Zhao, J. Influence of rock brittleness on TBM penetration rate in Singapore granite. Tunn. Undergr. Space Technol. 2007, 22, 317–324. [Google Scholar] [CrossRef]
  50. Hucka, V.; Das, B. Brittleness determination of rocks by different methods. Int. J. Rock Mech. Min. Sci. Geomech. Abstr. 1974, 11, 389–392. [Google Scholar] [CrossRef]
  51. Rathnaweera, T.; Ranjith, P.; Perera, M.; Haque, A.; Lashin, A.; Al Arifi, N.; Chandrasekharam, D.; Yang, S.; Xu, T.; Wang, S. CO2-induced mechanical behaviour of Hawkesbury sandstone in the Gosford basin: An experimental study. Mater. Sci. Eng. A 2015, 641, 123–137. [Google Scholar] [CrossRef]
Figure 1. Location and paleogeographic map in South China.
Energies 09 00516 g001
Figure 2. Effects of saline concentration on shale samples’ (a) axial stress and (b) Young’s modulus.
Energies 09 00516 g002
Figure 3. Average Stress–strain curves: (a) parallel; (b) normal.
Energies 09 00516 g003
Figure 4. Axial stress-volumetric strain curves: (a) parallel; (b) normal.
Energies 09 00516 g004
Figure 5. Determination of brittleness from a stress-strain diagram.
Energies 09 00516 g005
Figure 6. Variation of cumulative AE energy with axial strain: (ad) are for parallel samples; (eh) are for normal samples. (a) Temperature: 40 °C; Adsorption time: 20 days; (b) Temperature: 40 °C; Adsorption time: 10 days; (c) Temperature: 22 °C; Adsorption time: 0 day; (d) Temperature: 40 °C; Adsorption time: 0 day; (e) Temperature: 40 °C; Adsorption time: 20 days; (f) Temperature: 40 °C; Adsorption time: 10 days; (g) Temperature: 22 °C; Adsorption time: 0 day; (h) Temperature: 40 °C; Adsorption time: 0 day.
Energies 09 00516 g006aEnergies 09 00516 g006b
Table 1. The values of uniaxial compressive strength (UCS) and Young’s modulus (E) obtained from all the tested samples.
DirectionTemperatureSorption TimeUCSAverage UCS∆UCSEAverage EE
(°C)(Day)(MPa)(MPa)%(GPa)(GPa)%
parallel40092.293.0-12.812.7-
93.7(0.75)12.6(0.10)
22071.773.221.3%9.09.426.0%
74.6(1.45)9.8(0.40)
401067.568.226.7%9.08.830.7%
68.8(0.65)8.6(0.20)
402065.364.830.3%10.711.013.8%
64.2(0.50)11.2(0.26)
normal400225.9226.8-13.914.2-
227.6(0.85)14.4(0.26)
220191.3192.815.0%12.211.915.9%
194.2(1.46)11.6(0.30)
4010220.8219.93.0%8.69.036.7%
218.9(0.95)9.3(0.40)
4020186.3185.018.4%11.211.022.6%
183.7(1.30)10.7(0.26)
Table 2. Brittleness determination from stress-strain curves for all samples.
DirectionTemperatureSorption TimeStrain (DE)Strain (OE)Brittleness IndexAverage Brittleness Index
(°C)(Day)(%)(%)(%)(%)
parallel4001.282.2157.9263.87
2201.822.8364.31
40101.822.8962.98
40201.892.6970.26
normal4001.922.5874.4274.74
2202.112.7875.90
40102.062.8173.31
40202.232.9675.34
Table 3. The strain and peak energy release of the AE results.
DirectionTemperature (°C)Sorption Time
(Day)
Strain Variations in Crack Closure (%)Strain Variations in Unstable Crack Propagation (%)Peak Cumulative AE Energy (μJ)
parallel4001.27–1.522.01–2.59793168
2201.01–1.462.09–2.861104306
40101.15–1.582.18–2.671110382
40201.20–1.662.34–2.801230716
normal4000.77–1.572.14–2.49436088
2200.92–1.752.33–2.64511007
40100.89–1.752.25–2.65552154
40200.78–1.822.40–2.73672011
Table 4. The strain distribution and failure mechanism of samples saturated in different conditions.
Parallel (40 °C, 0 day)Parallel (20 °C, 0 day)
Energies 09 00516 i001Energies 09 00516 i002Energies 09 00516 i003Energies 09 00516 i004
Parallel (40 °C, 10 days)Parallel (40 °C, 20 days)
Energies 09 00516 i005Energies 09 00516 i006Energies 09 00516 i007Energies 09 00516 i008
Normal (40 °C, 0 day)Normal (20 °C, 0 day)
Energies 09 00516 i009Energies 09 00516 i010Energies 09 00516 i011Energies 09 00516 i012
Normal (40 °C, 10 days)Normal (40 °C, 20 days)
Energies 09 00516 i013Energies 09 00516 i014Energies 09 00516 i015Energies 09 00516 i016

