
Flexible Grouping for Enhanced Energy Utilization Efficiency in Battery Energy Storage Systems

 ,
, 
Abstract
:1. Introduction
2. Analysis of Energy Utilization of a Battery Pack
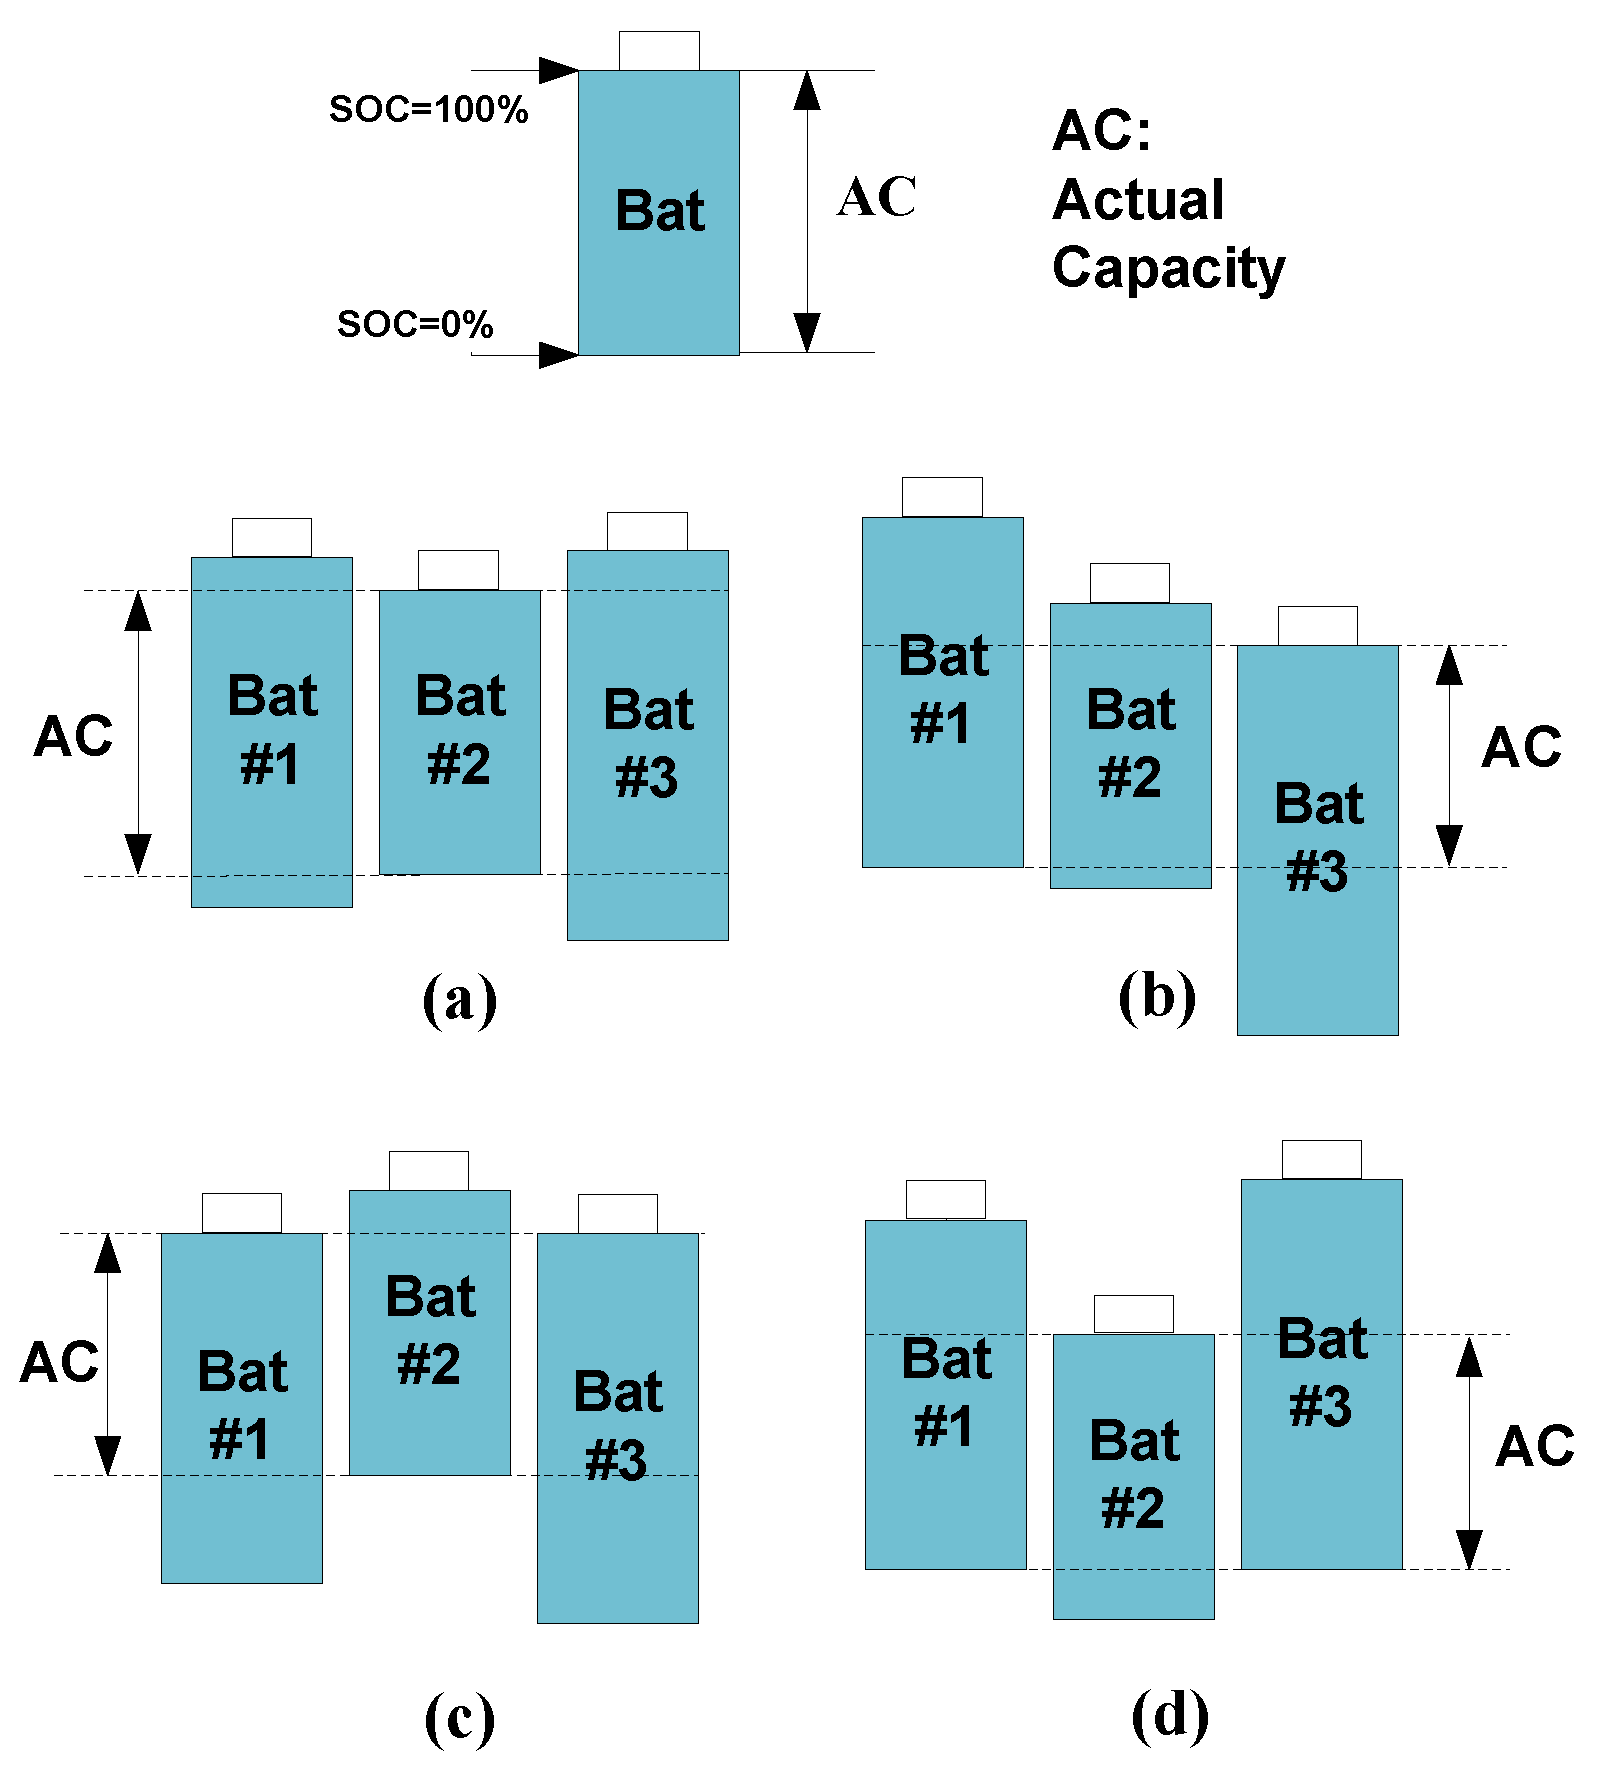
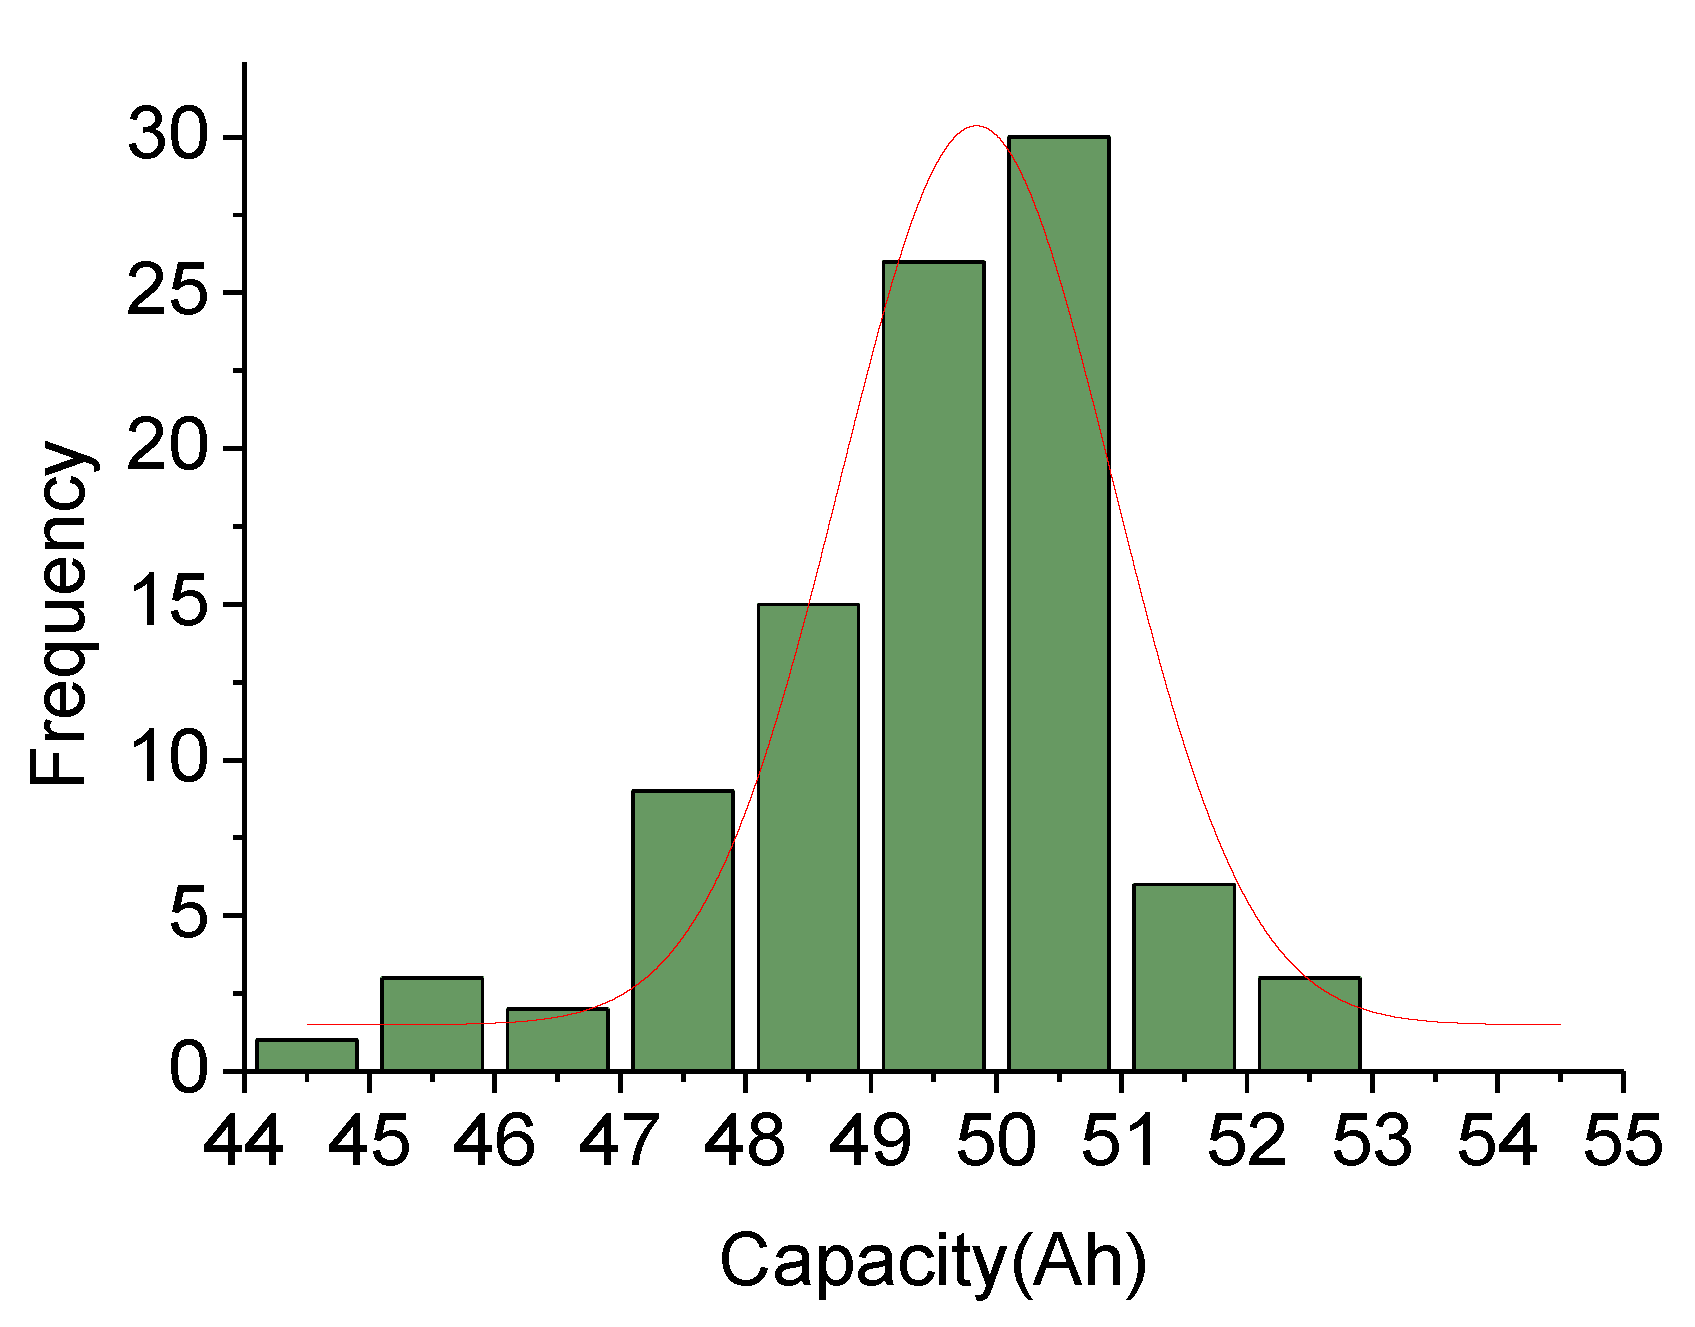
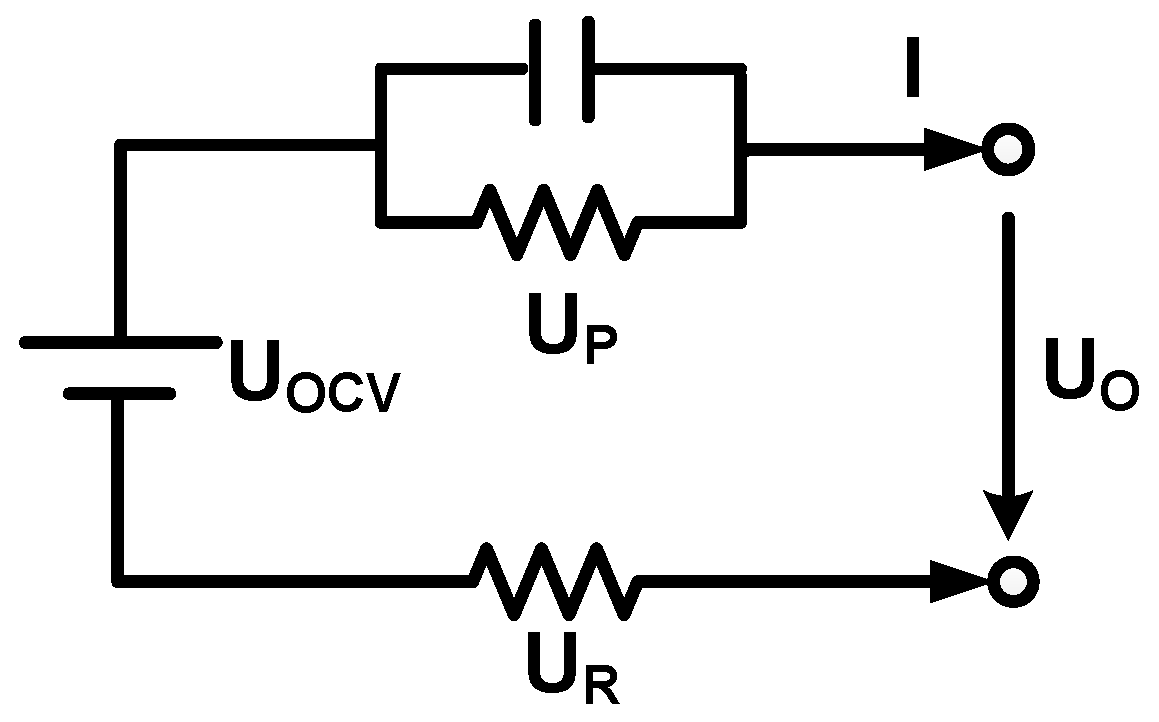
2.1. Capacity Analysis Based on a Battery Model
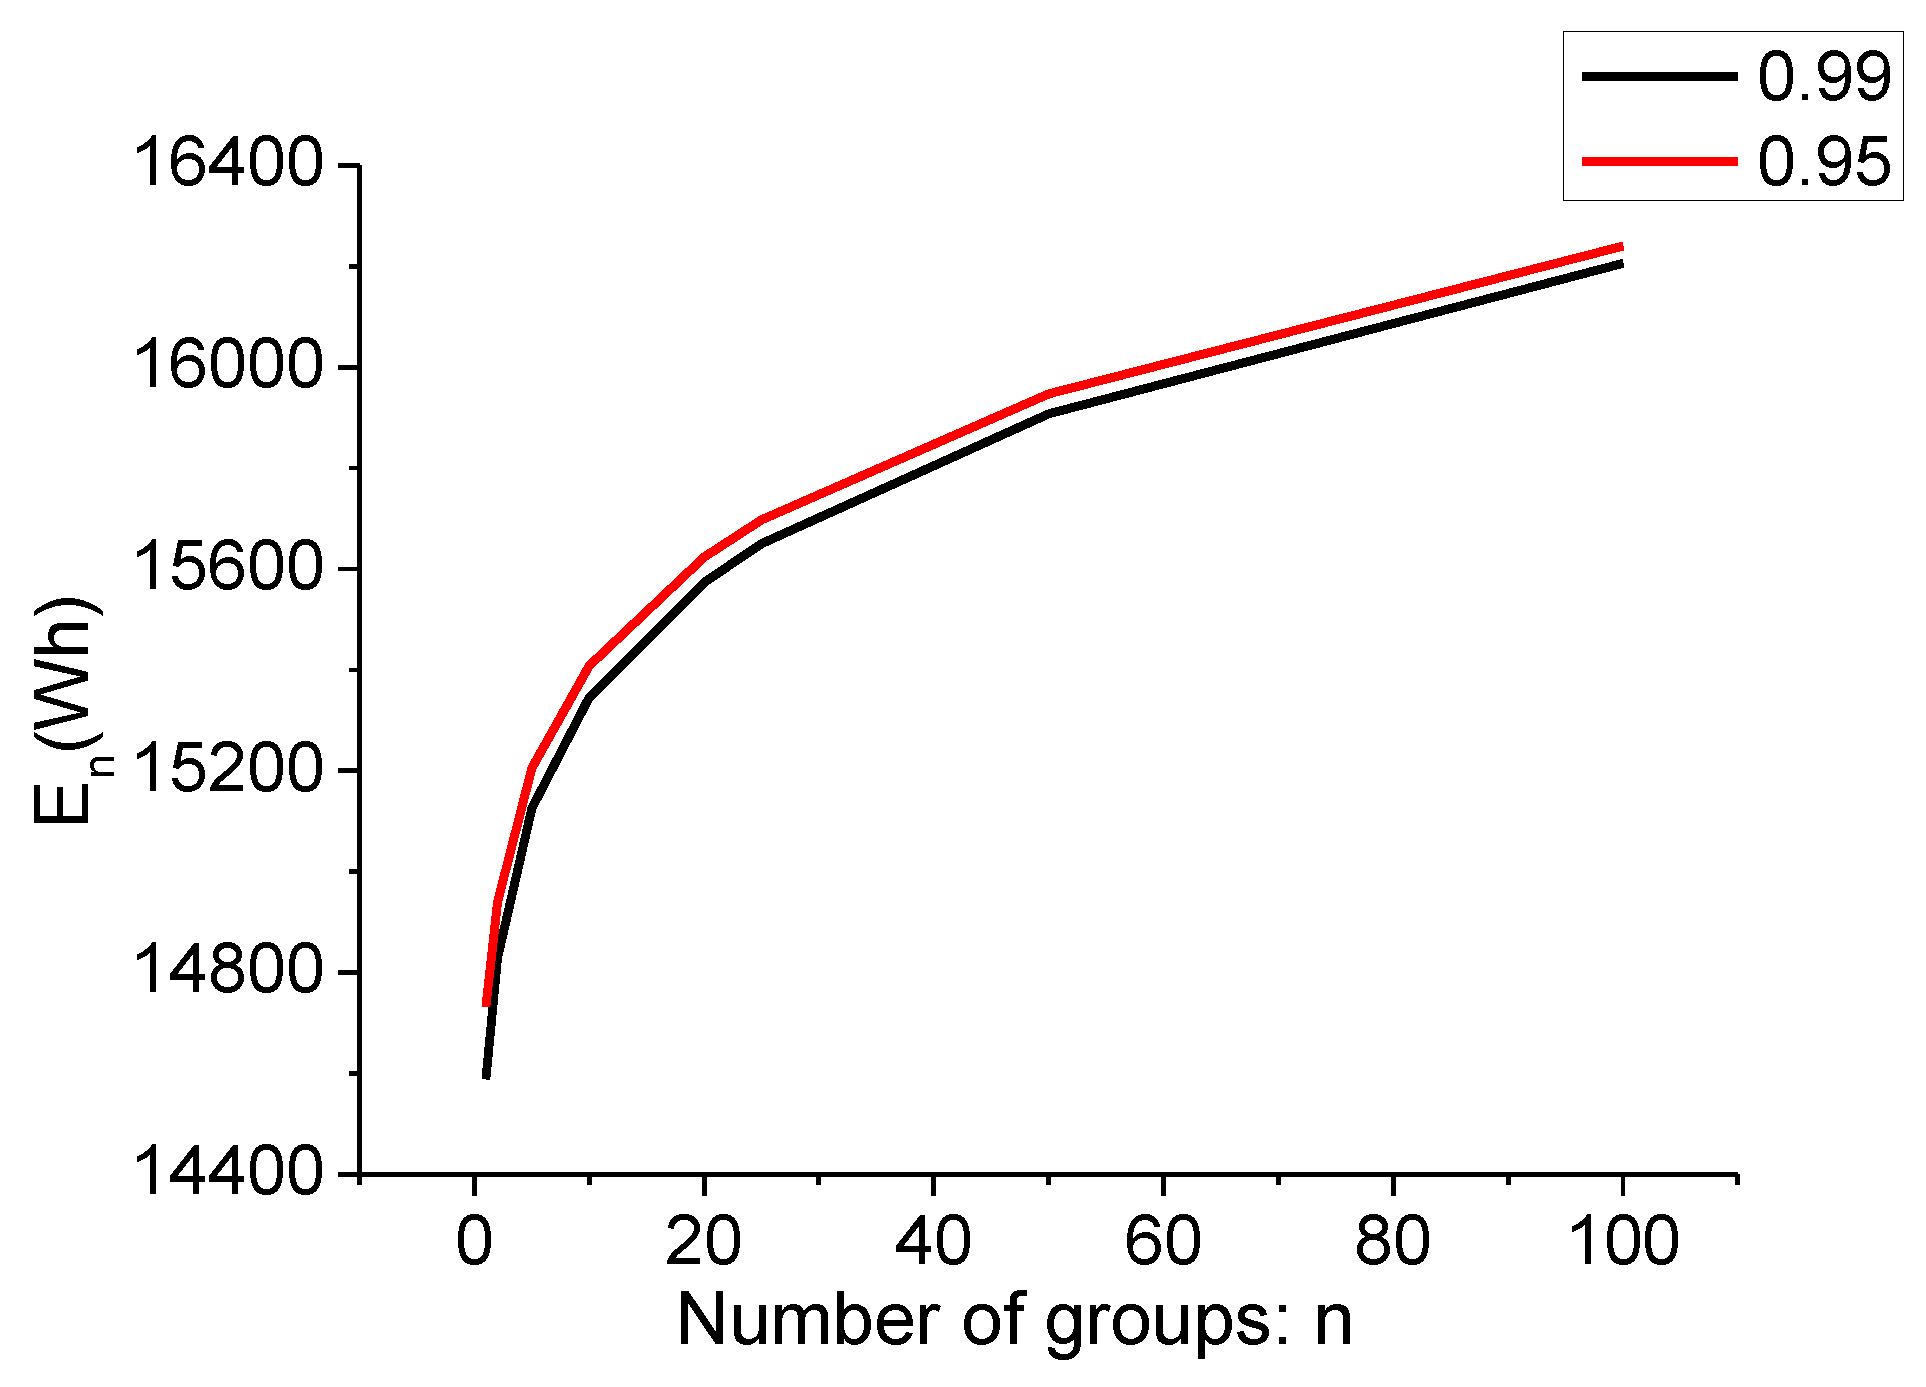
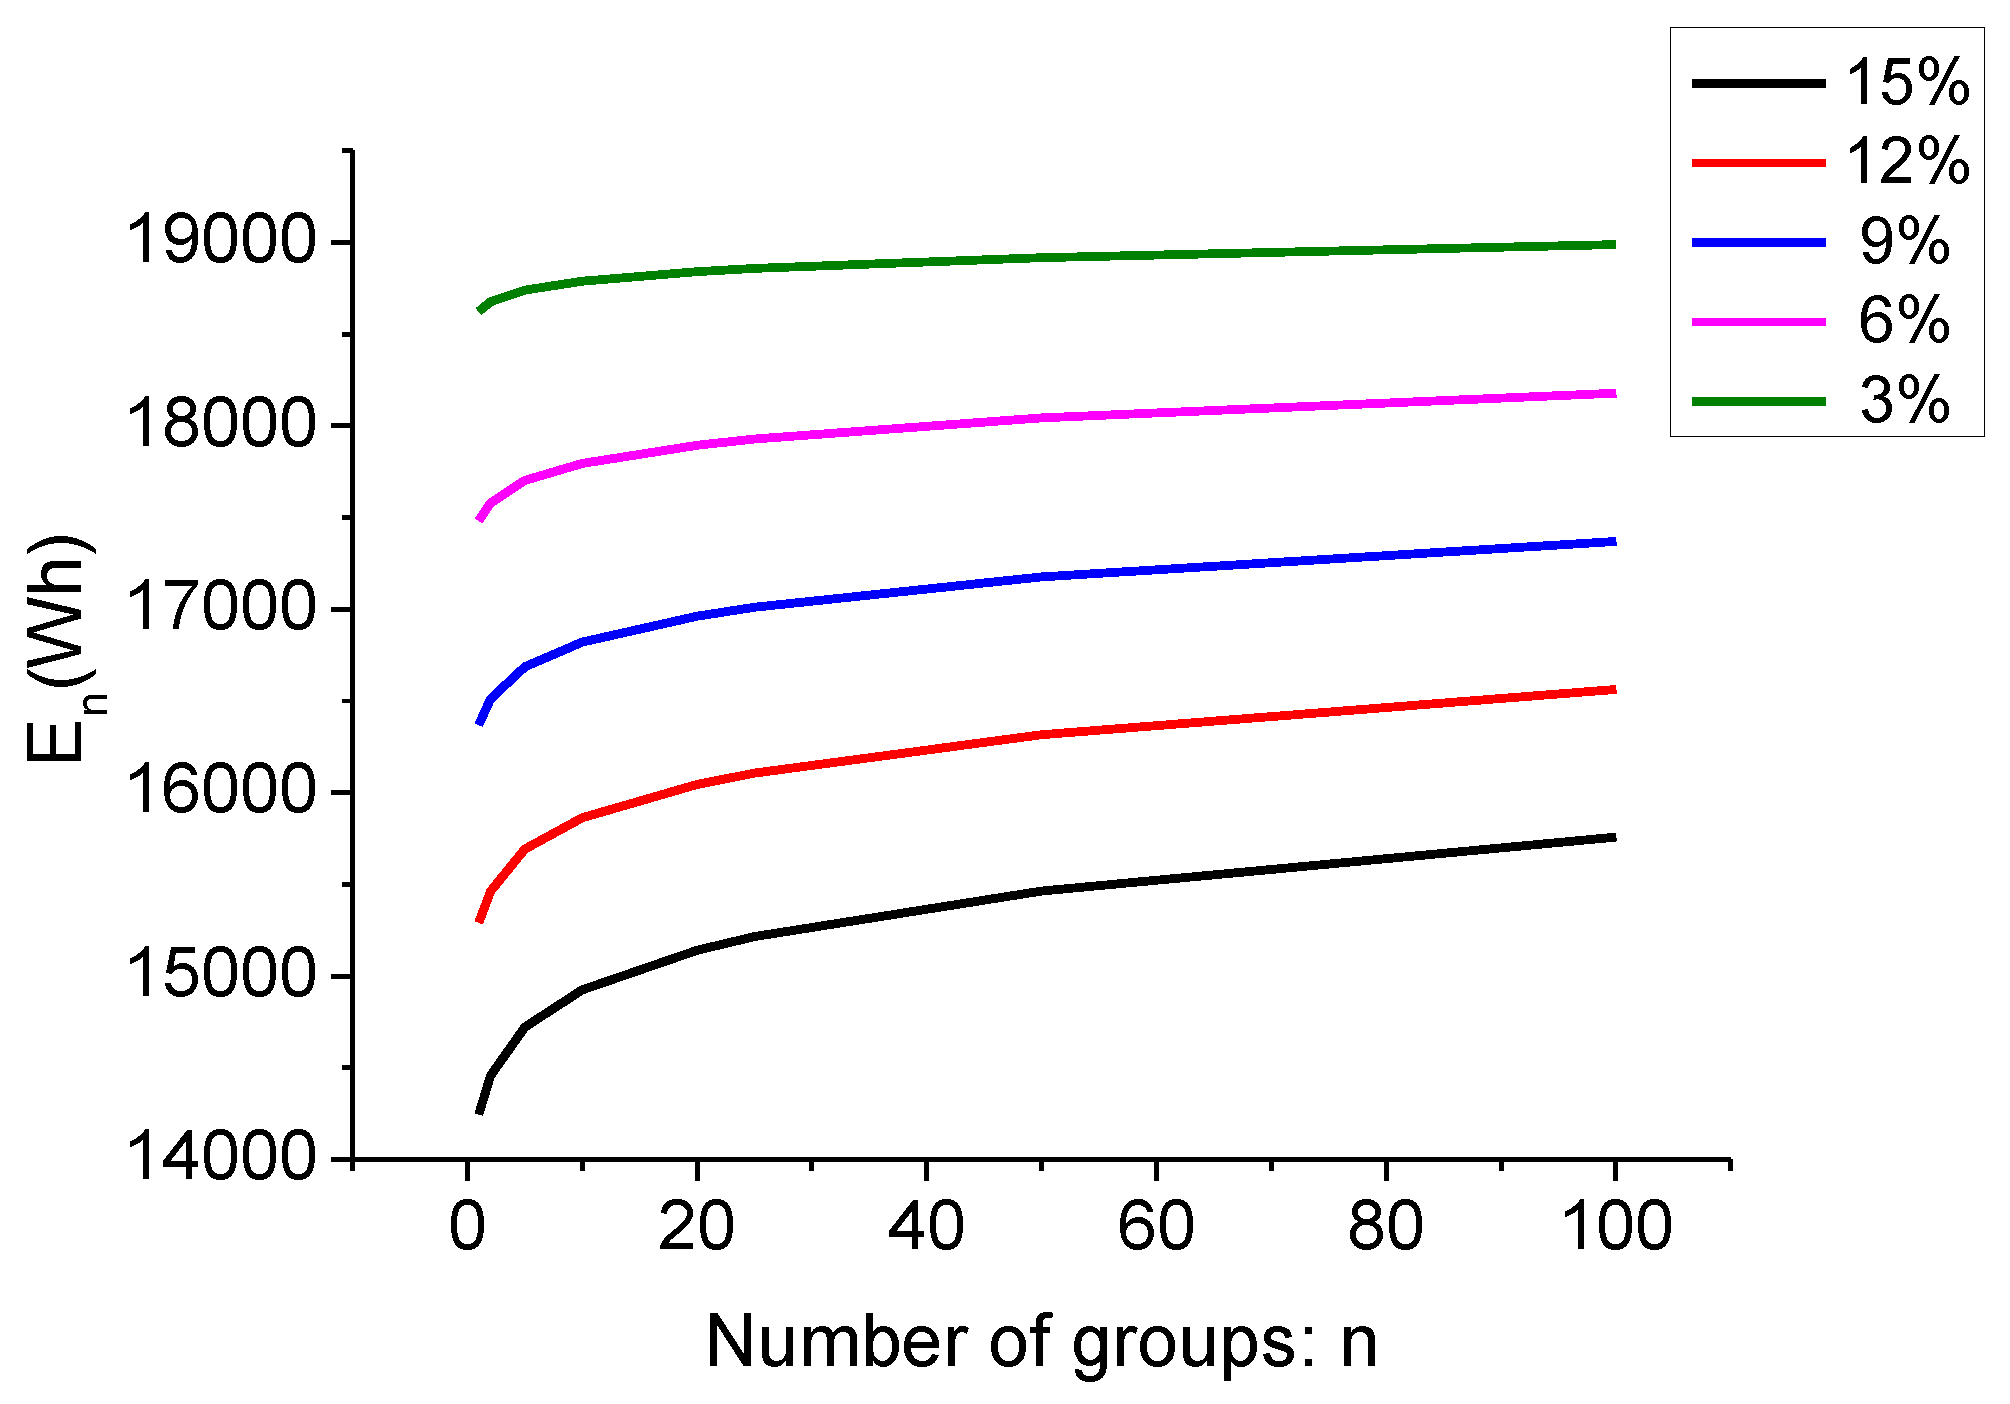
2.2. Energy Utilization Analysis
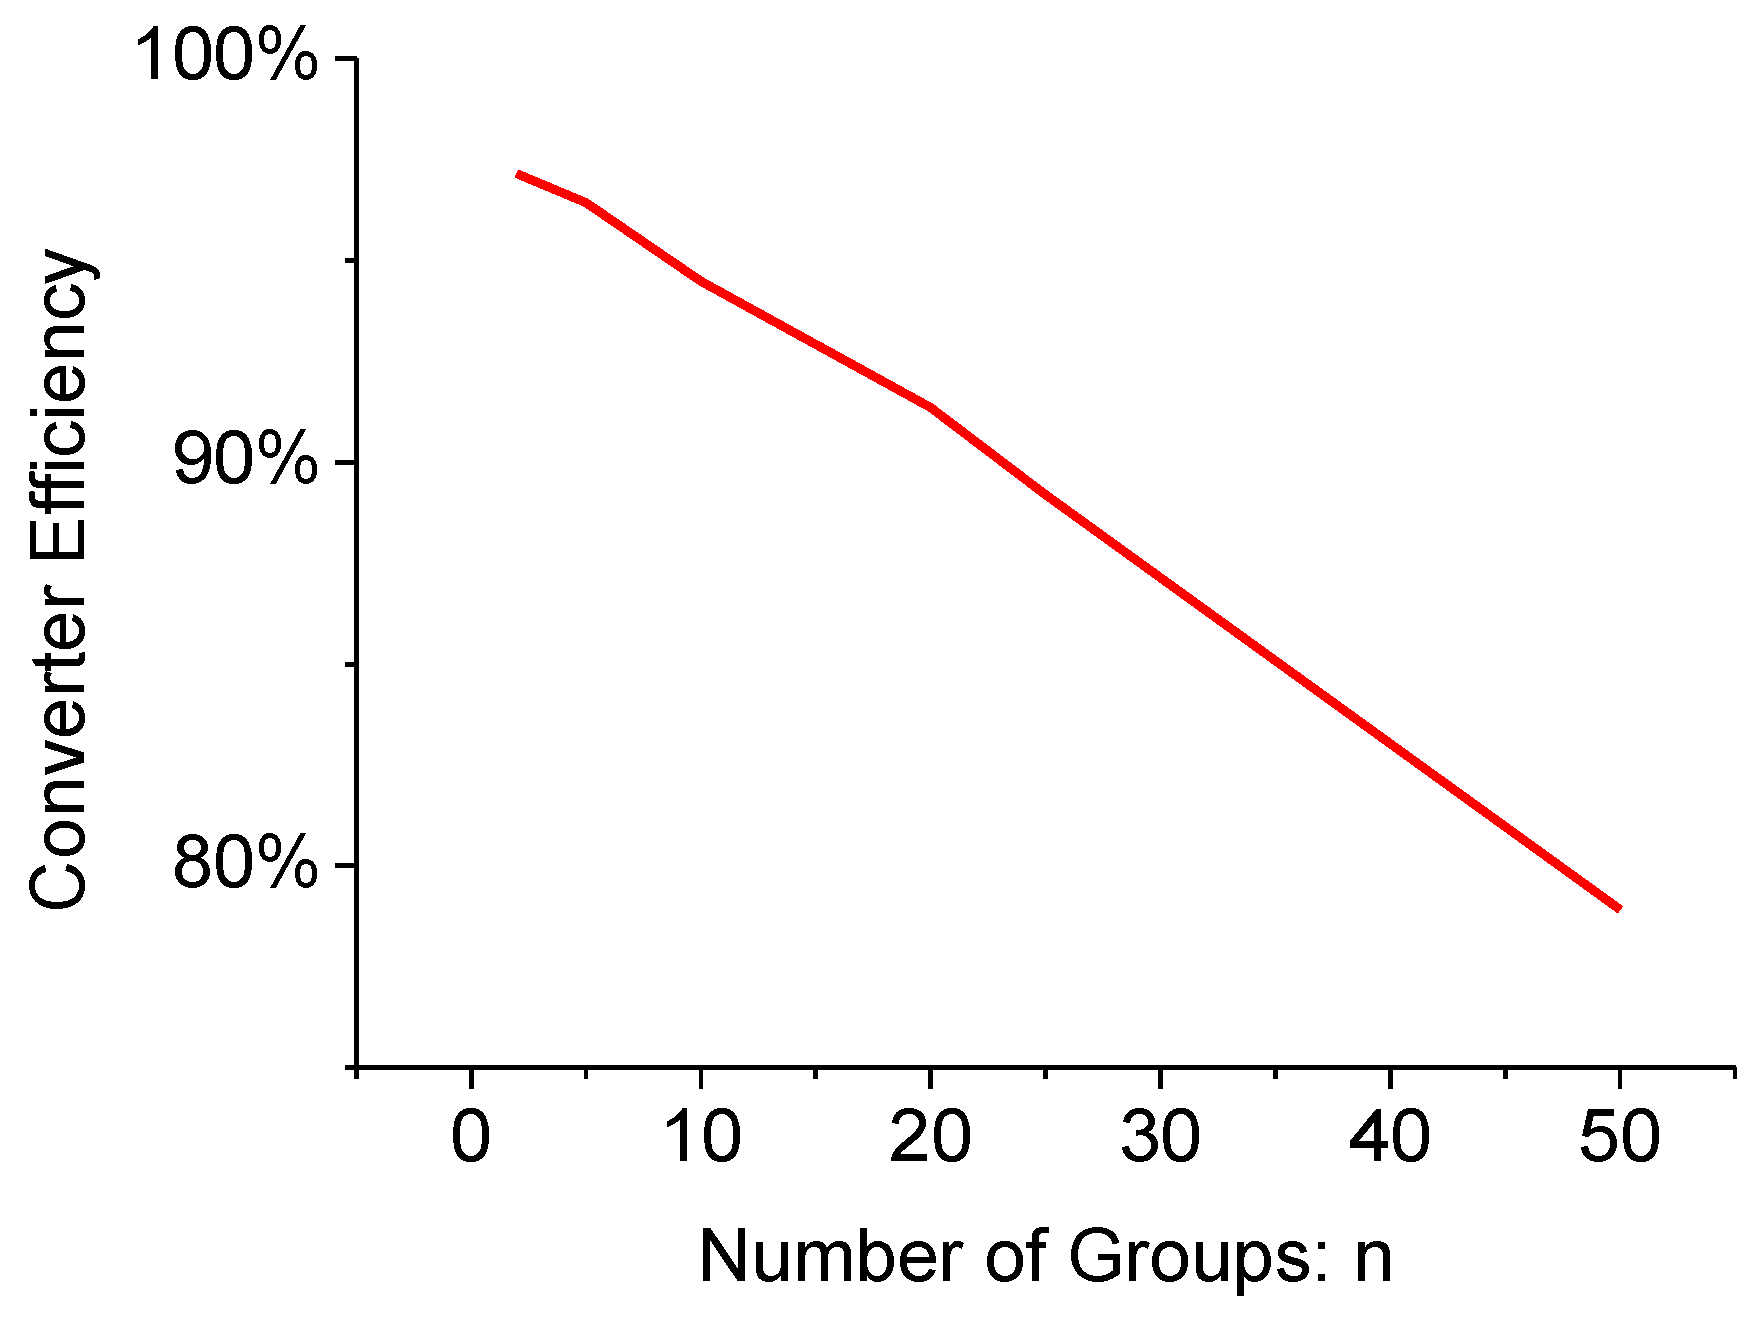
3. Analysis of Converter Efficiency
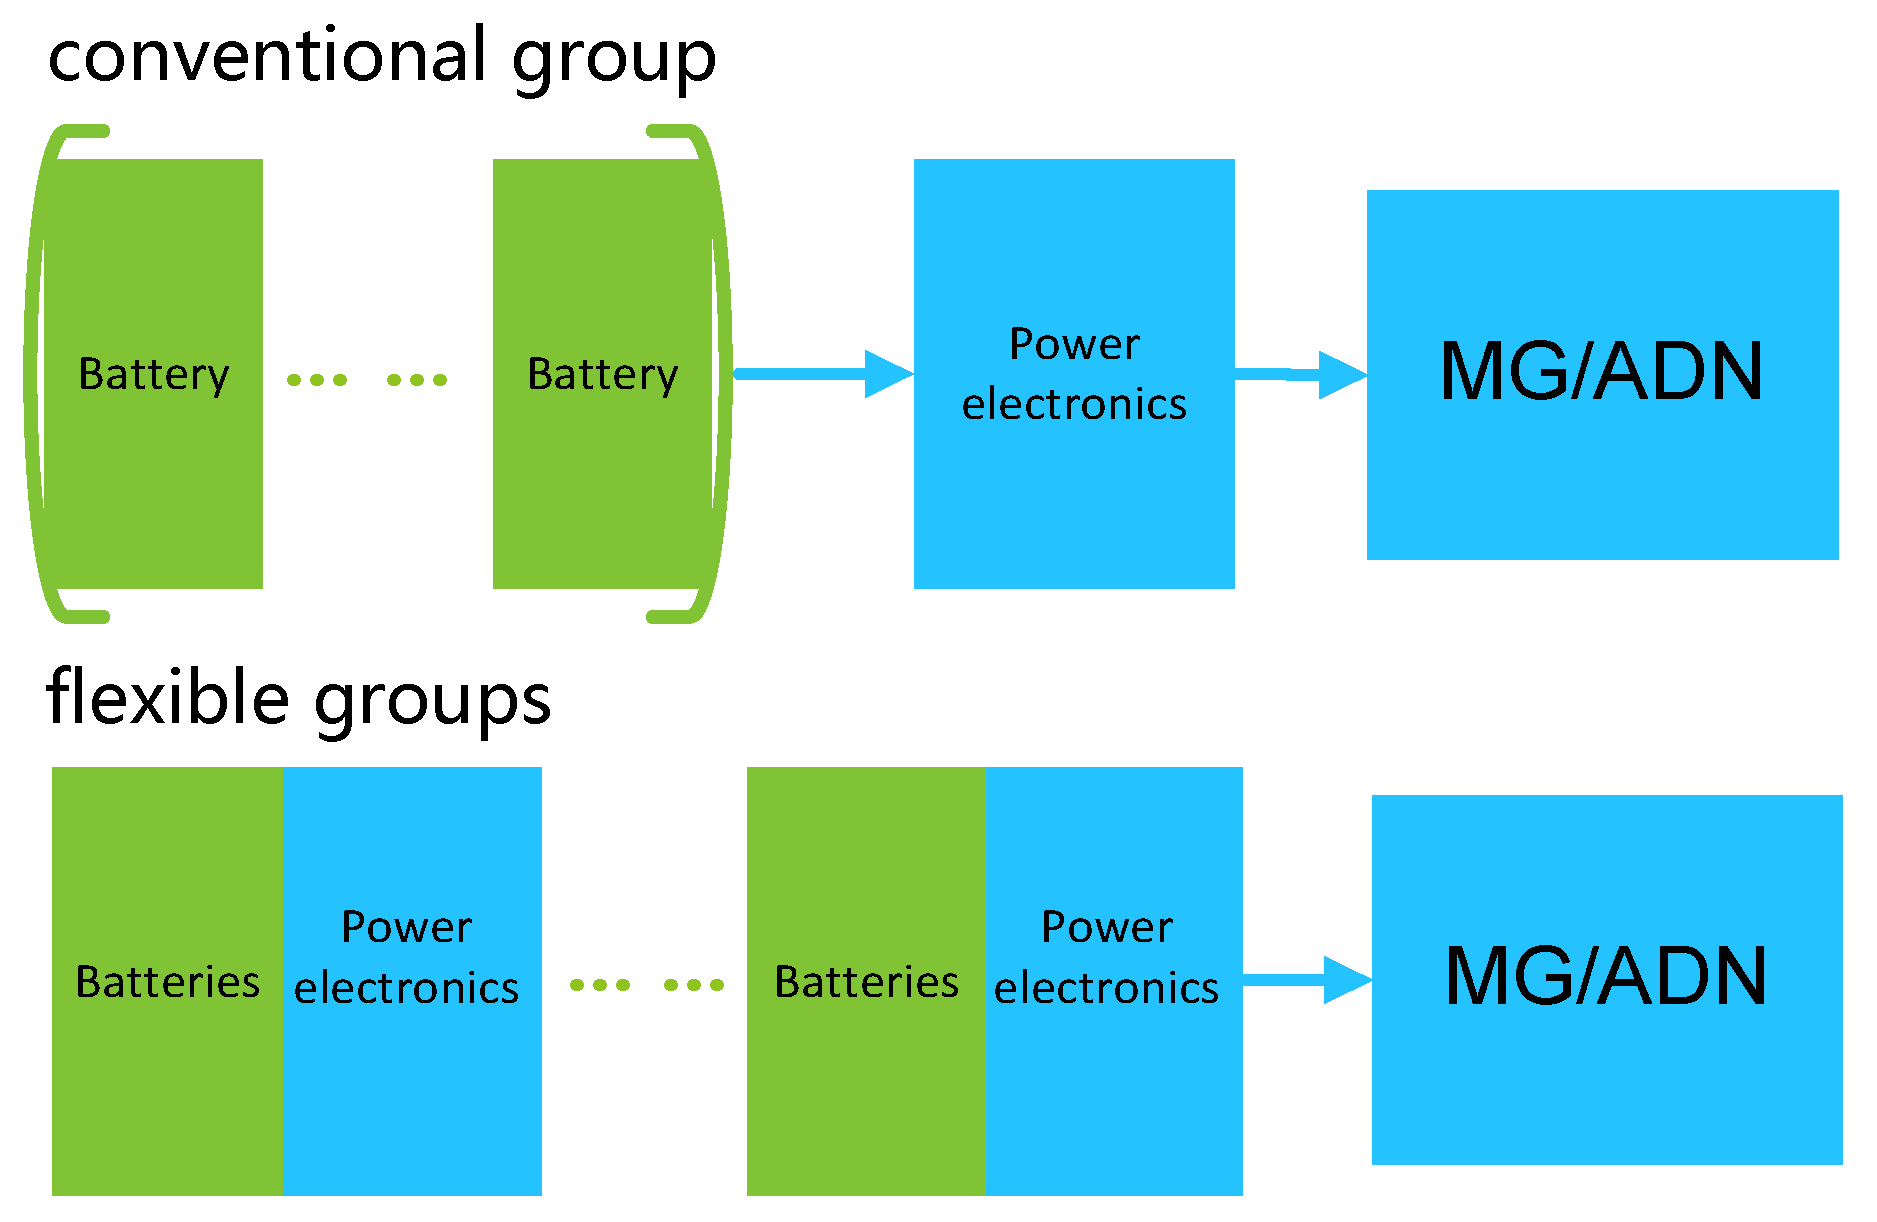
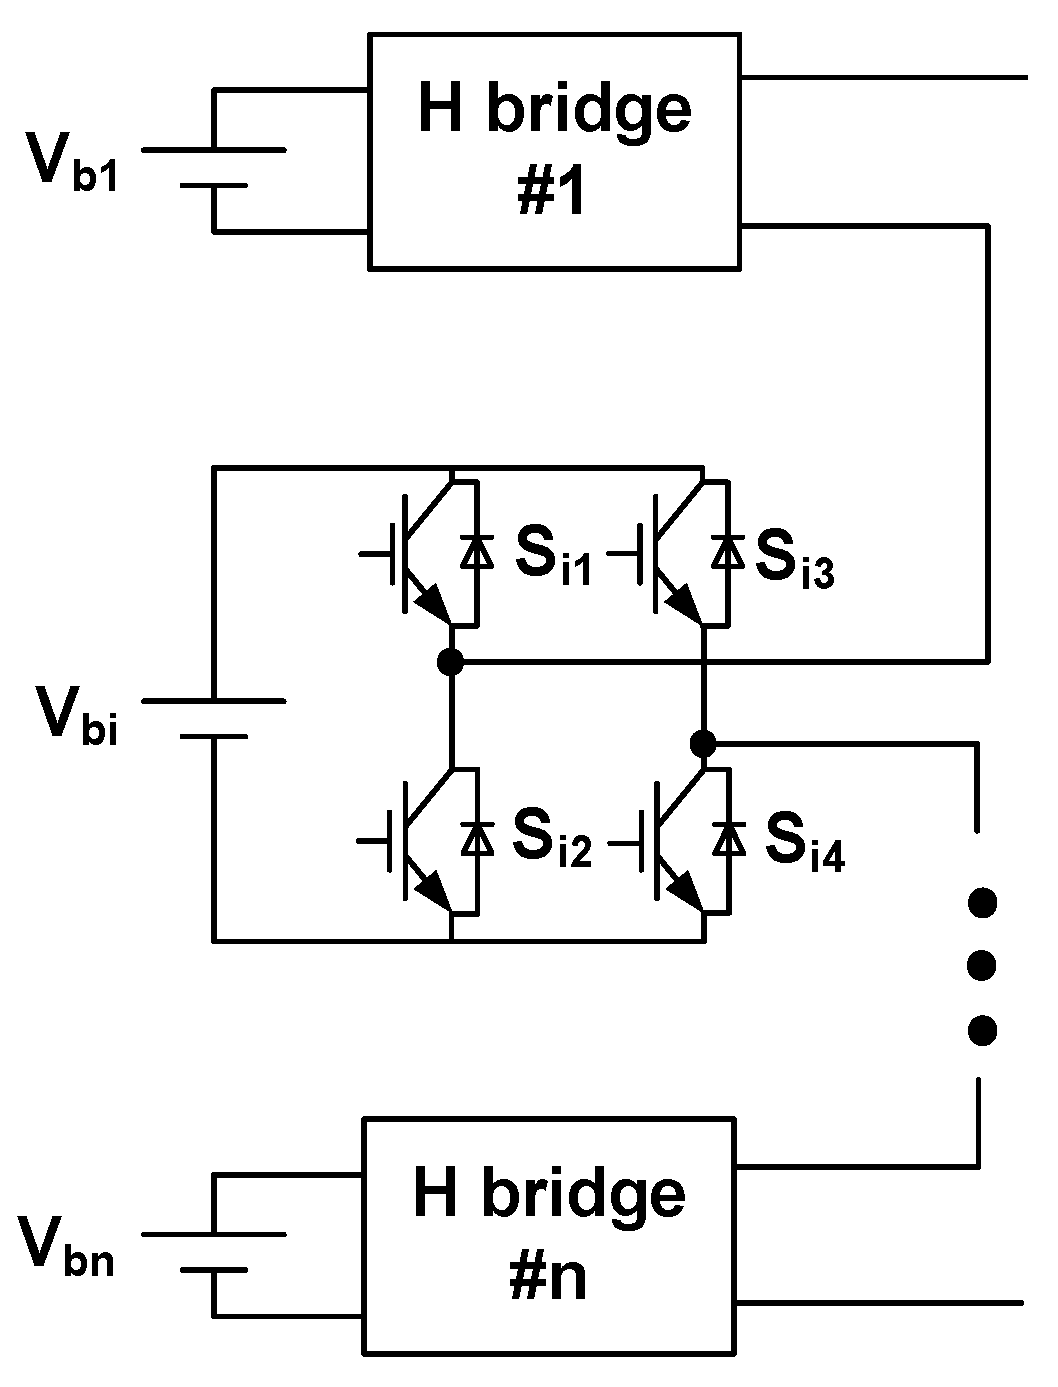
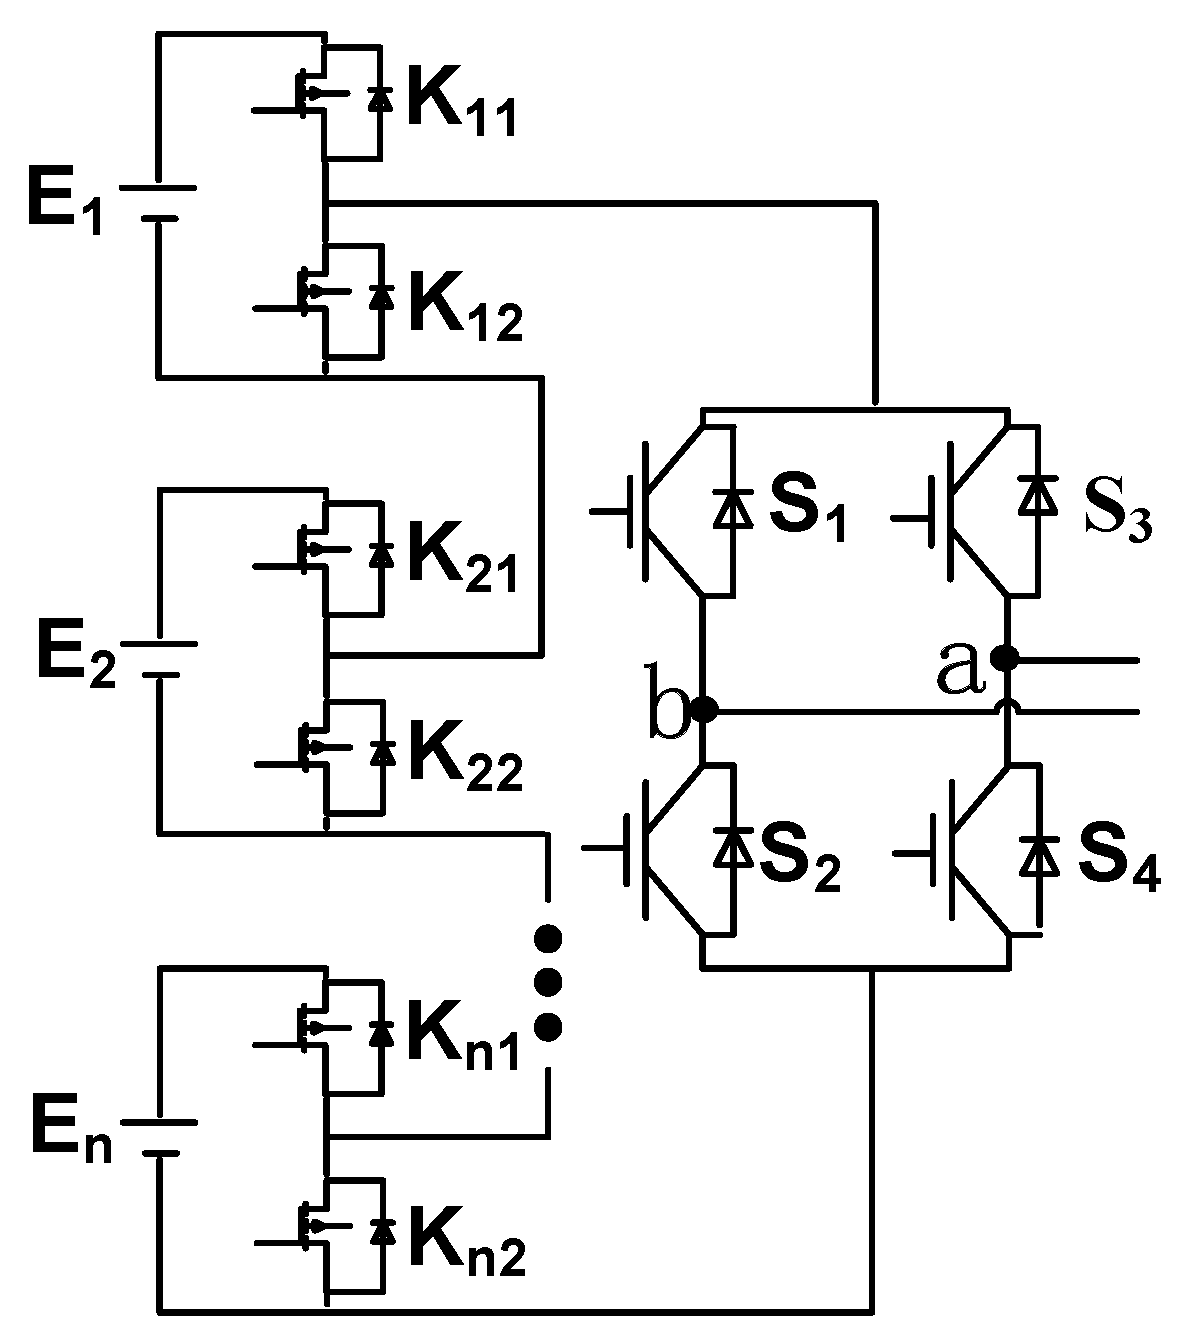
3.1. Topology Illustration of Converter
3.2. Converter Efficiency Calculation
3.2.1. Loss of MOSFET
3.2.2. Loss of Diode
3.2.3. Total Loss
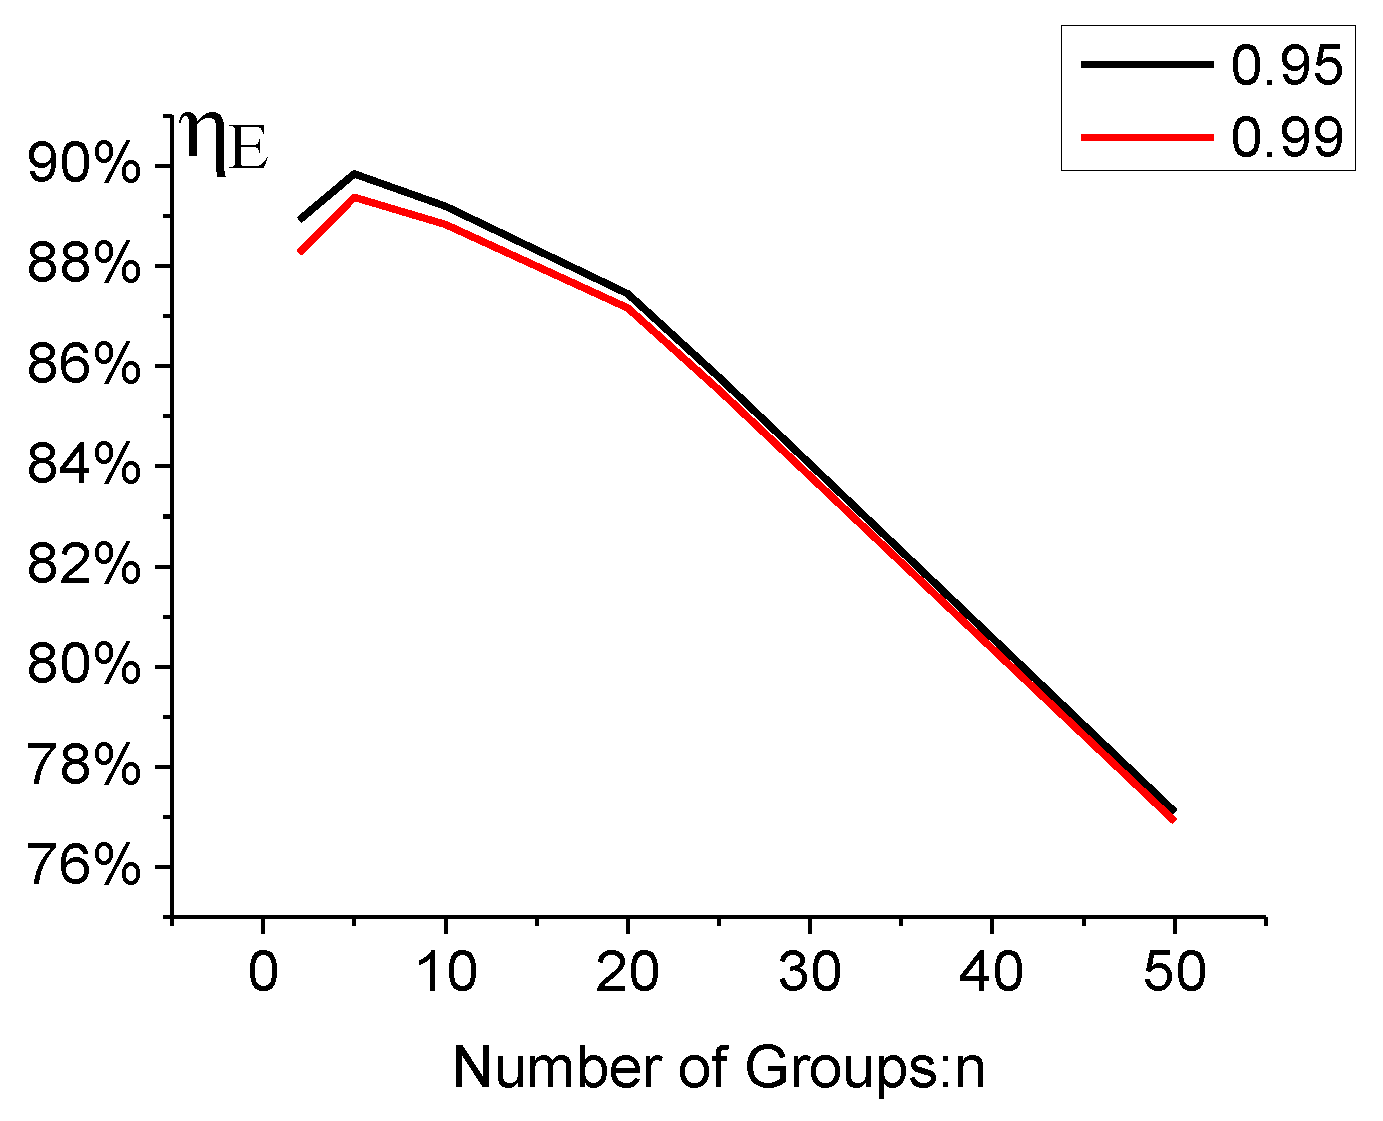
4. Energy Utilization Efficiency of Flexible Group Module
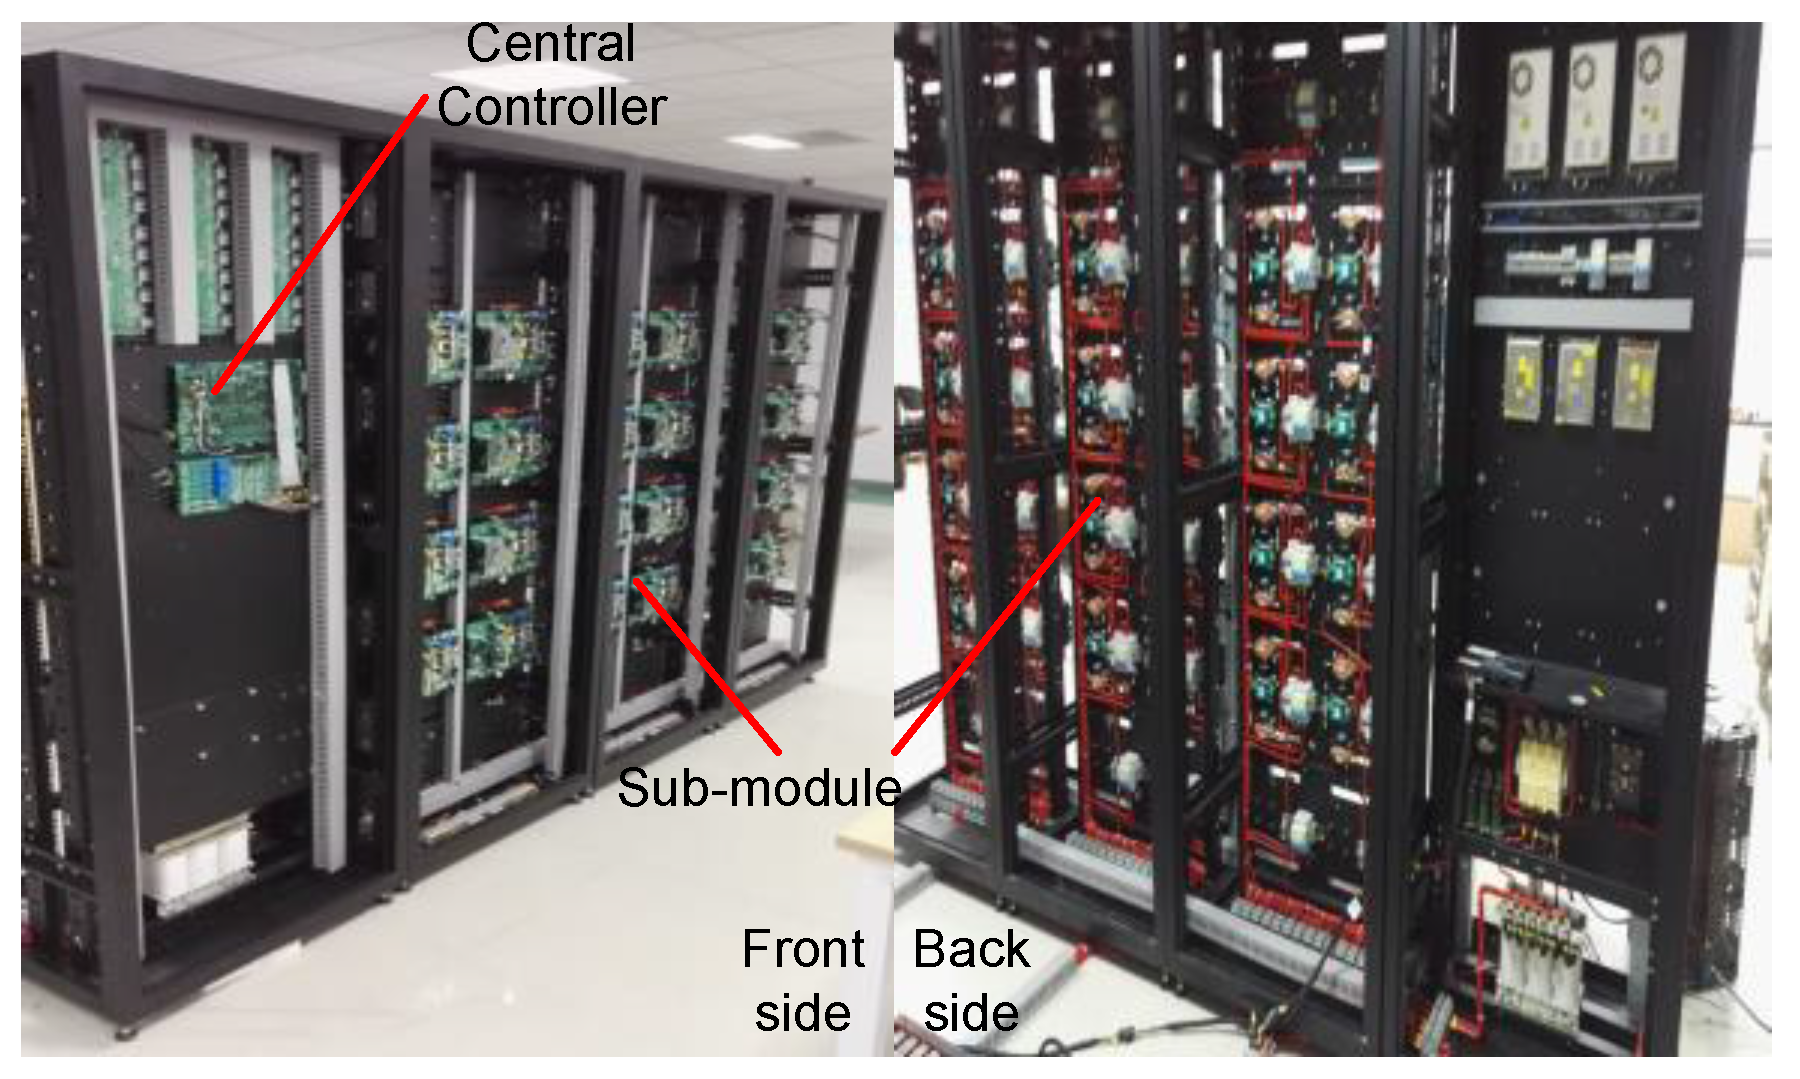
5. Experiments
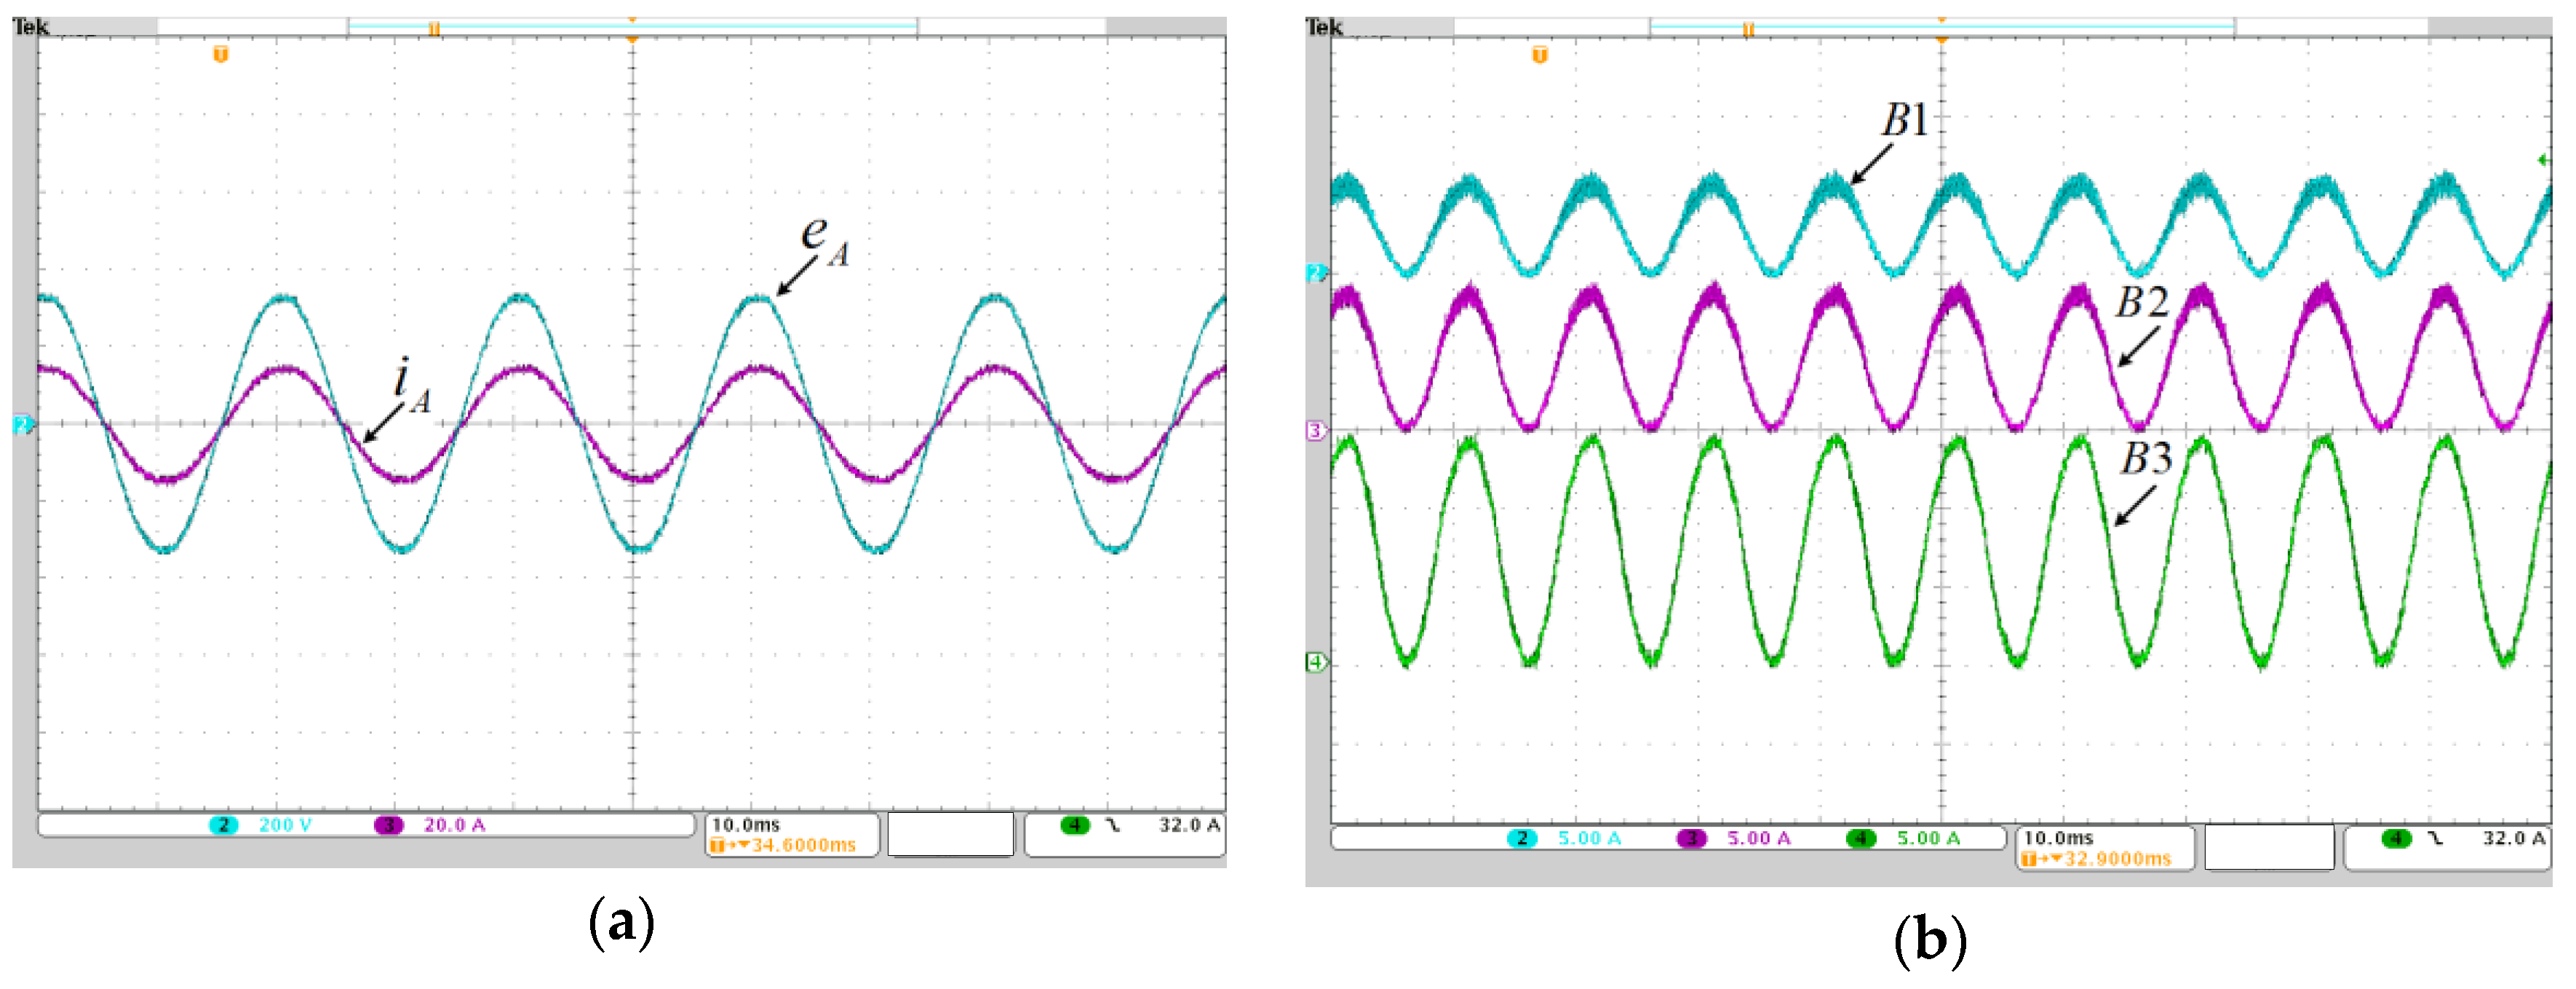
5.1. Experiment 1
5.2. Experiment 2
6. Conclusions
Acknowledgments
Author Contributions
Conflicts of Interest
Abbreviations
| BESS | Battery Energy Storage System |
| DG | Distribution Generation |
| ESS | Energy Storage System |
| SOC | State of Charge |
| DOD | Depth of Discharge |
| BMS | Battery Management System |
| SOH | State of Health |
References
- Li, Y.; Han, Y. Power electronics integration on battery cells. In Proceedings of the Applied Power Electronics Conference and Exposition (APEC), 2014 Twenty-Ninth Annual IEEE, Fort Worth, TX, USA, 16–20 March 2014; pp. 3318–3322.
- Wen, F. Study on Basic Issues of the Li-ion Battery Pack Management Technology for Pure Electric Vehicles; Beijing Jiaotong University: Beijing, China, 2009; pp. 8–9. [Google Scholar]
- Soong, T.; Lehn, P. Assessment of Fault Tolerance in Modular Multilevel Converters with Integrated Energy Storage. IEEE Trans. Power Electron. 2016, 36, 4085–4095. [Google Scholar] [CrossRef]
- Zhang, Z.; Cai, Y.Y.; Zhang, Y.; Gu, D.J.; Liu, Y.F. A Distributed Architecture Based on Microbank Modules with Self-Reconfiguration Control to Improve the Energy Efficiency in the Battery Energy Storage System. IEEE Trans. Power Electron. 2016, 31, 304–317. [Google Scholar] [CrossRef]
- Rothgang, S.; Baumhöfer, T.; van Hoek, H.; Lange, T.; De Doncker, R.W.; Sauer, D.U. Modular battery design for reliable, flexible and multi-technology energy storage systems. Appl. Energy 2015, 137, 931–937. [Google Scholar] [CrossRef]
- Mukherjee, N.; Strickland, D. Control of second-life hybrid battery energy storage system based on modular boost-multilevel buck converter. IEEE Trans. Ind. Electron. 2015, 62, 1034–1046. [Google Scholar] [CrossRef]
- Young, C.M.; Chu, N.Y.; Chen, L.R.; Hsiao, Y.C.; Li, C.Z. A Single-Phase Multilevel Inverter with Battery Balancing. IEEE Trans. Ind. Electron. 2013, 60, 1972–1978. [Google Scholar] [CrossRef]
- Su, G.H. Multilevel DC link inverter. IEEE Trans. Ind. Appl. 2005, 41, 848–854. [Google Scholar] [CrossRef]
- Gupta, K.K.; Jain, S. A Novel Multilevel Inverter Based on Switched DC Sources. IEEE Trans. Ind. Electron. 2014, 61, 3269–3278. [Google Scholar] [CrossRef]
- Babaei, E.; Laali, S.; Alilu, S. Cascaded Multilevel Inverter With Series Connection of Novel H-Bridge Basic Units. IEEE Trans. Ind. Electron. 2014, 61, 6664–6671. [Google Scholar] [CrossRef]
- Maharjan, L.; Yamagishi, T.; Akagi, H.; Asakura, J. Fault-tolerant operation of a battery-energy-storage system based on a multilevel cascade PWM converter with star configuration. IEEE Trans. Power Electron. 2010, 25, 2386–2396. [Google Scholar] [CrossRef]
- Maharjan, L.; Inoue, S.; Akagi, H.; Asakura, J. State-of-charge (SOC)-balancing control of a battery energy storage system based on a cascade PWM converter. IEEE Trans. Power Electron. 2009, 24, 1628–1636. [Google Scholar]
- Zheng, Z.; Wang, K.; Xu, L.; Li, Y. A Hybrid Cascaded Multilevel Converter for Battery Energy Management Applied in Electric Vehicles. IEEE Trans. Power Electron. 2014, 29, 3537–3546. [Google Scholar] [CrossRef]
- Vasiladiotis, M.; Rufer, A. Analysis and control of modular multilevel converters with integrated battery energy storage. IEEE Trans. Power Electron. 2015, 30, 163–175. [Google Scholar] [CrossRef]
- Wang, L.Y.; Wang, C.; Yin, G.; Lin, F.; Polis, M.P.; Zhang, C.P.; Jiang, J.C. Balanced Control Strategies for Interconnected Heterogeneous Battery Systems. IEEE Trans. Sustain. Energy 2016, 7, 189–199. [Google Scholar] [CrossRef]
- Arifujjaman, M. A comprehensive power loss, efficiency, reliability and cost calculation of a 1 MW/500 kWh battery based energy storage system for frequency regulation application. Renewable Energy 2015, 74, 158–169. [Google Scholar] [CrossRef]
- Mukherjee, N.; Strickland, D.; Cross, A.; Hung, W. Reliability estimation of second life battery system power electronic topologies for grid frequency response applications. In Proceedings of the 6th IET International Conference on IET Power Electronics, Machines and Drives (PEMD 2012), Bristol, UK, 27–29 March 2012; pp. 1–6.
- Zhang, C.P.; Jiang, J.C.; Zhang, W.G.; Wang, Y.K.; Sharkh, S.M.; Xiong, R. A novel data-driven fast capacity estimation of spent electric vehicle lithium-ion batteries. Energies 2014, 7, 8076–8094. [Google Scholar] [CrossRef]
- Schuster, S.F.; Brand, M.J.; Berg, P.; Gleissenberger, M.; Jossen, A. Lithium-ion cell-to-cell variation during battery electric vehicle operation. J. Power Sources 2015, 297, 242–251. [Google Scholar] [CrossRef]
- Zhang, C.; Jiang, J.; Zhang, W.; Wen, F. Determination of SOC of a battery pack used in pure electric vehicles. In Proceedings of the 2012 Asia-Pacific Power and Energy Engineering Conference, Shanghai, China, 27–29 March 2012; pp. 1–4.
- Order Statistics. Available online: http://www.math.uah.edu/stat/sample/OrderStatistics.html (accessed on 3 March 2016).
- The Central Limit Theorem. Available online: http://www.math.uah.edu/stat/sample/CLT.html (accessed on 3 March 2016).
- Paul, S.; Diegelmann, C.; Kabza, H.; Tillmetz, W. Analysis of ageing inhomogeneities in lithium-ion battery systems. J. Power Sources 2013, 239, 642–650. [Google Scholar] [CrossRef]
- Huang, B.X.; Chen, Y.S. Prediction of power losses in three-phase inverter based on system simulation. Micromotors 2009, 9, 49–52. [Google Scholar]


| Cycle(Times) | 0 | 300 | 600 | 900 | 1200 | 1500 |
|---|---|---|---|---|---|---|
| Mean (Ah) | 60 (100%) | 57.6 (96%) | 55.2 (92%) | 52.8 (88%) | 50.4 (84%) | 48 (80%) |
| Standard deviation (Ah) | 0(0%) | 0.36 (3%) | 0.69 (6%) | 0.99 (9%) | 1.26 (12%) | 1.5 (15%) |
| UH | Si1 | Si2 | Si3 | Si4 |
|---|---|---|---|---|
| +Vb | 1 | 0 | 0 | 1 |
| 0 | 0 | 1 | 0 | 1 |
| 0 | 1 | 0 | 1 | 0 |
| Vb | 0 | 1 | 1 | 0 |
| Number of Groups/n | Module Parameter | Efficiency Analysis | |||||
|---|---|---|---|---|---|---|---|
| Number of Each Pack/N/n | Module Voltage (V) | MOSFET Parameter | Ploss1 | Ploss2 | Ploss | H | |
| 2 | 50 | 160–210 | 500 V/497 A | 113 W | 19 W | 1056 W | 97.146% |
| 5 | 20 | 64–84 | 200 V/417 A | 50 W | 16 W | 1320 W | 96.432% |
| 10 | 10 | 32–42 | 100 V/420 A | 34 W | 17 W | 2043 W | 94.479% |
| 20 | 5 | 16–21 | 75 V/480 A | 23 W | 17 W | 3200 W | 91.35% |
| 25 | 4 | 12.8–16.8 | 75 V/480 A | 23 W | 17 W | 4000 W | 89.189% |
| 50 | 2 | 6.4–8.4 | 75 V/480 A | 22 W | 17 W | 7800 W | 78.919% |
| Cycle(Times) | 0 | 300 | 600 | 900 | 1200 | 1500 |
|---|---|---|---|---|---|---|
| Mean (Ah) | 100% (60) | 96% (57.6) | 92% (55.2) | 88% (52.8) | 84% (50.4) | 80% (48) |
| Standard deviation (Ah) | 0 (0) | 3% (0.36) | 6% (0.69) | 9% (0.99) | 12% (1.26) | 15% (1.5) |
| Optimal number of groups | 1 | 2 | 2–5 | 5 | 5 | 5 |
| Items | Discharge Capacity (Ah) | Discharge Energy (Wh) | Energy Utilization Efficiency | Theoretical Value (α = 0.95) | Error | |
|---|---|---|---|---|---|---|
| Configuration 1 | 44.22 | 3444.084 | 89.74% | 89.39% | 0.35% | |
| Configuration 2 | G1 | 43.82 | 1691.860 | 90.89% | 91.29% | −0.4% |
| G2 | 46.14 | 1796.272 | ||||
| Configuration 3.1 | G1 | 43.66 | 1123.480 | 92.37% | 92.38% | −0.01% |
| G2 | 45.87 | 1185.187 | ||||
| G3 | 47.85 | 1236.292 | ||||
| Configuration 3.2 | G1 | 42.56 | 1102.626 | 93.06% | 92.38% | 0.68% |
| G2 | 47.67 | 1230.209 | ||||
| G3 | 47.90 | 1238.653 | ||||
© 2016 by the authors; licensee MDPI, Basel, Switzerland. This article is an open access article distributed under the terms and conditions of the Creative Commons Attribution (CC-BY) license (http://creativecommons.org/licenses/by/4.0/).
Share and Cite
Diao, W.; Jiang, J.; Liang, H.; Zhang, C.; Jiang, Y.; Wang, L.; Mu, B. Flexible Grouping for Enhanced Energy Utilization Efficiency in Battery Energy Storage Systems. Energies 2016, 9, 498. https://doi.org/10.3390/en9070498
Diao W, Jiang J, Liang H, Zhang C, Jiang Y, Wang L, Mu B. Flexible Grouping for Enhanced Energy Utilization Efficiency in Battery Energy Storage Systems. Energies. 2016; 9(7):498. https://doi.org/10.3390/en9070498
Chicago/Turabian StyleDiao, Weiping, Jiuchun Jiang, Hui Liang, Caiping Zhang, Yan Jiang, Leyi Wang, and Biqiang Mu. 2016. "Flexible Grouping for Enhanced Energy Utilization Efficiency in Battery Energy Storage Systems" Energies 9, no. 7: 498. https://doi.org/10.3390/en9070498