Article

Integrated Combined Heat and Power System Dispatch Considering Electrical and Thermal Energy Storage

School of Electrical Engineering, Wuhan University, Wuhan 430072, China
*
Author to whom correspondence should be addressed.
Energies 2016, 9(6), 474; https://doi.org/10.3390/en9060474
Submission received: 5 April 2016 / Revised: 28 May 2016 / Accepted: 8 June 2016 / Published: 20 June 2016

Abstract

:
Wind power has achieved great development in Northern China, but abundant wind power is dissipated, rather than utilized, due to inflexible electricity production of combined heat and power (CHP) units. In this paper, an integrated CHP system consisting of CHP units, wind power plants, and condensing power plants is investigated to decouple the power and heat production on both the power supply side and heat supply side, by incorporating electrical energy storage (EES) and thermal energy storage (TES). Then the integrated CHP system dispatch (ICHPSD) model is formulated to reach the target of reducing wind power curtailment and primary energy consumption. Finally, the feasibility and effectiveness of the proposed ICHPSD model are verified by the six-bus system, and the simulation results show that EES has a better effect on wind power integration than TES. The annual net benefits by incorporating EES and TES increase with increasing wind penetration, but they gradually approach saturation. Introducing both EES and TES can largely increase the amount of wind power integration and improve the operation efficiency of the system.

Graphical Abstract

1. Introduction

The targets of reducing fossil fuel consumption and greenhouse gas emission are driving China to vigorously develop renewable energy [1]. Among the various forms of renewable energy, wind power is deemed as the most promising one due to its economic viability and technical maturity. In China it has become the third largest electricity provider following coal-fired power and hydropower [2]. By the end of 2014, the cumulative installed capacity of wind energy in China reached 96.4 GW, accounting for about 26% of the global total [3]. Moreover, the large technically-exploitable potential of 1400 GW onshore wind energy and 600 GW offshore wind energy has been estimated in China [4].
However, wind energy curtailment always occurs due to the inflexible electricity production of CHP units. CHP units are widely used in the north of China and some European countries, such as Germany and Denmark [5]. With a much higher efficiency in energy utilization compared with separated generation of heat and power, it represents one of the promising technologies for a reduction in primary energy consumption and greenhouse gas emission. CHP is characterized by the coupled production of heat and power and operates with the “thermal load-following” strategy, in which the heat power produced by the plant is conditional by the users’ thermal demand [6], thus having a constrained adjustment ability of electricity generation, which is a barrier to accommodate more wind power [7].
Improving the flexibility of CHP will significantly benefit for the wind power integration. Introducing EES to store the curtailed wind energy is a straightforward way [8,9,10]. Among the EES technologies which are suitable for large-scale applications, conventional battery storage is efficient but the investment would be very high. Pumped hydro is fit for large-scale applications but it is applicable only in certain locations [11]. Nowadays, hydrogen storage is emerging as a promising alternative due to high energy density, clean fuel, and relatively low capital cost [12,13]. Adding hydrogen storage to a CHP system could improve the accommodation of wind power, as well as primary energy saving, since the wind energy curtailed in off-peak hours could be used to split water into hydrogen and oxygen. Hydrogen would be stored and then transformed to electrical energy, when necessary, by various ways.
Thermal energy storage (TES) is another attractive option for wind energy integration. Although thermal storage is not directly related with electrical energy production, introducing TES is an efficient solution to relieve the mismatch between heat/power demand and supply, by decoupling the generation of electricity and heat [14]. The surplus thermal energy is stored during the operating periods for a later use when electrical demand is low, leading to a decrease in heat production of CHP plants, along with a reduction in electricity production, as a result, wind power would be better integrated. Under the influence of real-time electricity pricing, a large number of TES units have been installed in European countries which have a large percentage of wind power [15]. For example, in Denmark, TES systems have been an important part of its 100% renewable energy system plan [16].
Many studies have been involved in the flexible operation of integrated CHP systems recently. In [17], heat pumps and thermal inertia of buildings and thermal comfort of end users are considered to increase the wind power integration. In [18], electric boilers and heat storage tanks are compared in terms of their performance in reducing wind curtailment and saving energy. [19] explores the energy storage capability of the district heating network to increase the flexibility of integrated CHP system. In [20], individual heat pumps, heat accumulation tanks and passive heat storage in construction have been investigated in terms of their potentials in increasing wind power utilization and improving primary energy saving. In [21], a CHP-based district heating system with TES is proposed to promote the utilization of renewable energy over a long period of time.
However, all of these studies optimized the system on the heat supply side. The effect of improving wind accommodation is limited when heat demand is low. The insufficient adjustments for increasing the flexibility of the integrated CHP system will occur as heat demand is very high. In this paper, the integrated CHP system in which CHP units are coupled with EES and TES is investigated to explore its capability to enhance the utilization of wind power. The flexibility of the system is improved on both the heat supply side and electricity supply side.
This paper is organized as follows. In Section 2, the electrical energy storages, thermal energy storages, and CHP units in the integrated CHP system are modeled. In Section 3, the ICHPSD model aimed at minimizing the total fuel cost and wind power curtailment is formulated. In Section 4, a case study with four scenarios is implemented to demonstrate the performance of the proposed method. Conclusions are presented in Section 5.

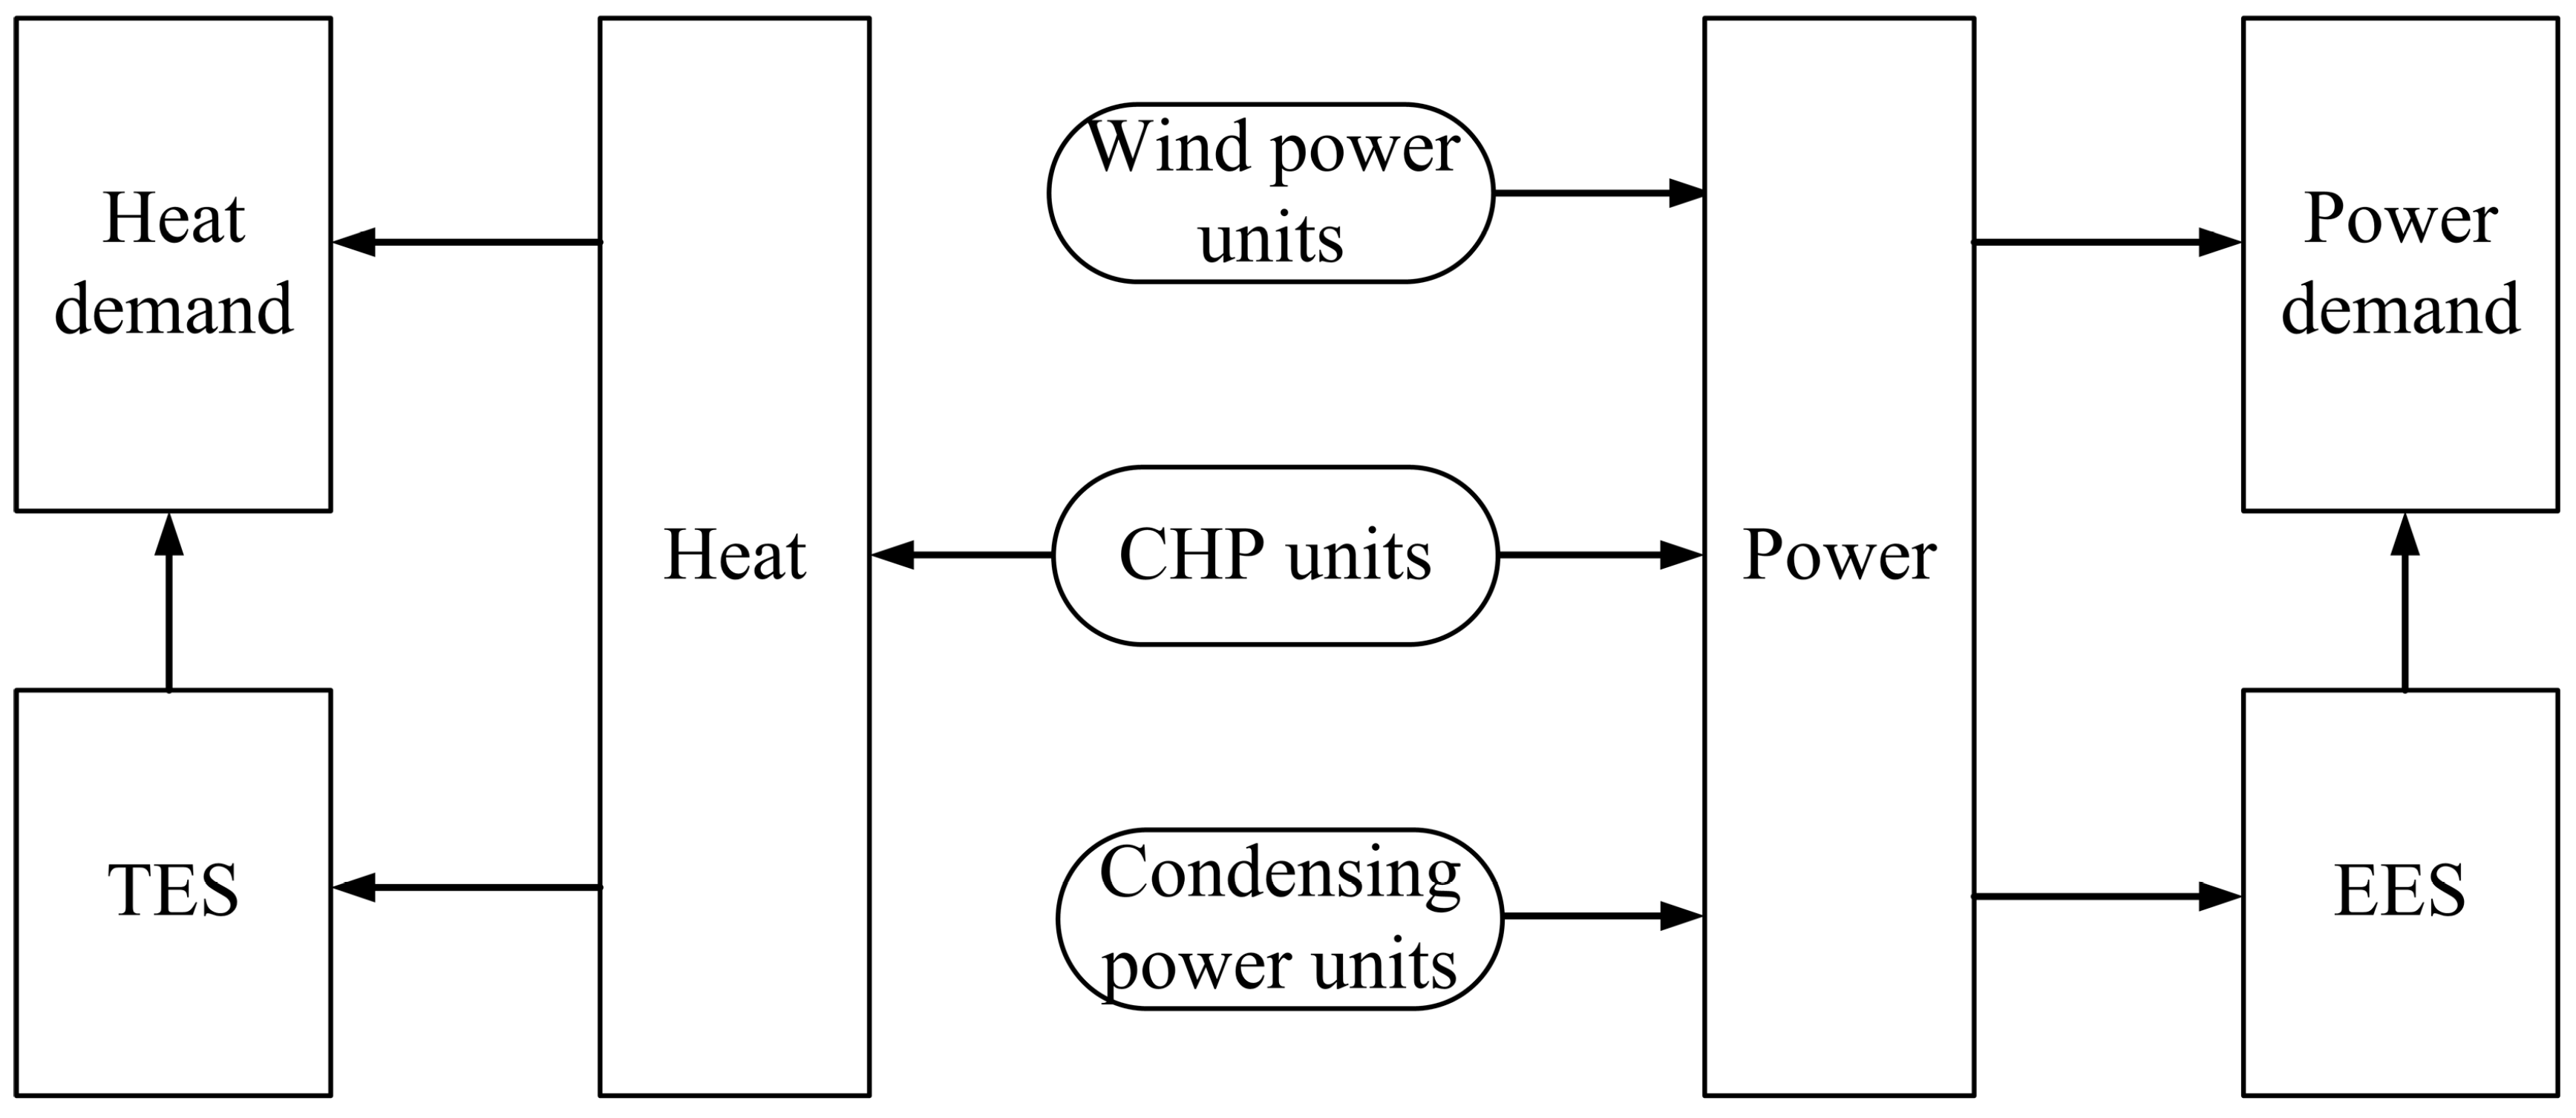
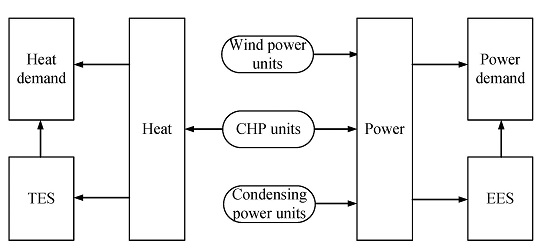
2. Integrated CHP System Model

An integrated CHP system consisting of CHP units, wind power plants, condensing power plants, EES, and TES is considered. In this system, heat demand is satisfied by CHP units and TES units, while power demand is satisfied by CHP units, condensing power units, wind power units and EES units, as shown in Figure 1. In this paper, the heat and power energy in the integrated CHP system are both assumed to totally self-sufficient. Additionally, it should be pointed out that there may be several heat regions whose heat demands are satisfied by different groups of CHP units and TES devices.

2.1. Electrical Energy Storage Model

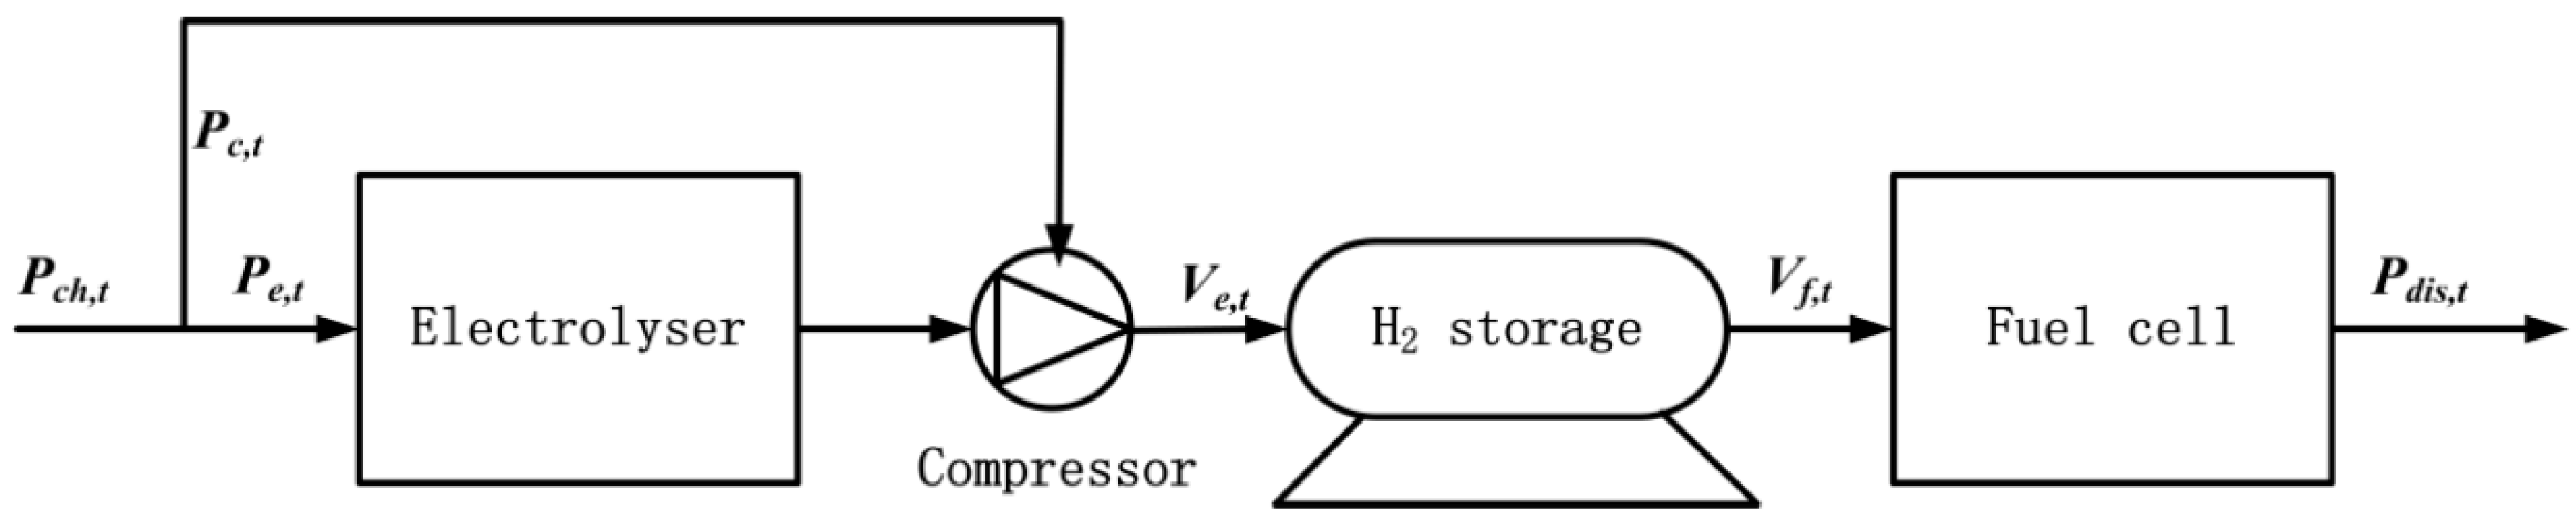
2.1.1. Description of Hydrogen Storage System

The typical hydrogen storage system is composed of an electrolyzer, a compressor, a storage tank, and a fuel cell, as shown in Figure 2. In the alkaline electrolyzer, water is decomposed into hydrogen and oxygen by the power input. The water electrolysis takes place between the anode and the cathode of the electrolyzer. The hydroxyl ions in the electrolyzer are transported to the anode and are split into water, oxygen gas and electrons. At the same time, the ionized hydrogen ions are attracted and transported to the cathode and then form hydrogen gas when combined with external electrons.
Then hydrogen gas is compressed by the compressor and stored in the pressurized storage tank. The fuel cell is used for re-electrification of hydrogen. It is a device that, like batteries, transforms chemical energy into electrical energy. The supplied hydrogen to the anode and oxygen to the cathode is ionized to hydrogen ions and oxygen ions, respectively. They recombine and produce electrical energy, as well as water and heat, which may be utilized [11].
During the charging process, with a supply of electrical energy to the electrolyzer, the water is electrolyzed and the produced hydrogen gas is compressed into the storage tank. The electrical energy is transformed to chemical energy and stored as hydrogen. During the discharging process, hydrogen is oxidized in the fuel cell and produces electric current. The chemical energy is converted to electrical energy and delivered to the power system when necessary [22].

2.1.2. Mathematical Model of Hydrogen Storage System

In this paper, a linear model for the charging/discharging model of hydrogen storage system is proposed based on the model in [23,24]. Both the electrolyzer and compressor consume energy; therefore, the charging rate of the storage system can be expressed as (1). Through the water electrolysis, the hydrogen production rate in time step t is shown in Equation (2). The compression power is defined as Equation (3) and discharging rate of the storage system as Equation (4).
P c h , t i = P e , t i + P c , t i
V e , t i = η e i P e , t i HHV
P c , t i = SEC c i V e , t i
P d i s , t i = η f i V f , t i HHV
where P c h , t i , P d i s , t i , P e , t i , P c , t i are the charging and discharging rate of the i-th hydrogen storage system, the power input of electrolyzer and the power consumption of compressor, respectively. V e , t i and V f , t i are the hydrogen production rate of the electrolyzer and the hydrogen consumption rate of the fuel cell. η e i , η f i are the overall efficiency of the electrolyzer and fuel cell, respectively. HHV is the higher heating value of hydrogen. SEC c i is the specific energy consumption of the compressor.
The relationship between one state of the storage tank and its previous is expressed as:
S t + 1 i = S t i + V e , t i V f , t i
where S t i is the storage level of the hydrogen storage tank at time step t. Summarizing the Equations (1)–(5), we can deduce the following expression:
S t + 1 i = S t i + η e i P c h , t i / ( HHV + SEC c i η e i ) P d i s , t i / ( η f i HHV )
Constraints on EES are listed as follows:
The storage level in energy storage is constrained to be not more than the capacity of energy storage:
0 S t i S c i
In Equation (7), S c i is the capacity of i-th hydrogen storage tank.
Energy storage charging and discharging rates should be not more than its maximum charging and discharging rates:
0 P c h , t i P c h , max i
0 P d i s , t i P d i s , max i
where P c h , max i and P d i s , max i represent the maximum charging and discharging rate of i-th electrical energy storage, respectively.
Energy storage should not be allowed to be charged and discharged at the same time step:
P c h , t i P d i s , t i = 0
Constraint on energy balance in one energy cycle: the storage level at the finish time step is assumed to be equal to that at the initial time step in one operating cycle:
S 0 i = S T i
where S 0 i and S 0 i are the storage level of hydrogen tank at the initial and finish time step, respectively.

2.2. Thermal Energy Storage Model

Among the various thermal storage styles, heat accumulator is a promising option due to low cost and environmental friendliness [25]. This accumulator utilizes the water as the heat storage medium, storing and releasing the heat energy based on the principle that the water with different temperature is stratified into several layers [18]. A small part of the heat would be lost due to energy exchange with external environment [26]. Thus, this kind of loss should be taken into consideration and is assumed to be proportional the previously stored heat [21]. Additionally, the heat charging and discharging efficiency are also taken into consideration. Then the stored heat energy level at time step t can be expressed by:
H t i = η t h , s t i H t 1 i + Q c h , t i η t h , c h i Q d i s , t i / η t h , d i s i
where H t i and H t 1 i are the stored heat level of accumulator at time step t and t−1, respectively. Q c h , t i and Q d i s , t i are the heat charging and discharging rate of heat accumulator at time step t, respectively. η t h , s t i , η t h , c h i , η t h , d i s i are the storage efficiency, heat charging, and discharging efficiency of the thermal storage, respectively.
The constraint on capacity of the TES can be expressed as:
H t i H c i
where H c i is the capacity of heat storage accumulator.
The constraint on maximum charging and discharging rate of TES:
0 Q c h , t i Q c h , max i
0 Q d i s , t i Q d i s , max i
where Q c h , max i and Q d i s , max i represent the maximum heat charging and discharging power, respectively.
The constraint on charging and discharging status of TES:
Q c h , t i Q d i s , t i = 0
The stored heat level at the end of last time step is assumed to be equal to that at the initial time:
H 0 i = H T i
where H 0 i and H T i are the stored heat level of heat storage tank at the initial time and last time, respectively.

2.3. CHP Unit Model

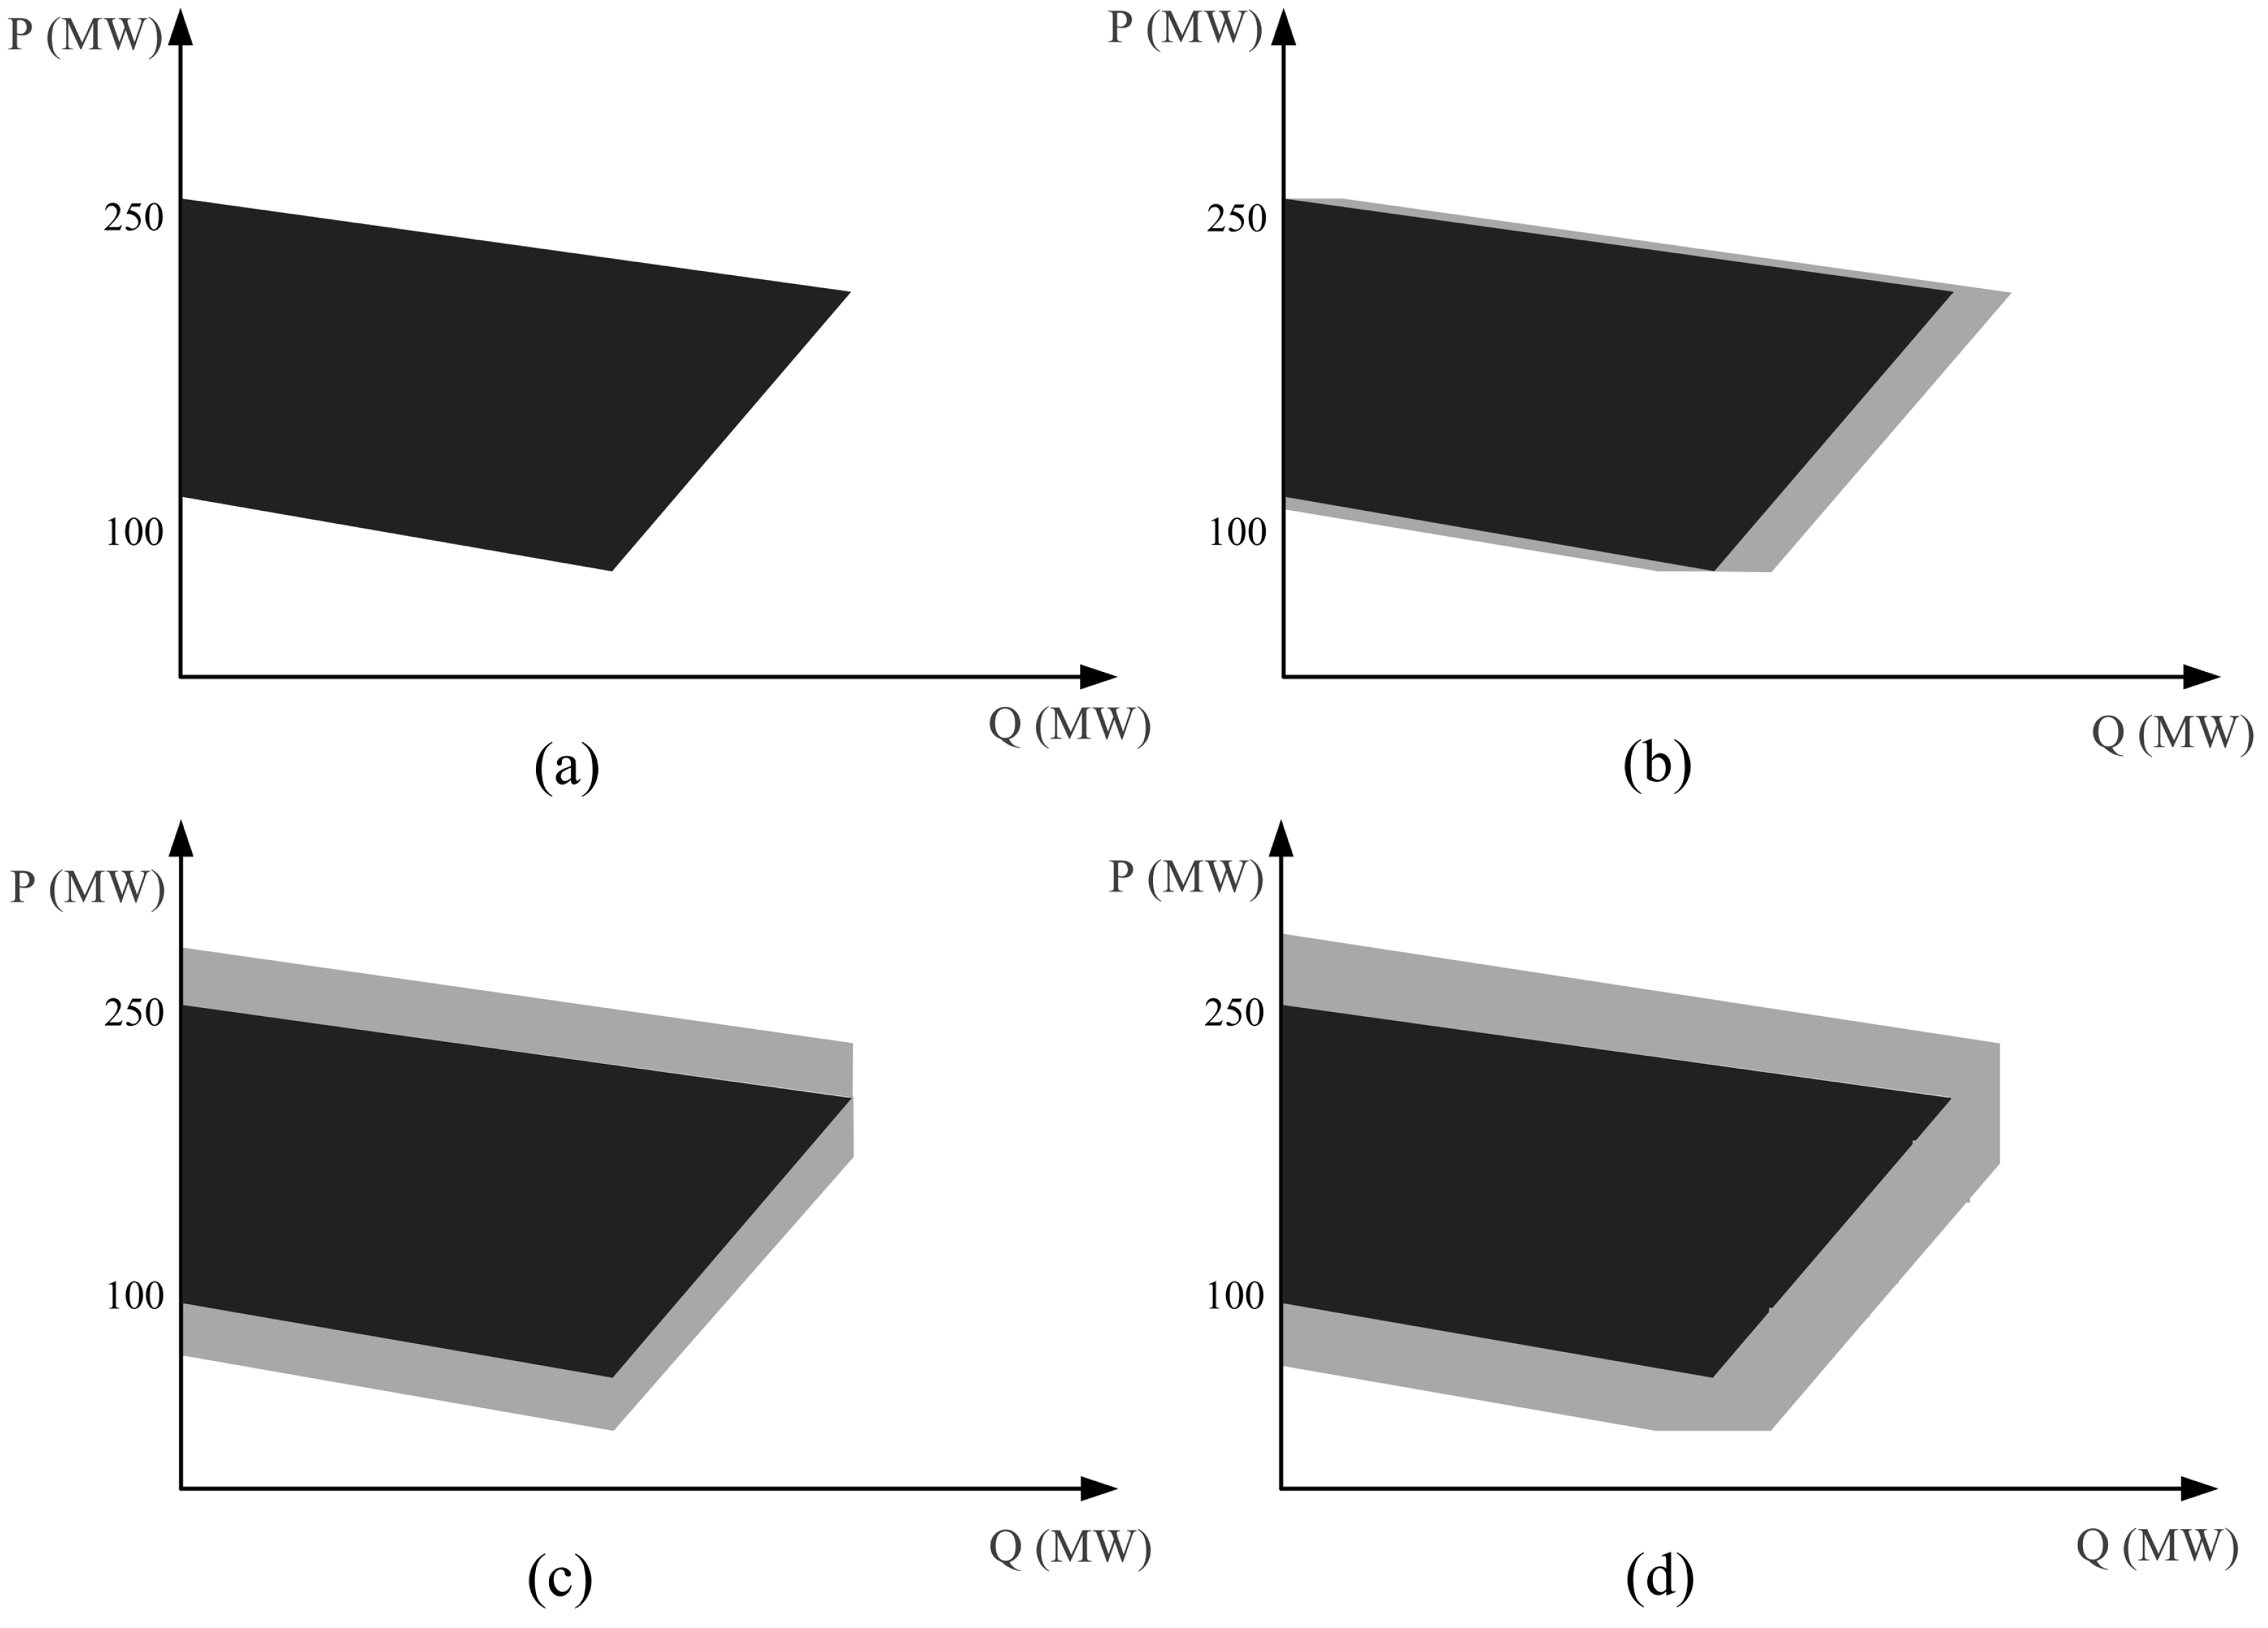
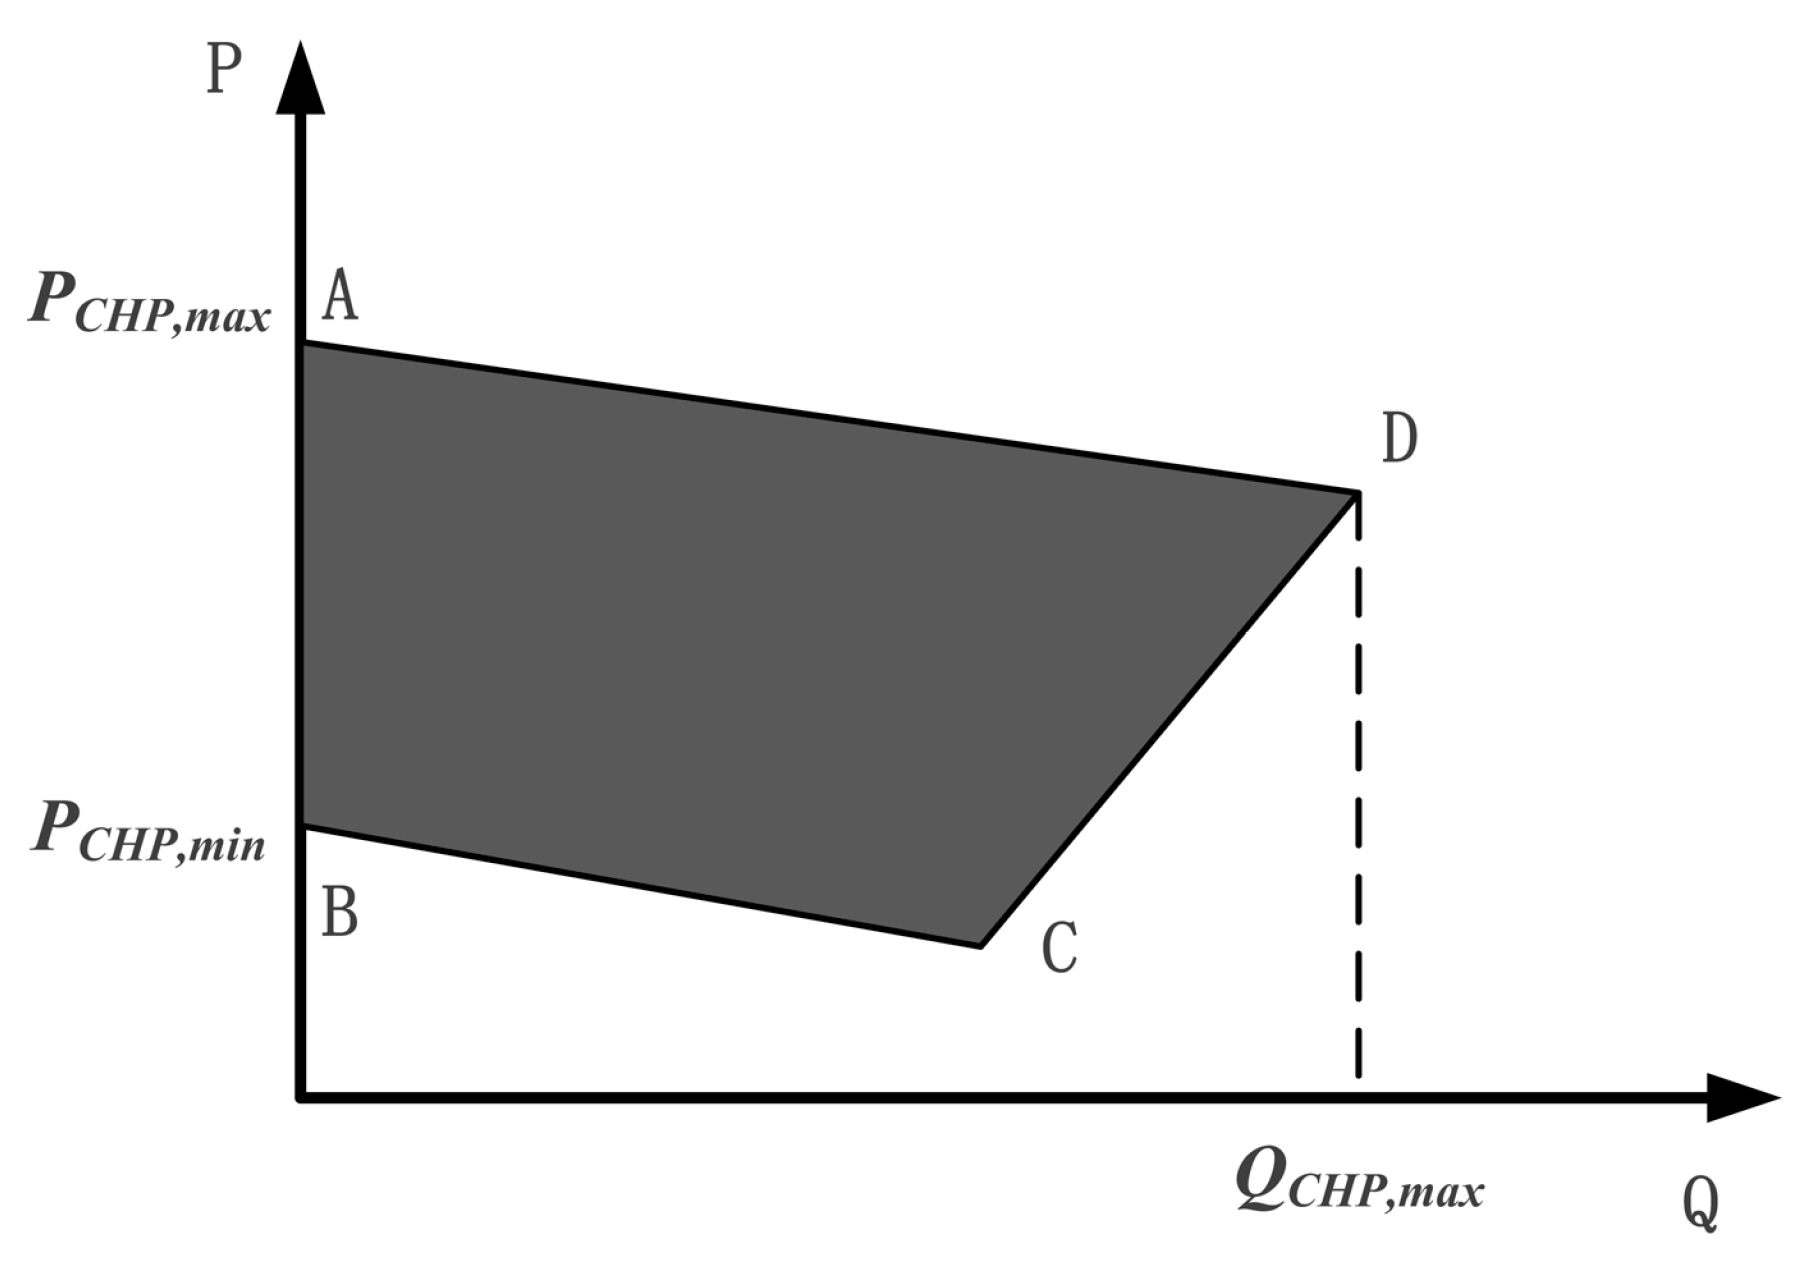
2.3.1. The Heat-Power Feasible Operation Region of CHP Unit

For the back-pressure unit, its power output is proportional to the heat output. In terms of extraction condensing unit, although its production of electricity and heat are also coupled, it has a more flexible heat-power generation characteristic compared with back-pressure turbine. A typical heat-power feasible operation region [27] for an extraction condensing CHP unit is shown in Figure 3. The power and heat outputs are constrained in the quadrilateral ABCD. P C H P , m a x and P C H P , m i n represent the maximum and minimum power output when the CHP acts as a power-only unit, respectively. Q C H P , m a x represents the maximum heat output of CHP.
The heat production constraint for CHP plant is defined as:
0 Q C H P , t i Q C H P , max i
where Q C H P , t i , Q C H P , max i are the heat output at time step t and the maximum heating rate of i-th CHP plant. According to Figure 3, the power production constraints for CHP plant can be defined as Equations (19)–(21):
P C H P , t i P C H P , min i k B C Q C H P , t i
P C H P , t i K i + k C D Q C H P , t i
P C H P , t i P C H P , max i k A D Q C H P , t i
where P C H P , t i is the power output at time step t of i-th CHP plant; K i is a constant. kBC, kCD, and kAD are the slopes of Line BC, CD, and AD, respectively.
The total hourly fuel cost of a CHP unit can be modeled as a quadratic function of electrical and thermal energy output, P C H P , t i and Q C H P , t i , respectively [28]:
C C H P , t i = α i + β i P C H P , t i + δ i P C H P , t i 2 + ε i Q C H P , t i + γ i Q C H P , t i 2 + μ i P C H P , t i Q C H P , t i
where C C H P , t i is the fuel cost in time step t of i-th CHP unit; α i , β i , δ i , ε i , γ i , and μ i are the cost coefficients of i-th CHP unit.

2.3.2. The Heat-Power Feasible Operation Region of CHP Unit when Introducing EES and TES

The heat-power feasible operation region will expand when introducing EES and TES. The expanded operation region of a representative 250 MW CHP plant when introducing a 30 MW EES and 30 MW TES is shown in Figure 4. The black region is the original heat-power feasible operation region while the grey region is the expanded region.
When introducing EES to the CHP unit, the equivalent feasible operation region extends vertically. The lower left and lower right boundaries will move downwards when EES is in the charging state, while the upper boundary will move upwards when EES is in the discharging state, as shown in Figure 4c. As a result, the maximum power output could increase 30 MW while the minimum power output could decrease 30 MW at any given thermal output.
Figure 4b shows the equivalent feasible operation region would expands horizontally. The lower left boundary will move leftwards when TES is charged, while the lower right and upper boundaries will move rightwards when the TES is discharged. Adding both EES and TES to the CHP unit will significantly extend the equivalent heat-power feasible operation region, as shown in Figure 4d. It will remarkably increase the flexibility of the CHP plant, leaving large room for wind power integration.

3. Integrated CHP System Dispatch (ICHPSD) Model

In this section, the ICHPSD model involving wind farms is formulated, where wind farms are regarded as power units having deterministic outputs. In the optimization model under investigation, the objective is to minimize the total fuel cost and wind power curtailment in an operating period, while meeting the constraints in terms of energy balance and the input/output characteristics of the energy sources. The unit commitment is assumed to be determined the day before.

3.1. Decision Variables

In the dispatch model, the electrical decision variables include power outputs of CHP units ( P C H P , t i ), condensing power units ( P c o n , t i ), wind power plants ( P w , t i ), and EES devices ( P c h , t i or P d i s , t i ) at time step t. The heat decision variables comprise heat outputs of CHP units ( Q C H P , t i ) and TES units ( Q c h , t i or Q d i s , t i ).

3.2. The Objective Function of the Dispatch Model

The objective function, considering the total fuel cost of CHP units and condensing power units as well as a penalty cost on wind power curtailment, is formulated as follow:
min C t o t a l = t T { i J C H P C C H P , t i + i J c o n C c o n , t i + i J w C w , t i }
where Ctotal is the total fuel cost of the CHP system, C C H P , t i , C c o n , t i , C w , t i are the fuel cost of i-th CHP plant, fuel cost of i-th condensing power plant, and penalty cost on curtailment of i-th wind power plant in time step t, respectively. T is length of the operating horizon; JCHP, Jcon, and Jw are the sets of CHP plants, condensing power plants and wind power plants, respectively. C C H P , t i is expressed in Equation (5) and the hourly fuel cost of a condensing power unit can be expressed as:
C c o n , t i = α i + β i P c o n , t i + δ i P c o n , t i 2 t T , i J c o n
where α i , β i , and δ i are the cost coefficients of i-th condensing power unit; P c o n , t i is the power output of i-th condensing power unit at time step t.
The penalty cost on curtailment of i-th wind power plant can be written as:
C w , t i = φ ( P w a v , t i P w , t i ) t T , i J w
where φ is the penalty cost coefficient, P w a v , t i , P w , t i are available wind power and actual power output of i-th wind power plant at time step t, respectively.

3.3. Constraints for Energy Balances

In this paper, we assume that both electrical and thermal energy are locally consumed. Power demand is satisfied by CHP units, condensing power units, wind power units and EESs, while thermal demand is satisfied only by CHP units and thermal energy storages. Thus, the power and thermal balance can be expressed in Equations (25) and (26).
i J C H P P C H P , t i + i J c o n P c o n , t i + i J w P w , t i i J E E S P c h , t i + i J E E S η e l , d i s i P d i s , t i = P d , t t T
i J C H P U C H P , j Q C H P , t i i J T E S U T E S , j Q c h , t i + i J T E S U T E S , j η t h , d i s i Q d i s , t i = Q d , t , j t T
where P d , t is the power demand in a local area at time step t. Q d , t , j is the thermal demand at time step t in j-th area. U C H P , j , U T E S , j are the sets of CHP units and TES units which provide heat energy for j-tharea, respectively.

3.4. Constraints for System Control and Operation

(1)
Constraints for thermal and electrical energy output of CHP plants are expressed in Equations (17)–(20).
(2)
Constraints for power ramping rate of CHP plants are expressed in Equations (28) and (29).
(3)
Constraints for power output of condensing power units are expressed in Equations (30).
(4)
Constraints for power ramping rate of condensing power units are expressed in Equations (31) and (32).
(5)
Constraint for power output of wind power in Equation (33) which means the power output should be smaller than the available wind power.
P C H P , t i P C H P , t 1 i P C H P , u p i t T , i J C H P
P C H P , t 1 i P C H P , t i P C H P , d o w n i t T , i J C H P
P c o n , min i P c o n , t i P c o n , max i t T , i J c o n
P c o n , t i P c o n , t 1 i P c o n , u p i t T , i J c o n
P c o n , t 1 i P c o n , t i P c o n , d o w n i t T , i J c o n
P w , t i P w a v , t i t T , i J w
where P C H P , u p i , P C H P , d o w n i , P c o n , u p i , P c o n , d o w n i are the ramp-up and ramp-down rates of i-th CHP unit and condensing power unit, respectively.
(6)
Constraints for EES device are described in Equations (6)–(11).
(7)
Constraints for TES device are described in Equations (12)–(17).

4. Case Study

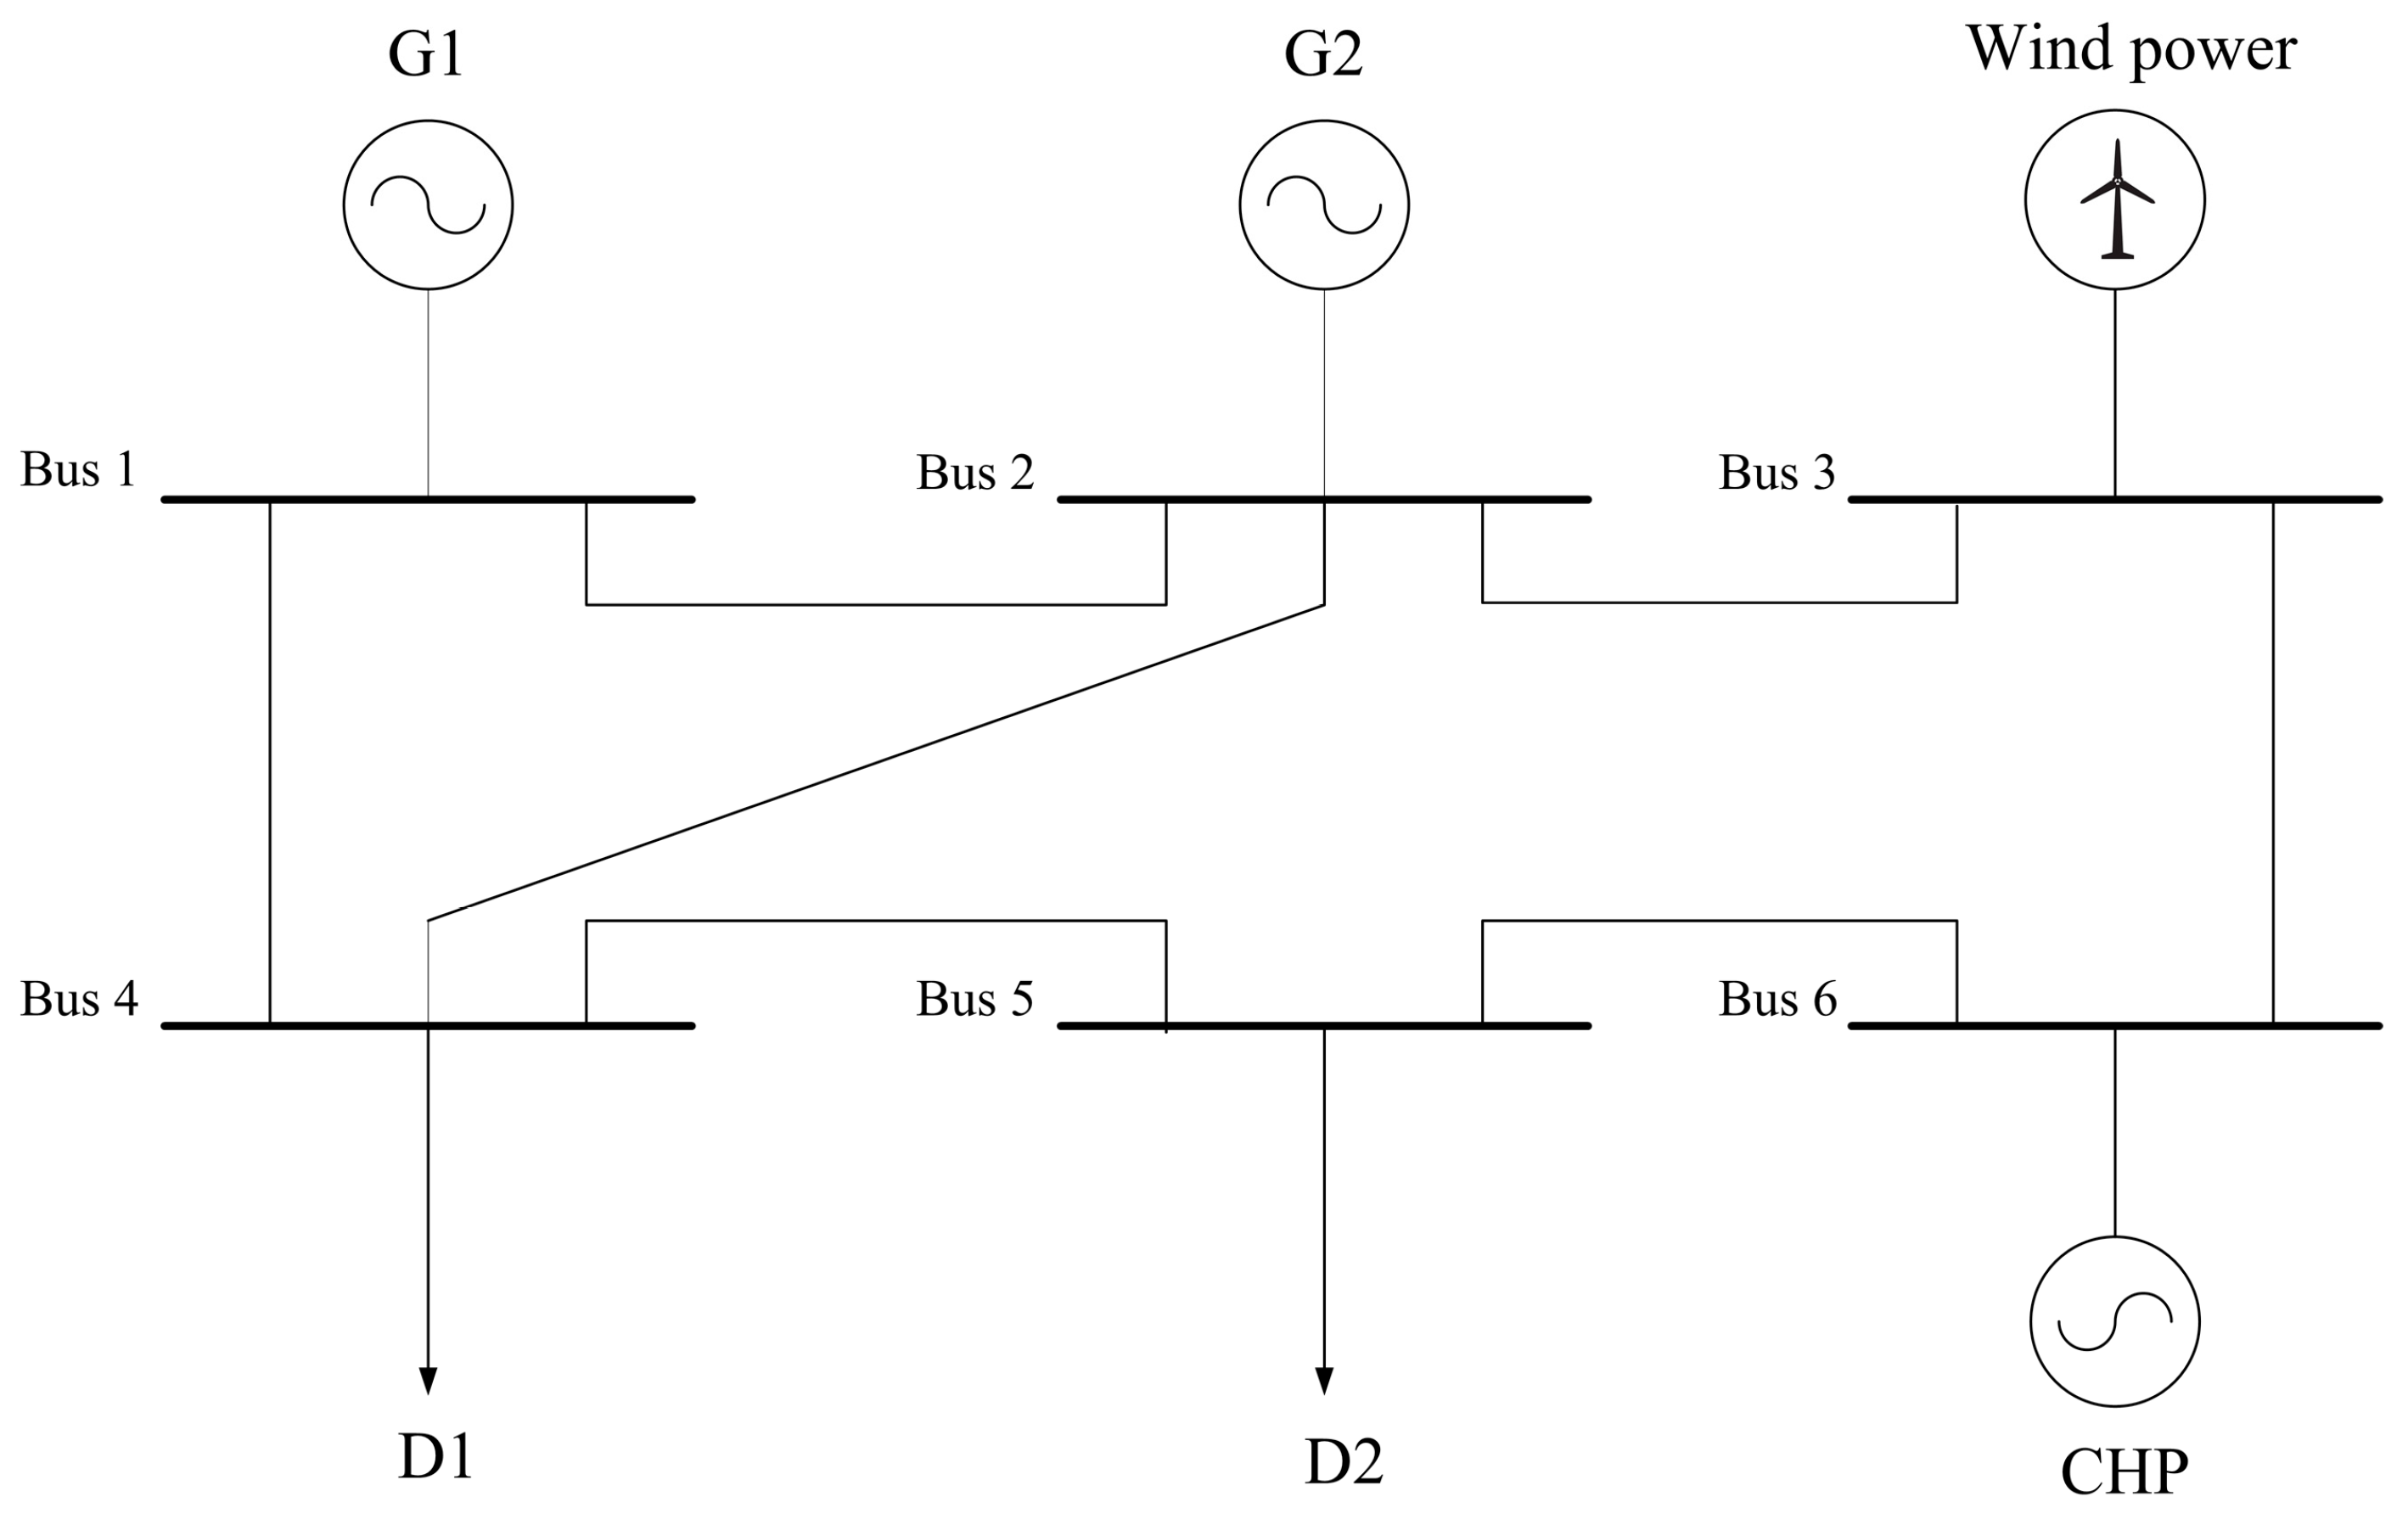
4.1. System Description
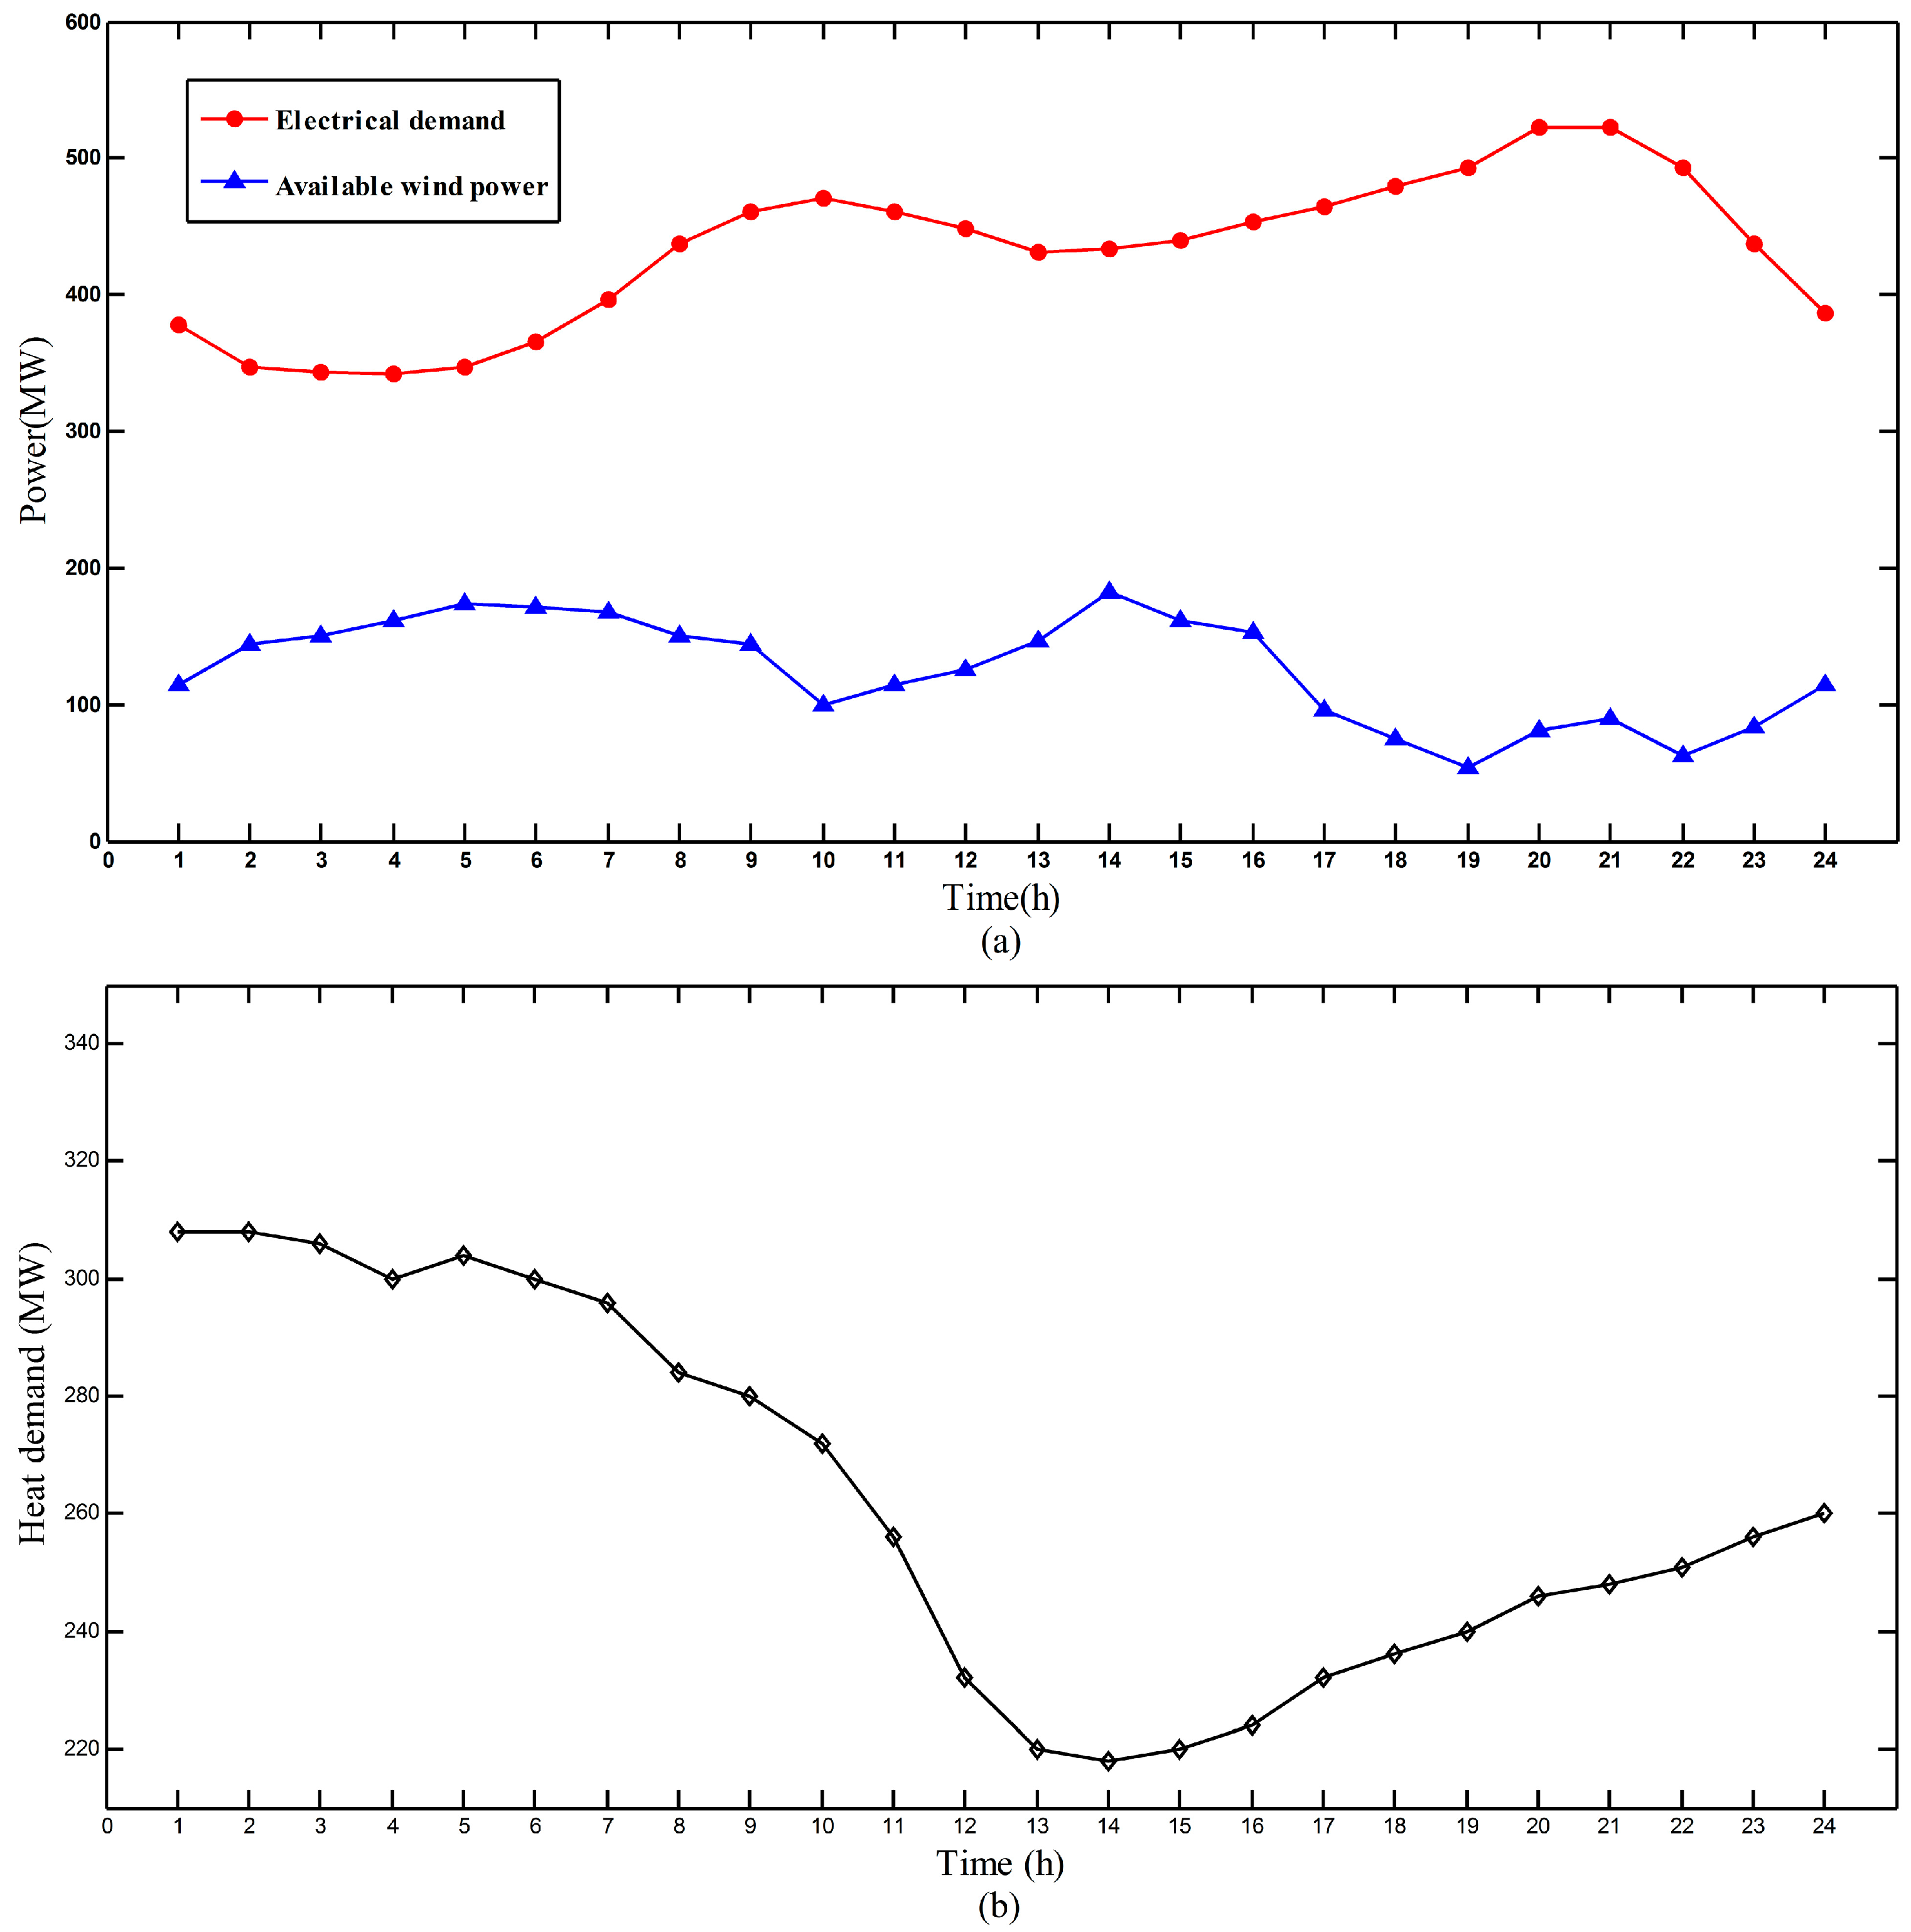
The integrated CHP system studied in this paper, aimed at satisfying the electrical and thermal energy demands of a special area, consists of: (i) one extraction condensing turbine CHP unit; (ii) two condensing power plants (G1 and G2); (iii) an EES device; (iv) a TES device; and (v) a wind power plant. The six-bus integrated CHP system [29] studied in this paper is shown in Figure 5.
To demonstrate the effectiveness and benefits of the proposed model, four different scenarios are taken into account, as shown in Table 1, where the cross means the corresponding EES or TES device is not included. In scenario 1, neither the EES device nor the TES device is introduced to the integrated CHP system. In scenario 2 and 3, a 30 MW EES device and a 30 MW TES device, respectively, are added to the system. In scenario 4, both the 30 MW EES and 30 MW TES are introduced. The storage capacity of EES and TES are both 300 MW.
The simulations were conducted on a computer with two Intel (R) Core (TM) i5 processors running at 2.50 GHz with 4.0 GB of memory. The dispatch model was coded in MATLAB R2014a (manufactured by the MathWorks Inc. in Natick, MA, USA) with the help of YALMIP (a MATLAB toolbox for rapid prototyping of optimization problems) and solved by the CPLEX solver(an optimizer manufactured by IBM WebSphere ILOG).

4.2. Model Input

Main input data of the integrated CHP system are: (i) the original parameters of the CHP plant and condensing power plants; (ii) hourly thermal and electrical demands; (iii) the input data of electrical and thermal energy storages; and (iv) the forecasted output values of wind power at 24 time points. A 24 h operation has been investigated by selecting a typical daily electrical and heat demand profile in the winter.
Profiles of electrical and heat demand, as well as forecasted wind power output, are shown in Figure 6. As can be seen from Figure 6a, the electrical demand and wind power output have the opposite peaks, which is in line with the situation in the real power system. The heat demand data is based on the hourly thermal data in a winter day [30]. The heat load in the morning and evening is higher than that in any other time, which is consistent with the living habits of residents. The CHP unit is the cheapest, while G2 is the most expensive one among the three thermal units. The simulations are designed for hourly generation dispatch over 24-h period.

4.3. Results

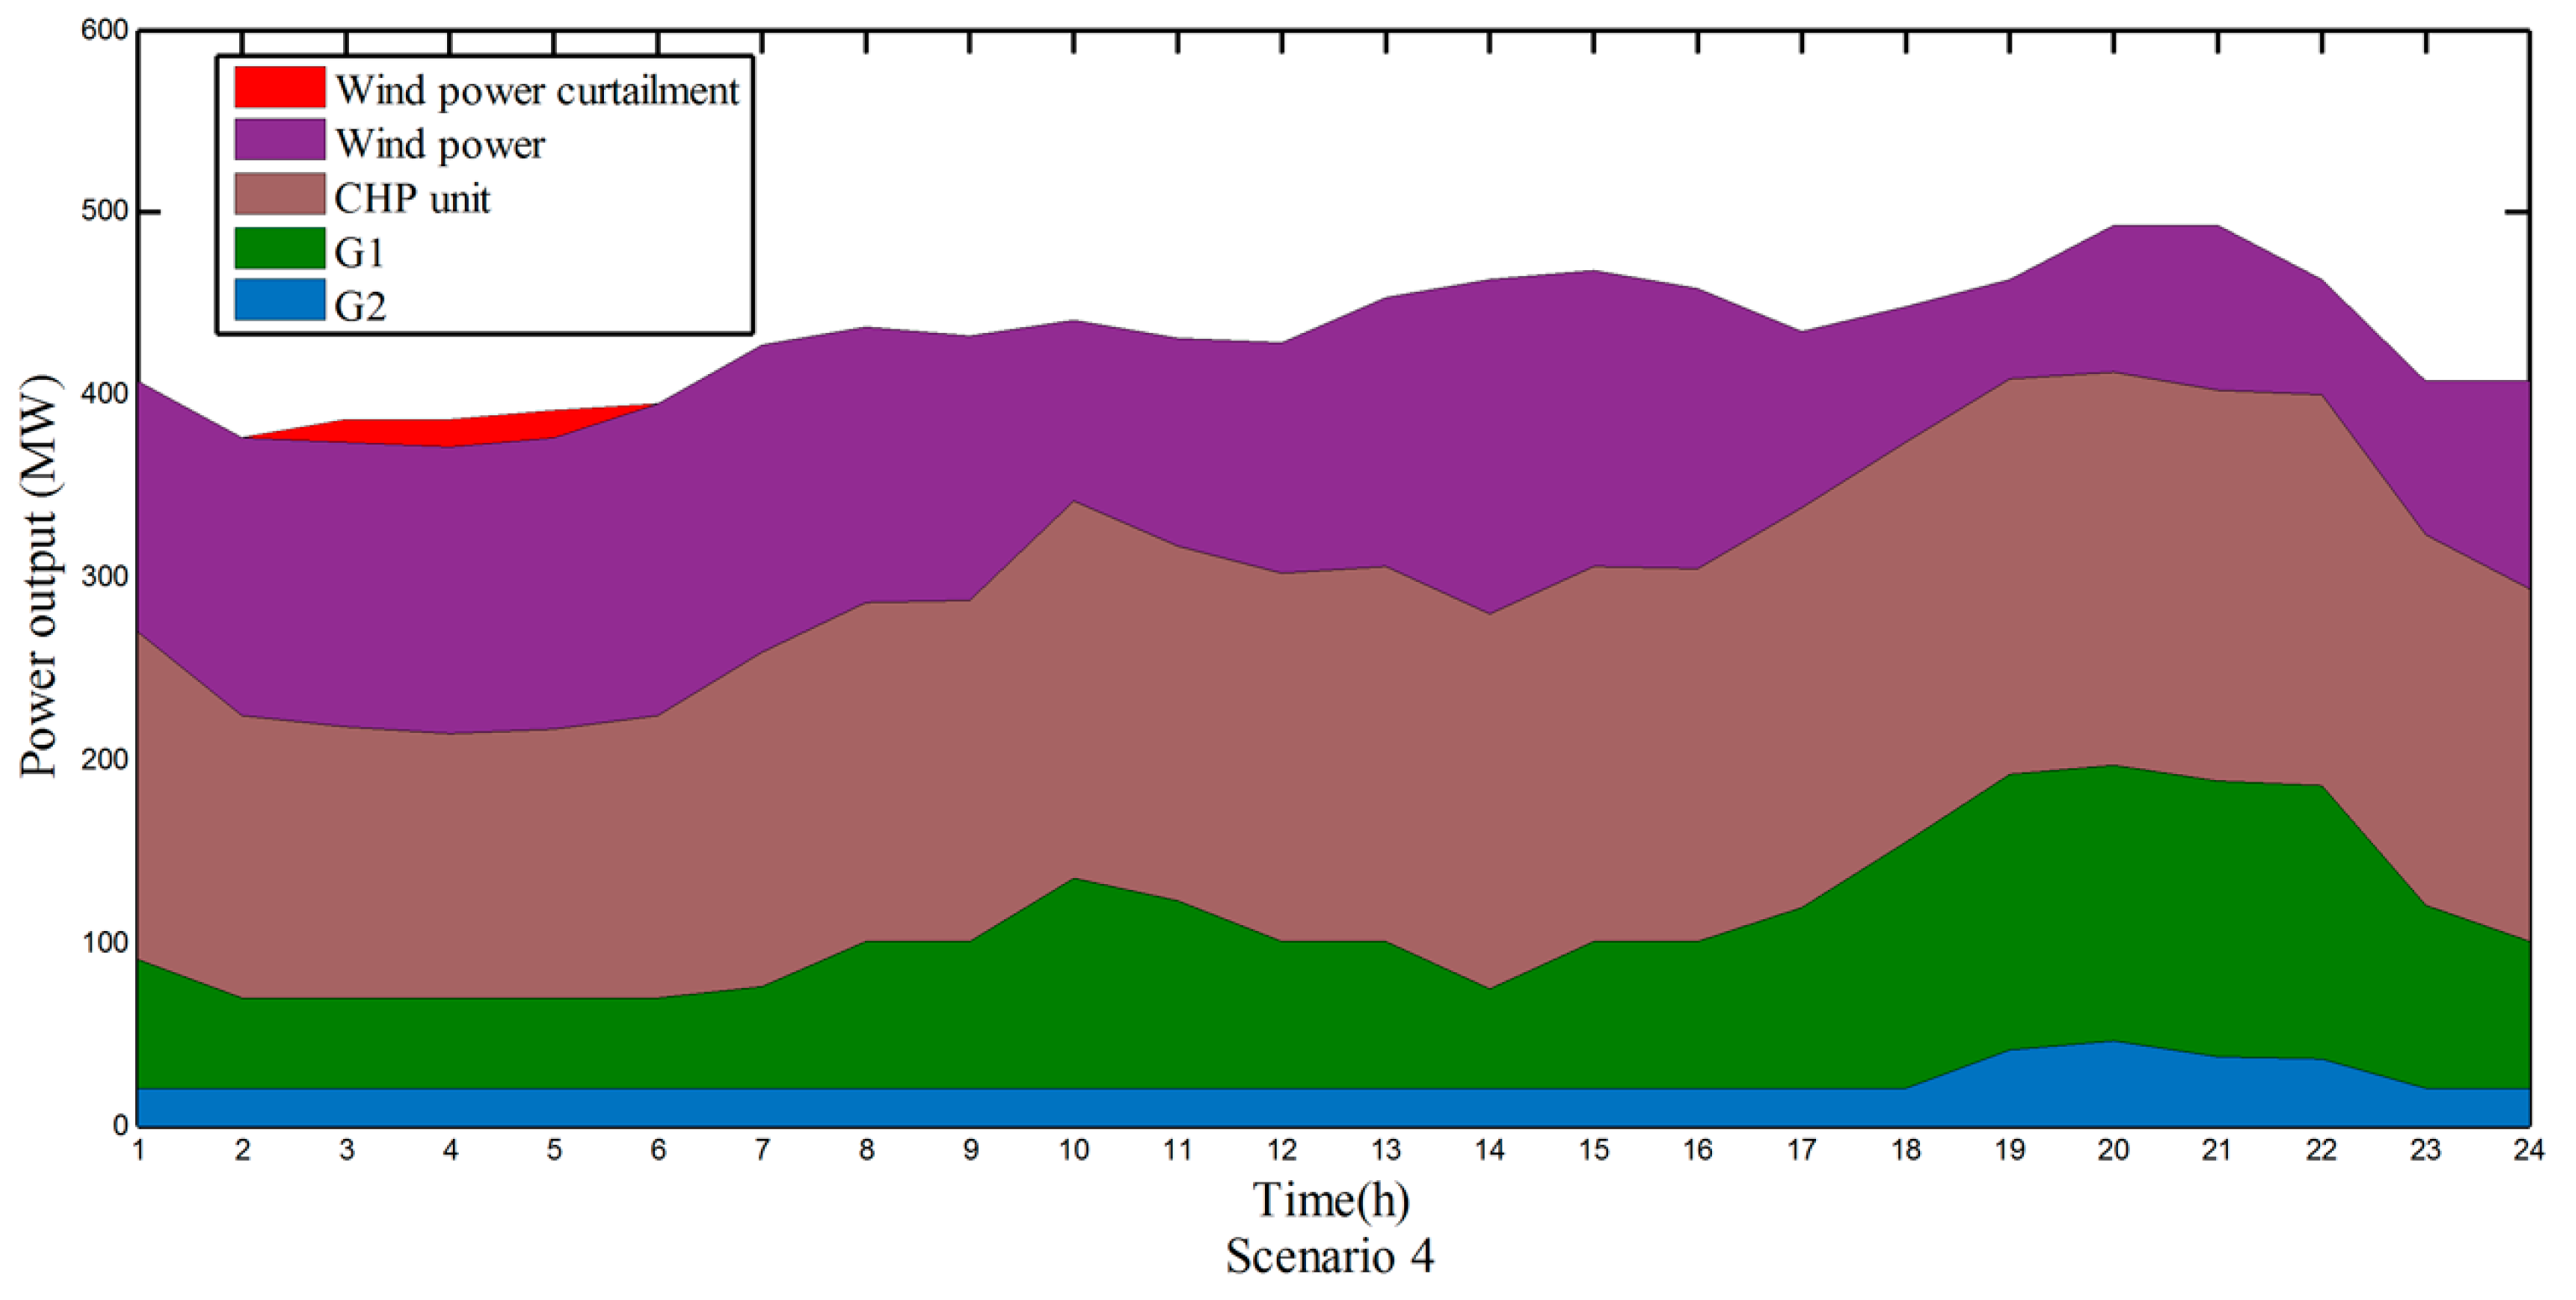
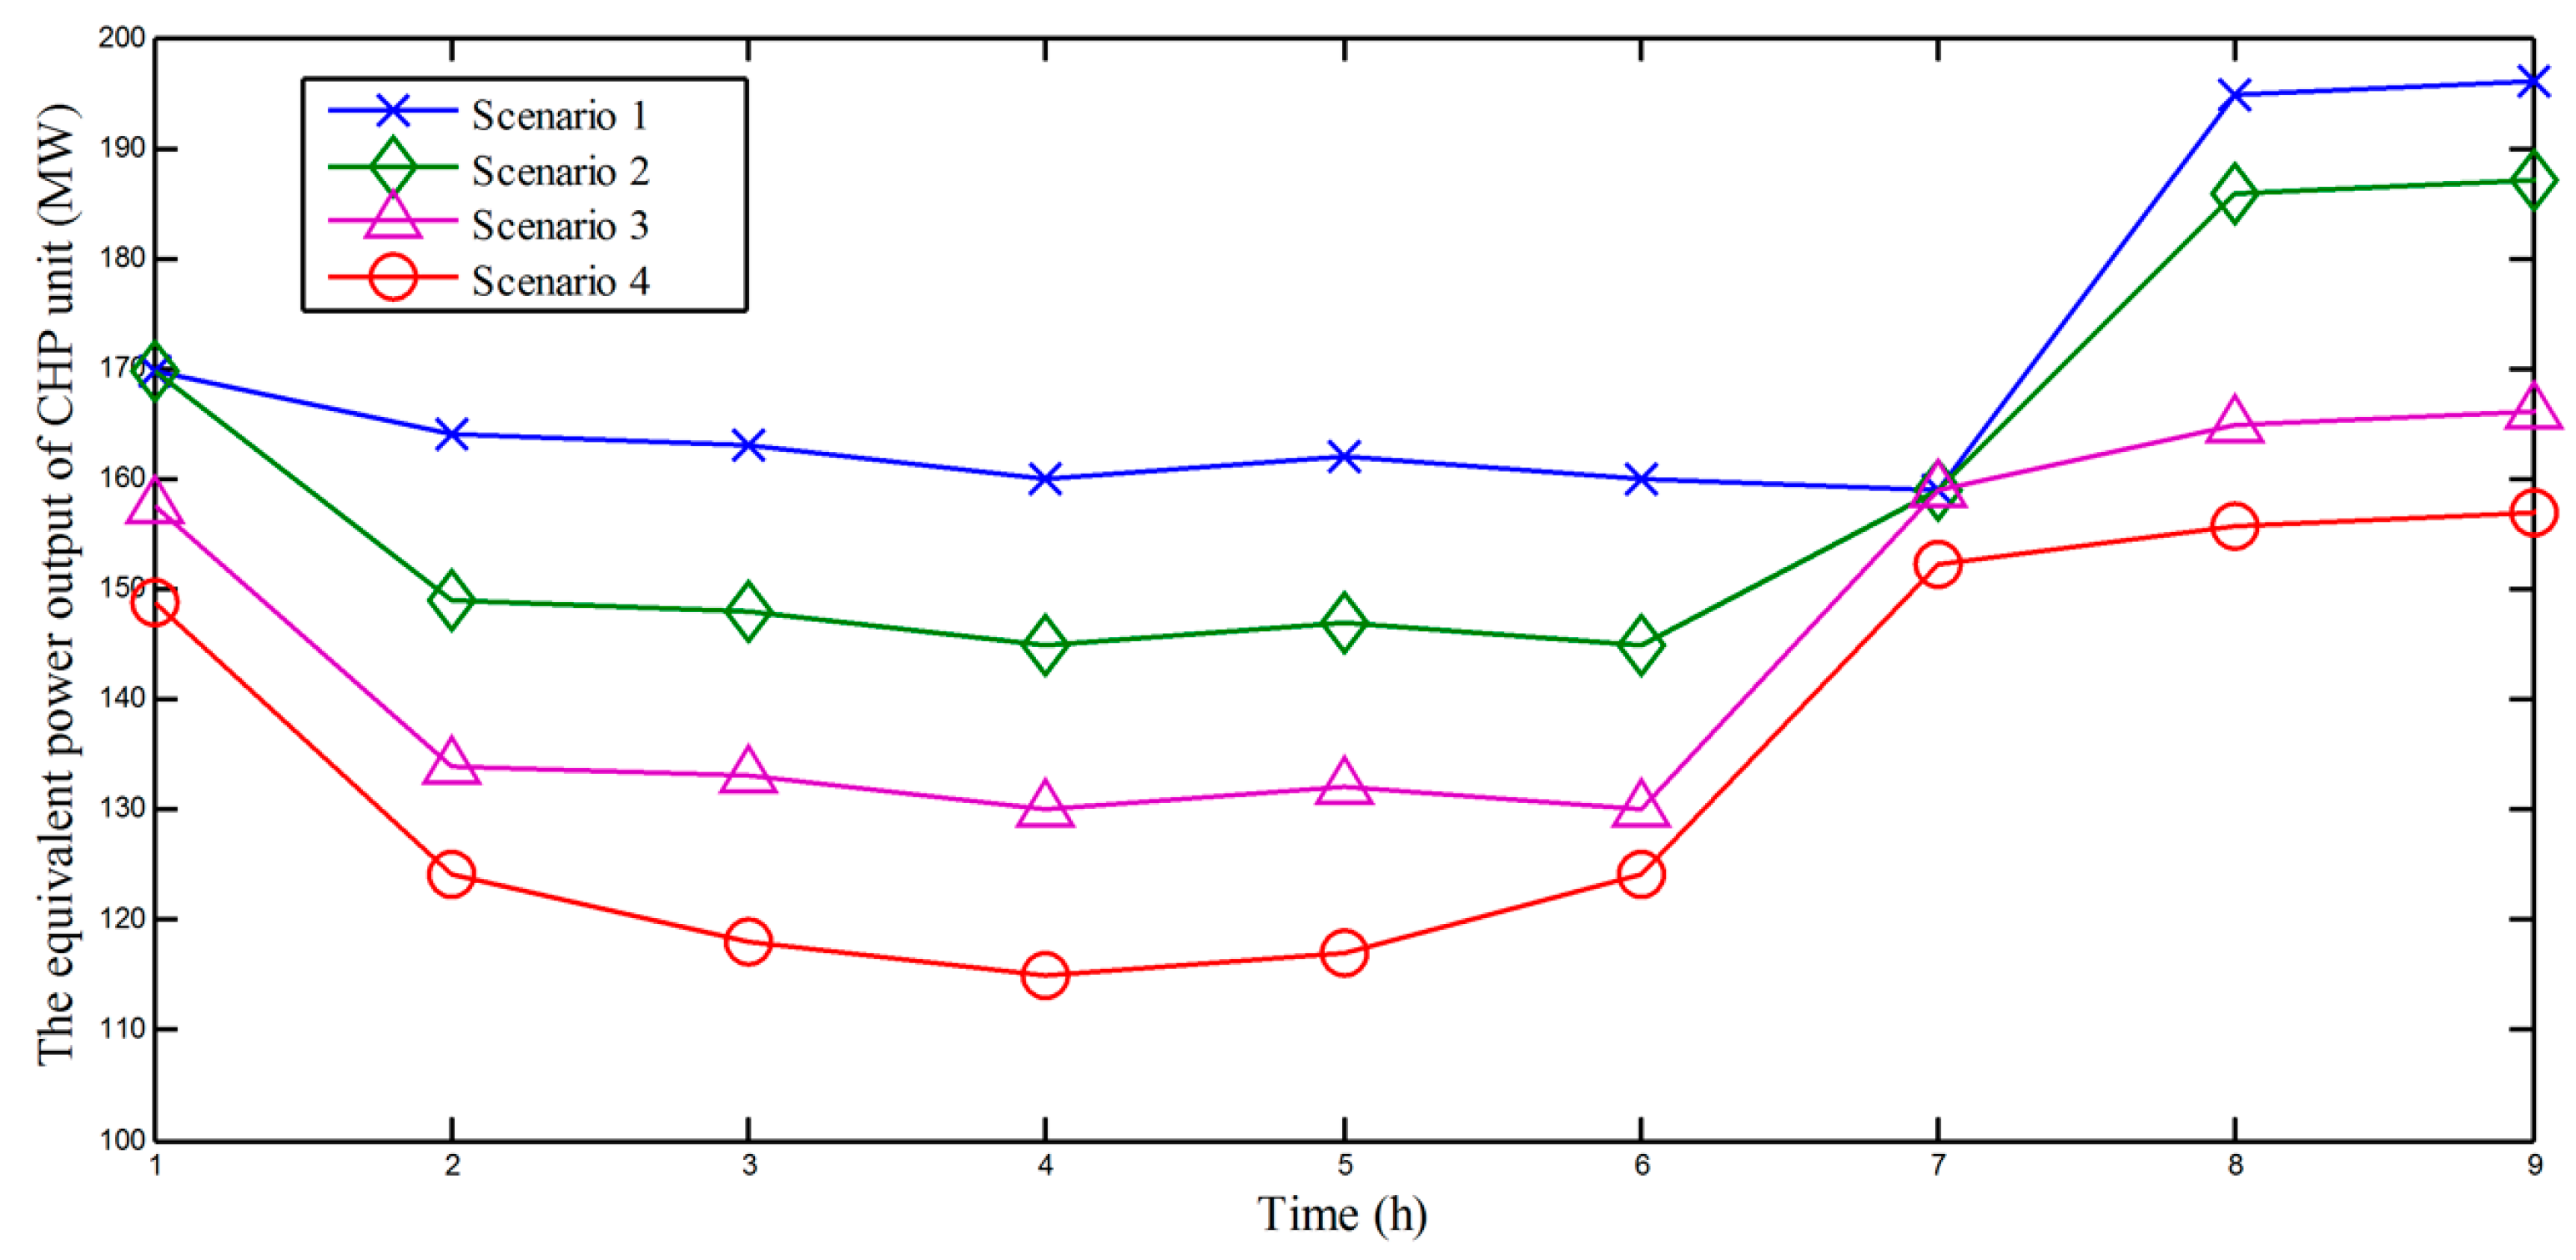
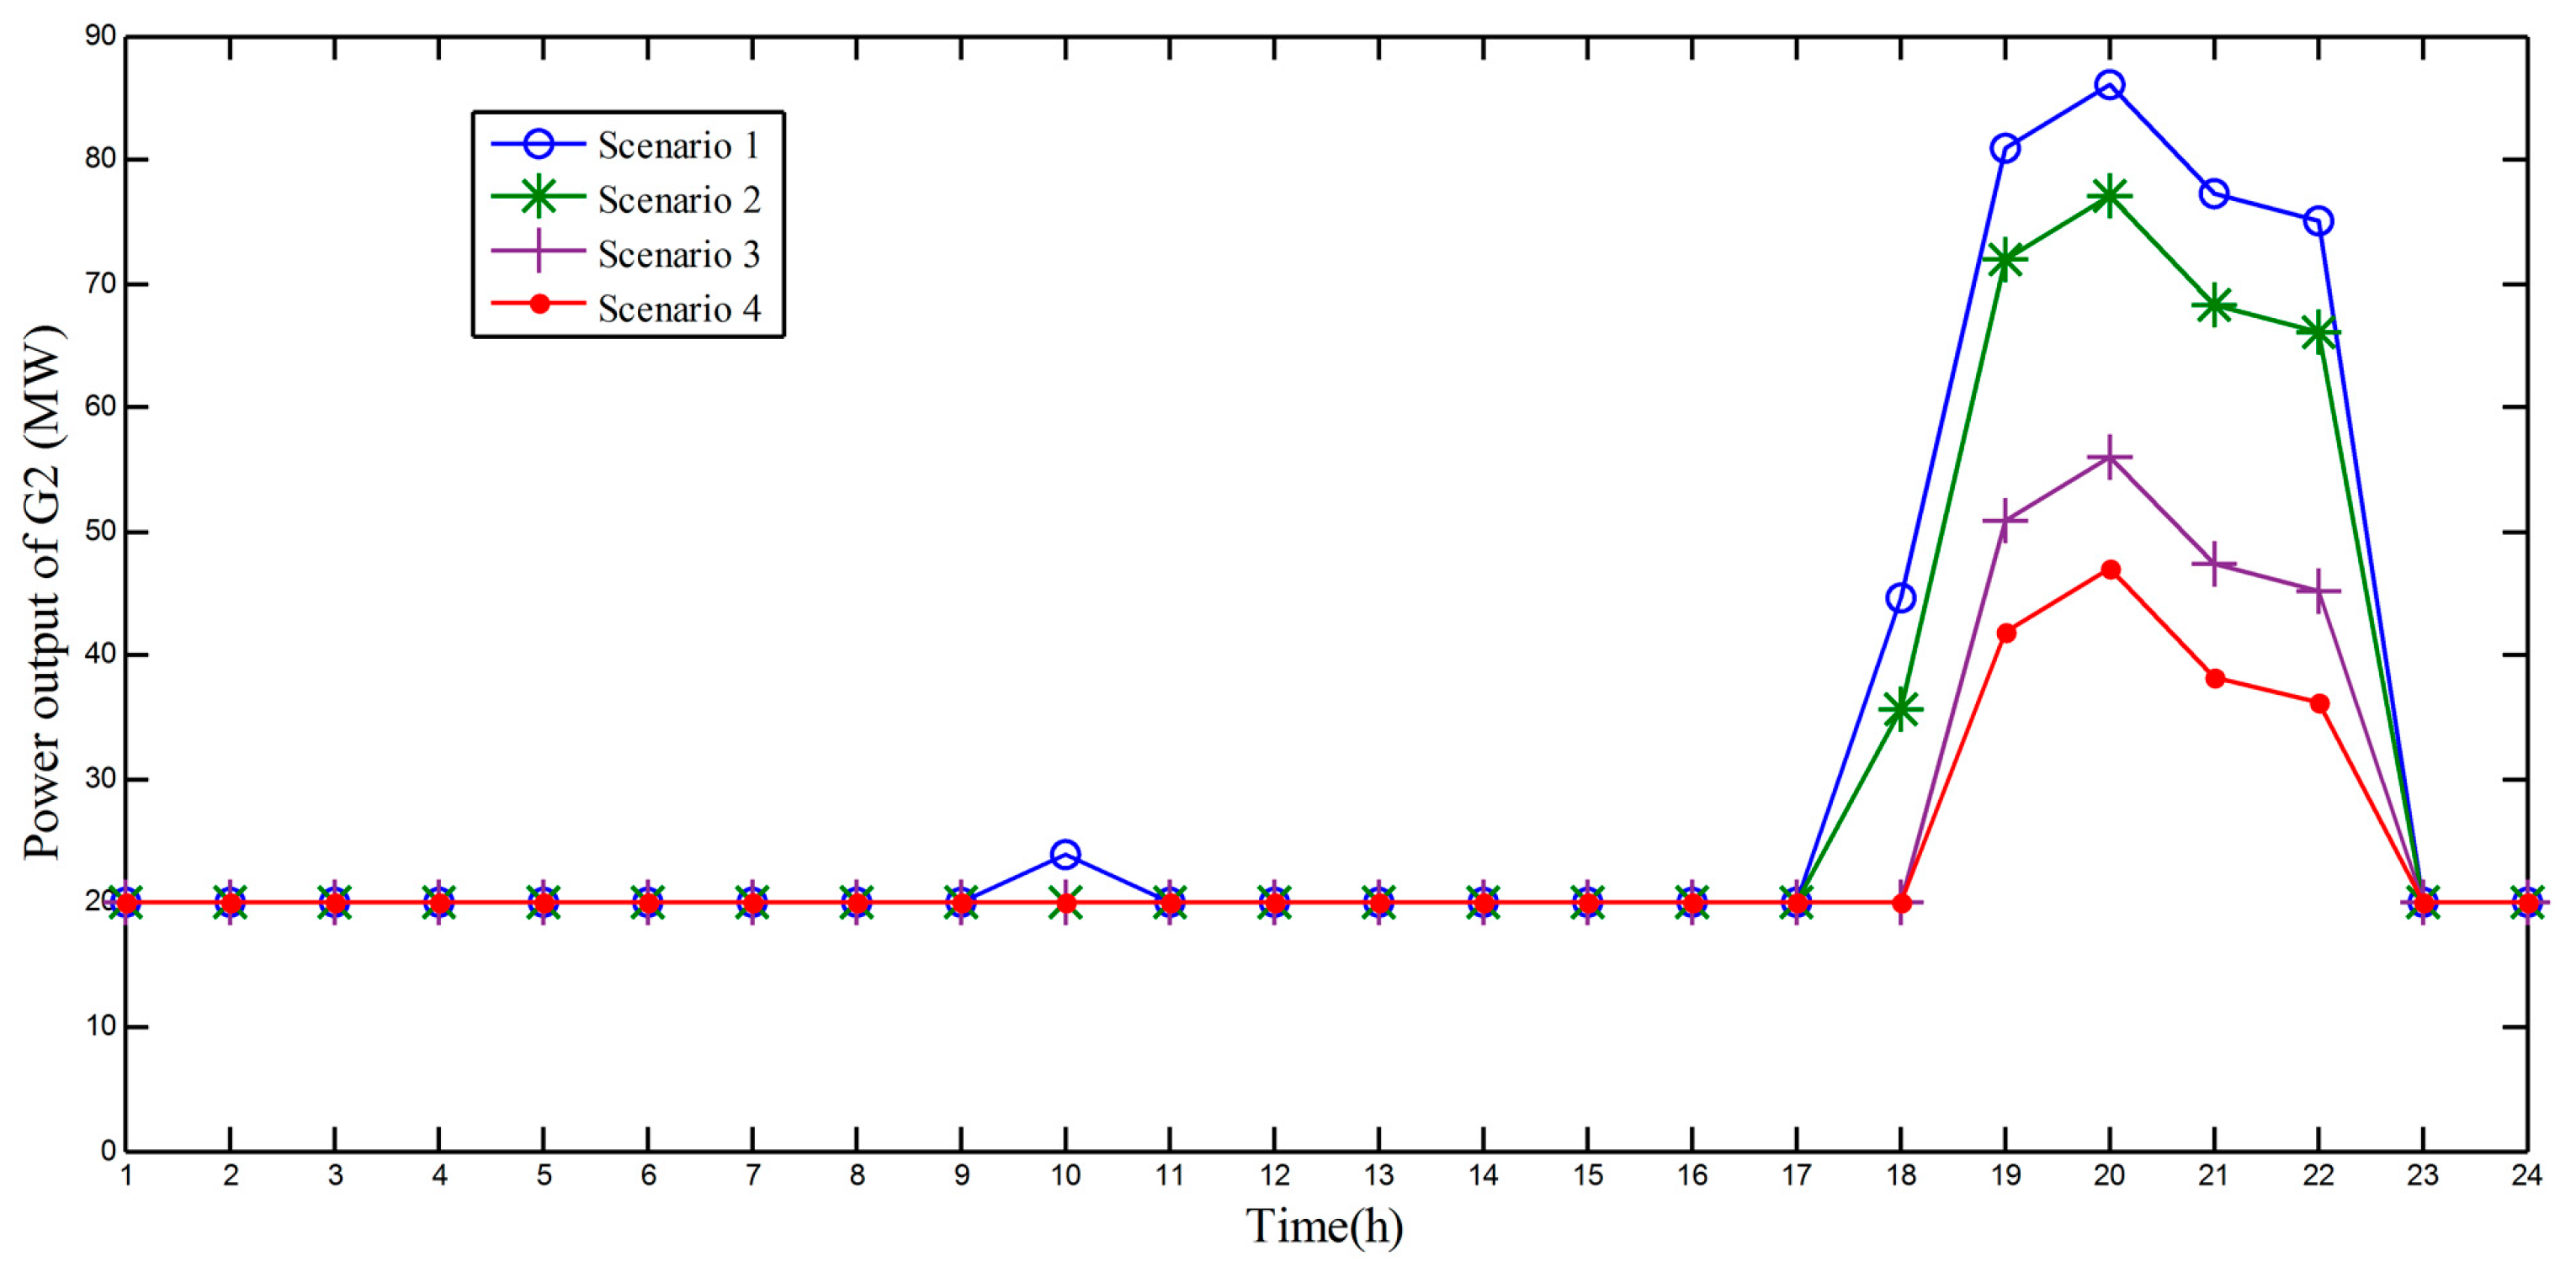
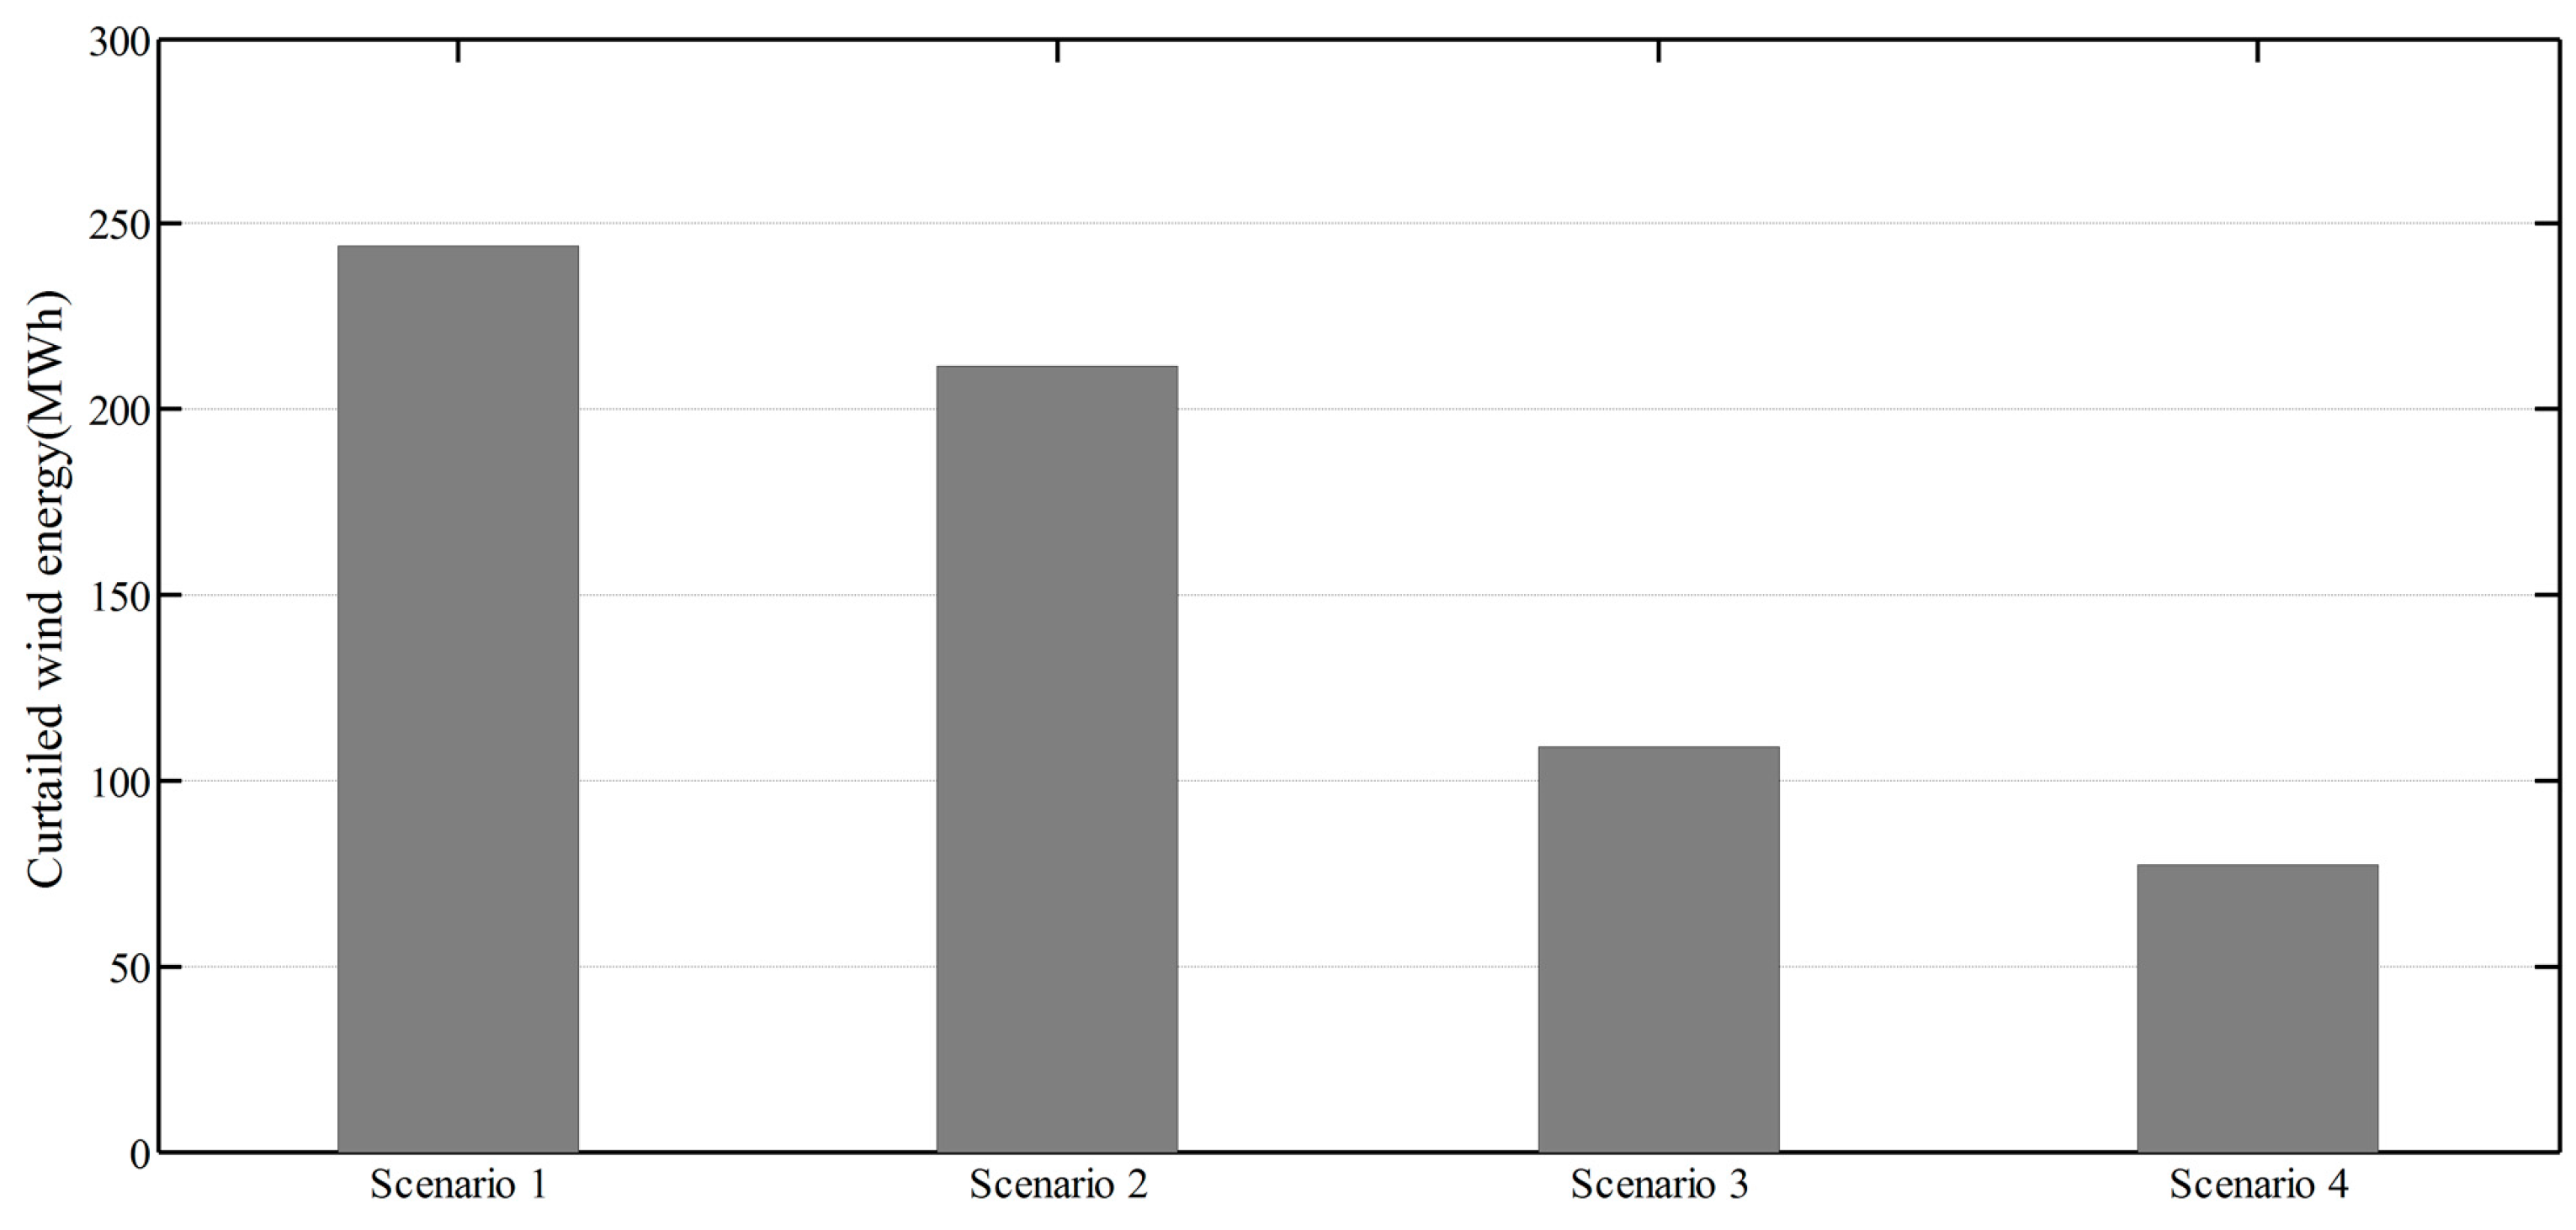
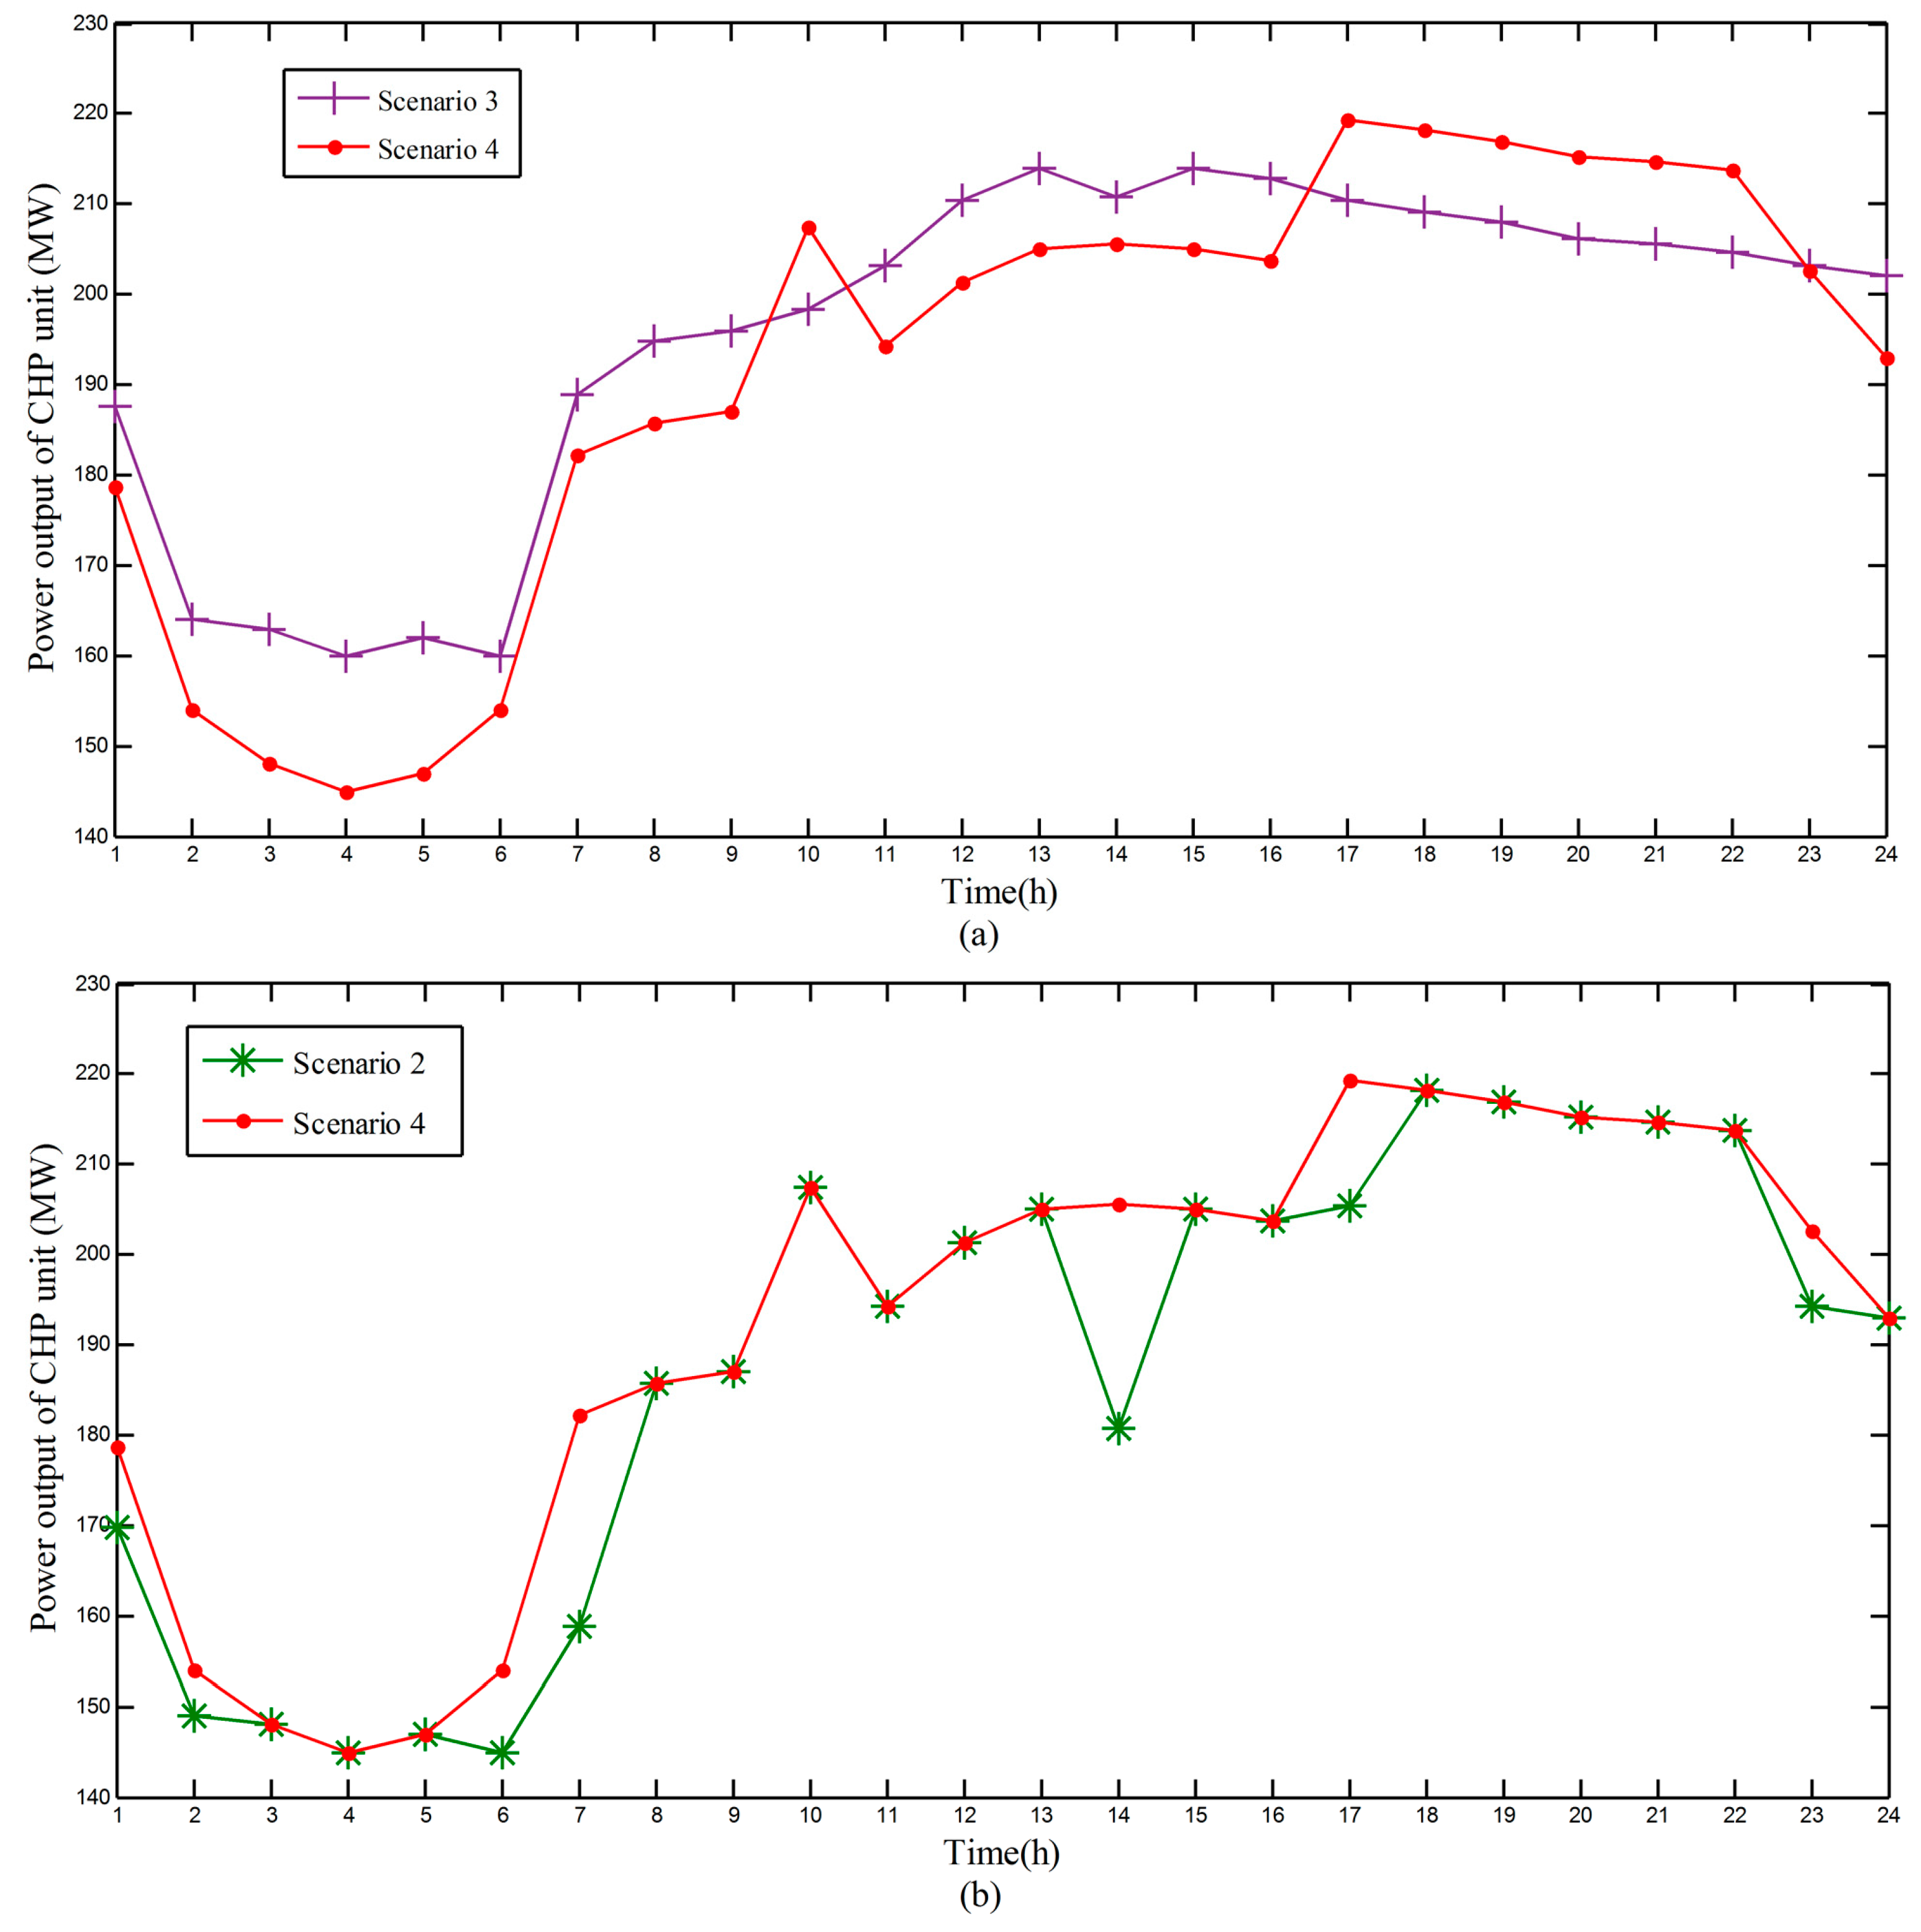
4.3.1. The Effect on Reducing Wind Curtailment

The hourly power outputs of each generation within 24 h in the four scenarios are shown in Figure 7. It can be seen from Figure 7a that wind power is curtailed between 1 o’clock and 7 o’clock. The reason lies in that the thermal demand is high and, thus, the flexibility of CHP is low within these hours, leading to limited minimal power output for CHP unit. At the same time, the power demand is low, which hinders the wind power accommodation. While in other periods, the thermal demand is lower while the electrical demand is relatively higher and, thus, the power output of CHP has more adjustment space and wind power can be entirely accommodated.
In Scenario 1, a large amount of wind power is abandoned in off-peak hours. In Scenario 2, in off-peak hours thermal energy storage acts as a heat output source, decreasing the heat and power output of CHP unit, thus promoting the wind power integration. In Scenario 3, the surplus wind energy is stored in the electrical energy storage. Comparing Figure 7b,c, the effect on reducing wind curtailment in Scenario 3 is more remarkable than that in scenario 2. In Scenario 4, when introducing both the thermal and electrical energy storage, a large proportion of wind energy would be integrated to the power system. The total amounts of curtailed wind energy in four scenarios are 250, 175, 100, and 40 MWh, respectively, as shown in Figure 8.
The equivalent power output of CHP unit (considering electrical energy storage output) in off-peak period can represent the effect on integrating wind power in four scenarios, as shown in Figure 9. The equivalent power output of CHP decreases from Scenario 1 to Scenario 4, thus, the benefit of integrating wind power rises from Scenario 1 to Scenario 4.

4.3.2. The Effect on Reducing Operation Cost

The total operation costs from Scenario 1 to Scenario 4 are $196,300, $194,900, $191,100, and $190,000, respectively. Therefore, the economic margins in Scenario 2 and Scenario 3, compared with Scenario 1, are $1,400 and $5,200, respectively. Previous study has demonstrated wind integration margins in Scenario 2 and Scenario 3 are 75 and 150 MWh, respectively. Thus, integrating per MWh wind power can reduce the cost of $18.7 and $34.7 when introducing TES or EES, respectively. Adding both TES and EES will gain the least operating cost among the four scenarios.
The effect on operation costs saving can be analyzed by the dispatch decisions of thermal units. The Figure 10 depicts the comparisons of the power output of CHP in different scenarios. It can be seen from Figure 10a that the power output of CHP in Scenario 4 is always less than that in Scenario 3 except in extremely peak period (in time step 10 and 18–22), since TES replaces part of heat production from CHP in off-peak hours and absorbs heat in peak hours. In Figure 10b it is observed that, in off-peak hours, CHP unit produces more power in Scenario 4 than that in Scenario 2. The reason lies in that EES could store part of the power production from CHP in off-peak period.
Comparing the power dispatch of G2, the most expensive unit, in Figure 11, it can be seen that the power production of G2 decreases from Scenario 1 to Scenario 4. Thus, it can be indicated that when introducing EES and TES, the power system can be dispatched more efficiently, which could benefit both in wind power integration and primary energy saving.

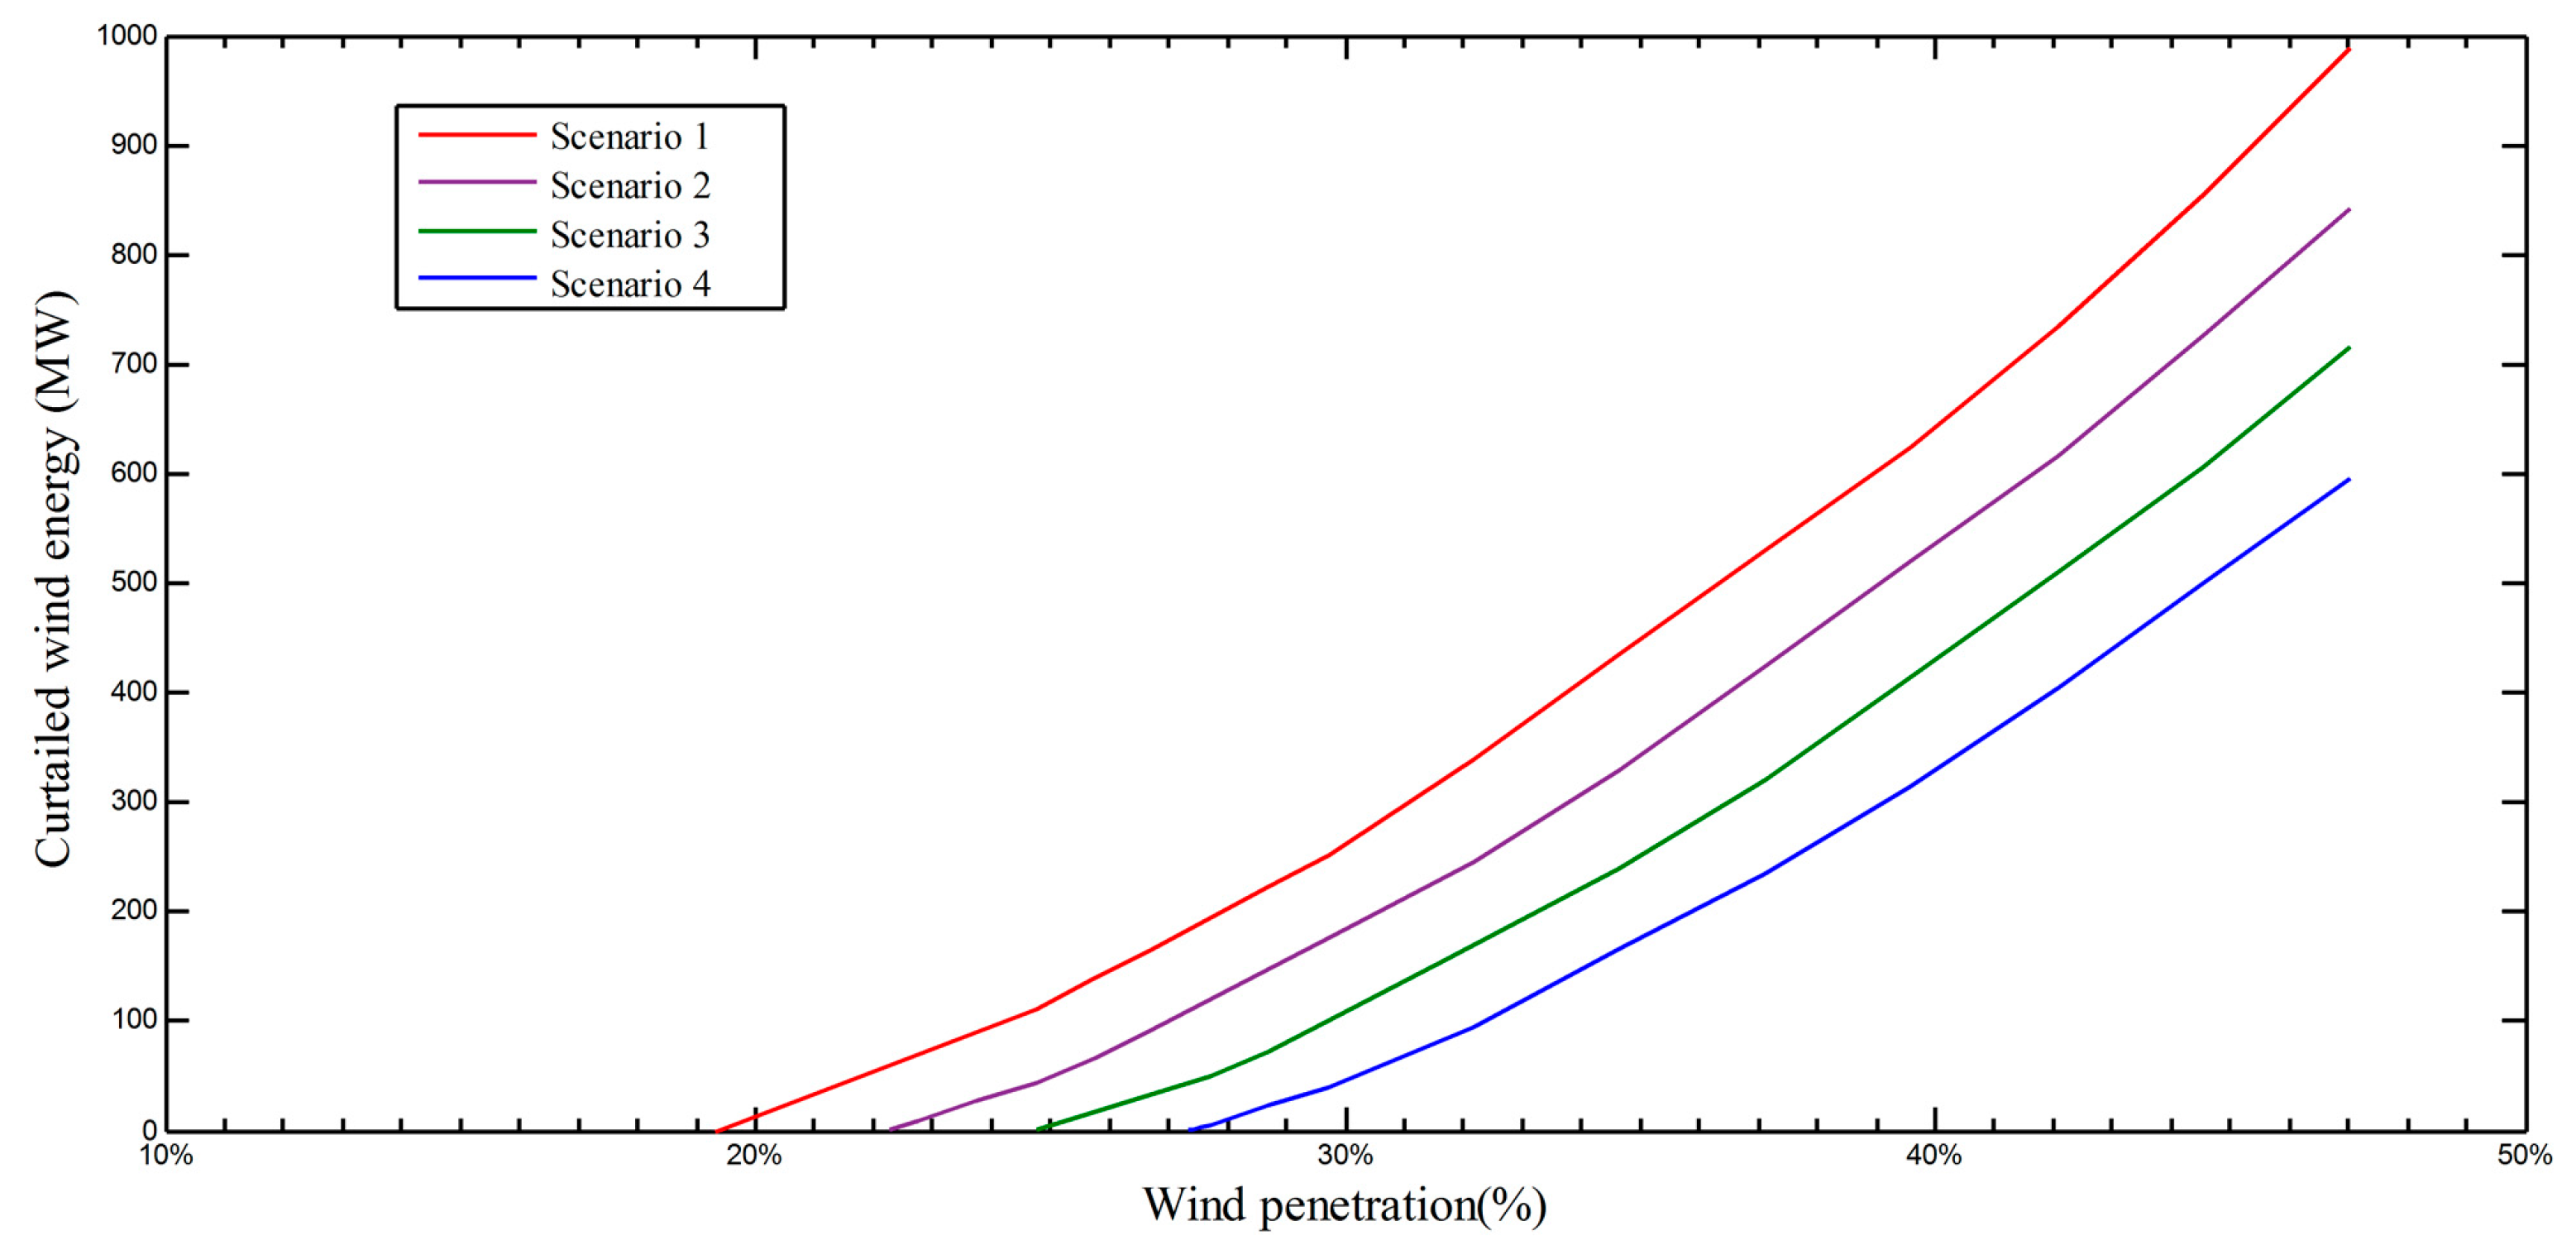
4.3.3. Sensitivity Analysis of Wind Penetration

Wind penetration is a key factor influencing the operating cost and wind integration performance of the integrated system. Comparisons of curtailed wind energy in the system at different wind penetration levels in four scenarios are shown in Figure 12.
In Scenario 1, wind energy curtailment begins to appear as wind penetration reaches 19.3%. While in other three scenarios, the corresponding wind penetrations are 22.3%, 24.8%, 27.3%, respectively. Thus, it is indicated the threshold value of wind curtailment occurrence would be increased when introducing the energy storages. The trends of wind curtailment are also shown in Figure 12, demonstrating the different performances in four scenarios, as well as the significant effectiveness of integrating electrical and thermal energy storage into the integrated CHP system. With increasing wind penetration, the amount of curtailed wind energy will increase rapidly in all four scenarios.

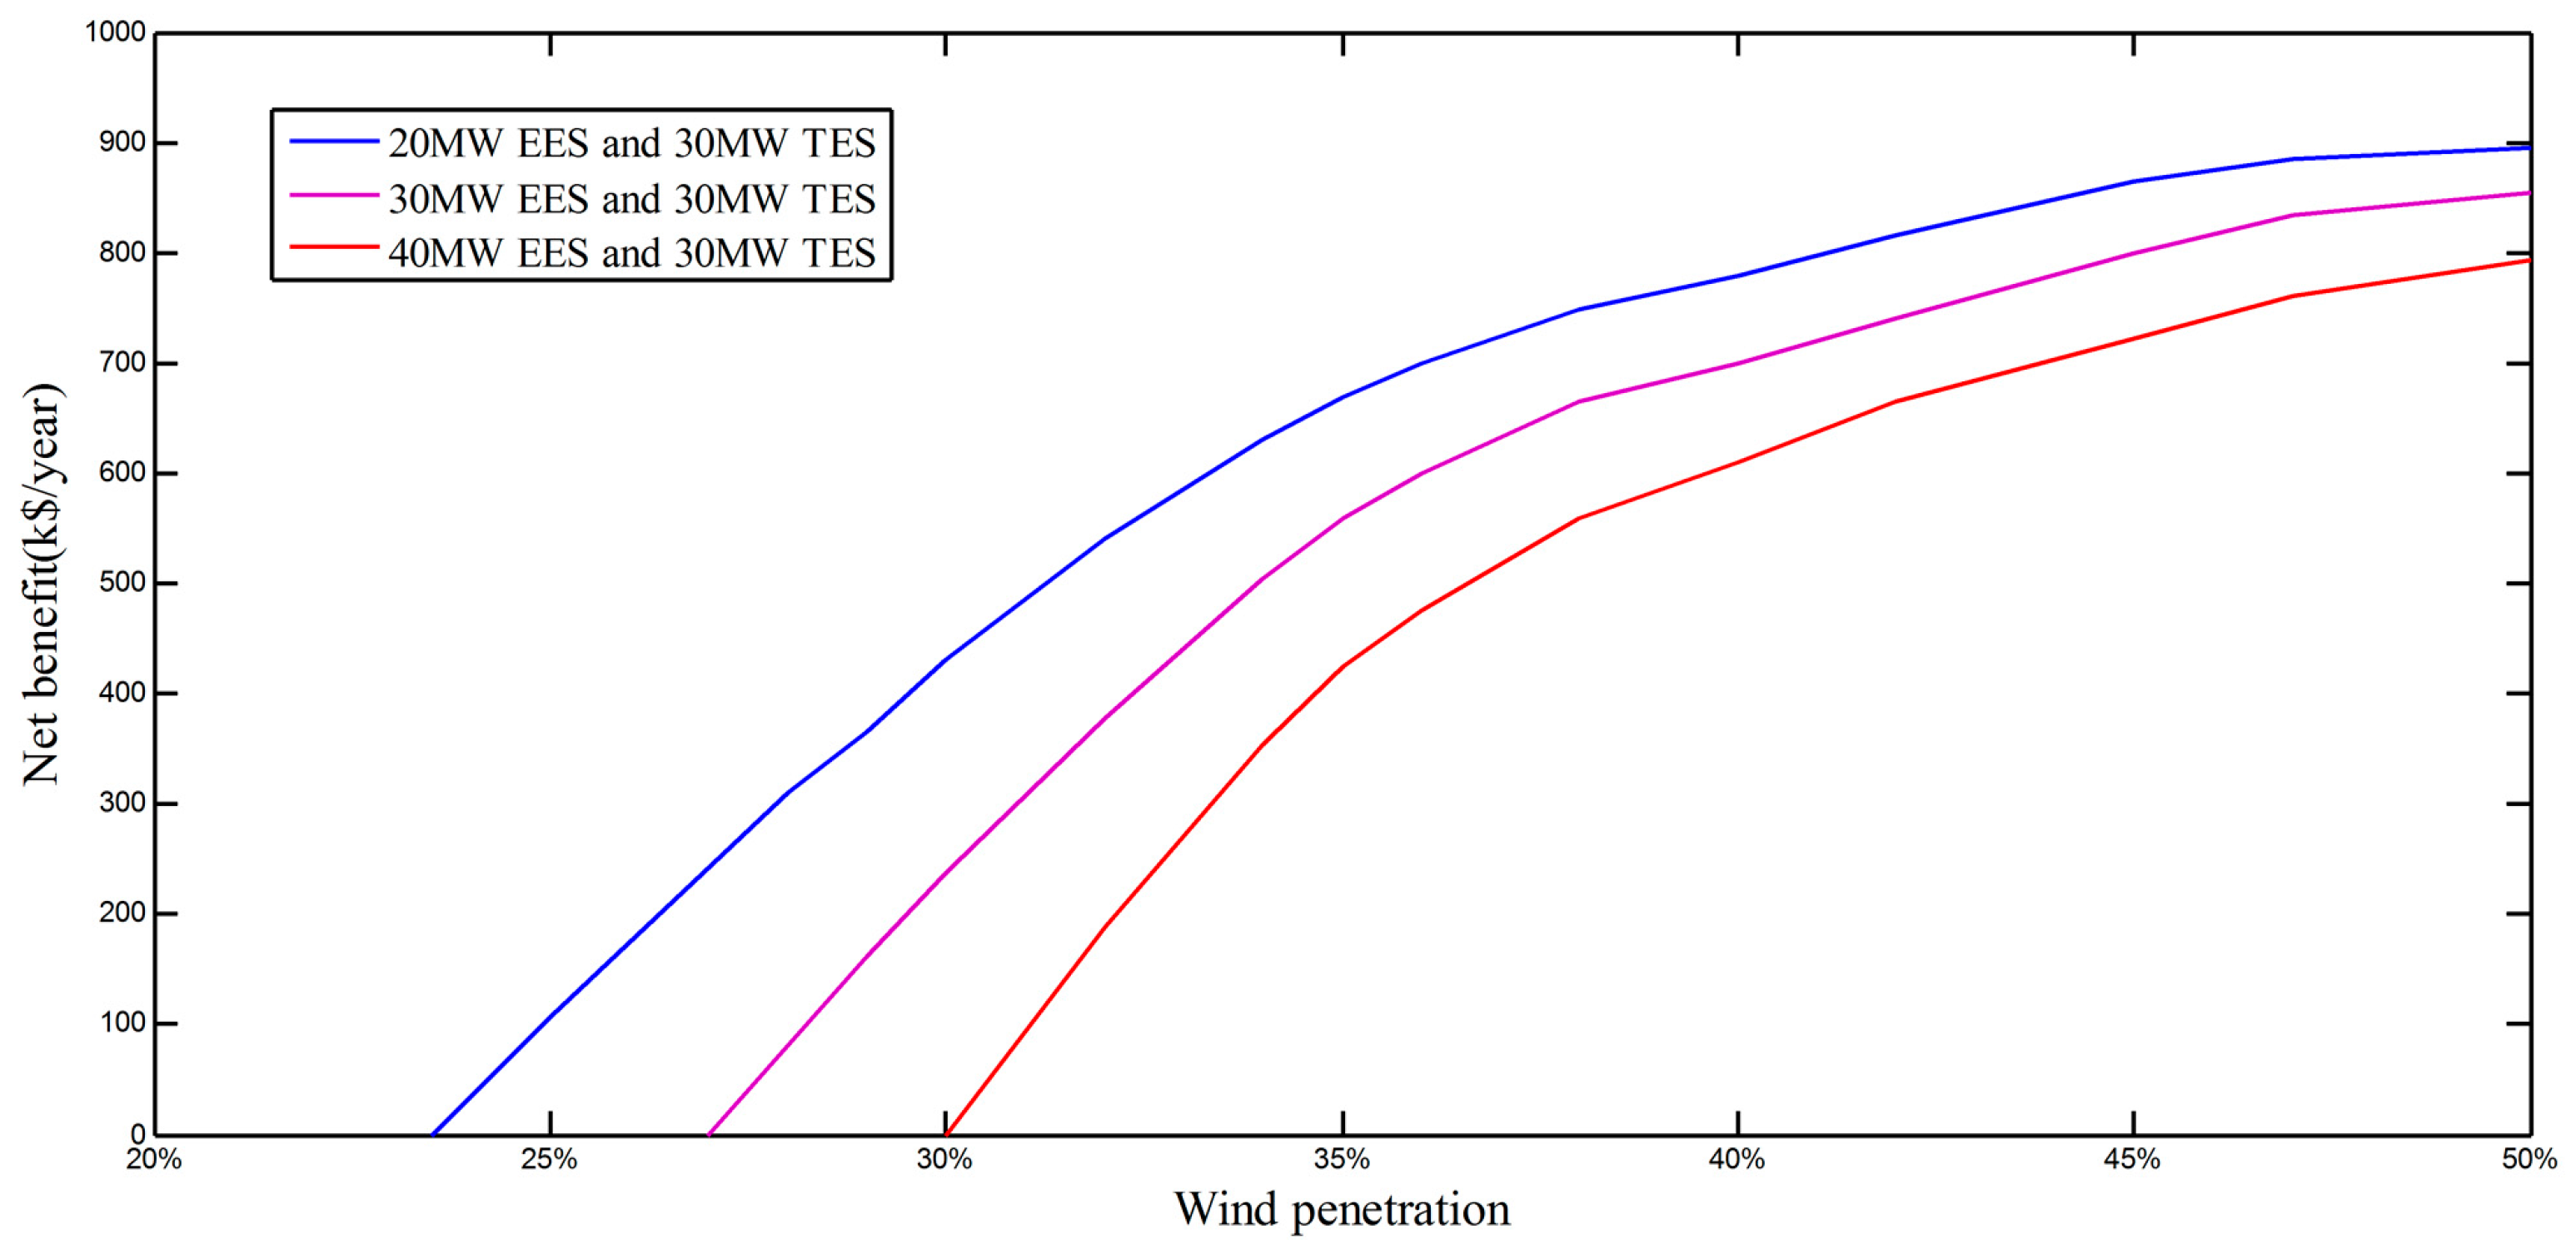
4.3.4. Cost-Benefit Analysis of EES and TES

The cost-benefit analysis of the integrated CHP system when introducing both EES and TES is carried out. The investment costs, operation and maintenance (O&M) costs, overall efficiency, and lifetimes of the EES and TES are shown in Table 2, which are derived from [31,32]. The investment costs are annualized using a discount rate of 5%. The annual saving costs include operating saving costs and annualized avoided investment costs of substitute power and heat capacity [32]. The results are shown in Figure 13 which presents the annual net benefits at different wind penetration levels.
It can be seen that the net benefits become positive as wind penetration reaches a critical level. Net benefits increase with increasing wind penetration, but they gradually approach saturation, independent of the EES capacity. It should be noted that the net benefits are conservative since the value of ancillary services provided by EES and TES are not included and they would increase if real-time electricity pricing is carried out. The further analysis can be studied in future publications.

5. Conclusions

An integrated CHP system dispatch model was formulated in this paper, which incorporates TES and EES into the system. Four scenarios in the six-bus system were studied. The results show that when adding EES and TES to the system, the curtailed wind energy will largely decrease due to lower power production from the CHP unit in the off-peak period, and the operation cost will largely be reduced since the system can be dispatched more efficiently. Introducing EES to the system can integrate more wind energy and reduce more operation costs when compared with introducing TES, but the investment cost of EES is much more than that of TES. The annual net benefits which EES and TES provide increase with increasing wind penetration, but they gradually approach saturation. Introducing both TES and EES will have a best overall economic benefit in improving wind power integration, increasing operation efficiency, and reducing operation cost.
On the basis of the proposed ICHPD model, many interesting issues could be further studied. For instance, the impact of wind forecasting uncertainty on the charging/discharging strategy of TES and EES deserves more investigation since currently the wind output could still not be forecasted accurately. Moreover, some other solutions, such as heat pumps and demand response, could also be incorporated into the system and need more study.

Acknowledgments

This work was supported by the research funding of School of Electrical Engineering, Wuhan University. This sponsorship is gratefully acknowledged.

Author Contributions

Rongxiang Yuan proposed the concrete ideas of the proposed optimization model. Jun Ye performed the simulations and wrote the manuscript. Jiazhi Lei and Timing Li gave some useful suggestions to the manuscript. Both of the authors revised the manuscript.

Conflicts of Interest

The authors declare no conflict of interest.

References

  1. Zhou, K.; Yang, S.; Shen, C.; Ding, S.; Sun, C. Energy conservation and emission reduction of China’s electric power industry. Renew. Sustain. Energy Rev. 2015, 45, 10–19. [Google Scholar] [CrossRef]
  2. Feng, Y.; Lin, H.Y.; Ho, S.L.; Yanc, J.H.; Dong, J.N.; Fang, S.H.; Huang, Y.K. Overview of wind power generation in China: Status and development. Renew. Sustain. Energy Rev. 2015, 50, 847–858. [Google Scholar] [CrossRef]
  3. Zhao, Z.Y.; Chang, R.D.; Chen, Y.L. What hinder the further development of wind power in China? A socio-technical barrier study. Energ Policy 2016, 88, 465–476. [Google Scholar] [CrossRef]
  4. Zhang, D.; Zhang, X.L.; He, J.K.; Chai, Q.M. Offshore wind energy development in China: Current status and future perspective. Renew. Sustain. Energy Rev. 2011, 15, 4673–4684. [Google Scholar] [CrossRef]
  5. Nuytten, T.; Claessens, B.; Paredis, K.; Van Bael, J.; Six, D. Flexibility of a combined heat and power system with thermal energy storage for district heating. Appl. Energy 2013, 104, 583–591. [Google Scholar] [CrossRef]
  6. Bianchi, M.; De Pascale, A.; Melino, F. Performance analysis of an integrated CHP system with thermal and Electric Energy Storage for residential application. Appl. Energy 2013, 112, 928–938. [Google Scholar] [CrossRef]
  7. Hong, L.X.; Lund, H.; Moller, B. The importance of flexible power plant operation for Jiangsu’s wind integration. Energy 2012, 41, 499–507. [Google Scholar] [CrossRef]
  8. Tan, Z.F.; Li, H.H.; Ju, L.W.; Song, Y.H. An Optimization Model for Large-Scale Wind Power Grid Connection Considering Demand Response and Energy Storage Systems. Energies 2014, 7, 7282–7304. [Google Scholar] [CrossRef]
  9. Yuan, Y.; Zhang, X.S.; Ju, P.; Qian, K.J.; Fu, Z.X. Applications of battery energy storage system for wind power dispatchability purpose. Electr. Power Syst. Res. 2012, 93, 54–60. [Google Scholar] [CrossRef]
  10. Ghofrani, M.; Arabali, A.; Etezadi-Amoli, M.; Fadali, M.S. Energy Storage Application for Performance Enhancement of Wind Integration. IEEE Trans. Power Syst. 2013, 28, 4803–4811. [Google Scholar] [CrossRef]
  11. Trifkovic, M.; Sheikhzadeh, M.; Nigim, K.; Daoutidis, P. Modeling and Control of a Renewable Hybrid Energy System With Hydrogen Storage. IEEE Trans. Contr. Syst. Tech. 2014, 22, 169–179. [Google Scholar] [CrossRef]
  12. Recalde Melo, D.F.; Chang-Chien, L.R. Synergistic Control Between Hydrogen Storage System and Offshore Wind Farm for Grid Operation. IEEE Trans. Sustain. Energy 2014, 5, 18–27. [Google Scholar] [CrossRef]
  13. Zhao, H.R.; Wu, Q.W.; Hu, S.J.; Xu, H.H.; Rasmussen, C.N. Review of energy storage system for wind power integration support. Appl. Energy 2015, 137, 545–553. [Google Scholar] [CrossRef]
  14. Nuytten, T.; Moreno, P.; Vanhoudt, D.; Jespers, L.; Sole, A.; Cabeza, L.F. Comparative analysis of latent thermal energy storage tanks for micro-CHP systems. Appl. Therm. Eng. 2013, 59, 542–549. [Google Scholar] [CrossRef]
  15. Christidis, A.; Koch, C.; Pottel, L.; Tsatsaronis, G. The contribution of heat storage to the profitable operation of combined heat and power plants in liberalized electricity markets. Energy 2012, 41, 75–82. [Google Scholar] [CrossRef]
  16. Lund, H.; Mathiesen, B.V. Energy system analysis of 100% renewable energy systems—The case of Denmark in years 2030 and 2050. Energy 2009, 34, 524–531. [Google Scholar] [CrossRef]
  17. Yang, Y.L.; Wu, K.; Long, H.Y.; Gao, J.C.; Yan, X.; Kato, T.; Suzuoki, Y. Integrated electricity and heating demand-side management for wind power integration in China. Energy 2014, 78, 235–246. [Google Scholar] [CrossRef]
  18. Chen, X.Y.; Kang, C.Q.; O'Malley, M.; Xia, Q. Increasing the Flexibility of Combined Heat and Power for Wind Power Integration in China Modeling and Implications. IEEE Trans. Power Syst. 2015, 30, 1848–1857. [Google Scholar] [CrossRef]
  19. Li, Z.G.; Wu, W.C.; Shahidehpour, M.; Wang, J.H.; Zhang, B. Combined Heat and Power Dispatch Considering Pipeline Energy Storage of District Heating Network. IEEE Trans. Sustain. Energy 2016, 7, 12–22. [Google Scholar] [CrossRef]
  20. Hedegaard, K.; Mathiesen, B.V.; Lund, H.; Heiselberg, P. Wind power integration using individual heat pumps—Analysis of different heat storage options. Energy 2012, 47, 284–293. [Google Scholar] [CrossRef]
  21. Wang, H.C.; Yin, W.S.; Abdollahi, E.; Landelma, R.; Jiao, W.L. Modelling and optimization of CHP based district heating system with renewable energy production and energy storage. Appl. Energy 2015, 159, 401–421. [Google Scholar] [CrossRef]
  22. Agbossou, K.; Kolhe, M.; Hamelin, J.; Bose, T.K. Performance of a stand-alone renewable energy system based on energy storage as hydrogen. IEEE Trans. Energy Convers. 2004, 19, 633–640. [Google Scholar] [CrossRef]
  23. Korpas, K.; Holen, A.T. Operation planning of hydrogen storage connected to wind power operating in a power market. IEEE Trans. Energy Convers. 2006, 21, 742–749. [Google Scholar] [CrossRef]
  24. Garcia-Torres, F.; Bordons, C. Optimal Economical Schedule of Hydrogen-Based Microgrids With Hybrid Storage Using Model Predictive Control. IEEE Trans. Ind. Electron. 2015, 62, 5195–5207. [Google Scholar] [CrossRef]
  25. Bogdan, Z.; Kopjar, D. Improvement of the cogeneration plant economy by using heat accumulator. Energy 2006, 31, 2285–2292. [Google Scholar] [CrossRef]
  26. Rezaie, B.; Reddy, B.V.; Rosen, M.A. Energy analysis of thermal energy storages with grid configurations. Appl. Energy 2014, 117, 54–61. [Google Scholar] [CrossRef]
  27. Yazdani, A.; Jayabarathi, T.; Ramesh, V.; Raghunathan, T. Combined heat and power economic dispatch problem using firefly algorithm. Front. Energy 2013, 7, 133–139. [Google Scholar] [CrossRef]
  28. Khorram, E.; Jaberipour, M. Harmony search algorithm for solving combined heat and power economic dispatch problems. Energy Convers. Manag. 2011, 52, 1550–1554. [Google Scholar] [CrossRef]
  29. Jiang, R.W.; Wang, J.H.; Guan, Y.P. Robust Unit Commitment With Wind Power and Pumped Storage Hydro. IEEE Trans. Power Syst. 2012, 27, 800–810. [Google Scholar] [CrossRef]
  30. Barbieri, E.S.; Melino, F.; Morini, M. Influence of the thermal energy storage on the profitability of micro-CHP systems for residential building applications. Appl. Energy 2012, 97, 714–722. [Google Scholar] [CrossRef]
  31. Hedegaard, K.; Münster, M. Influence of individual heat pumps on wind power integration—Energy system investments and operation. Energ. Convers. Manag. 2013, 75, 673–684. [Google Scholar] [CrossRef] [Green Version]
  32. Danish Energy Agency. Energinet.dk. Technology Data for Energy Plants–Generation of Electricity and District Heating, Energy Storage and Carrier Generation and Conversion; Danish Energy Agency: Copenhagen, Denmark, 2012. [Google Scholar]
Figure 1. Energy flow in the integrated CHP system.
Energies 09 00474 g001
Figure 2. Structure of hydrogen storage system.
Energies 09 00474 g002
Figure 3. The heat-power feasible operation region of a CHP unit.
Energies 09 00474 g003
Figure 4. The equivalent heat-power feasible operation region of a CHP unit (a) without TES or EES; (b) when coupled with TES; (c) when coupled with EES; and (d) when coupled with both TES and EES.
Energies 09 00474 g004
Figure 5. The six-bus integrated CHP system.
Energies 09 00474 g005
Figure 6. Profiles of (a) electrical demand, forecasted wind power output and (b) heat demand.
Energies 09 00474 g006
Figure 7. The power outputs of each generation.
Energies 09 00474 g007aEnergies 09 00474 g007b
Figure 8. The total amounts of curtailed wind energy within 24 h in four scenarios.
Energies 09 00474 g008
Figure 9. The equivalent power output of CHP unit in off-peak period.
Energies 09 00474 g009
Figure 10. The comparisons of the power outputs of CHP in (a) Scenario 3 and 4 and (b) Scenario 2 and 4.
Energies 09 00474 g010
Figure 11. The power outputs of G2 in four scenarios.
Energies 09 00474 g011
Figure 12. Wind power curtailment at different wind penetration levels in the four scenarios.
Energies 09 00474 g012
Figure 13. Annual net benefits at different wind penetration levels.
Energies 09 00474 g013
Table 1. Components of the integrated CHP system scenarios.
ScenarioCondensing Power UnitsCHP UnitWind Power UnitEESTES
G1G2
1××
2×
3×
4
Table 2. Parameters of hydrogen storage and thermal storage for investment.
DeviceInvestment CostO&M Cost (% of Investment Cost per Year)Overall EfficiencyLifetime (years)
Hydrogen storage1.6 M$/MW4%0.6530
Thermal storage0.004 M$/MWh1%0.9940

