
Analysis and Solution for Operations of Overcurrent Relay in Wind Power System


Abstract
:
1. Introduction
2. Operation and Analysis of Overcurrent Relay
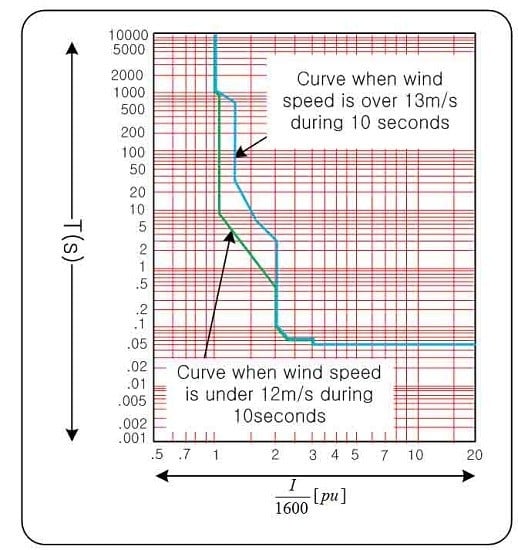
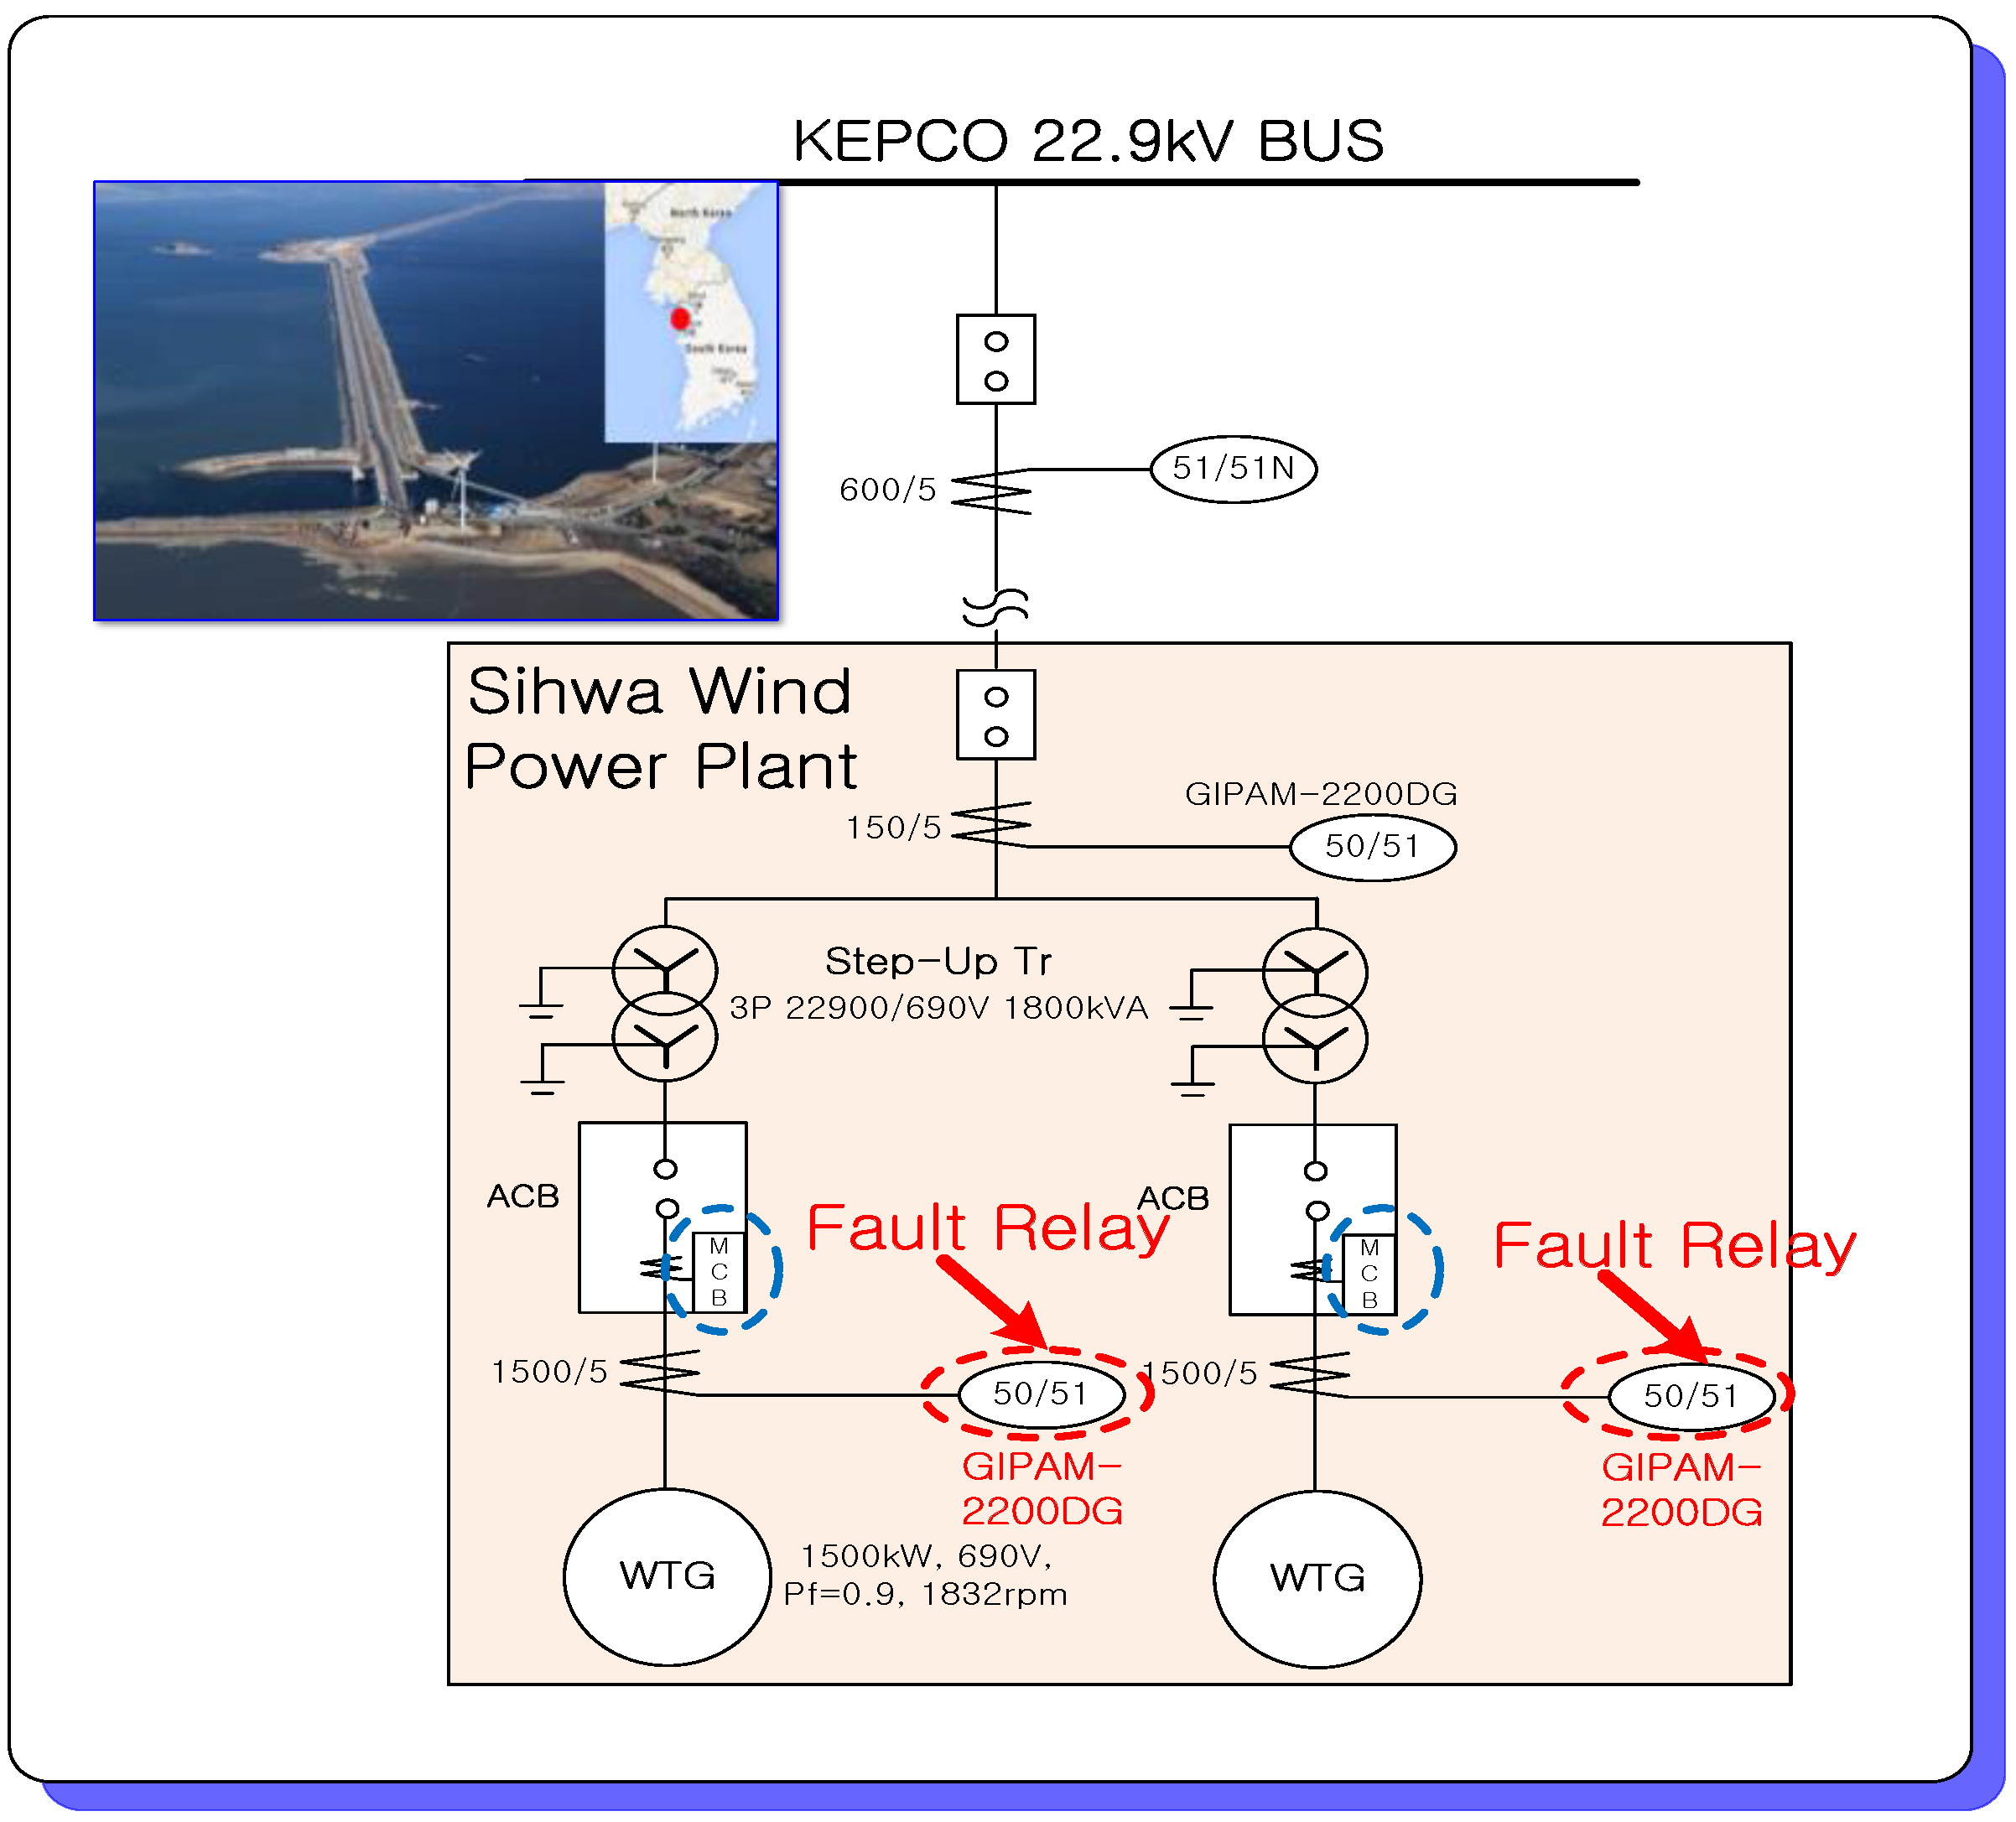
2.1. Installation and Operation of OCR
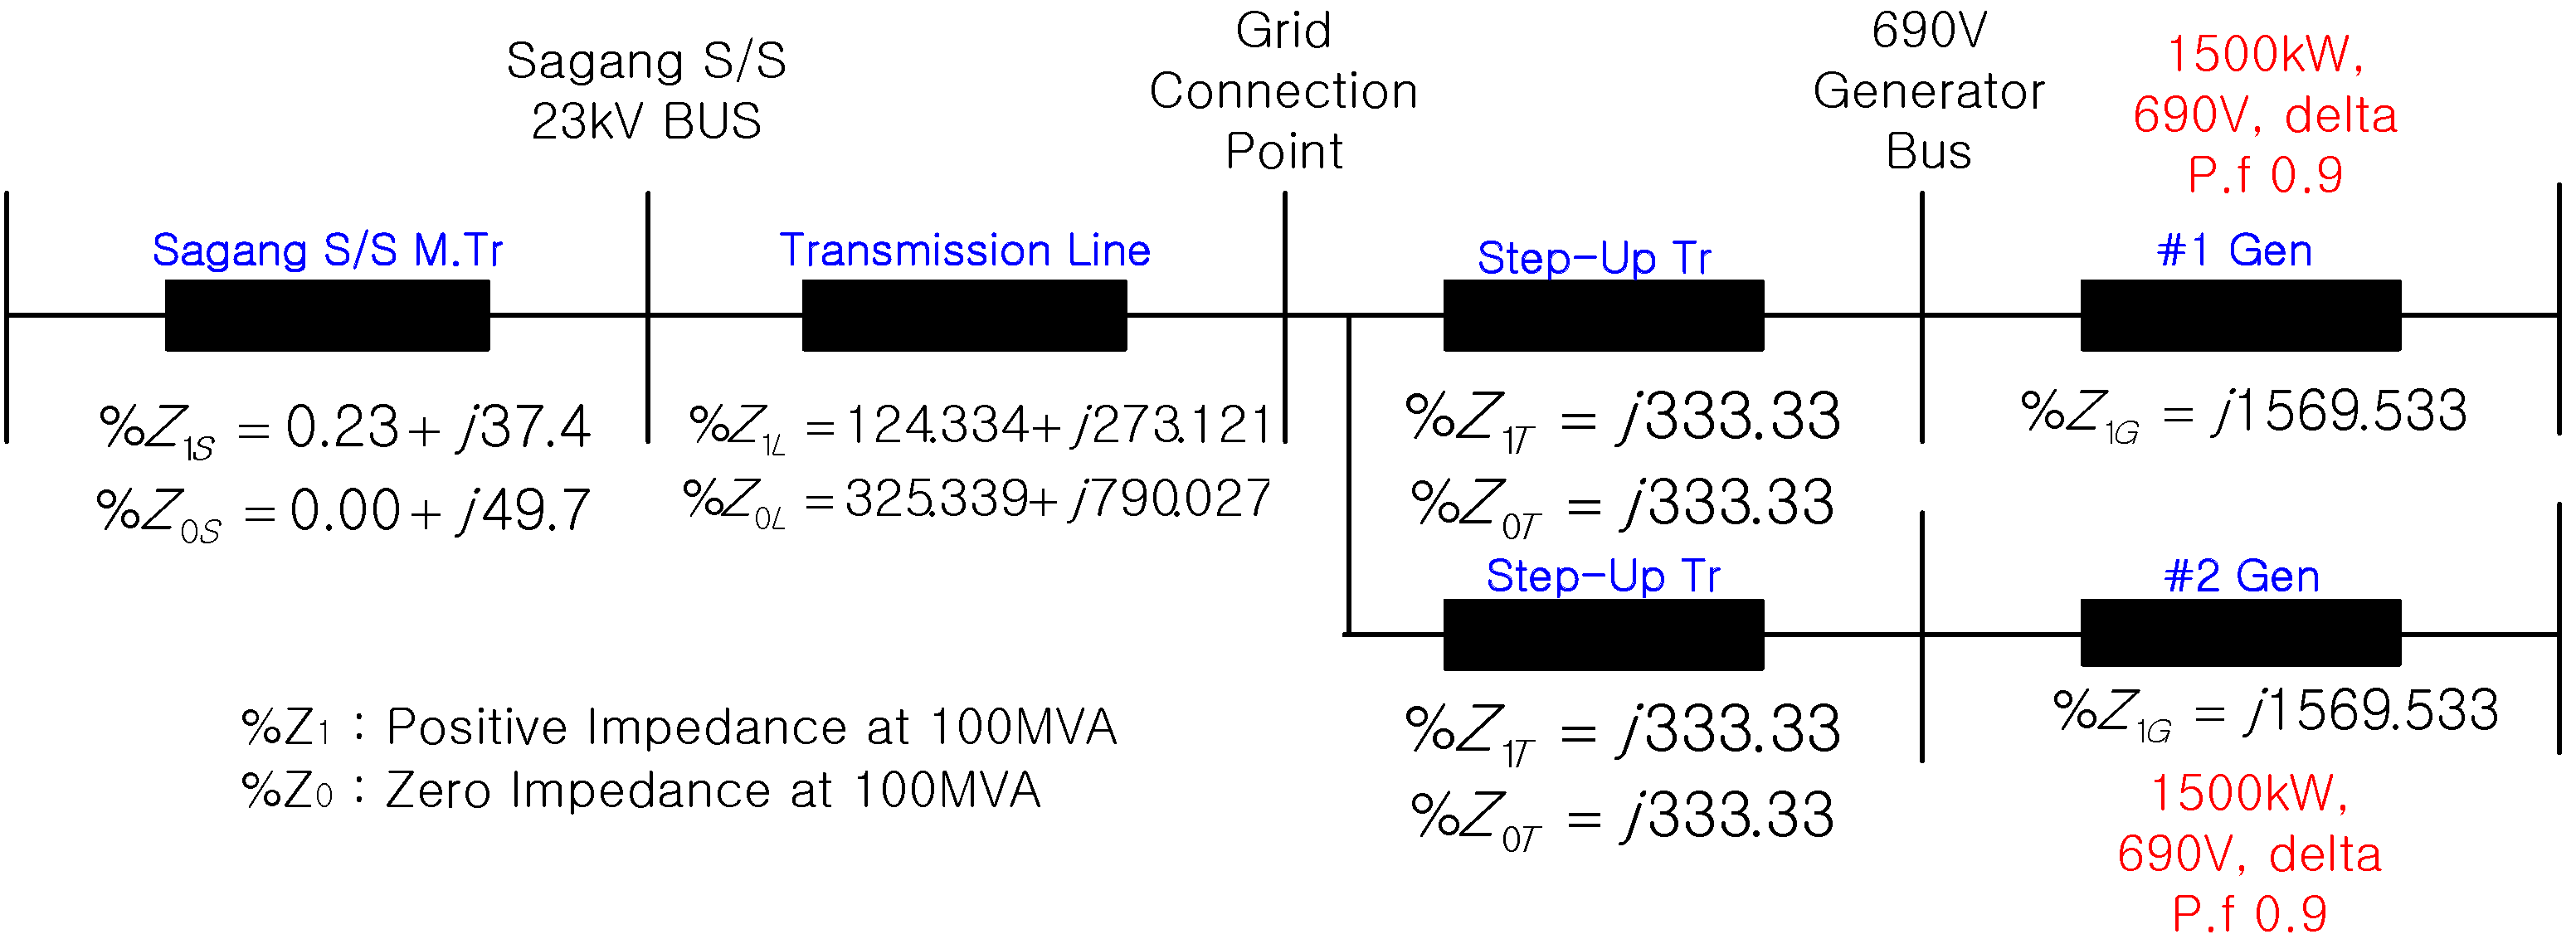
2.2. Analysis of OCR Operations
3. Re-Coordination of over Current Relay in GIPAM-2200DG
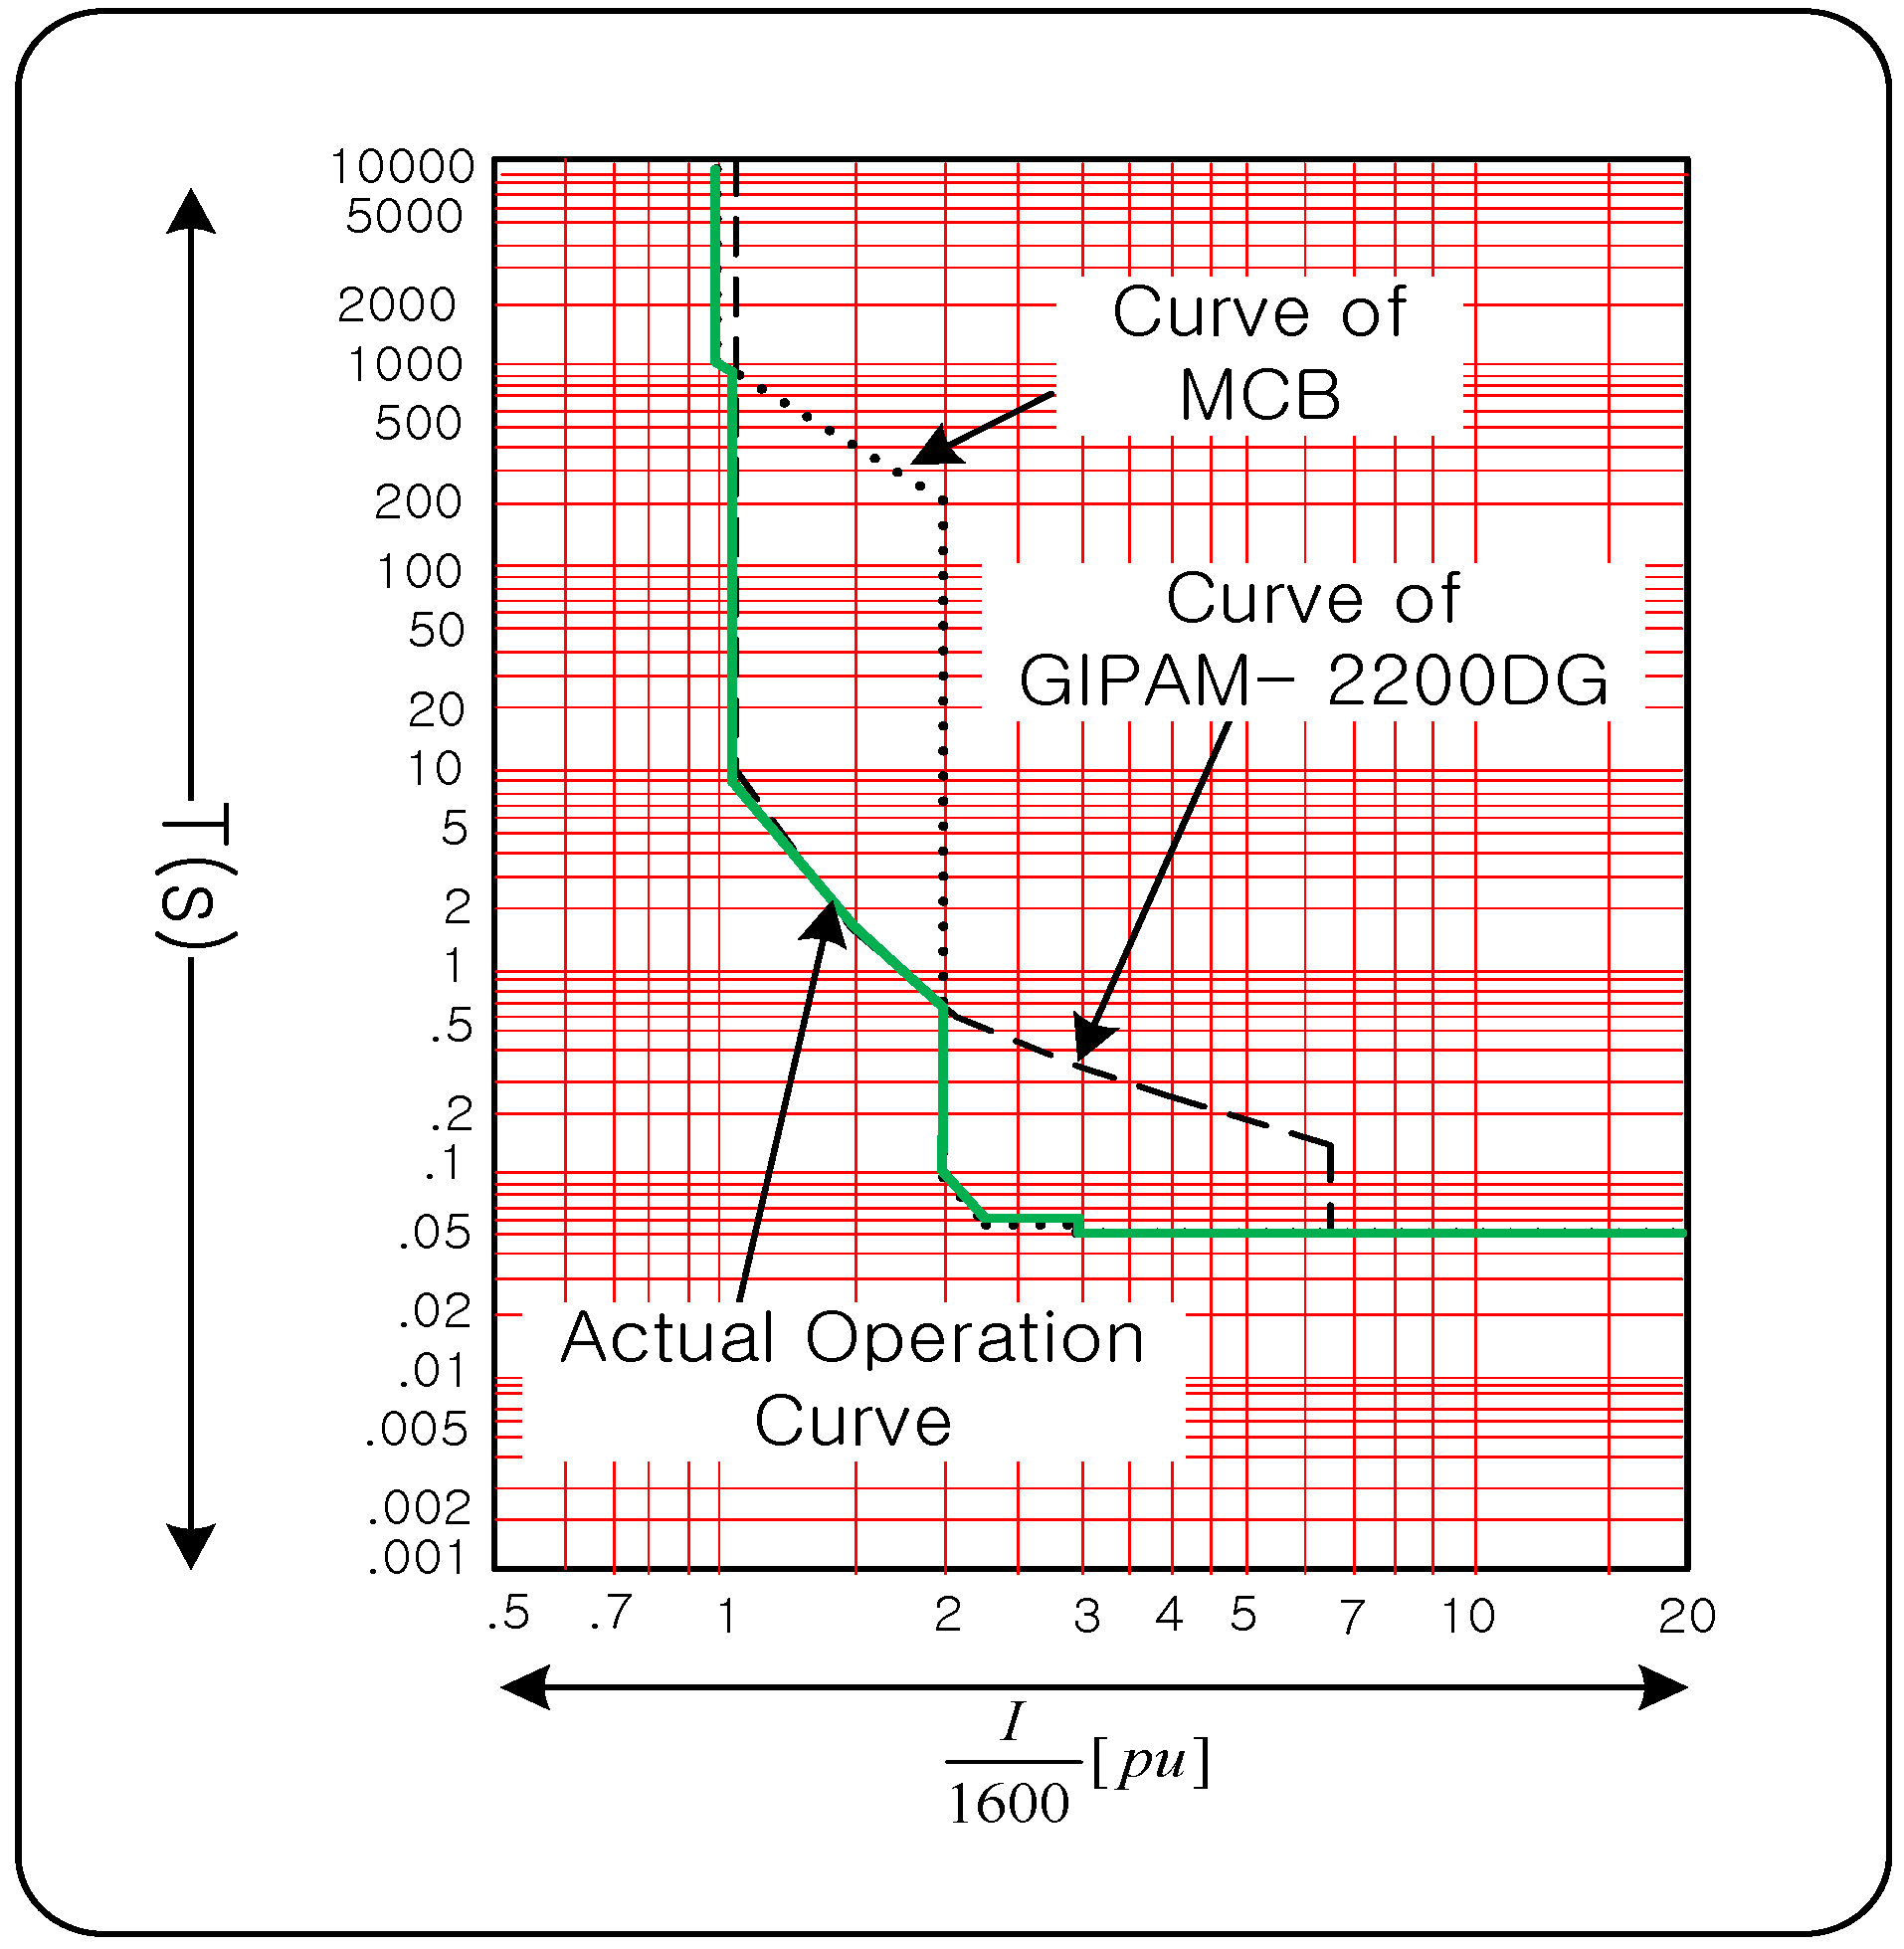
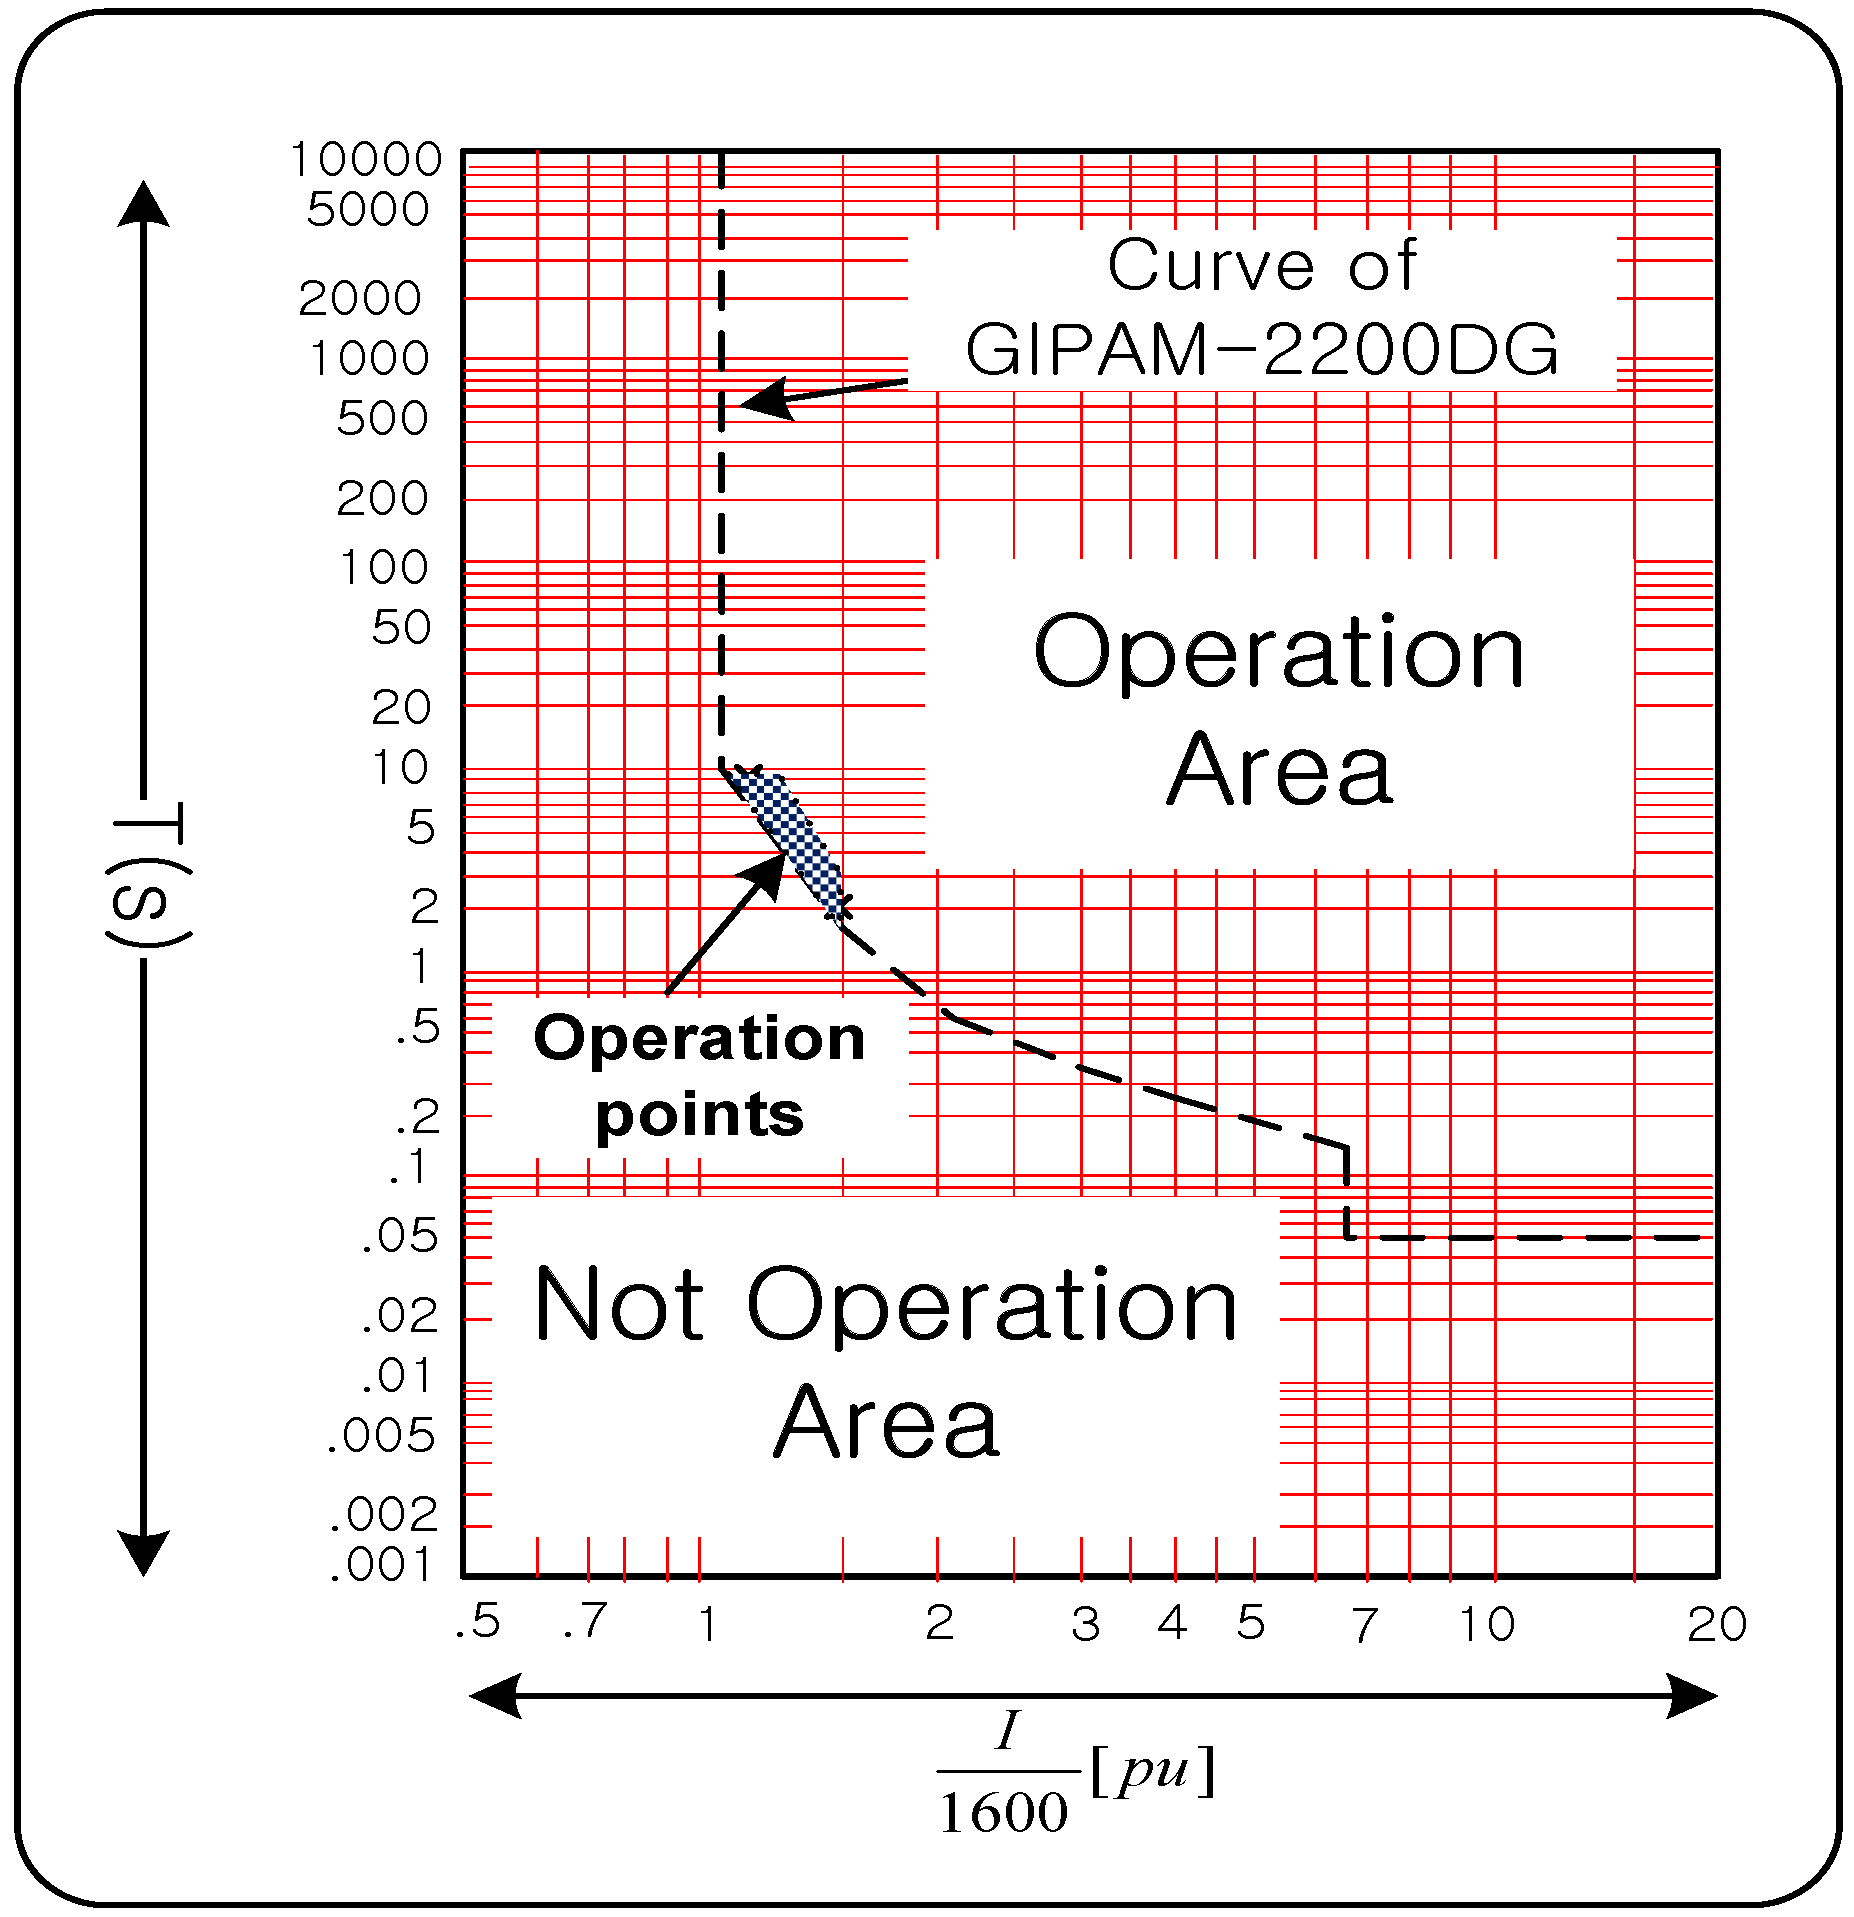
3.1. Present Coordination of OCR
- t = operating time for a constant current, I (seconds);
- = energizing current (amps);
- = over current pick-up setting (amps);
- TMS = time multiplier setting; and
- k, a, c = constants defining curve.
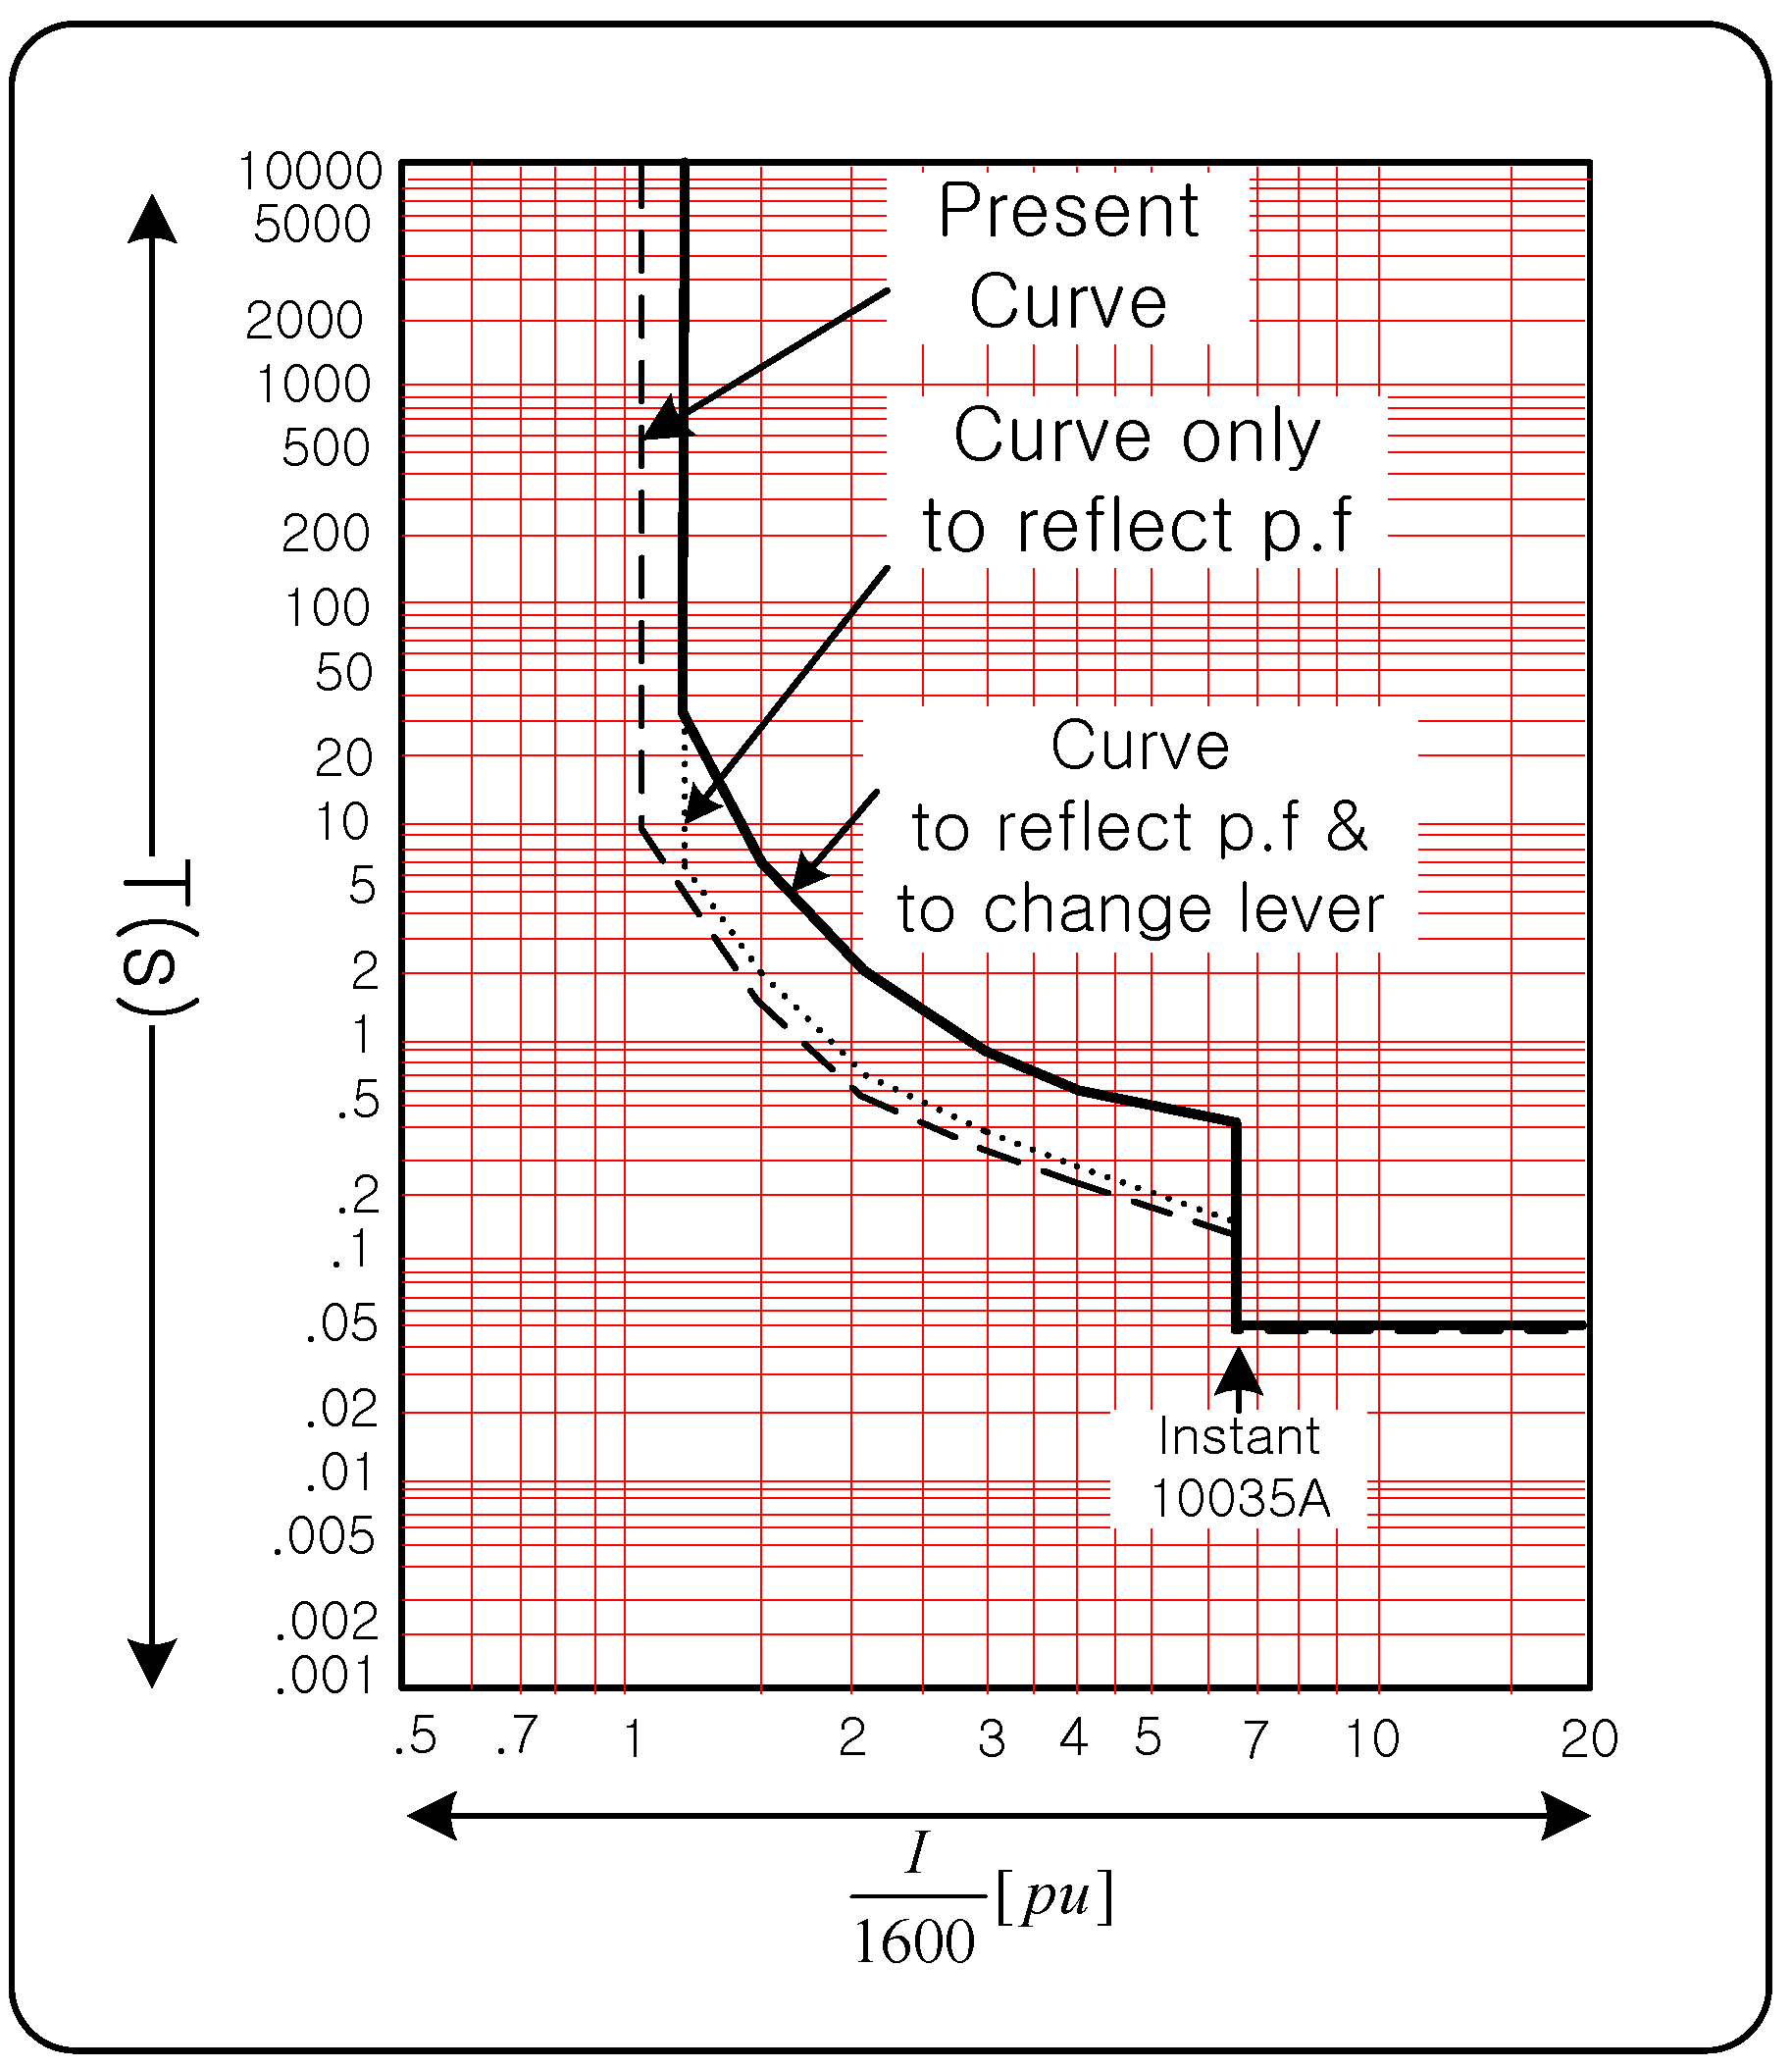
3.2. Power Factor in Coordination
3.3. Lever of OCR in GIPAM-2200DG
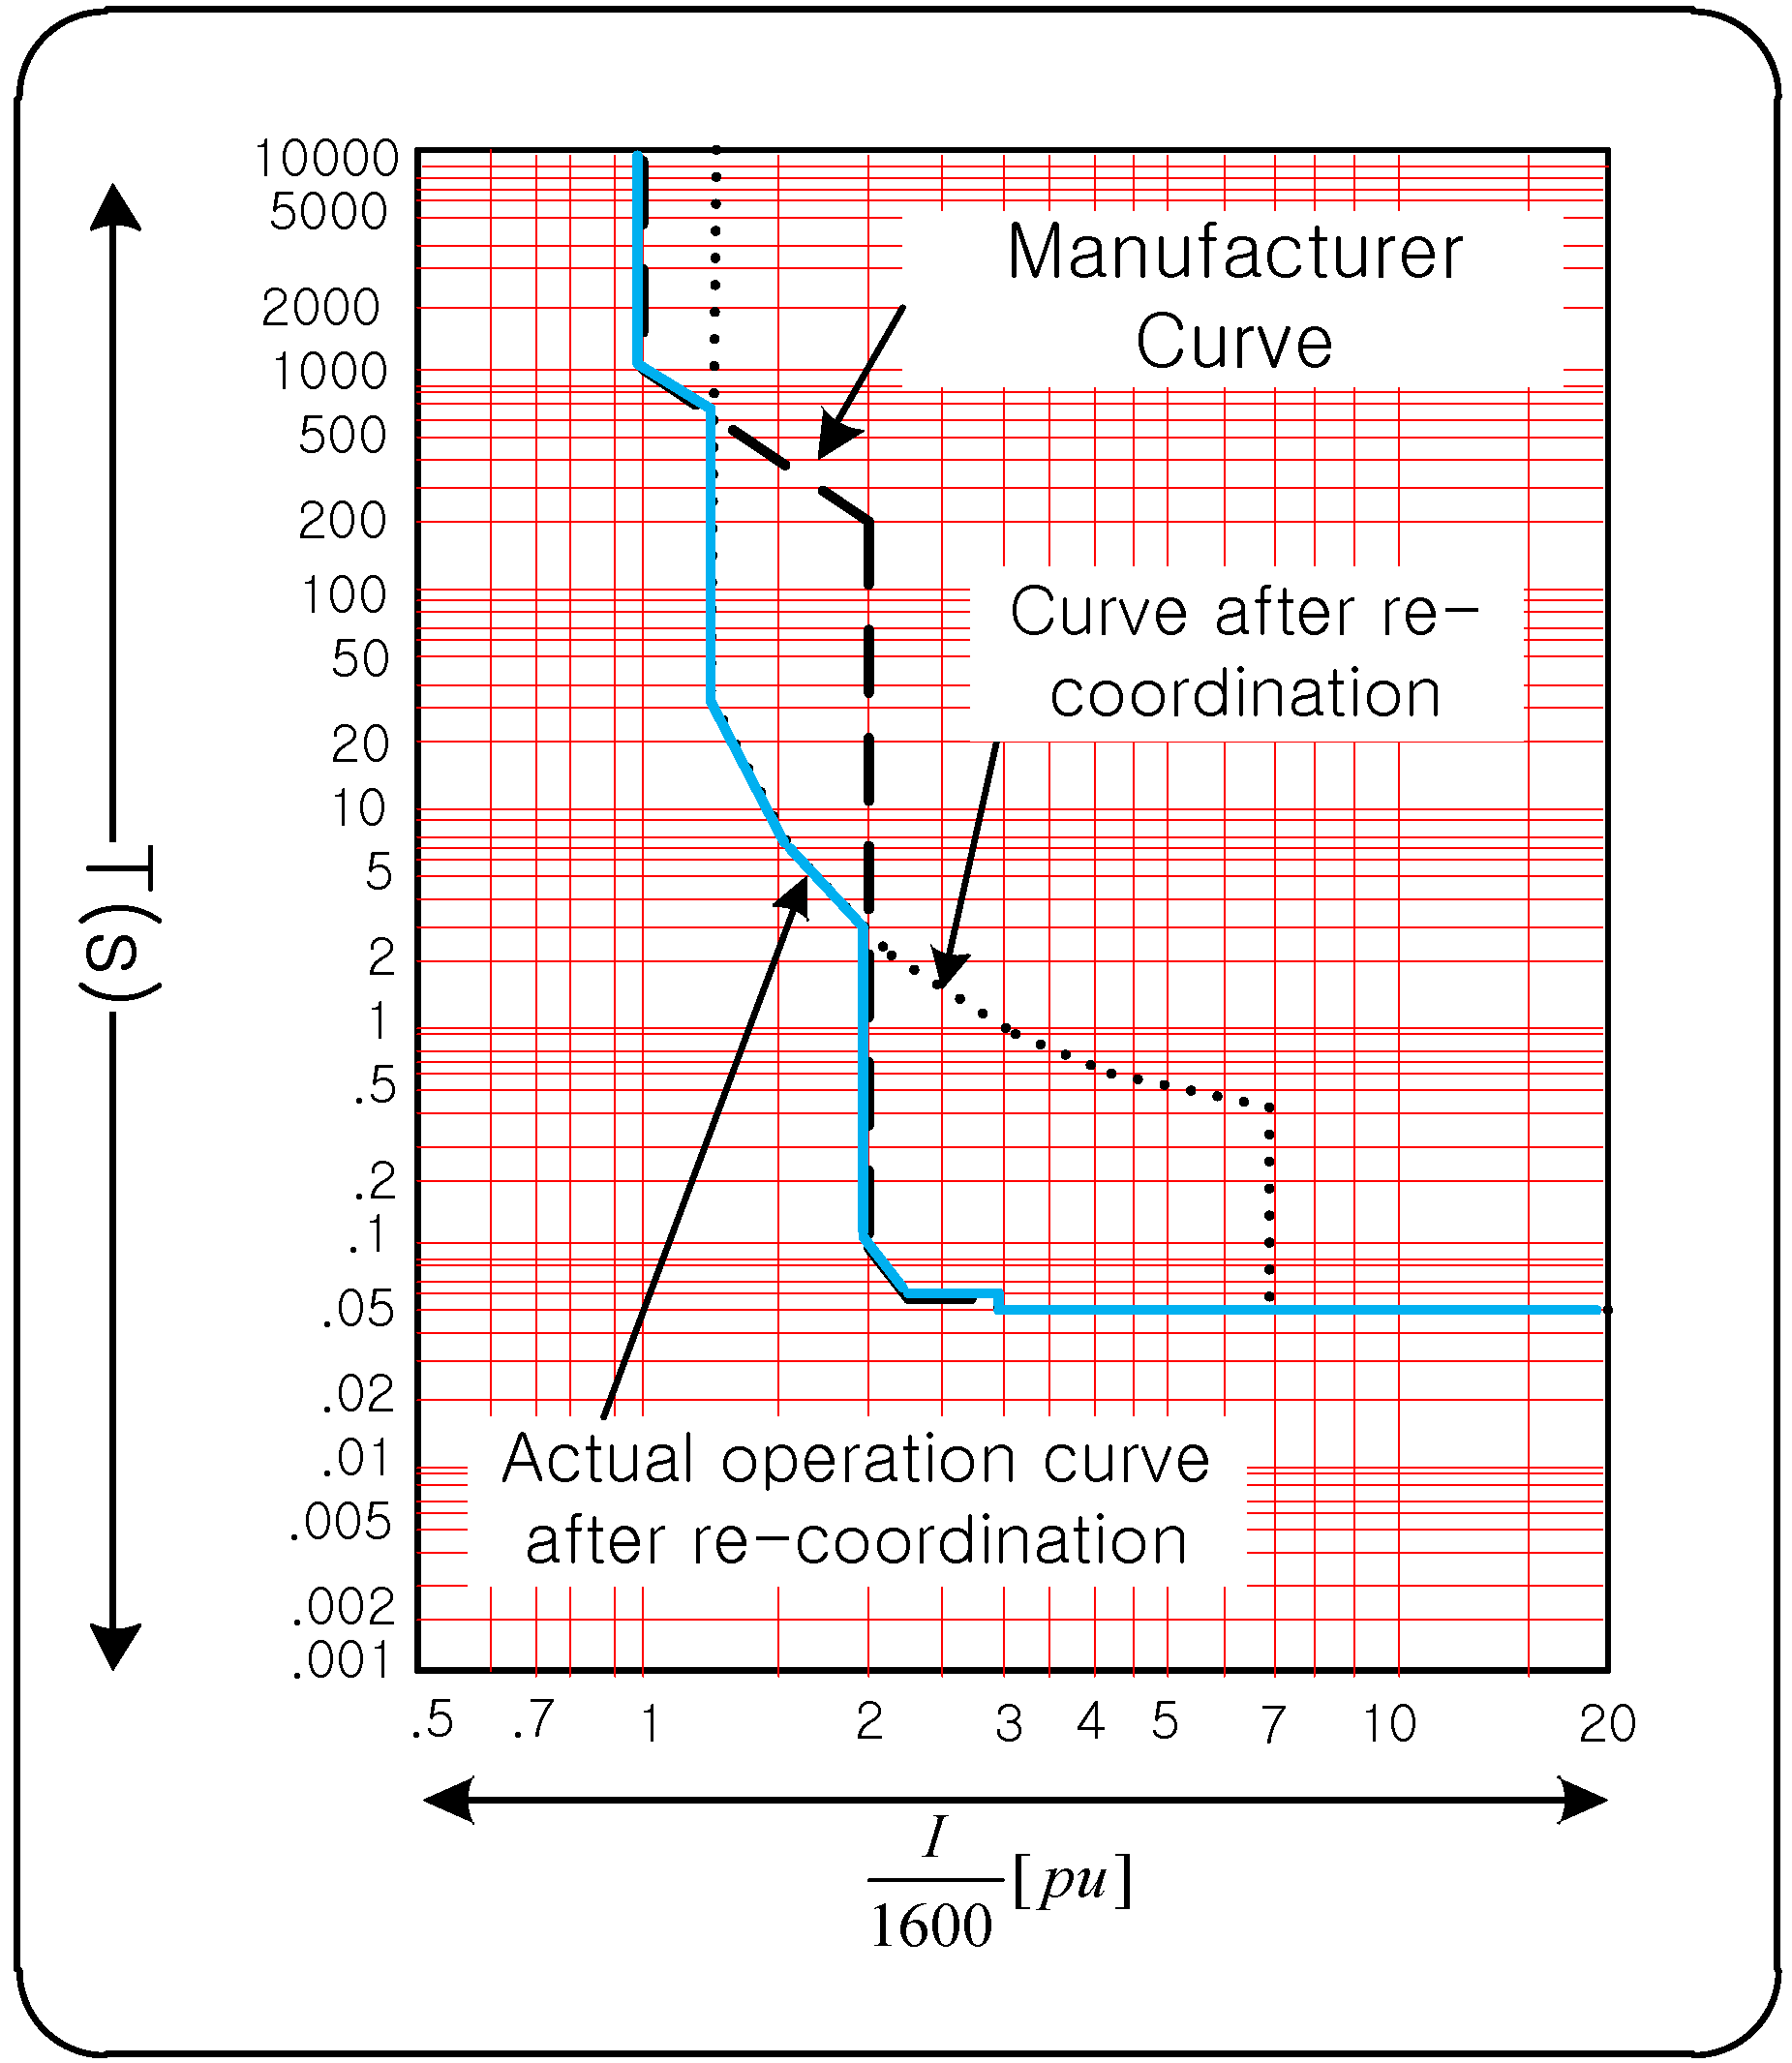
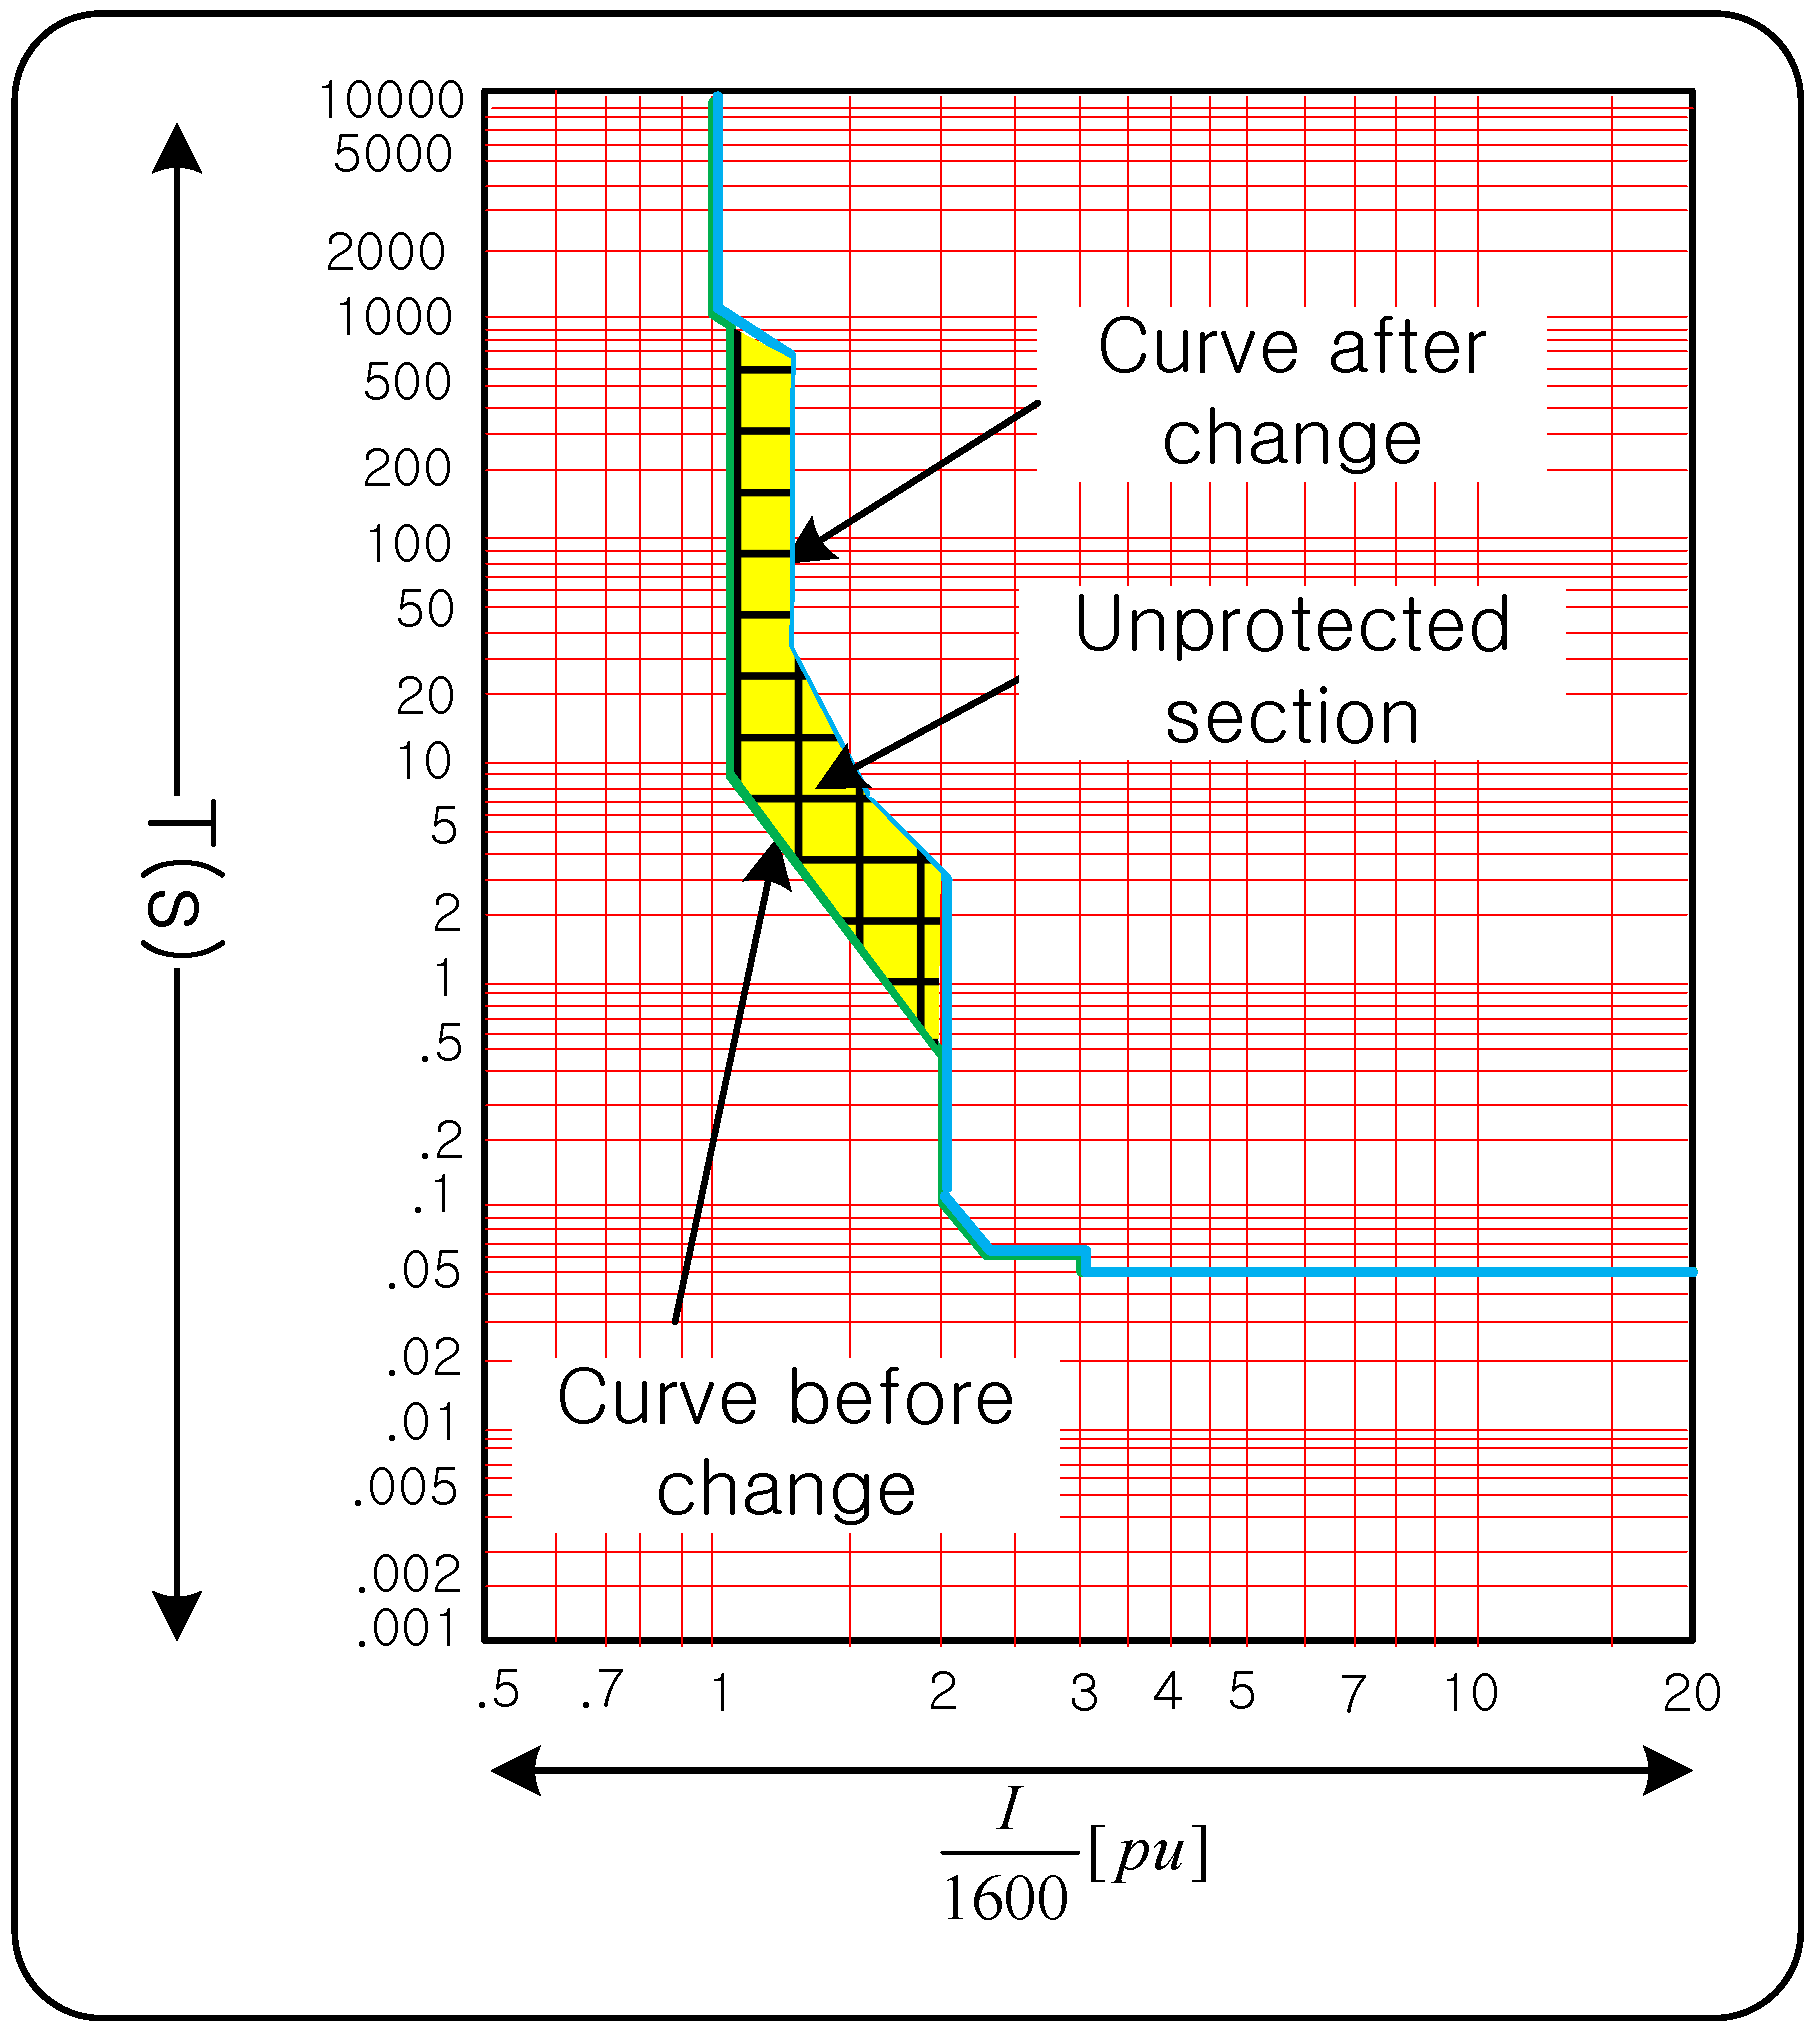
3.4. Problem and Solution of Re-Coordination
4. Demonstration in the Field
5. Conclusions
Acknowledgments
Author Contributions
Conflicts of Interest
Appendix
References
- Hornak, D.; Chau, N.H. Green power-wind generated protection and control considerations. In Proceedings of the 57th IEEE Annual Conference for Protective Relay Engineers, College Station, TX, USA, 1 April 2004; pp. 110–131.
- Pradhan, A.K.; Joos, G. Adaptive distance relay setting for lines connecting wind farms. IEEE Trans. Energy Convers. 2007, 22, 206–213. [Google Scholar] [CrossRef]
- Sujo, P.G.; Ashok, S. Malfunction of differential relays in wind farms. Int. J. Adv. Electr. Electron. Eng. 2014, 3, 27–31. [Google Scholar]
- Wu, Y.K.; Lin, Z.T.; Lee, T.C.; Hsieh, T.Y.; Lin, W.M. Adaptive setting and simulation of distance protection relay in a long transmission system connected to an offshore wind farm. J. Clean Energy Technol. 2016, 6, 401–407. [Google Scholar] [CrossRef]
- Glushakow, B. Effective lightning protection for wind turbine generators. IEEE Trans. Energy Convers. 2007, 22, 214–222. [Google Scholar] [CrossRef]
- Yip, T.; An, C.; Lloyd, G.; Aten, M.; Ferri, B. Dynamic line rating protection for wind farm connections. In Proceedings of the 2009 CIGRE/IEEE PES Joint Symposium on Integration of Wide-Scale Renewable Resources into the Power Delivery System, Calgary, AB, Canada, 29–31 July 2009; pp. 1–5.
- Altin, M.; Göksu, Ö.; Teodorescu, R.; Rodriguez, P.; Jensen, B.B.; Helle, L. Overview of recent grid codes for wind power integration. In Proceedings of the 12th IEEE International Conference on Optimization of Electrical and Electronic Equipment, Basov, Romania, 20–22 May 2010; pp. 1152–1160.
- Sun, T.; Chen, Z.; Blaabjerg, F. Voltage recovery of grid-connected wind turbines with DFIG after a short-circuit fault. In Proceedings of the 35th IEEE Annual Power Electronics Specialists Conference, Aachen, Germany, 20–25 June 2004; Volume 3, pp. 1991–1997.
- Erlich, I.; Bachmann, U. Grid code requirements concerning connection and operation of wind turbines in Germany. In Proceedings of the IEEE Power Engineering Society General Meeting, San Francisco, CA, USA, 12–16 June 2005; pp. 1253–1257.
- Sun, T.; Chen, Z.; Blaabjerg, F. Transient stability of DFIG wind turbines at an external short-circuit fault. Wind Energy 2005, 8, 345–360. [Google Scholar] [CrossRef]
- Lopez, J.; Sanchis, P.; Roboam, X.; Marroyo, L. Dynamic behavior of the doubly fed induction generator during three-phase voltage dips. IEEE Trans Energy Convers. 2007, 22, 709–717. [Google Scholar] [CrossRef]
- Erlich, I.; Winter, W.; Dittrich, A. Advanced grid requirements for the integration of wind turbines into the German transmission system. In Proceedings of the IEEE Power Engineering Society General Meeting, Montreal, QC, Canada, 18–22 June 2006; pp. 1–7.
- Chen, Z.; Guerrero, J.M.; Blaabjerg, F. A review of the state of the art of power electronics for wind turbines. IEEE Trans. Power Electron. 2009, 24, 1859–1875. [Google Scholar] [CrossRef]
- Seman, S.; Niiranen, J.; Kanerva, S.; Arkkio, A.; Saitz, J. Performance study of a doubly fed wind-power induction generator under network disturbances. IEEE Trans. Energy Convers. 2006, 21, 883–890. [Google Scholar] [CrossRef]
- Brochu, J.; Larose, C.; Gagnon, R. Validation of single-and multiple-machine equivalents for modeling wind power plants. IEEE Trans. Energy Convers. 2011, 26, 532–541. [Google Scholar] [CrossRef]
- Morren, J.; De Haan, S.W. Short-circuit current of wind turbines with doubly fed induction generator. IEEE Trans. Energy Convers. 2007, 22, 174–180. [Google Scholar] [CrossRef]
- Yang, J.; Fletcher, J.E.; O’Reilly, J. Multiterminal DC wind farm collection grid internal fault analysis and protection design. IEEE Trans. Power Deliv. 2010, 25, 2308–2318. [Google Scholar] [CrossRef]
- Chen, Y.M.; Cheng, C.S.; Wu, H.C. Grid-connected hybrid PV/wind power generation system with improved DC bus voltage regulation strategy. In Proceedings of the 12th IEEE Applied Power Electronics Conference and Exposition, Dallas, TX, USA, 19–23 March 2006; pp. 1–7.
- Erlich, I.; Wrede, H.; Feltes, C. Dynamic behavior of DFIG-based wind turbines during grid faults. In Proceedings of the Power Conversion Conference-Nagoya, Nagoya, Japan, 2–5 April 2007; pp. 1195–1200.
- Lei, Y.; Mullane, A.; Lightbody, G.; Yacamini, R. Modeling of the wind turbine with a doubly fed induction generator for grid integration studies. IEEE Trans. Energy Convers. 2006, 21, 257–264. [Google Scholar] [CrossRef]
- Banakar, H.; Luo, C.; Ooi, B.T. Impacts of wind power minute-to-minute variations on power system operation. IEEE Trans. Power Syst. 2008, 23, 150–160. [Google Scholar] [CrossRef]
- Jauch, C.; Sørensen, P.; Norheim, I.; Rasmussen, C. Simulation of the impact of wind power on the transient fault behavior of the Nordic power system. Electr. Power Syst. Res. 2007, 77, 135–144. [Google Scholar] [CrossRef]
- Erlich, I.; Kretschmann, J.; Fortmann, J.; Mueller-Engelhardt, S.; Wrede, H. Modeling of wind turbines based on doubly-fed induction generators for power system stability studies. IEEE Trans. Power Syst. 2007, 22, 909–919. [Google Scholar] [CrossRef]
- Slootweg, J.G.; De Haan, S.W.H.; Polinder, H.; Kling, W.L. General model for representing variable speed wind turbines in power system dynamics simulations. IEEE Trans. Power Syst. 2003, 18, 144–151. [Google Scholar] [CrossRef]
- Qiao, W.; Zhou, W.; Aller, J.M.; Harley, R.G. Wind speed estimation based sensorless output maximization control for a wind turbine driving a DFIG. IEEE Trans. Power Electron. 2008, 23, 1156–1169. [Google Scholar] [CrossRef]
- Lo, K.Y.; Chen, Y.M.; Chang, Y.R. MPPT battery charger for stand-alone wind power system. IEEE Trans. Power Electron. 2011, 26, 1631–1638. [Google Scholar] [CrossRef]
- Luo, C.; Banakar, H.; Shen, B.; Ooi, B.T. Strategies to smooth wind power fluctuations of wind turbine generator. IEEE Trans. Energy Convers. 2007, 22, 341–349. [Google Scholar] [CrossRef]
- Li, P.; Banakar, H.; Keung, P.K.; Far, H.G.; Ooi, B.T. Macromodel of spatial smoothing in wind farms. IEEE Trans. Energy Convers. 2007, 22, 119–128. [Google Scholar] [CrossRef]
- Thet, A.K.; Saitoh, H. Pitch control for improving the low-voltage ride-through of wind farm. In Proceedings of the Transmission and Distribution Conference and Exposition: Asia and Pacific, Seoul, Korea, 26–30 October 2009; pp. 1–4.
- Dubey, R.; Samantaray, S.R.; Panigrahi, B.K. Adaptive distance protection scheme for shunt-FACTS compensated line connecting wind farm. J. IET Gener. Transm. Distrib. 2016, 10, 247–256. [Google Scholar] [CrossRef]
- Haque, M.E.; Negnevitsky, M.; Muttaqi, K.M. A novel control strategy for a variable-speed wind turbine with a permanent-magnet synchronous generator. IEEE Trans. Ind. Appl. 2010, 46, 331–339. [Google Scholar] [CrossRef]
- Pannell, G.; Atkinson, D.J.; Zahawi, B. Minimum-threshold crowbar for a fault-ride-through grid-code-compliant DFIG wind turbine. IEEE Trans. Energy Convers. 2010, 25, 750–759. [Google Scholar] [CrossRef]
- Muyeen, S.M.; Takahashi, R.; Murata, T.; Tamura, J. A variable speed wind turbine control strategy to meet wind farm grid code requirements. IEEE Trans. Power Syst. 2010, 25, 331–340. [Google Scholar] [CrossRef]
- Ok, Y.; Lee, J.; Choi, J. Coordination of over current relay for sudden rise of input energy in renewable power system. In Proceedings of the International Conference on Renewable Energy Research and Applications, Palermo, Italy, 22–25 November 2015; pp. 654–658.


| No. | Fault | No. | Fault | ||||||
|---|---|---|---|---|---|---|---|---|---|
| 1 | R, S, T | 1788.5 | 1863.8 | 1928.2 | 21 | R, S, T | 2123.1 | 2184.0 | 2257.7 |
| 2 | R, S, T | 1792.3 | 1874.0 | 1953.8 | 22 | R, S, T | 1920.5 | 1974.0 | 2057.7 |
| 3 | R, S, T | 2216.7 | 2263.5 | 2316.7 | 23 | R, S, T | 2002.6 | 2053.4 | 2155.1 |
| 4 | R, S, T | 2214.1 | 2283.9 | 2285.9 | 24 | R, S, T | 2000.0 | 2025.2 | 2100.0 |
| 5 | R, S, T | 2034.6 | 2091.8 | 2125.6 | 25 | R, S, T | 1944.9 | 2000.9 | 2073.1 |
| 6 | R, S, T | 2210.3 | 2250.6 | 2285.9 | 26 | R, S, T | 2030.8 | 2081.6 | 2137.2 |
| 7 | R, S, T | 2132.1 | 2189.2 | 2205.1 | 27 | R, S, T | 1985.9 | 2026.5 | 2091.0 |
| 8 | R, S, T | 2052.6 | 2117.4 | 2146.2 | 28 | R, S, T | 2023.1 | 2045.7 | 2093.6 |
| 9 | R, S, T | 1878.2 | 1924.0 | 1998.7 | 29 | R, S, T | 1925.6 | 1944.5 | 1997.4 |
| 10 | R, S, T | 2133.3 | 2208.4 | 2288.5 | 30 | R, S, T | 1970.5 | 1995.7 | 2059.0 |
| 11 | R, S, T | 2091.0 | 2144.3 | 2188.5 | 31 | R, S, T | 2042.3 | 2061.1 | 2123.1 |
| 12 | R, S, T | 1928.2 | 1997.0 | 2057.7 | 32 | R, S, T | 1974.4 | 1984.2 | 2080.8 |
| 13 | R, S, T | 1941.0 | 1985.5 | 2057.7 | 33 | R, S, T | 2069.2 | 2095.6 | 2189.7 |
| 14 | R, S, T | 1984.6 | 2035.4 | 2057.7 | 34 | R, S, T | 1909.0 | 1930.4 | 2028.2 |
| 15 | R, S, T | 1964.1 | 2016.2 | 2070.5 | 35 | R, S, T | 2223.1 | 2223.7 | 2294.9 |
| 16 | R, S, T | 2053.8 | 2116.1 | 2167.9 | 36 | R, S, T | 1997.4 | 2000.9 | 2062.8 |
| 17 | R, S, T | 2039.7 | 2080.3 | 2109.0 | 37 | R, S, T | 2029.5 | 2025.2 | 2091.0 |
| 18 | R, S, T | 2048.7 | 2085.4 | 2120.5 | 38 | R, S, T | 2026.9 | 2053.4 | 2155.1 |
| 19 | R, S, T | 2025.6 | 2068.7 | 2098.7 | 39 | R, S, T | 2059.0 | 2072.6 | 2125.6 |
| 20 | R, S, T | 2259.0 | 2308.3 | 2326.9 |
| Event No. | Phase Voltage (V) | Event No. | Phase Voltage (V) | ||||
|---|---|---|---|---|---|---|---|
| 1 | 359.6 | 369.9 | 361.4 | 21 | 366.8 | 375.3 | 369.2 |
| 2 | 358.4 | 369.0 | 359.8 | 22 | 368.4 | 377.1 | 371.0 |
| 3 | 368.4 | 372.6 | 369.7 | 23 | 364.8 | 375.1 | 369.2 |
| 4 | 373.6 | 376.0 | 371.5 | 24 | 382.2 | 387.7 | 383.8 |
| 5 | 378.3 | 382.3 | 378.0 | 25 | 373.8 | 381.8 | 375.3 |
| 6 | 369.3 | 372.2 | 368.4 | 26 | 370.4 | 376.7 | 371.3 |
| 7 | 377.4 | 380.3 | 375.5 | 27 | 373.1 | 378.9 | 374.4 |
| 8 | 370.6 | 375.5 | 369.5 | 28 | 385.3 | 387.7 | 385.4 |
| 9 | 372.5 | 381.2 | 376.0 | 29 | 383.5 | 386.8 | 384.5 |
| 10 | 357.5 | 368.4 | 360.9 | 30 | 386.9 | 392.4 | 388.8 |
| 11 | 374.0 | 379.6 | 374.6 | 31 | 376.8 | 382.3 | 376.9 |
| 12 | 360.5 | 369.9 | 362.7 | 32 | 367.7 | 376.7 | 370.8 |
| 13 | 373.8 | 381.4 | 376.4 | 33 | 362.3 | 372.0 | 365.0 |
| 14 | 376.5 | 379.1 | 375.1 | 34 | 367.5 | 377.1 | 370.4 |
| 15 | 372.2 | 378.5 | 373.1 | 35 | 347.1 | 353.5 | 372.2 |
| 16 | 375.2 | 382.3 | 376.0 | 36 | 351.7 | 359.1 | 378.2 |
| 17 | 390.5 | 393.3 | 389.9 | 37 | 351.2 | 358.0 | 374.0 |
| 18 | 383.5 | 386.3 | 382.9 | 38 | 332.2 | 343.2 | 364.8 |
| 19 | 379.7 | 382.1 | 378.2 | 39 | 358.7 | 368.8 | 372.4 |
| 20 | 375.4 | 377.1 | 373.3 | ||||
| Event No. | Wind Speed | Event No. | Wind Speed | Event No. | Wind Speed | Event No. | Wind Speed | Event No. | Wind Speed | Event No. | Wind Speed |
|---|---|---|---|---|---|---|---|---|---|---|---|
| 1 | 12.7 | 8 | 12.1 | 15 | 12.8 | 22 | 13.5 | 29 | 13.1 | 36 | 10.7 |
| 2 | 13.3 | 9 | 12.4 | 16 | 10.6 | 23 | 11.8 | 30 | 14.1 | 37 | 15.9 |
| 3 | 12.0 | 10 | 12.7 | 17 | 12.6 | 24 | 13.2 | 31 | 11.5 | 38 | 13.8 |
| 4 | 15.5 | 11 | 12.9 | 18 | 9.8 | 25 | 10.4 | 32 | 8.9 | 39 | 12.6 |
| 5 | 14.3 | 12 | 12.7 | 19 | 12.3 | 26 | 11.4 | 33 | 10.4 | ||
| 6 | 11.7 | 13 | 12.2 | 20 | 20.1 | 27 | 15.8 | 34 | 13.1 | ||
| 7 | 12.2 | 14 | 13.4 | 21 | 13.7 | 28 | 9.2 | 35 | 11.9 |
| Month | Wind Speed (2011) | Wind Speed (2012) |
|---|---|---|
| January | 5.1 | 4.7 |
| February | 3.5 | 5.0 |
| March | 5.8 | 5.7 |
| April | 4.6 | 5.2 |
| May | 4.3 | 3.4 |
| June | 3.9 | 3.5 |
| July | 3.7 | 3.8 |
| August | 3.0 | 5.1 |
| September | 4.1 | 4.1 |
| October | 3.9 | 4.8 |
| November | 4.6 | 6.1 |
| December | 5.0 | 5.3 |
| Average | 4.3 | 4.7 |
| GIPAM-2200DG | Lever | Operation Time | ||
|---|---|---|---|---|
| Minimum Operating Current | Average Operating Current | Maximum Operating Current | ||
| 1788.5 A | 2052.6 A | 2316.7 A | ||
| Before change | 0.05 | 6.49 | 2.53 | 1.57 |
| After change | 0.06 | ∞ | 6.10 | 2.91 |
| 0.07 | ∞ | 7.12 | 3.39 | |
| 0.08 | ∞ | 8.13 | 3.88 | |
| 0.09 | ∞ | 9.15 | 4.36 | |
| 0.10 | ∞ | 10.17 | 4.85 | |
| 0.11 | ∞ | 11.18 | 5.33 | |
| 0.12 | ∞ | 12.20 | 5.82 | |
| 0.13 | ∞ | 13.22 | 6.30 | |
| 0.14 | ∞ | 14.23 | 6.79 | |
| 0.15 | ∞ | 15.25 | 7.27 | |
| 0.16 | ∞ | 16.27 | 7.75 | |
| 0.17 | ∞ | 17.28 | 8.24 | |
| 0.18 | ∞ | 18.30 | 8.72 | |
| 0.19 | ∞ | 19.32 | 9.21 | |
| 0.20 | ∞ | 20.33 | 9.69 | |
| Wind Speed (m/s) | Times | Operation | Remarks |
|---|---|---|---|
| Higher than 17.00 | 1 | X | O: Operation X: No operation Test Period: 5 March–25 June 2014 |
| 16.00~16.99 | 2 | X | |
| 15.00~15.99 | 5 | X | |
| 14.00~14.99 | 35 | X | |
| 13.00~13.99 | 119 | X | |
| 12.00~12.99 | 320 | X | |
| 11.00~11.99 | 422 | X | |
| 10.00~10.99 | 575 | X | |
| 8.90~9.99 | 1000 | X | |
| Total | 2479 |
© 2016 by the authors; licensee MDPI, Basel, Switzerland. This article is an open access article distributed under the terms and conditions of the Creative Commons Attribution (CC-BY) license (http://creativecommons.org/licenses/by/4.0/).
Share and Cite
Ok, Y.; Lee, J.; Choi, J. Analysis and Solution for Operations of Overcurrent Relay in Wind Power System. Energies 2016, 9, 458. https://doi.org/10.3390/en9060458
Ok Y, Lee J, Choi J. Analysis and Solution for Operations of Overcurrent Relay in Wind Power System. Energies. 2016; 9(6):458. https://doi.org/10.3390/en9060458
Chicago/Turabian StyleOk, Yeonho, Jaewon Lee, and Jaeho Choi. 2016. "Analysis and Solution for Operations of Overcurrent Relay in Wind Power System" Energies 9, no. 6: 458. https://doi.org/10.3390/en9060458