Article

Development of a PEM Fuel Cell City Bus with a Hierarchical Control System

1
Department of Automotive Engineering, State Key Laboratory of Automotive Safety and Energy, Tsinghua University, Beijing 100084, China
2
Collaborative Innovation Center of Electric Vehicles in Beijing, Beijing 100081, China
3
Institute of Energy and Climate Research, IEK-3: Electrochemical Process Engineering, Forschungszentrum Jülich GmbH, 52425 Jülich, Germany
*
Author to whom correspondence should be addressed.
Energies 2016, 9(6), 417; https://doi.org/10.3390/en9060417
Submission received: 19 April 2016 / Revised: 21 May 2016 / Accepted: 24 May 2016 / Published: 30 May 2016
(This article belongs to the Special Issue Polymer Electrolyte Membrane Fuel Cells 2016)

Abstract

:
The polymer electrolyte membrane (PEM) fuel cell system is considered to be an ideal alternative for the internal combustion engine, especially when used on a city bus. Hybrid buses with fuel cell systems and energy storage systems are now undergoing transit service demonstrations worldwide. A hybrid PEM fuel cell city bus with a hierarchical control system is studied in this paper. Firstly, the powertrain and hierarchical control structure is introduced. Secondly, the vehicle control strategy including start-stop strategy, energy management strategy, and fuel cell control strategy, including the hydrogen system and air system control strategies, are described in detail. Finally, the performance of the fuel cell was analyzed based on road test data. Results showed that the different subsystems were well-coordinated. Each component functioned in concert in order to ensure that both safety and speed requirements were satisfied. The output current of the fuel cell system changed slowly and the output voltage was limited to a certain range, thereby enhancing durability of the fuel cell. Furthermore, the economic performance was optimized by avoiding low load conditions.

1. Introduction

Since fossil fuel energy resources are becoming scarcer and the environment is negatively affected by their combustion, increasing attention is being paid to electric vehicles (EVs) [1]. Hydrogen fuel cell electric vehicles (FCEVs) are one type of electric vehicle. Polymer electrolyte membrane (PEM) FCEVs have the advantages of high efficiency, low temperature and low noise. In addition, FCEVs provide zero emission driving combined with reasonably short refueling times of 3 to 5 min. If the hydrogen used for FCEVs is produced with renewable electricity such as solar and wind power generation, there is an environmental advantage of a FCEV towards an internal combustion engine (ICE) vehicle [2,3]. In addition, compared with battery systems, PEM fuel cell systems can store more energy because of the high energy density of hydrogen gas, so the driving range of a (PEM) FCEV can be as extended as that of an ICE vehicle [4,5]. Therefore, a PEM fuel cell is suitable for vehicles with large weight and long driving range requirement, such as buses.
Owing to the effect of gas inertia, the actual power change of the fuel cell is always delayed by several seconds compared with power demand; otherwise, there would be a serious gas starvation, which is harmful to the fuel cell stack. Thus, in order to satisfy the power demand, the fuel cell system is usually combined with an energy storage system such as a battery package or ultra-capacitor system, constituting a hybrid fuel cell powertrain [6,7]. For this reason, most buses adopt hybrid powertrains to obtain an improved performance and extended life of the fuel cell system [8,9,10].
In particular, fuel cell buses are receiving more and more attention worldwide. All major international automobile manufacturers have launched fuel cell buses, and in order to promote the commercialization of these buses, they have been demonstrated in transit service in various countries [9].
For example, nine demonstrational projects of fuel cell buses were carried out in the US during the years 2010–2012. These projects were carried out in different cities. By the end of December 2011, three different buses achieved running times of 1100 h, 8000 h and 6000 h, respectively [11,12].
Under the European Union project entitled Clean Urban Transport for Europe (CUTE), 36 Citaro fuel cell buses together achieved an accumulated driving time of more than 140,000 hours, and an accumulated driving distance of over 2,200,000 km [13].
The second phase of the Japan Hydrogen and Fuel Cell (JHFC) project was completed in 2010 [14]. During the past eight years, 13 fuel cell buses accumulated a remarkable driving distance of 400,000 km [15].
As the technology advances, hybrid systems with smaller fuel cells and more powerful batteries are being developed that will further increase the reliability and cost-effectiveness of the systems [16,17]. The third generation prototype of the hybrid fuel cell powertrain system developed by Tsinghua University is called a “plug-in hybrid fuel cell powertrain” and comprises a battery that allows charging from the grid. The fuel cell system provides the average power demand and works in a relatively stable state to prolong its working lifetime. The more powerful lithium-ion battery provides the extra power to ensure dynamic performance [10].
A hybrid powertrain requires the coordinated functioning of different systems, so a hierarchical control strategy is required. The strategy structure needs to consist of both vehicle control and fuel cell control. A number of studies have been conducted to develop an optimized hierarchical control strategy.
For vehicle control, many researches are about energy management strategies. Paganelli et al. laid the foundation for an optimized energy management strategy by introducing the concept of equivalent fuel consumption [18]. Peng Hui et al. introduced global optimization algorithms using dynamic programming or stochastic programming methods for hybrid vehicles, enabling a reduction in fuel consumption of up to 15% [19]. Junzhi Zhang developed a braking energy regeneration control strategy coordinating the regenerative brake and the pneumatic brake for a fuel cell hybrid bus, the results showed that the fuel consumption was improved by 11.5% and the brake safety was guaranteed at the same time [20]. Xu et al. proposed an adaptive supervisory control strategy for a fuel cell/batter y-powered city bus to fulfill the complex road conditions in Beijing bus routes, what lowered fuel consumption from 9.5 kg (100 km)−1 to 9.3 kg (100 km)−1 [21]. In addition, they set up a simulation model to compare the DDP (Determined Dynamic Programming) strategy, the DBSD (Charge Depleting-Blended-Sustaining-Depleting) strategy and the CDCS (Charge Depleting and Charge Sustaining) strategies. Compared to the CDCS strategy, the daily operating cost can be reduced by 6.4% with the DBSD strategy, and it can be reduced by 9.5% with the DDP strategy [22]. Besides energy management strategies, Xu et al. have also done some other work on vehicle control such as developed an optimal control strategy based on a time-triggered controller area network (TTCAN) and developed an active fault tolerance control system to ensure the vehicle safety [23,24].
For fuel cell control, J.T. Pukrushpan et al. proposed a widely-used non-linear dynamic model to describe the PEM fuel cell system, and designed feedback controllers based on the model [25]. Rakhtala et al. presented the designing and controlling a suitable power conditioning unit (PCU) that consists of two DC/DC converter stages and DC/AC inverter. In addition, an analysis of cascade structure based on fuzzy PID controller for a single phase inverter is done and also two feedback control loops are comprised [26]. Fang developed a model based control strategy to regulate the anode pressure of the fuel cell system and utilized the strategy on a test bench [27]. Toyota has done excellent work on fuel cell cold start control. They use the concept of concentration loss and developed a control strategy which enable the system to start up from −37 degree centigrade. In addition, the problem of pumping hydrogen is solved by a bypass valve control [28,29].
However, there are not many researches about how to improve the fuel cell durability and system reliability through vehicle control. In addition, the DC/DC efficiency has not been widely investigated.
In this paper, a plug-in hybrid fuel cell bus with a small fuel cell system and a high-power battery package was studied. The rest of this paper is organized as follows: first, the powertrain structure and the fuel cell system are introduced, together with the hierarchical control system. Then, in Section 3, the control strategies aiming at improving durability, reliability and efficiency are discussed, including start-stop strategy, energy management strategy, air supply control strategy, hydrogen supply control strategy. In Section 4, the start performance, dynamic performance and economy performance of the bus are analyzed based on road test data. Section 5 presents the conclusions of our study.

2. System Description

2.1. Powertrain Structure and System Model

2.1.1. The Hybrid Powertrain

A schematic of the structure of the powertrain of the city bus is shown in Figure 1. The arrows indicate the direction of energy flow.
The city bus is driven by two electric wheel motors with a power rating of 65 kW each, and is powered by a Li-ion battery as the primary power source and a PEM fuel cell as the auxiliary power unit. The main specifications of the city bus are listed in Table 1.
The rated power of the fuel cell system, at 50 kW, is relatively small in comparison to the rated power of the battery system. The fuel cell system is used to supply the average power demand, whereas the high-frequency power change is assumed by the battery system.
In order to realize this hybrid energy structure, a boost DC/DC converter is necessary to control the output current of the fuel cell system. This auxiliary of the fuel cell system is powered by the main network bus.
A further specification of this city bus is that it is a plug-in hybrid fuel cell city bus; therefore, as mentioned above, the battery may be charged by an external power supply.

2.1.2. Fuel Cell System

A schematic of the fuel cell system is shown in Figure 2. The main components of the complete fuel cell system consist of the stack, the hydrogen system, the air system, the cooling system and the humidifier.
The stack used in this system consisted of 520 identical cells in series. A small-scale chemical reaction takes place in each cell. Air flows through one side and hydrogen the other side. Water and electricity are generated due to catalysis in the catalyst layer.
The hydrogen system is used for supplying hydrogen to the fuel cells. The hydrogen is released from its tank and passes through a pressure release valve to enter the cell where it takes part in the reaction, and the exhaust gases exit through a purge valve. The purge valve opens when the release of accumulated water and nitrogen is required.
The air system is used for supplying air to the fuel cells. The air comes from an air compressor and is humidified by the humidifier. This ensures that the air is in a moist state so that the membrane does not dry out. The cooling system is used to control the temperature of the stack, thus maintaining the functioning of the stack at conditions of high efficiency and high durability.
The current-voltage (I-V) curve of this fuel cell system is shown in Figure 3a, and the relationship between current and stack efficiency (stack power/hydrogen consumption power) is shown in Figure 3b. As can be seen, these curves show similar trends. The relationship between current and system efficiency ((stack power-auxiliary power)/hydrogen consumption power), on the other hand, exhibits a slight difference in trend, as shown in Figure 3c. This is because when the current is too low, the auxiliary provides a major part of the total output power. The system efficiency is an important parameter in energy management strategy that needs to be considered.

2.1.3. PEM Fuel Cell Model

Generally, the stack voltage V c e l l is made up of four parts: the open circuit voltage E n e r n s t , the activation loss V a c t , the ohmic loss V o h m , and the concentration loss V c o n c .
V c e l l is calculated by the following formula:
V c e l l = E n e r n s t V a c t V o h m V c o n c
The open-circuit voltage E c e l l is slightly affected by temperature and gas pressure. The activation loss V a c t is a function of temperature. The ohmic loss V o h m is mostly determined by current density. Finally, the concentration loss V c o n c is highly related to the gas pressure and gas composition. The detailed derivation of the formula is presented in [23].
The stack power P s t a c k can be calculated as follows:
P s t a c k = n × V c e l l × I s t a c k
where n is the number of cells in the stack; and I s t a c k is the stack current.
The system power P f c is equal to the stack power minus the auxiliary power P a u x , as shown in Equation (3):
P f c = P s t a c k P a u x

2.1.4. DC/DC Converter Model

The efficiency of the boost DC/DC converter can be calculated using the following simplified equation:
η D C = P D C / P s t a c k
where the efficiency of the DC/DC converter, η D C , is equal to the output power P D C divided by the input power P s t a c k .

2.1.5. Battery Model

Several different models are widely used to govern the functioning of the Li-ion battery. In this study, the extended Thevenin model, which is a widely used equivalent circuit model, was used to model and optimize the battery function. A detailed description of this model can be found in ([22] equations 9–11).

2.2. Hierarchical Control System Structure

The hierarchical structure of the control system consists of four layers. The top layer comprises the driver interface, including the accelerator pedal, the brake pedal, the gear-shifting buttons and the dashboard. The driver receives information regarding the vehicle operation and the status of each component from the dashboard, and is able to manipulate the pedals, and shift buttons accordingly, thus controlling the vehicle. The second layer comprises the vehicle control layer. The vehicle control unit (VCU) receives information on pedal positions and shift signals, and communicates with other controller nodes. The third layer comprises the subsystem control layer for the fuel cell system, the battery package, and the Siemens DICO (Digital Input Control) drive system controller. The fourth layer comprises the chip voltage monitoring layer. The chip voltages are cruising inspected, both for the fuel cell system and the battery packages.

2.2.1. Vehicle Control Layer

The framework of the distributed network control system utilized on the city bus is shown in Figure 4. The red line represents controller area network (CAN) A, which is the CAN network bus of the powertrain. Through CAN A, the fuel cell control system (FCS), the electric power steering (EPS), the compressor, the assistant DC/DC converter (ADC) and the battery management system (BMS) send information on their states to the VCU and the data acquisition system (DAS), in turn receiving command information from the VCU. Furthermore, the DAS communicates with the VCU through CAN A.
The VCU sends information to the dashboard for display through CAN B, which is the CAN network bus represented by the pink line.
CAN C, which is represented by a blue line, connects the VCU, the charger control unit (CCU), the BMS and the baud rate converter (BRC). The BRC receives CAN data of 500 k baud rate from the hydrogen concentration sensor, then converts it into 250 k and sends it to the VCU. Furthermore, the VCU communicates with the CCU and the BMS through CAN C in order to complete the charging.
The Flexray network bus, represented by a green line, is utilized in the network for testing. This network bus connects the VCU and the Flexray/CAN converter. The Flexray data from the VCU is transferred to CAN data and sent to the DICO as well as the DC/DC by the converter. In addition, the CAN data from the DICO and the DC/DC is transferred to Flexray data.
The DICO and the DC/DC converter communicate with the Flexray/CAN converter and the DAS through CAN D, which is the CAN network bus represented by the brown line. The DICO is a motor control system, manufactured by Siemens. It has its own algorithm for motor control and it sends out its own state information using the CAN network bus.

2.2.2. Network of the Fuel Cell System

Figure 5 shows the network of the fuel cell system. The main controller of the fuel cell system has three CAN channels. CAN C is used to communicate with the VCU. The main controller obtains commands from the VCU and sends state parameters to the VCU. CAN B is used for communicating with the cell voltage monitor; the six monitor module can detect the voltage of each single cell. CAN A is the major channel of communication. The auxiliary DC/DC converter, the air compressor, and the computer are all connected by CAN A. The computer is used for programming and manual switching during tests. The auxiliary DC/DC converter obtains power from the main network bus to drive the pump and other auxiliaries. The air compressor receives the air request signal from the main controller and sends air into the stack.

3. Control Strategy Design

3.1. Vehicle Control Layer

The VCU uses MPC5644 manufactured by Freescale as its core. The control algorithm is set up in the Simulink platform and downloaded in the VCU using automatic code generation technology.

3.1.1. Start-Stop Strategy

As shown in Figure 1, for a hybrid energy structure, the battery system, the DICO and the DC/DC converter are all directly connected by the power network bus. As shown in Figure 6, there is an electric capacitor inside the DC/DC converter that is parallel-connected to the power network bus. Obviously, when Relay 1 is closed, the capacitor will be charged. Because of the high voltage of the power network bus and the small resistance of the wire, the capacitor is charged within about 10 milliseconds from 0 to 560 V. Thus, the charge current will be sufficient to burn Relay 1. Therefore, Relay 2 and resistance R1 are added to the circuit to ensure the safety of Relay 1.
The shut-down strategy is designed mainly for protecting the fuel cell, as shown in Figure 7. It takes a few minutes for the fuel cell to shut down, so the driver has to maintain power supply to the control system. First, the key needs to be turned from START to ACC, and remain at the ACC position for several seconds while the VCU conducts the shut-down process. When the VCU receives the ACC signal, it communicates with the DICO to ensure that it is ready to be disconnected and disconnects it from the power network bus when it is ready. At the same time, the VCU sends a current decrease command to the DC/DC converter to lower the output power. When the output current of the DC/DC converter is lower than 10 A, it is shut down and disconnected from the power network bus. Then, the fuel cell commences its own shut-down process. After the process is complete, the FCS sends a signal to the VCU and the VCU in turn sends a signal to the dashboard indicating to the driver that all shut-down processes are complete. The driver is not able to turn off the FC-On and H2-Active buttons until he sees this signal. After the buttons are pressed, the driver can shift the key to OFF and may leave the vehicle.

3.1.2. Energy Management Strategy

As described above, the PEM fuel cell is connected to the network bus through the DC/DC converter, which is the key element in the energy management strategy. The converter’s output voltage is determined by the network bus voltage, which means that it operates in current-control mode. Furthermore, the converter’s output current is determined by the energy management strategy.
The pedal position transmitted to the DICO by the VCU determines the output power of the two wheel motors. The power requirement of the motor is distributed between the PEM fuel cell and the battery system by the energy management strategy in order to obtain optimal performance. The battery power P b a t is the difference between the power demanded by the motor P m o t o r and the output power of the DC/DC converter P D C , as shown in Equation (5). Keeping the state of charge (SOC) of the battery within a certain range is beneficial for battery durability and ensures that the battery is able to supply the necessary power at all times. In order to maintain the battery SOC within a certain range, it is important to regulate the output power of the DC/DC converter.
P b a t = P m o t o r P D C
P D C is influenced by P m o t o r and the battery SOC, and a simplified form of the power prediction algorithm is shown in Equation (6):
P D C = P m o t o r τ s + 1 + α ( SOC SOC tg )
Where τ is a variable time constant; α is a coefficient with the unit of kW; and SOC tg is the target SOC.
To optimize the economic performance, it is important to regulate the power distribution between the fuel cell and battery and to set a proper target SOC after one day’s driving. Both these two issues are highly related to the coefficient α , so it needs to be an optimized. Optimization of economic performance can be expressed as the following mathematical formula:
J = min P D C k = 0 N { C f c , k + C b a t , k }
where J is the minimum operation cost; C f c , k is the instantaneous cost of hydrogen for the fuel cell system at the k-th control step; and C b a t , k is the instantaneous battery charge/discharge cost at the k-th control step. The formulae to calculate these costs can be written as follows:
C f c = M H 2 b e P f c Δ t
C b a t = M e l e P b a t ( η dis η chg ) sgn ( P bat ) Δ t
where M H 2 is the current market price of hydrogen (Yuan/kg); b e is the hydrogen consumption rate of the fuel cell (kg/kWh); P f c is the fuel cell output power (kW); M e l e is the current price of electricity (Yuan/kWh); P b a t is the battery output power (kW); η dis is the battery discharging efficiency; η chg is the battery charging efficiency; sgn ( P bat ) represents whether the battery is charged or discharged; and Δ t is the control step in the embedded controller. A detailed explanation of the optimization method can be found in the literature [11].
For a vehicle power source, durability is very important. Therefore, it is necessary to enhance the durability of the fuel cell, and one convenient method for this is by limiting the power changing rate. To limit the power changing rate, the variable time constant τ is the key variable. It can be optimized based on the driving cycle.
In case of extreme conditions such as emergency brake, a forced limitation of power changing rate is necessary. The relationship between the output current of the PEM fuel cell I f c and the output current of the DC/DC converter I D C is as follows:
I f c = I D C * U D C / U f c / η = I D C * λ
where U D C represents the output voltage of the DC/DC converter; U f c represents the output voltage of the PEM fuel cell; and η is the efficiency of the DC/DC converter. The output voltage of the fuel cell is around 400 V and the output voltage of the battery or the network bus voltage is around 600 V. The efficiency η is about 0.9. Therefore, λ is a number between 1.5 and 2 According to the manufacturer of the fuel cell, the rate of current increase should be lower than 8 A/s and the rate of current decrease should be lower than 10 A/s. Therefore, for the converter, the rate of current increase is limited to 4 A/s and the rate of current decrease limited to 5 A/s.
Another method for enhancing the durability is to avoid the low power condition. The output voltage of the fuel cell can be tested and the result directly transmitted to the VCU from the FCS. Whenever the VCU receives a signal indicating a fuel cell voltage higher than 410 V, which means the output power is quite low, it will send a command of current increase to the DC/DC converter until the voltage returns to 410 V.

3.2. Fuel Cell System

As described previously, the fuel cell system is made up of several subsystems and each subsystem has its own characteristics.

3.2.1. Hydrogen Supply System

The purge control strategy is showed in Figure 8.
Normal purge is used under normal operating conditions to discharge the nitrogen and water at the anode side. The open time and frequency are carefully designed based on experimental data to ensure that the hydrogen utilization ratio and system efficiency are both optimized.
Forced purge is used under special operating conditions such as unexpected cell voltage drop. The main purpose of forced exhaust is to recover performance so that the hydrogen utilization ratio is not affected. Therefore, the forced purge frequency is fixed at a much higher rate than normal purge.

3.2.2. Air Supply System

Air starvation is harmful to fuel cell durability and can cause a drop in performance, so it must be prevented. In order to prevent air starvation, the control logic consists of the following procedures (Figure 9). As soon as the VCU receives the signal of load change, it sends commands to the fuel cell system to alter the quantity of air provided by the air compressor. After this is done, a load change command can be sent to the DC/DC to change the fuel cell output current.
As a result of the auxiliary power, there is a trade-off between system efficiency and stack efficiency. An increase in supply of air increases oxygen stoichiometry and pressure, resulting in higher voltage and higher stack efficiency. However, at the same time, an increase in air supply means increased power is required for the air compressor, thus lowering the system efficiency. Therefore, the supply of air is carefully optimized based on experimental data.

4. Performance Analysis and Discussion

Road testing of a city bus was undertaken to test the effectiveness of the control strategies highlighted in Section 3. In this section, the performance of the city bus is analyzed.

4.1. Start-up Process

The purpose of testing the start-up process was to make sure that every component started in the correct order and functioned in a safe condition. The following procedures describe the start-up order. First, the driver shifted the key to ACC, which meant the power supply for the control system was on. When the VCU received the ACC signal from the driver, it communicated with the battery and DICO to make sure they were ready to connect, and also sent commands to various related relays so that they were connected to the power network bus when ready. After proceeding to this step, the vehicle could move when the key was shifted to START and the transmission was shifted to the correct position.
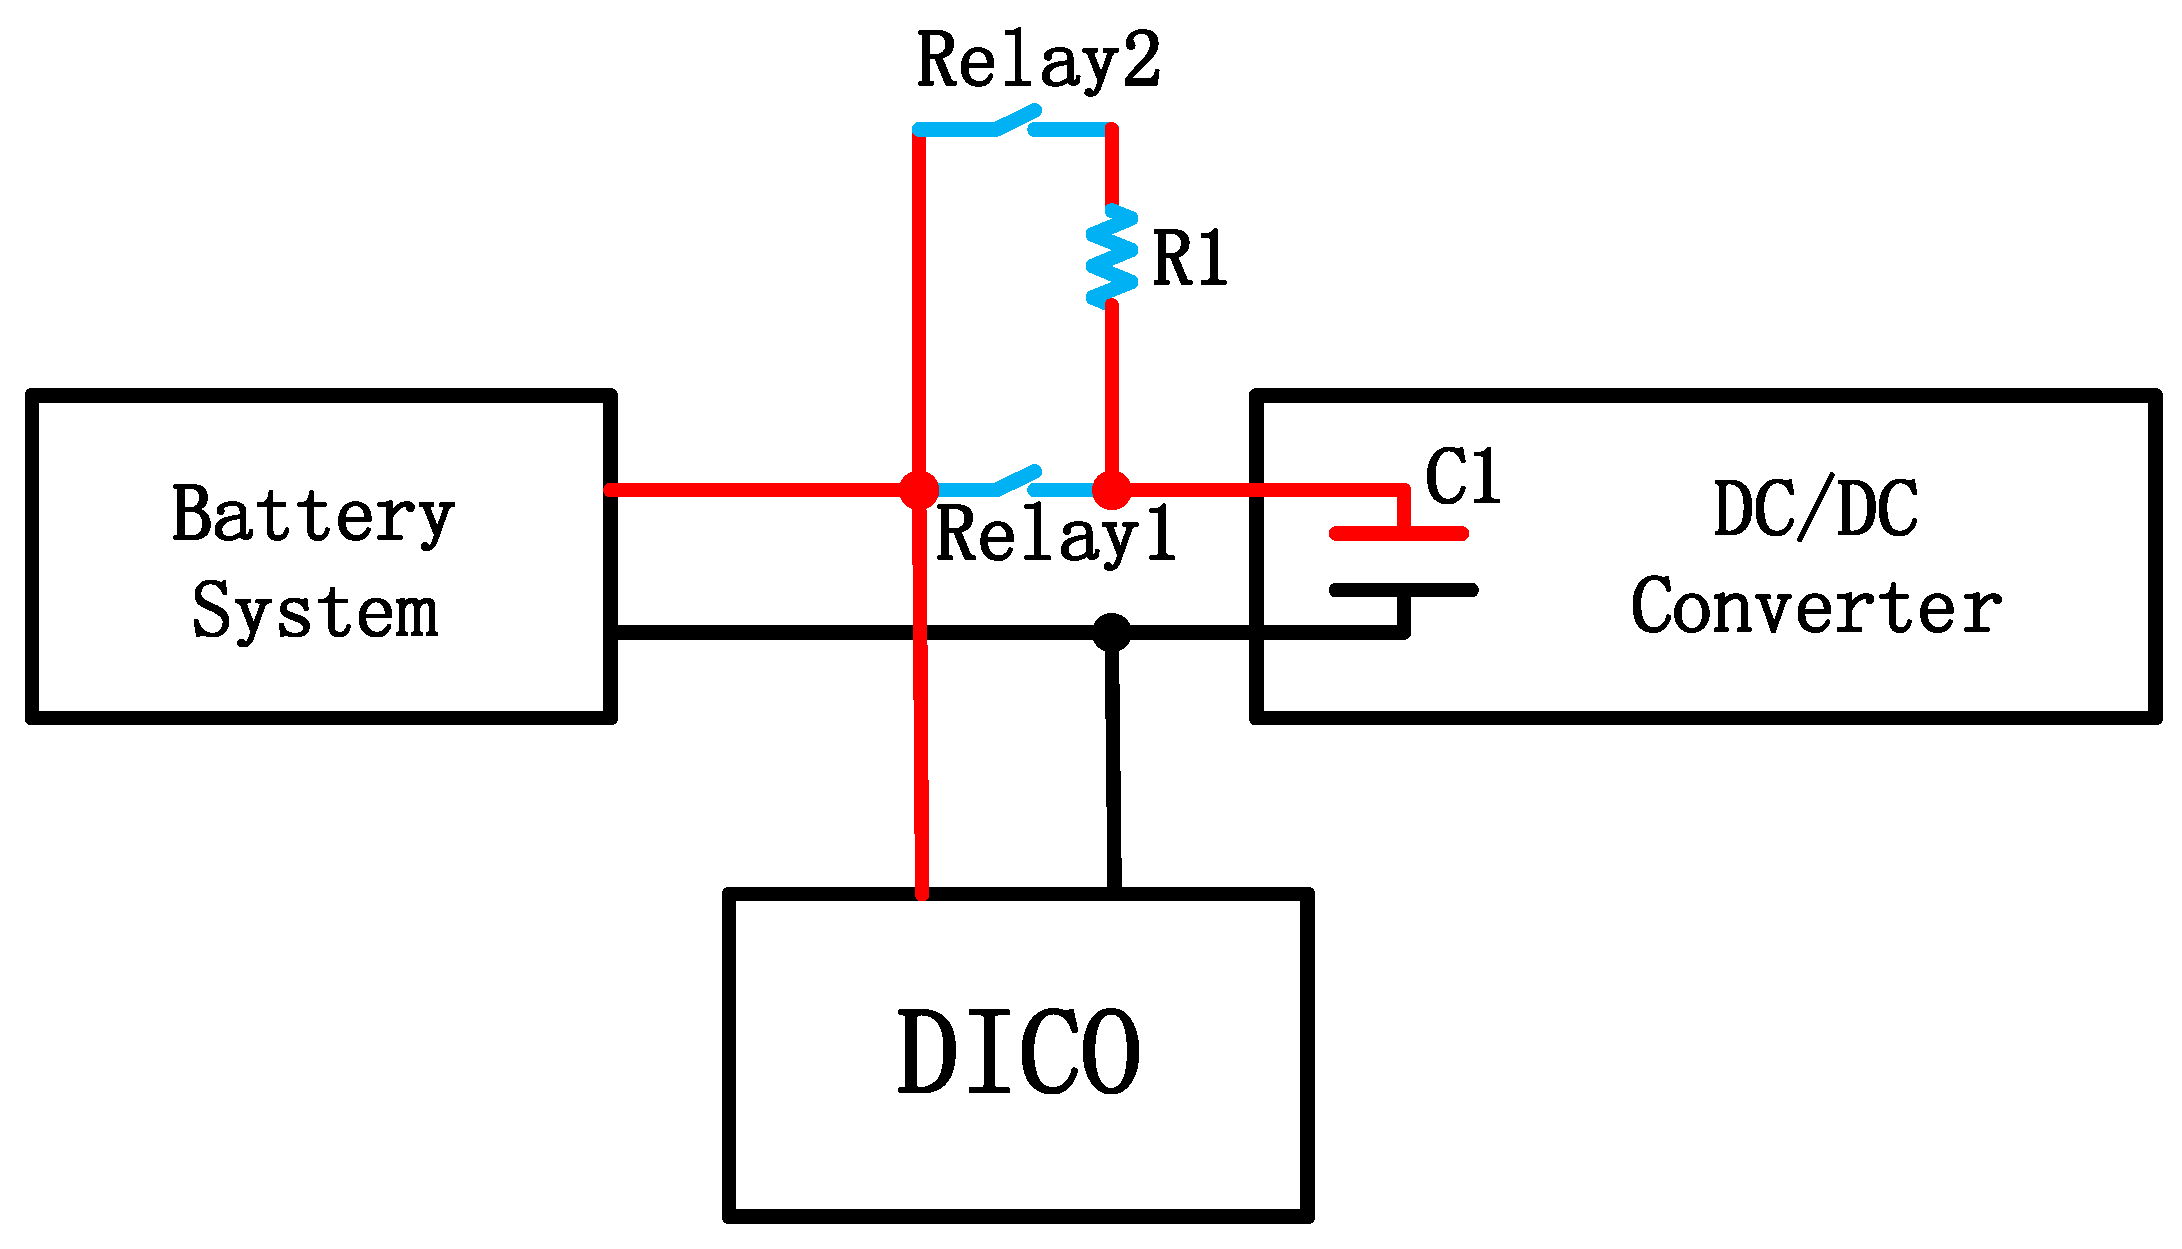
After the key was shifted to START and the battery and DICO were connected, the VCU started to control the DC/DC converter. First, the control code changed, which meant the DC/DC started to function in current mode. Then, Relay 2 was closed to charge the capacitor C1. As soon as the voltage of C1 reached the voltage of the power network bus, Relay 1 was closed and Relay 2 was turned off. When all these procedures were complete, the VCU sent commands to the DC/DC controller to operate the DC/DC converter as required.
If the VCU had already sent control commands to the DC/DC controller and the driver had pressed the FC-On and H2-Active buttons to start the fuel cell and open the hydrogen valve at the same time, then the relay between the DC/DC and the fuel cell system closed so that the fuel cell could start transmitting power.
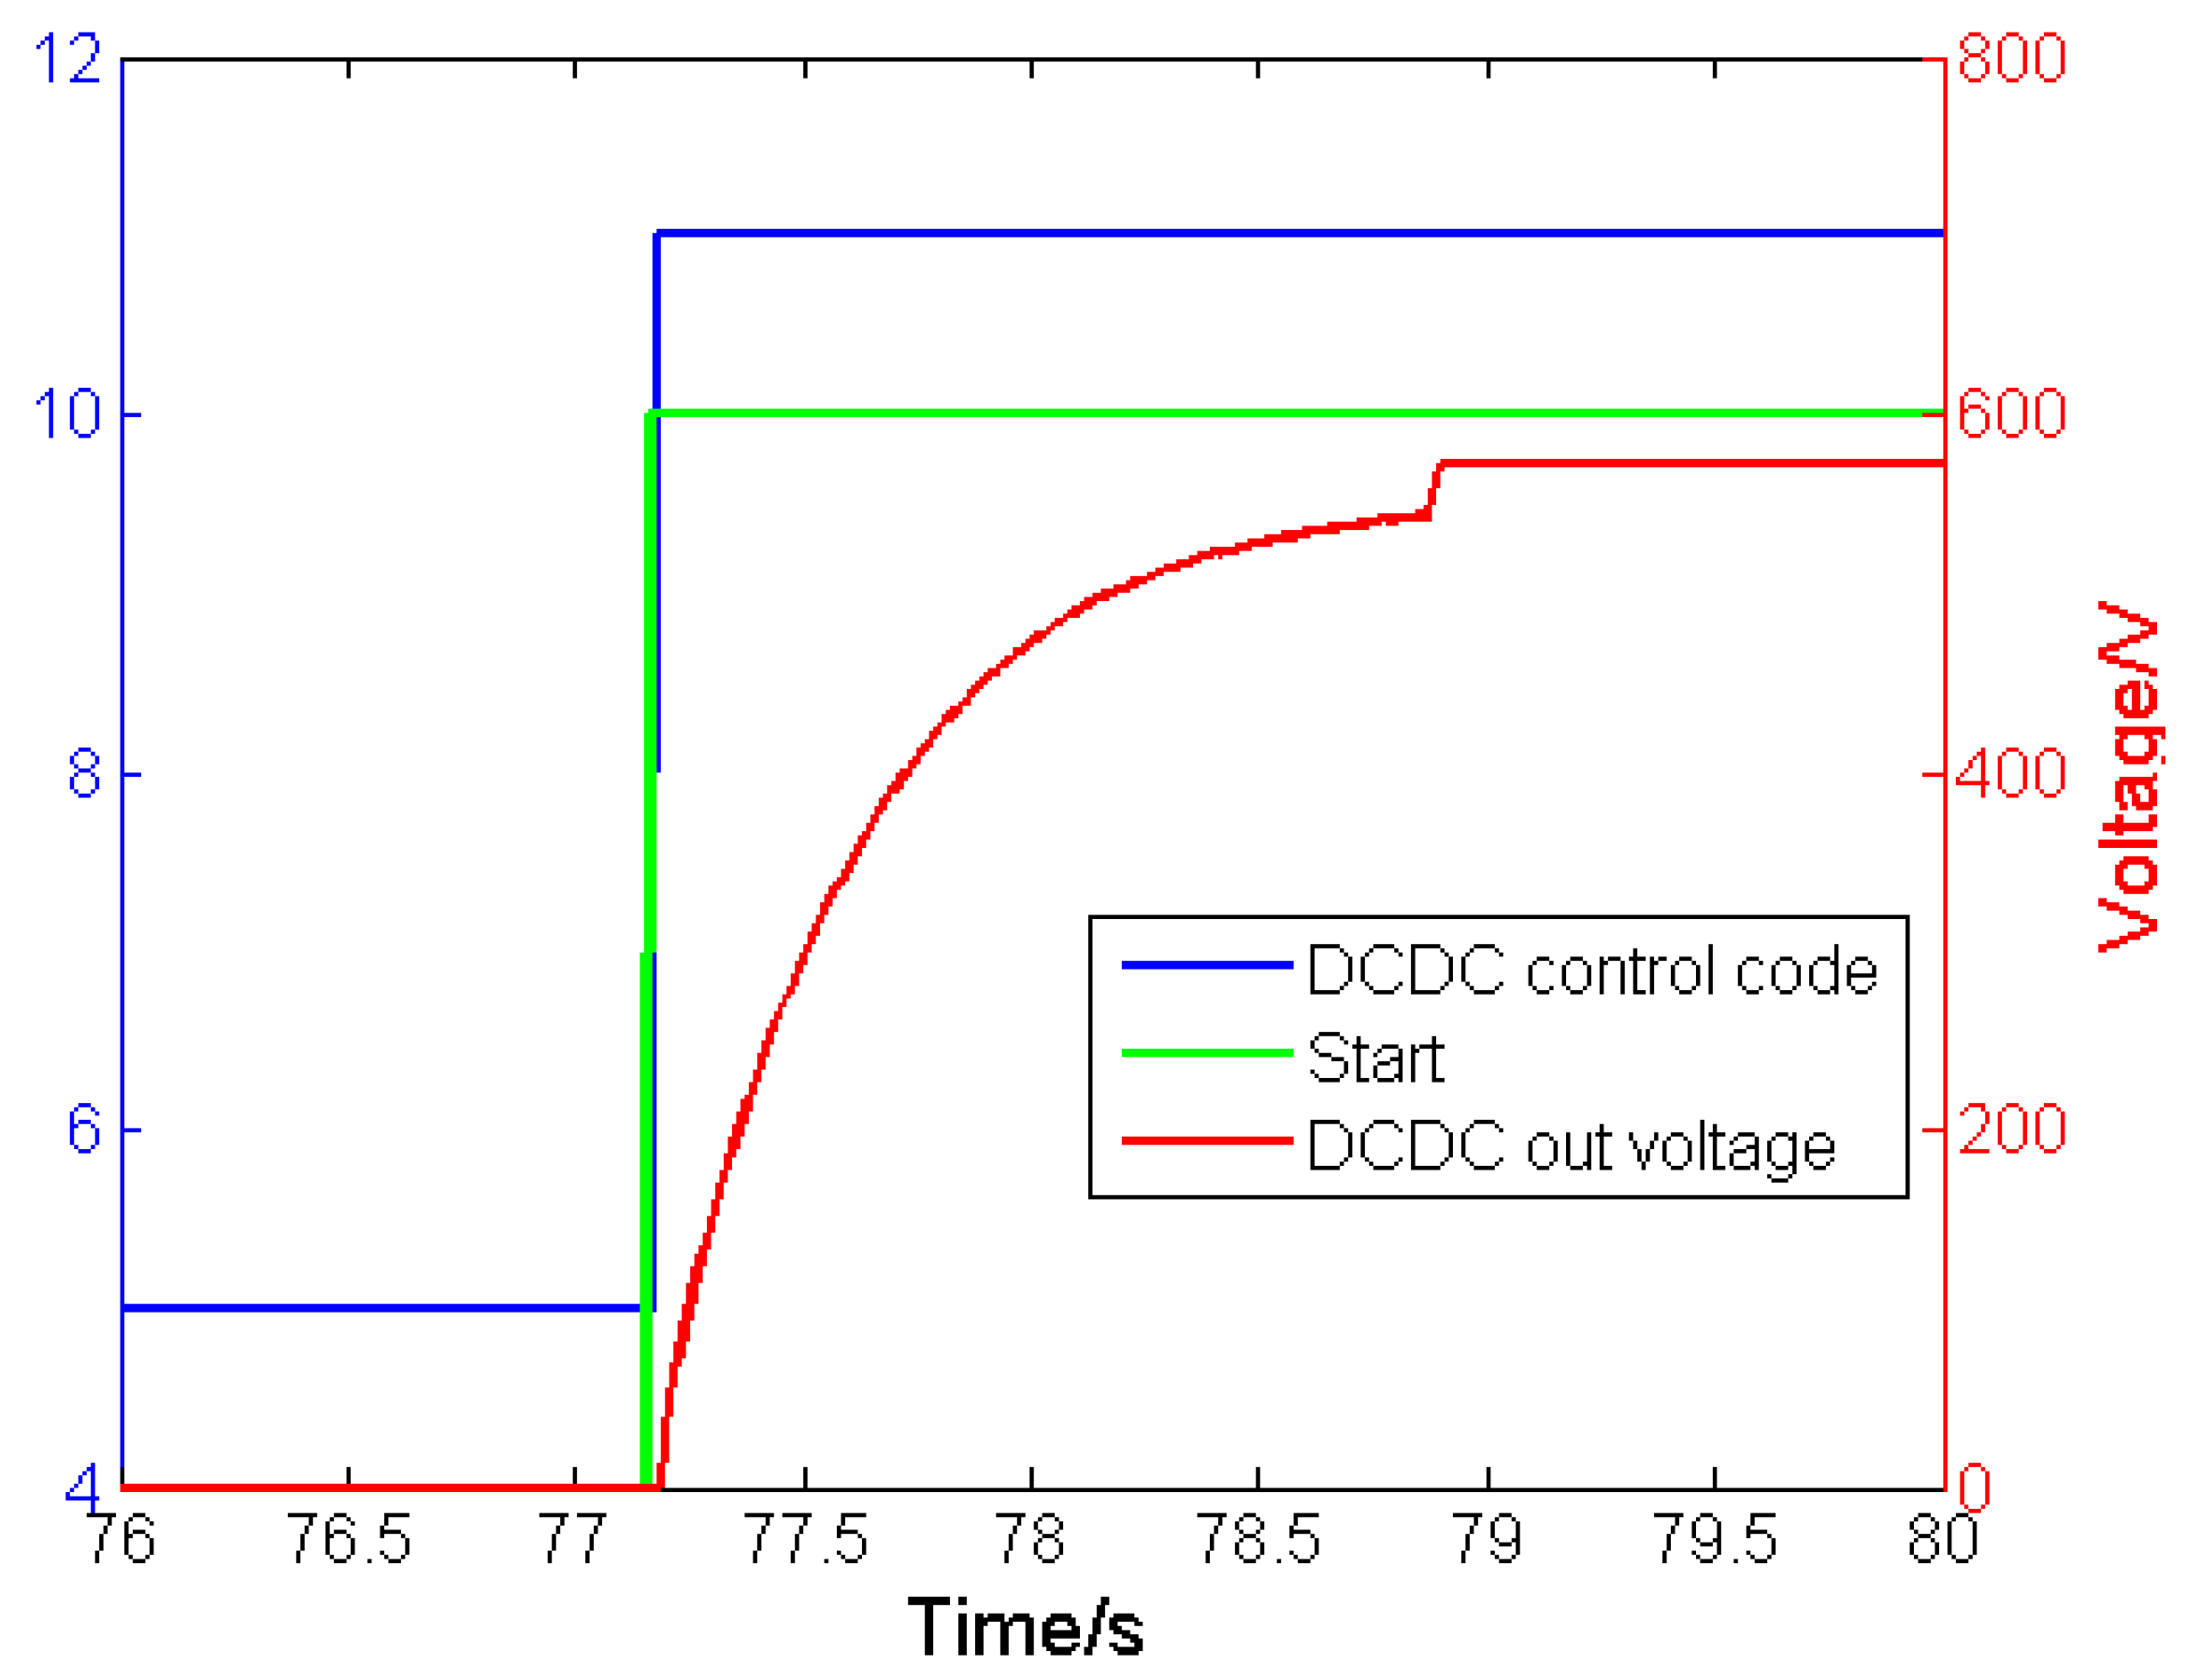
The pre-charge process of the DC/DC converter, shown in 
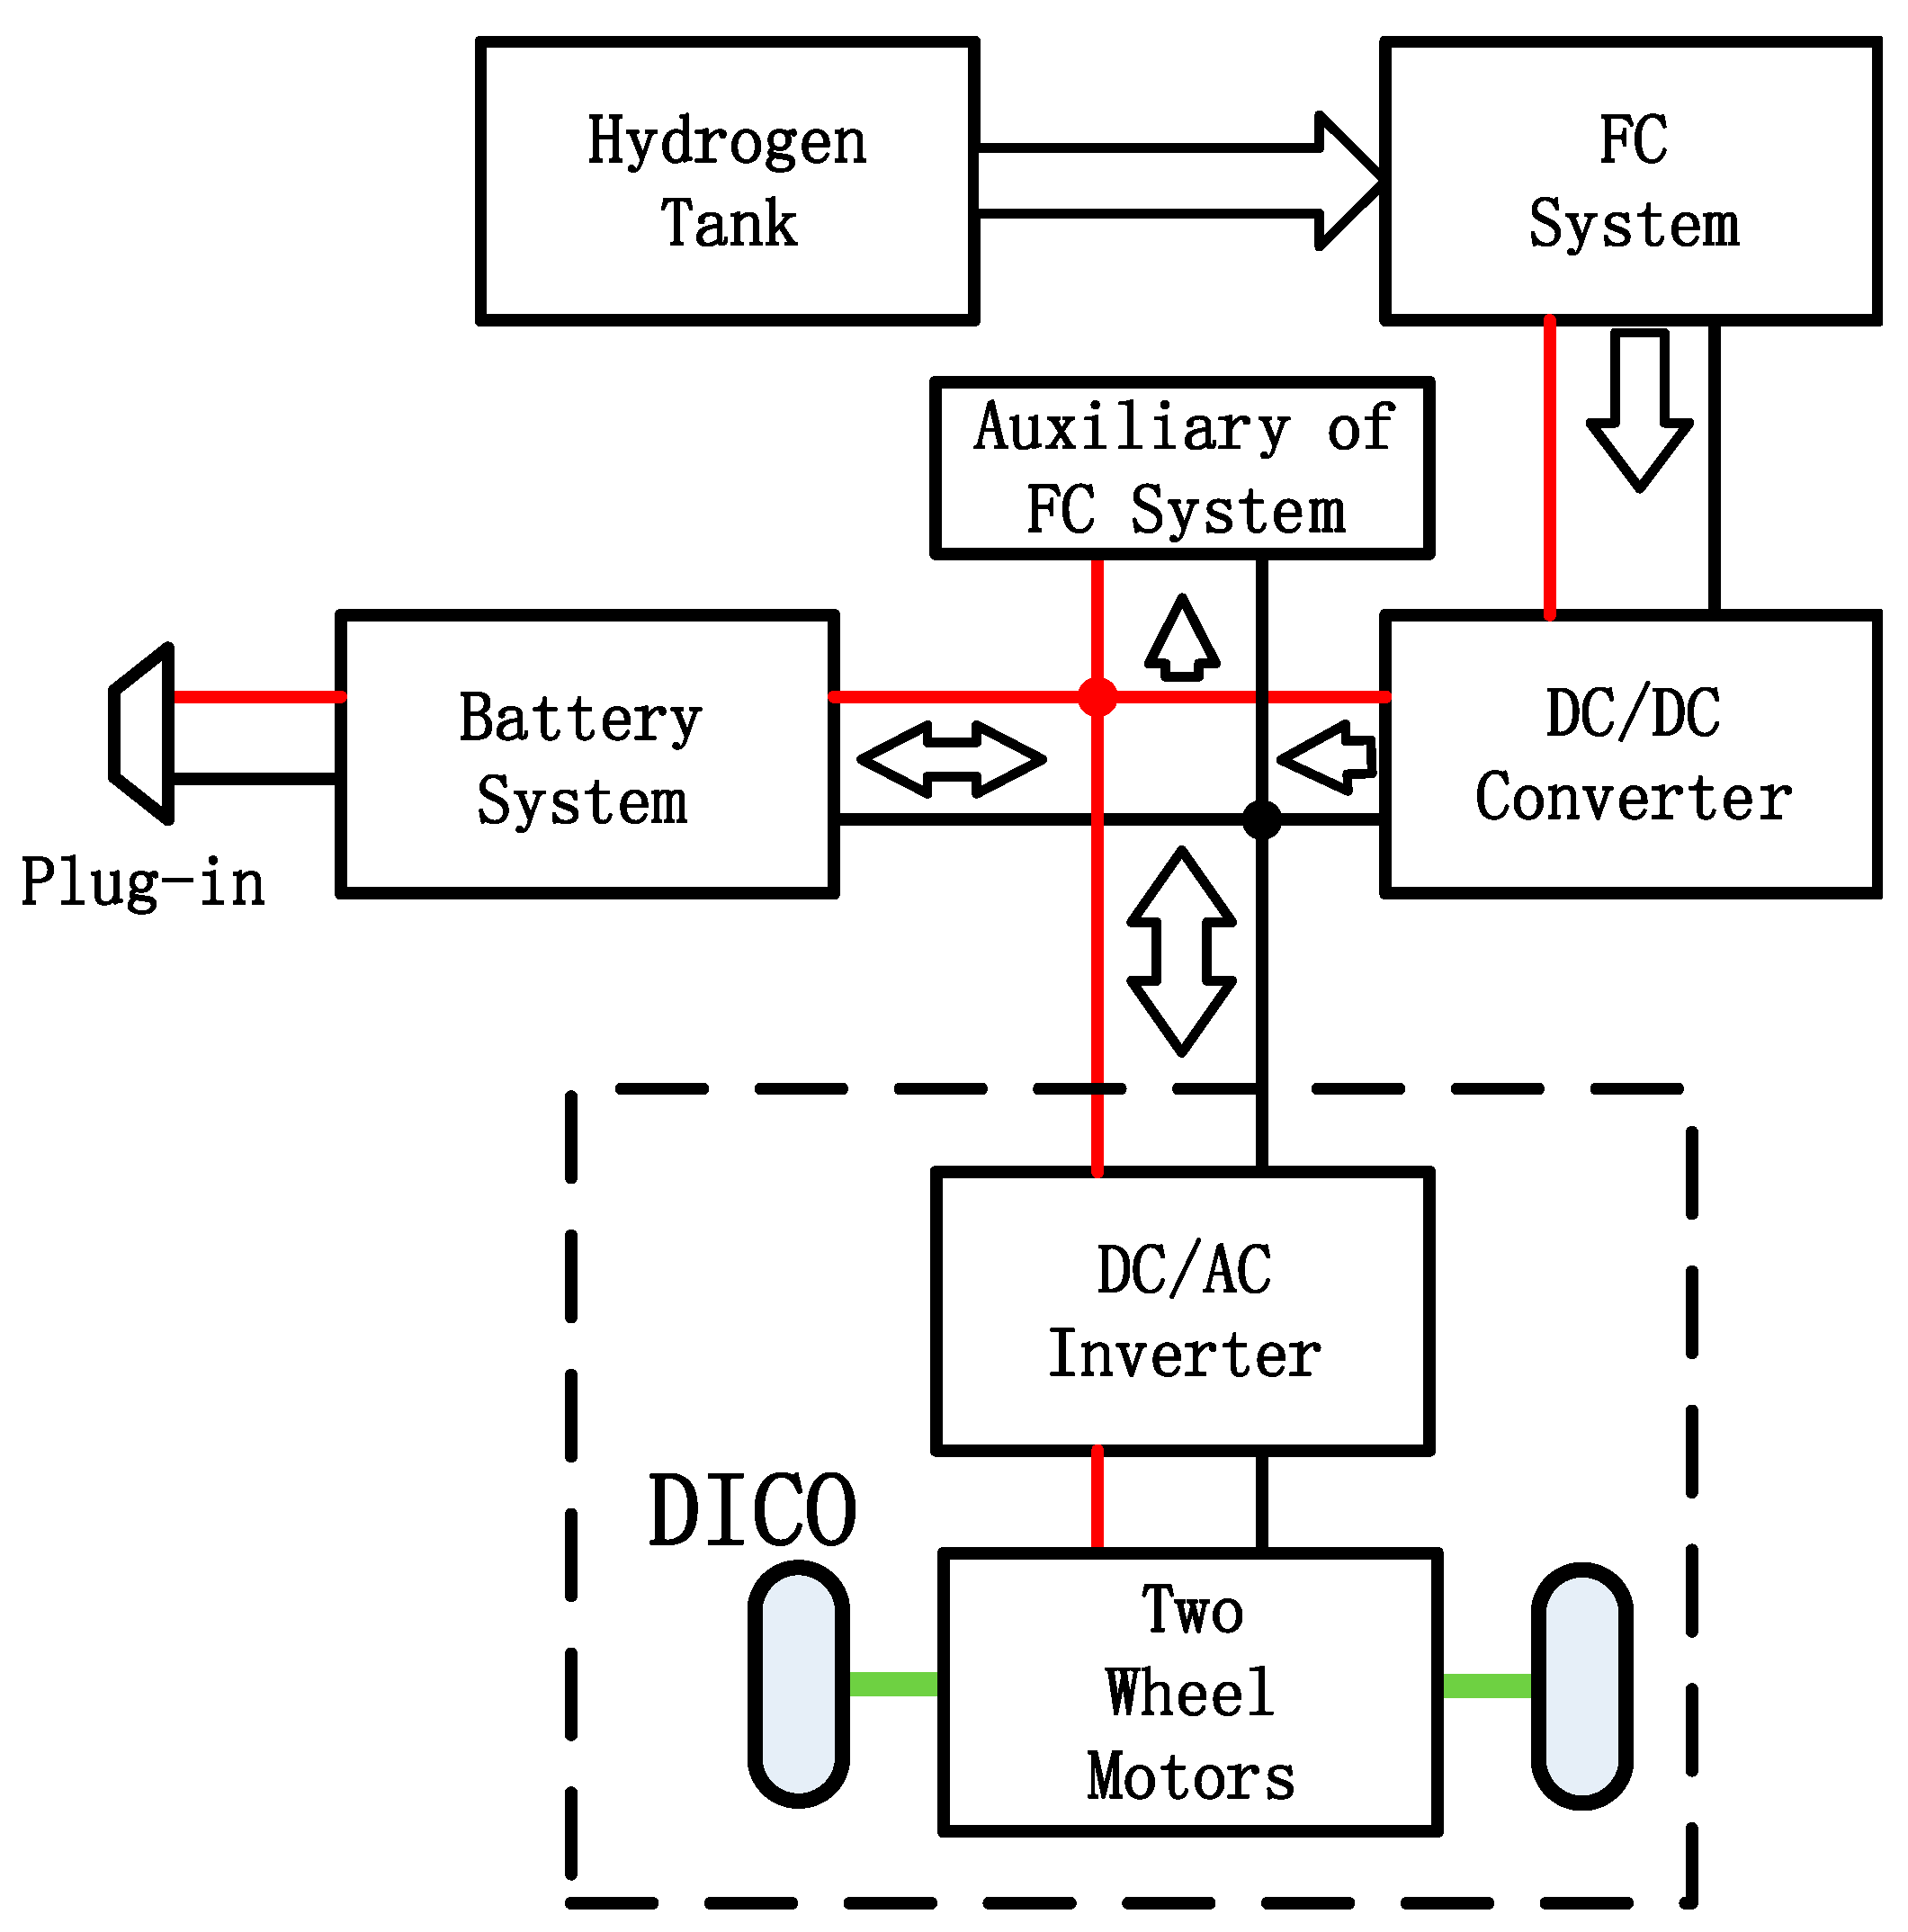
Figure 10, took nearly 2 seconds. It can been seen from the green and blue lines in the figure that as soon as the VCU received the “start” signal from the driver, it sent a command to the DC/DC to change the control code from 5 to 11, which meant that the operation mode of the DC/DC changed from off mode to current mode. Then Relay 2 in Figure 6 was closed and the voltage of the DC/DC started to increase slowly, which was beneficial to the components in the circuit. When the voltage of the DC/DC had almost reached the same voltage as the network bus voltage, Relay 1 in Figure 6 was closed and Relay 2 was opened. This action caused a small increase in the voltage due to the removal of the resistance. After progressing to this step, the fuel cell was ready to start up if necessary.
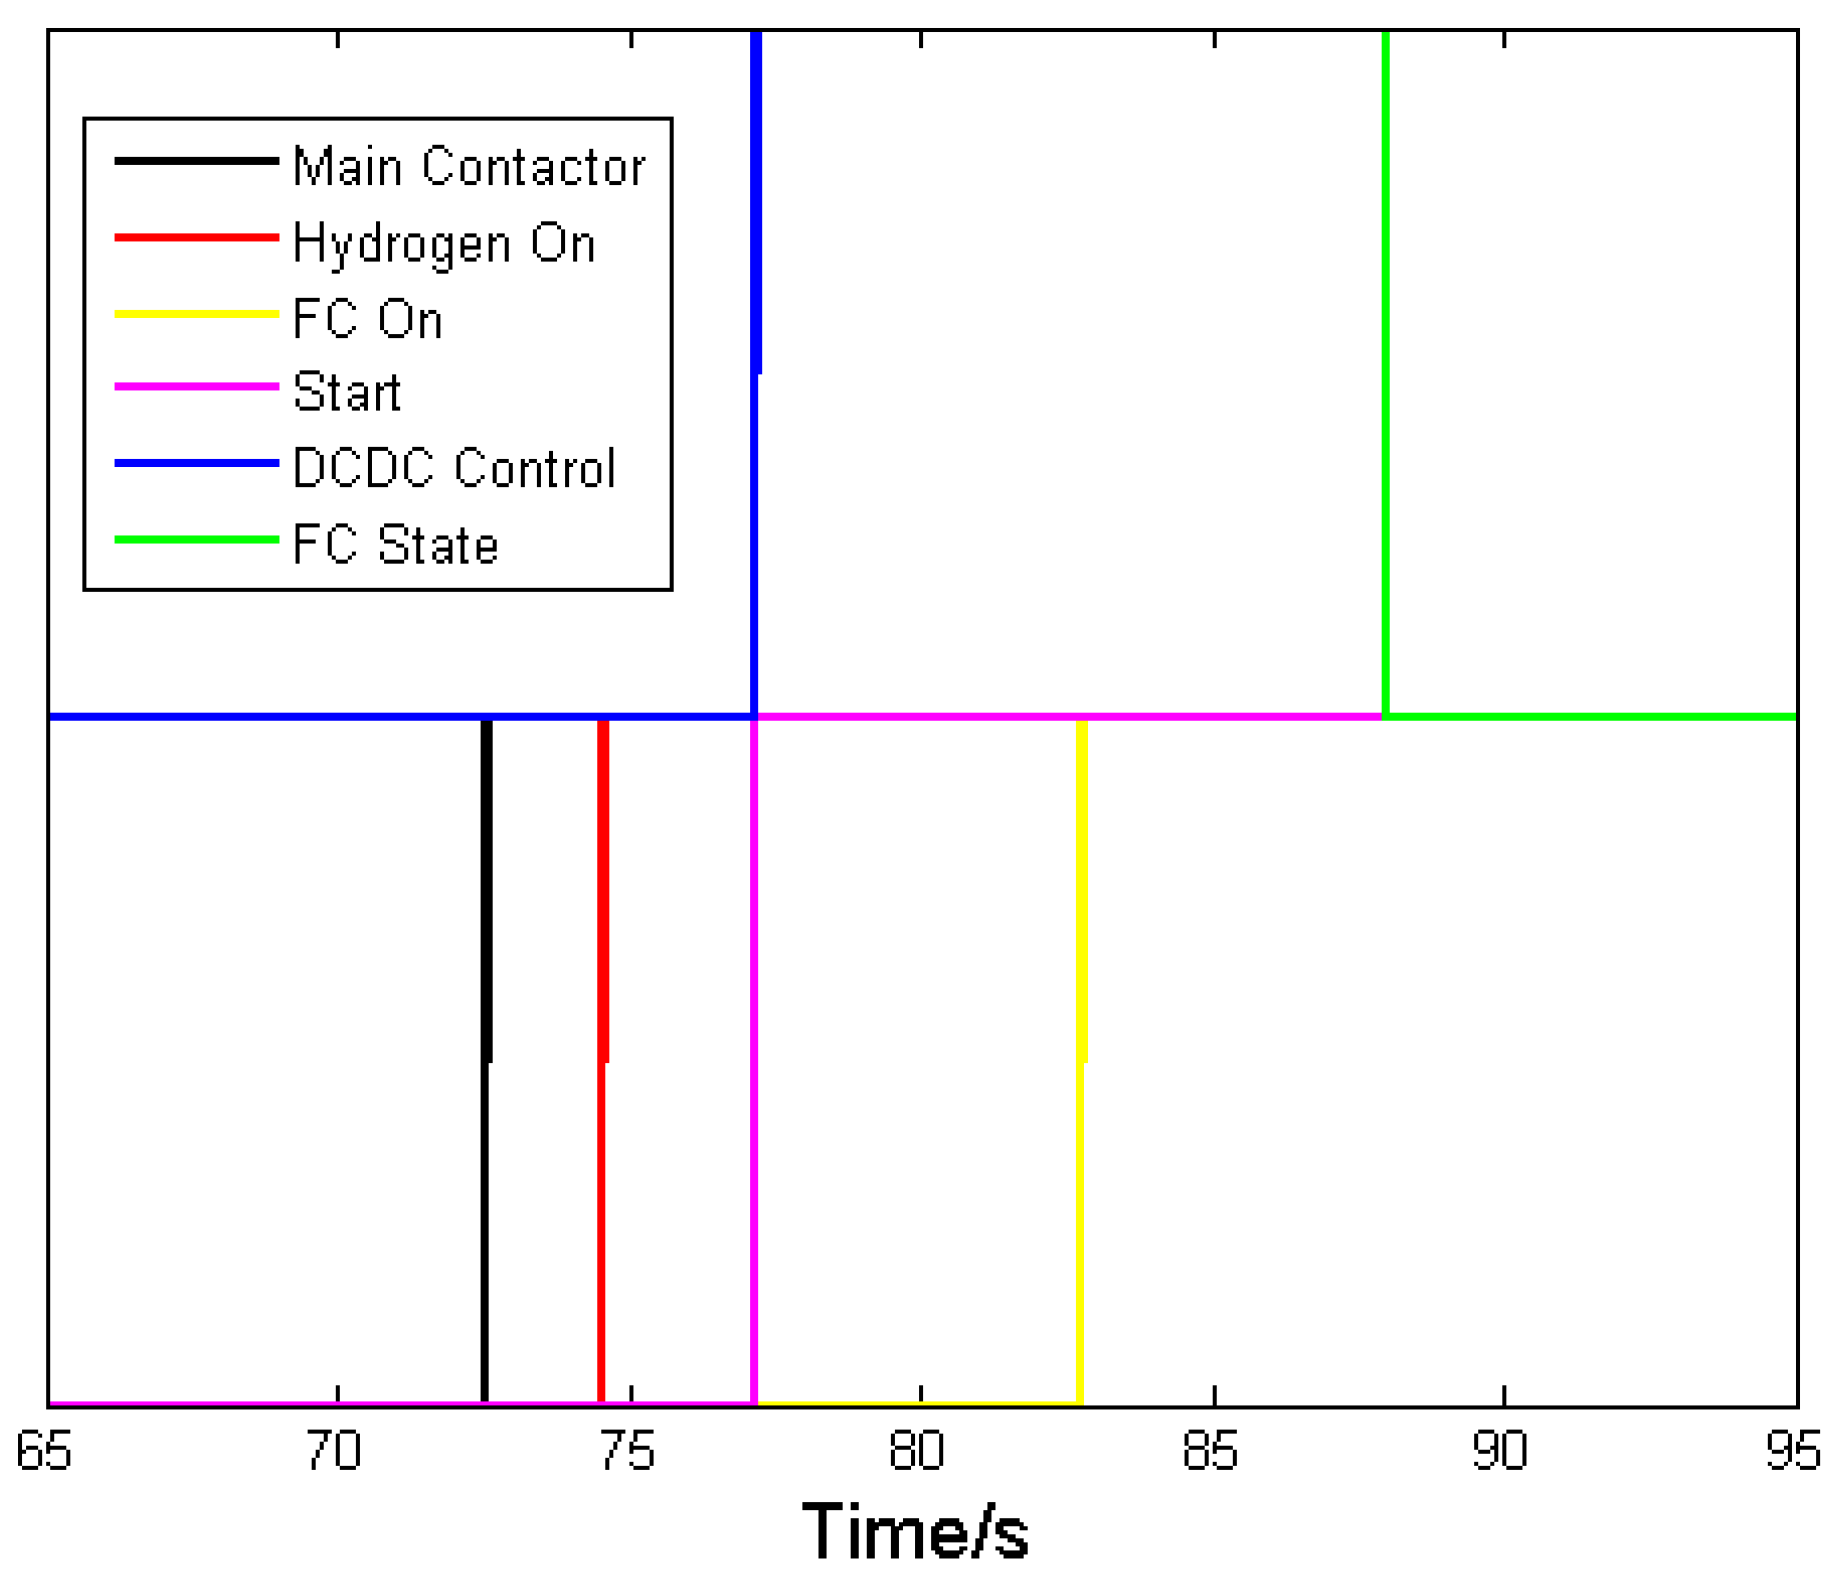
The change order of the main signals is listed in Figure 11. The start signal changed after the main contact was closed. The FC state signal changed after the DC/DC pre-charge was complete, with the obvious precondition that the H2-Active and FC-On buttons were switched on by the driver. The basic logic for this is as follows. First, no signals would change without the necessary change in the main contact signal. Second, H2-Active came on earlier than FC-On in order to prevent fuel starvation. Third, the DC/DC started earlier than the fuel cell system to ensure that the system could output power as soon as it was started.

4.2. Dynamic Performance

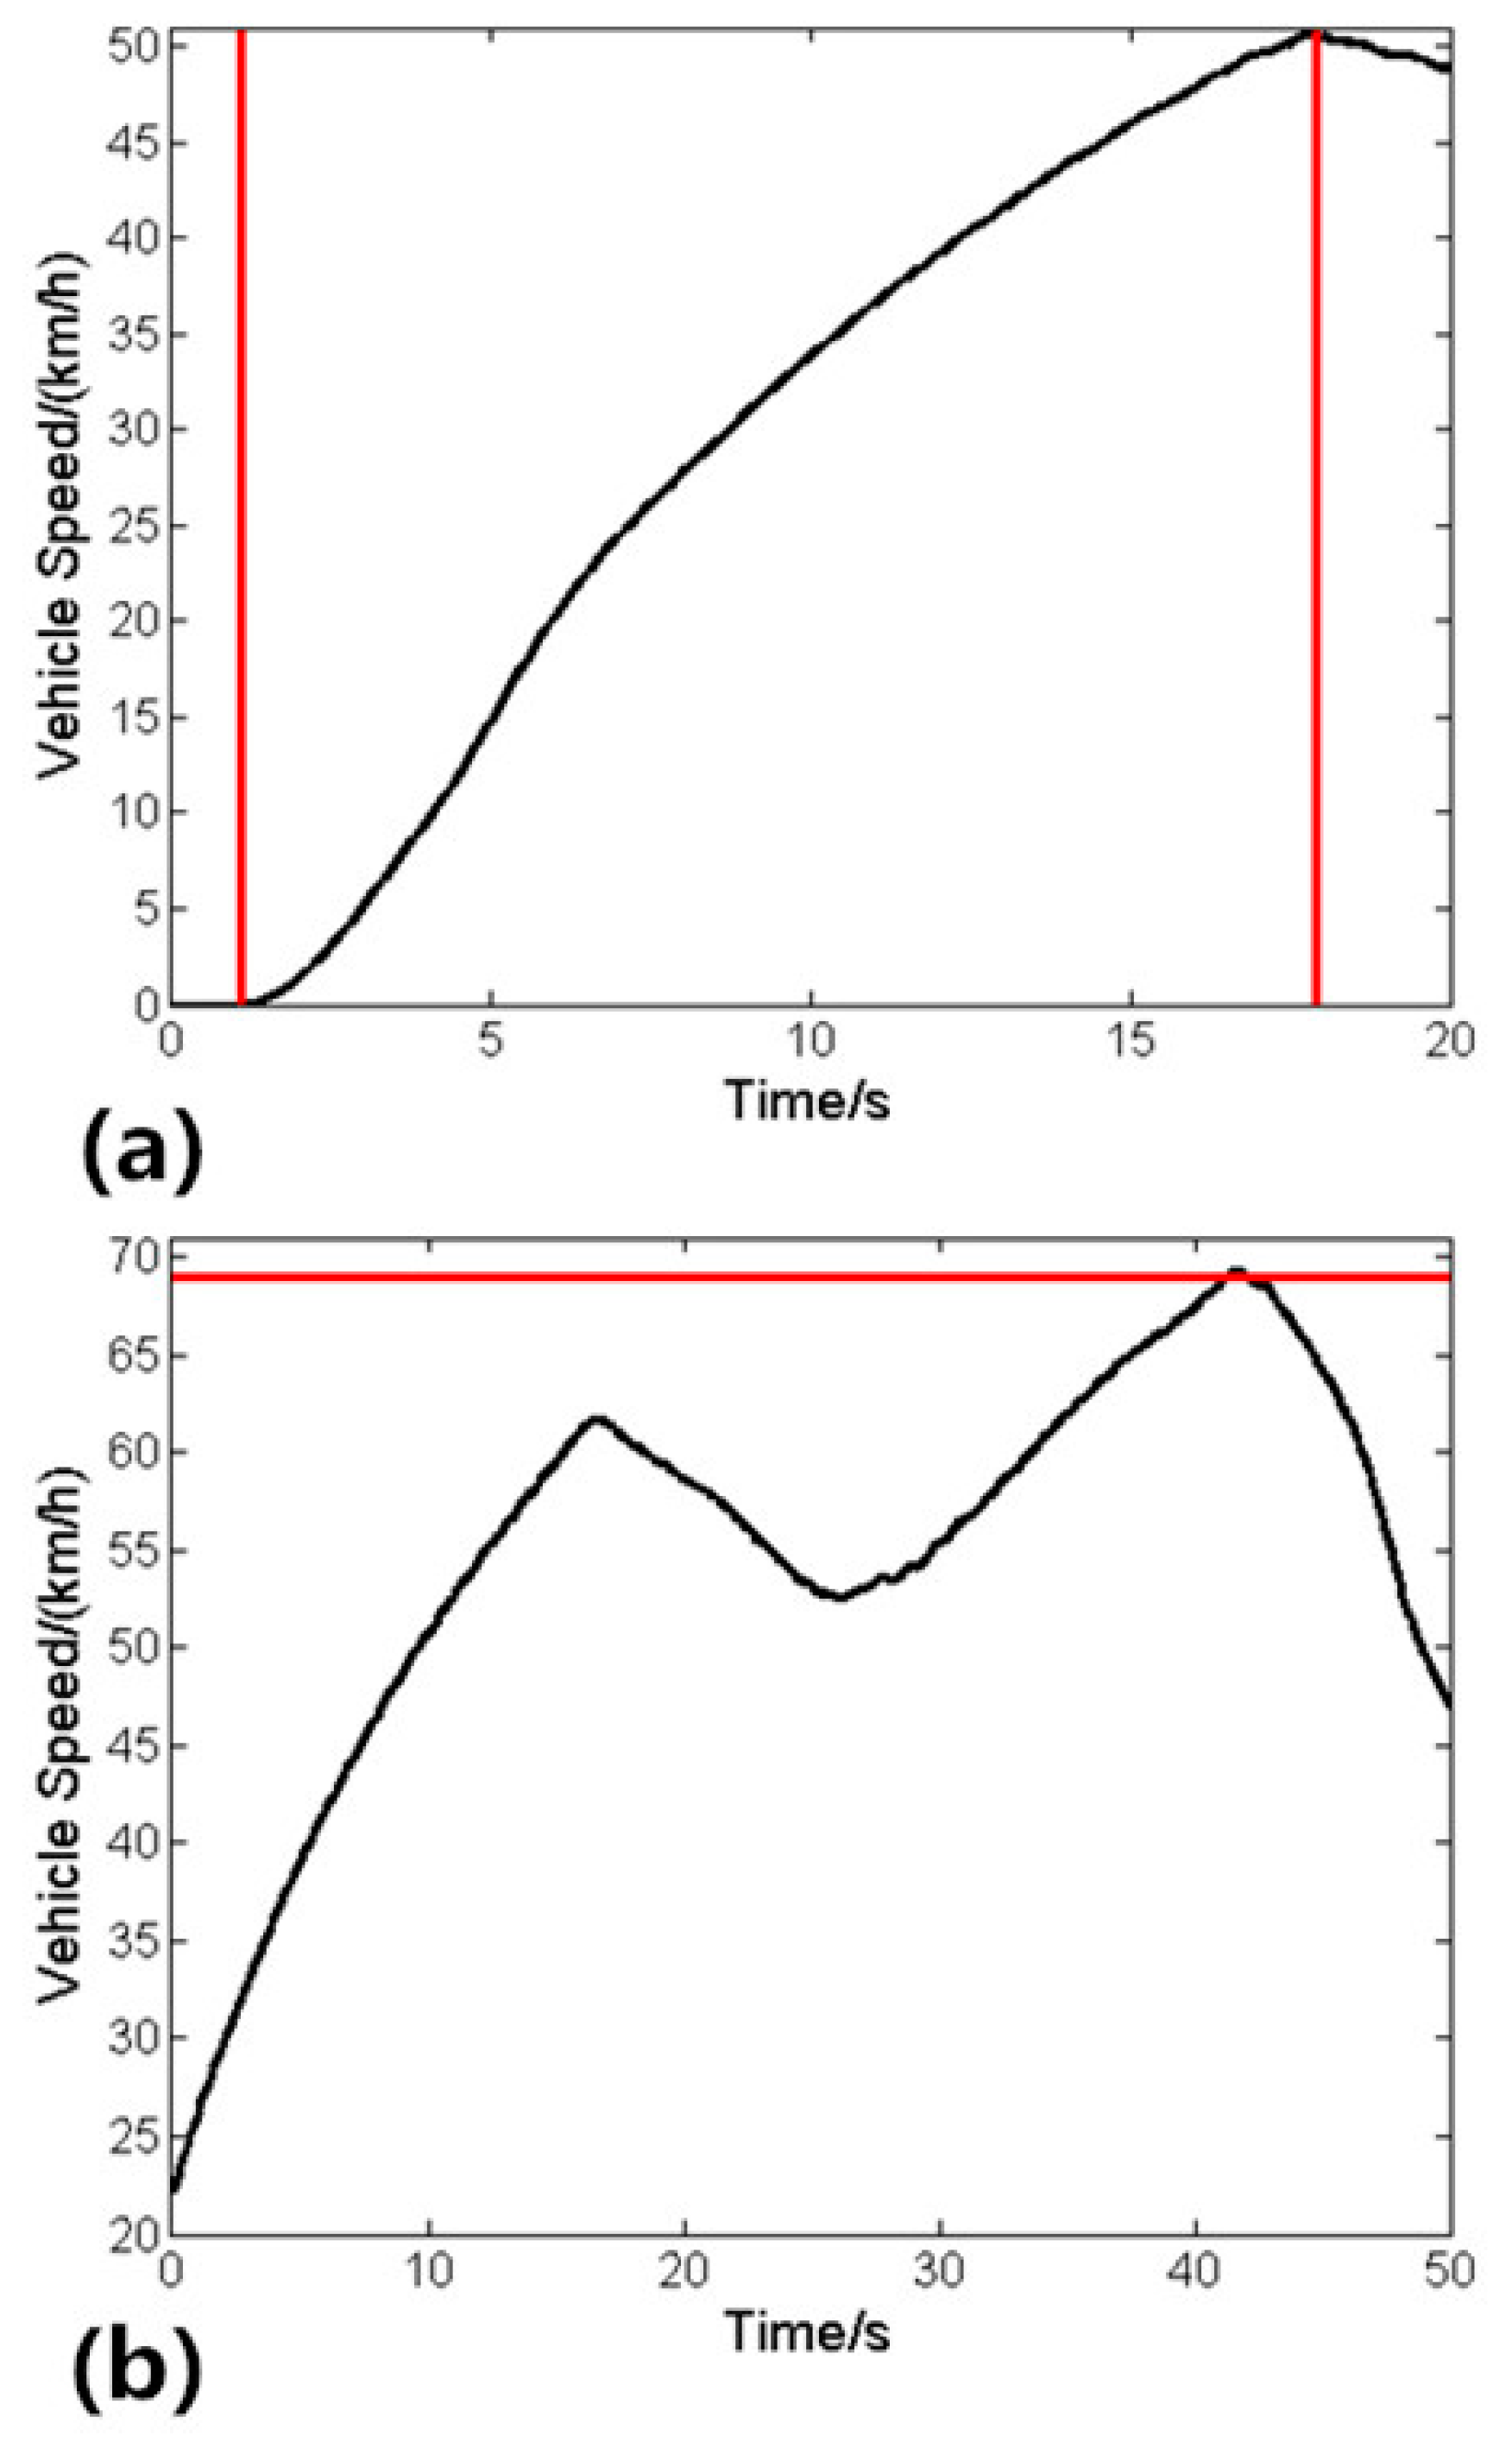
Two main indices of dynamic performance are acceleration and max speed (Figure 12). Local regulations required that the city bus should be able to accelerate from 0 km/h to 50 km/h is less than 23 seconds and the max speed should be 69 km/h.
The results showed that the acceleration time was significantly less than 20 seconds. The velocity curve in Figure 12b shows that during travel, the vehicle did indeed reach 69 km/h on one occasion, which means the maximum speed criterion was satisfied. The bus is not able to exceed the maximum speed of 69 km/h since the DICO limits the speed to 69 km/h.
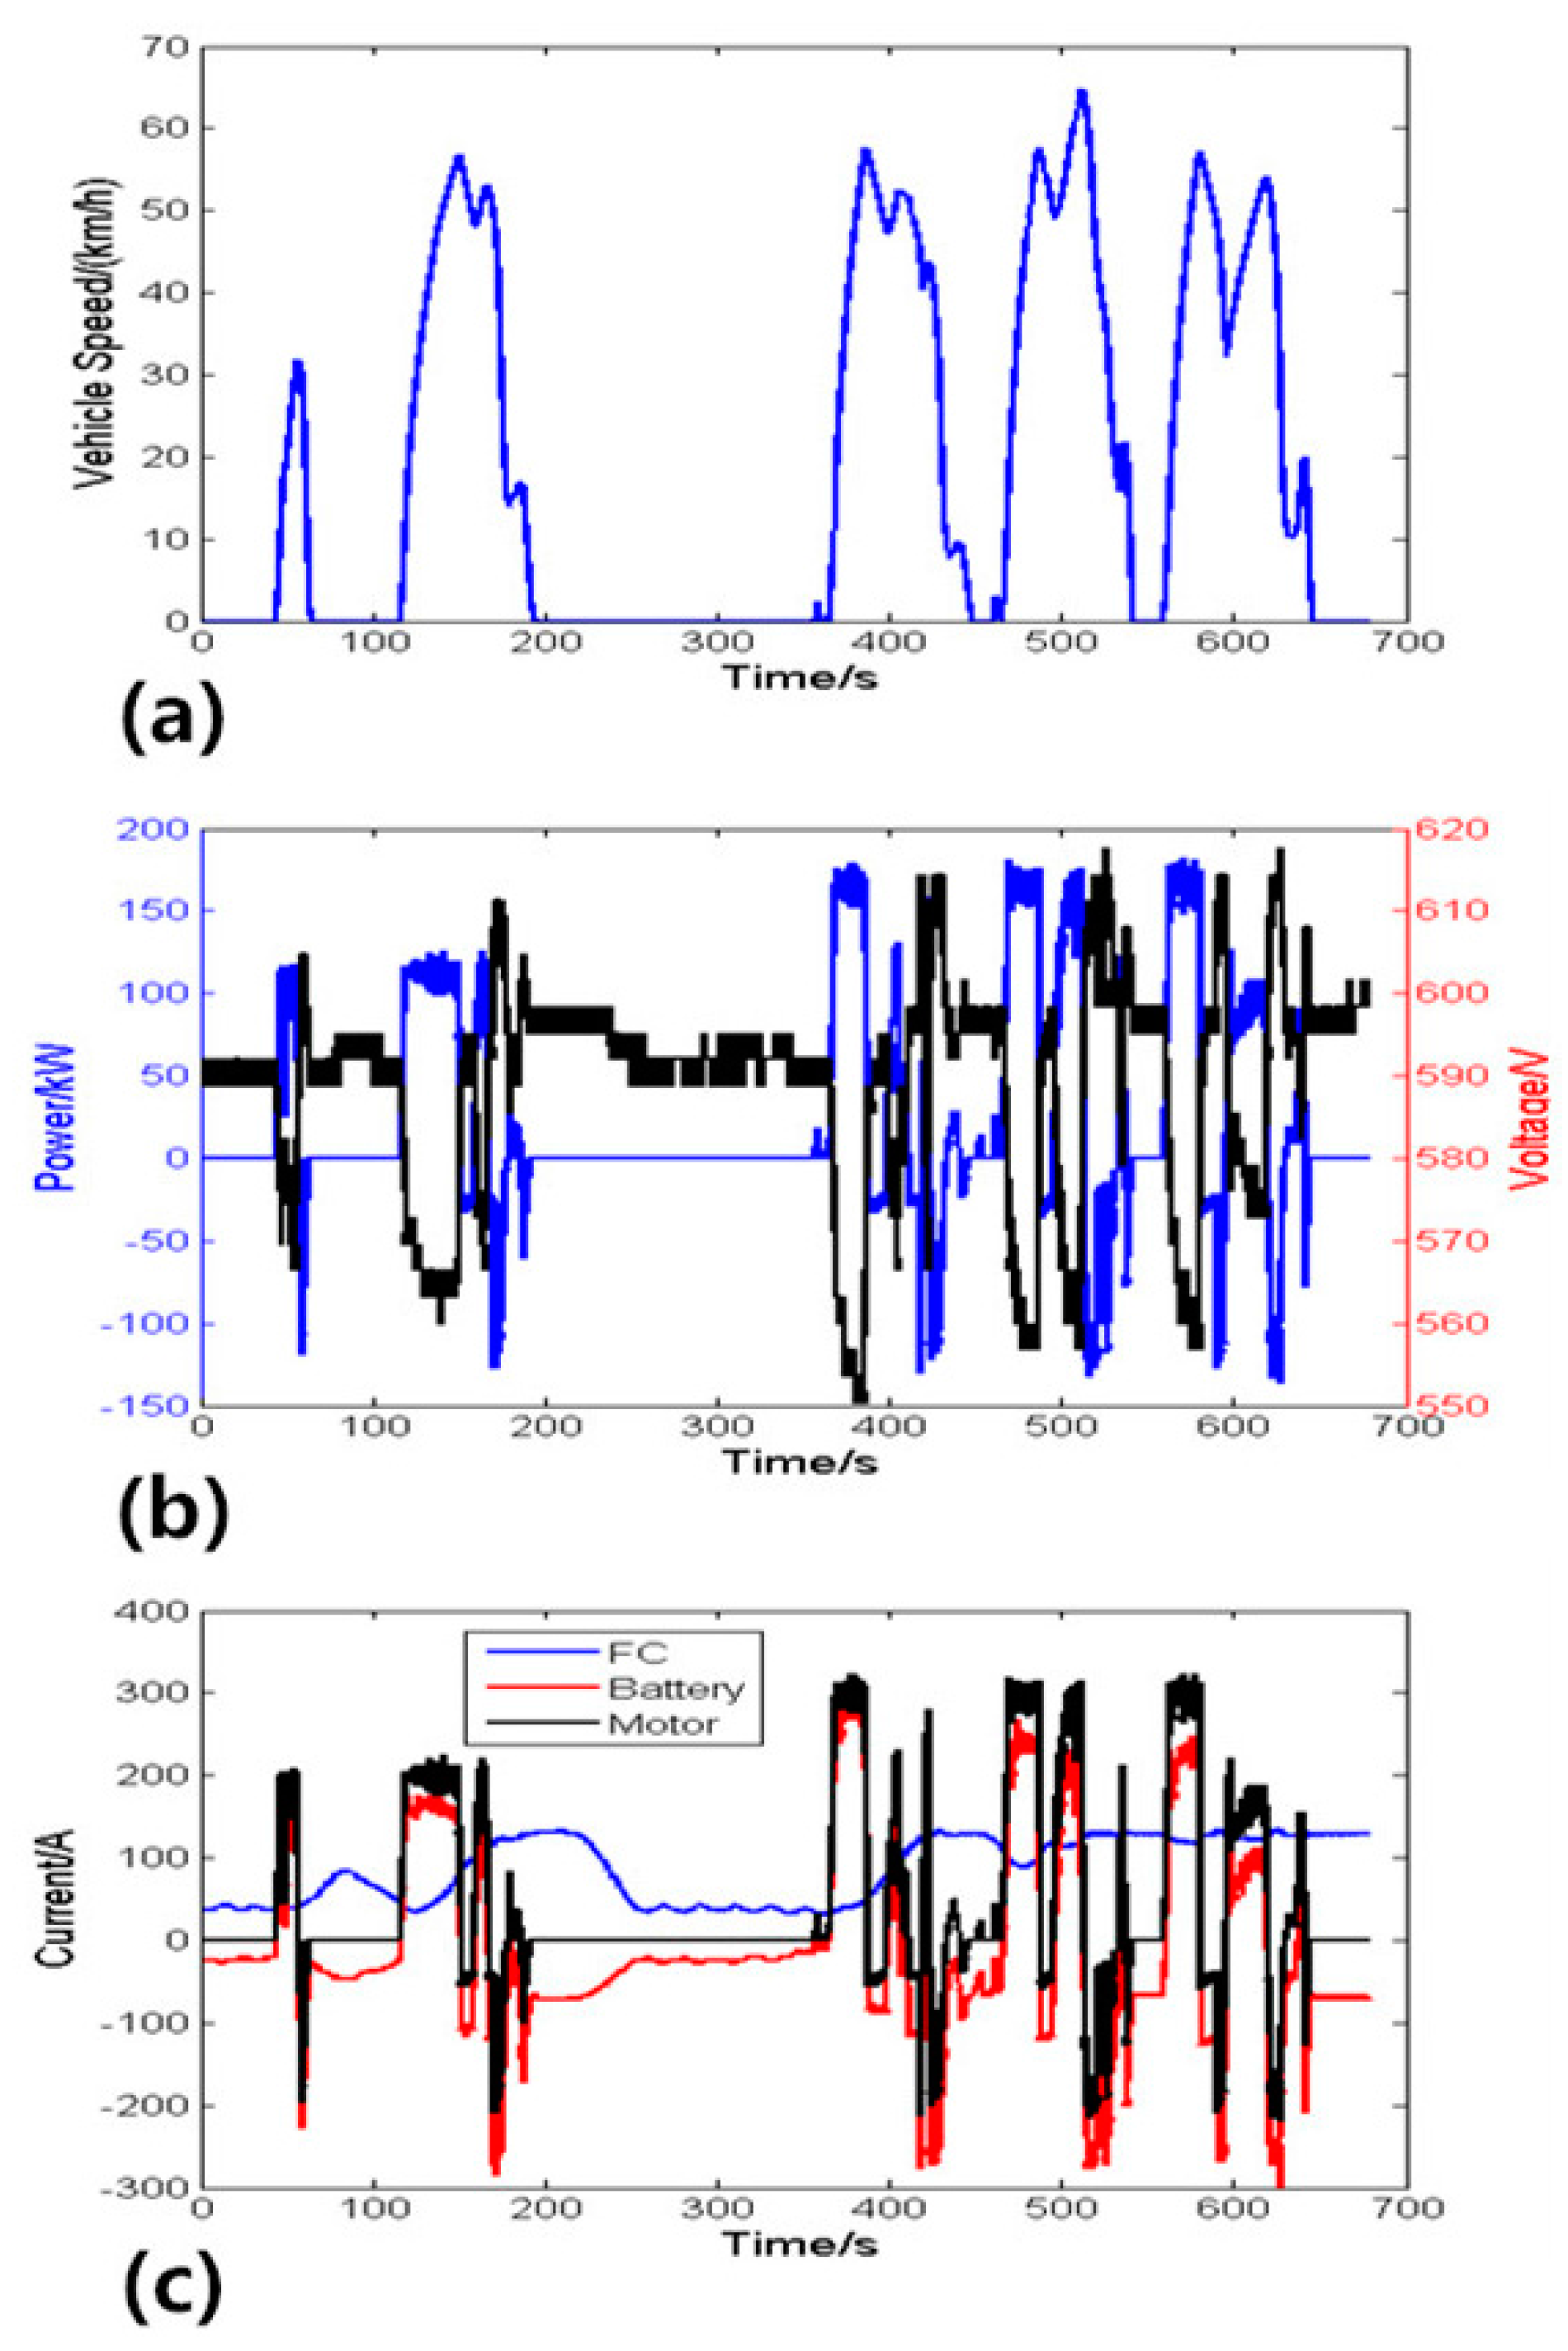
The test performance results are shown in Figure 13. Figure 13a shows the speed trend and Figure 13b shows the power and voltage trends. Obviously, power and voltage have different trends owing to the characteristics of the battery system.
It can be seen from Figure 13c that the current of the motor, which is represented by the black line, altered sharply due to the change in power demand of the vehicle. However, as can be clearly seen in this figure, the trend of the red line is almost the same as that of the black line, which means that the sharp change of the power demand is mainly borne by the battery. The energy management strategy made the output current of the fuel cell system change slowly, just fast enough to be able to satisfy the average power demand of the city bus. A lower change rate avoids many detrimental conditions such as local fuel starvation and local oxygen enrichment, so it is beneficial for fuel cell durability.
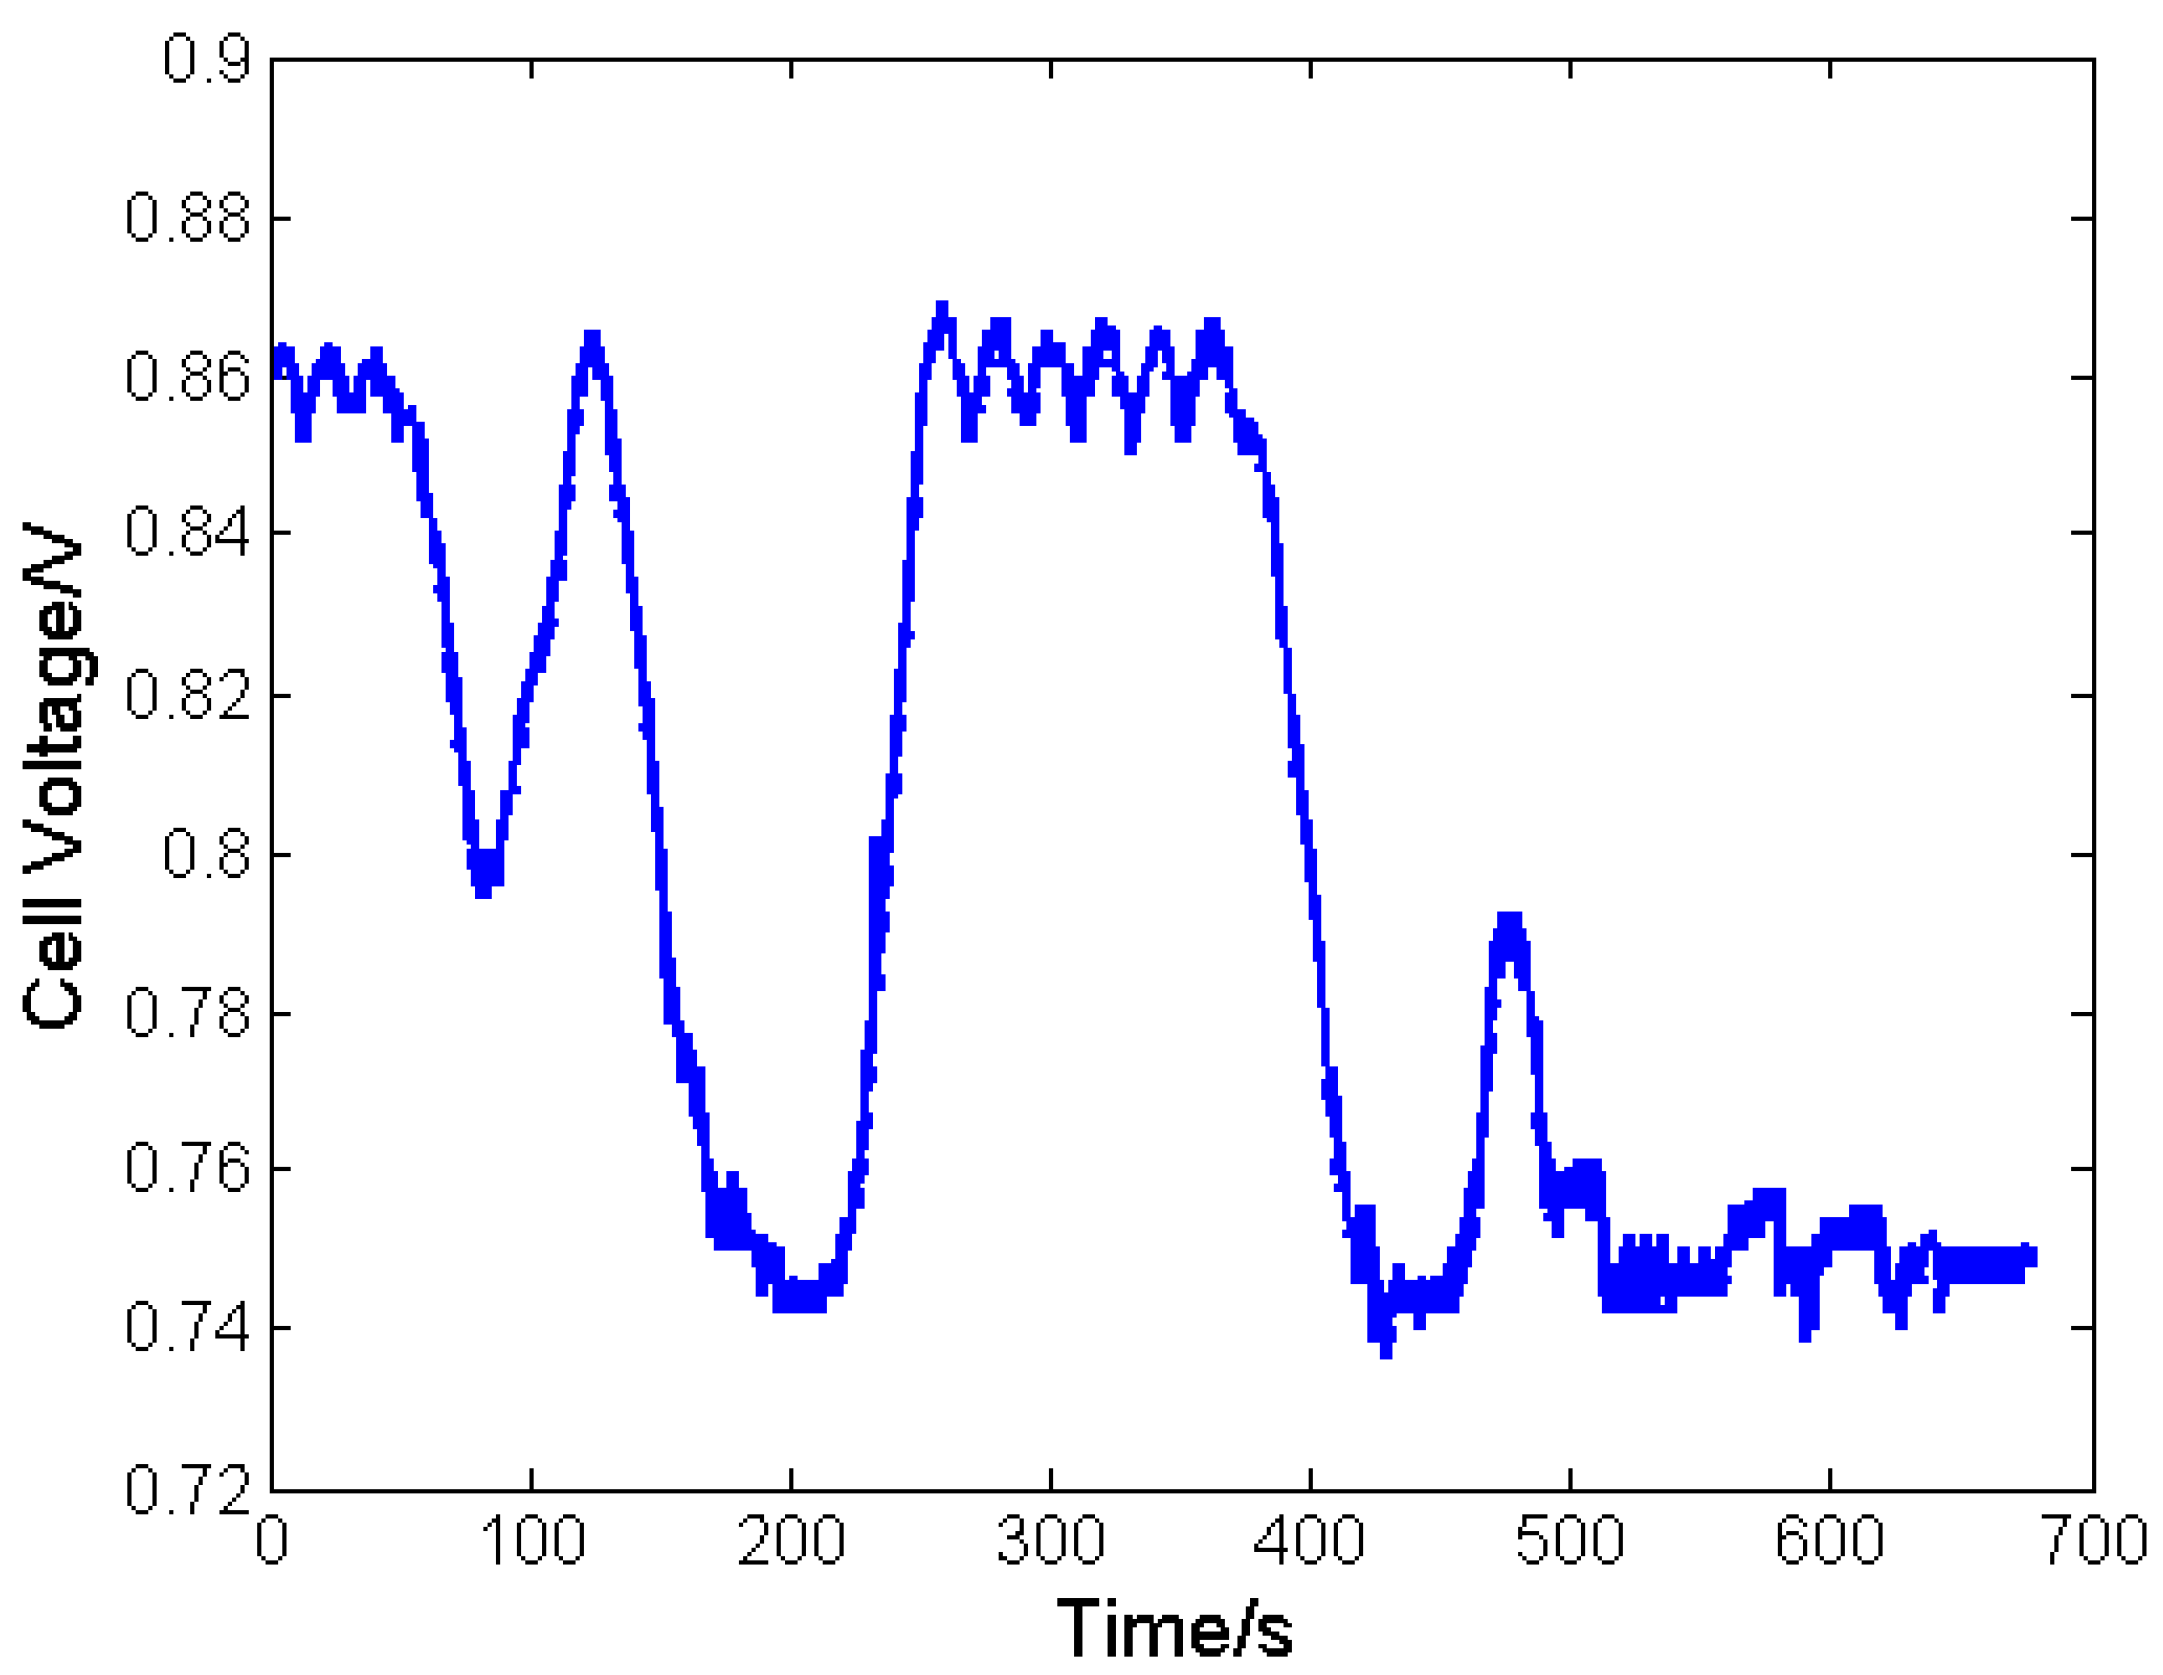
Furthermore, as shown in Figure 14, the cell voltage was limited to around 0.85 V by the control strategy. It has been confirmed by several researchers that high voltage is harmful to fuel cell durability, so idle or small load conditions should be avoided as much as possible. The results show that once the current decreased to a certain value and the cell voltage exceeded 0.85 V, the control strategy limited the decrease of the current and maintained the voltage. This process can be seen by the voltage fluctuation in Figure 14.

4.3. Economic Performance

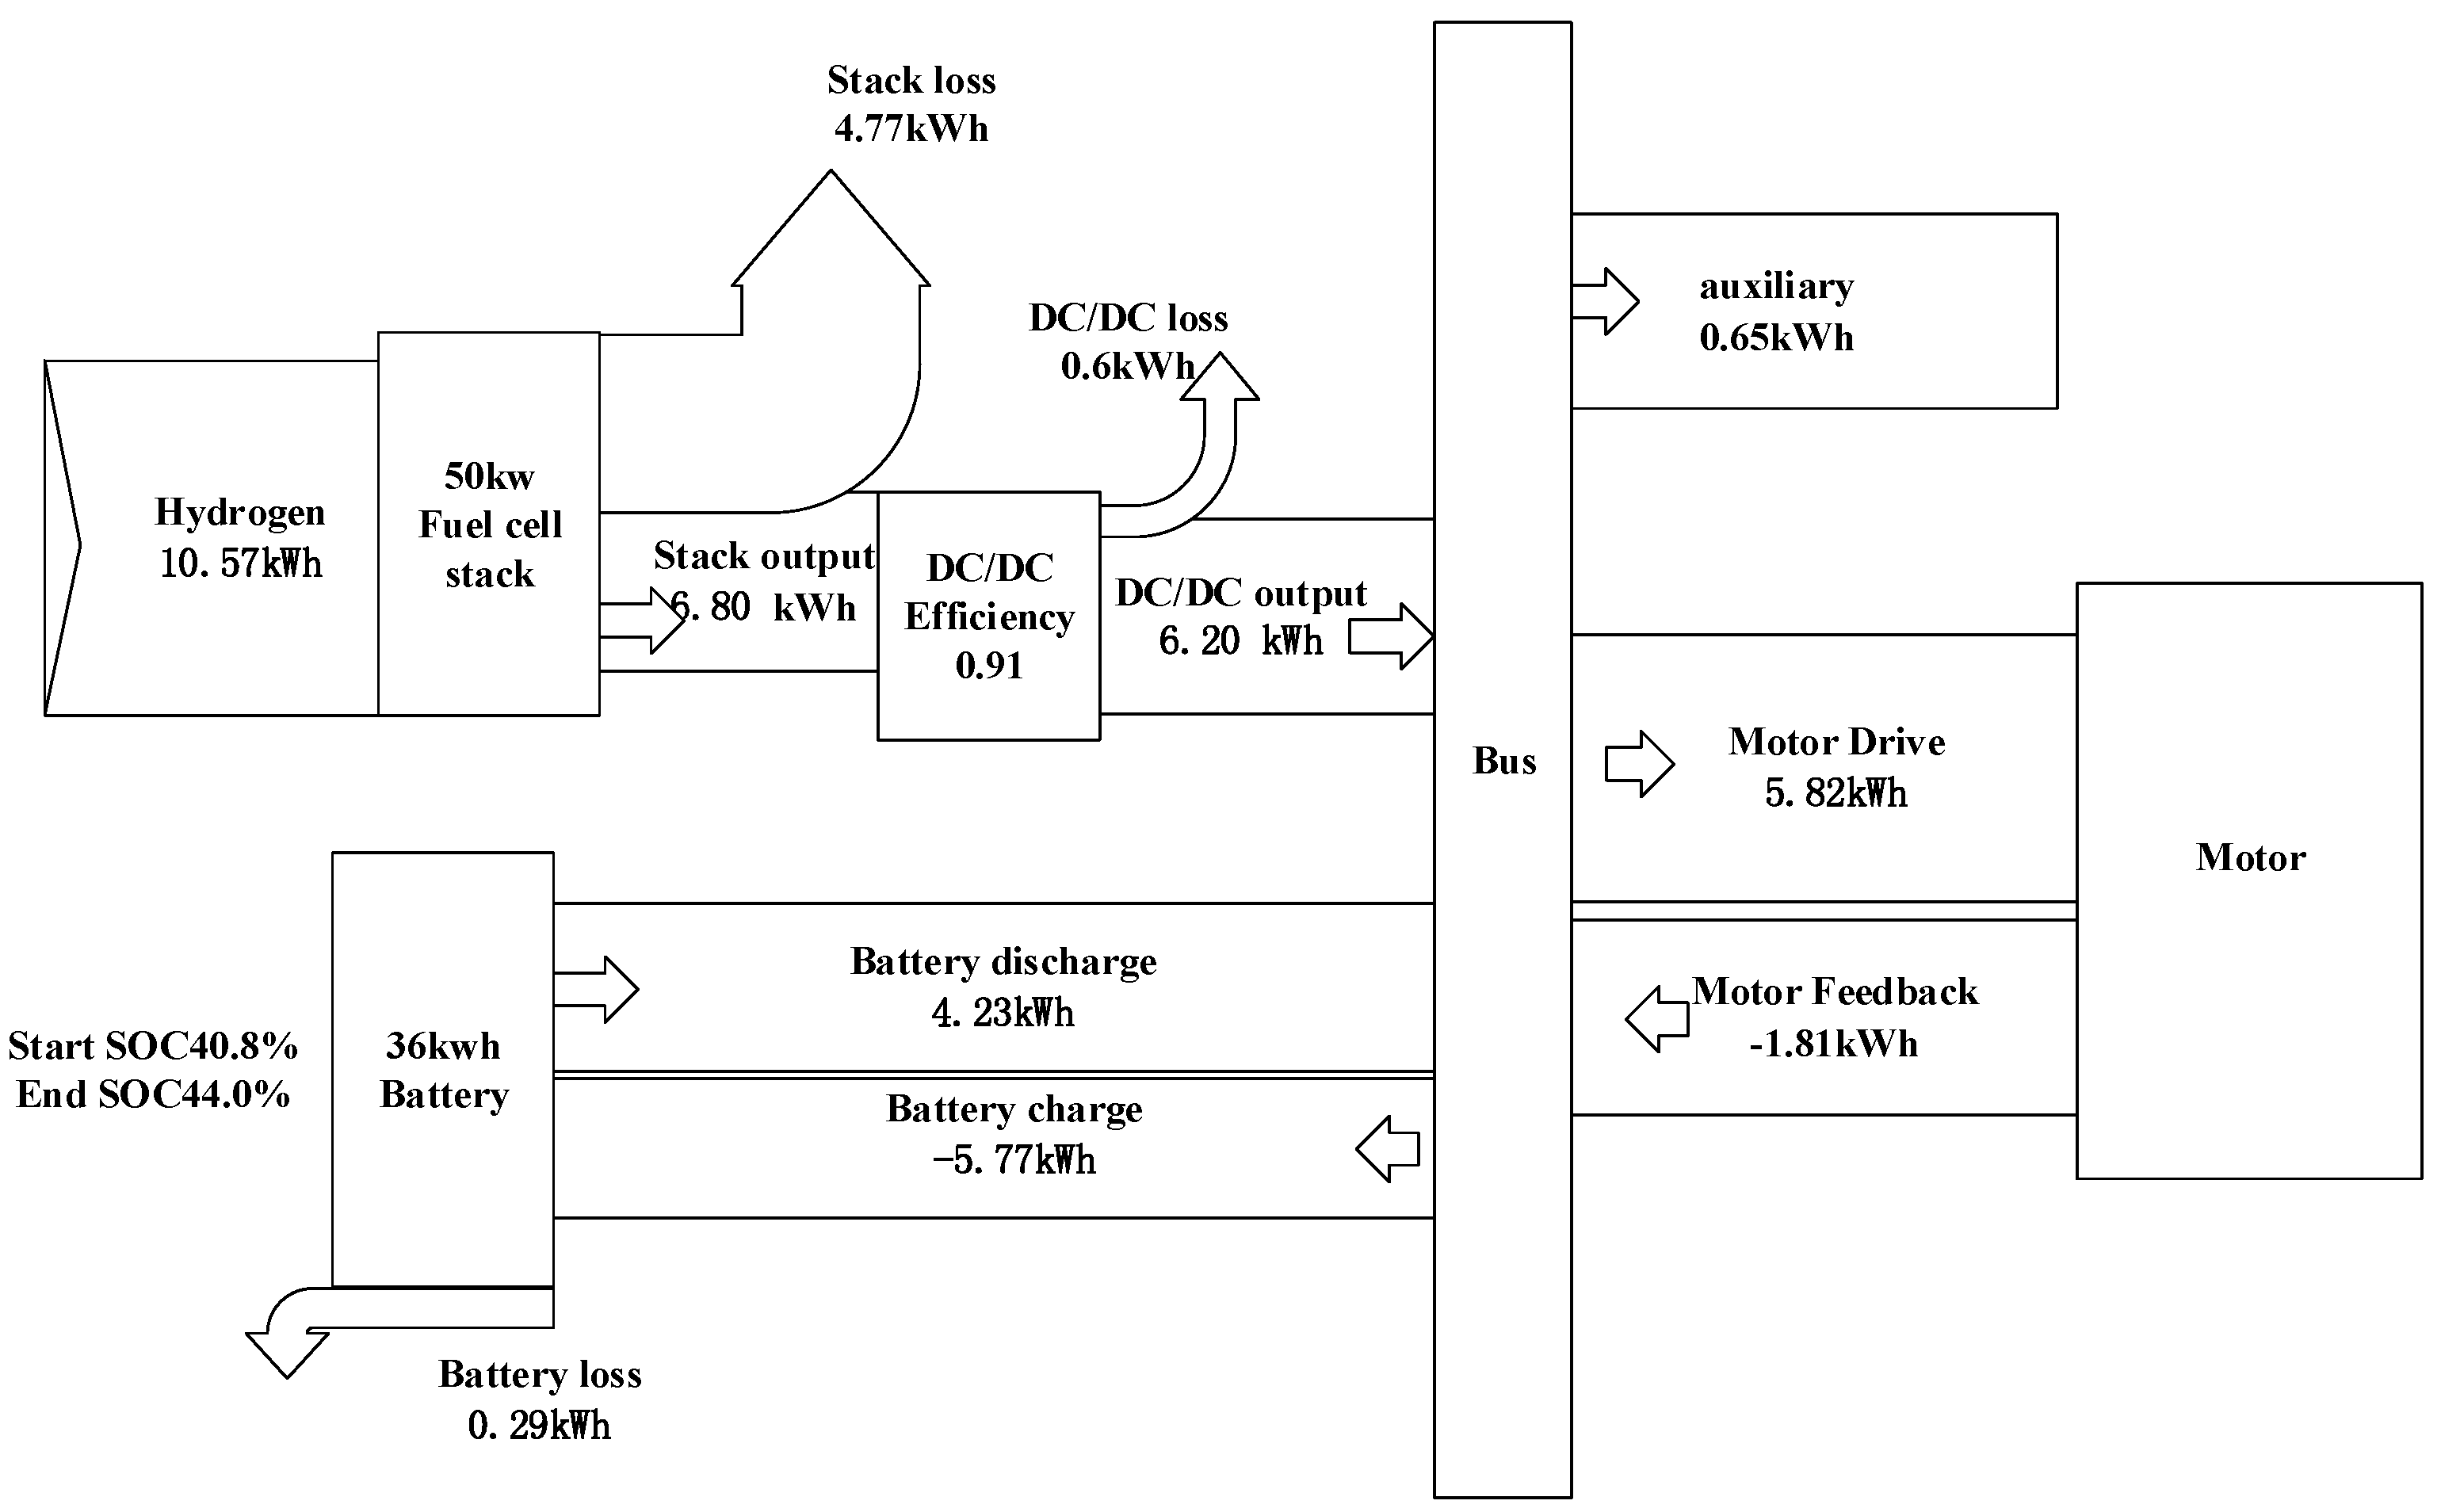
The Sankey diagram of a typical trip is shown in Figure 15, all the input energy (10.57 kWh) is from the hydrogen consumption. The lower heating value of hydrogen is used. It can be seen that even taking auxiliary power into consideration, the combined efficiency of the stack and the DC/DC converter was about 52.5% × ((6.20−0.65)/10.57), which is higher than the internal combustion engine. The overall efficiency of the battery was more than 97% (1 − 0.29/(4.23 + 5.77)), so the battery is an ideal energy storage device. The energy used to drive the motor is 5.82 kWh, of which 1.81 kWh is recycled by brake energy regeneration.
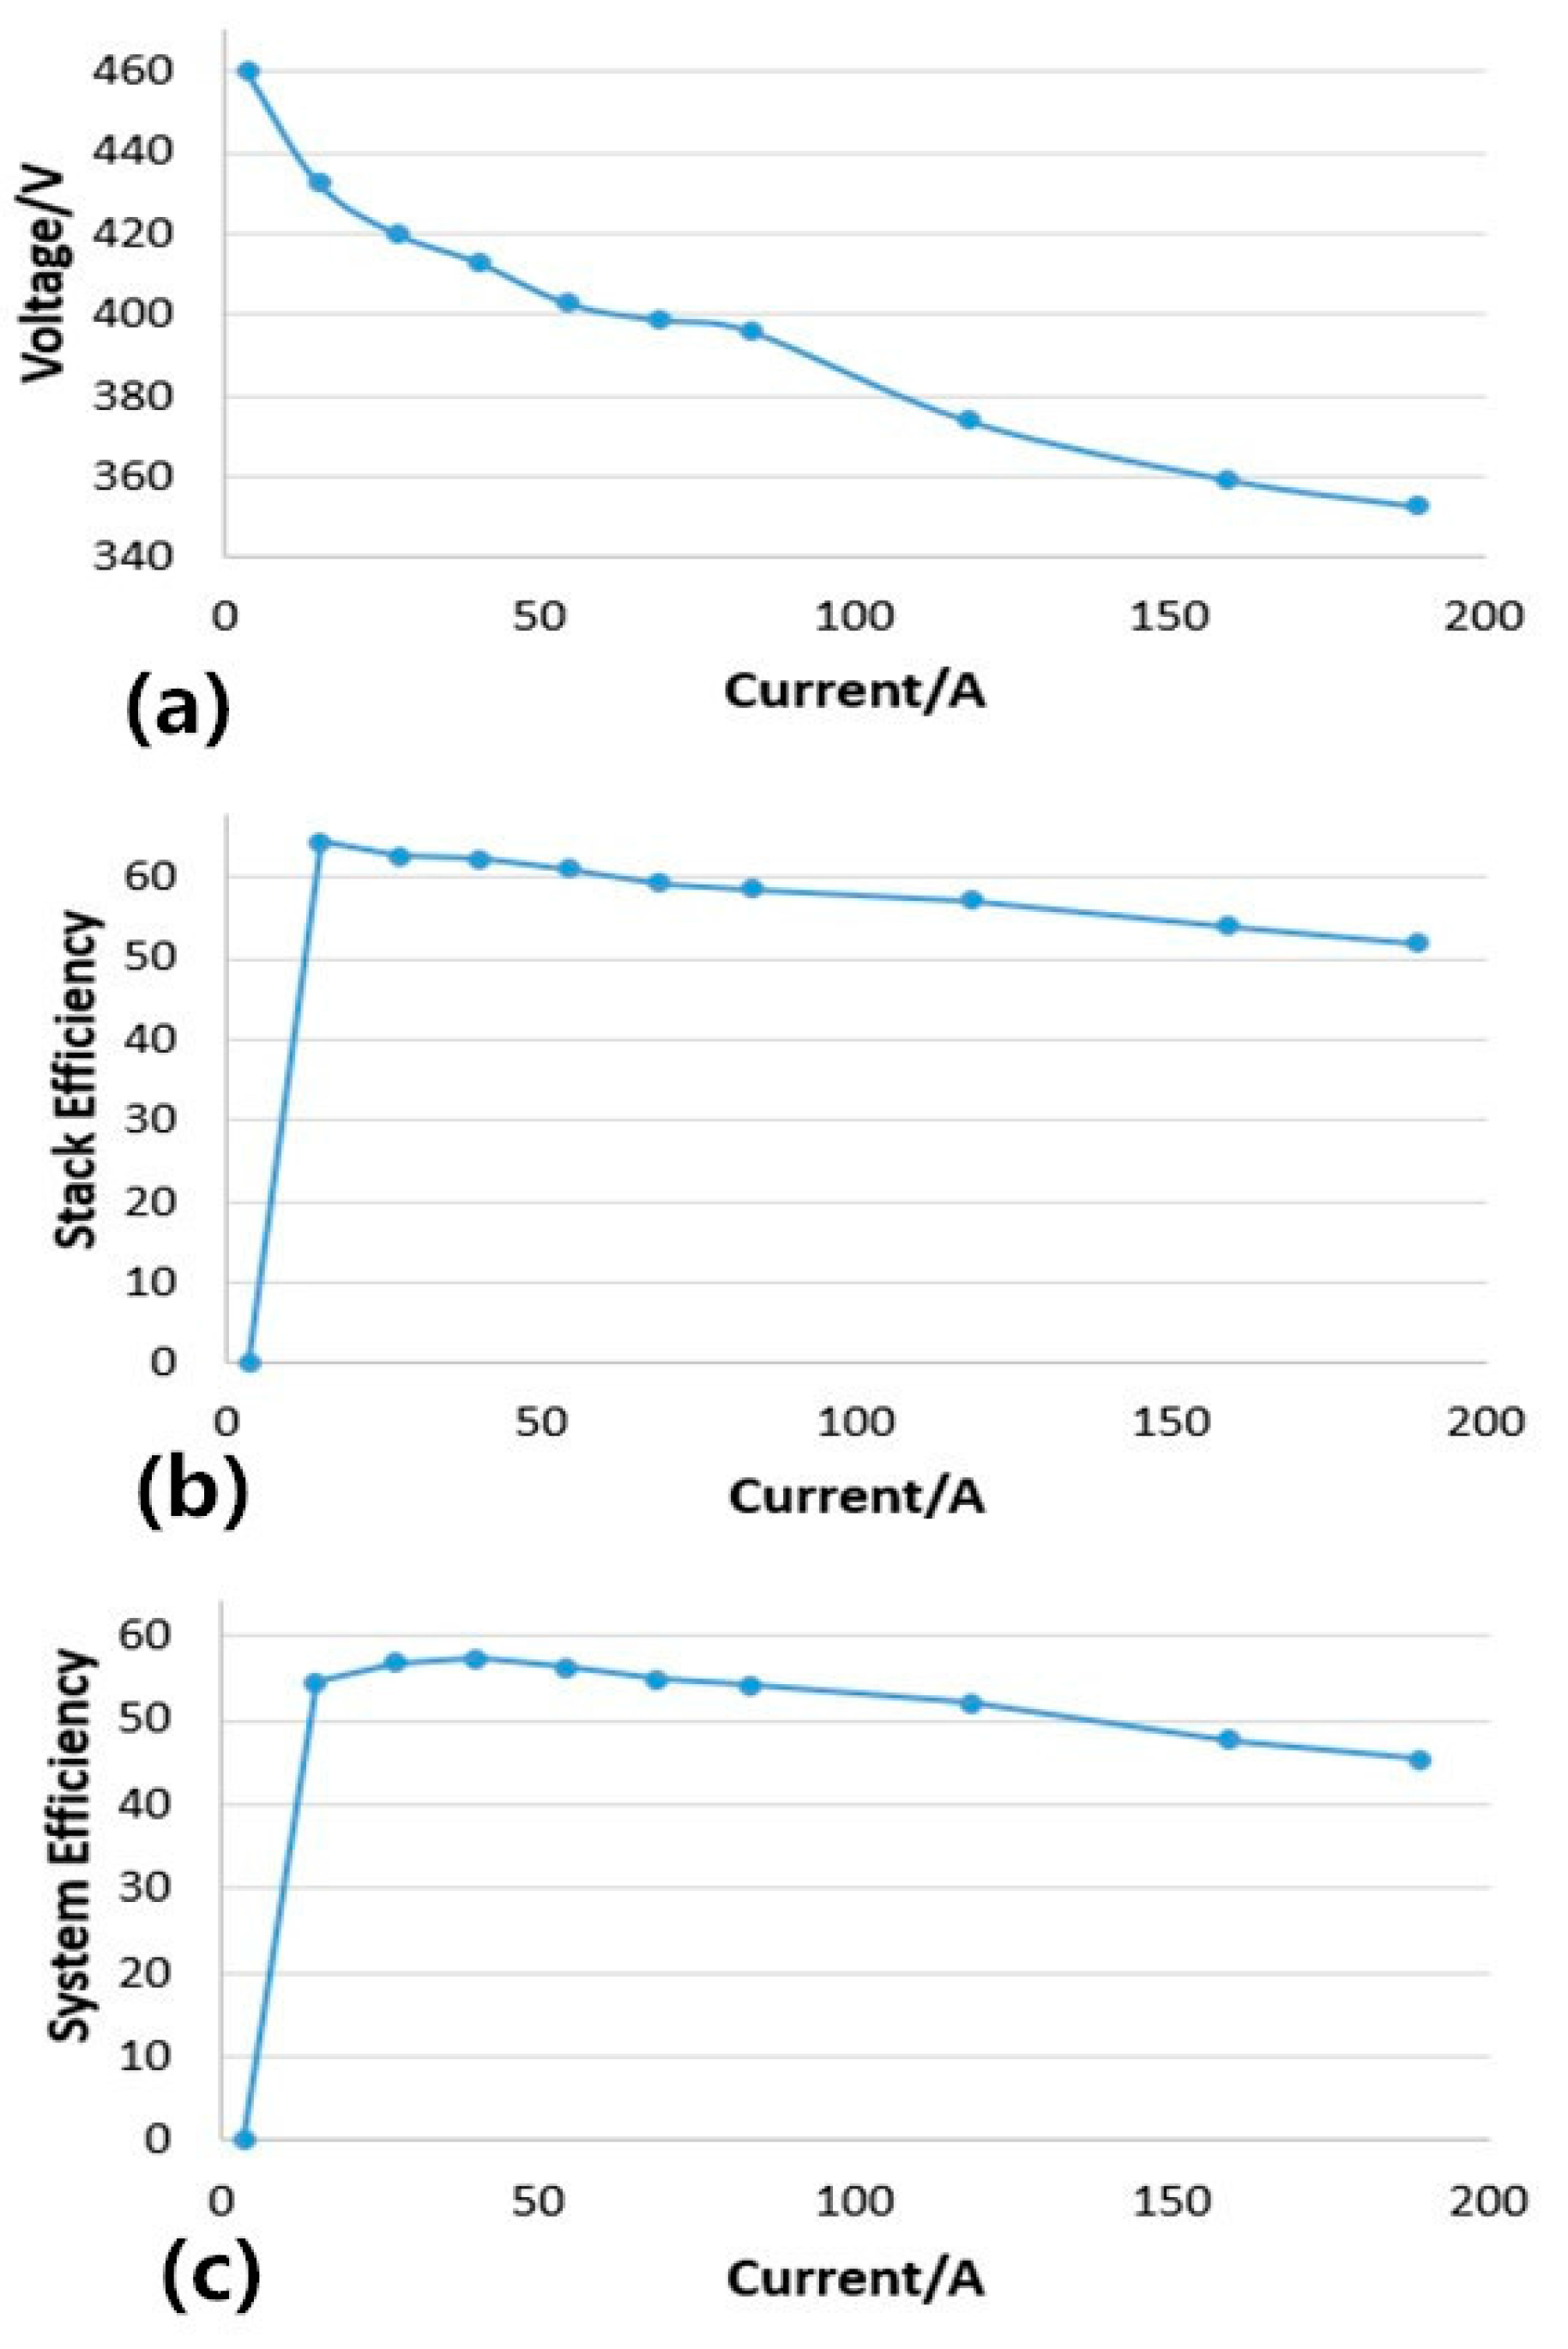
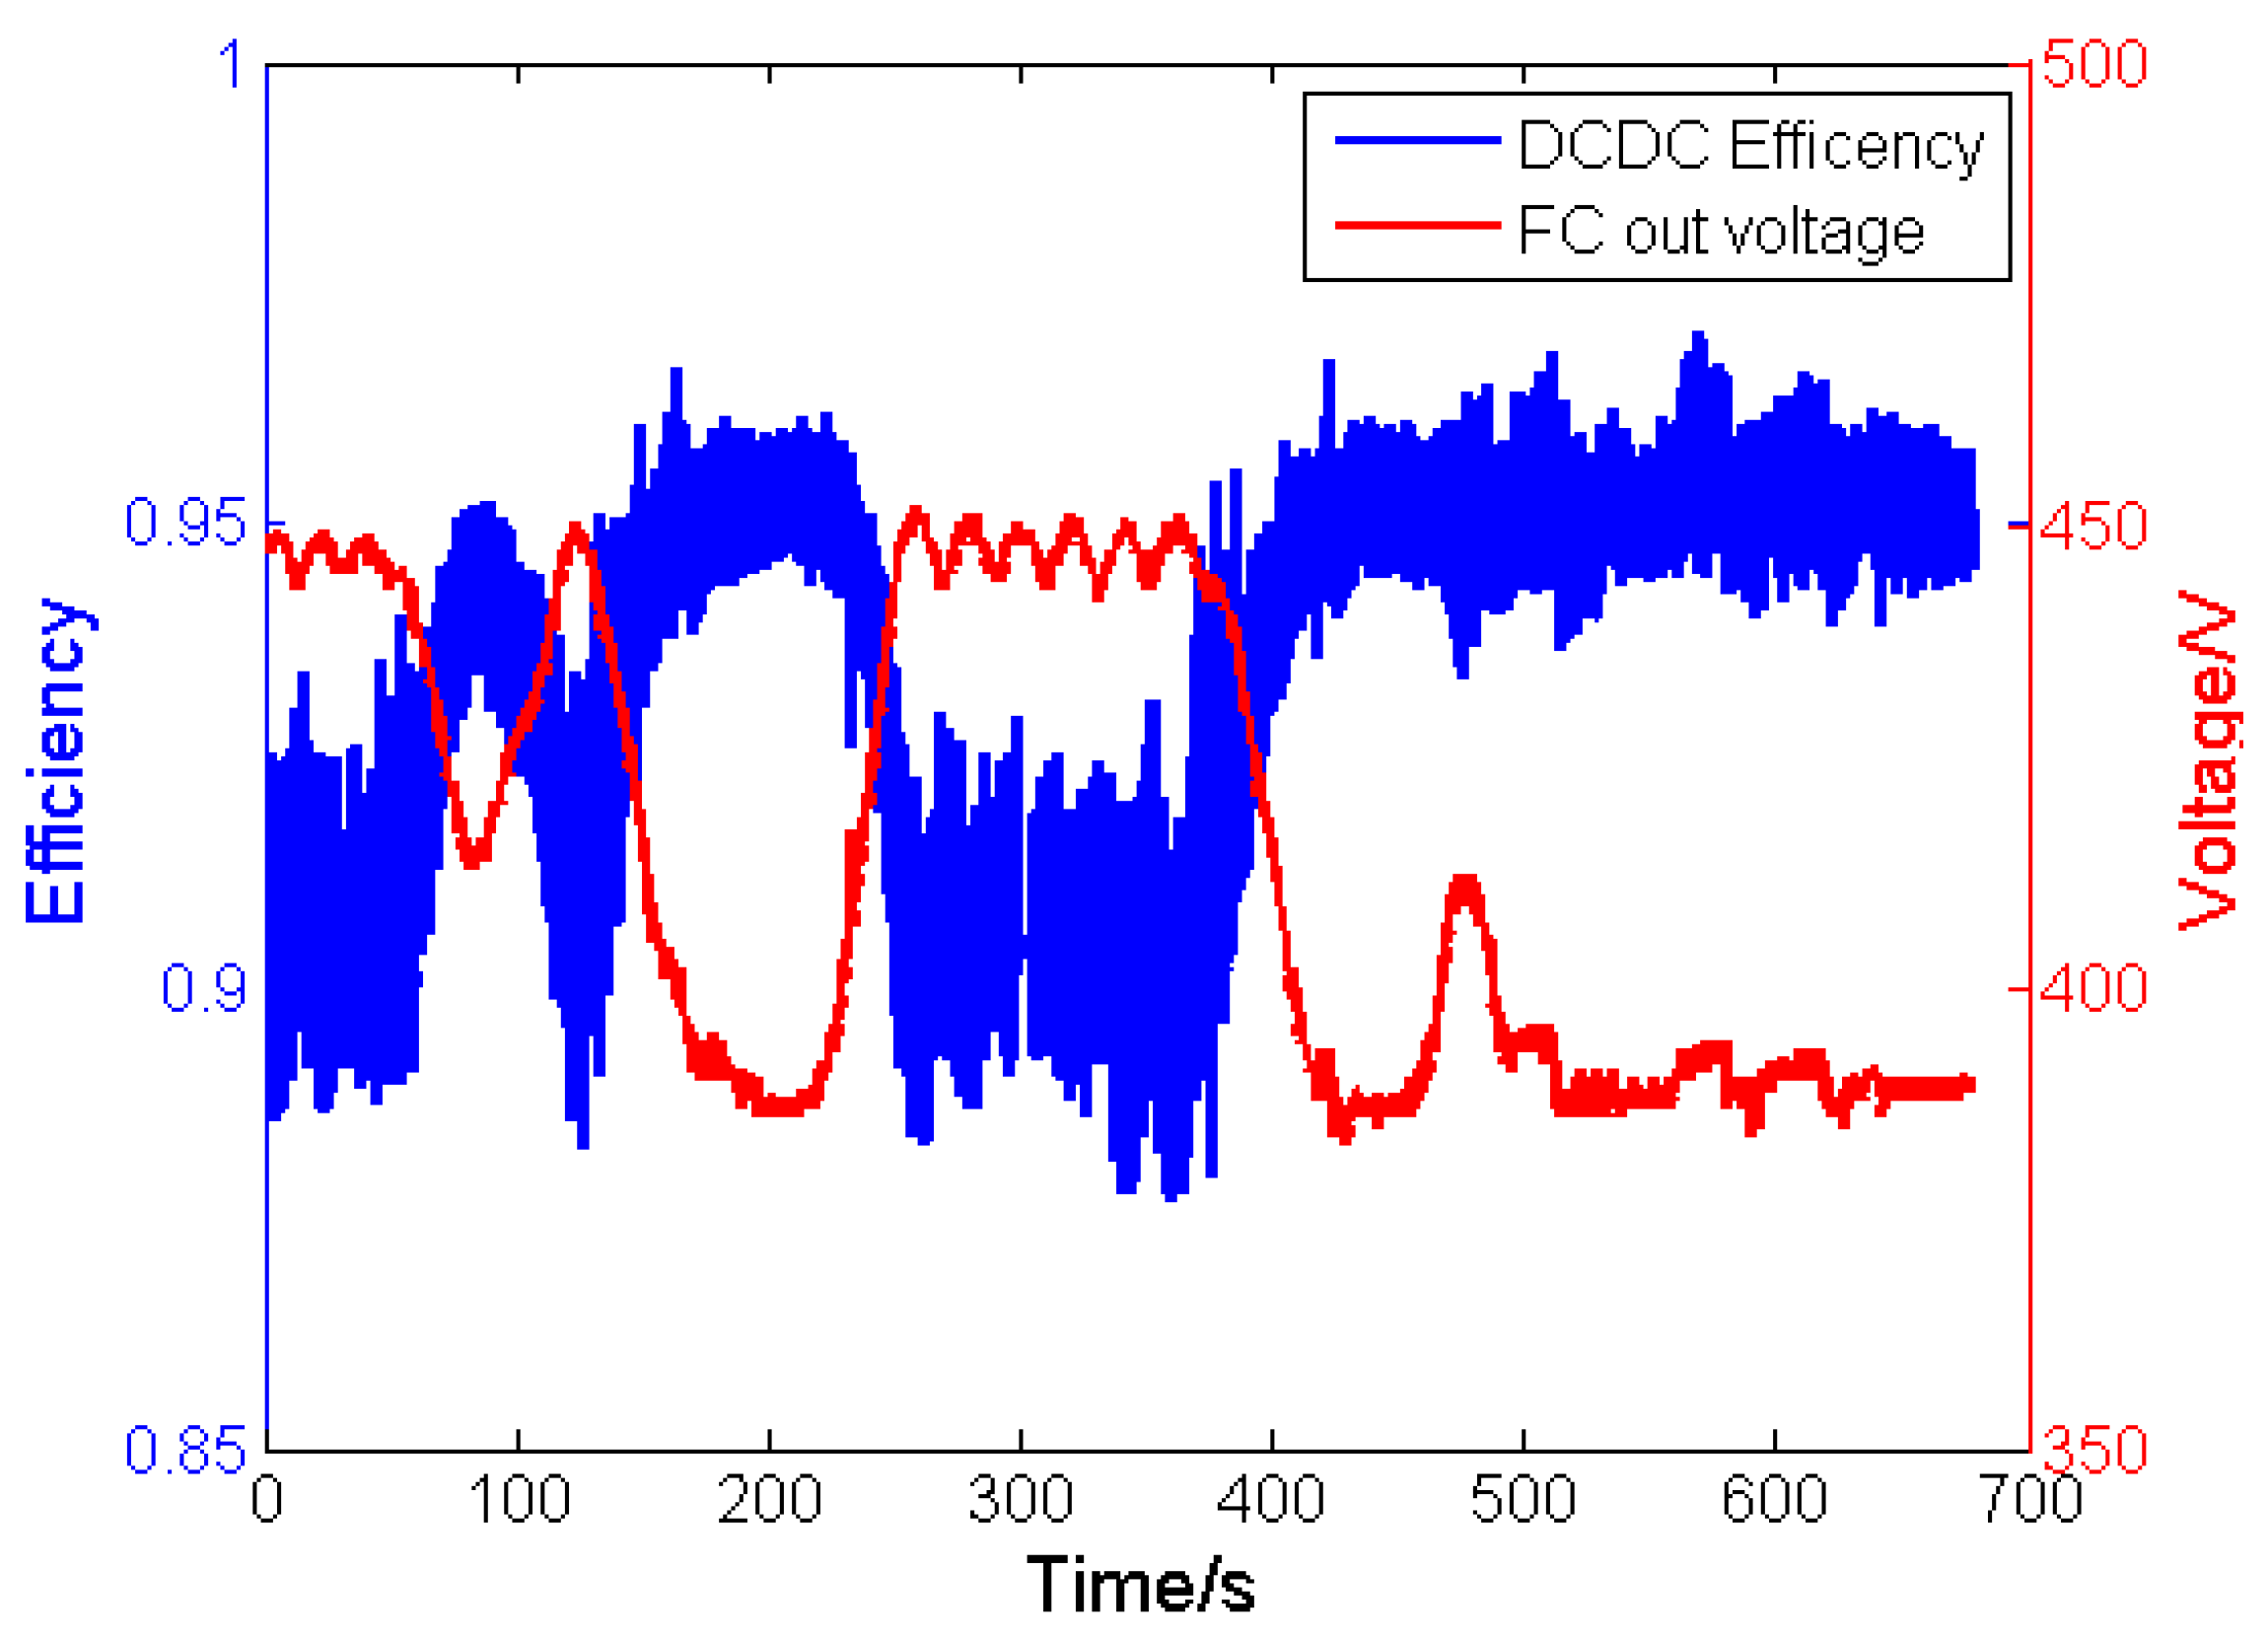
Owing to the high efficiency of the battery, the main energy losses were stack loss and DC/DC loss. The stack efficiency is determined by the stack voltage, and the DC/DC efficiency is also influenced by the stack voltage (
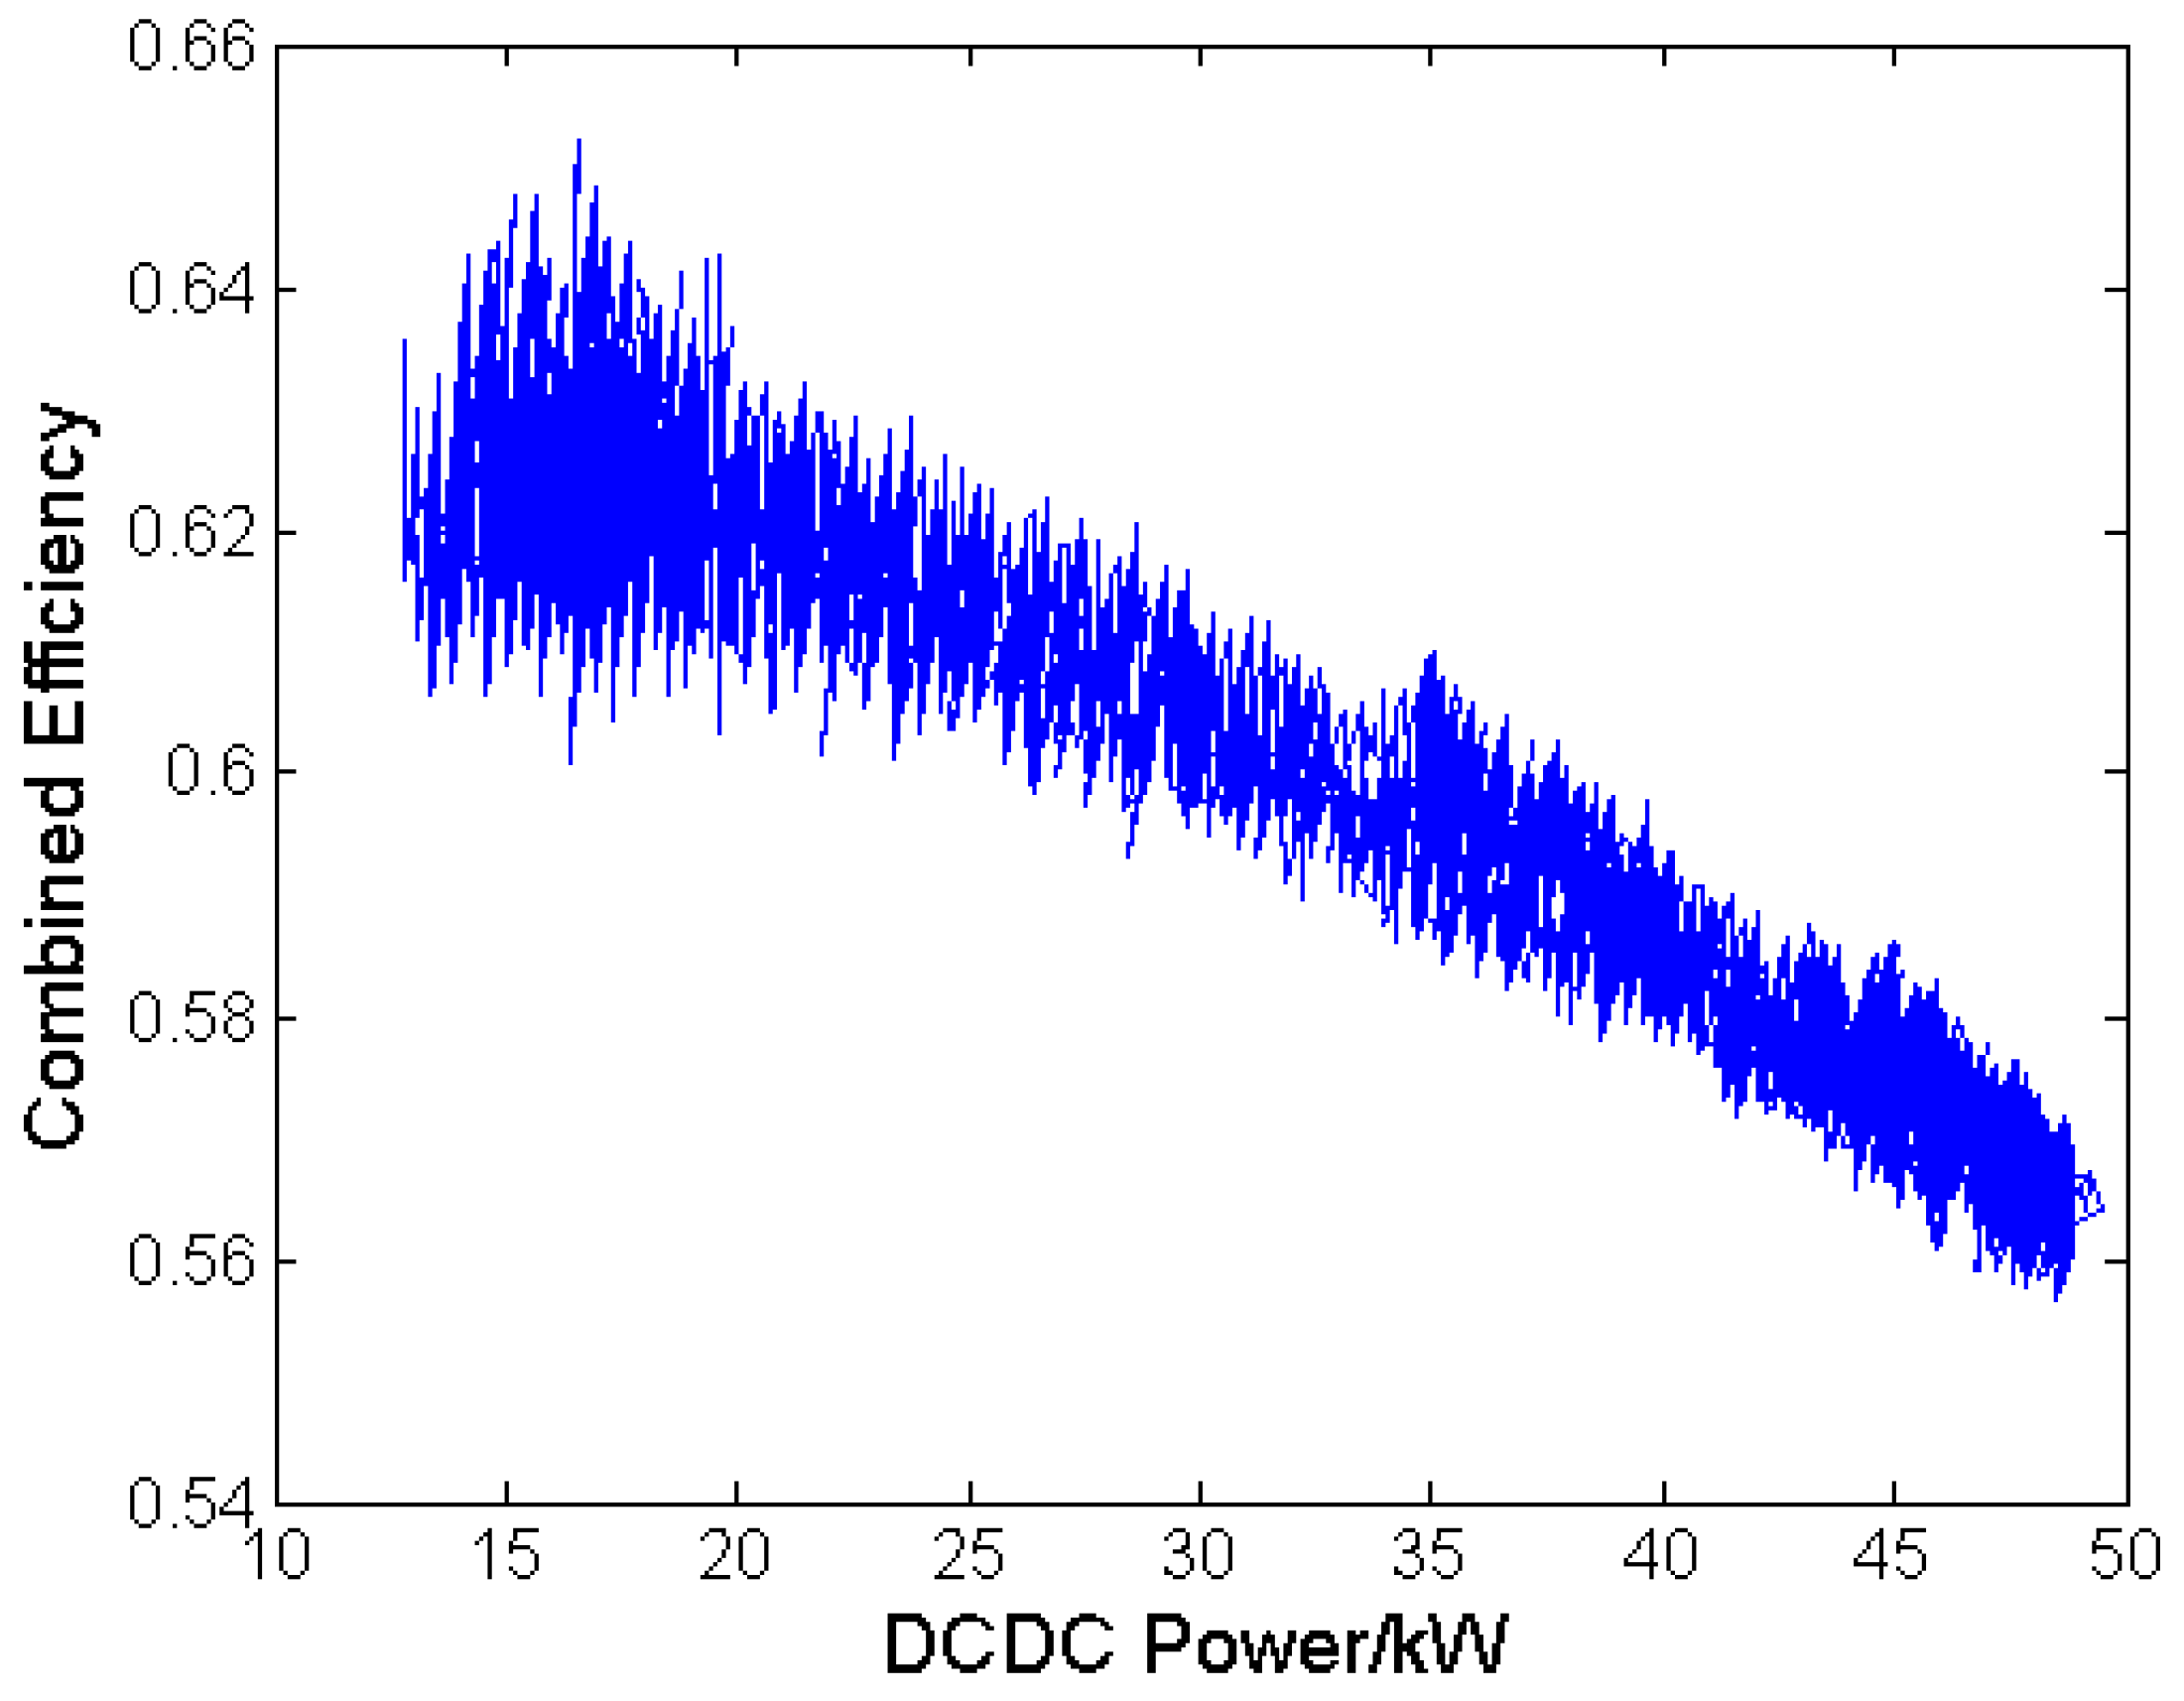
Figure 16). The lower stack voltage meant a higher DC/DC efficiency. The combined efficiency, which is product of DC/DC efficiency and fuel cell efficiency, is shown in Figure 17. The trend shows that higher power corresponded to lower efficiency. The reason for this was that the efficiency of the stack decreased more rapidly with the power increase and the efficiency of the DC/DC increased more slowly.
Due to the voltage limitation, the DC/DC output power was always larger than 13 kW. When the output power was lower than 20 kW, the combined efficiency was almost identical. Furthermore, as long as the output power of the DC/DC was larger than 20 kW, the combined efficiency decreased almost linearly.

4.4. Discussion

The application of pre-charge helps to protect the DC/DC and the main relay, which means an enhancement of system reliability. In addition, proper strategy is utilized to keep every component working in right order to make sure that the vehicle works in the safe mode.
The acceleration and max speed performance can be satisfied mainly owing to the ability of battery system and motor. Thanks to the large capacity of the battery, it is not necessary for the fuel cell to supply the instantaneous power. This is the precondition that allows the energy management strategy to regulate the fuel cell power. Apparently, results show that the fuel cell power changes slowly and the high voltage condition is avoided. Both are of great help to the durability of the fuel cell. Further research should be done to deal with the fluctuation caused by voltage limiting strategy.
The combined efficiency is directly related to the hydrogen consumption, and higher efficiency equals to lower hydrogen consumption. The small load conditions persist with large load conditions at the same time, while higher power means lower efficiency, the power lower than 20 kW does not mean higher efficiency. This phenomenon indicates that a load smaller than 20 kW should be avoided if the average power demand of the vehicle is greater than 20 kW. In addition, assuming that the battery SOC is 100% at the start of daily driving, then, at the end of the day, the lower SOC, the better. Because lower SOC means that the battery offers more energy and the fuel cell offers less, thus the average power of the fuel cell would be lower, which means higher combined efficiency.

5. Conclusions

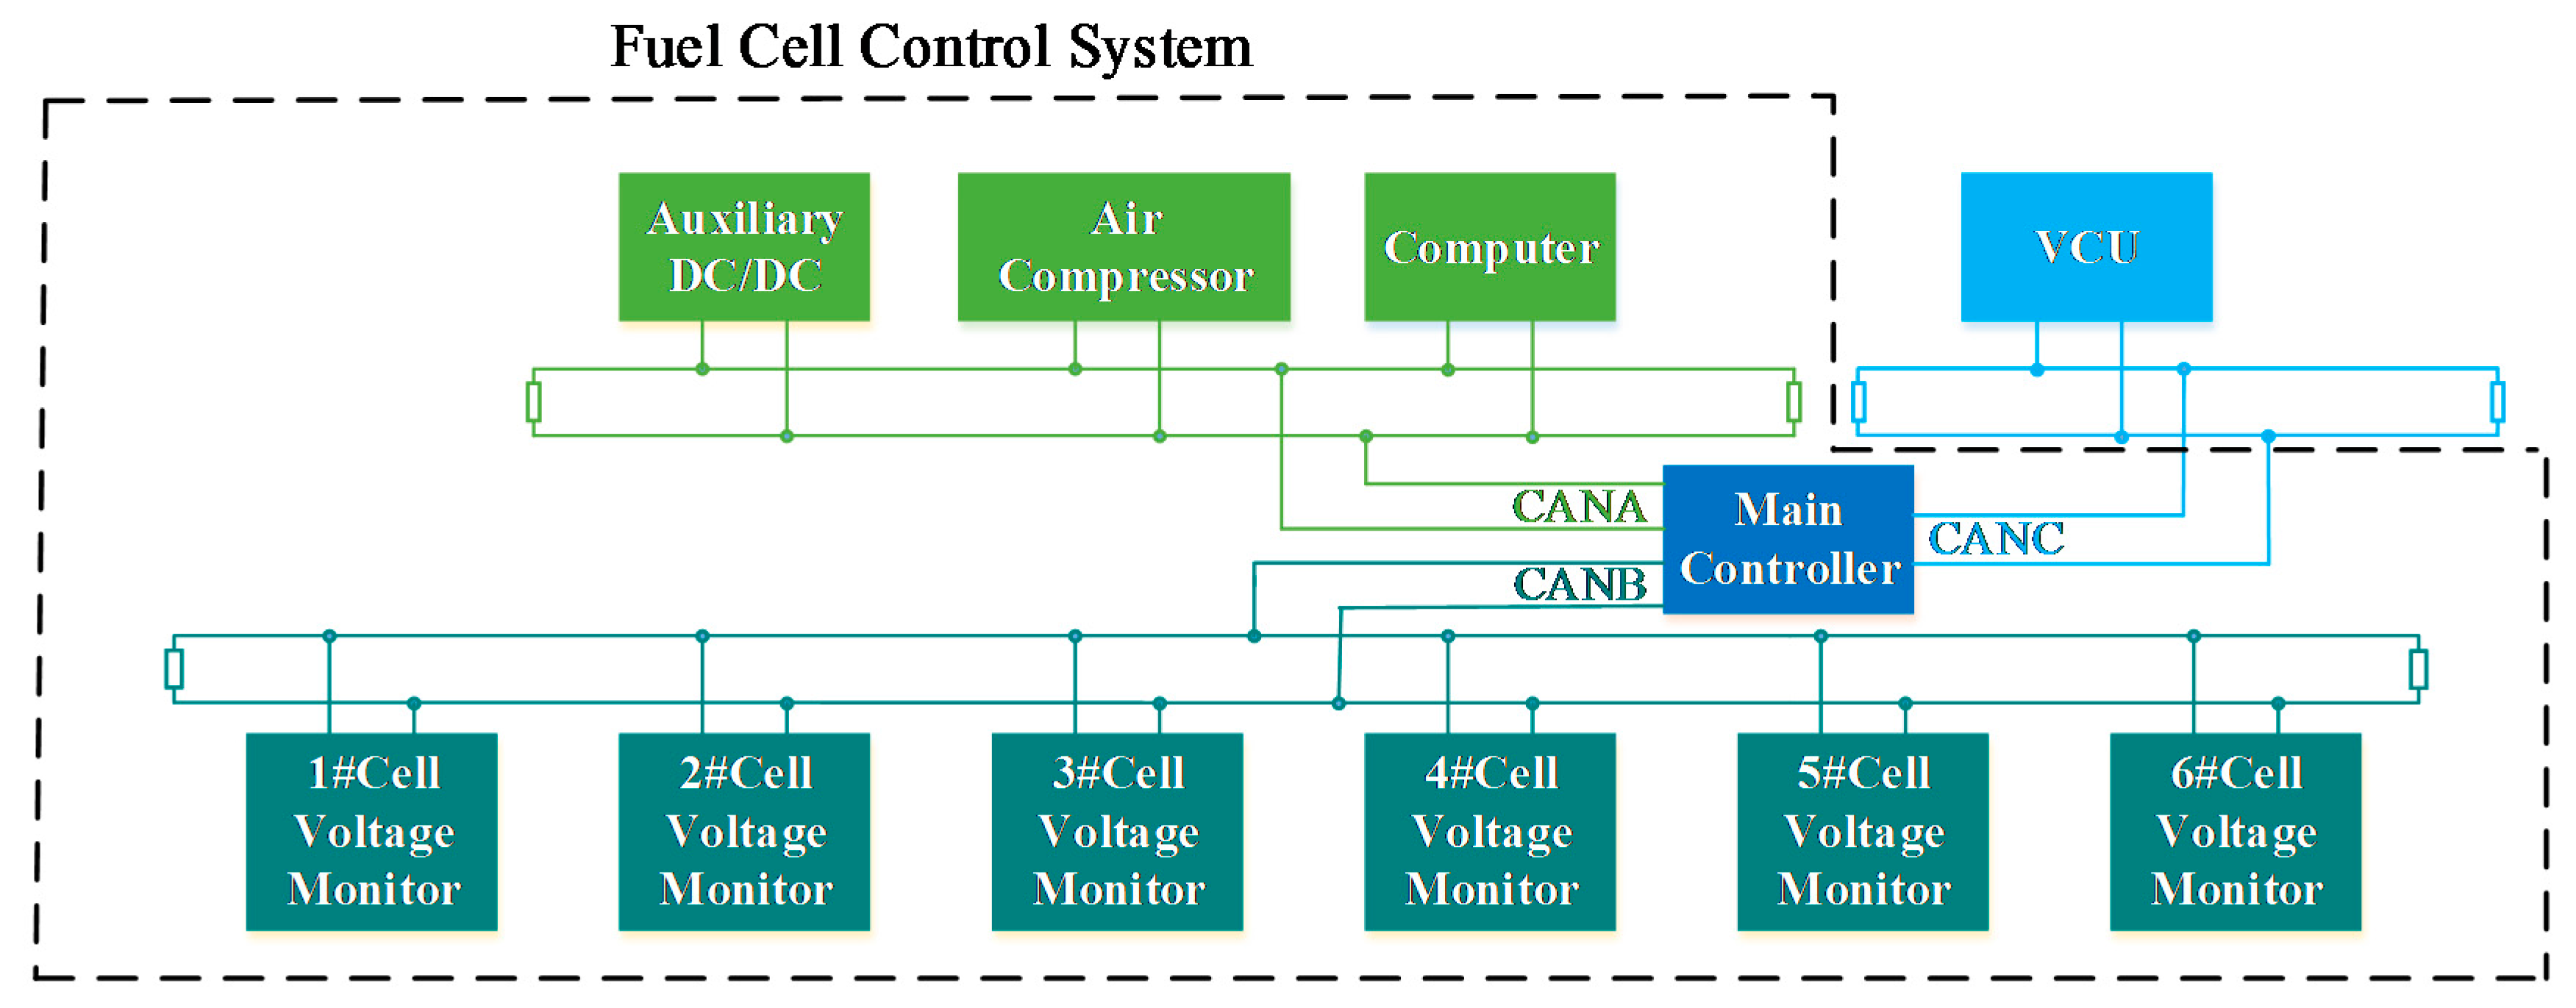
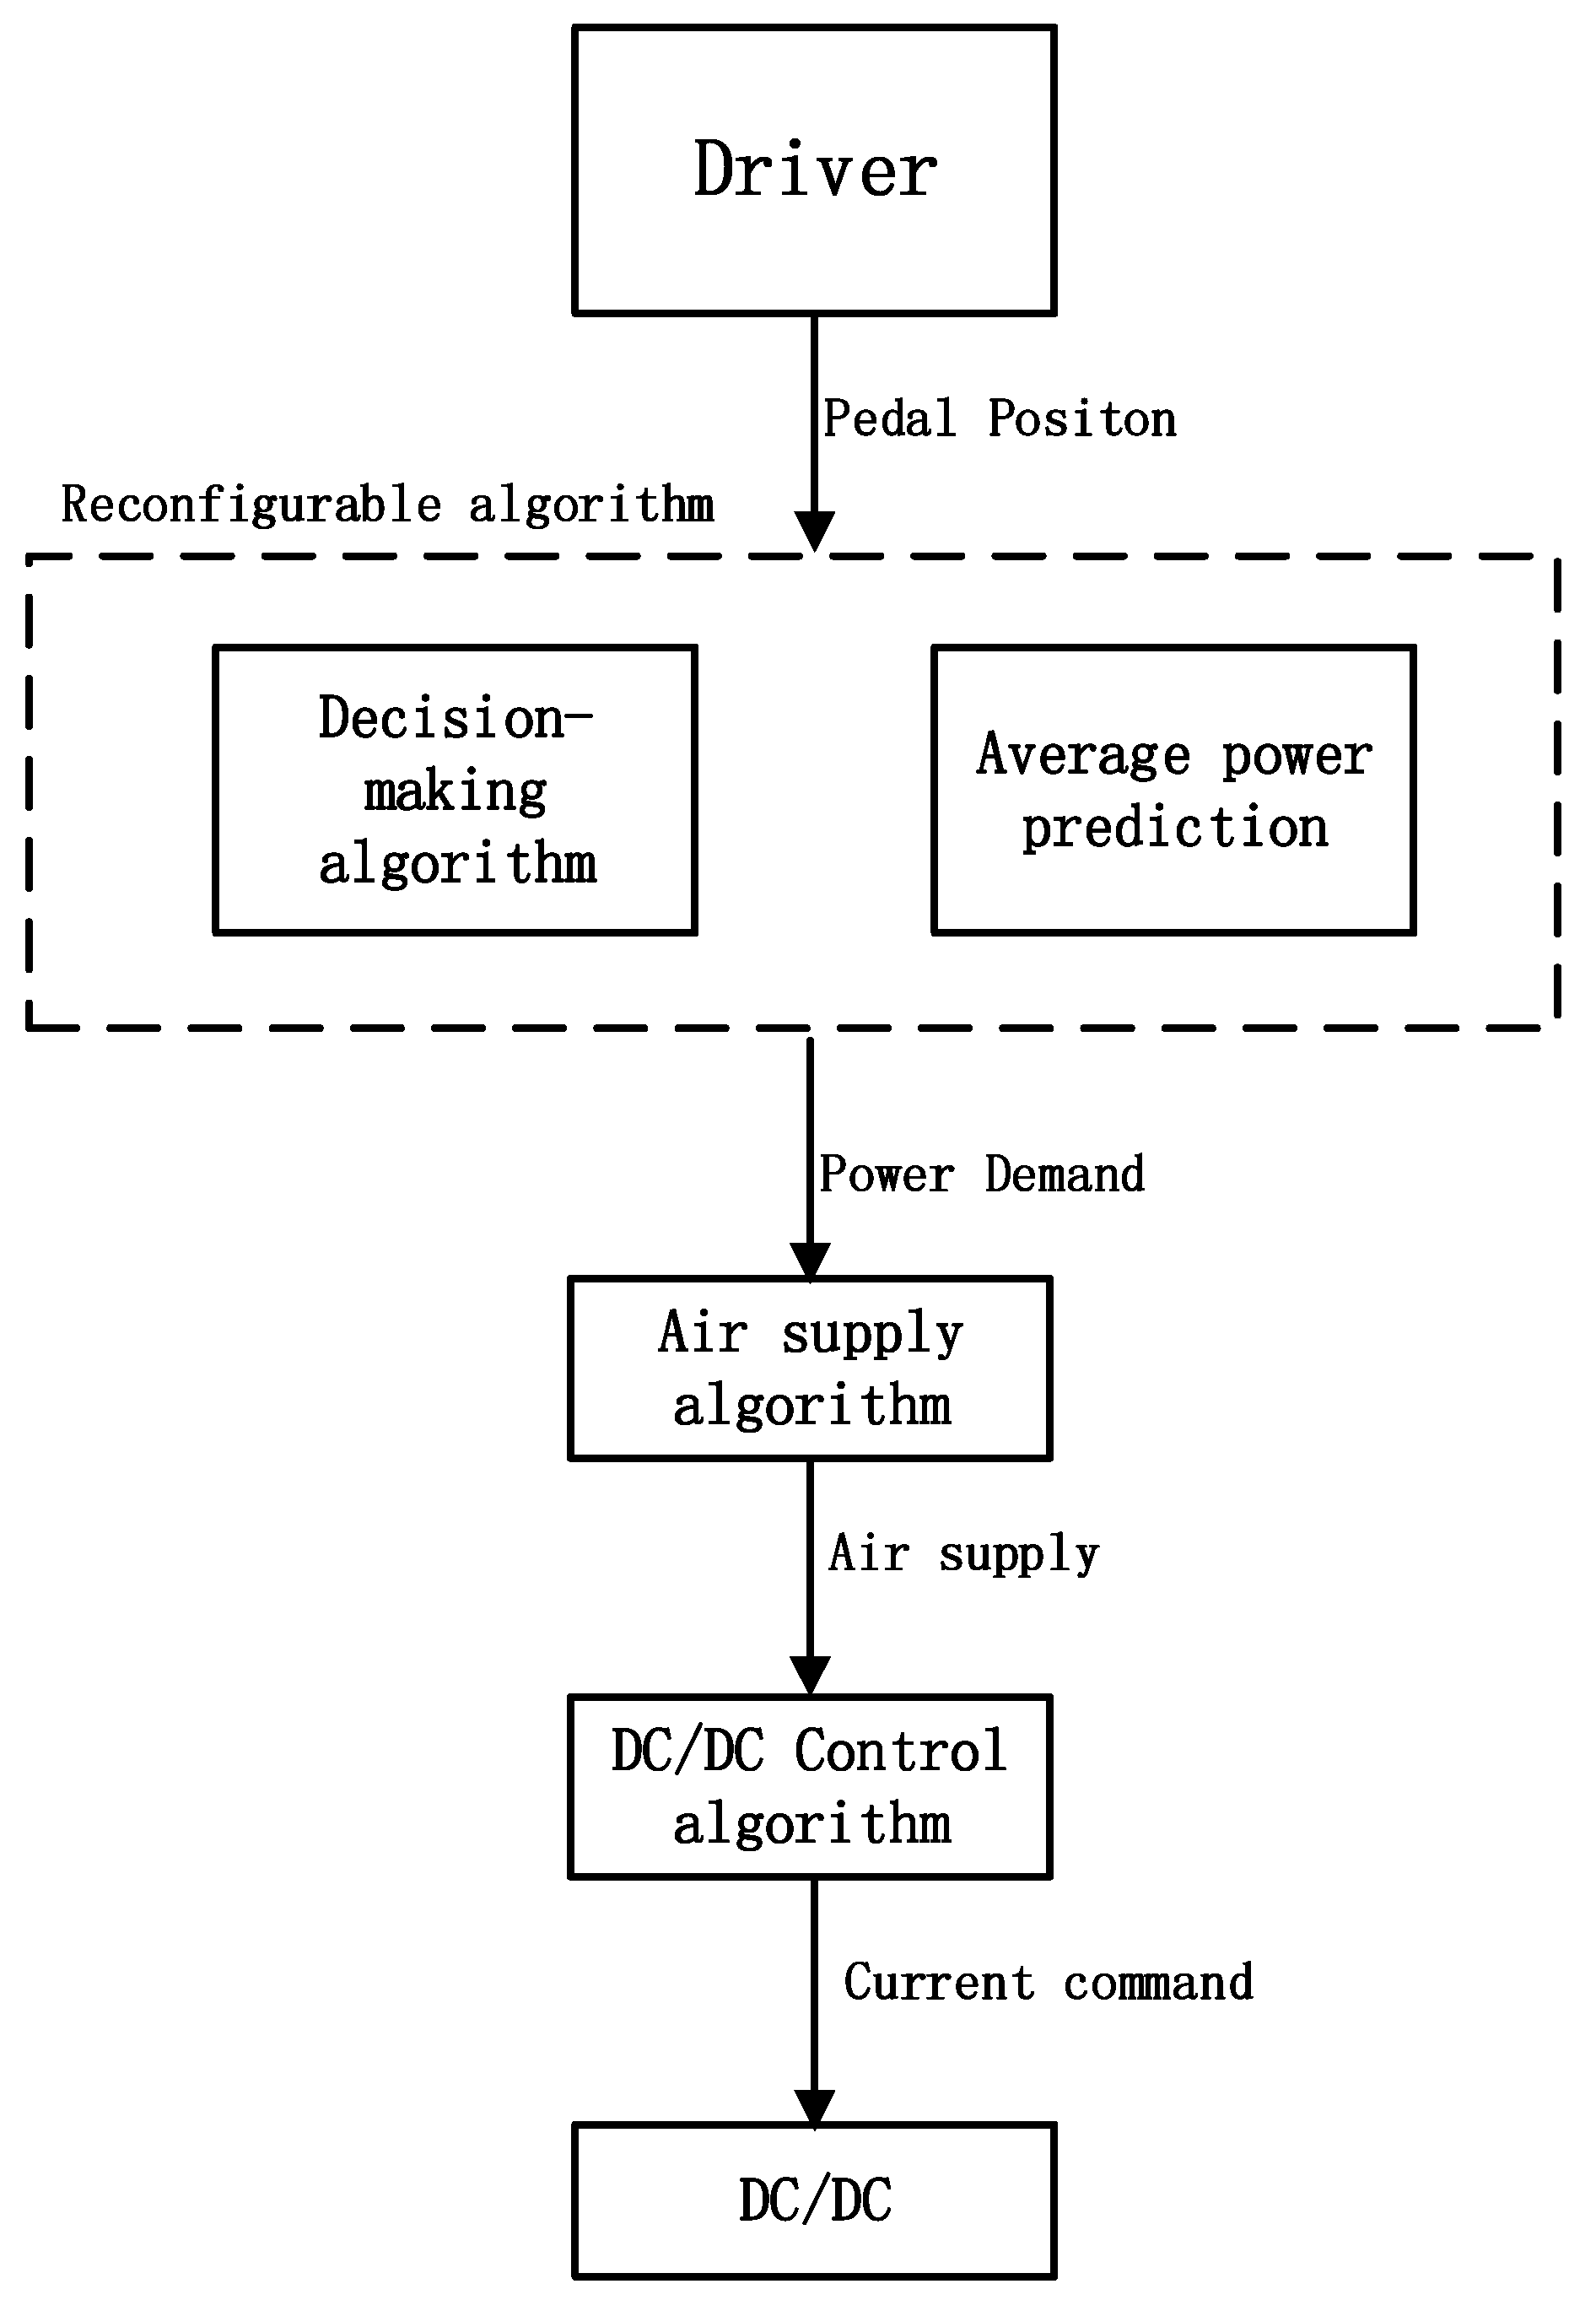
Owing to the complexity of the hybrid fuel cell powertrain, a networked hierarchical control system is necessary. The networked control system consists of a hierarchical structure with four layers. The driver constitutes the top layer, and the vehicle control unit the second layer. The third and the fourth layers are designed for the fuel cell systems and the battery packages, respectively. The control strategies cover two aspects: the vehicle control strategy, and the fuel cell control strategy.
The vehicle control strategy consists of a start-stop strategy and an energy management strategy. The first strategy ensures that the system functions in safe mode. Every component functions in the correct order and the voltage of the DC/DC converter rises slowly, thus ensuring the durability of the relevant components. The second strategy manages the fuel cell output so as to reduce hydrogen consumption and enhance system durability. The two elements, a large power change rate and a high voltage condition, which diminish fuel cell durability, are both avoided. The hydrogen consumption can be optimized by avoiding small load conditions. Furthermore, the accelerating time and maximum speed requirements are both satisfied.
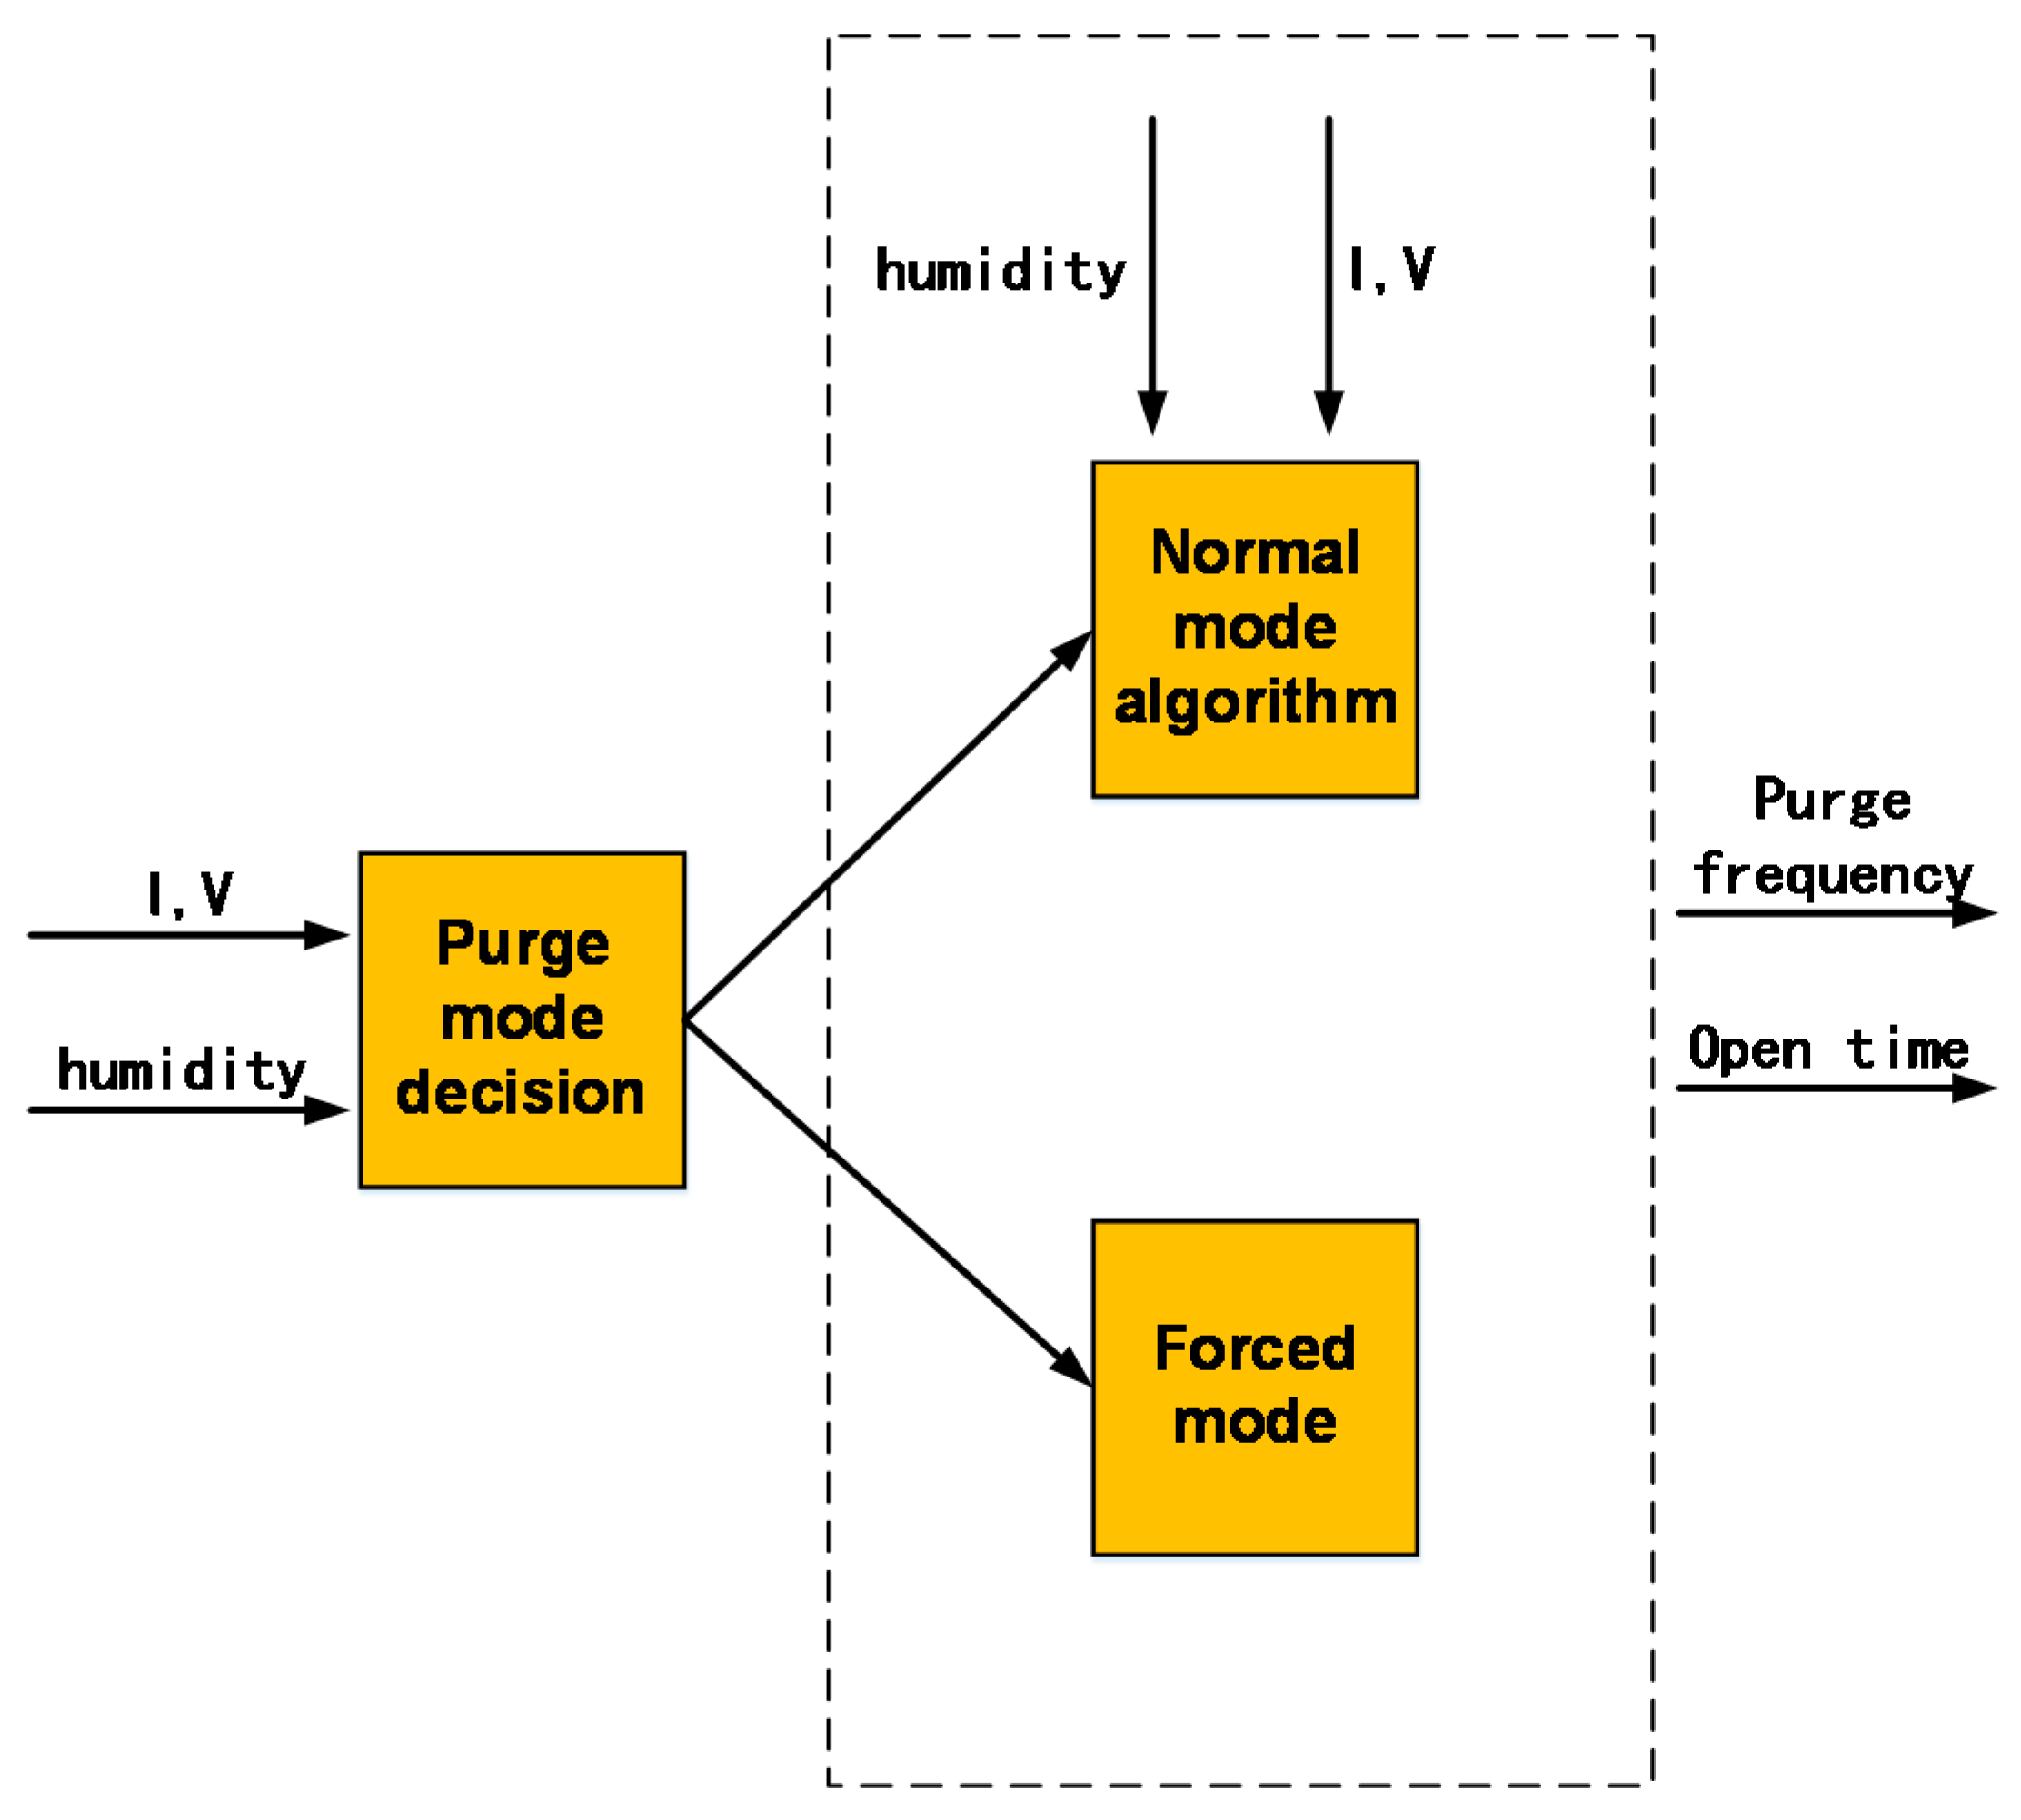
For the fuel cell control system, we introduced the control strategies for the air supply system and the hydrogen supply system. Because the fuel cell is a passive power source, a simple feed-forward control strategy is used to control the air supply. For the hydrogen system, a normal and a forced purge strategy are applied so as to take into account both the hydrogen utilization ratio and the system performance. This paper developed a PEM fuel cell city bus with a hierarchical control system. The control strategy helps to improve the reliability, durability and efficiency. This is a reference for the development of new energy vehicles. Of course, there is still much room for improvement, such as the economy performance can be better optimized based on the real road condition.

Acknowledgments

This work is supported by National Natural Science Foundation of China (Grant No. 51576113 and U1564209), Ministry of Science and Technology of China (Grand No. 2015BAG06B01), Tsinghua University (the independent research plan Z02-1 Grand No. 20151080411).

Author Contributions

Liangfei Xu and Jianqiu Li helped to design the control strategy; Minggao Ouyang helped to analyze data; Chuan Fang and Junming Hu helped to perform the experiments; Siliang Cheng wrote the paper.

Conflicts of Interest

The authors declare no conflict of interest.

References

  1. Chan, C.C.; Wong, Y.S. Electric vehicles charge forward. IEEE Power Energy Mag. 2004, 2, 24–33. [Google Scholar] [CrossRef]
  2. Eberle, U.; Muller, B.; Helmolt, R. Fuel cell electric vehicles and hydrogen infrastructure: Status 2012. Energy Environ. Sci. 2012, 5, 8780. [Google Scholar] [CrossRef]
  3. Notter, D.A.; Kouravelou, K.; Karachalios, T.; Daletou, M.K.; Haberland, N.T. Life cycle assessment of PEM FC applications: electric mobility and μ-CHP. Energy Environ. Sci. 2015, 8, 1969. [Google Scholar] [CrossRef]
  4. Dominguez, I.; Contreras, A.; Posso, F.; Varela, F. Simulation of the operation of a fleet of materials handling and transport vehicles, powered by fuel cells. Int. J. Hydrog. Energy 2015, 40, 7678–7688. [Google Scholar] [CrossRef]
  5. Hardman, S.; Shiu, E.; Wilckens, R.S. Changing the fate of fuel cell vehicles: can lessons be learnt from Tesla motors? Int. J. Hydrog. Energy 2015, 40, 1625–1638. [Google Scholar] [CrossRef]
  6. Xu, L.; Ouyang, M.; Li, J.; Yang, F.; Lu, L.; Hua, J. Optimal sizing of plug-in fuel cell electric vehicles using models of vehicle performance and system cost. Appl. Energy 2013, 103, 477–487. [Google Scholar] [CrossRef]
  7. Erdinc, O.; Uzunoglu, M. Recent trends in PEM fuel cell powered hybrid systems: investigation of application areas, design architectures and energy management approaches. Renew. Sust. Energ. Rev. 2010, 14, 2874–2884. [Google Scholar] [CrossRef]
  8. Hua, T.; Ahluwalia, R.; Eudy, L.; Singer, G.; Jermer, B.; Asselin-Millere, N.; Wesself, S.; Pattersong, T.; Marcinkoskih, J. Status of hydrogen fuel cell electric buses worldwide. J. Power Sources 2014, 269, 975–993. [Google Scholar] [CrossRef]
  9. Gao, D.; Jin, Z.; Zhang, J.; Li, J.; Ouyang, M. Development and performance analysis of a hybrid fuel cell/battery bus with an axle integrated electric motor drive system. Int. J. Hydrog. Energy 2016, 41, 1161–1169. [Google Scholar] [CrossRef]
  10. Andaloro, L.; Napoli, G.; Sergi, F.; Dispenza, G.; Antonucci, V. Design of a hybrid electric fuel cell power train for an urban bus. Int. J. Hydrog. Energy 2013, 38, 7725–7732. [Google Scholar] [CrossRef]
  11. Xu, L.; Ouyang, M.; Li, J.; Yang, F.; Lu, L.; Hua, J. Application of Pontryagin’s minimal principle to the energy management strategy of plugin fuel cell electric vehicles. Int. J. Hydrog. Energy 2013, 38, 10104–10115. [Google Scholar] [CrossRef]
  12. 2011 Fuel Cell Technologies Market Report; Department of Energy (US): Washington, DC, USA, 2012.
  13. Bubna, P.; Brunner, D.; Gangloff, J.J., Jr.; Advani, S.G.; Prasad, A.K. Analysis, operation and maintenance of a fuel cell/battery series-hybrid bus for urban transit applications. J. Power Sources 2010, 195, 3939–3949. [Google Scholar] [CrossRef]
  14. Yoshikazu, M.; Kenji, U. Development of Fuel Cell Vehicle with Next-Generation Fuel Cell Stack; SAE International: Warrendale, PA, USA, 2006. [Google Scholar]
  15. Mitsutaka, A.; Takanori, O.; Yasuhiro, N. Low-cost FC stack concept with increased power density and simplified configuration utilizing an advanced MEA. SAE Int. J. Engines 2011, 1872–1878. [Google Scholar]
  16. Ryu, J.; Park, Y.; Sunwoo, M. Electric powertrain modeling of a fuel cell hybrid electric vehicle and development of a power distribution algorithm based on driving mode recognition. J. Power Sources 2010, 195, 5735–5748. [Google Scholar] [CrossRef]
  17. Barbosa, F.C. Hydrogen Fuel Cell Transit Bus Technology into a Technical-Economical Perspective. SAE Technical Paper 2013. [Google Scholar] [CrossRef]
  18. Paganelli, G.; Delprat, S.; Guerra, T.M.; Rimaux, J.; Santin, J.J. Equivalent consumption minimization strategy for parallel hybrid powertrains. In Proceedings of the IEEE 55th Vehicular Technology Conference (VTC), Birmingham, AL, USA, 6–9 May 2002; Volume 4, pp. 2076–2081.
  19. Lin, C.; Peng, H.; Grizzle, J.W.; Kang, J. Power management strategy for a parallel hybrid electric truck. IEEE Tran. Control Syst. Technol. 2003, 11, 839–849. [Google Scholar]
  20. Zhang, J.; Lv, C.; Qiu, M.; Li, Y.; Sun, D. Braking energy regeneration control of a fuel cell hybrid electric bus. Energy Convers. Manag. 2013, 76, 1117–1124. [Google Scholar] [CrossRef]
  21. Xu, L.; Li, J.; Hua, J.; Li, X.; Ouyang, M. Adaptive supervisory control strategy of a fuel cell/battery powered city bus. J. Power Sources 2009, 194, 360–368. [Google Scholar] [CrossRef]
  22. Xu, L.; Yang, F.; Li, J.; Ouyang, M.; Hua, J. Real time optimal energy management strategy targeting at minimizing daily operation cost for a plug-in fuel cell city bus. Int. J. Hydrog. Energy 2012, 37, 15380–15392. [Google Scholar] [CrossRef]
  23. Xu, L.; Li, J.; Hua, J.; Li, X.; Ouyang, M. Optimal vehicle control strategy of a fuel cell/battery hybrid city bus. Int. J. Hydrog. Energy 2009, 34, 7323–7333. [Google Scholar] [CrossRef]
  24. Xu, L.; Li, J.; Ouyang, M.; Hua, J.; Li, X. Active fault tolerance control system of fuel cell hybrid city bus. Int. J. Hydrog. Energy 2010, 35, 12510–12520. [Google Scholar] [CrossRef]
  25. Pukrushpan, J.T.; Stefanopoulou, A.G.; Peng, H. Control of Fuel Cell Power Systems: Principles, Modeling, Analysis and Feedback Design; Springer Verlag: Bangkok, Thailand, 2004. [Google Scholar]
  26. Rakhtala, S.M.; Roudbari, E.S. Fuzzy PID control of a stand-alone system based on PEM fuel cell. Int. J. Electric. Power Energy Syst. 2016, 78, 576–590. [Google Scholar] [CrossRef]
  27. Fang, C.; Li, J.; Xu, L.; Ouyang, M.; Hu, J.; Cheng, S. Model-based fuel pressure regulation algorithm for a hydrogen-injected PEM fuel cell engine. Int. J. Hydrog. Energy 2015, 40, 14942–14951. [Google Scholar] [CrossRef]
  28. Yoshiake, N.; Manabe, K.; Hiroyuki, I.; Yasuhiro, N. Development of system control for rapid warm-up operation of fuel cell. SAE Int. J. Altern. Powertrains 2012, 1, 365–373. [Google Scholar]
  29. Manabe, K.; Yoshiake, N.; Yasuhiro, N.; Mikio, K.; Tomoya, O. Development of Fuel Cell Hybrid Vehicle Rapid Start-up from Sub-freezing Temperatures. In Proceedings of the SAE 2010 World Congress & Exhibition, Detroit, MI, USA, 13–15 April 2010; pp. 1379–1385.
Figure 1. Powertrain structure schematic.
Energies 09 00417 g001
Figure 2. Fuel cell system schematic.
Energies 09 00417 g002
Figure 3. (a) The I-V curve of the PEM fuel cell; (b) The relationship between stack efficiency and current of the PEM fuel cell; (c) The relationship between system efficiency and current of the PEM fuel cell.
Energies 09 00417 g003
Figure 4. Vehicle control layer.
Energies 09 00417 g004
Figure 5. Network of the fuel cell system.
Energies 09 00417 g005
Figure 6. Electrical connection of battery system, DICO, and DC/DC converter.
Energies 09 00417 g006
Figure 7. Flow chart of stop process.
Energies 09 00417 g007
Figure 8. Purge control strategy.
Energies 09 00417 g008
Figure 9. Air supply control order.
Energies 09 00417 g009
Figure 10. The voltage trend of the DC/DC during start-up process.
Energies 09 00417 g010
Figure 11. Signal change order during Start-up process.
Energies 09 00417 g011
Figure 12. (a) Acceleration performance; (b) Maximum speed performance.
Energies 09 00417 g012
Figure 13. (a) vehicle speed; (b) Voltage and power trend of the city bus. (c) Current trend of fuel cell, battery and motor.
Energies 09 00417 g013
Figure 14. Cell voltage trend.
Energies 09 00417 g014
Figure 15. Sankey diagram.
Energies 09 00417 g015
Figure 16. The relationship between stack voltage and DC/DC efficiency.
Energies 09 00417 g016
Figure 17. The relationship between DC/DC power and combined efficiency.
Energies 09 00417 g017
Table 1. Main specifications of (PEM) FCEV bus in this study.
ParameterValue
Bus Length (mm)12,000
Bus Width (mm)2550
Bus Height (mm)3500
Bus Weight (kg)12,500
Rated Power of Fuel Cell System (kW)50
Number of Cells in Stack520
Cell Area (cm2)300
Fuel Cell Dimension (mm)950 × 630 × 853
Fuel Cell Weight (kg)330
Rated Voltage of Battery (V)607
Capacity of Battery (Ah)60
Energy Storage of Battery (kWh)36
Battery Dimension (mm)600 × 750 × 430 × 4
Battery Weight (kg)700
Rated Power of Motor (kW)65 × 2
Hydrogen Tank Volume (L)140 × 8
Hydrogen Tank Pressure (MPa)35
Max Hydrogen Storage (kg)25
Max Energy Storage of Hydrogen (kWh)830
Average Fuel Consumption per 100 km (kg)8.4

