
An Intelligent Sensor for the Ultra-High-Frequency Partial Discharge Online Monitoring of Power Transformers

Abstract
:1. Introduction
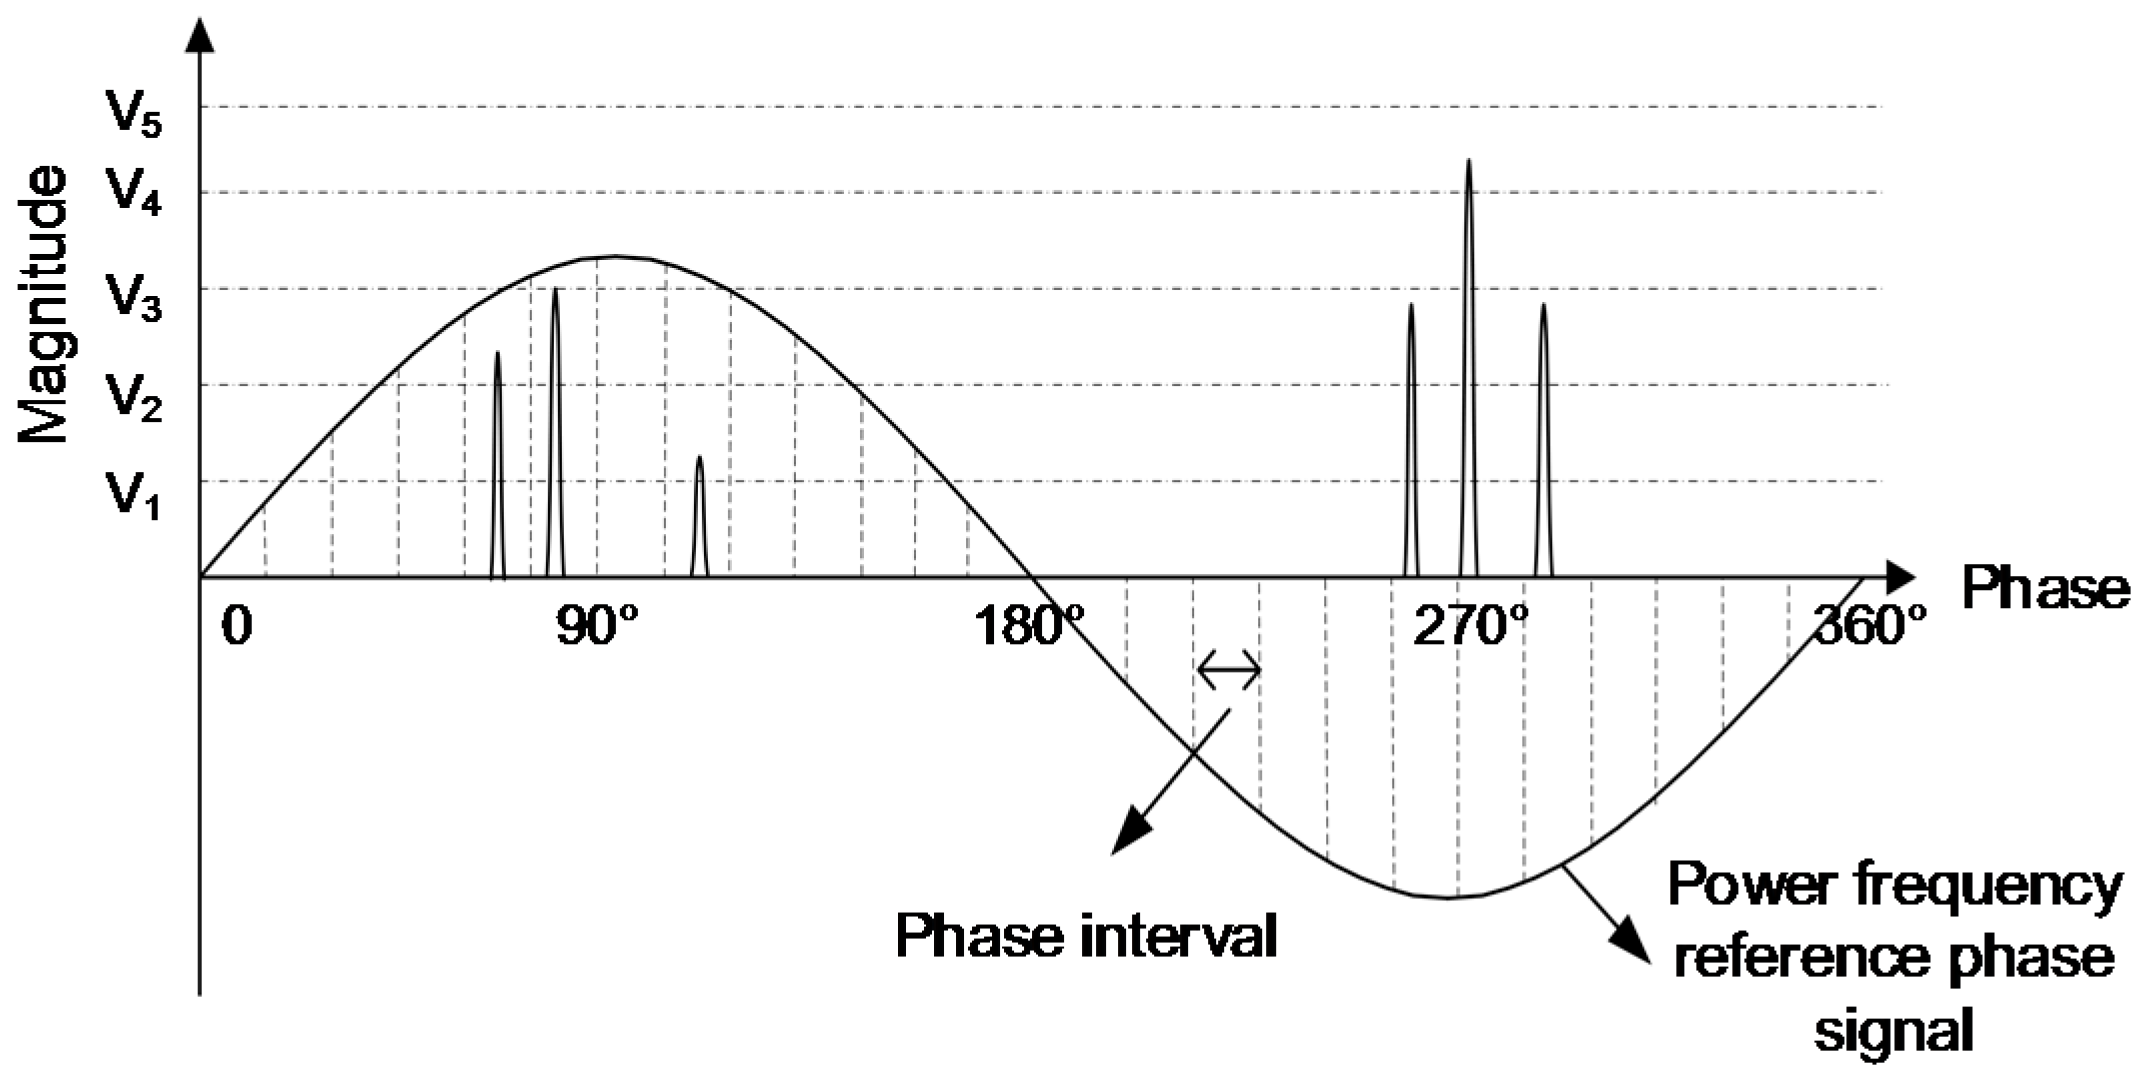
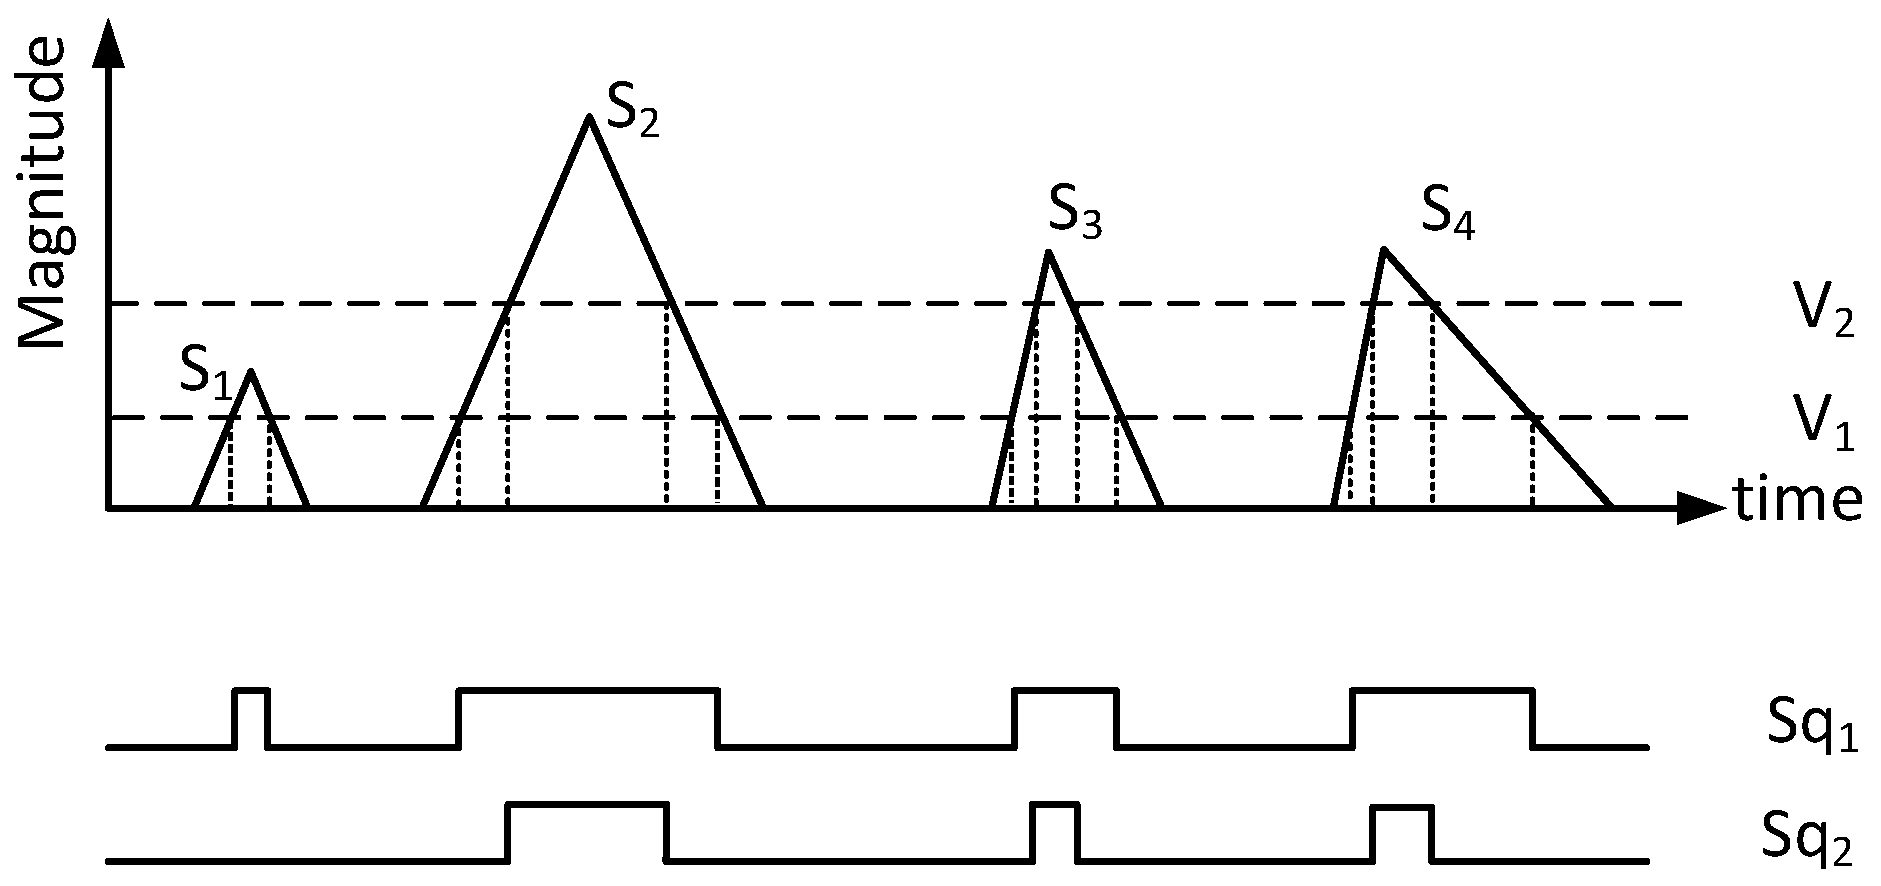
2. The Level Scanning Method
3. Implementation of the Intelligent Sensor
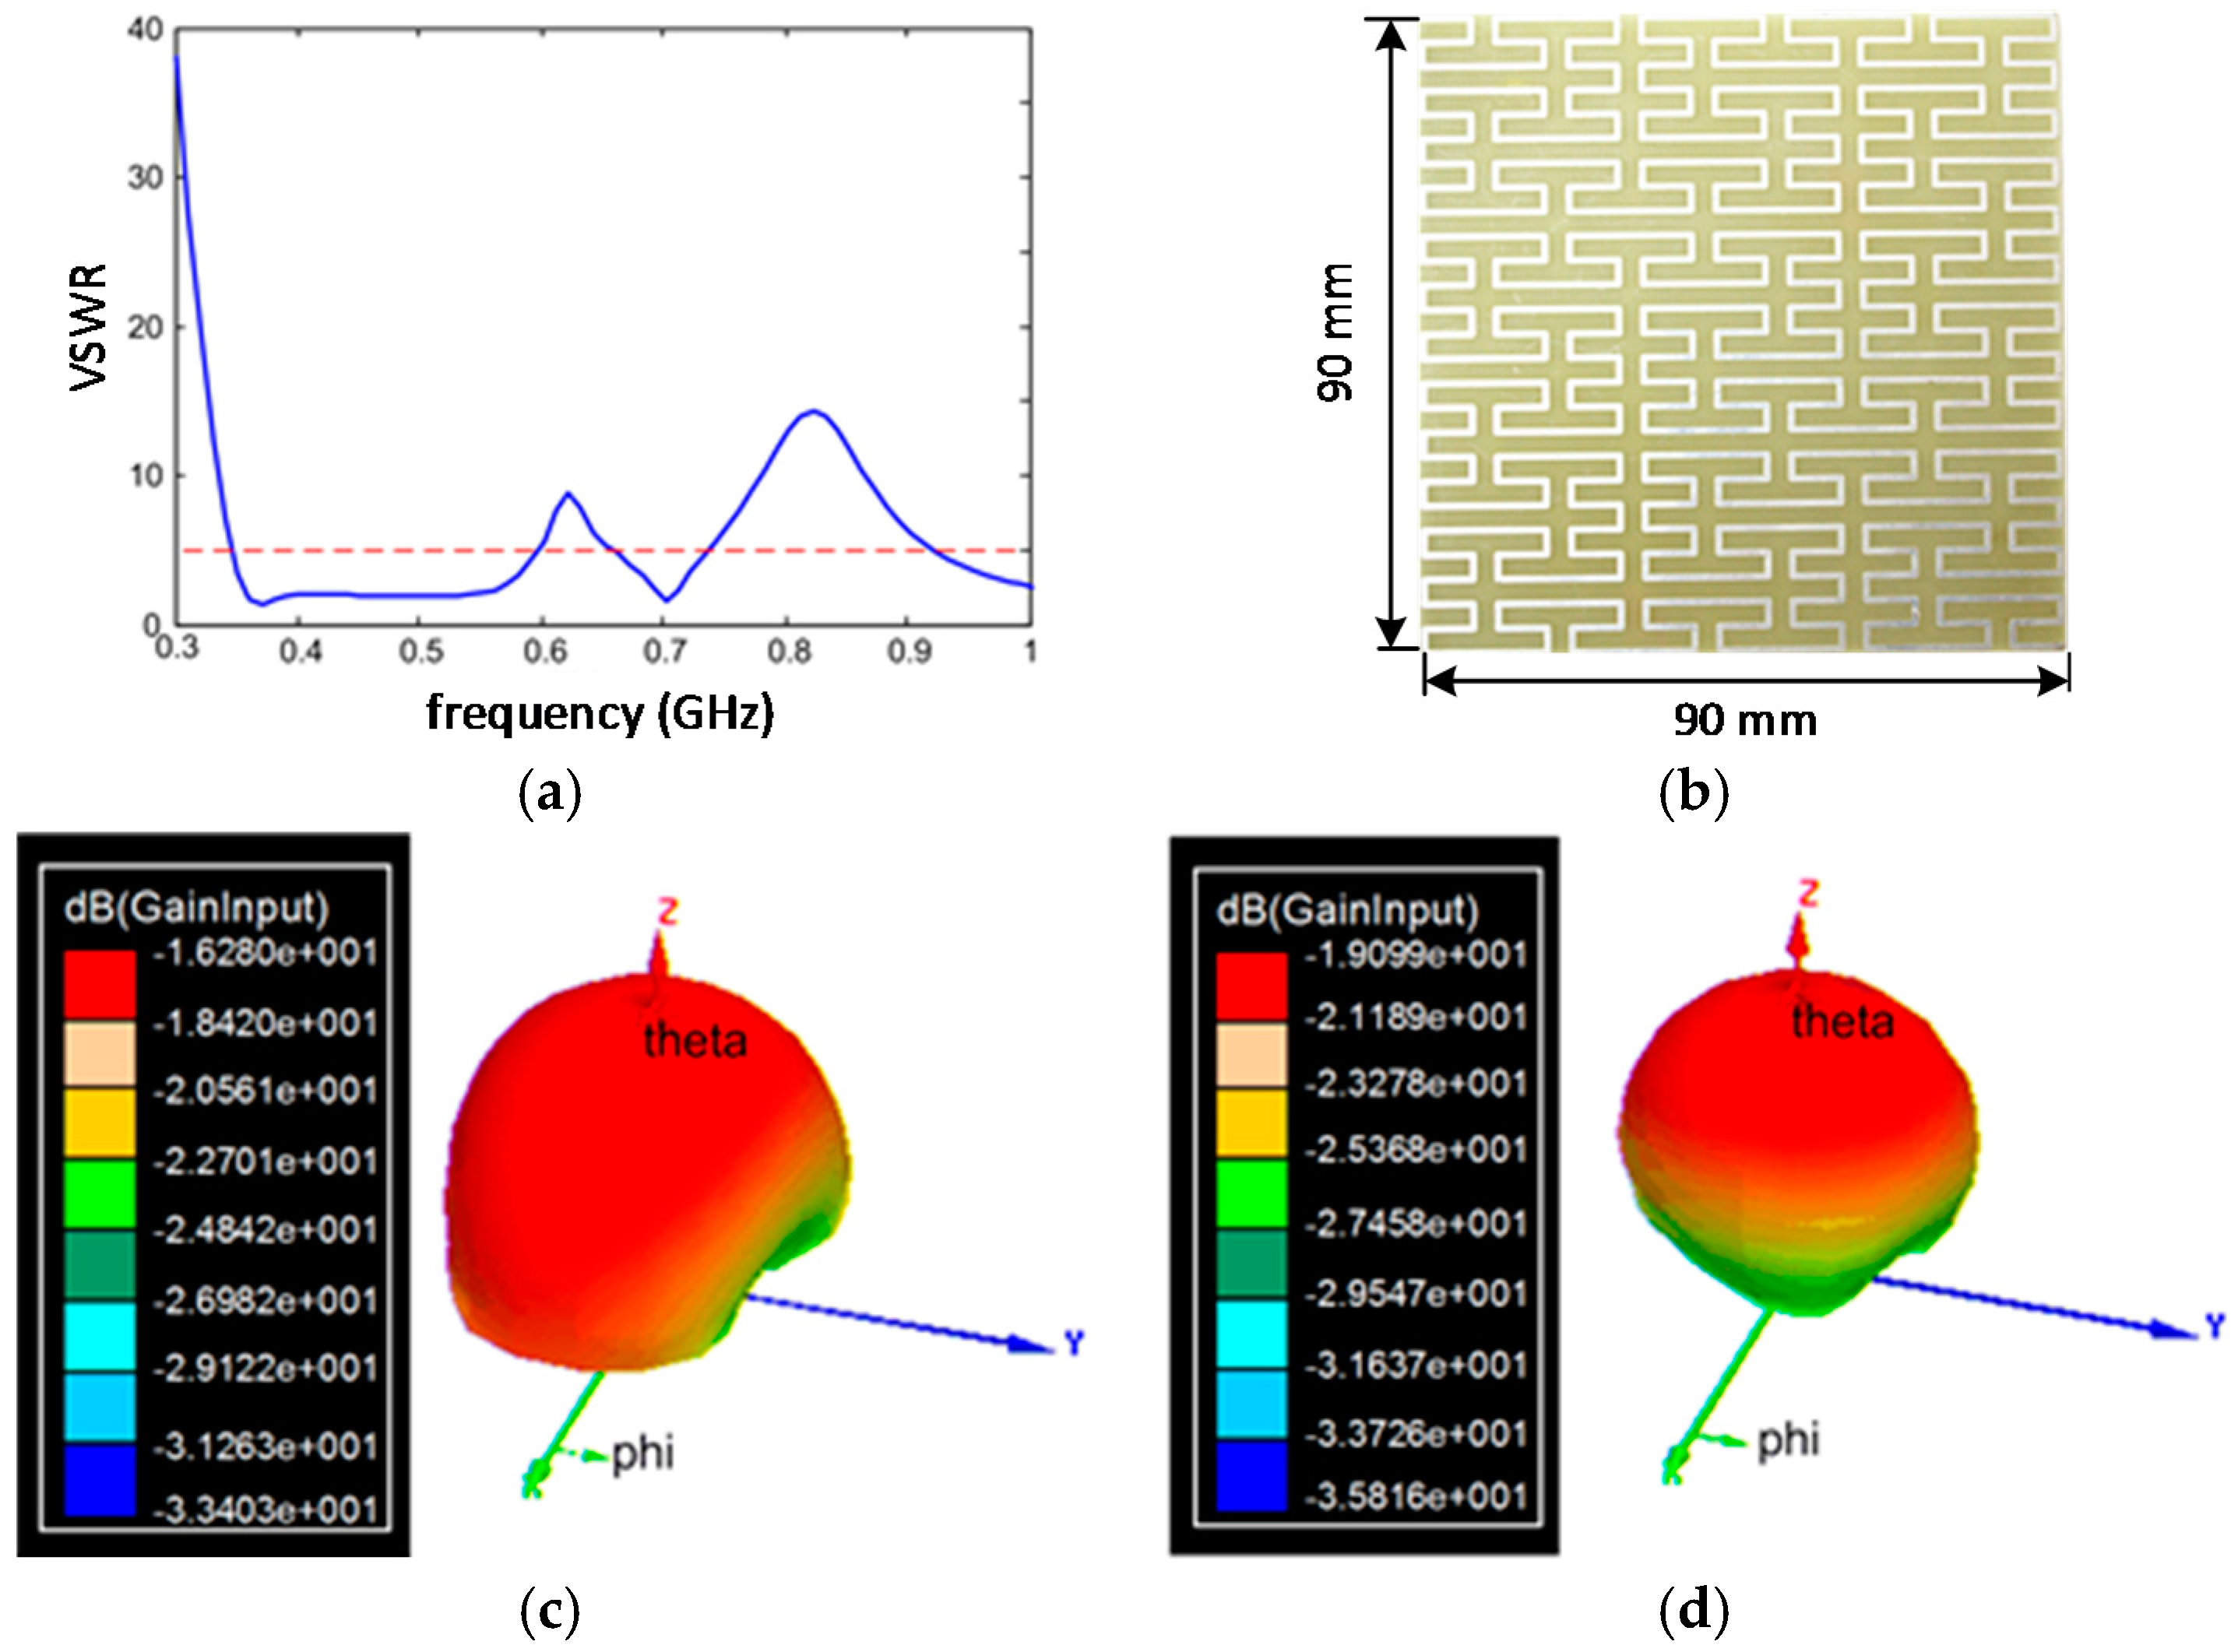
3.1. Ultra-High-Frequency Antanas
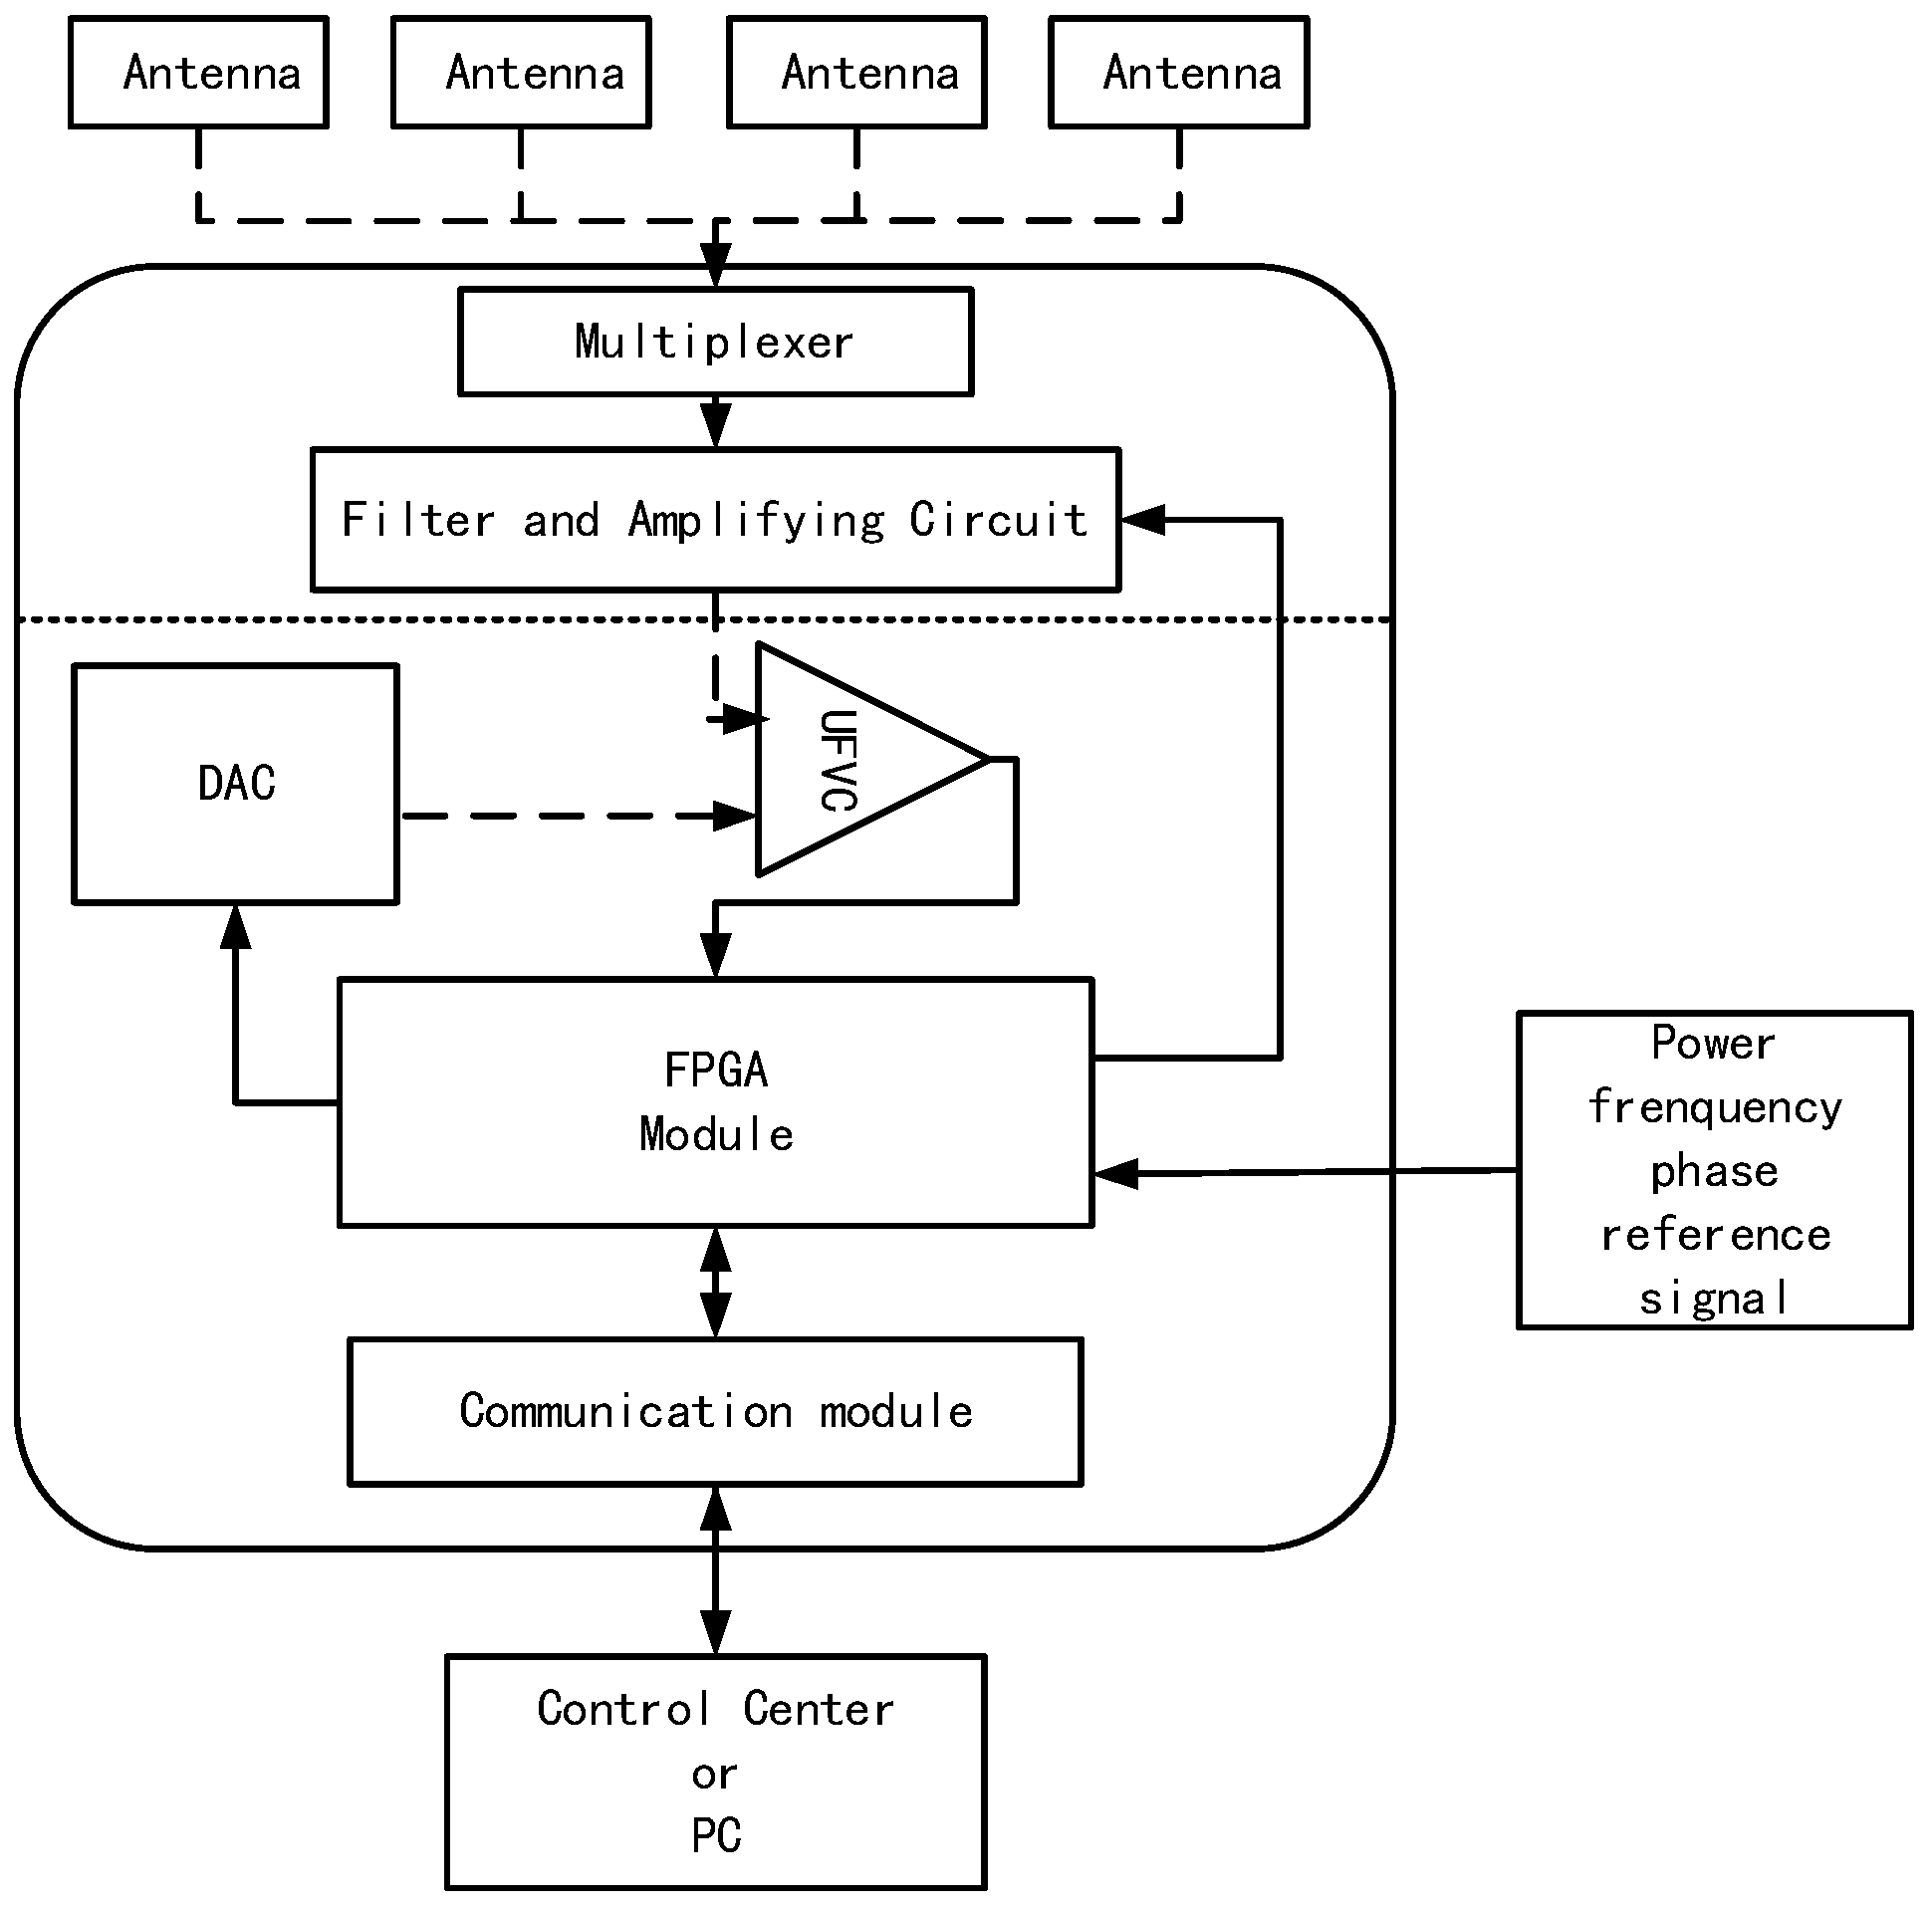
3.2. Hardware of the Data Processing Module
3.2.1. The Signal Pre-Processing Module
3.2.2. The Data Acquisition Module
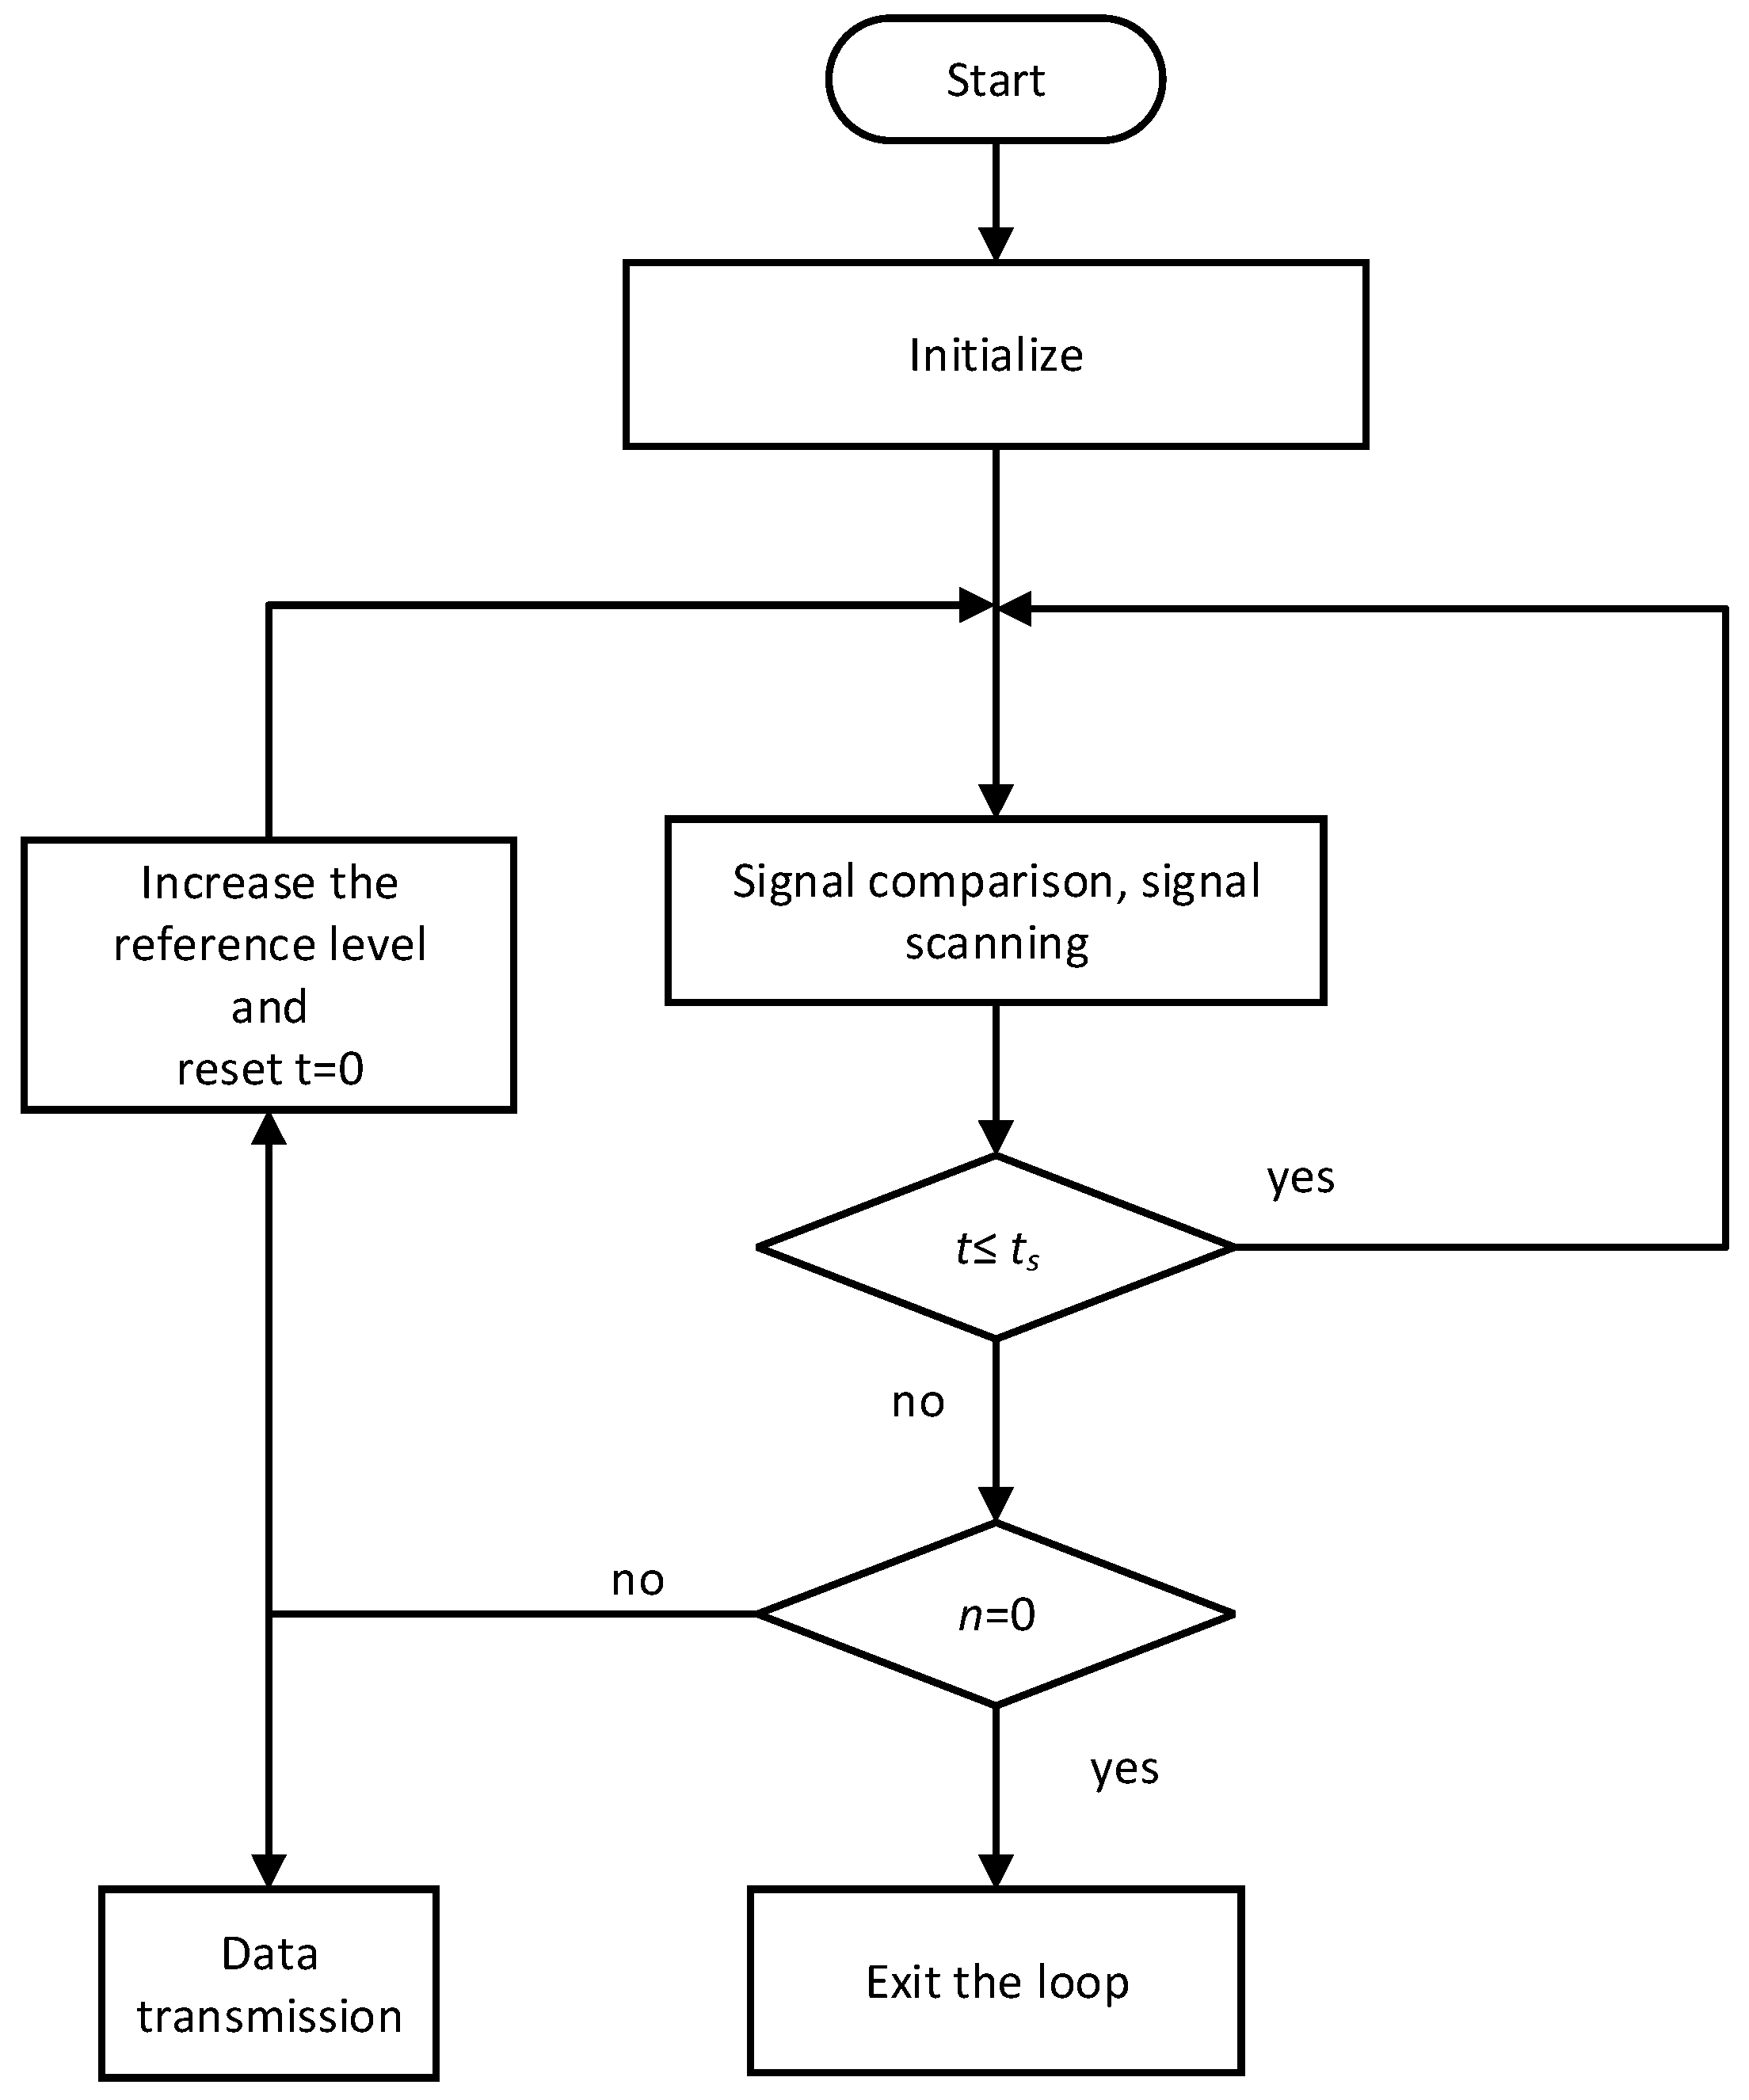
3.3. Software of the Data Processing Module
- Step 1:
- Initialization. In this step, the signal channel, the gain of amplifier, the initial reference level, and the number of scanning cycles are set. Moreover, a frequency cycle is divided into several equal phase intervals, and the corresponding memory addresses to store the number of discharges within each phase interval are assigned in FPGA.
- Step 2:
- Signal comparison, data storage, and transmission. The start of the module is first triggered by the zero crossing point in the rising edge of the power frequency phase inference signal after being initialized, and the scanning time is counted from this moment. UHF PD signals are compared with the reference level and then scanned by FPGA, and the phase of UHF PD signals are calculated simultaneously. If the UHF PD signal is greater than the reference level, the number of discharges within the corresponding phase interval in the memory address add 1. If the counted scanning cycle reaches the set valve ts, stop scanning and transmitting the data to the PC or control center. The data is a row of numbers, which is shown in Table 1.
- Step 3:
- Comparison with variable reference level. FPGA automatically changes the value of the reference level according to the algorithm. Repeat Step 2.
- Step 4:
- Stop operation. Judge the number of discharges in each phase interval; if they are totally equal to zero, which means there is no discharge whose magnitude is greater than the reference level, stop scanning and exit the loop.
4. Experiment and Results
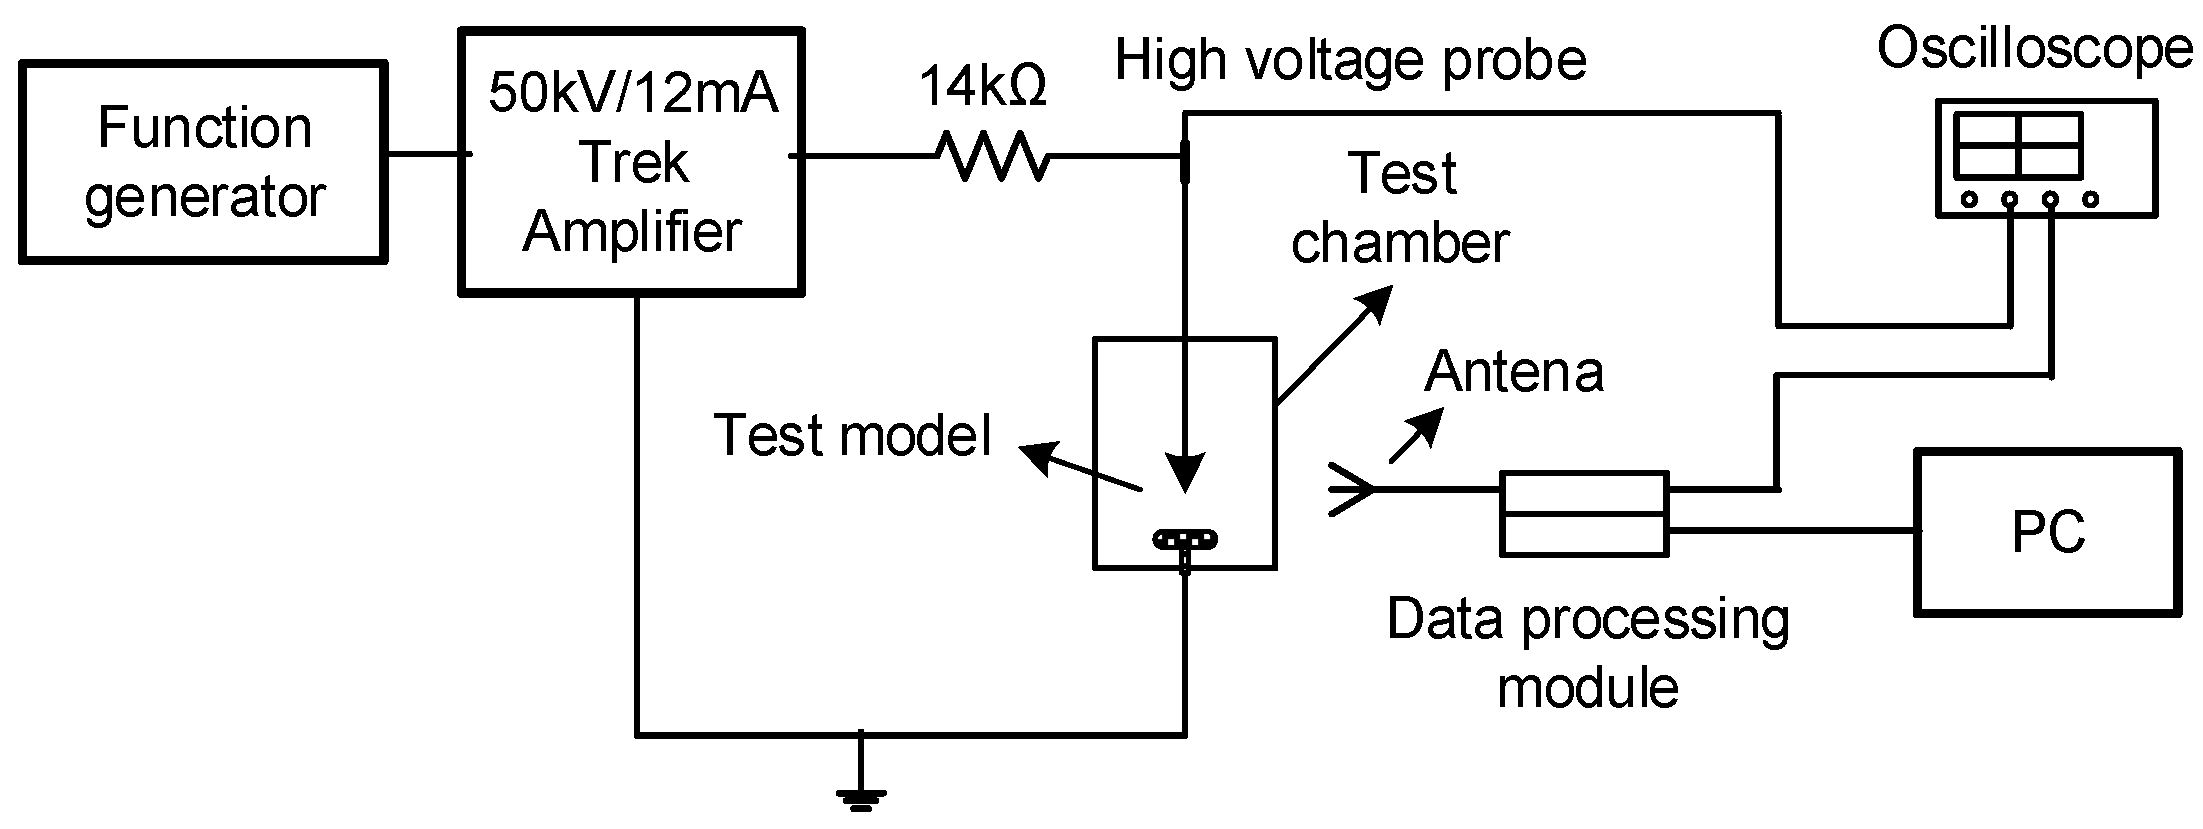
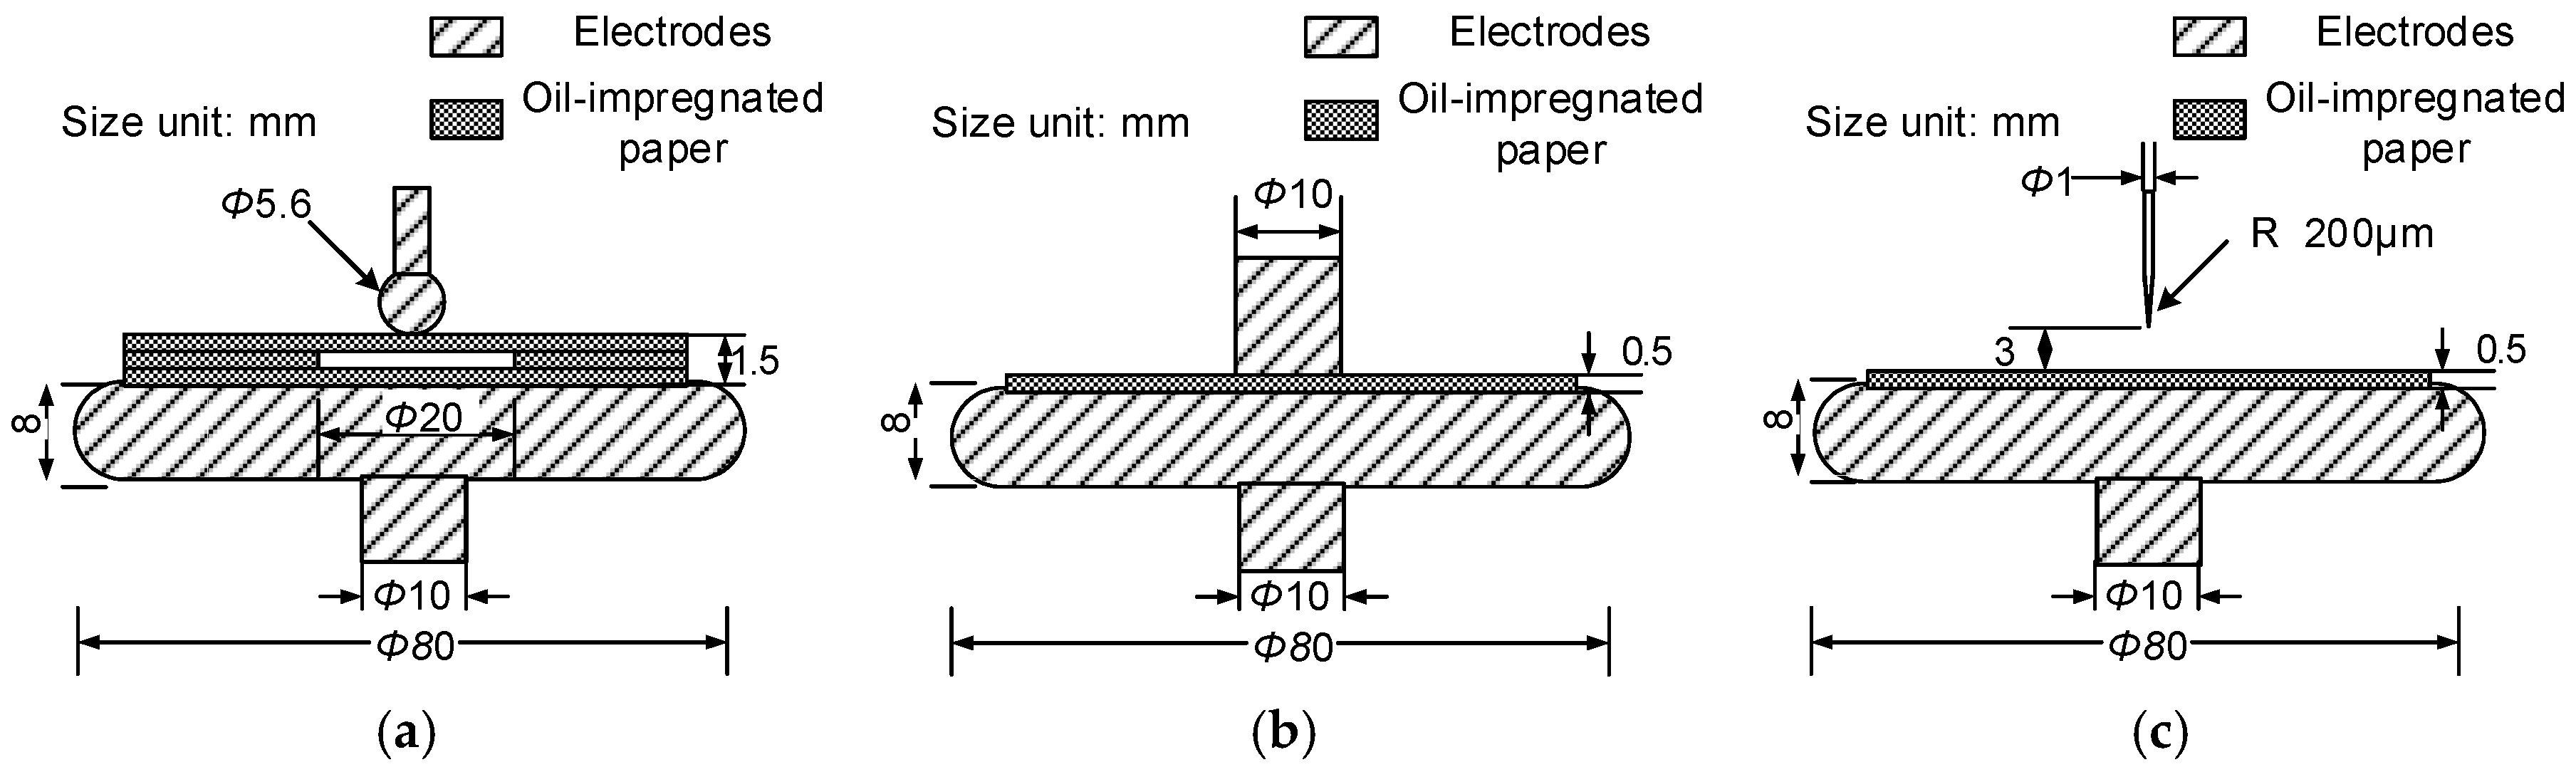
4.1. Experiment
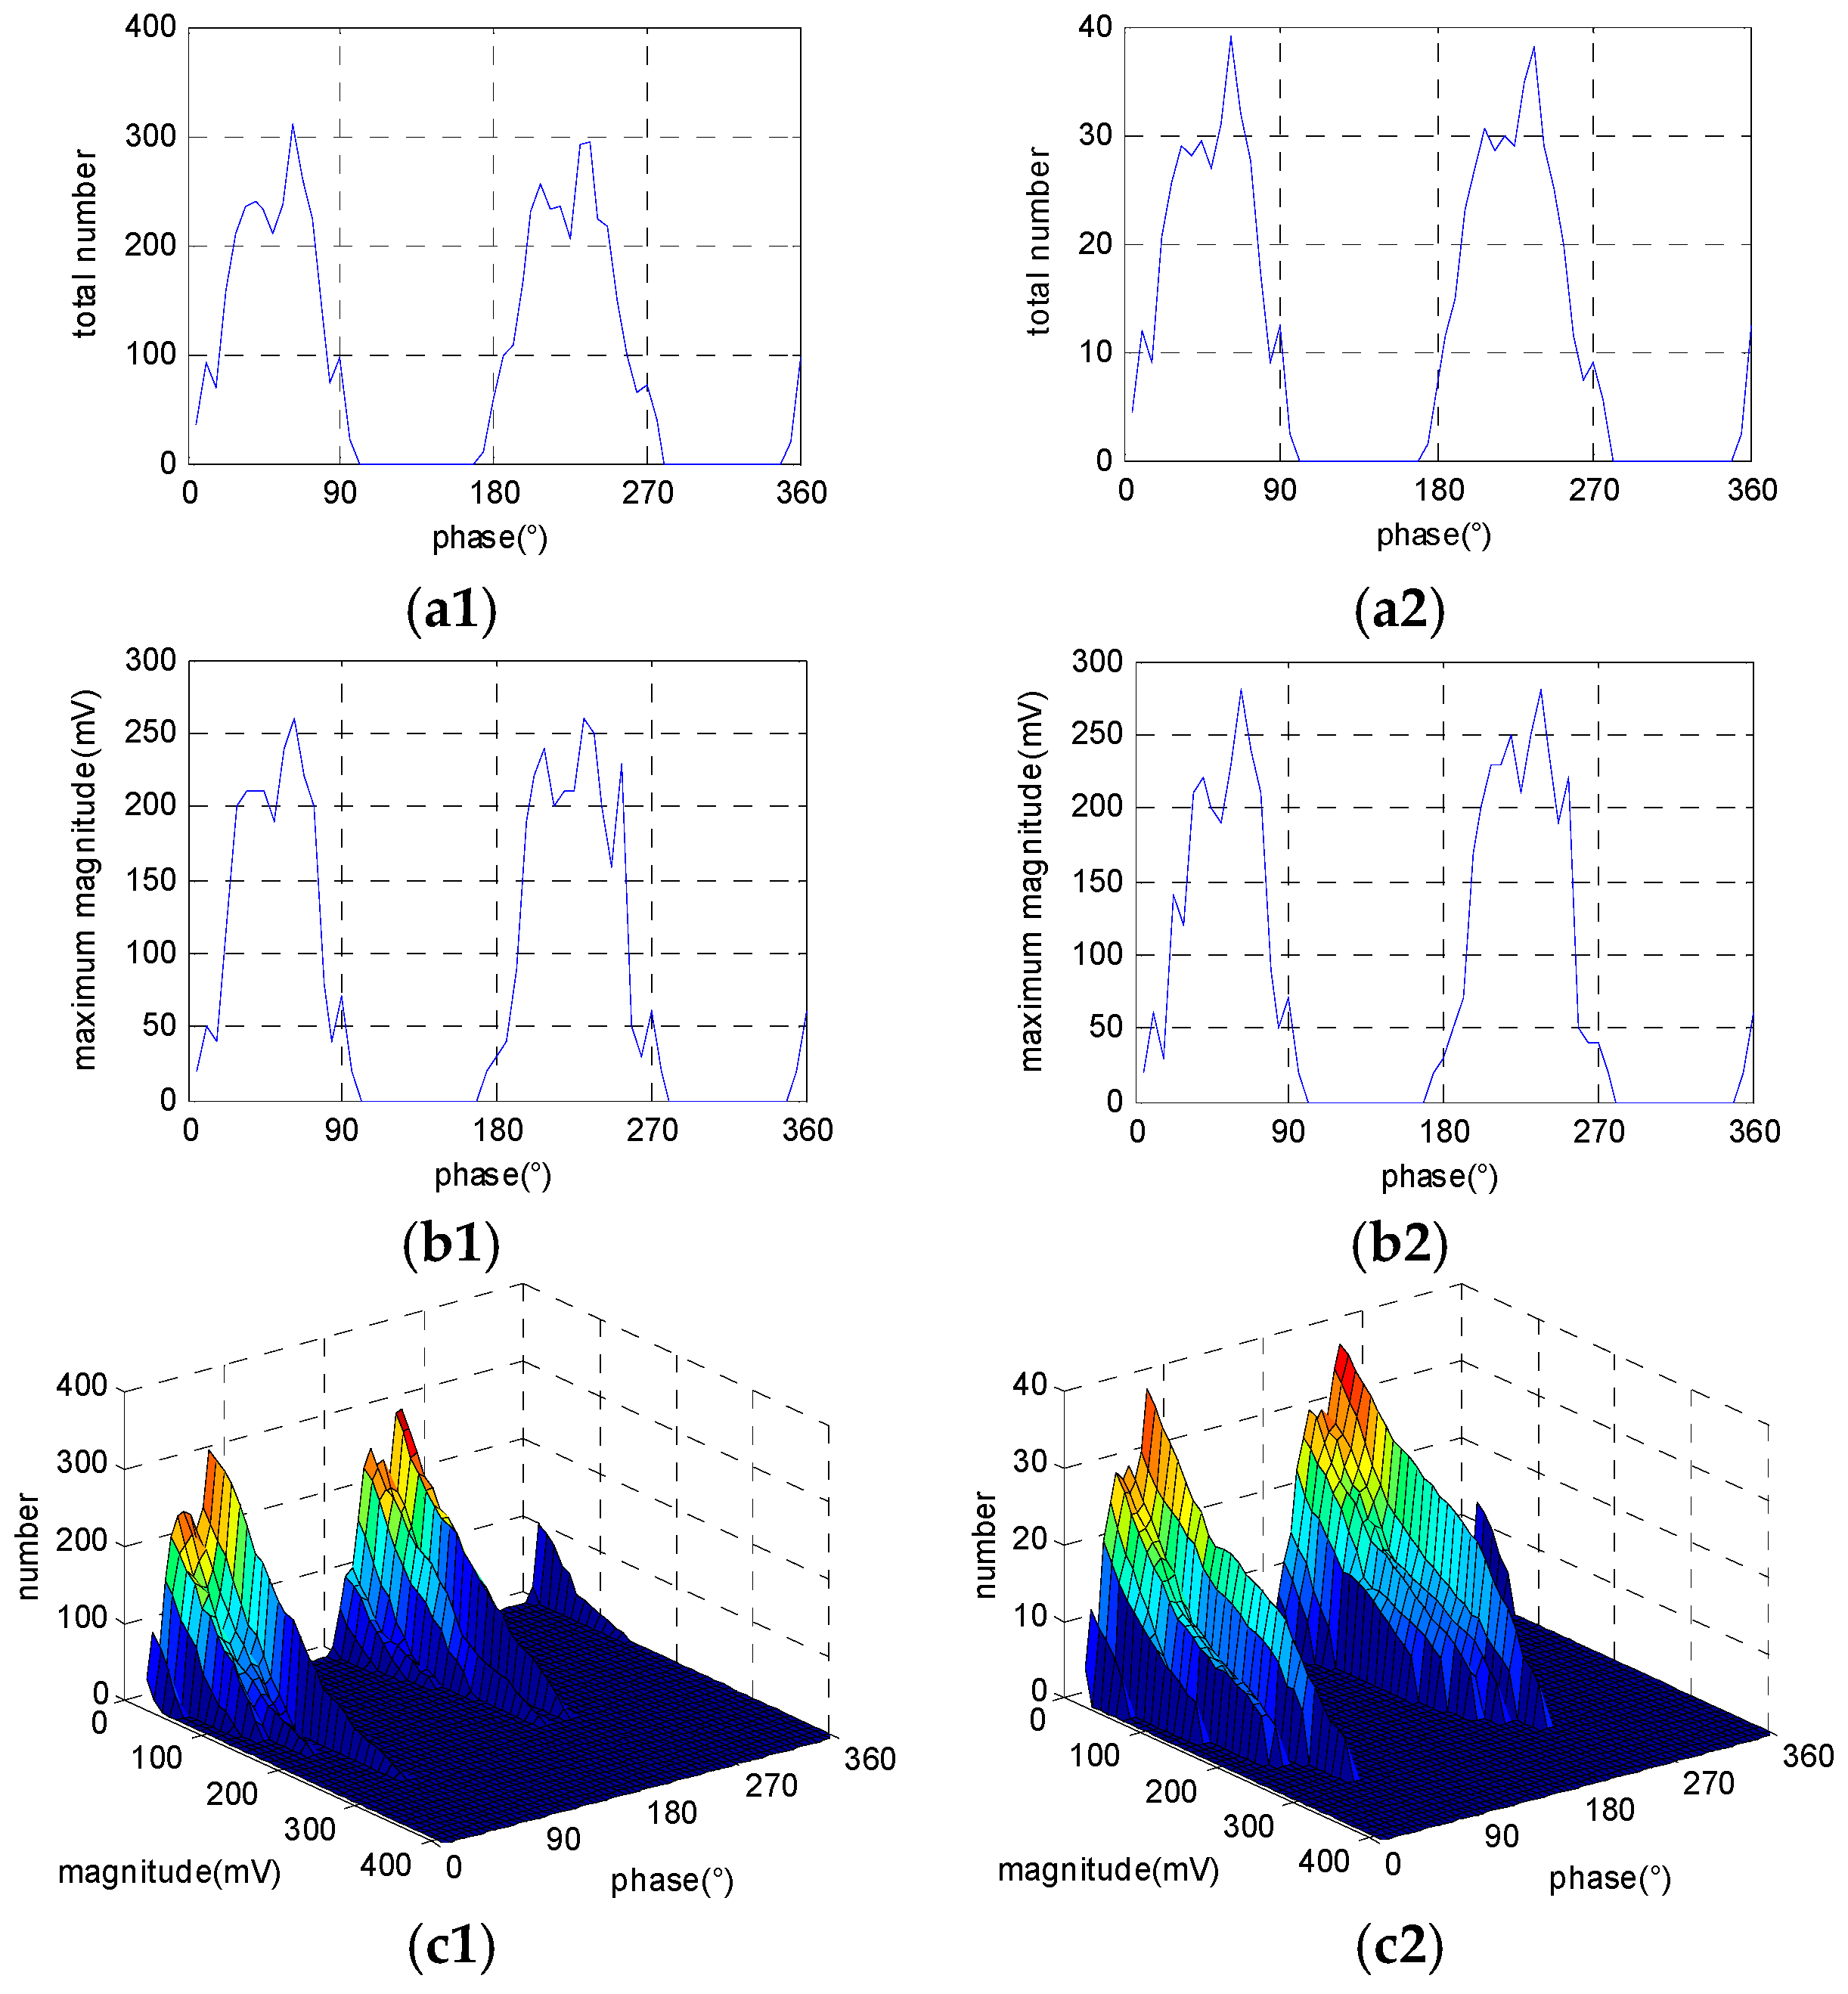
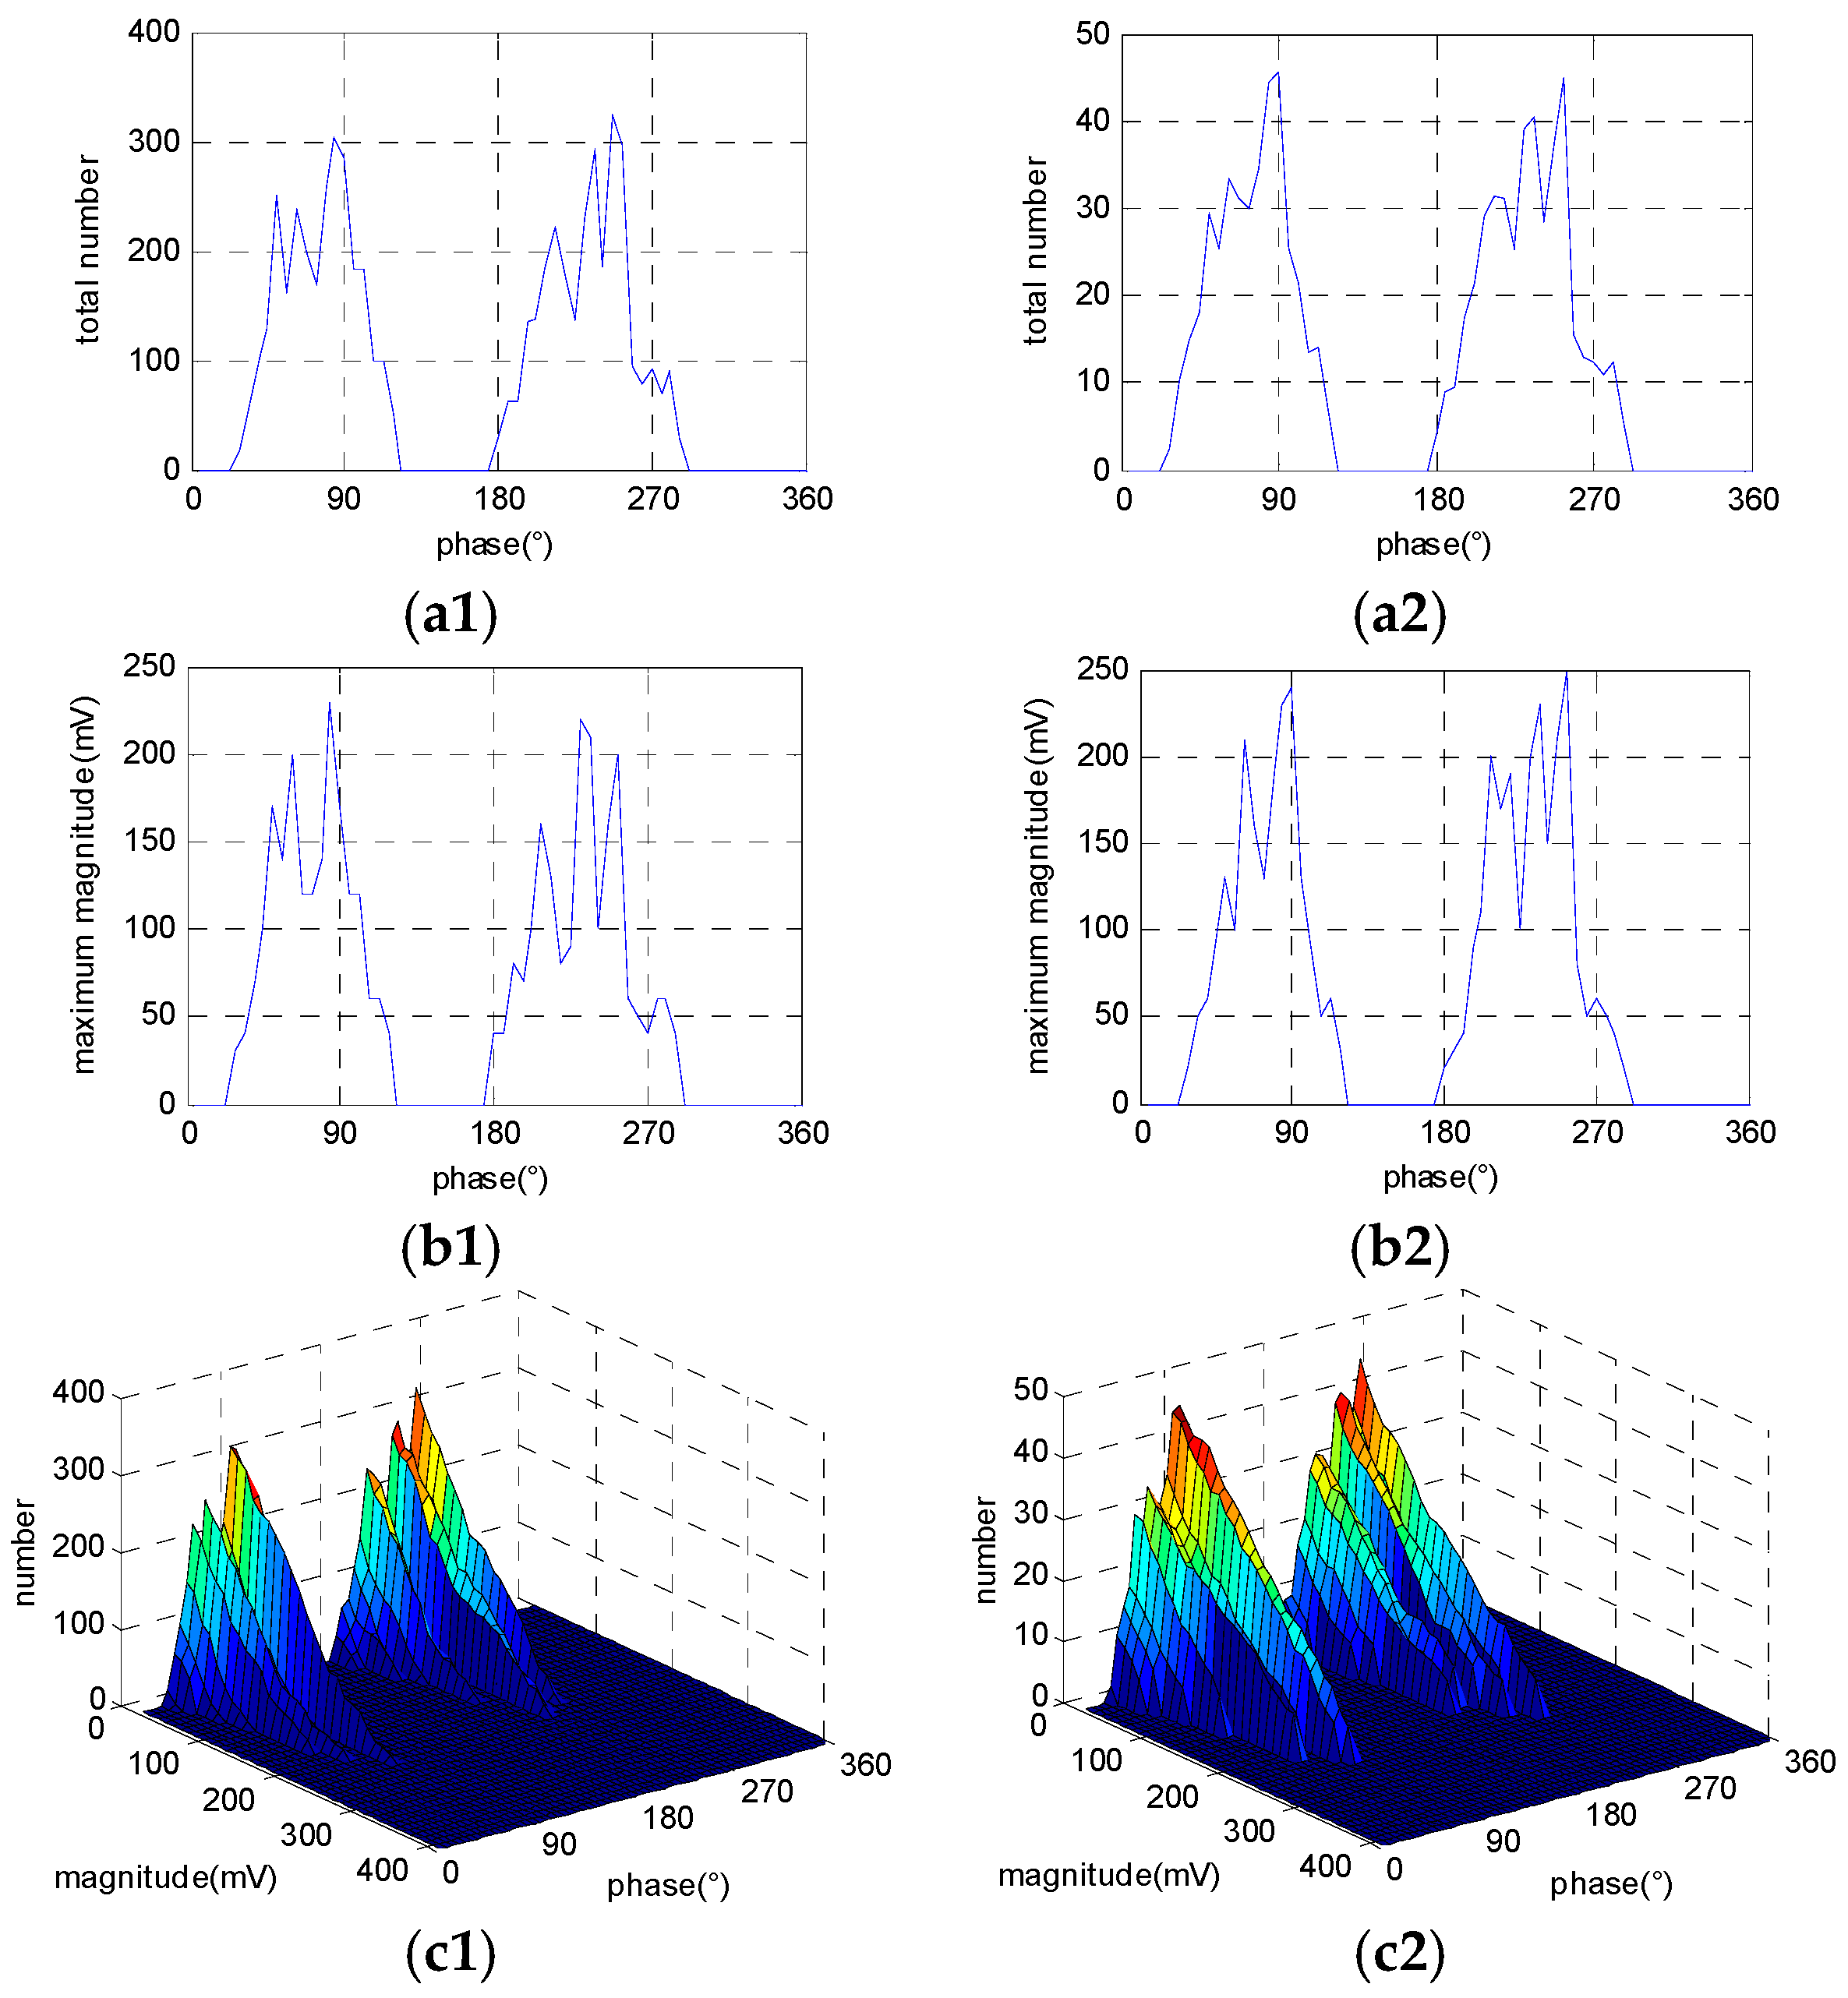
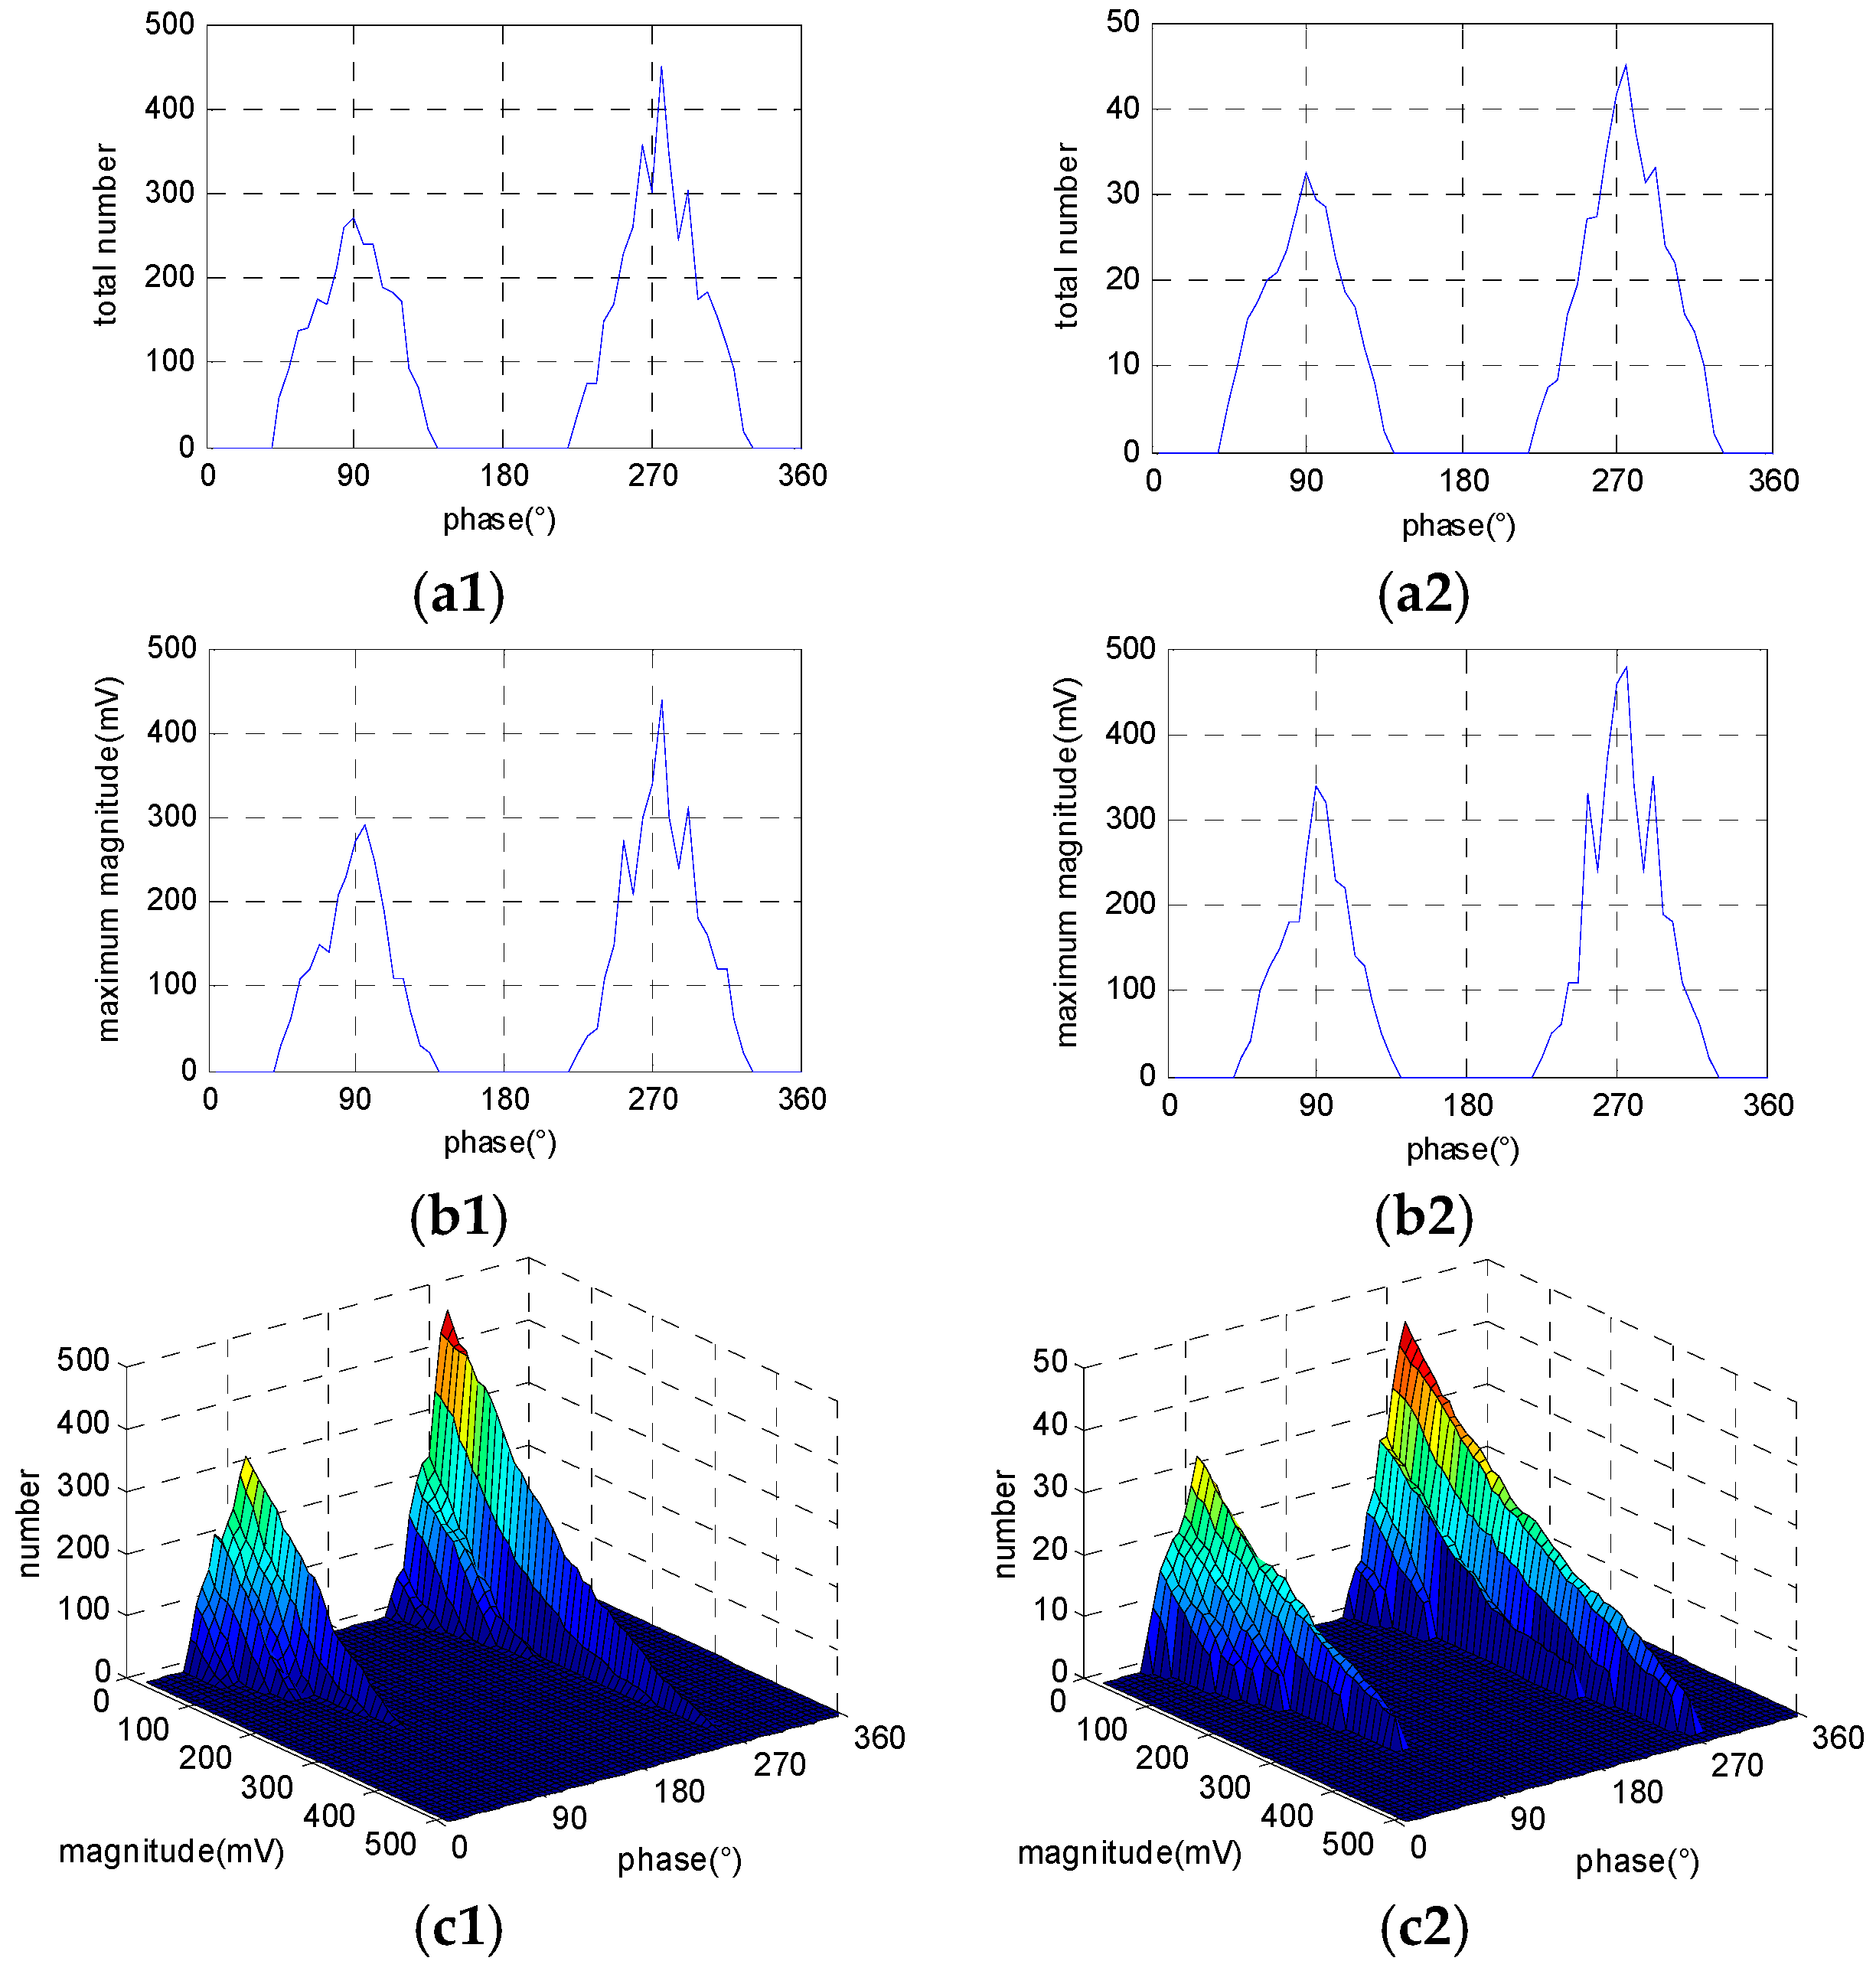
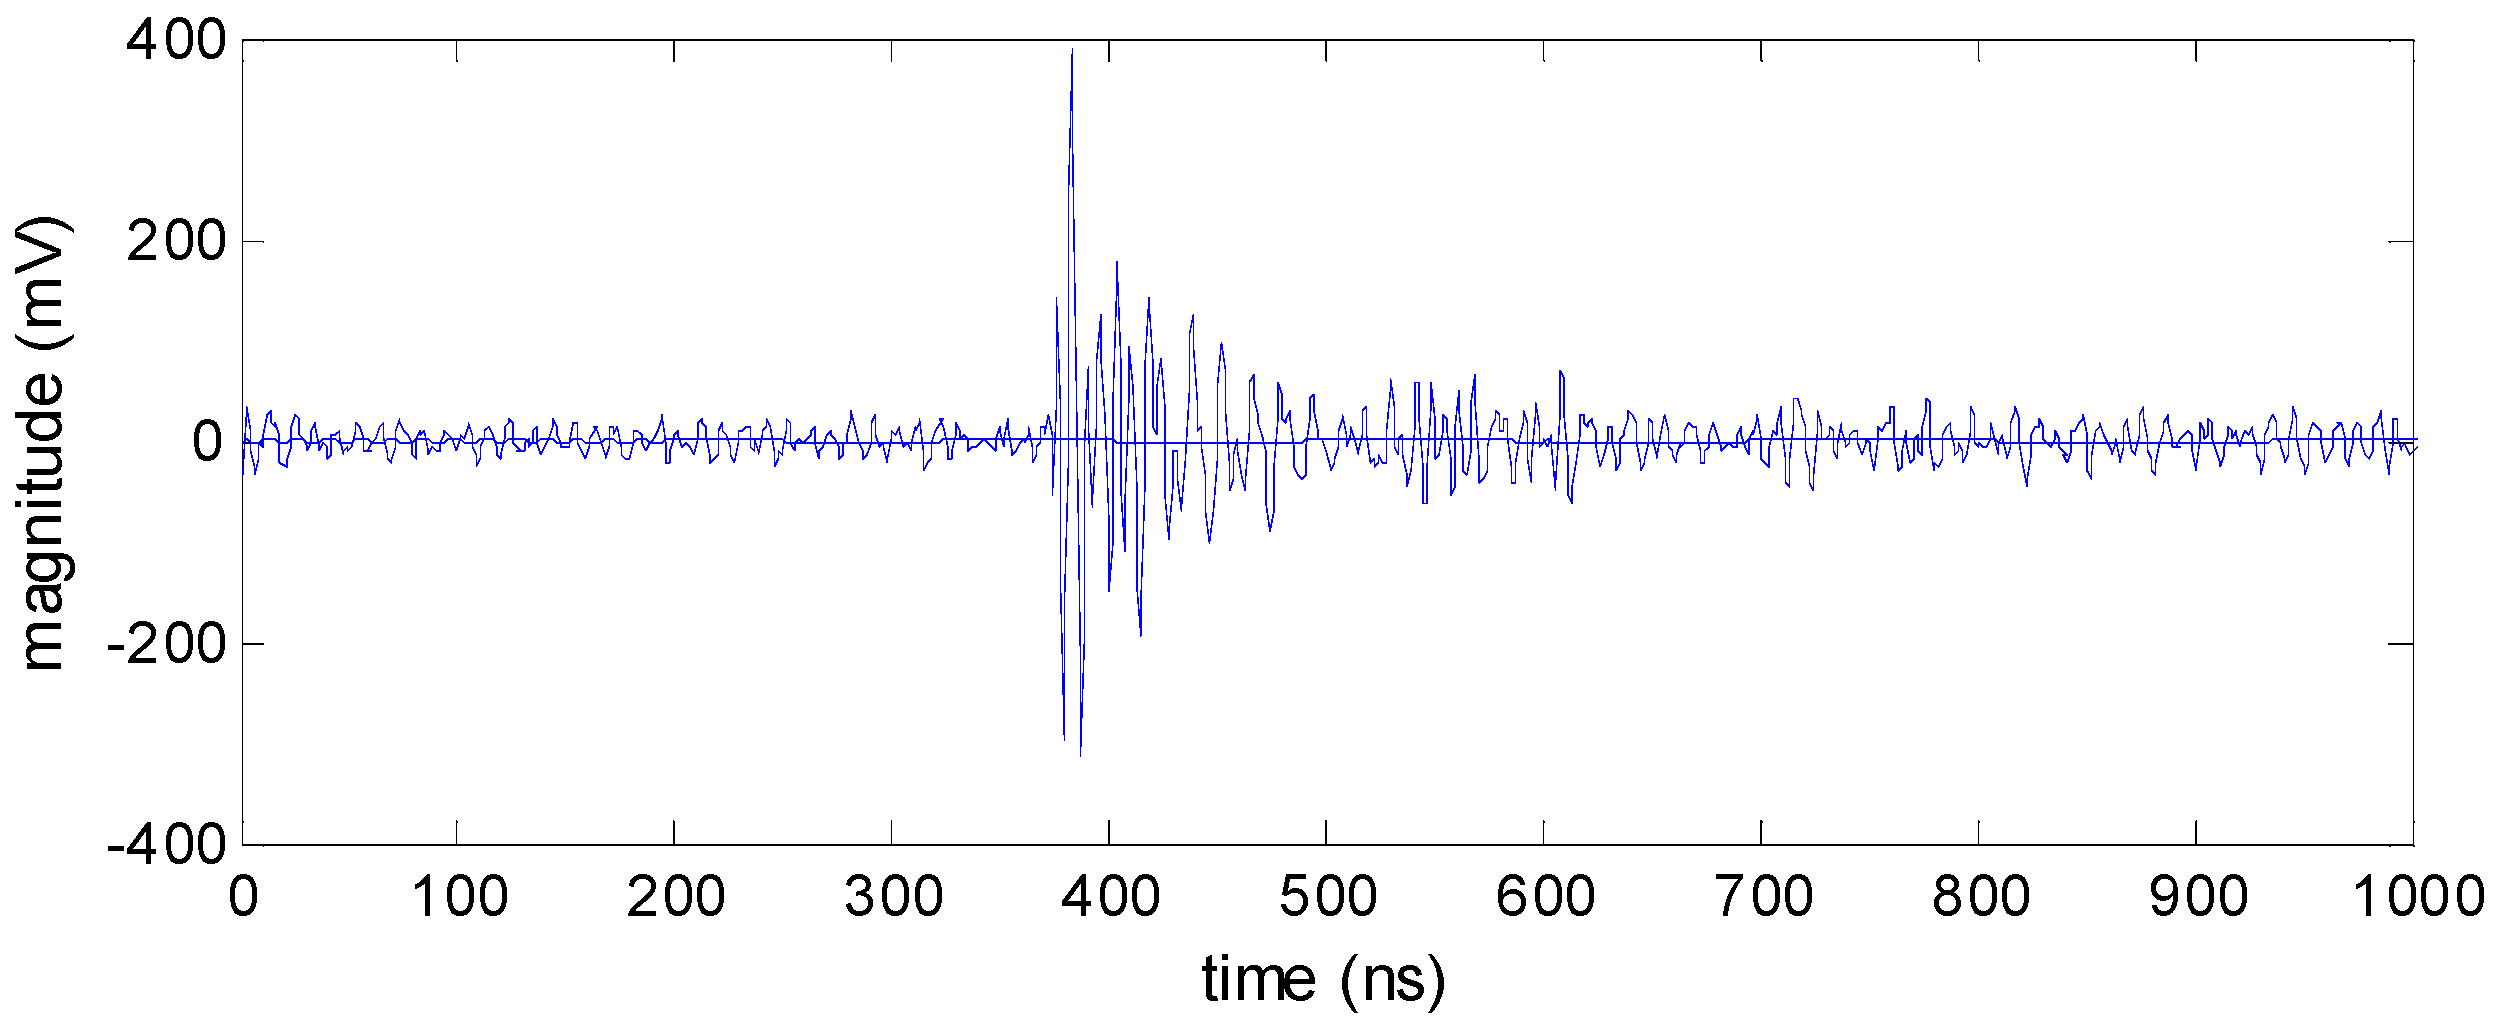
4.2. Results
5. Discussion
5.1. The Influence Factors of the Number of Discharges
5.2. Methods to Improve the Performance of the Intelligent Sensor
- Increase the gain of the amplifier. For a UHF PD signal, the width of the discharge pulse becomes larger after being amplified, and the larger the gain of the amplifier is, the greater the width of the discharge pulse is, which makes the discharge pulse easier to detect.
- Increase the scanning frequency of the FPGA. Woff of the proposed intelligent sensor is decided by the scanning frequency used to count the square wave in the FPGA; the smaller the Woff is, the more accurate the data is. This method can be realized with the rapid development of the FPGA in the future.
- Decrease the step of the reference level. According to the theory of the level scanning method, the detection accuracy of the magnitude will increase with the decrease in the step of the reference level, especially when the reference level is near the peak of the discharge pulse.
5.3. The Use of the Intelligent Sensor for Ultra-High-Frequency Partial Discharge Detection in Other Electrical Components
6. Conclusions
- A new method to directly acquire the statistical characteristic quantities of UHF PD, namely the level scanning method, is proposed.
- The corresponding data processing module of the level canning method was designed, and a prototype was made. Combined with the antenna designed in our previous work, the intelligent sensor was made.
- Actual UHF PD experiments with three typical artificial defect models of power transformers were carried out to verify the performance of the intelligent sensor in a laboratory, and the waveform recording method and the intelligent sensor proposed were simultaneously used for UHF PD measurement. The results show that the intelligent sensor can accurately acquire statistical characteristic quantities of the UHF PD signal, which indicates the proposed intelligent sensor is qualified for UHF PD online monitoring.
- In order to improve the accuracy of the intelligent sensor, three methods to improve the performance of the intelligent sensor are proposed according to the principle of the proposed level scanning method.
Acknowledgments
Author Contributions
Conflicts of Interest
References
- Barbieri, L.; Villa, A.; Malgesini, R. A step forward in the characterization of the partial discharge phenomenon and the degradation of insulating materials through nonlinear analysis of time series. IEEE Trans. Dielectr. Electr. Insul. 2012, 28, 14–21. [Google Scholar] [CrossRef]
- Kiiza, R.C.; Niasar, M.G.; Nikjoo, R.; Wang, X.; Edin, H. Change in partial discharge activity as related to degradation level in oil-impregnated paper insulation: Effect of high voltage impulses. IEEE Trans. Dielectr. Electr. Insul. 2014, 21, 1243–1250. [Google Scholar] [CrossRef]
- Sellars, A.G.; Farish, O.; Hampton, B.F.; Pritchard, L.S. Using the uhf technique to investigate PD produced by defects in solid insulation. IEEE Trans. Dielectr. Electr. Insul. 1995, 2, 448–459. [Google Scholar] [CrossRef]
- Haida, T.; Wakabayashi, S.; Tsuge, R.; Sakakibara, T. Development of partial discharge monitoring technique using a neural network in a gas insulated substation. IEEE Trans. Power Syst. 1997, 12, 1014–1021. [Google Scholar]
- Hikita, M.; Okabe, S.; Murase, H.; Okubo, H. Cross-equipment evaluation of partial discharge measurement and diagnosis techniques in electric power apparatus for transmission and distribution. IEEE Trans. Dielectr. Electr. Insul. 2008, 15, 505–518. [Google Scholar] [CrossRef]
- Jacob, N.D.; Mcdermid, W.M.; Kordi, B. On-line monitoring of partial discharges in a HVDC station environment. IEEE Trans. Dielectr. Electr. Insul. 2012, 19, 925–935. [Google Scholar] [CrossRef]
- Yao, C.G.; Zhou, D.B.; Chen, P.; Xing, L.; Sun, C.X. UHF-based monitoring for equipment PD within the substation and early warning. High Volt. Eng. 2011, 37, 1670–1676. [Google Scholar]
- Jiang, T.; Li, J.; Zheng, Y.; Sun, C. Improved bagging algorithm for pattern recognition in uhf signals of partial discharges. Energies 2011, 4, 1087–1101. [Google Scholar] [CrossRef]
- De Kock, N.; Coric, B.; Pietsch, R. UHF PD detection in gas-insulated switchgear-suitability and sensitivity of the UHF method in comparison with the IEC 270 method. IEEE Electr. Insul. Mag. 1996, 6, 20–26. [Google Scholar] [CrossRef]
- Wang, M.; Vandermaar, A.J.; Srivastava, K.D. Review of condition assessment of power transformers in service. IEEE Electr. Insul. Mag. 2002, 18, 12–25. [Google Scholar] [CrossRef]
- Chen, M.; Chen, J.; Cheng, C. Partial discharge detection by rf coil in 161 kv power transformer. IEEE Trans. Dielectr. Electr. Insul. 2014, 21, 1405–1414. [Google Scholar] [CrossRef]
- Zargari, A.; Blackburn, T.R. Application of optical fibre sensor for partial discharge detection in high-voltage power equipment. In Proceedings of the IEEE 1996 Annual Report of the Conference on Electrical Insulation and Dielectric Phenomena, Millbrae, CA, USA, 20–23 October 1996.
- Sharkawy, R.M.; Abdel-Galil, T.K.; Mangoubi, R.S.; Salama, M.M.; Bartnikas, R. Particle identification in terms of acoustic partial discharge measurements in transformer oils. IEEE Trans. Dielectr. Electr. Insul. 2008, 15, 1649–1656. [Google Scholar] [CrossRef]
- Tang, J.; Zhou, J.; Zhang, X.; Liu, F. A transformer partial discharge measurement system based on fluorescent fiber. Energies 2012, 5, 1490–1502. [Google Scholar] [CrossRef]
- Chen, W.; Chen, X.; Peng, S.; Li, J. Canonical correlation between partial discharges and gas formation in transformer oil paper insulation. Energies 2012, 5, 1081–1097. [Google Scholar] [CrossRef]
- Sima, W.; Jiang, C.; Lewin, P.; Yang, Q.; Yuan, T. Modeling of the partial discharge process in a liquid dielectric: effect of applied voltage, gap distance, and electrode type. Energies 2013, 6, 934–952. [Google Scholar] [CrossRef]
- Meijer, S.; Agoris, P.D.; Smit, J.J.; Judd, M.D.; Yang, L. Application of UHF diagnostics to detect PD during power transformer acceptance tests. In Proceedings of the Conference Record of the 2006 IEEE International Symposium on Electrical Insulation, Toronto, ON, Canada, 11–14 June 2006.
- Cleary, G.P.; Judd, M.D. UHF and current pulse measurements of partial discharge activity in mineral oil. IEE Proc. Sci. Meas. Technol. 2006, 153, 47–54. [Google Scholar] [CrossRef]
- Tenbohlen, S.; Denissov, D.; Hoek, S.M.; Markalous, S.M. Partial discharge measurement in the ultra-high frequency (UHF) range. IEEE Trans. Dielectr. Electr. Insul. 2008, 15, 1544–1552. [Google Scholar] [CrossRef]
- Yoshida, M.; Kojima, H.; Hayakawa, N.; Endo, F.; Okubo, H. Evaluation of UHF method for partial discharge measurement by simultaneous observation of UHF signal and current pulse waveforms. IEEE Trans. Dielectr. Electr. Insul. 2011, 18, 425–431. [Google Scholar] [CrossRef]
- Beltle, M.; Mueller, A.; Tenbohlen, S. Statistical analysis of online ultrahigh-frequency partial-discharge measurement of power transformers. IEEE Trans. Dielectr. Electr. Insul. 2012, 28, 17–22. [Google Scholar] [CrossRef]
- Wang, Y.; Wu, J.; Li, Z.; Yin, Y. Research on a practical de-noising method and the characterization of partial discharge UHF signals. IEEE Trans. Dielectr. Electr. Insul. 2014, 21, 2206–2216. [Google Scholar] [CrossRef]
- Judd, M.D.; Yang, L.; Hunter, I. Partial discharge monitoring for power transformers using UHF sensors Part 1: Sensors and signal interpretation. IEEE Electr. Insul. Mag. 2005, 21, 5–14. [Google Scholar] [CrossRef]
- Zhang, X.X.; Wang, Z.; Tang, J.; Liu, L.; Wei, Y. GIT partial discharge UHF on-line monitoring system. High Volt. Eng. 2010, 36, 1692–1697. [Google Scholar]
- Xie, Y.; Tang, J.; Zhang, X. Development of GIT partial discharge UHF online monitoring system. In Proceedings of the 2010 International Conference on High Voltage Engineering and Application (ICHVE), New Orleans, LA, USA, 11–14 October 2010.
- Capponi, G.; Schifani, R. Measurement of partial discharge in solid dielectrics with a microprocessor-based system. IEEE Trans. Dielectr. Electr. Insul. 1992, 27, 106–113. [Google Scholar] [CrossRef]
- Wang, G.; Hao, Y.; Peng, Y. Application of frequency mixing technique to ultra-high-frequency PD detection for transformers. Proc. CSEE 2013, 24, 115–120. [Google Scholar]
- Lixue, L.; Letian, T.; Chengjun, H. Envelope analysis and defects identification of partial discharge UHF signals in GIS. High Volt. Eng. 2009, 35, 260–265. [Google Scholar]
- Ye, H.; Qian, Y.; Dong, Y.; Sheng, G.; Jiang, X. Development of multi-band ultra-high-frequency sensor for partial discharge monitoring based on the meandering technique. IET Sci. Meas. Technol. 2014, 8, 327–335. [Google Scholar]
- Shibuya, Y.; Matsumoto, S.; Tanaka, M.; Muto, H.; Kaneda, Y. Electromagnetic waves from partial discharges and their detection using patch antenna. IEEE Trans. Dielectr. Electr. Insul. 2010, 17, 862–871. [Google Scholar] [CrossRef]
- Li, T.; Rong, M.; Zheng, C.; Wang, X. Development simulation and experiment study on UHF partial discharge sensor in GIS. IEEE Trans. Dielectr. Electr. Insul. 2012, 19, 1421–1430. [Google Scholar] [CrossRef]
- Li, J.; Jiang, T.; Wang, C.; Cheng, C. Optimization of UHF Hilbert antenna for partial discharge detection of transformers. IEEE Trans. Antennas Propag. 2012, 60, 2536–2540. [Google Scholar]
- Li, J.; Cheng, C.; Bao, L.; Jiang, T. Resonant frequency calculation and optimal design of peano fractal antenna for partial discharge detection. Int. J. Antennas Propag. 2012, 2012. [Google Scholar] [CrossRef]


| Reference Level | Phase Interval | |||
|---|---|---|---|---|
| 1 | 2 | … | j | |
| V1 | n11 | n12 | … | n1j |
| V2 | n21 | n22 | … | n2j |
| V3 | n31 | n32 | … | n3j |
| … | … | … | … | … |
| Vi−1 | n(i−1)1 | n(i−1)2 | … | n(i−1)j |
| Vi | ni1 | ni2 | … | nij |
| Defect Model | Incepetion Voltage (kV) | Breakdown Voltage (kV) | Test Voltage (kV) |
|---|---|---|---|
| Air-void discharge | 6.1 | 12.3 | 9.7 |
| Surface discharge | 8.4 | 13.2 | 10.5 |
| Corona discharge | 5.7 | 12.5 | 9.0 |
| Vt (mV) | f (MHz) | N1 | N2 | Voff (mV) | Woff (ns) |
|---|---|---|---|---|---|
| 1000 | 100 | 312,500 | 312,508 | 725 | 2.4184 |
| 1000 | 80 | 250,000 | 250,007 | 785 | 2.6583 |
| 1000 | 50 | 156,250 | 156,255 | 870 | 3.2824 |
| 500 | 100 | 312,500 | 312,510 | 390 | 2.0483 |
| 500 | 80 | 250,000 | 250,005 | 420 | 2.2819 |
| 500 | 50 | 156,250 | 156,253 | 450 | 2.8713 |
| 250 | 100 | 312,500 | 312,506 | 190 | 2.2520 |
| 250 | 80 | 250,000 | 250,003 | 210 | 2.2819 |
| 250 | 50 | 156,250 | 156,253 | 230 | 2.5638 |
© 2016 by the authors; licensee MDPI, Basel, Switzerland. This article is an open access article distributed under the terms and conditions of the Creative Commons Attribution (CC-BY) license (http://creativecommons.org/licenses/by/4.0/).
Share and Cite
Li, J.; Li, X.; Du, L.; Cao, M.; Qian, G. An Intelligent Sensor for the Ultra-High-Frequency Partial Discharge Online Monitoring of Power Transformers. Energies 2016, 9, 383. https://doi.org/10.3390/en9050383
Li J, Li X, Du L, Cao M, Qian G. An Intelligent Sensor for the Ultra-High-Frequency Partial Discharge Online Monitoring of Power Transformers. Energies. 2016; 9(5):383. https://doi.org/10.3390/en9050383
Chicago/Turabian StyleLi, Jian, Xudong Li, Lin Du, Min Cao, and Guochao Qian. 2016. "An Intelligent Sensor for the Ultra-High-Frequency Partial Discharge Online Monitoring of Power Transformers" Energies 9, no. 5: 383. https://doi.org/10.3390/en9050383