Article

Optimal Operation of Combined Photovoltaic Electrolyzer Systems

Electrical and Computer Engineering Department, Florida International University, Miami, FL 33174, USA
*
Author to whom correspondence should be addressed.
Energies 2016, 9(5), 332; https://doi.org/10.3390/en9050332
Submission received: 25 February 2016 / Revised: 12 April 2016 / Accepted: 18 April 2016 / Published: 30 April 2016
(This article belongs to the Special Issue Hydrogen Production, Separation and Applications)

Abstract

:
In this study, the design and simulation of a combination of a photovoltaic (PV) array with an alkaline electrolyzer is performed to maximize the production of hydrogen as a reliable power resource. Detailed electrical model of PV system, as long as thermal and electrochemical model of electrolyzer is used. Since an electrolyzer is a non-linear load, its coupling with PV systems to get the best power transfer is very important. Solar irradiation calculations were done for the region of Miami (FL, USA), giving an optimal surface slope of 25.7° for the PV array. The size of the PV array is optimized, considering maximum hydrogen production and minimum excess power production in a diurnal operation of a system using the imperialistic competitive algorithm (ICA). The results show that for a 10 kW alkaline electrolyzer, a PV array with a nominal power of 12.3 kW The results show that 12.3 kW photvoltaic system can be utilized for supplying a 10 kW electrolyzer. Hydrogen production and Faraday efficiency of the system are 697.21 mol and 0.3905 mol, respectively.

1. Introduction

The demand for environmentally-friendly renewable energy resources has been growing recently because of a decreasing demand for fossil fuels, and an increasing demand for power [1,2]. Among the various kinds of renewable power resources, wind and solar power are the best-known. The power sources of these systems are abundant, free, and environmentally friendly. Photovoltaic (PV) systems can be installed to generate electricity anywhere there is a suitable amount of solar irradiation, however, the irradiation is only available during the day. Additionally, this daily irradiation fluctuates with non-linear behavior because of unstable climatic conditions. Therefore, an energy storage system is needed to increase the reliability of solar systems. Batteries are good choices, however, their use for bulk power production during extended time periods has some issues. First, during operation, they have significant amounts of hourly power leakage, which makes them useless for long-term applications. Batteries are also not capable of storing large amounts of energy in commercial applications. There are other novel techniques, such as superconductivity, which have been developed in order to store and deliver power instantaneously [3,4,5,6,7,8]. Hydrogen is another suitable option because of its ability to work as a reliable fuel for almost every application, especially in transportation devices. Furthermore, hydrogen can be converted to electricity, and is able to heat more efficiently than fossil fuels [9,10,11,12,13]. Combining hydrogen fuel with other sources of energy makes the system more reliable, secure, and flexible with respect to different energy management techniques. One of the most environmentally-friendly and technically-mature procedures to produce hydrogen from electricity is by using an electrolyzer, which is able to operate in a large range of capacity with high efficiency, combined with various energy production sources [14,15]. The connection of a PV system to an electrolyzer is possible, either directly or by powered electronic devices [16]. However, with an optimal sizing of the system, the effects of lack of power of electronic devices can be minimized, which is beneficial in an economic point of view, making hydrogen fuel cost competitive with respect to conventional, commonly-used fuels.
Various studies have been done regarding the commercial, technological, techno-economical, and environmental aspects of this issue. Moreover, studies of different conditions of energy management procedures, with various scenarios about how to combine them to get the most efficient operation, have been performed [17].
In this study, generation of hydrogen with a stand-alone PV power system is evaluated. The model of components of the PV array, electrolyzer, and storage tank are described in details. The optimal sizing of the PV array is simulated and discussed. As the cost of the components of this system varies over time, another index for optimization is used, which is independent of time, but can also serve to describe the cost. The introduced index is based on maximum hydrogen production with a minimum excess of power production.

2. Analysis and Modeling

Detailed models of the PV system and electrolyzer are given, and the individual characteristics of the various components are discussed. The direct coupling of the components must be optimized in order to get the most of the produced power to the electrolyzer. A PV array generates the power needed for the electrolysis process in an alkaline electrolyzer. The PV system should be optimally sized in order to get as much hydrogen as possible from a 10-kW electrolyzer.

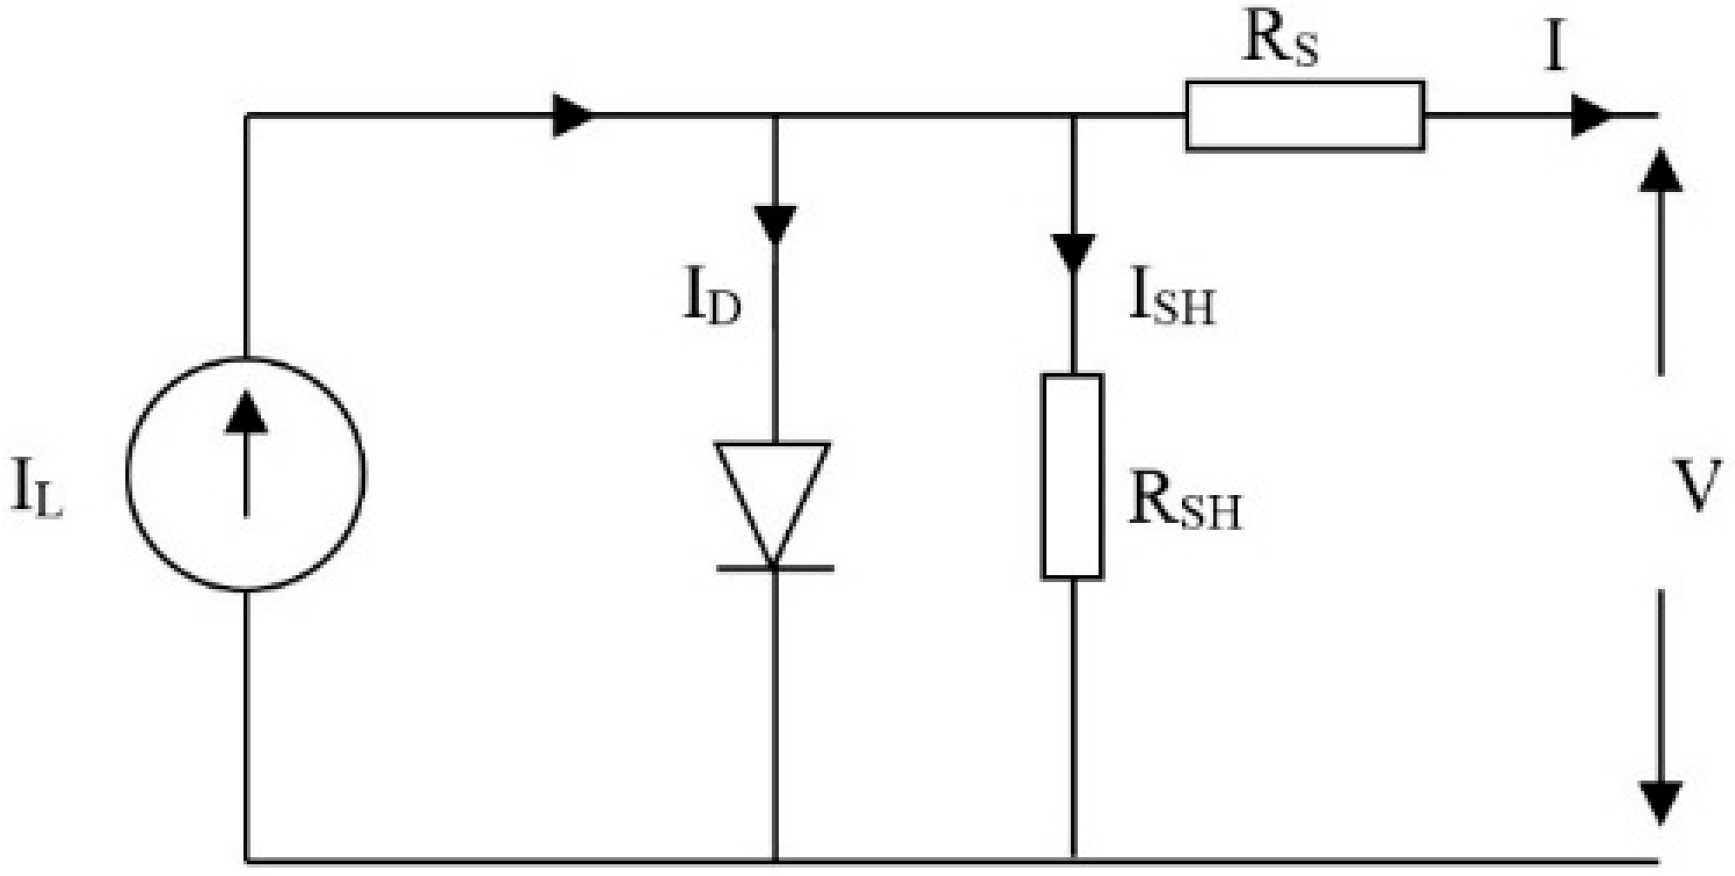
2.1. Photovoltaic System

The circuit diagram of a one-diode model of a PV cell is shown in Figure 1. The model can be described based on Kirchhoff’s current law [18,19].
As can be seen, the open-circuit voltages pattern is non-linear and the short-circuit current is directly proportional to the irradiance. During darkness, assuming that the reverse saturation current is negligible, the solar cell works as a diode, which is off, and produces neither voltage nor current. The determination of I-V characteristics of the cell by diode is given by Equation (1):
I = I L I D I SH
The characteristics of the PV system are tabulated in Table 1.
As derived from Equation (1), the difference between the generated current IL, from the shunt leakage current ISH, and diode current ID, gives the output current. ID is defined by:
I D = I 0 ( e q ( V + I R S ) A k T c 1 )
where I0 is the saturation current of a diode, q is the electronic charge (c), V is the solar cell terminal voltage, RS is the cell series resistance, A is the ideal factor of PV cell, k is the Boltzmann constant. Tc is the cells’ working temperature (K). The shunt leakage current can be obtained by:
I SH = V + I R S R SH
Shunt resistance is generated because of manufacturing defects causing power losses and therefore, the I-V curve of the PV is affected by the shunt resistance. It should be mentioned that at low voltages the effect of this resistance is intensified.

2.2. Electrolyzer

An electrolyzer is a device that can split hydrogen and oxygen, and form the water using electricity injected into it. The electrolyzer used in this study is an alkaline electrolyzer. The electrolyzer model is based on a combination of fundamental thermodynamics, heat transfer theory and empirical electrochemical relationships [20,21,22,23].

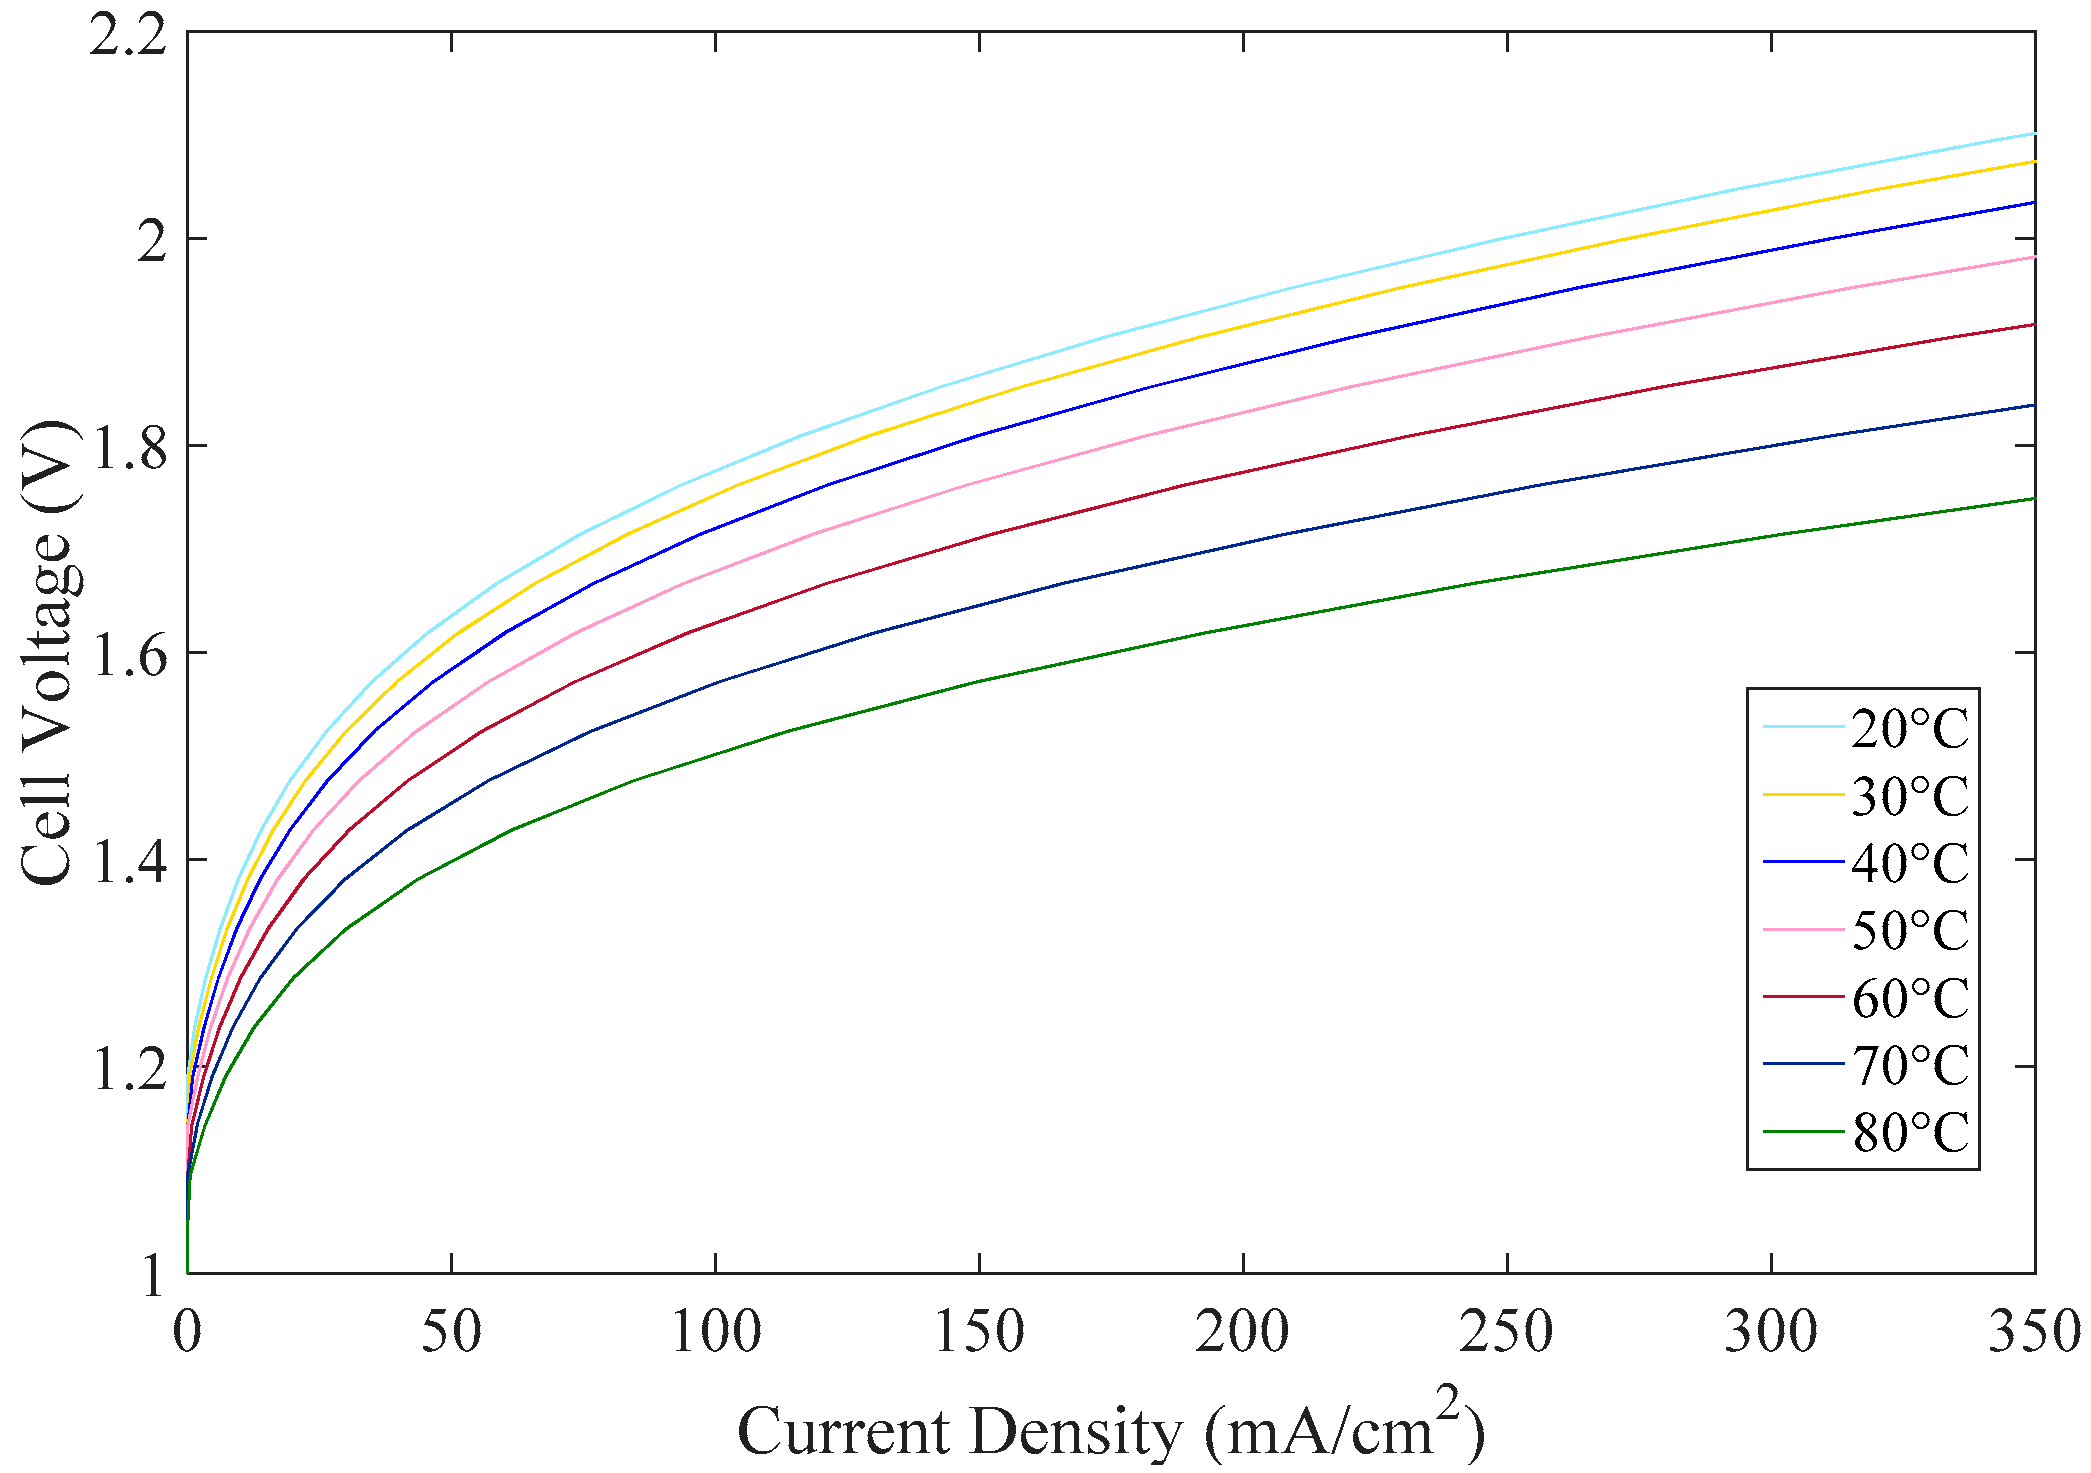
2.2.1. Electrochemical Model

In the operation of an electrolyser, the voltage of the cell is dependent on the three reversible, activation and ohmic overvoltages, as given by [20]:
U cell = U rev + U act + U ohm
The reversible voltage is the minimum electric voltage that must be delivered to the electrolyzer because of its chemical characteristics, based on the Gibbs equation as follows:
U rev = Δ G z F
where ∆G is the Gibbs energy which is 237.2 kJ/kmol, z is the number of electrons involved in the reaction which is 2, and F is the Faraday constant equal to 96,485 C/mol. Therefore, the reversible voltage for the alkaline electrolyzer is 1.229 V. Also, the activation and ohmic overvoltages can be determined by:
U act = s log ( t 1 + t 2 T + t 3 T 2 A I + 1 ) = s log ( t A I + 1 )
U ohm = r 1 + r 2 T A I = r A I
where ri is the ohmic resistance of the electrolyte (Ωm2), s and ti are electrode response overvoltage coefficients which are temperature dependent (V), (A−1m2°C ) [20]. The basic form of the U-I characteristic for a given temperature used in this study is expressed by:
U = U rev + r A I + s   log ( t A I + 1 )
where r is the ohmic resistance of electrolyte (Ωm2), s and t are overvoltage coefficients which are temperature dependent (V), (A−1m2°C). The parameters used in this study are given in Table 2.
Figure 2 shows the U-I characteristics of a typical alkaline electrolyzer at temperatures of 20 °C and 80 °C. The difference between the curves is caused because of temperature dependence of the overvoltages, so when the temperature rises, the current increases drastically. However, the parasitic bulbs of the can affect the current in very high temperatures [24,25,26].
The actual amount of hydrogen production is less than the theoretical one due to Faraday efficiency which is the ratio of actual hydrogen production to theoretical amount. An empirical expression to depict the Faraday efficiency is given by:
η F = ( I / A ) 2 f 1 + ( I / A ) 2 f 2
where f1 (mA2cm−4), and f2 are parameters in the Faraday efficiency calculation. The Faraday efficiency parameters at 60 °C are given in Table 3.
The hydrogen production rate for several cells connected in series is expressed by:
n ˙ H 2 = η F n c I 2 F
where nc is the number of cells in the series.

2.2.2. Thermal Model

The operating temperature of an electrolyzer affects its performance. The variation of the temperature is caused by the difference in generated heat, less heat loss and cooling. In other words, as experimentally shown in [27,28], the cell performance increases with a corresponding increase in temperature as a result of reduced reversible potential, kinetic loss and ohmic loss. The overall thermal energy balance is expressed by:
C t d T d t = Q ˙ gen   Q ˙ loss Q ˙ cool

2.3. Storage

The storage of hydrogen is greatly affected by the choice of storage conditions, which include but are not limited to, storage pressure, the attainable volumetric density under that pressure, and the amount of thermal losses that accompany the mode of storage [29]. Physical hydrogen storage is a common technique to store hydrogen using tanks. The model of a storage system which calculates tank pressure using the flow rate of produced hydrogen is expressed by [30,31]:
P b P bi = z n H 2 R T b M H 2 V b
where MH2 is the molar mass of hydrogen (kg·kmol−1), Pb is the pressure of tank (Pa), Pbi is the initial pressure of the storage tank (Pa), R is the universal gas constant (J·kmol−1 K−1), Tb is the operating temperature (K), Vb is the volume of the tank (m3), z is the compressibility factor as a function of the temperature of the storage tank.

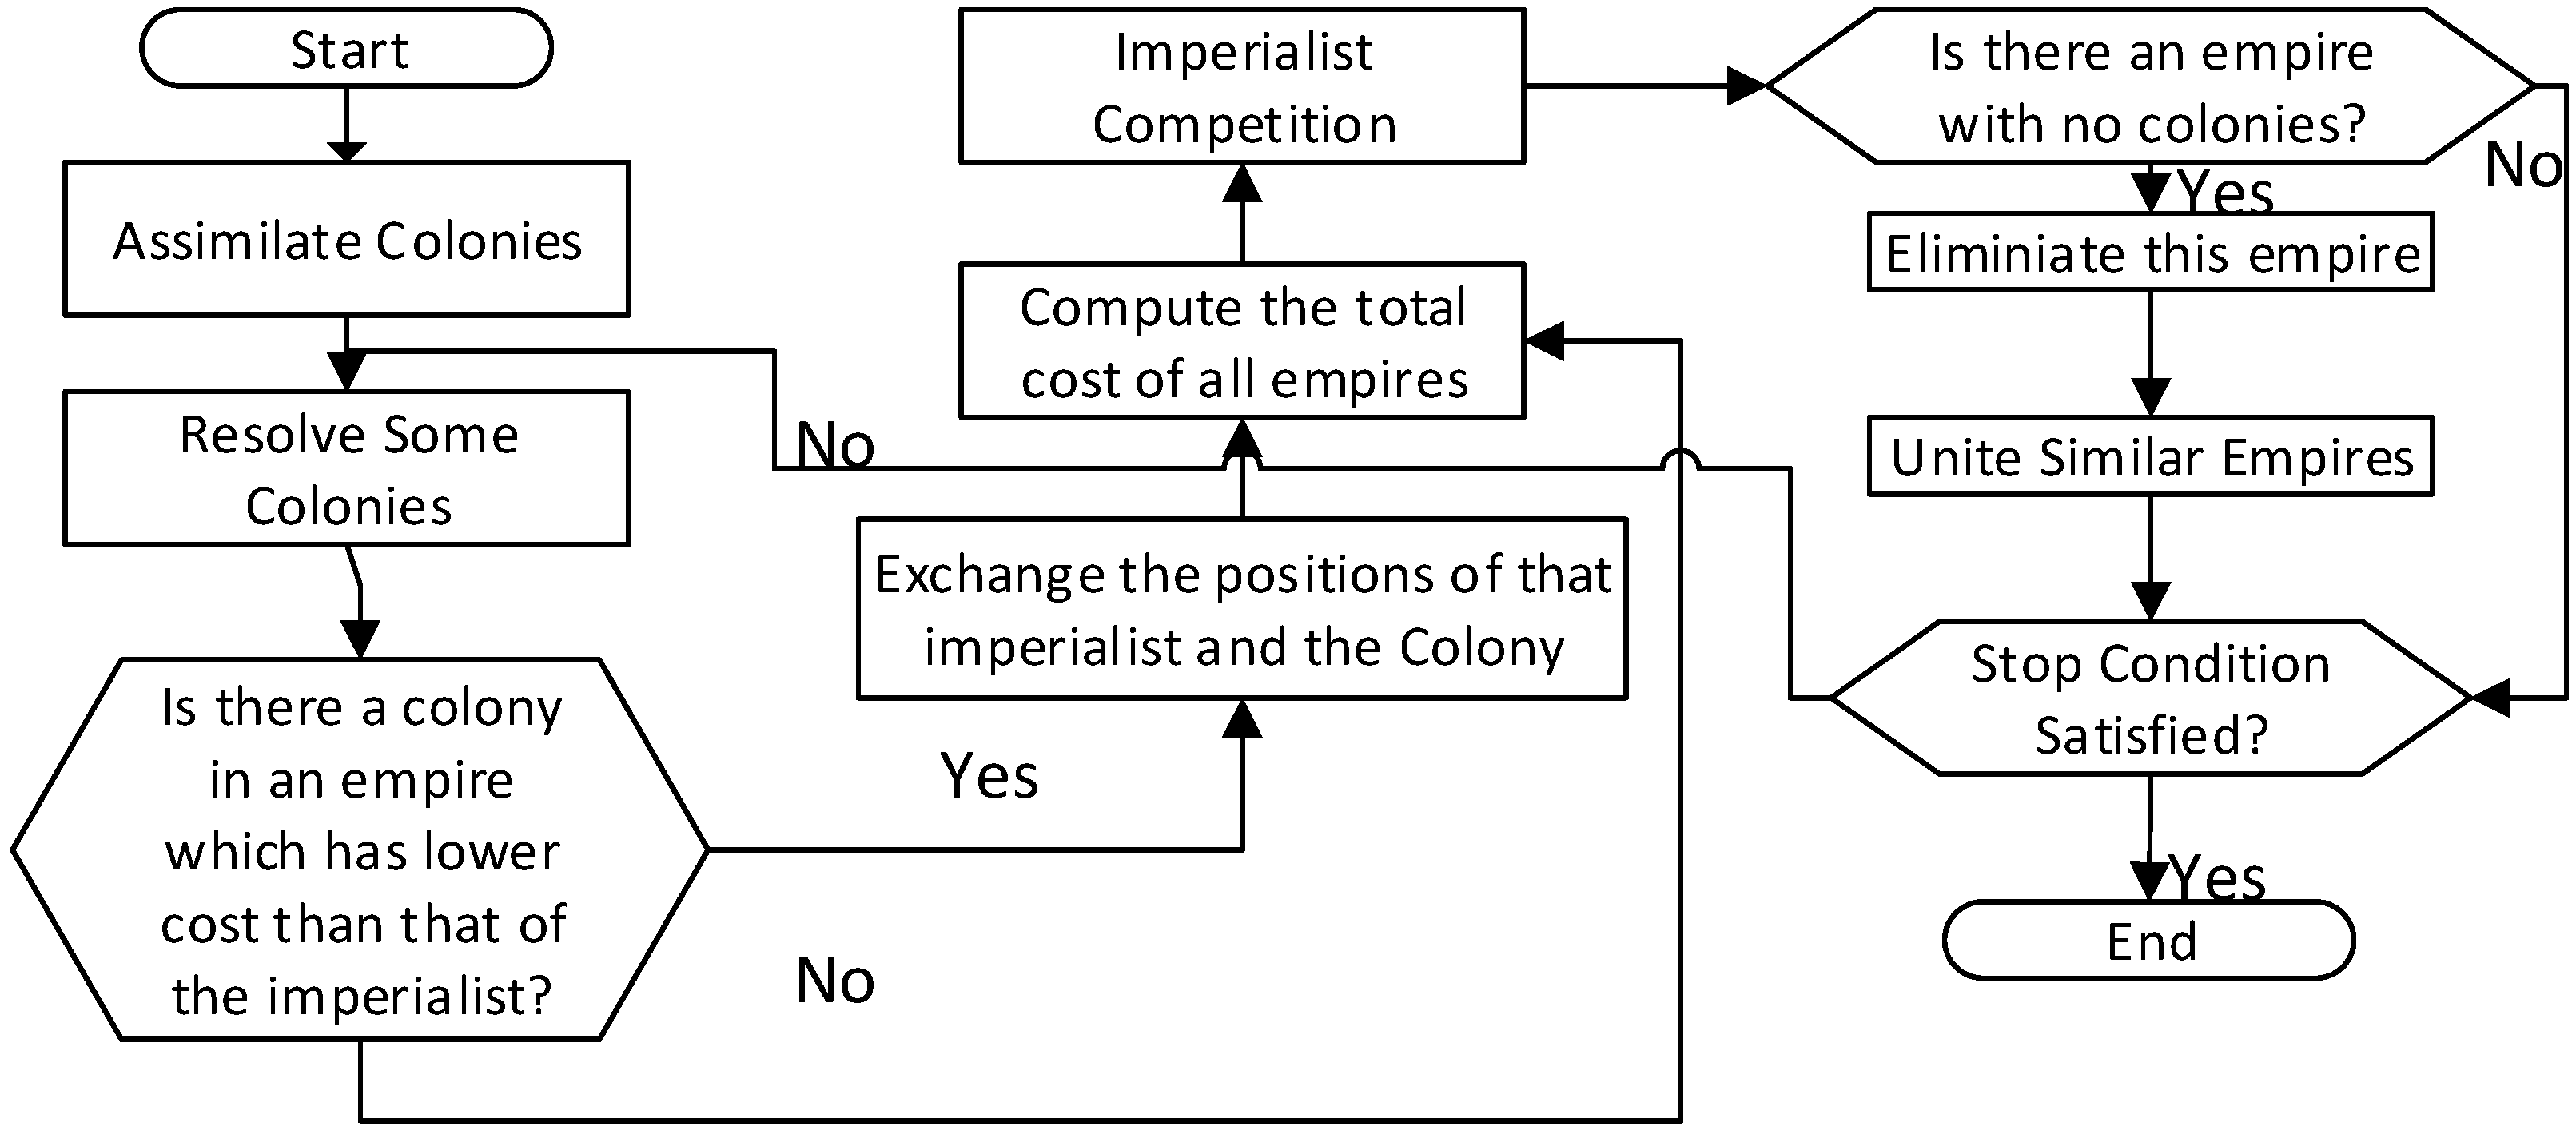
3. Imperialist Competitive Algorithm

The primary objective of this paper to estimate the optimal size of the PV subsystem, taking into account the efficiency of the electrolyzer as well, which are most directly determined by maximal hydrogen production and minimal excess power generation. Most recently, meta-heuristic-based optimization algorithms inspired by biological phenomena and natural occurrences have been proven to perform much better in comparison with other widely available algorithms [32,33,34]. One immensely useful addition to this arsenal is the imperialistic competitive algorithm (ICA), which does not require the function gradient (or slope) during its optimization process. While GA views the problem as a biological evolution problem, the ICA views the problem as a socio-economic evolution specific to human civilization, which was witnessed at the dawn of industrial revolution and consequential imperialistic gains.
Having a good search capacity in addition to a powerful exploitation strategy renders this method very advantageous in identifying the global optimal solution [35]. Figure 3 shows the generic flowchart of the ICA, wherein the optimization commences by generating a candidate set of random solutions in the search space of the defined problem.
This set of random points is called “countries”, which are essentially analogous to the “chromosomes” in GA and “particles” in PSO [35]. Like every optimization problem, this is fundamentally built on a cost function as its primary objective as well. However, here, the cost function is contextually associated with the “imperialistic power of a country”. Since minimizing the cost is the goal of the objective function, the optimization works towards the “countries” with lower cost (and hence greater power) “acquiring” or “annexing” the “countries” with higher cost (and hence lower power, called “colonies”) into their space, called “empires” [37,38]. As can be seen from the flowchart, the ICA has two major operators: assimilation and revolution, both of which are antagonistic yet complementary to each other. While assimilation deals with the process of “annexation” of “colonies” to “countries”, thereby progressing the solution closer to the intended objective, revolution introduces sudden randomness in the process by altering the positions of some “countries” in the search space. Hence, the continuous operations of assimilation and revolution might transform a “colony” into a “country”, enabling it to acquire an entire “empire”. The optimization can also be viewed as a game wherein there is a constant struggle between the different “countries” and “colonies” and within the “countries” as well, to attain the greatest “empire”, that is, the least cost. Like other optimization strategies in this area, ICA is also iterative in nature. After a series of assimilation, revolution and games (also called competitions), the algorithm reaches its stop condition when the objective is satisfied. Provided below in Table 4 is a brief pseudocode of the generic ICA [39], following which, in Table 5, the pseudocode for the ICA specific to the proposed method is provided.
This forms the setup for further competition to happen between the different imperialists wherein each imperialist has the goal of maximizing the power by adding as many colonies as possible. Thus in the process, those empires that lose all of their colonies to others collapse and are weeded out of the optimization problem. In the final state, the colonies and imperialists will all have the same power.

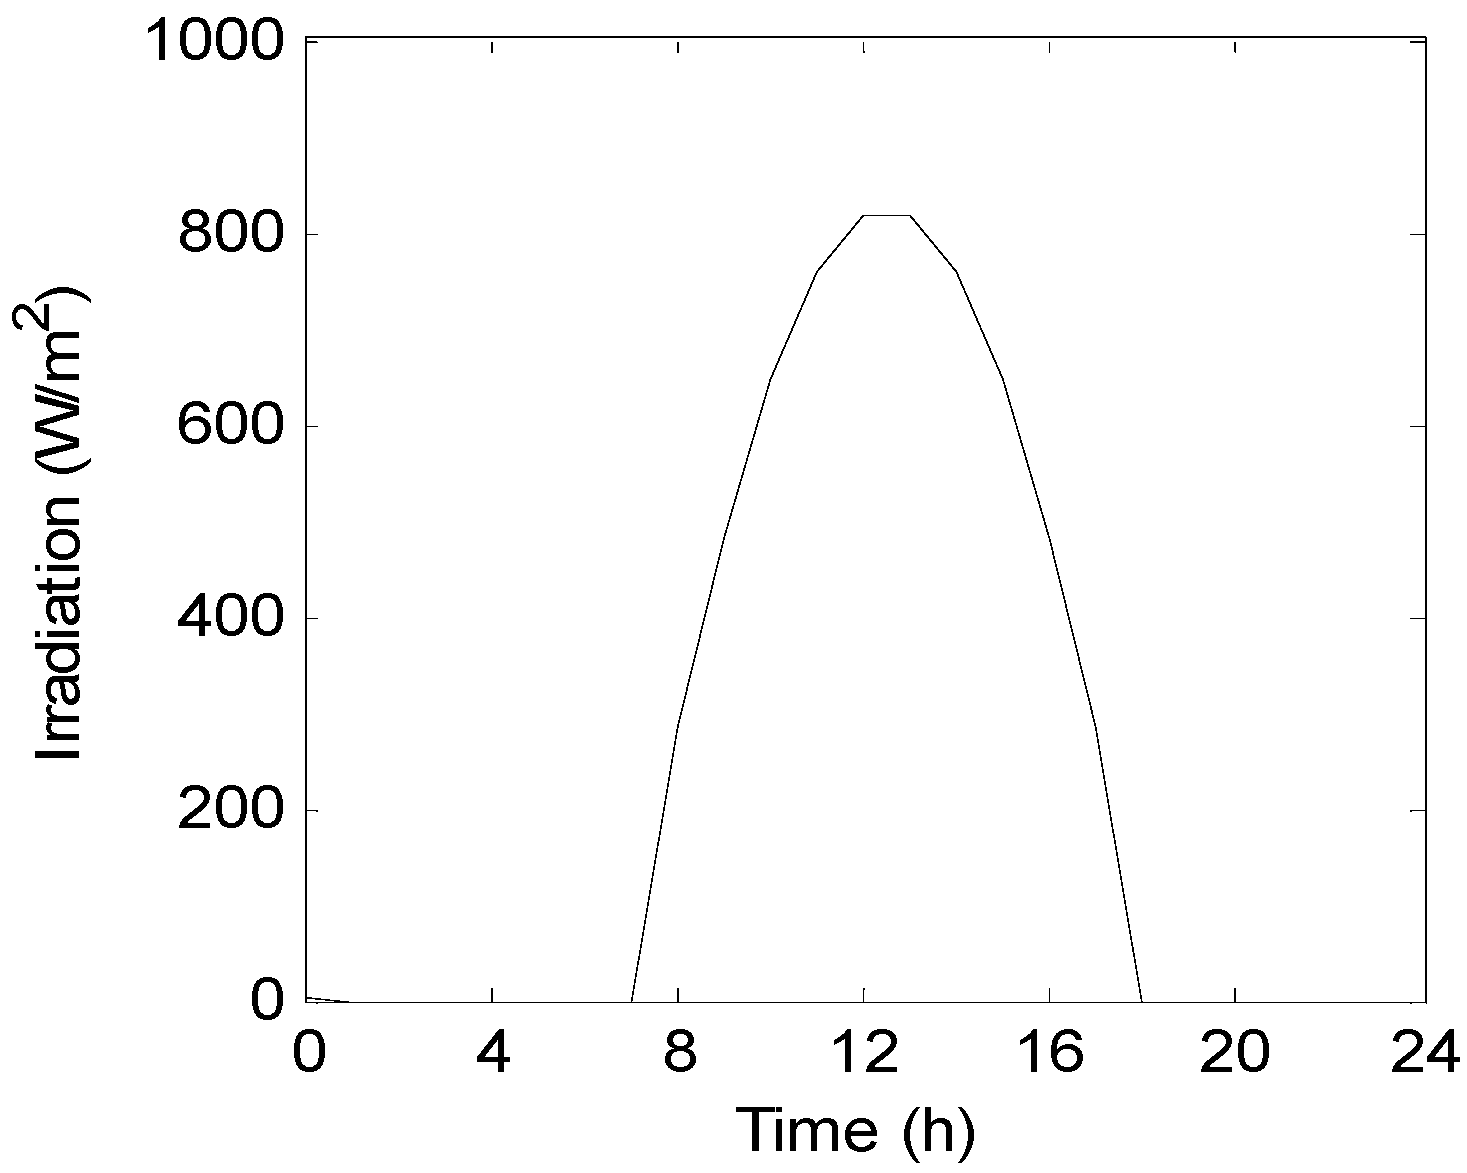
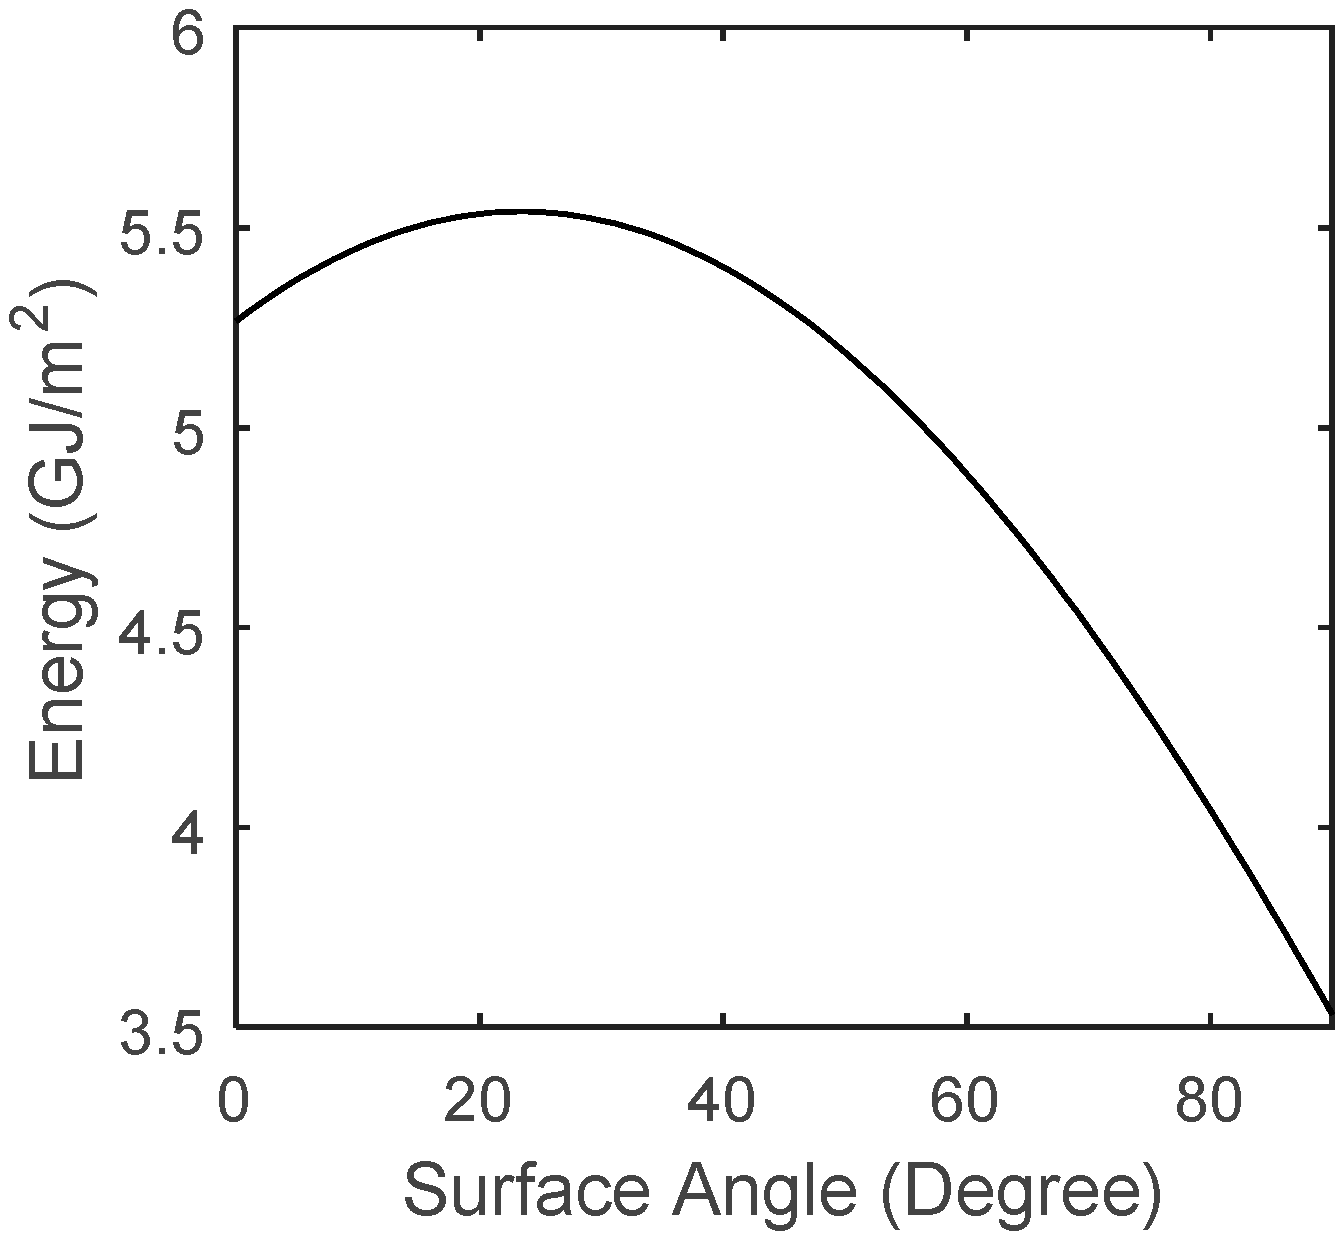
4. Solar Calculation

Total hourly radiation on a tilted surface is given by:
I T = I b R b + I d,iso F c-s + I d,cs R b + I d,hz F c-hz + I ρ g F c-g
where Ib and Id are the beam and diffuse irradiations, respectively. Rb is the geometric factor which is the ratio of beam radiation on a tilted surface to that on a horizontal surface at any time. Further, F is the view factor in which the subscripts “c-s”, “c-hz”, and “c-g” designate cell to sky, cell to horizon, and cell to ground, respectively. The integration of total hourly radiation for one year can give the optimal surface angle. Figure 4 shows the annual radiation for Miami (FL, USA). As it can be seen, the maximum energy is absorbed when the angle is 25.7° which is equal to latitude of the region. Also, the surface azimuth angle should be zero, making the tilts always directed to south.

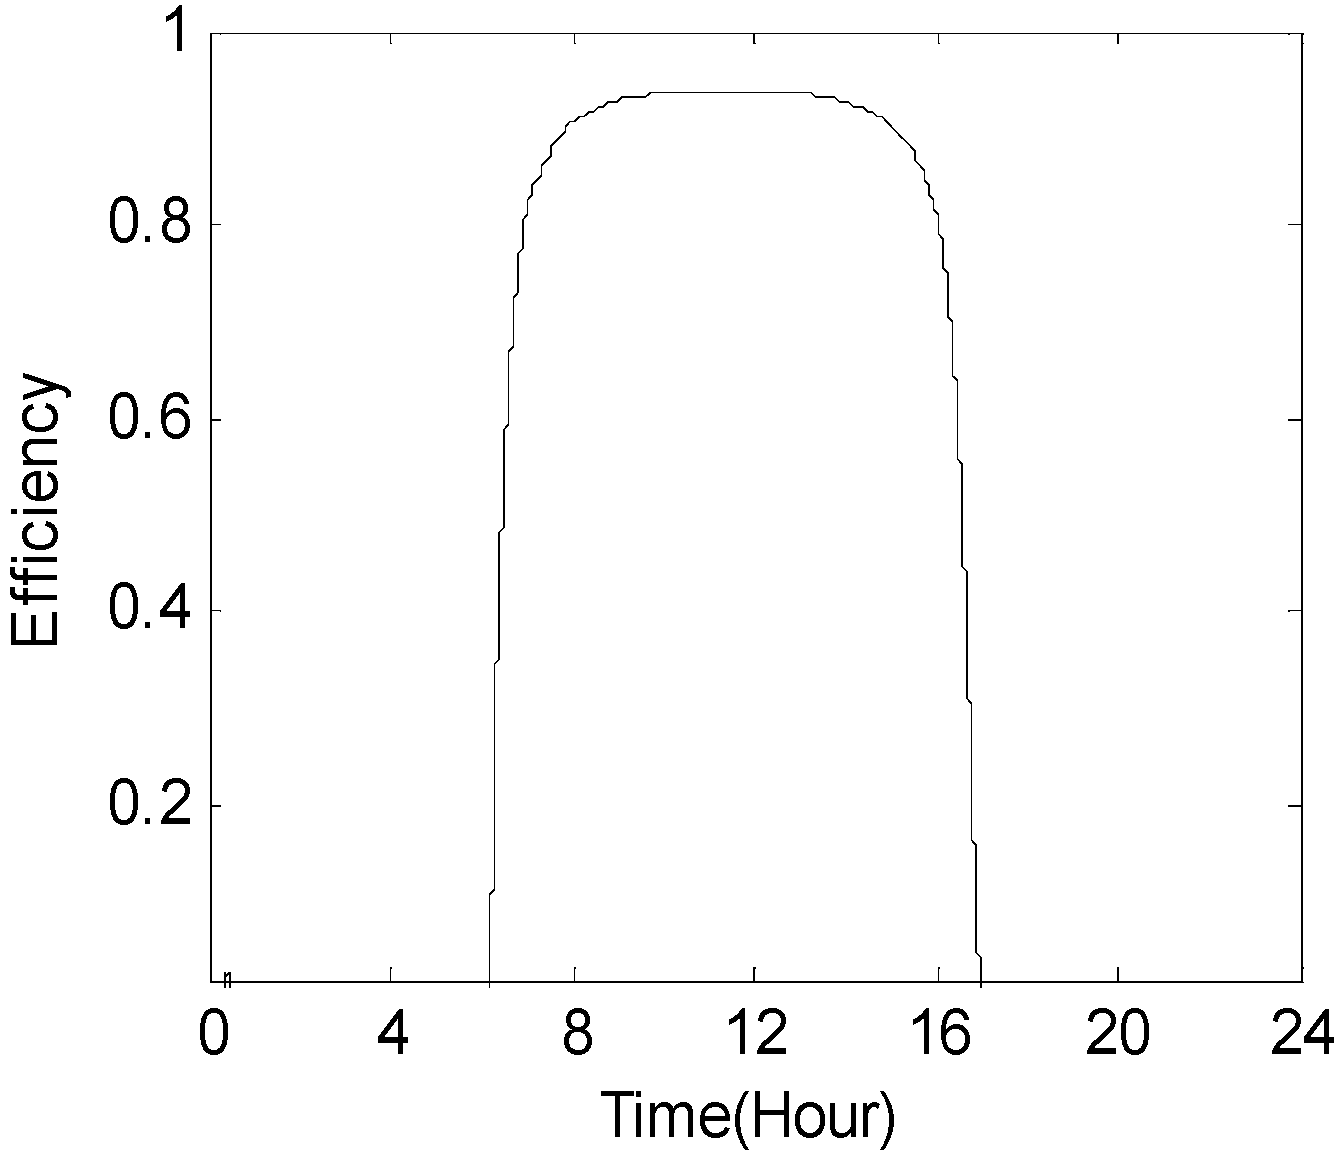
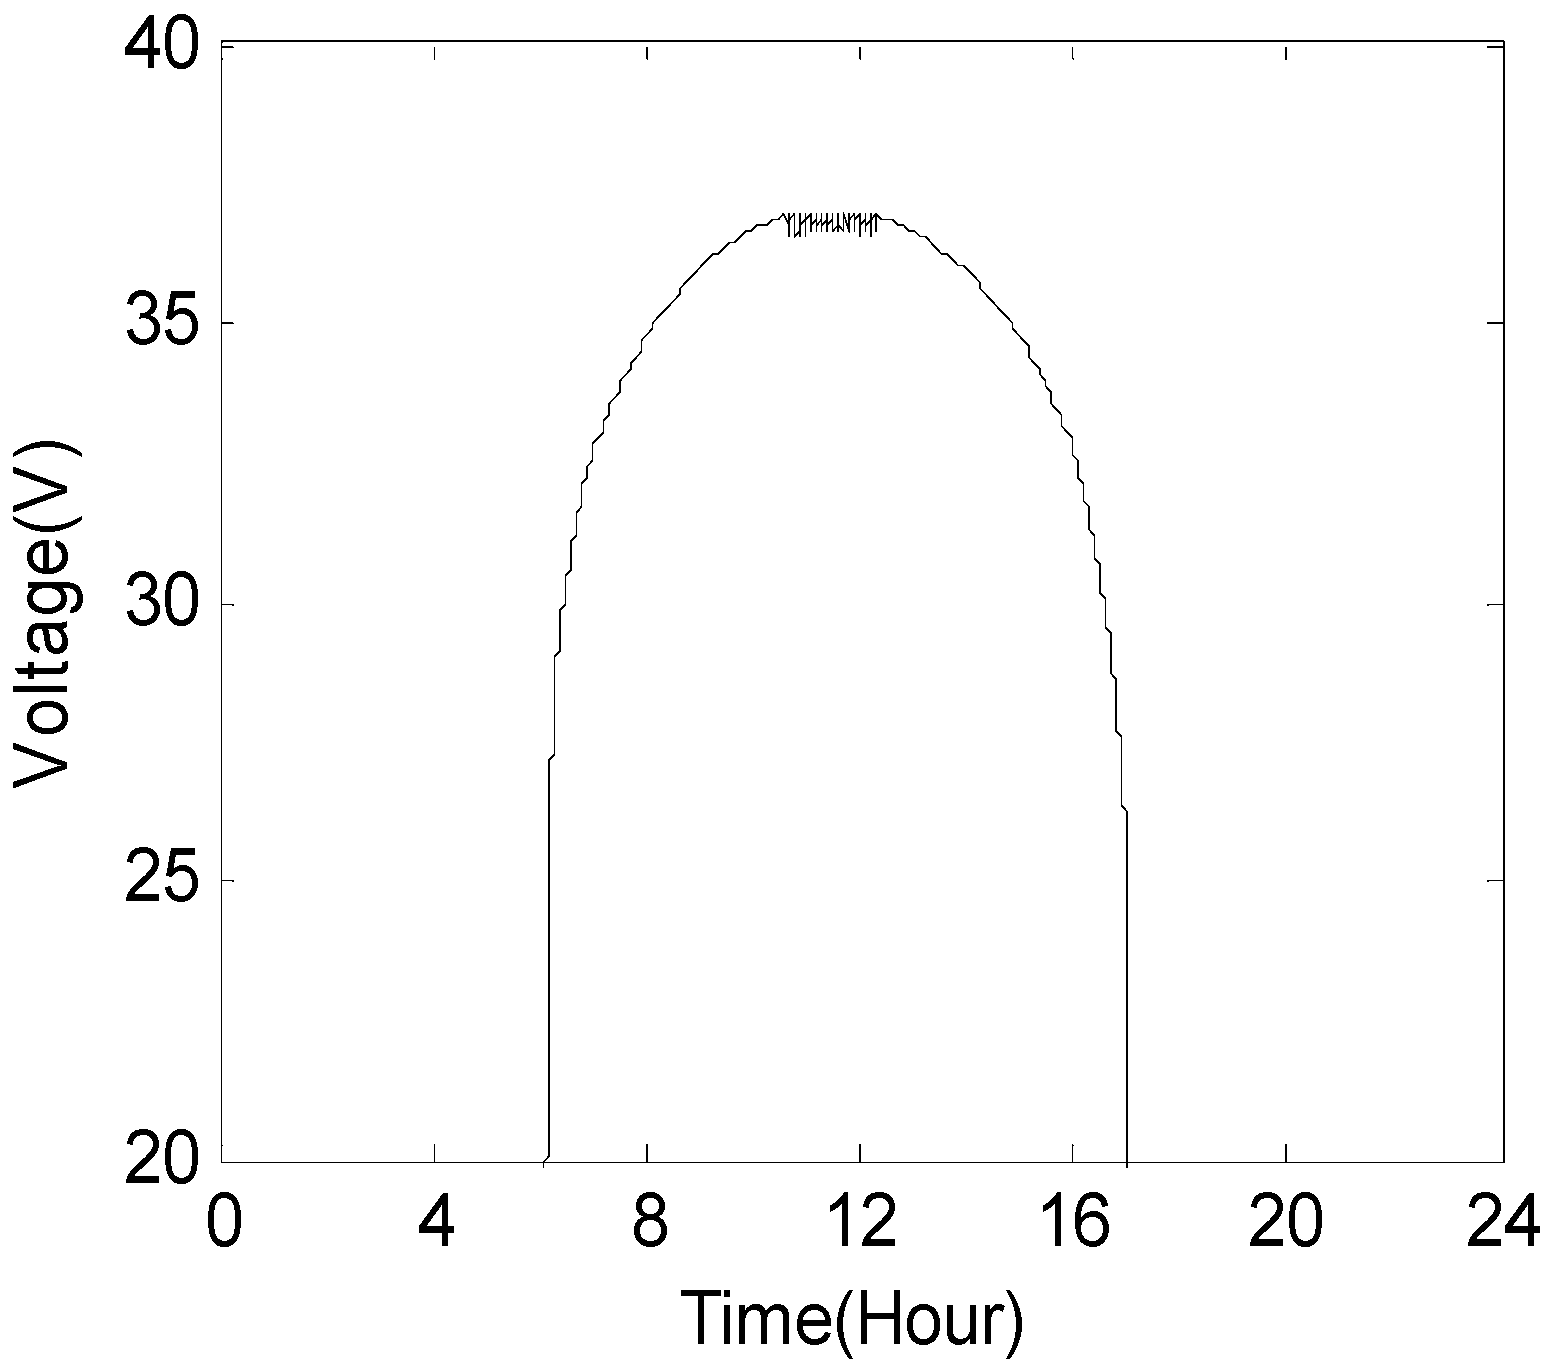
5. Hybrid System Simulation

To obtain the maximum amount of hydrogen from the source, the PV and the electrolyzer are combined to yield the hybrid system being proposed. In this section, the simulation setup for this hybrid system is explained with appropriate results and discussions in the subsequent section. The irradiance computed using Equation (13) represents the starting point for the simulations. Derivation of the electrical working point of this entire system is done by equating the electrical characteristics of the PV with those of the electrolyzer, as elaborated by Equations (2) and (8). As described earlier, the electrolyzer’s operation is dependent to its temperature, which is depicted by Equation (6) and (9). Section 3 details the optimization procedure, wherein the step of resolving the colonies also computes the PV power. Through this, the cost function is generated following which the Simulink model runs to obtain results in the step where total cost of the empires is computed. The remainder of the steps of iteration are as expressed in the aforementioned section.

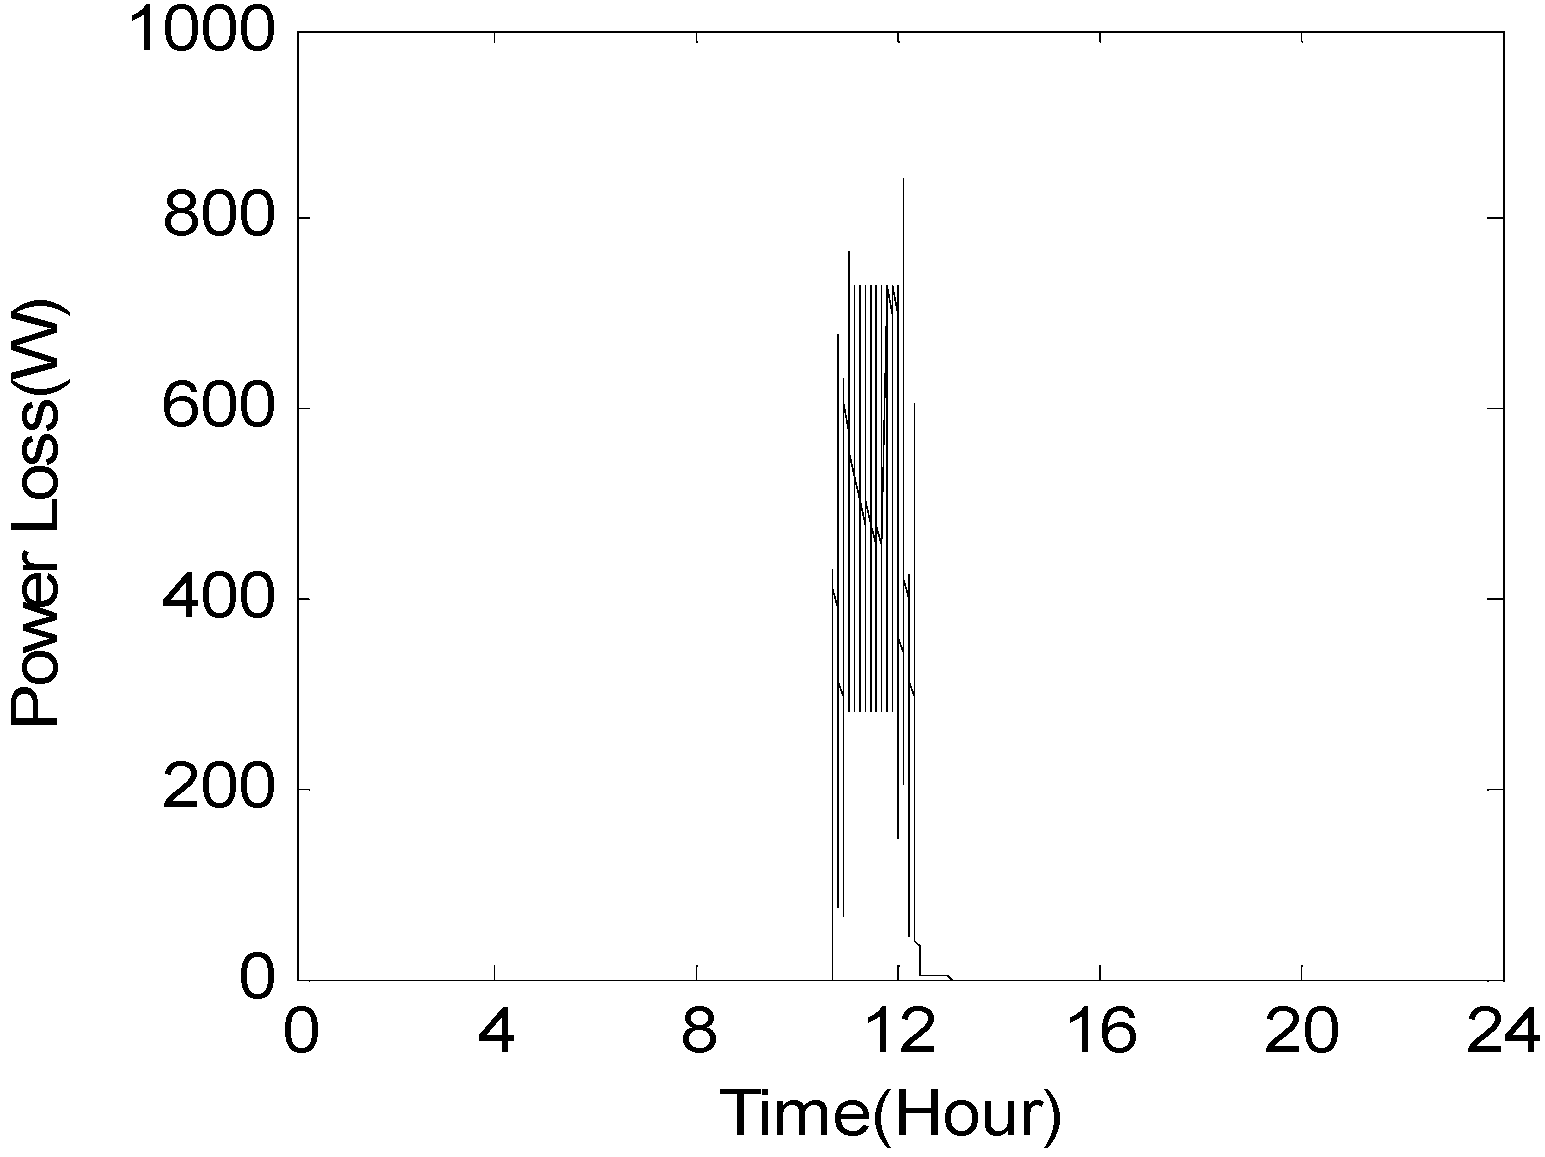
6. Results and Discussion

According to the mentioned models, the coupling of a PV array and an electrolyzer is simulated in this study. The simulation is based on diurnal solar calculation for the region of Miami which is shown in Figure 5. The optimal size of the system is achieved through ICA [23]. The various costs of the system components are not included in optimization process. The dependency of the cost of the system to time makes this factor inappropriate to be considered as cost function. Another index to optimization is introduced, based on maximum hydrogen production and storage through minimum average excess power production. As minimum excess power production tends to lower the dimensions of the system, its cost is indirectly accounted for in the optimization. In this case, it gives 12.3 kW for the size of PV array for a 10 kW advanced alkaline electrolyzer. The results of the simulation are given in Table 6. This condition produces 697 mol of hydrogen in which the power generation of PV is 2.94 kW. For a PV panel of 85 W, 145 panels are needed. The results are almost the same in other profiles of irradiation despite the simulation being performed for a sunny day.
Power loss of the system is shown in Figure 6. As it is shown, excess power is produced at the middle of the day, when the irradiation is maximum. The average daily unused power is 0.029 kW, which spends 2500 kJ of energy for that day. The transient switching power of the system cuts off the power flow from the electrolyzer sub-system, causing spikes in the excess power as can be observed. The optimization based on minimizing excess power, means minimizing the dimensions of the system which indirectly reduces the cost.
Instead of evaluating the cost in objective function which is variable during time, we minimize the excess power which is independent of time. It should be mentioned that this factor is different from the transfer loss, which is the difference between the actual power point and the maximum power point.
Faraday efficiency directly affects hydrogen production, which is shown in Figure 7. The average Faraday efficiency is 0.52 below the maximum possible value. However, when the PV starts to generate electricity, the efficiency immediately raises to its maximum value. The effect of radiation to faraday efficiency is negligible, so during the operation of the electrolyzer, the efficiency is almost fixed.
The system voltage is another factor which is shown in Figure 8. The proposed system operates at voltages around 35 V. The peak voltage point for the system is 37 V which can produce the maximum amount of hydrogen. As we have not used power electronics devices in our system to control the voltage and make the system work at the maximum power point of PV output, the voltage is set by the connecting point of the U-I characteristics of PV system and electrolyzer.
At the end of the operation of the PV/hydrogen system, the produced hydrogen is stored in storage tanks. The storage pressure of a tank for daily operation is shown in Figure 9. Maximum pressure for the storage tank with the capacity of 0.25 m3 is 3.62 MPa. Therefore, a storage tank with a capacity higher than the given pressure is needed. The stored hydrogen is portable and can be used as a fuel for the input hydrogen of fuel cells. In this study, it is assumed that the pressurizing power of the storage tanks is derived from another source.

7. Conclusions

The operation of a combined PV-electrolyzer system to produce hydrogen as a fuel is designed and simulated. The solar radiation for one day is used for solar calculations. The maximum hydrogen production and minimum average excess power are considered as the optimization indices, which are 697 mol and 0.029 kW, respectively. This condition occurs when the tilts are in their appropriate location with an angle of 38°. The ratio of the PV array’s average power production to its maximum power is about 0.23, which shows how efficient it works. The results can be extrapolated for various other power values for the same rate, although the results have been shown herein only for a 10 kW electrolyzer. For further studies, batteries can be added to system to decrease the size of the electrolyzer. The excess surplus power which is wasted because of the excess over the nominal power of the electrolyser can be stored in batteries to be delivered to the electrolyser at other times.

Acknowledgments

This material is based on work supported by the National Science Foundation under Grant No. 1541108. Any opinions, findings, and conclusions or recommendations expressed in this material are those of the authors and do not necessarily reflect the views of the National Science Foundation.

Author Contributions

Arash Khalilnejad, Alireza Abbaspour, and Arif Sarwat conceived and designed the simulations, Arash Khalilnejad and Aditya Sundararajan contributed in analysis; Arash Khalilnejad and Aditya Sundararajan wrote the paper.

Conflicts of Interest

The authors declare no conflict of interest.

References

  1. Salmani, M.A.; Anzalchi, A.; Salmani, S. Virtual Power Plant: New Solution for Managing Distributed Generations in Decentralized Power Systems. In Proceedings of the 2010 International Conference on Management and Service Science (MASS), Wuhan, China, 24–26 August 2010; pp. 1–6.
  2. Anzalchi, A.; Sarwat, A.I. Analysis of Carbon Tax as an Incentive toward Building Sustainable Grid with Renewable Energy Utilization. In Proceedings of the 2015 Seventh Annual IEEE on Green Technologies Conference, New Orleans, LA, USA, 15–17 April 2015; pp. 103–109.
  3. Moghadasi, A.H.; Heydari, H.; Farhadi, M. Pareto optimality for the design of SMES solenoid coils verified by magnetic field analysis. IEEE Trans. Appl. Supercond. 2011, 21, 13–20. [Google Scholar] [CrossRef]
  4. Moghadasi, A.; Torabi, S.M.; Salehifar, M. Combined Operation of the Unified Power Quality Conditioner with SFCL and SMES. In Proceedings of the 2010 First Power Quality Conference, Tehran, Iran, 14–15 September 2010; pp. 1–7.
  5. Moghadasi, A.H.; Sundararajan, A.; Sarwat, A.I. Power Management and Control Strategy in Standalone DC Microgrid along with SMES Solenoid Coil. Int. J. Enhanc. Res. Sci. Technol. Eng. 2014, 3, 102–112. [Google Scholar]
  6. Wei, L.; Moghadasi, A.H.; Sundararajan, A.; Sarwat, A.I. Defending Mechanisms for Protecting Power Systems against Intelligent Attacks. In Proceedings of the 2015 10th IEEE Conference on System of Systems Engineering (SoSE), San Antonio, TX, USA, 17–20 May 2015.
  7. Gholami, H.; Sarwat, A.I.; Hosseinian, H.; Khalilnejad, A. Evaluation of optimal dual axis concentrated photovoltaic thermal system with active ventilation using Frog Leap algorithm. Energy Convers. Manag. 2015, 105, 782–790. [Google Scholar] [CrossRef]
  8. Gholami, H.; Khalilnejad, A.; Gharehpetian, G.B. Electrothermal performance and environmental effects of optimal photovoltaic–thermal system. Energy Convers. Manag. 2015, 95, 326–333. [Google Scholar] [CrossRef]
  9. Calderon, M.; Calderon, A.J.; Ramiro, A.; Gonzalez, J.F.; Gonzalez, I. Evaluation of a hybrid photovoltaic-wind system with hydrogen storage performance using exergy analysis. Int. J. Hydrog. Energy 2011, 36, 5751–5762. [Google Scholar] [CrossRef]
  10. Castañeda, M.; Fernández, L.M.; Sánchez, H.; Cano, A.; Jurado, F. Sizing methods for stand-alone hybrid systems based on renewable energies and hydrogen. In Proceedings of the 2012 16th IEEE Mediterranean Electrotechnical Conference, Yasmine Hammamet, Tunisia, 25–28 March 2012; pp. 832–835.
  11. Clarke, R.E.; Giddey, S.; Ciacchi, F.T.; Badwal, S.P.S.; Paul, B.; Andrews, J. Direct coupling of an electrolyzer to a solar PV system for generating hydrogen. Int. J. Hydrog. Energy 2009, 34, 2531–2542. [Google Scholar] [CrossRef]
  12. Pelacchi, P.; Poli, D. The influence of wind generation on power system reliability and the possible use of hydrogen storages. Electr. Power Syst. Res. 2010, 80, 249–255. [Google Scholar] [CrossRef]
  13. Abaspour, A.; Parsa, N.T.; Sadeghi, M. A new feedback Linearization-NSGA-II based control design for PEM fuel cell. Int. J. Comput. Appl. 2014, 97, 25–32. [Google Scholar] [CrossRef]
  14. Singh, S.; Jain, S.; Venkateswaran, P.S.; Tiwari, A.K.; Nouni, M.R.; Pandey, J.K.; Goel, S. Hydrogen: A sustainable fuel for future of the transport sector. Renew. Sustain. Energy Rev. 2015, 51, 623–633. [Google Scholar] [CrossRef]
  15. Ganeshan, I.S.; Manikandan, V.V.S.; Sundhar, V.R.; Sajiv, R.; Shanthi, C.; Kottayil, S.K.; Ramachandran, T. Regulated hydrogen production using solar powered electrolyzer. Int. J. Hydrog. Energy 2015. [Google Scholar] [CrossRef]
  16. Anzalchi, A.; Sarwat, A. Artificial Neural Network Based Duty Cycle Estimation for Maximum Power Point Tracking in Photovoltaic Systems. In Proceedings of the IEEE on SoutheastCon 2015, Fort Lauderdale, FL, USA, 9–12 April 2015.
  17. Martinez-Frias, J.; Pham, A.Q.; Aceves, S.M. A natural gas-assisted steam electrolyzer for high-efficiency production of hydrogen. Int. J. Hydrog. Energy 2003, 28, 483–490. [Google Scholar] [CrossRef]
  18. Rajesh, R.; Mabel, M.C. A comprehensive review of photovoltaic systems. Renew. Sustain. Energy Rev. 2015, 51, 231–248. [Google Scholar] [CrossRef]
  19. Zahedi, A. Maximizing solar PV energy penetration using energy storage technology. Renew. Sustain. Energy Rev. 2011, 15, 866–870. [Google Scholar] [CrossRef]
  20. Ulleberg, Ø. Modeling of advanced alkaline electrolyzers: A system simulation approach. Int. J. Hydrog. Energy 2003, 28, 21–33. [Google Scholar] [CrossRef]
  21. Kiaee, M.; Cruden, A.; Chladek, P.; Infield, D. Demonstration of the operation and performance of a pressurized alkaline electrolyzer operating in the hydrogen fueling station in Porsgrunn, Norway. Energy Convers. Manag. 2015, 94, 40–50. [Google Scholar] [CrossRef]
  22. Zhou, T.; Francois, B. Modeling and control design of hydrogen production process or an active hydrogen/wind hybrid power system. Int. J. Hydrog. Energy 2009, 34, 21–30. [Google Scholar] [CrossRef]
  23. Khalilnejad, A.; Riahy, G.H. A hybrid wind-PV system performance investigation for the purpose of maximum hydrogen production and storage using advanced alkaline electrolyzer. Energy Convers. Manag. 2014, 80, 398–406. [Google Scholar] [CrossRef]
  24. Dutta, S. A review on production, storage of hydrogen and its utilization as an energy resource. J. Ind. Eng. Chem. 2014, 20, 1148–1156. [Google Scholar] [CrossRef]
  25. Torreglosa, J.P.; Garcia, P.; Fernández, L.M.; Jurado, F. Energy dispatching based on predictive controller of an off-grid wind turbine/photovoltaic/hydrogen/battery hybrid system. Renew. Energy 2015, 74, 326–336. [Google Scholar] [CrossRef]
  26. Brka, A.; Al-Abedli, Y.M.; Kothapalli, G. The interplay between renewables penetration, costing and emissions in the sizing of stand-alone hydrogen systems. Int. J. Hydrog. Energy 2015, 40, 125–135. [Google Scholar] [CrossRef]
  27. Zhang, H.C.; Su, S.; Lin, G.; Chen, J. Efficiency calculation and configuration design of a PEM electrolyzer system for hydrogen production. Int. J. Electrochem. Sci. 2012, 7, 4143–4157. [Google Scholar]
  28. Opu, M.S. Effect of operating parameters on performance of alkaline water electrolysis. Int. J. Therm. Environ. Eng. 2015, 9, 53–60. [Google Scholar]
  29. Stetson, N.T.; McWhorter, S.; Ahn, C.C. Introduction to hydrogen storage. Compend. Hydrog. Energy 2016, 3–25. [Google Scholar]
  30. Zhevago, N.K. Other methods for the physical storage of hydrogen. Compend. Hydrog. Energy 2016, 189–218. [Google Scholar]
  31. Züttel, A. Hydrogen storage methods. Naturwissenschaften 2004, 91, 157–172. [Google Scholar] [CrossRef] [PubMed]
  32. Khalghani, M.R.; Khooban, M.H. A novel self-tuning control method based on regulated bi-objective emotional learning controller’s structure with TLBO algorithm to control DVR compensator. Appl. Soft Comput. 2014, 24, 912–922. [Google Scholar] [CrossRef]
  33. Khalghani, M.R.; Khooban, M.H.; Mahboubi-Moghaddam, E.; Vafamand, N.; Goodarzi, M. A self-tuning load frequency control strategy for microgrids: Human brain emotional learning. Int. J. Electr. Power Energy Syst. 2016, 75, 311–319. [Google Scholar] [CrossRef]
  34. Khalghani, M.R.; Shamsi-Nejad, M.A.; Farshad, M.; Khooban, M.H. Modifying power quality’s indices of load by presenting an adaptive method based on Hebb learning algorithm for controlling DVR. Automatika J. Control Meas. Electron. Comput. Commun. 2014, 55, 153–161. [Google Scholar] [CrossRef]
  35. Nazari-Shirkouhi, S.; Eivazy, H.; Ghodsi, R.; Rezaie, K.; Atashpaz-Gargari, E. Solving the integrated product mix-outsourcing problem by a novel meta-heuristic algorithm: Imperialist competitive algorithm. Expert Syst. Appl. 2010, 37, 7615–7626. [Google Scholar] [CrossRef]
  36. Wikimedia Commons. Available online: https://commons.wikimedia.org/wiki/File:Imperialist-competitive-algorithm-flowchart.jpg (accessed on 10 May 2009).
  37. Yousefi, M.; Darus, A.N.; Mohammadi, H. Second law based optimization of a plate fin heat exchanger using imperialist competitive algorithm. Int. J. Phys. Sci. 2011, 6, 4749–4759. [Google Scholar]
  38. Hadidi, A.; Hadidi, M.; Nazari, A. A new design approach for shell-and-tube heat exchangers using imperialist competitive algorithm (ICA) from economic point of view. Energy Convers. Manag. 2013, 67, 66–74. [Google Scholar] [CrossRef]
  39. Kaveh, A.; Talatahari, S. Imperialist competitive algorithm for engineering design problems. Asian J. Civil Eng. Build. Hous. 2010, 11, 675–697. [Google Scholar]
Figure 1. Circuit diagram of the photovoltaic (PV) model.
Energies 09 00332 g001
Figure 2. Cell voltage of an electrolyzer in the 20–80 °C temperature range.
Energies 09 00332 g002
Figure 3. Imperialistic competitive algorithm (ICA) generic flowchart [36].
Energies 09 00332 g003
Figure 4. Annual Energy received to tilted surface.
Energies 09 00332 g004
Figure 5. Energy received on a tilted surface.
Energies 09 00332 g005
Figure 6. Power loss of the system.
Energies 09 00332 g006
Figure 7. Faraday efficiency.
Energies 09 00332 g007
Figure 8. Operating voltage of the system.
Energies 09 00332 g008
Figure 9. Pressure of the hydrogen storage tank.
Energies 09 00332 g009
Table 1. Characteristics of the photovoltaic (PV) modules.
ParameterPV AreaVocIscVmppImppRshRs
Vlaue0.8522.25.4517.24.958131.2
Unitm2VAVA
Table 2. Electrolyzer parameters [20].
ParameterUrevAst1t2t3r1r2
Value1.2290.250.1851.0028.424247.38.05 × 10−5−2.5 × 10⁻⁵
UnitVm2VA−1m2A−1m2°CA−1m2°C2Ωm2Ωm2°C−1
Table 3. Faraday efficiency parameters [20].
Parameterf1f2
Value2000.985
UnitmA2·cm−4mA2 cm−4
Table 4. Generic pseudocode for ICA.
StepICA Generic PseudocodeDescription
1Formulate the problemby defining the objective function:
f(x), where x = (x1, x2, …., xd)
Produce a random solution in the search space and create an initial set of Empires
2Assimilation is performedwherein the colonies move towards the imperialist states in different in directions
3Revolution follows where random changes are triggeredaltering certain characteristics of some countries in the space
4A colony gaining a position better than that of the imperialist has chance to control that Empireby replacing the existing imperialist
5All imperialist countries compete against each otherto possess one another‘s colonies
6Empires deemed weak in these imperialist competitions lose their power graduallyfinally it will be eliminated
7If the exit condition is satisfied go to step 8, else go to step 3-
8End-
Table 5. Pseudocode for ICA optimization steps.
StepNameDescription
1IntializationSelect random points on the function and initialize them
2AssimilationPerform the assimilation process
3ExchangeIf there is a colony with lower cost than that of the imperialist, exchange positions
4AnnexationAnnex the weakest colony of the weakest empire to the empire that has the most likelihood to possess it
5EliminationEliminate the powerless empires
6RepeationRepeat steps (a) through (e) until there is just one empire left
Table 6. Optimization result for PV array/electrolyzer.
ParameterPV Nominal PowerArea of PV ArrayHydrogen Production RateAverage Faraday Efficiency
Value12.32260.0810.39
UnitkWm2mol/s-

