Article

Methodology to Calculate the Costs of a Floating Offshore Renewable Energy Farm

by
Laura Castro-Santos
1,
Elson Martins
2 and
C. Guedes Soares
2,*
1
Integrated Group for Engineering Research, Centro de Investigacións Tecnolóxicas, Departamento de Enxeñaría Naval e Oceánica, Escola Politécnica Superior, Universidade da Coruña, Campus de Ferrol, 15471 Ferrol, Spain
2
Centre for Marine Technology and Ocean Engineering (CENTEC), Instituto Superior Tecnico, Universidade de Lisboa, Av Rovisco Pais, 1049-001 Lisbon, Portugal
*
Author to whom correspondence should be addressed.
Energies 2016, 9(5), 324; https://doi.org/10.3390/en9050324
Submission received: 6 October 2015 / Revised: 16 March 2016 / Accepted: 12 April 2016 / Published: 28 April 2016
(This article belongs to the Special Issue Tools and Techniques for Economic Delivery of Ocean Energy)

Abstract

:
This paper establishes a general methodology to calculate the life-cycle cost of floating offshore renewable energy devices, applying it to wave energy and wind energy devices. It is accounts for the contributions of the six main phases of their life-cycle: concept definition, design and development, manufacturing, installation, exploitation and dismantling, the costs of which have been defined. Moreover, the energy produced is also taken into account to calculate the Levelized Cost of Energy of a floating offshore renewable energy farm. The methodology proposed has been applied to two renewable energy devices: a floating offshore wave energy device and a floating offshore wind energy device. Two locations have been considered: Aguçadoura and São Pedro de Moel, both in Portugal. Results indicate that the most important cost in terms of the life-cycle of a floating offshore renewable energy farm is the exploitation cost, followed by the manufacturing and the installation cost. In addition, the best area in terms of costs is the same independently of the type of floating offshore renewable energy considered: Aguçadoura. However, the results in terms of Levelized Cost of Energy are different: Aguçadoura is better when considering wave energy technology and the São Pedro de Moel region is the best option when considering floating wind energy technology. The method proposed aims to give a direct approach to calculate the main life-cycle cost of a floating offshore renewable energy farm. It helps to assess its feasibility and evaluating the relevant characteristics that influence it the most.

1. Introduction

The demand for energy on a global scale is likely to increase in the coming years [1]. Fossil fuels have been the conventional source of energy, but a high dependence on these might lead to or aggravate any sustainability and environmental issues. Renewable sources of energy gain increasing importance in this scenario, in order to assure that the energy demand is met. There are also additional benefits such as reduced CO2 emissions, which have been a concern for countries throughout the world. Examples of this are the Kyoto Protocol on CO2 emissions reduction or the Directive 2009/28/EC of the European Parliament [2] which targets for the use of renewable sources of energy within the European Union. These factors and others such as security of supply stimulate the development of technologies that are able to exploit renewable sources of energy [3].
Ocean energy is one source of renewable energy. It can be exploited from waves, tides, tidal currents, thermal gradients or salinity gradients. Waves are a resource that varies in height, period and direction [4]. These characteristics determine the wave power levels, which as a consequence are of a stochastic nature also.
In the ocean energy industry, the wave energy sector has been focused on the exploitation of the resource and production of useful energy (i.e., electricity) through the development of appropriate technology. Several concepts have been developed so far with no particular preference between the alternatives, most at an early stage of development [5]. Other authors, such as Falcão [6] and Guedes Soares et al. [7] classified and explained these different concepts designed to extract energy from waves in detail. Most devices are either floating or fixed systems located onshore, near shore or offshore. This work is focused on floating offshore concepts.
Another source of renewable energy is offshore wind energy. Wind resources tend to be better at greater distances from shore, i.e., stronger and with less irregular behaviour [8,9]. Wind power is proportional to air density and the cube of wind speed [10].
The harnessing of offshore wind energy relies on technology similar to onshore wind energy but designed for the offshore environment. Therefore, most concepts consist of horizontal-axis turbines. Foundations are a critical element in the deployment of these devices. The selection of a given type of foundation and design depends on aspects such as sea floor geology, water depth or sea state conditions. Floating foundations are designed for deep waters but are still at an early stage of development. Spars, tension leg platforms and semisubmersible are some of the main concepts for these types of foundations, considering the type of floating platform in which the device is supported [9,11]. This work is focused on offshore wind concepts employing floating foundations [12,13].
Wave devices are designed to be deployed in locations with a particular set of characteristics hence the variety of solutions, which will adapt to different conditions, have different operational ranges and have different efficiencies depending on sea state [5,14,15]. Likewise, wind devices extract power with a given efficiency within an operating range of wind speed [16]. Performance might also be affected by wake effects on neighbouring turbines. Moreover, as these devices are located further from the coast they might exploit higher power levels but at the cost of survivability or accessibility issues due to harsher sea state and weather conditions [5,6,9]. Therefore, while the attractiveness of a region might be measured by its power levels it is ultimately dependent on an adequate match between device and location. These aspects demonstrate that knowledge about resource characteristics in a potential location is of great importance. Resource assessments are meant to provide this knowledge, with possible options being in-situ measurements or numerical modelling techniques [17,18,19,20].
A concept and a location are basic requirements to set a project. Projects, from the beginning to the end, comprise a set of operations and costs over time, and these determine its feasibility. Project costs are associated with the resources, infrastructures and deliveries required along the life cycle. These costs are either capital costs or operating costs [21,22]. Costs are site-specific and depend on aspects such as geographic conditions, technical design or market conditions [10,23].
Wave energy technology is at an early stage of development, with a reduced number of full scale grid connected projects [5]. Limited experience hampers the assessment of project feasibility in the sector with an adequate level of confidence due to the current lack of data and high number and degree of uncertainties [17]. These projects are capital intensive and entail significant risk for investors. Offshore wind projects are also capital intensive, and although there are some grid connected projects deployed it is still a young industry sector [23]. The trend in this sector is towards larger farms in deeper water at greater distances from shore [9], options that are more challenging and riskier for investors.
This paper presents a general methodology to calculate the life-cycle cost of a floating offshore renewable energy farm. The specific equations of all these costs have been developed in order to increase the detail of calculating the life-cycle cost, which is not specified in other studies, whose costs are calculated considering general percentages of influences of each costs. It will enable an assessment of the feasibility of a particular project by calculating and analysing in detail its life cycle costs. It will also enable the analysis of these costs, their impact and the most influential variables. Hence, considering these aspects, this methodology should be useful for decision-making.
The paper proceeds as follows: the first section introduces the methodology. Then a case study is presented, considering two different options in terms of project scale (i.e., installed capacity) in two different locations for two floating offshore renewable energy devices—one based on wave energy technology and another based on wind energy technology. This is followed by the presentation of the results in the next section. Last section addresses the conclusions from this work.

2. Methodology

2.1. General View

The methodology proposed has been adapted from the floating offshore wind [24] and wave [
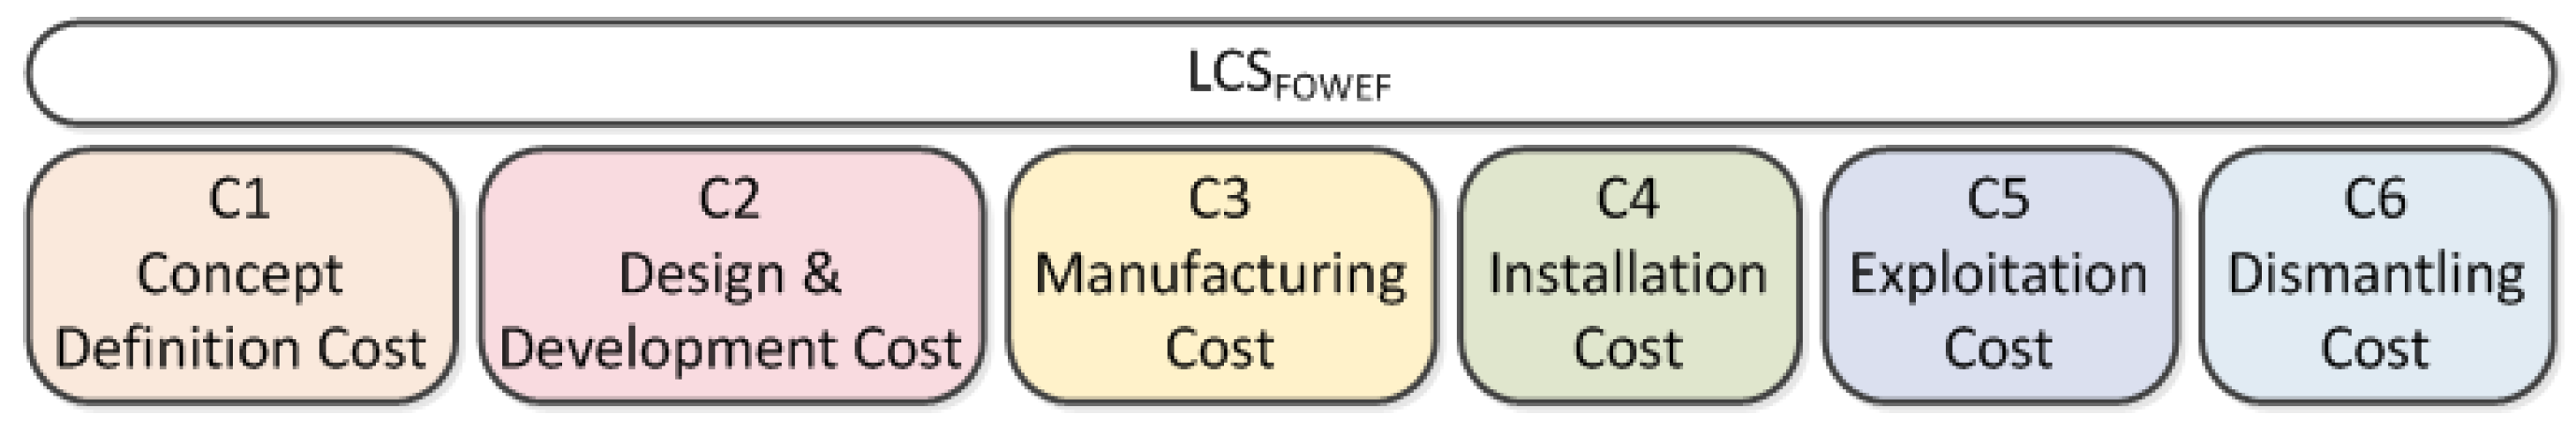
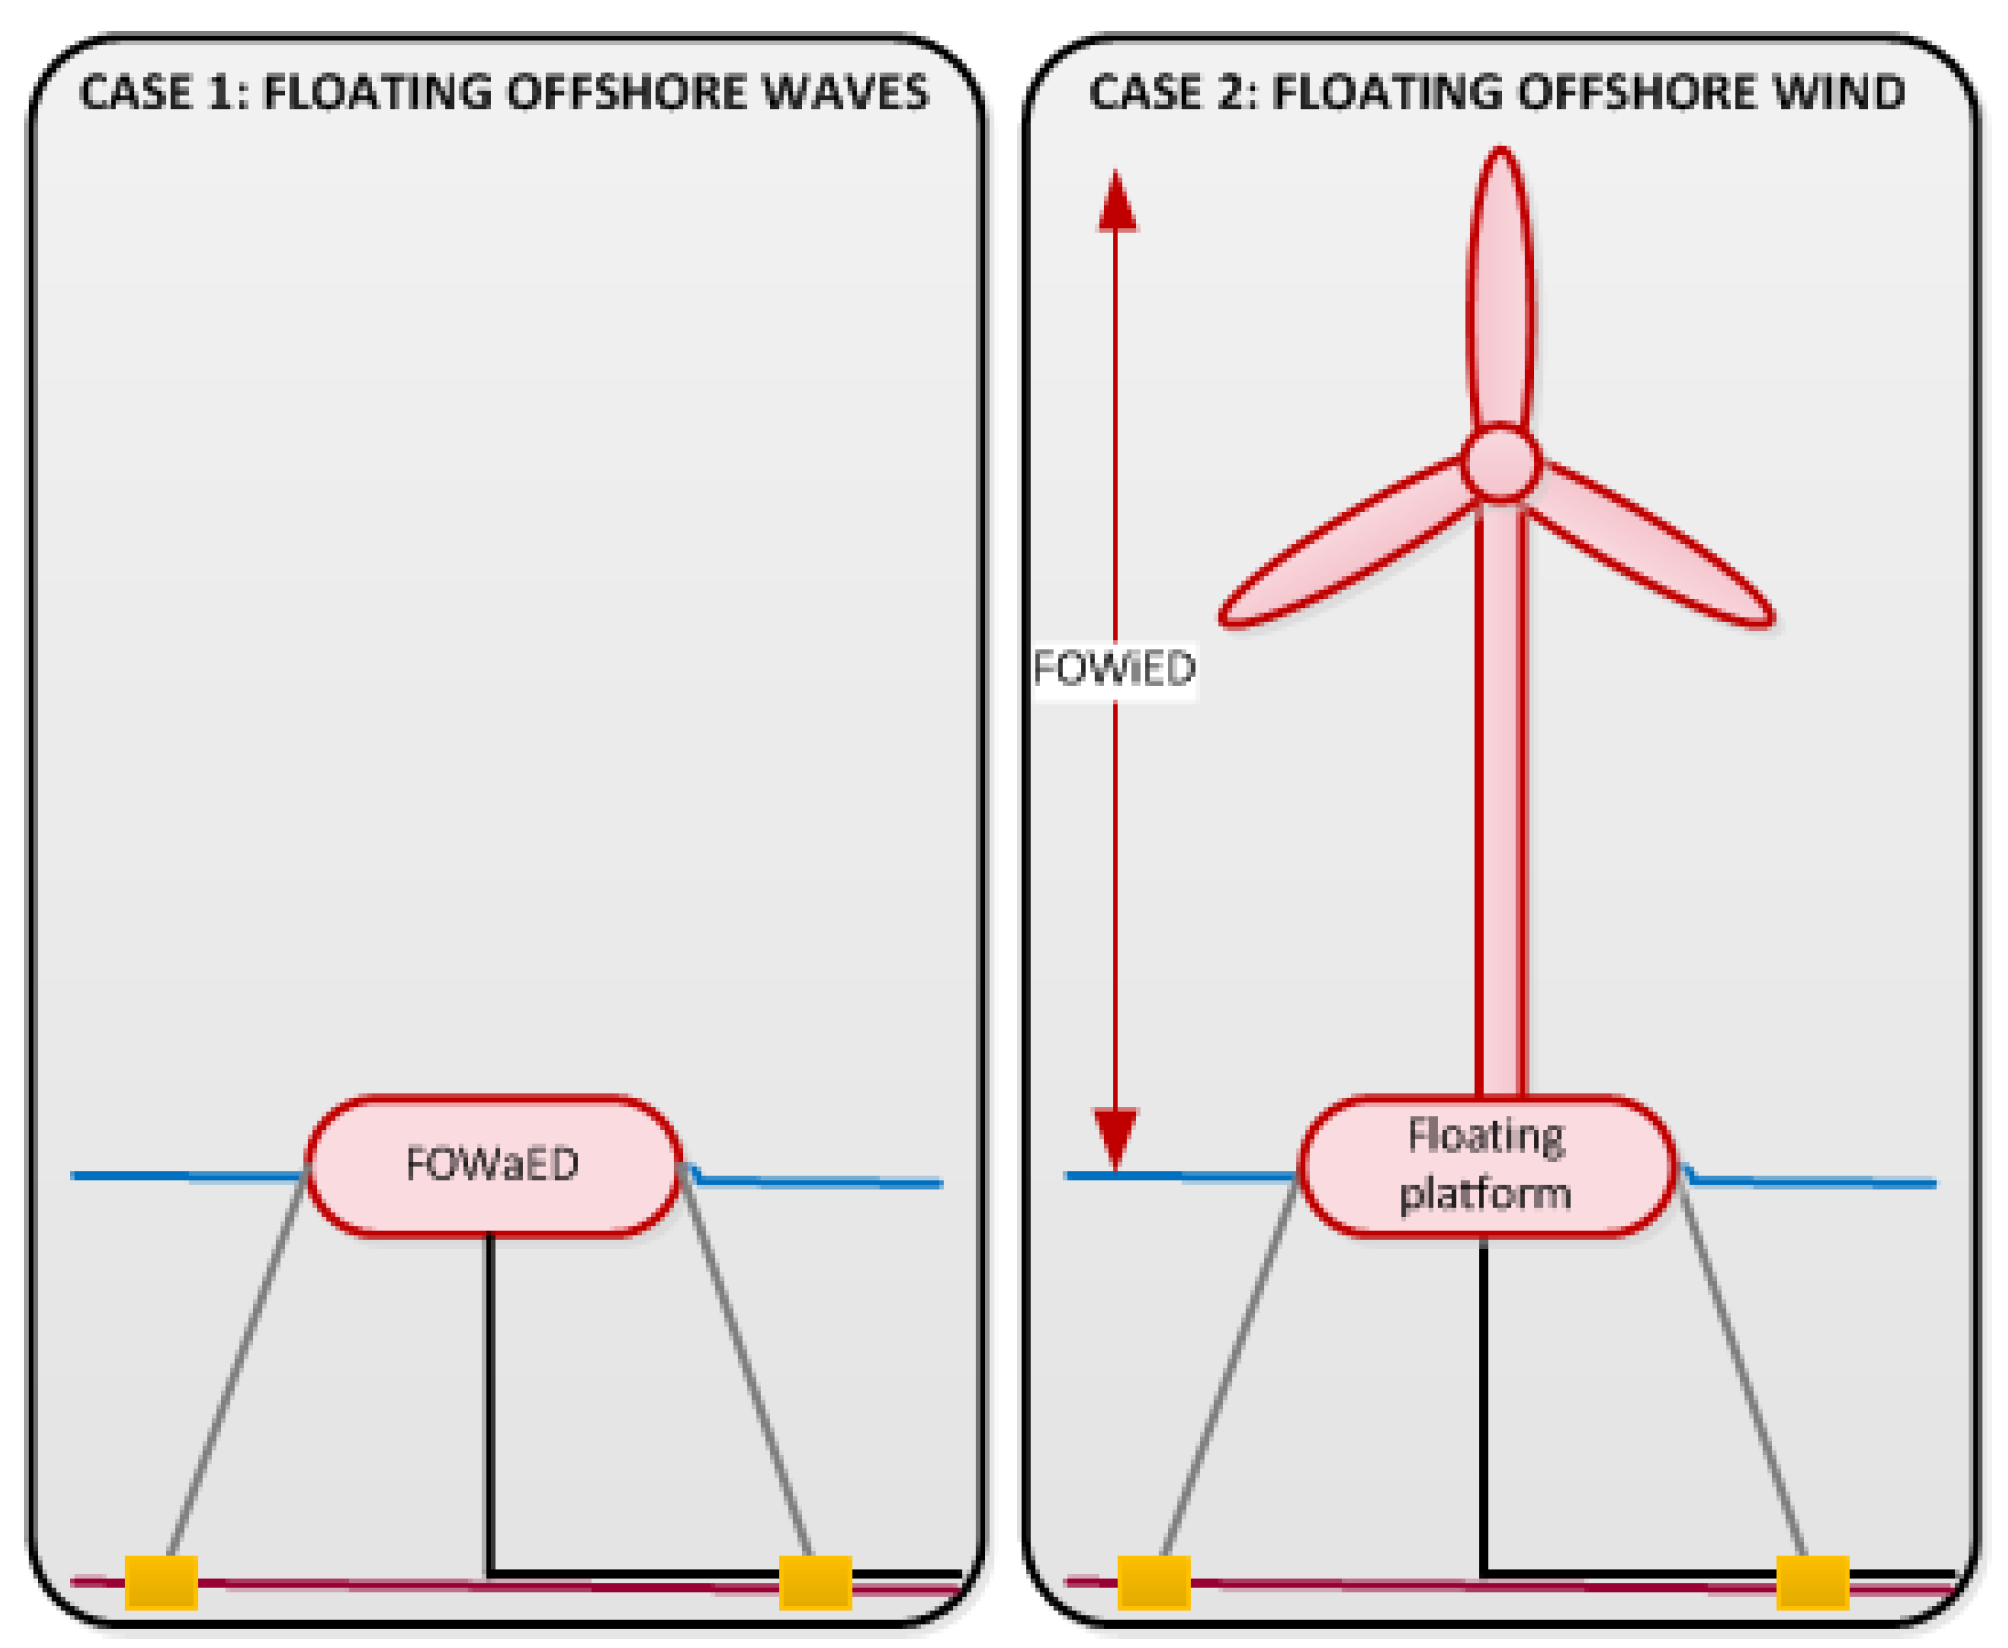
25] life-cycle process and it is based on the life-cycle of floating offshore renewable energy devices (FOWEDs), which is composed by six main phases (Figure 1): concept definition, design and development, manufacturing, installation, exploitation and dismantling.
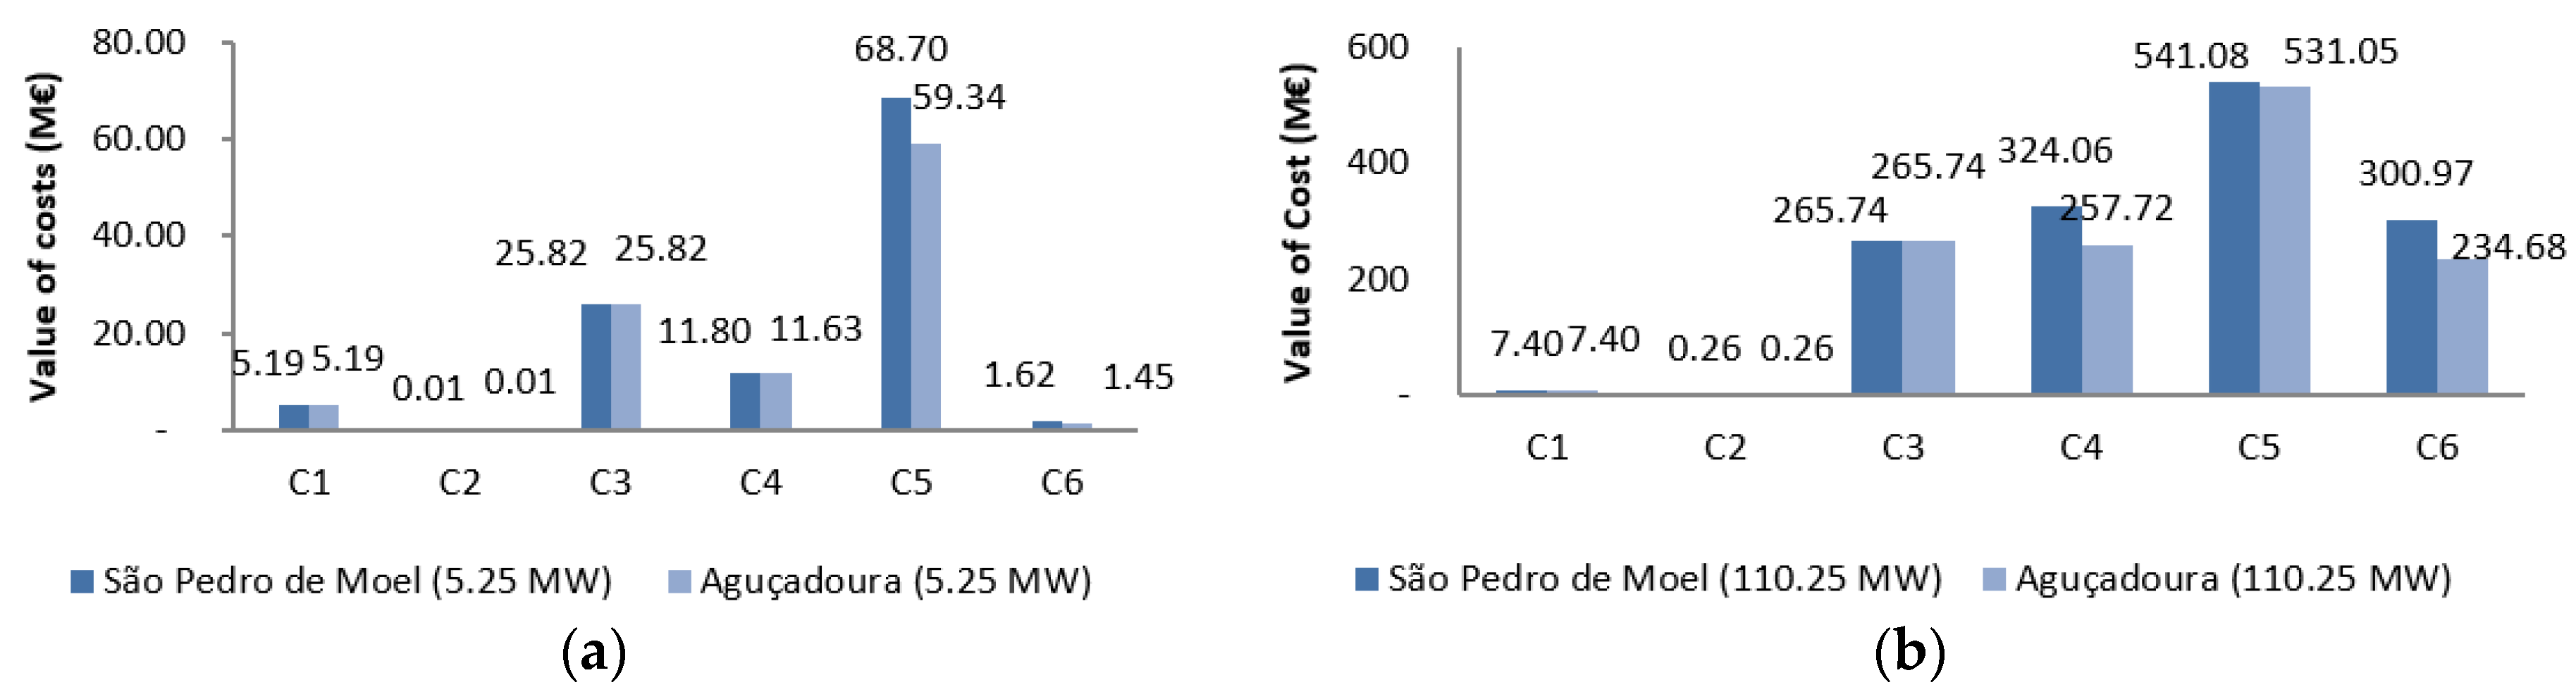
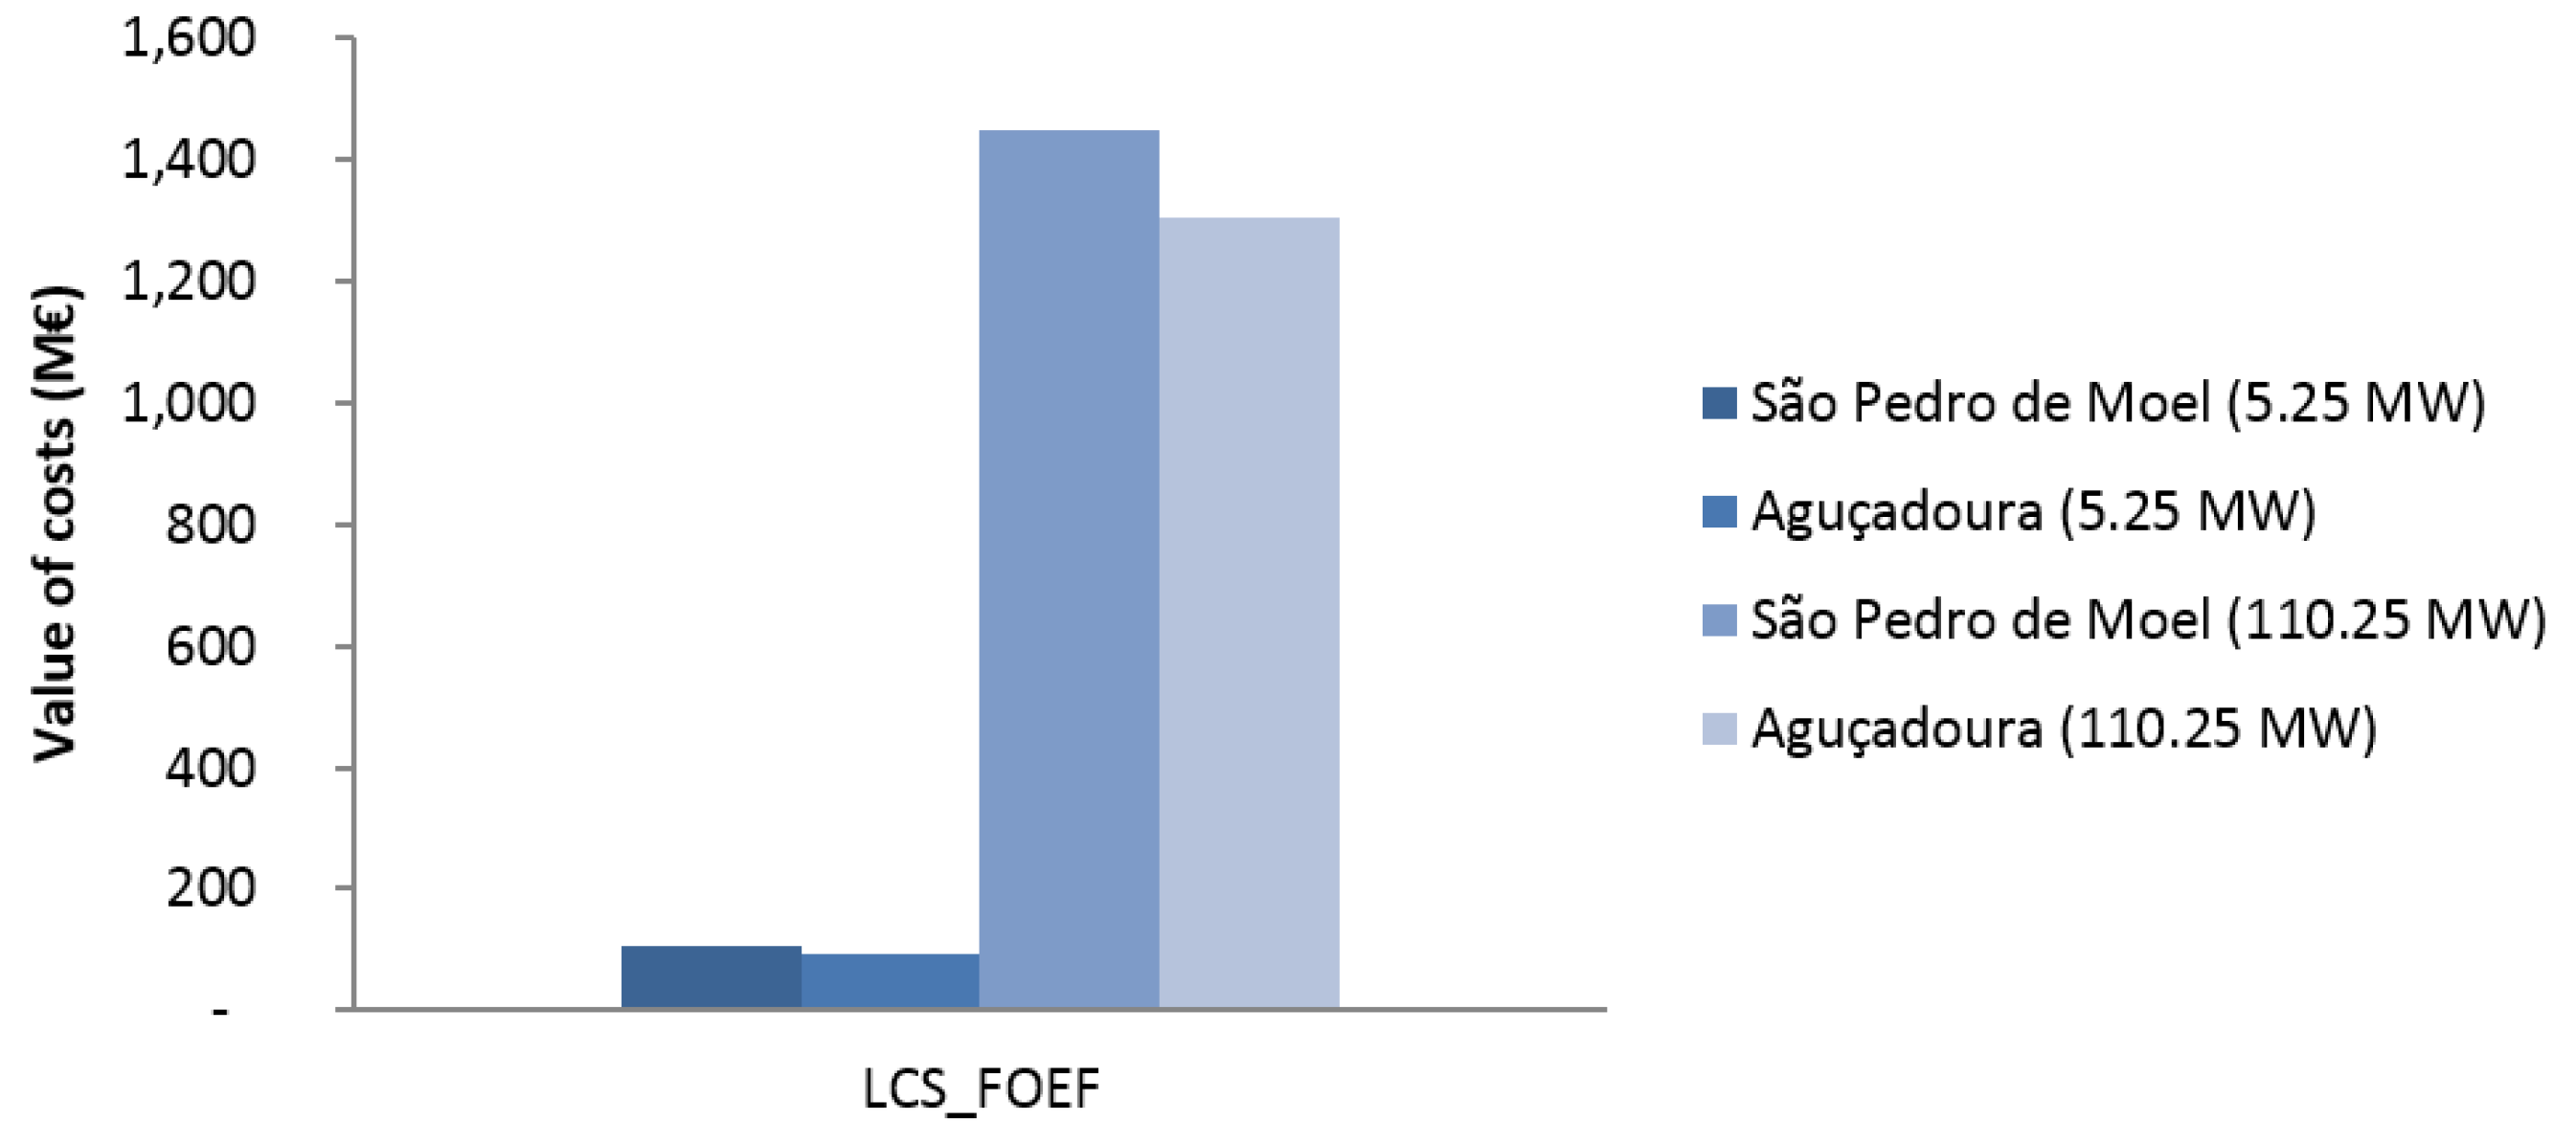
The costs of these phases comprise the Life-cycle Cost System (LCS) of a floating offshore renewable energy farm (FOREF), as follows:
L C S F O R E F = C 1 + C 2 + C 3 + C 4 + C 5 + C 6
where 
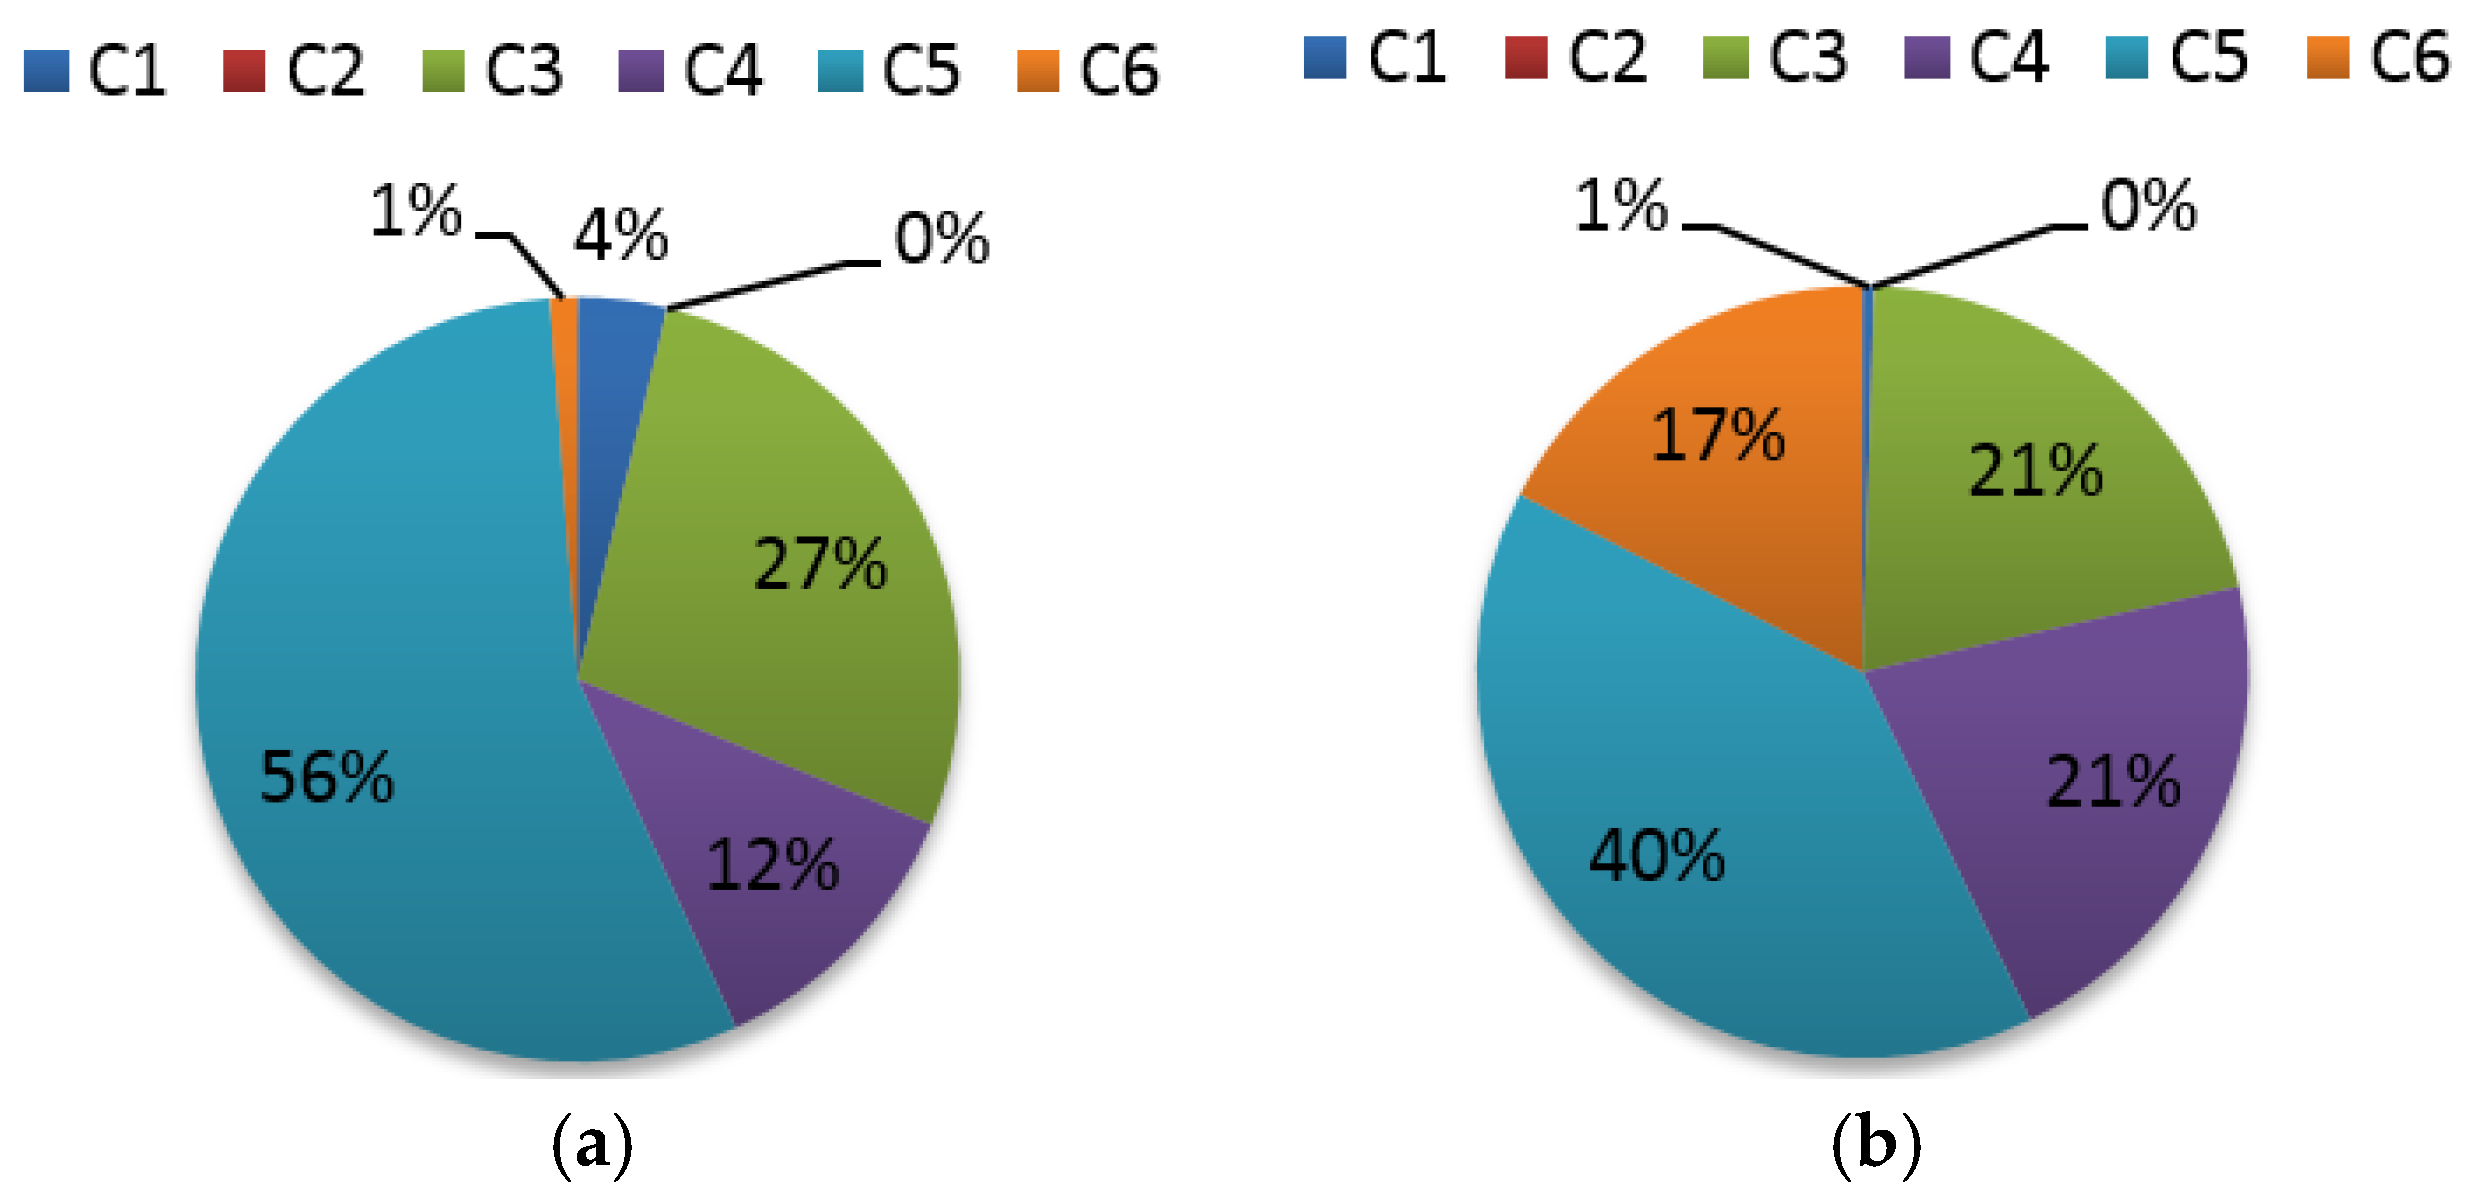
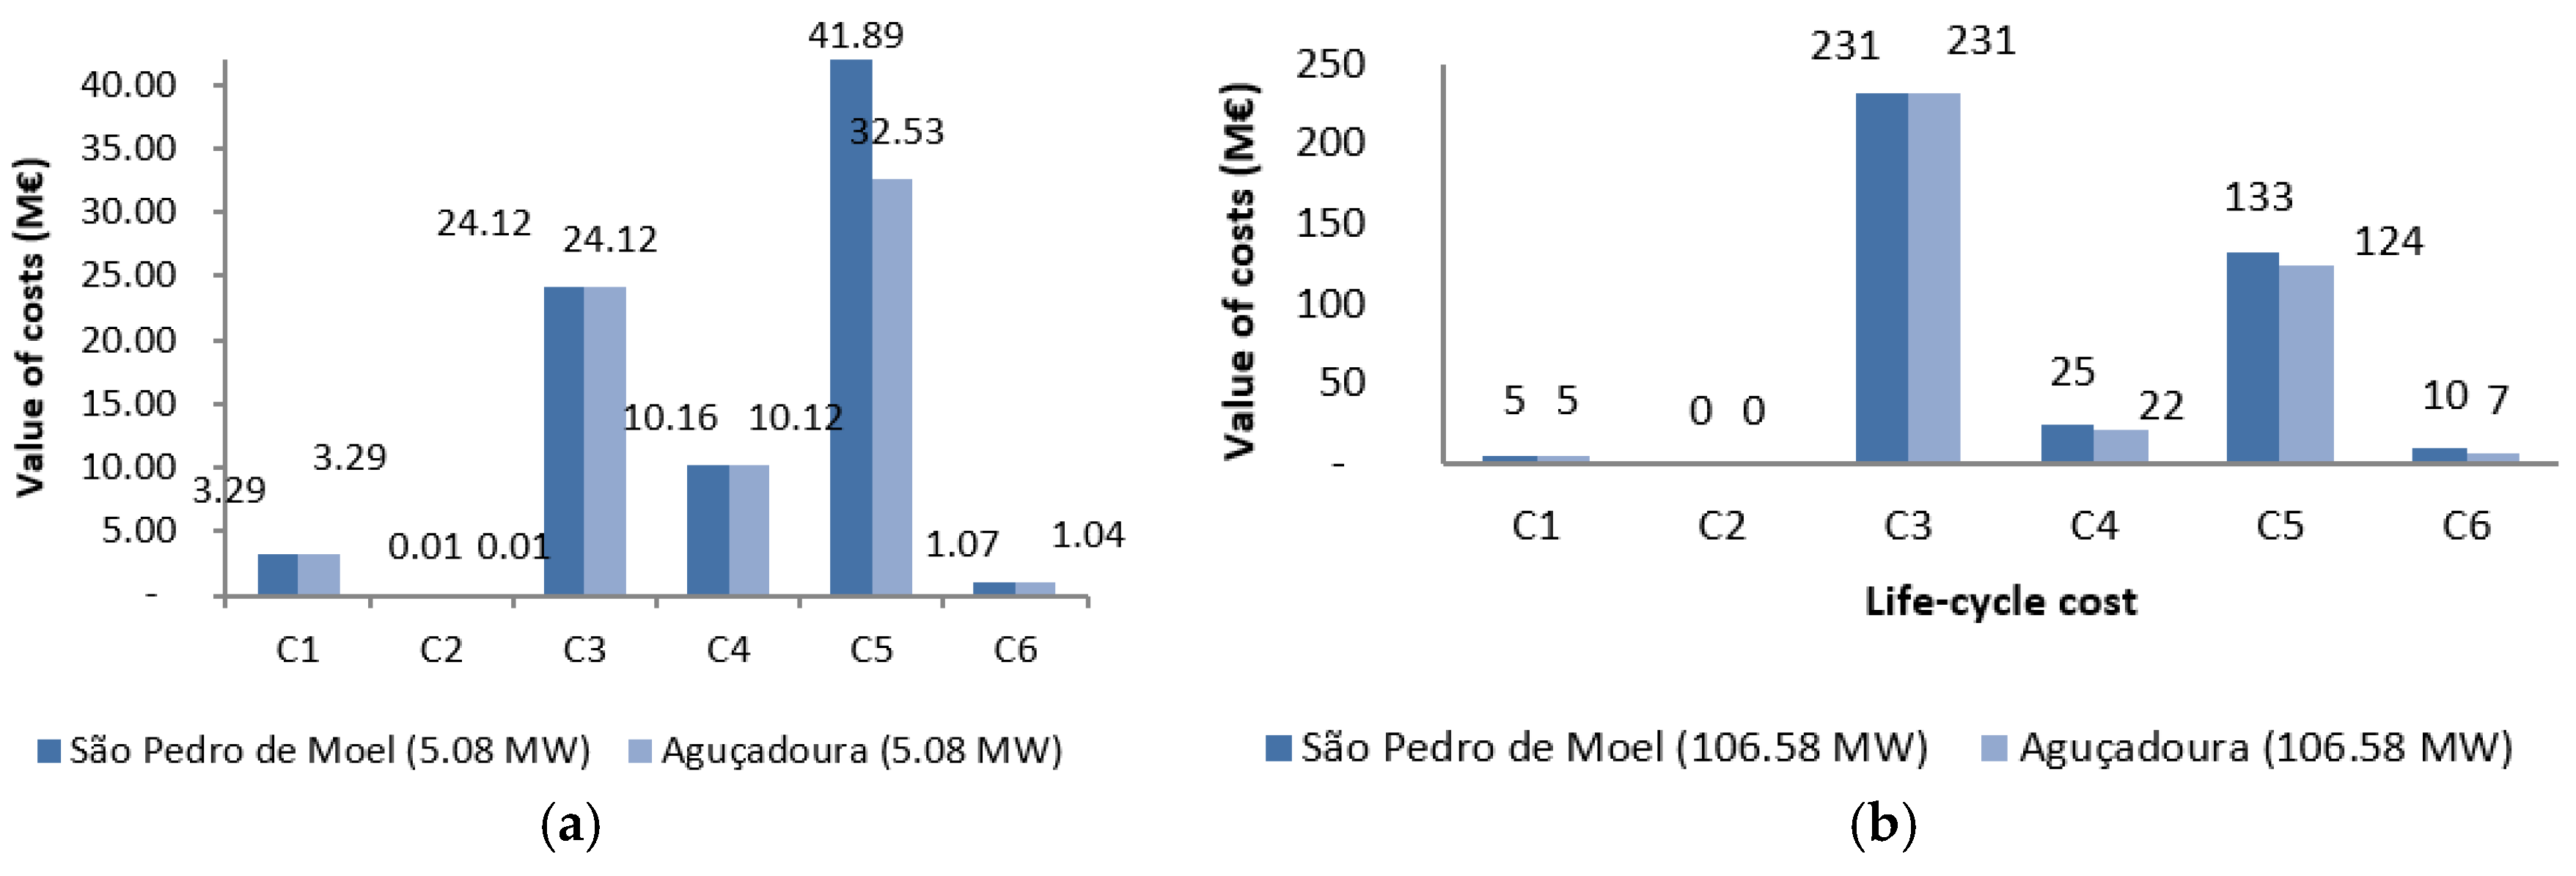
C1 is the cost of concept definition, C2 is the cost of design and development, C3 is the cost of manufacturing, C4 is the cost of installation, C5 is the cost of exploitation and C6 is the cost of dismantling. 
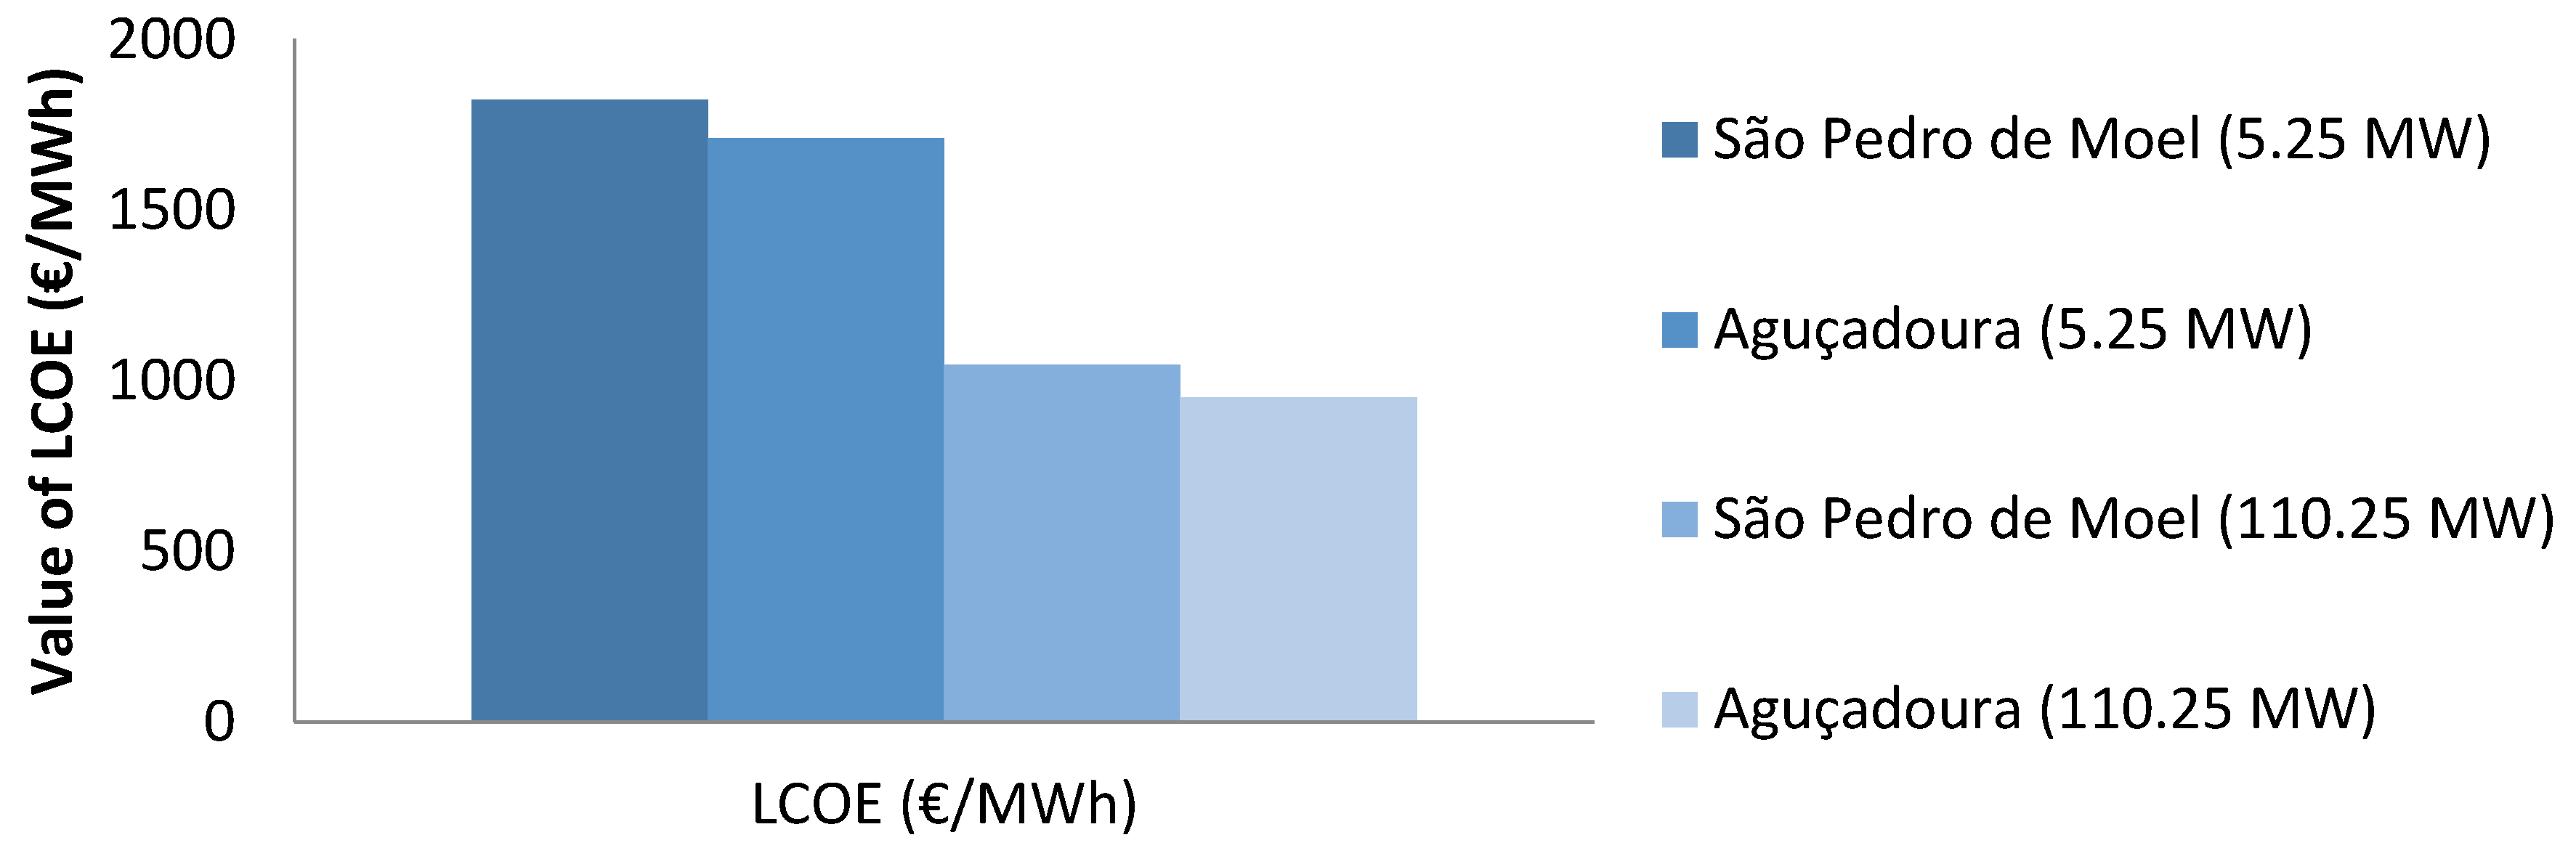
C5 is the overall exploitation cost for the number of years that the farm is active, whereas in most paper reports it is shown as an annual cost. These costs are studied in order to develop a methodology to calculate the total cost, in €, and the Levelized Cost of Energy (LCOE), in €/MWh, of the FOWEDs.
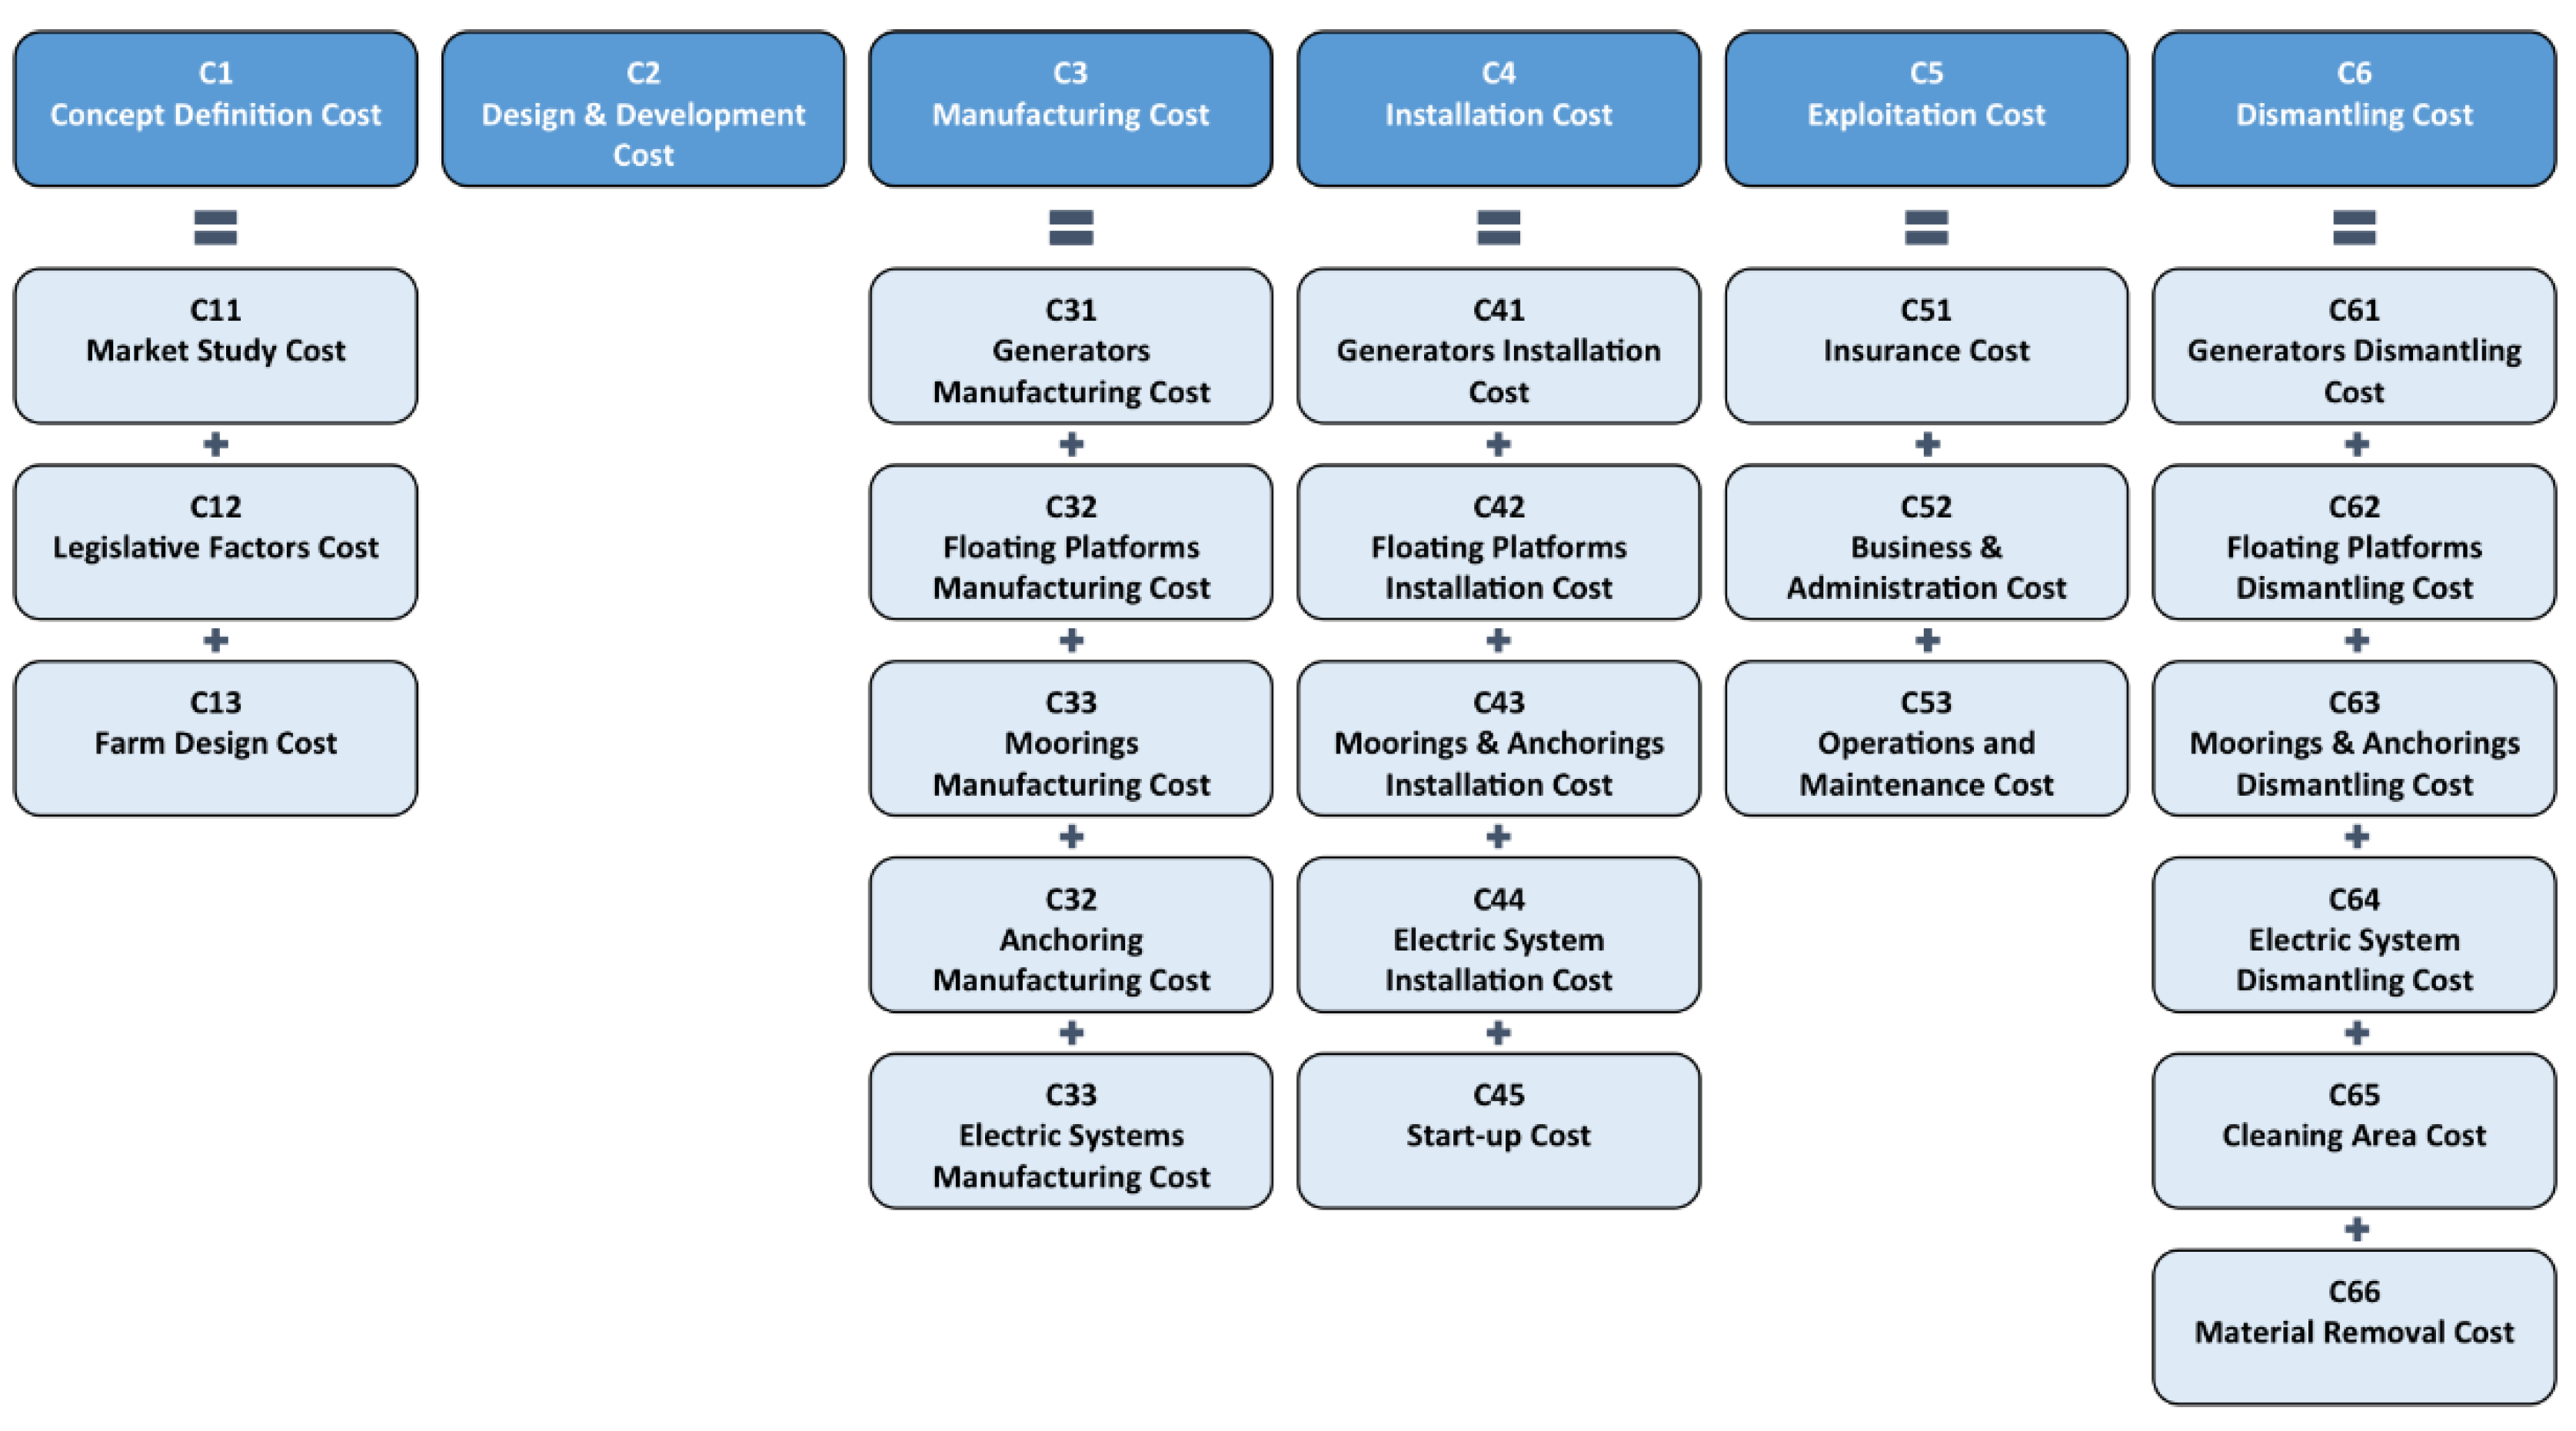
The costs are built up from their various components denoted as sub-costs (Figure 2) so as to reflect the details of the configuration on the final cost. The next sections are focused on this issue.

2.2. Concept Definition Cost

The cost of concept definition considers all the preliminary studies to develop the offshore renewable energy farm as, for instance, the offshore energy resource spatial and temporal distribution to know which location will be the most appropriate to install the offshore farm and the economic feasibility of the project, among others.
In this context, three sub-costs have been defined: market study (C11), legislative factors c (C12) and farm design (C13), as shown:
C 1 = C 11 + C 12 + C 13
The market study cost will take into account the preliminary feasibility study to know if the farm and its location will be feasible:
C 11 = C e m
The legislative factors cost is dependent on the taxes of the country selected to install the floating offshore renewable energy farm, as shown:
C 12 = C t a x e s × N f a r m
Finally, one of the most important issues in terms of installing a floating offshore renewable energy farm is to know what the location is. In this sense, the offshore energy resource available, the sea conditions ( C emet , C smet , C samet ) and the geotechnical characteristics of the seabed ( C lm ) should be studied. Therefore, their costs are as shown:
C 13 = ( C e m e t + C s m e t + C s a m e t ) + ( C l m × N A × P A )
This cost is dependent on the number of offshore renewable energy devices (NA) and their power per unit (PA), in MW.

2.3. Design and Development Cost

The design and development cost is made up by the costs of the detailed engineering of the offshore renewable energy farm designed and its management, defined here as a unitary cost of design and development (Cga). The total design and development cost is dependent on the number of floating offshore renewable energy devices (NA) and their power per unit (PA), in MW, as shown:
C 2 = C g a × N A × P A
The cost of design and development per unit (Cga) corresponds to the unit cost of the resources and the work required during this phase of detailed engineering, which includes several calculations and definitions related with the device or farm, namely the calculation of the distance between FOWEDs and their grid lines, the number of devices in the farm, considering the consumption of the nearest areas, the electric cables and substation calculations or the calculation of the moorings and anchors.

2.4. Manufacturing Cost

The manufacturing cost considers the costs of fabricating the device generators (C31), floating platforms (C32), moorings (C33), anchoring (C34) and electric systems (C35), the main components of a farm are as shown:
C 3 = C 31 + C 32 + C 33 + C 34 + C 35
The manufacturing cost of generators is mainly dependent on the cost (€/MW) of each generator (CMW). Furthermore, this value is multiplied by the power per unit (PA), in MW, and the number of floating offshore renewable energy devices (NA):
C 31 = C M W × N A × P A
The floating platform manufacturing cost is divided in two main costs: the basic floating platform, which also depends on the number of floating offshore renewable energy devices (NA), and the substation floating platform, which also depends on the number of floating platforms for the substation (Psub ):
C 32 = C 321 1 p g e n e r a t o r × N A + C 322 1 p s u b × P s u b
The cost of manufacturing the floating platforms for generators ( C 321 1 p g e n e r a t o r ) has been calculated considering an Activity-Based Cost (ABC) model in a conventional shipyard [26], where these types of floating platforms are built. The cost comprises the materials costs (CMAT), the direct labour cost (CDL), the activity cost (CACT) and the industrial profit (Bi), as shown:
C 321 1 p g e n e r a t o r = ( C M A T + C D L + C A C T ) × ( 1 + B i )
The cost of materials, direct labour and activities will be different depending on the floating offshore renewable energy platform considered, because the quantity of steel changes.
The cost of direct labour is dependent on the mass of the platform (mplatform), the live surface of the platform (Sov), the died surface of the platform (Som), the interior surface of the platform (Si) and the cost per hour (€/h) of the direct labour (Cmo):
C D L = f ( m platform , S o v ,   S o m , S i ,   C m o )
The cost of materials is also dependent on the mass of the platform (mplatform), the live surface of the platform (Sov), the dead surface of the platform (Som), the interior surface of the platform (Si) and the cost of steel in €/ton (Csteel):
C M A T = f ( m p l a t f o r m ,   S o v ,   S o m , S i ,   C s t e e l )
The cost of the activities is dependent on the direct labour cost (CDL), the materials cost (CMAT) and the mass of the platform (mplatform), namely because of aspects such as the electricity consumption and others:
C A C T = f ( m p l a t f o r m ,   C D L ,   C M A T )
The cost of manufacturing the floating platform of the substation ( C 322 1 p s u b ) has been considered as a constant value [26].
The cost of manufacturing the mooring comprises the cost of manufacturing the mooring of the device platform (C331) and the cost of manufacturing the mooring of the substation platform (C332), as shown:
C 33 = C 331 + C 332
The cost of manufacturing the mooring of the device platform is dependent on the mass per meter (kg/m) (pMOOR) of the mooring, the length of the mooring in m (LMOOR), the cost of the mooring in €/kg (CMOOR), the number of mooring lines (LP) and the number of generators (NA):
C 331 = [ ( p M O O R × L M O O R ) × C M O O R ] × L P × N A
The cost of manufacturing the mooring of the substation platform is zero because it is included here in the cost of manufacturing its floating platform.
Similarly, cost of manufacturing the anchoring comprises the cost of manufacturing the anchoring of the device platform (C341) and the cost of manufacturing the anchoring of the substation platform (C342):
C 34 = C 341 + C 342
The cost of manufacturing the anchoring of the device platform is dependent on the cost of the mass of the anchor in kg (mANC), the anchoring in €/kg (CANC) for a drag embedment anchor, the number of mooring lines (LP) and the number of generators (NA):
C 341 = N A × L P × m A N C × C A N C
Just like in the case of the moorings, the cost of the anchoring for the substation platform is zero because it is included here in the cost of manufacturing its floating platform.
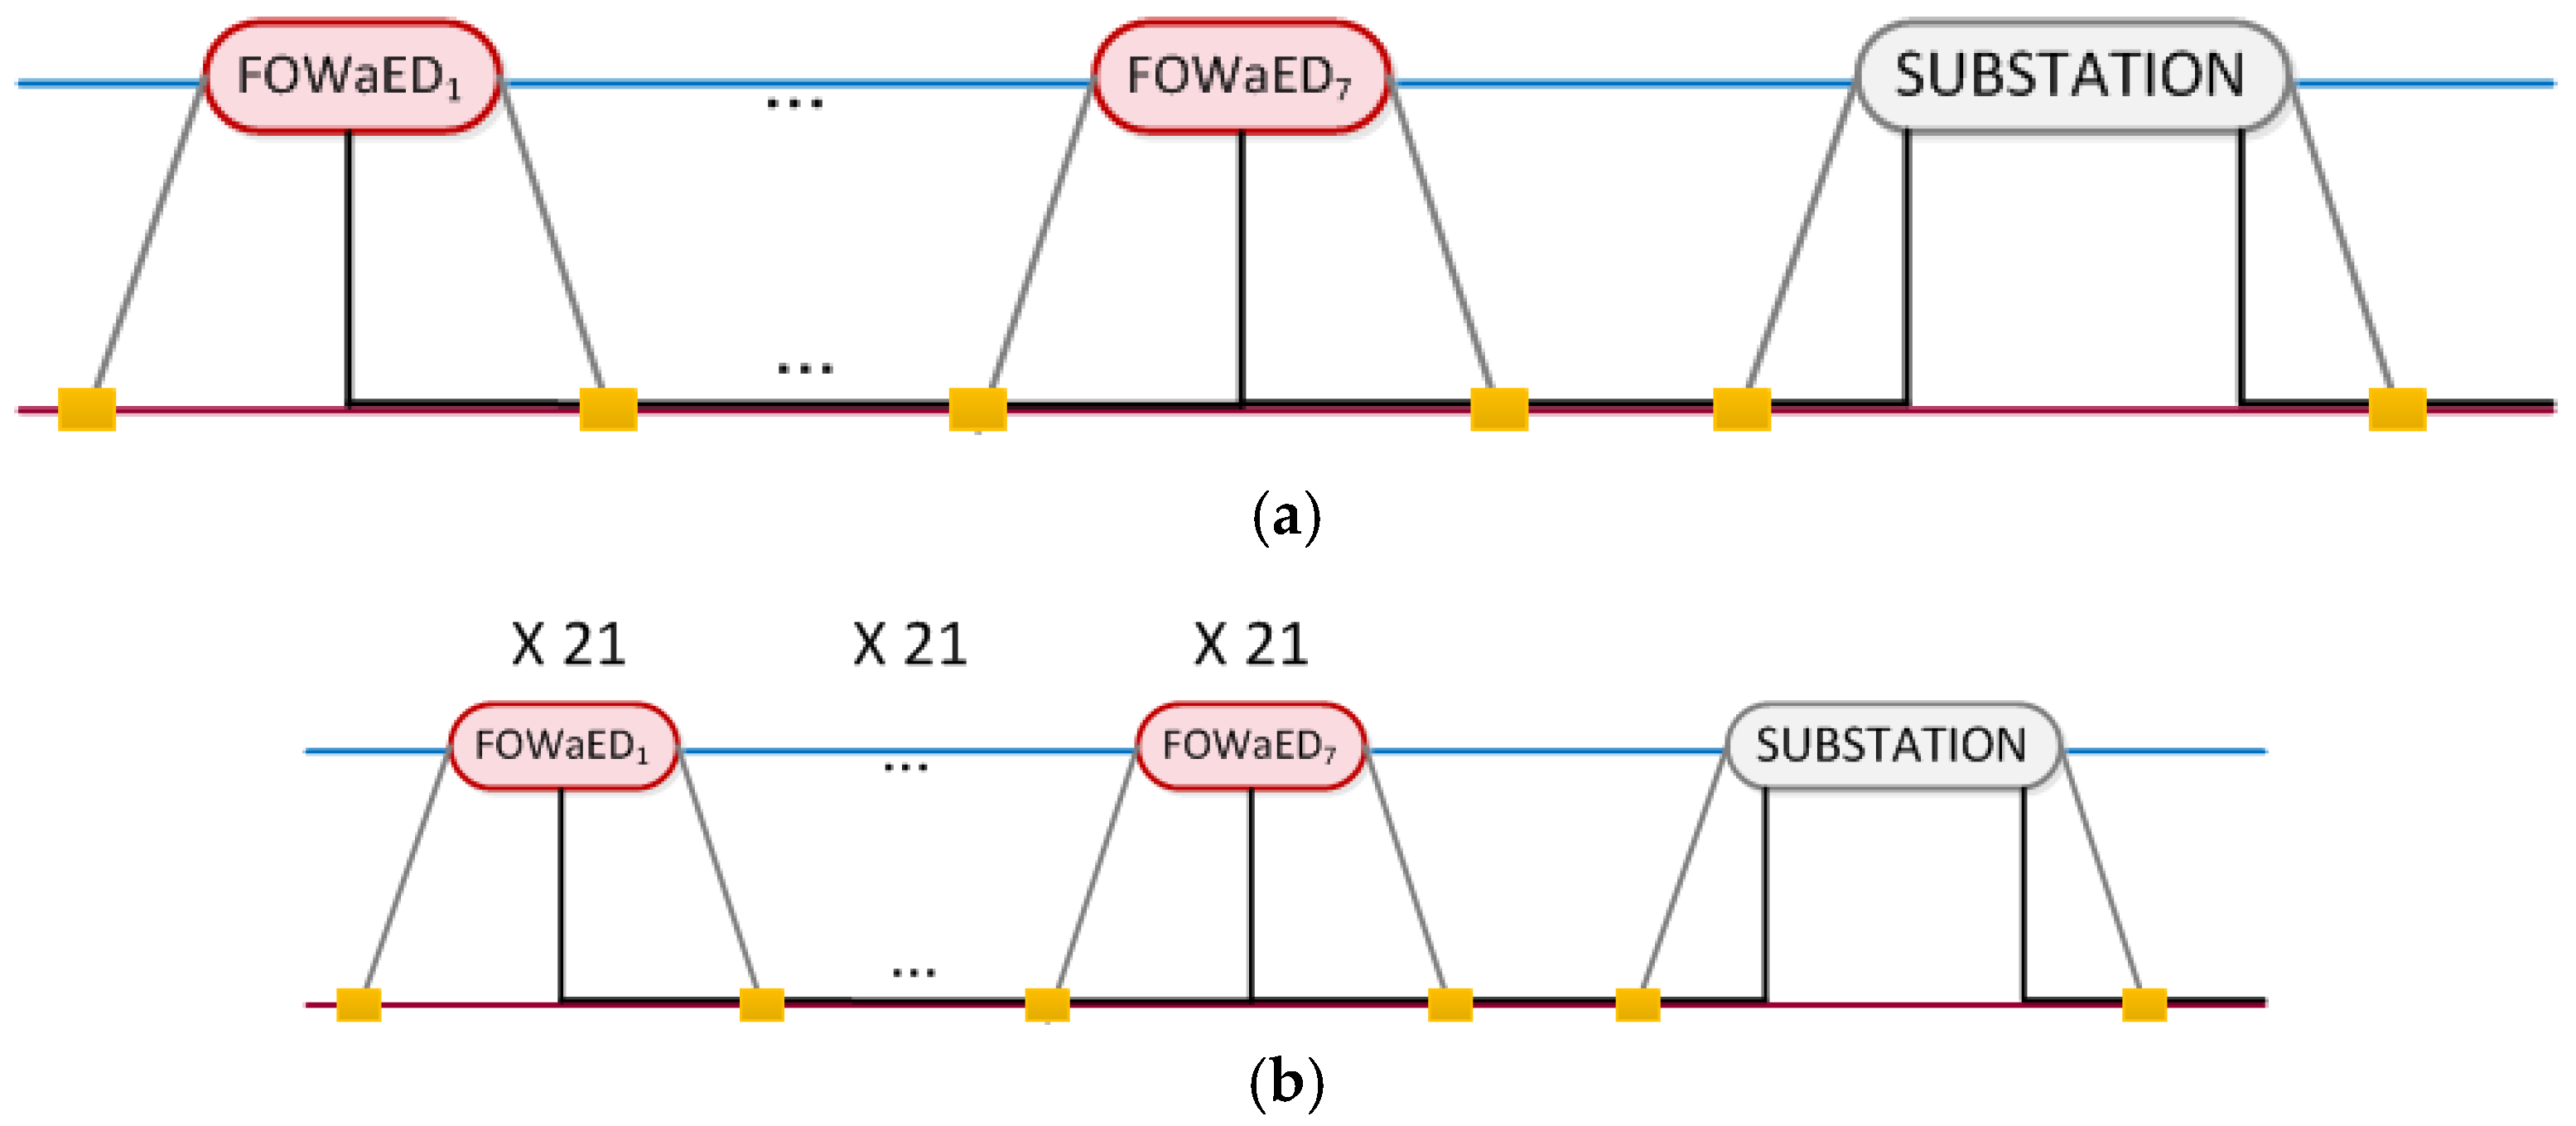
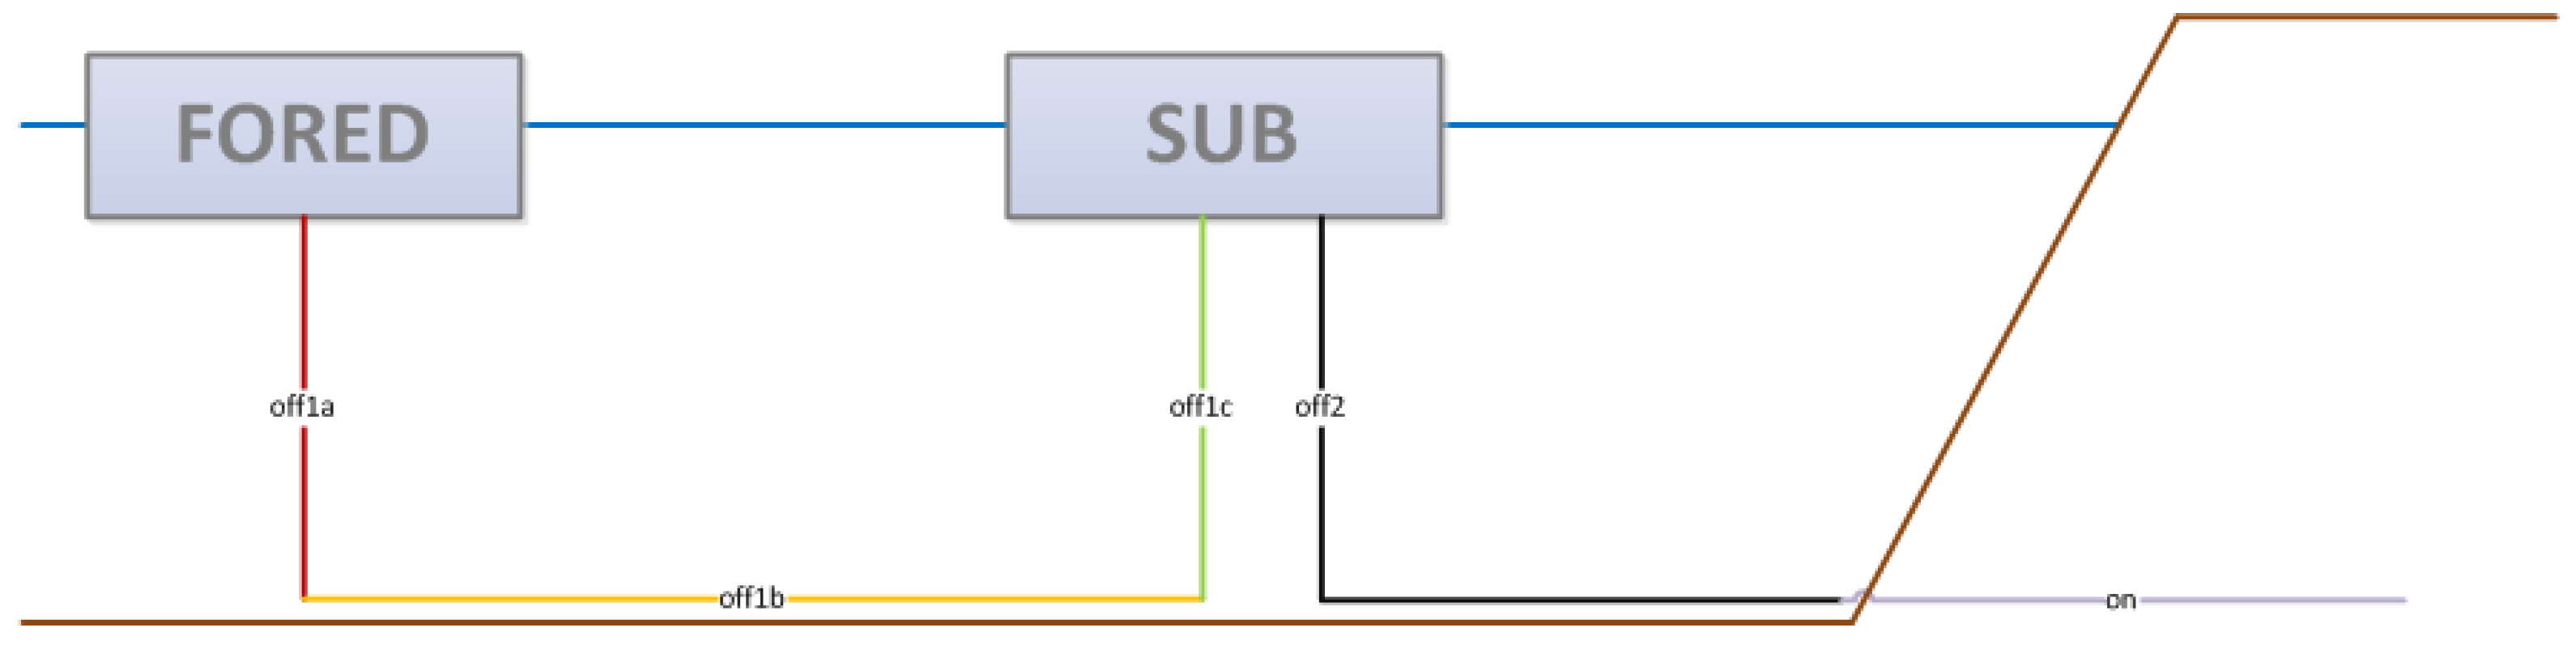
The cost of manufacturing the electric system refers to the electric cables (C351) and the substation (C352), as shown:
C 35 = C 351 + C 352
The cost of manufacturing the electric cable is dependent on the number of generators (NA), the number of electric cables (Nx), the length of the electric cable in m (dx) and the cost in €/m of the electric cable (Cx) (Figure 3), as shown:
C 351 = N F × ( N o f f 1 a × d o f f 1 a × C o f f 1 a + n = 1 n = N A F N o f f 1 b × d o f f 1 b × C o f f 1 b ) + N o f f 1 c × d o f f 1 c × C o f f 1 c + N o f f 2 × d o f f 2 × C o f f 2 + N o n × d o n × C o n
where:
AreaNxdxPx
WINDWAVES
off1aNAFP5 MW0.75 MW
off1b1NDGENERATORS × D5 MW0.75 MW
1.50 MW
2.25 MW
3.00 MW
3.75 MW
4.50 MW
5.25 MW
off1cNFP5 MW5.25 MW
off21P + d5 MW5.25 MW
on1donshore5 MW5.25 MW
The cost of manufacturing the substation is calculated as in an onshore location, but taking into consideration a coefficient (KSUBE) which makes this value higher, because the cost of an offshore substation, in terms of corrosion, is higher than the onshore one. In addition, it depends on the number of transformers (NTS), the cost of the transformer (CTS) and the cost of the GIS (CGIS), as shown:
C 352 = K S U B E × N T S × ( C T S + C G I S )

2.5. Installation Cost

The installation cost comprises the cost of installing the device generator (C41), the floating platforms (C42), the moorings and anchorings (C43), and the electric system (C44). It also includes the start-up cost (C45), as shown:
C 4 = C 41 + C 42 + C 43 + C 44 + C 45
The cost of installing the generator (C41) is dependent on the costs related to the shipyard or port operations (C41pa), the costs due to its transport (C41transport) and the costs due to its installation (C41installation), as shown:
C 41 = C 41 p a + C 41 t r a n s p o r t + C 41 i n s t a l l a t i o n
The value of the cost of port operations (C41pa) is dependent on the type of floating offshore renewable energy considered. In this sense, this cost is dependent on the number of generators (NA), the distance from shipyard to port in m (dshipyard−port), the speed of the tug in m/s (vtug), the cost of transporting to port in €/h (Ctransport to port), the time spent on loading the generator at port in s (tchargeGENERATOR), the cost of the port crane in €/h (Ccrane), the number of liftings of the generator to charge it (NIchargeGENERATOR) and the time to lift the generator in the vessel (TIchargeGENERATOR), as shown:
C 41 p a = N w i × 2 3600 s 1 h × d s h i p y a r d p o r t v t u g × C t r a n s p o r t   t o   p o r t + N w i × t l o a d G E N E R A T O R × C c r a n e
where:
t l o a d G E N E R A T O R = N I l o a d G E N E R A T O R × T I l o a d G E N E R A T O R
For wave energy devices, the cost of the shipyard or port operations (C41pa) is zero because it is included here in the cost of installing the floating platform, since the device generator is inside the platform.
The transport cost of installing the generator is zero due to the fact that it is included in the cost of installing the floating platform. The main reason for this issue is the fact that the installation process will take part in towing the floating platform. Therefore, the transportation of the generator is simultaneous to the transportation of the floating platform.
C 41 t r a n s p o r t = 0   ( included in the cost of installing the floating platform )
The installation cost of the generators, for the case of the floating offshore wind energy, is dependent on the number of generators (NA), the time spent on loading the generator at port in s (tchargeGENERATOR) and the cost of the port crane in €/h (Ccrane), as shown:
C 41 i n s t a l l a t i o n = N w i × t l o a d G E N E R A T O R × C c r a n e
However, for wave energy devices, the cost of installing the device generators ( C 41 i n s t a l l a t i o n ) is included in the cost of installing the floating platform, hence its value here is zero.
On the other hand, the cost of installing the floating platforms is also composed of three main sub-costs, as equation shows: operations at port or shipyard ( C 42 p a ), transport of the platforms ( C 42 t r a n s p o r t ) and installation of the platform ( C 42 i n s t a l l a t i o n ):
C 42 = C 42 p a + C 42 t r a n s p o r t + C 42 i n s t a l l a t i o n
The cost related to the operations at port or shipyard depends on the number of generators (NA), the distance from shipyard to port in m ( d s h i p y a r d p o r t ), the speed of the tug in m/s ( v t u g ), the cost of transporting the platform to port in €/h ( C t r a n s p o r t   t o   p o r t ), the time spent on hiring the installations of the shipyard or the port to storage the platforms in s ( t h i r e P L A T ), the area of storage in m2 ( S h i r e P L A T ), the cost of store in ( C S s t o r a g e ), the time spent on loading the platform at port in s ( t l o a d G E N E R A T O R ) and the cost of the port crane in €/h ( C c r a n e ):
C 42 p a = N A × 2 3600 s 1 h × d s h i p y a r d p o r t v t u g × C t r a n s p o r t   t o   p o r t + t h i r e P L A T × ( S h i r e P L A T × C S s t o r a g e ) + N A × t l o a d P L A T × C c r a n e
The cost of transporting the floating platforms is calculated depending on the number of vessels considered ( N v e s s e l T P L A T ), the number of platforms ( N P L A T ), the coefficient TA1 calculated before, the cost of the vessel taken into account in €/day ( C v e s s e l T P L A T ) and the cost of moving the vessel in € ( C m o v T P L A T ):
C 42 t r a n s p o r t = ( N v e s s e l T P L A T × N A ) × TA 1 × C v e s s e l T P L A T + C m o v T P L A T
The cost of installing the floating platforms is dependent on the number of vessels used to install the platform ( N v e s s e l T P L A T ), the time of installing the platform ( t i n s t a l l a t i o n P L A T ), the number of platforms ( N P L A T ) and the cost of the crane in the shipyard ( C c r a n e   s h i p y a r d ), as shown:
C 42 i n s t a l l a t i o n = N v e s s e l T P L A T × t i n s t a l l a t i o n P L A T 24 h d a y × N A × C c r a n e   s h i p y a r d
Regarding the cost of installing the mooring and anchoring (C43) a methodology considering an Anchor Handling Vehicle, which is specialized in this field, has been considered [27]. This type of installation does not need submersed equipment, which reduces cost. The value of this cost is calculated as a function of the cost of the vessel in €/day ( C a a A H V ), the cost of its direct labour in €/day ( C a a D L ), the cost of pumps and divers in €/day ( C a a p u m p s & d i v e r s ), the number of anchors ( N a n c h o r s ), the time spent on installing using an AHV in anchors/day ( T i n s t A H V ), as shown:
C 43 = ( C a a A H V + C a a D L + C a a p u m p s & d i v e r s ) × ( N a n c h o r s T i n s t A H V )
where the number of anchors ( N a n c h o r s ) is dependent on the number of device generators (NA), the number of mooring lines per platform (LP), the number of substation platforms ( P s u b ) and the number of mooring lines per substation ( L P s u b ):
N a n c h o r s = N A × L P + P s u b × L P s u b
The cost of installing the electric system (C44) is composed of two main aspects: the cost of installing the electric cable ( C 44 c a b l e ) and the cost of installing the substation ( C 44 s u b ):
C 44 = C 44 c a b l e + C 44 s u b
The cost of installing the electric cable is calculated depending on the cost of installing the 20 kV electric cable in €/day ( C i n s t 20 k V ), the coefficient of installing the 20 kV electric cable in m/day ( K i n s t 20 k V ), the number of lines of devices (NF), the cost of installing the 220 kV electric cable in €/day ( C i n s t 220 k V ), the coefficient of installing the 220 kV electric cable in m/day ( K i n s t 220 k V ), the cost of onshore electric cable installation in €/m ( C i n s t o n s h o r e ), the number of electric cables ( N x ) and the length in m of the electric cables ( d x ), as shown:
C 44 c a b l e = C i n s t 20 k V × 1 K i n s t 20 k V × ( N F × N o f f 1 a × d o f f 1 a + N F × n = 1 n = N A F N o f f 1 b n × d o f f 1 b n + N o f f 1 c × d o f f 1 c ) + C i n s t 220 k V × 1 K i n s t 220 k V   × N o f f 2 × d o f f 2 + C i n s t o n s h o r e × N o n × d o n
On the other hand, the calculation of the cost of installing the substation ( C 44 s u b e ) is dependent on costs of port ( C i s u b p o r t ), transport ( C i s u b t r a n s p o r t ) and installation ( C i s u b i n s t a l l a t i o n ). Its calculus is analog to the floating platform installation process:
C 44 s u b = ( P s u b ) × C i s u b p o r t + C i s u b t r a n s p o r t + ( P s u b ) × C i s u b i n s t a l l a t i o n
where:
C i s u b p o r t = t h i r e S U B E × ( S h i r e S U B E × C S s t o r a g e ) + ( N T S × 1 + 2 ) × t c h a r g e S U B E × C c r a n e
t h i r e S U B = T A 6 s u b + T A 7 s u b + T A 4 s u b
t c h a r g e S U B = ( N T S × 1 + 2 ) × T I c h a r g e S U B
C i s u t r a n s p o r t = N v e s s e l T 1 S U B × TA 6 sub × P s u b N A × C v e s s e l T 1 S U B + N v e s s e l T 2 S U B × TA 7 sub × P s u b N A × C v e s s e l T 2 S U B + C m o v T 1 S U B + C m o v T 2 S U B
C i s u b i n s t a l l a t i o n = T A 4 s u b × P s u b N A × C v e s s e l I S U B + C m o v I S U B
Finally, the start-up cost is calculated as follows:
C 45 = C s t a r t u p

2.6. Exploitation Cost

The exploitation cost (C5) is composed of several sub-costs: the insurance (C51), the business & administration (C52) and the operation and maintenance (C53), as shown:
C 5 = C 51 + C 52 + C 53
The insurance cost is considered here as a percentage of the sum of the costs of the previous phases—concept definition, design and development, manufacturing and installation [28]:
C 51 = 0.01 × ( C 1 + C 2 + C 3 + C 4 )
The business and administration cost is composed of the number of years of the life-cycle of the farm ( N f a r m ), the cost per year of the administration of the farm ( C g A D M ) and the cost per year of the legal aspects ( C g L E G A L ), as shown:
C 52 = N f a r m × ( C g A D M + C g L E G A L )
The operation and maintenance cost is calculated taking into consideration two aspects [29,30,31]: the preventive maintenance cost per year (C531), the corrective maintenance cost per year (C532) and the number of years of the life-cycle of the farm ( N f a r m ), as shown:
C 53 = ( C 531 + C 532 ) × N f a r m
The preventive maintenance cost includes activities such as periodic equipment inspection, oil and filters changes, calibration and adjustment of sensors, equipment substitution or cleaning. The specific tasks related to the preventive maintenance are considered in the specific brochure of each equipment manufacturer. Its value can be determined taking into account: the cost of transportation ( C M P T R A N S P ), the cost of materials ( C M P M A T p ) and the cost of direct labour ( C M P D L p ). The cost of materials and direct labour are calculated for each of the main components involved: device (p = 1), floating platform (p = 2), mooring (p = 3), anchoring (p = 4) and electric system (p = 5). However, the cost of transportation is considered only once here, because it is assumed that the trip of the vessel will be the same for all the components. Furthermore, it is necessary to say that the preventive maintenance will take place in summer because it is the season when the weather conditions are better. Therefore, the costs will be reduced.
C 531 = C M P T R A N S P + p = 1 p = 5 C M P M A T p + p = 1 p = 5 C M P D L p
The cost of transportation for preventive maintenance is calculated taking into account: the time needed to go from the port to the farm ( t p o r t f a r m ), the time considered in the farm to carry out the tasks ( t f a r m ) and the daily cost of the transport for preventive maintenance in €/day ( C D M P T R A N S P ):
C M P T R A N S P = ( 2 × t p o r t f a r m + t f a r m ) × C D M P T R A N S P  
being the various components of time dependent, among others, on the speed of the maintenance vessel in m/s ( V M P B N P ):
t p o r t f a r m = d p o r t × ( 1 + K t i m e ) V M P B N P × 3600 s 1 h × 24 h 1   d a y
t f a r m = N A F × 4 × D + N F × 7 × D V M P B N P × 3600 s 1 h × 24 h 1   d a y
C D M P T R A N S P = C F S V
The cost of direct labour for preventive maintenance depends on the type of component considered, as shown:
DEVICE (GENERATOR) C M P D L 1 = N M P D L 1 × ( N A × T M P D L 1 ) × C H M P D L 1 (50)
FLOATING PLATFORM C M P D L 2 = N M P D L 2 × ( ( N A + P s u b ) × T M P D L 2 ) × C H M P D L 2 (51)
MOORING C M P D L 3 = N M P D L 3 × ( N A × T M P D L 3 ) × C H M P D L 3 (52)
ANCHORING C M P D L 4 = C M P D L 3 (53)
ELECTRIC SYSTEM C M P D L 5 = N M P D L 3 × ( N o f f 1 a + n = 1 n = N A F N o f f 1 b n + N o f f 1 c + N o f f 2 + N o n + P s u b ) × T M P D L 3 × C H M P D L 3 × K p r e v T S (54)
The preventive maintenance of the generator includes visual reviews, cleaning, calibration, lubrication, etc. of its main components. N M P D L 1 is the number of people, T M P D L 1 is the required time in h/generator and C H M P D L 1 is the cost of the direct labour for preventive maintenance in €/h ( 2 × C D L p r e v e n t i v e ).
The preventive maintenance of the floating platform also includes visual inspections, cleaning, etc. N M P D L 2 is the number of persons, T M P D L 2 is the required time in h/platform and C H M P D L 2 is the cost of the direct labour for preventive maintenance in €/h ( C D L p r e v e n t i v e ).
The preventive maintenance of mooring also includes visual reviews, cleaning, etc. N M P D L 3 is the number of people, T M P D L 3 is the required time in h/mooring and C H M P D L 3 is the cost of the direct labour for preventive maintenance in €/h ( C D L p r e v e n t i v e ). The reviews will take place in the submersed area. Therefore, divers will be used for these tasks. Then, the cost will be similar to the platform cost.
The material cost of the preventive maintenance is dependent on the cost of the direct labour ( C M P D L p ) and the cost of the transport ( C M P T R A N S P ) [28], as shown:
C M P M A T = p = 1 p = 5 10 % × ( C M P D L p + C M P T R A N S P )
The corrective maintenance is not programmed, taking place after the occurrence of a failure. Its cost is composed of the cost of direct labour ( C M C D L p ), the cost of transportation ( C M C T R A N S P p ), the cost of materials ( C M C M A T p ) and the failure probability of the component “p” ( P f a i l u r e p ) [29], as shown:
C 532 = p = 1 p = 5 P f a i l u r e p × ( C M C D L p + C M C T R A N S P p + C M C M A T p )
The corrective maintenance cost for the generator (p = 1) is dependent on the probability of failure of each component c1 of the generator ( P f a i l u r e c 1 ), the cost of direct labour ( C M C D L c 1 ), the cost of transport ( C M C T R A N S P c 1 ) and the cost of materials ( C M C M A T c 1 ) for each of these components, as shown:
C 532 1 = c 1 = 1 P f a i l u r e c 1 × ( C M C D L c 1 + C M C T R A N S P c 1 + C M C M A T c 1 )
The number of components considered depends on the type of technology, which is dependent on the offshore renewable energy (see Table 1):
The corrective cost for the floating platform is calculated considering the failure probability of the floating platform ( P f a i l u r e 2 ), the probability of using crane in the corrective maintenance ( P c r a n e ), the probability of not using crane in the corrective maintenance ( P n o   c r a n e ) and the coefficient due to the accommodation of the direct labour ( K D L ):
C 532 2 = P f a i l u r e 2 × [ P c r a n e × ( ( 1 + K D L ) × C M C D L + T R A N S P c r a n e + ( N A + P s u b ) × C M C M A T c r a n e ) + P n o   c r a n e × ( ( 1 + K D L ) × C M C D L + T R A N S P n o   c r a n e + ( N A + P s u b ) × C M C M A T n o   c r a n e ) ]
where:
C M C D L + T R A N S P c r a n e = C f l o a t i n g p l a t f o r m
C M C D L + T R A N S P n o   c r a n e = C t u g
C M C M A T c r a n e = 10 % × C M C D L + T R A N S P c r a n e
C M C M A T n o   c r a n e = 10 % × C M C D L + T R A N S P n o   c r a n e
The corrective cost for the mooring is dependent on the cost of direct labour ( C M C D L 3 ), the cost of transport ( C M C T R A N S P 3 ), the cost of materials ( C M C M A T 3 ), the failure probability of the mooring ( P f a i l u r e 3 ), the number of devices ( N A ) and the number of mooring lines per generator ( L P ), as shown:
C 532 3 = P f a i l u r e 3 × ( N A × L P × C M C D L 3 + C M C T R A N S P 3 + N A × L P × C M C M A T 3 )
where:
C M C M A T 3 = 10 % × ( C M C D L 3 + C M C T R A N S P 3 )
The corrective cost for the anchoring, the calculation of which is very similar to the mooring cost, is dependent on the cost of direct labour ( C M C D L 4 ), the cost of transport ( C M C T R A N S P 4 ), the cost of materials ( C M C M A T 4 ), the failure probability of the mooring ( P f a i l u r e 4 ) [32], the number of devices (NA) and the number of mooring lines per generator (LP), as shown:
C 532 4 = P f a i l u r e 4 × ( N A × L P × C M C D L 4 + C M C T R A N S P 4 + N A × L P × C M C M A T 4 )
where:
C M C M A T 4 = 10 % × ( C M C D L 4 + C M C T R A N S 4 )
The corrective cost of the electric system is dependent on the number of transformers ( N T S ), the probability of failure of the transformers ( P f a i l u r e T S ), the cost of the corrective maintenance of the transformers ( C M C T S ), the parameter of the substation ( K S U B E ), the number of electric cables ( N x ), the probability of failure of the electric cables ( P f a i l u r e x ) and the cost of the corrective maintenance of the electric cable ( C M C C ), as shown:
C 532 5 = 0.75 × ( N T S × P f a i l u r e T S × C M C T S × K S U B E + ( N o f f 1 a × P f a i l u r e o f f 1 a + n = 1 n = N A F N o f f 1 b n × P f a i l u r e o f f 1 b n + N o f f 1 c × P f a i l u r e o f f 1 c + N o f f 2 × P f a i l u r e o f f 2 + N o n × P f a i l u r e o n ) × C M C C )

2.7. Dismantling Cost

The floating offshore renewable energy farm should be dismantled at the end of operational life in order to clean the area and leave it as initially. Firstly, the farm is disassembled and, then, the main materials obtained (steel, copper, etc.) can be sold. This income will be considered as a negative cost. Here, the dismantling cost is dependent on the cost of dismantling device generators (C61), the floating platforms (C62), the mooring and anchoring systems (C63) and the electric system (C64). It also includes the cleaning cost of the area (C65) and the removal cost of the materials (C66), as shown:
C 6 = C 61 + C 62 + C 63 + C 64 + C 65 + C 66
The dismantling method of the device generators is the same as in the case of the installation process. However, in this case the time will be less, because less caution is necessary in the process. In this sense, the cost of dismantling the device generators is dependent on the cost of the offshore dismantling of the device ( C 61 d i s m a n t l i n g ), the cost of its transport from the farm to the port ( C 61 t r a n s p o r t ) and the cost of the process at port ( C 61 p a ), as shown:
C 61 = C 61 d i s m a n t l i n g + C 61 t r a n s p o r t + C 61 p a
Here it is considered that the device generator is towed simultaneously with the floating platform. For this reason C 61 d i s m a n t l i n g and C 61 t r a n s p o r t are zero. The cost of the process at port is as shown:
C 61 p a = N A × t c h a r g e G E N E R A T O R × C c r a n e
The cost of dismantling the floating platforms is also dependent on the cost of the offshore dismantling of the platform ( C 62 d i s m a n t l i n g ), the cost of its transport from the farm to the port ( C 62 t r a n s p o r t ) and the cost of the process at port ( C 62 p a ), as shown:
C 62 = C 62 d i s m a n t l i n g + C 62 t r a n s p o r t + C 62 p a
In this case, the offshore dismantling cost of the platform is zero, because it is dismantled onshore. The cost of the transport in terms of dismantling is the same as in the case of the installation process, i.e.,:
C 62 t r a n s p o r t = C 42 t r a n s p o r t
The cost due to the operations at port for the floating platform is calculated as follows:
C 62 p a = N A × t c h a r g e P L A T F O R M × C c r a n e
The cost of dismantling the mooring and anchoring systems is similar to their installation cost, but considering less time for the operations ( T d i s m a n t l i n g A H V ):
C 63 = ( C a a A H V + C a a D L + C a a p u m p s & d i v e r s ) × ( N a n c h o r s T d i s m a n t l i n g A H V )
The cost of dismantling the electric system is composed of two main components: the cost of dismantling the electric cables ( C 64 c a b l e ) and the cost of dismantling the offshore substation ( C 64 s u b e ):
C 64 = C 64 c a b l e + C 64 s u b e
The requirements of the vessels for the dismantling of the electric cables are less strict than the installation process. Therefore, its cost will also be inferior. In this case, tugs, cargo barges and OSV have been considered. The electric cable is cut in portions. In this context, the cost of dismantling the electric cable is dependent on the cost of the barge for dismantling the cable in €/day ( C b a r g e d i s m a n t l i n g c a b l e + C O S V d i s m a n t l i n g c a b l e ), the cost of the OSV vessel for dismantling the electric cable in €/day ( C OSVdismantlingcable ), the cost of the dredge for dismantling the electric cable in €/day ( C d r e d g e d i s m a n t l i n g c a b l e ), the dismantling coefficient of the 20 kV electric cable in €/m ( K d i s m a n t l i n g 20 k V ), the dismantling coefficient of the 220 kV electric cable in €/m ( K d i s m a n t l i n g 220 k V ), the cost of installing the onshore electric cable ( C i n s t o n ), the number of electric cables ( N x ) and the length in m of each electric cable ( d x ), as shown:
C 64 c a b l e = ( C b a r g e d i s m a n t l i n g c a b l e + C O S V d i s m a n t l i n g c a b l e ) × [ 1 K d i s m a n t l i n g 20 k V × ( N o f f 1 a × d o f f 1 a + n = 1 n = N A F N o f f 1 b n × d o f f 1 b n + N o f f 1 c × d o f f 1 c ) ] + ( C b a r g e d i s m a n t l i n g c a b l e + C O S V d i s m a n t l i n g c a b l e + C d r e d g e d i s m a n t l i n g c a b l e ) × [ 1 K d i s m a n t l i n g 220 k V × ( N o f f 2 × d o f f 2 ) ] + 0.3 × C i n s t o n × N o n × d o n
The cost of dismantling the offshore substation is dependent on the number of substations ( P s u b ), the cost of dismantling the substation ( C d i s m a n t l i n g s u b i n s t a l l a t i o n ), the cost of transporting the substation ( C i s u b t r a n s p o r t ) and the cost of dismantling the substation at port ( C d i s m a n t l i n g s u b p o r t ), as shown:
C 64 s u b e = P s u b × C d i s m a n t l i n g s u b p o r t + C i s u b t r a n s p o r t + P s u b × C d i s m a n t l i n g s u b i n s t a l l a t i o n
where:
C d i s m a n t l i n g s u b p o r t = ( N T S × 1 + 1 + 1 ) × t l o a d S U B × C c r a n e
C d i s m a n t l i n g s u b i n s t a l l a t i o n = T A 4 × P s u b N A × C v e s s e l I P L A T + C m o v I P L A T
Cleaning the area is carried out considering the methodology taken into account in the offshore oil industry, which considers the total surface of the farm. In this sense, the cost of the cleaning area is dependent on the cost of cleaning the surface occupied by the farm in €/m2 ( C c l e a n i n g m 2 ), the number of lines (NF), the number of diameters per line ( N D L I N E S ), the diameter of the generator (D), the number of devices per line (NAF) and the number of diameters between devices ( N D G E N E R A T O R S ), as shown:
C 65 = C c l e a n i n g m 2 × ( N F × N D L I N E S × D ) × ( N A F × N D G E N E R A T O R S × D )
Finally, the cost of the disposal of the materials is composed of the cost of its processing ( C 66 p r o c e s s i n g ), transportation ( C 66 t r a n s p o r t ) and elimination ( C 66 e l i m i n a t i o n ) (income if it is sold as scrap or cost if it is taken to a dump):
C 66 = C 66 p r o c e s s i n g + C 66 t r a n s p o r t + C 66 e l i m i n a t i o n
Considering the elimination, some of the components will be sold as scrap whereas the rest will be disposed of a dump, as Table 2 and Table 3 show.
The processing cost is determined considering each of the components of the floating offshore renewable energy farm. It depends on the length of processing of each of the components ( L p r o c e s s i n g X ) and the cost of processing in €/m of them ( C p r o c e s s i n g ):
C 66 p r o c e s s i n g = ( L p r o c e s s i n g G E N E R A T O R + L p r o c e s s i n g P L A T F O R M + L p r o c e s s i n g M O O R & A N C H + L p r o c e s s i n g C A B L E S + L p r o c e s s i n g S U B ) × C p r o c e s s i n g
The cost of the transport for disposal is also dependent on the component of the farm considered [33]:
C 66 t r a n s p o r t = [ N A × ( m t r a n s p o r t G E N E R A T O R + m t r a n s p o r t M O O R & A N C H + m t r a n s p o r t C A B L E S + m t r a n s p o r t S U B + m t r a n s p o r t P L A T + m t r a n s p o r t E Q U I P P L A T ) + ( N A + P s u b ) × m t r a n s p o r t P L A T ] × C l o r r y
where:
DEVICE GENERATOR (WIND) m t r a n s p o r t G E N E R A T O R = m r o t o r 24000 × d d u m p + m n a c e l l e 24000 × d s c r a p + m t o w e r 24000 × d s c r a p (84)
DEVICE GENERATOR (WAVE) m t r a n s p o r t G E N E R A T O R = m g e n e r a t o r W A V E S 24000 × d d u m p (85)
MOORING & ANCHORING m t r a n s p o r t M O O R & A N C H = L P × m M O O R + L P × m A N C H 24000 × d d u m p (86)
CABLES m t r a n s p o r t C A B L E S = m c a b l e 24000 × d s c r a p (87)
SUBSTATION m t r a n s p o r t S U B = N T S × ( m T S + m G I S ) 24000 × d d u m p (88)
PLATFORM m t r a n s p o r t P L A T = m P L A T F O R M 24000 × d s c r a p (89)
EQUIPMENT PLATFORM m t r a n s p o r t E Q U I P P L A T = m e q u i p m e n t 24000 × d d u m p (90)
and:
m c a b l e = N o f f 1 a × m o f f 1 a × d o f f 1 a + n = 1 n = N A F N o f f 1 b n × m o f f 1 b n × d o f f 1 b n + N o f f 1 c × m o f f 1 c × d o f f 1 c + N o f f 2 × m o f f 2 × d o f f 2 + N o n × m o n × d o n
Finally, the cost of eliminating the materials comprises the cost of eliminating each of the components, i.e.,
C 66 e l i m i n a t i o n = C 66 e l i m i n a t i o n G E N E R A T O R + C 66 e l i m i n a t i o n E Q U I P P L A T + C 66 e l i m i n a t i o n P L A T + C 66 e l i m i n a t i o M O O R & A N C H + C 66 e l i m i n a t i o n C A B L E S + C 66 e l i m i n a t i o n S U B
where:
DEVICE GENERATOR (WIND) C 66 e l i m i n a t i o n G E N E R A T O R = N A × m r o t o r × C d u m p N A × m n a c e l l e × C s c r a p   s t e e l N A × m t o w e r × C s c r a p   s t e e l (93)
DEVICE GENERATOR (WAVE) C 66 e l i m i n a t i o n G E N E R A T O R = N A × m g e n e r a t o r W A V E S × C d u m p (94)
MOORING & ANCHORING C 66 e l i m i n a t i o M O O R & A N C H = N A × ( L P × m M O O R + L P × m A N C H )   × C d u m p (95)
CABLES C 66 e l i m i n a t i o n C A B L E S = m c a b l e × C s c r a p   a l u m i n i u m (96)
SUBSTATION C 66 e l i m i n a t i o n S U B = N A × N T S × ( m T S + m G I S ) × C d u m p (97)
PLATFORM C 66 e l i m i n a t i o n P L A T = ( N A + P s u b ) × m P L A T F O R M × C s c r a p   s t e e l (98)
EQUIPMENT PLATFORM C 66 e l i m i n a t i o n E Q U I P P L A T = N A × m e q u i p m e n t × C d u m p (99)
The cost of eliminating the materials is dependent, among others, on the cost of the steel for scrap in €/kg ( C s c r a p   s t e e l ), the cost of the dump in €/kg ( C d u m p ) and the cost of aluminium for scrap in €/kg ( C s c r a p   a l u m i n i u m ). It is negative when the material can be sold, being considered as income.

2.8. Energy Produced

The energy produced is dependent on the type of offshore renewable energy considered but the formula to assess energy production might be the same. Here, the energy produced is dependent on the number of devices (NA), the energy produced by one device in kWh/year ( E 1 D E V I C E ), the percentage of availability ( η a v a i l a b i l i t y ) and the transmission efficiency ( η t r a n s m i s s i o n ), as shown:
E = N A × E 1 D E V I C E × η a v a i l a b i l i t y × η t r a n s m i s s i o n
In the case of the offshore wind, the energy produced by one offshore wind turbine is dependent on the number of hours per year ( N H A T = N d a × N h d ), the power curve of the wind turbine ( P C P ( v ) ) and the Weibull wind distribution ( p W e i b u l l ( v ; c a , k a ) ), which also is dependent on the offshore wind speed (v) [34], the scale parameter of wind ( c a ) and the shape parameter of wind ( k a ) [35,36]. The integral includes the values of speed from zero to the cut-out speed ( v D ) of the wind turbine:
Wind E 1 D e v i c e = N H A T 1000 × 0 v D P C P ( v ) × p W e i b u l l ( v ; c a , k a )   d v (101)
On the other hand, the energy produced by a wave energy device can be calculated considering two methods. Method 1 (M1) is dependent on the power matrix of the device ( P o w e r   m a t r i x D e v i c e ) and the probability or yearly distribution matrix of the sea states of the location considered ( S e a   s t a t e   m a t r i x l o c a t i o n ) [14]:
Wave (M1): E 1 D e v i c e = P o w e r   m a t r i x D e v i c e × S e a   s t a t e   m a t r i x l o c a t i o n (102)
However, Method 2 (M2) is dependent on the sea water density (ρ), the gravity (g), the wave period ( T w a v e s ) and the wave height ( H w a v e s ) [3], [32]:
Wave (M2): E 1 D e v i c e = ρ × g 2 4 × π 0 2 π 0 f 1 × S ( f , θ ) d f d θ 0.5 × H w a v e s 2 × T w a v e s (103)

2.9. Levelized Cost of Energy (LCOE)

The Levelized Cost of Energy (LCOE) allows to compare different technological alternatives which have different investment and time operations or were located in the same place. The LCOE depends on the total cost of the FOREF in the “n” period ( L C S F O R E D n ), which goes from the year 1 to the number of year of the life-cycle of the project ( N f a r m ), and the capital cost of the project (r):
L C O E = n = 0 N f a r m L C S F O R E D n ( 1 + r ) n n = 0 N f a r m E ( 1 + r ) n
It is important to know that the total cost is different depending on the year considered. The total cost of year 0 is the cost of the investment without the costs of exploitation (C5) and dismantling (C6). The total cost of the following years (1–n) is the exploitation cost (C5) divided by the number of years of the farm (Nfarm), except for the last year which also includes the dismantling cost (C6):
Year 0 L C S F O R E D 0 = L C S F O R E D C 5 C 6 (105)
Years 1 – n L C S F O R E D 1 n = C 5 N f a r m (106)
Year Nfarm L C S F O R E D N f a r m = C 5 N f a r m + C 6 (107)

3. Case Study

3.1. Introduction

The case study comprises different scenarios for wave energy and wind energy technology, considering these in different locations and scale. Overall, the scenarios can be aggregated into two cases: Case 1, which is focused on floating offshore wave energy devices (FOWaED) and Case 2, which is focused on floating offshore wind energy devices (FOWiED) (Figure 4).
The methodology proposed here is used to assess the total life-cycle cost and LCOE for each case. Data required was such as to define the parameters of the method, with accuracy as high as reasonably possible given the resources available. The parameters required to determine the life cycle costs and the produced energy can be estimated through research or knowledge of the characteristics of the device, the location and the market, literature information, expert consultation or data related to projects with relevant similarities. A significant amount of data is kept private or unavailable and therefore it has to be calculated, extrapolated or assumed. Nonetheless, great effort was made to maximize the resemblances with current reality.

3.2. Location

The scenarios on all cases are considered to be installed in two locations in Portugal—the Aguçadoura region in the North and the Pilot area of São Pedro de Moel, closer to the central area. These locations have been the selected sites for several offshore renewable energy projects in Portugal. Data related to these locations is presented in Table 4. The nearest port and shipyard from Aguçadoura are Leixões and Viana do Castelo respectively, whereas the nearest port and shipyard from the Pilot area are Figueira da Foz and Peniche respectively. Average wave height and period for both locations were taken from Silva et al. [14], whereas current speed was assumed considering the conclusions of Sauvaget et al. [37]. More detailed local resource information can be found in [38,39] for waves and [40,41] for wind.

3.3. Case 1

Case 1 considers two wave energy farms of different size (scale) for each of the locations—a small farm of 7 devices and a big farm of 147 devices.
The device considered here is the Pelamis. It is an oscillating device composed of five cylindrical steel sections linked by hinged joints that oscillate relative to each other as the device interacts with the waves, extracting their energy. Yemm et al. [42] described the main characteristics of this device in detail.
Here, it is considered that the Pelamis are placed in rows of seven units. Therefore the small farm consists of a single row of devices whereas the big farm consists of 21 rows of devices (Figure 5). Table 5 presents device related data. The small wave farm has an installed capacity of 5.25 MW and the big wave farm 110.25 MW.

3.4. Case 2

Case 1 considers a single offshore wind turbine and an offshore wind farm of 21 wind turbines for each of the locations (Figure 6).
Here, the Repower wind turbine and the Dutch-Trifloater semisubmersible platform are considered for the scenarios. The turbine is a horizontal axis solution suited for the offshore environment and the platform has a design that is very similar to the WindFloat but with a reduced cost [24,28].
Table 6 and Table 7 present turbine and platform related data respectively. The single turbine scenario has an installed capacity of 5.075 MW whereas the farm scenario has an installed capacity of 106.575 MW.

4. Results

4.1. Results for Case 1 (Wave Energy)

The most important cost in terms of floating offshore wave energy is the exploitation cost, followed by the manufacturing cost and the installation cost (Figure 7a,b). They are calculated taking into account all their sub-costs as indicated in Table 8.
Table 8 indicates that exploitation and operation costs are the highest cost for a wave farm. The total life-cycle cost of the small wave farm (5.25 MW) is 104 M€ for the São Pedro de Moel location and 95 M€ for the Aguçadoura area. However, the cost of several main components, as the electric cable and the offshore substation has a great importance, because there are only 7 wave generators and a complete offshore substation is needed, the cost of which is too high. This context explains the importance of studying a larger farm. Therefore, the total life-cycle cost of the big wave farm (110.25 MW) is 1445 M€ for the São Pedro de Moel location and 1303 M€ for the Aguçadoura area. Figure 8 shows the comparison of the total cost of the two wave farms considered (small and big) and the two locations taken into account.
Figure 8 shows that the best location in terms of costs and in the Portuguese case is the Aguçadoura area. In fact, there is a difference in the total costs up to 10 M€ in the case of a small wave farm and 143 M€ in the case of a big wave farm.
The percentages of the life-cycle phases cost is also different depending on the type of wave farm considered, because the effect on the costs which are shared between devices. Although the most important percentages are located in the same phases (exploitation, installation and manufacturing), the cost of dismantling (C6) appears, in the case of a big farm, as a 17% of costs, which represents much more than in the case of a small wave farm (1%) (Figure 9).
Finally, Figure 10 shows values of Levelized Cost Of Energy (LCOE) for the four main scenarios taken into consideration here: 1,708 €/MWh for the 5.25 MW small wave farm in São Pedro de Moel, 1068 €/MWh for the 110.25 MW big wave farm in São Pedro de Moel, 1595 €/MWh for the 5.25 MW small wave farm in Aguçadoura and 972 €/MWh for the 110.25 MW big wave farm in Aguçadoura.
Figure 10 shows the importance of the number of floating offshore wave devices in the study of the economic aspects of a floating offshore wave farm. It is due to the fact that there are some important costs, such as the offshore electric cables or the offshore substation, which are shared by the number of devices considered.

4.2. Results For Case 2 (Wind Energy)

The most important cost in terms of floating offshore wind energy is the cost of exploiting the farm, followed by the manufacturing cost and the installation cost for the single floating offshore wind turbine (Figure 11a). However, this value changes when considering the floating offshore wind farm of 21 wind turbines, where the main costs are the manufacturing cost, the exploitation cost and the installation cost respectively (Figure 11b). It is due to the high cost of manufacturing the floating platforms.
They are calculated taking into account all their sub-costs indicated in Table 9. The total life-cycle cost of the single floating offshore wind turbine (5.08 MW) is 77 M€ for the São Pedro de Moel location and 68 M€ for the Aguçadoura area. However, the cost of several main components, such as the electric cable and the offshore substation has a great importance, because there is only 1 wind turbine and a complete offshore substation is needed, whose cost is too high. This context explains the importance of studying the option of an offshore wind farm. Therefore, the total life-cycle cost of a floating offshore wind farm of 21 wind turbines (106.58 MW) is 406 M€ for the São Pedro de Moel location and 391 M€ for the Aguçadoura area.
Figure 12 shows that the best location in terms of costs is the Aguçadoura area. In fact, there is a difference in the total costs up to 9 M€ in the case of a small floating offshore wind farm and 15 M€ in the case of a big floating offshore wind farm.
The percentages of the life-cycle phases cost is also different depending on the type of floating offshore wind farm considered, because the effect on the costs which are shared between generators. Although the most important percentages are located in the same phases (exploitation, installation and manufacturing), their value is different depending on the scenario considered (Figure 13).
Finally, Figure 14 shows values of Levelized Cost Of Energy (LCOE) for the 4 main scenarios taken into consideration here: 713 €/MWh for the 5.08 MW single wind turbine in São Pedro de Moel, 199 €/MWh for the 106.58 MW offshore wind farm in São Pedro de Moel, 782 €/MWh for the 5.08 MW single wind turbine in Aguçadoura and 232 €/MWh for the 106.58 MW offshore wind farm in Aguçadoura.
Figure 14 shows the importance of the number of floating offshore wind turbines in the study of the economic aspects of a floating offshore wind farm. It is due to the fact that there are some important costs, such as the offshore electric cables or the offshore substation, which are shared by the number of turbines considered.
Finally, a comparison of costs between several renewable energy farms can be established. In this sense, Figure 15 shows how these costs are very high in a floating offshore wind farm and in a floating offshore wave farm comparing their values with other traditional systems such as fixed offshore wind and onshore wind farms [10,35,36,37].

5. Conclusions

This paper has proposed a general methodology to calculate the life-cycle cost of floating offshore renewable energy devices (FOWEDs). It is based on the six main phases of their life-cycle: concept definition, design and development, manufacturing, installation, exploitation and dismantling. To develop the methodology each of the equations of costs and sub-costs from these phases have been defined considering their main parameters. Moreover, the energy produced is also taken into account to calculate the Levelized Cost Of Energy (LCOE) of a floating offshore renewable energy farm (FOREF).
The methodology proposed has been applied to two types of FOWEDs: a floating offshore wave energy device (FOWaED) and a floating offshore wind energy device (FOWiED). The case study presented takes into consideration four scenarios: a small wave farm of seven Pelamis wave energy converters, a big wave farm of 147 Pelamis wave energy converters, a single floating offshore wind turbine and a farm of 21 floating offshore wind turbines. These are considered for the locations of Aguçadoura and São Pedro de Moel, both in Portugal, where the floating offshore renewable energies have a great development.
Results indicate the most important cost in terms of the life-cycle of a Floating Offshore Renewable Energy Farm (FOREF) is the exploiting cost, followed by the manufacturing and the installation cost.
The total life-cycle cost of a floating offshore wave farm of seven wave generators is 104 M€ for the São Pedro de Moel location and 95 M€ for the Aguçadoura region, and the cost for a big wave farm (110.25 MW) is 1445 M€ for the São Pedro de Moel location and 1303 M€ for the Aguçadoura area. On the other hand, the total life-cycle cost of one wind turbine is 77 M€ for the São Pedro de Moel location and 68 M€ for the Aguçadoura region. In addition, the total life-cycle cost of a floating offshore wind farm of 21 wind turbines (106.58 MW) is 406 M€ for the São Pedro de Moel location and 391 M€ for the Aguçadoura area.
In addition, the best area in terms of costs is the same independently of the type of floating offshore renewable energy considered: Aguçadoura. The LCOE is reducing when the number of wave devices is increasing. In this sense, the LCOE has values of 1,708 €/MWh for the 5.25 MW small wave farm in São Pedro de Moel, 1,068 €/MWh for the 110.25 MW big wave farm in São Pedro de Moel, 1,595 €/MWh for the 5.25 MW small wave farm in Aguçadoura and 972 €/MWh for the 110.25 MW big wave farm in Aguçadoura. For the case of floating offshore wind, the values of LCOE are 713 €/MWh for the 5.08 MW single wind turbine in São Pedro de Moel, 199 €/MWh for the 106.58 MW offshore wind farm in São Pedro de Moel, 782 €/MWh for the 5.08 MW single wind turbine in Aguçadoura and 232 €/MWh for the 106.58 MW offshore wind farm in Aguçadoura. Therefore, results in terms of LCOE are different: when considering wave energy technology Aguçadoura is better and when considering wind energy technology São Pedro de Moel region is better. In addition, best results are for a big wave or wind farm, whose values are 972 €/MWh and 199 €/MWh respectively.
On the other hand, in terms of percentages, although the most important percentages are located in the same phases (exploitation, installation and manufacturing), their value is different depending on the scenario considered. In this sense, a big wave farm mainly has a 40% of exploiting cost, 21% of installing cost, 21% of manufacturing cost and 17% of dismantling cost. Otherwise, a big wind farm mainly has a 32% of exploiting cost, 7% of installing cost, 57% of manufacturing cost and 2% of dismantling cost. The percentage of the manufacturing cost is higher in the case of the floating offshore wind because the floating offshore wind platforms are bigger and more expensive than the wave devices.
In terms of technology, the best area in terms of floating offshore wind technology is the São Pedro de Moel region whereas the best area in terms of wave energy technology is Aguçadoura, because their LCOE is higher. In terms of location or project scale, floating offshore wind technology is the best option compared to wave technology for the scenarios considered here. It is important to be aware of what is taken into account in order to make good decisions. The methodology proposed aims to provide a direct path for calculating the main life-cycle costs of a floating offshore renewable energy farm. It should help calculating its feasibility and evaluating the relevant characteristics that influence it the most.

Acknowledgments

This work was performed within the research project “MAREN2-Hydro-environmental modelling of multi-purpose marine renewable energy platforms” funded by the Atlantic Area Transnational Programme (European Regional Development Fund).

Author Contributions

Laura Castro-Santos, Elson Martins and Carlos Guedes Soares conceived the study and designed the experiments; Laura Castro-Santos and Elson Martins performed the calculations; Laura Castro-Santos, Elson Martins and Carlos Guedes Soares analyzed the data and contributed to the writing of the paper, which had Laura Castro-Santos as the main contributor.

Conflicts of Interest

The authors declare no conflict of interest.

References

  1. International Energy Agency (IEA). Technology Roadmap; IEA: Paris, France, 2013. [Google Scholar]
  2. European Union. Directive 2009/28/EC of the European Parliament and of the Council of 23 April 2009 on the Promotion of the Use of Energy from Renewable Sources and Amending and Subsequently Repealing Directives 2001/77/EC and 2003/30/EC; European Union: Brussels, Belgum, 2009; pp. 16–60. [Google Scholar]
  3. Bahaj, A.S. Generating electricity from the oceans. Renew. Sustain. Energy Rev. 2011, 15, 3399–3416. [Google Scholar] [CrossRef]
  4. Clément, A.; McCullen, P.; Falcão, A. Wave energy in Europe: Current status and perspectives. Renew. Sustain. Energy Rev. 2002, 6, 405–431. [Google Scholar] [CrossRef]
  5. López, I.; Andreu, J.; Ceballos, S.; De Alegría, I.M.; Kortabarria, I. Review of wave energy technologies and the necessary power-equipment. Renew. Sustain. Energy Rev. 2013, 27, 413–434. [Google Scholar] [CrossRef]
  6. Falcão, A.F.D.O. Wave energy utilization: A review of the technologies. Renew. Sustain. Energy Rev. 2010, 14, 899–918. [Google Scholar] [CrossRef]
  7. Guedes Soares, C.; Bhattacharjee, J.; Tello, M.; Pietra, L. Review and classification of wave energy converters. In Maritime Engineering and Technology; Guedes Soares, C., Garbatov, Y., Sutulo, S., Santos, T.A., Eds.; Taylor & Francis Group: Boca Raton, FL, USA, 2012; pp. 585–594. [Google Scholar]
  8. Möller, B.; Hong, L.; Lonsing, R.; Hvelplund, F. Evaluation of offshore wind resources by scale of development. Energy 2012, 48, 314–322. [Google Scholar] [CrossRef]
  9. Sun, X.; Huang, D.; Wu, G. The current state of offshore wind energy technology development. Energy 2012, 41, 298–312. [Google Scholar] [CrossRef]
  10. Snyder, B.; Kaiser, M.J. Ecological and economic cost-benefit analysis of offshore wind energy. Renew. Energy 2009, 34, 1567–1578. [Google Scholar] [CrossRef]
  11. Collu, M.; Kolios, A.J.; Chahardehi, A.; Brennan, F. A comparison between the preliminary design studies of a fixed and a floating support structure for a 5 MW offshore wind turbine in the North Sea. Available online: https://www.researchgate.net/profile/Maurizio_Collu/publication/259982909_2010_Collu_et_al._A_Comparison_Between_the_Preliminary_Design_Studies_of_a_Fixed_and_a_Floating_Support_Structure_for_a_5_MW_Offshore_Wind_Tur/links/0a85e52eefd3112eee000000.pdf (accessed on 6 October 2015).
  12. Bagbanci, H.; Karmakar, D.; Guedes Soares, C. Review of offshore floating wind turbines concepts. In Maritime Engineering and Technology; Guedes Soares, C., Garbatov, Y., Sutulo, S., Santos, T.A., Eds.; Taylor & Francis Group: London, UK, 2012; pp. 553–562. [Google Scholar]
  13. Guedes Soares, C.; Bhattacharjee, J.; Karmakar, D. Overview and prospects for development of wave and offshore wind energy. Brodogradnja 2014, 65, 87–109. [Google Scholar]
  14. Silva, D.; Rusu, E.; Guedes Soares, C. Evaluation of various technologies for wave energy conversion in the portuguese nearshore. Energies 2013, 6, 1344–1364. [Google Scholar] [CrossRef]
  15. Carballo, R.; Iglesias, G. A methodology to determine the power performance of wave energy converters at a particular coastal location. Energy Convers. Manag. 2012, 61, 8–18. [Google Scholar] [CrossRef]
  16. Madariaga, A.; De Alegría, I.M.; Martín, J.L.; Eguía, P.; Ceballos, S. Current facts about offshore wind farms. Renew. Sustain. Energy Rev. 2012, 16, 3105–3116. [Google Scholar] [CrossRef]
  17. Mueller, M.; Wallace, R. Enabling science and technology for marine renewable energy. Energy Policy 2008, 36, 4376–4382. [Google Scholar] [CrossRef]
  18. Guedes Soares, C.; Bento, A.R.; Gonçalves, M.; Silva, D.; Martinho, P. Numerical Evaluation of the wave energy resource along the Atlantic European Coast. Comput. Geosci. 2014, 71, 37–49. [Google Scholar] [CrossRef]
  19. Salvação, N.; Bernardino, M.; Guedes Soares, C. Assessing mesoscale wind simulations in different environments. Comput. Geosci. 2014, 71, 28–36. [Google Scholar] [CrossRef]
  20. Salvação, N.; Bernardino, M.; Guedes Soares, C. Assessing the offshore wind energy potential along coasts of Portugal and Galicia. In Developments in Maritime Transportation and Exploitation of Sea Resources; Guedes Soares, C., Lopez Pena, F., Eds.; Taylor & Francis Group: London, UK, 2014; pp. 995–1002. [Google Scholar]
  21. Stallard, T.; Stansby, P.K.; Williamson, A.J. An Experimental Study of Closely Spaced Point Absorber Arrays. In Proceedings of the 18th International Offshore and Polar Engineering Conference, Vancouver, BC, Canada, 6–11 June 2008; Volume 8.
  22. Levitt, A.C.; Kempton, W.; Smith, A.P.; Musial, W.; Firestone, J. Pricing offshore wind power. Energy Policy 2011, 39, 6408–6421. [Google Scholar] [CrossRef]
  23. Prässler, T.; Schaechtele, J. Comparison of the financial attractiveness among prospective offshore wind parks in selected European countries. Energy Policy 2012, 45, 86–101. [Google Scholar] [CrossRef]
  24. Castro-Santos, L.; Diaz-Casas, V. Life-cycle cost analysis of floating offshore wind farms. Renew. Energy 2014, 66, 41–48. [Google Scholar]
  25. Castro-Santos, L.; Martins, E.; Guedes Soares, C. Calculation of the Levelized Cost of Energy (LCOE) of a wave energy converter. In Renewable Energies Offshore; Guedes Soares, C., Ed.; Taylor & Francis Group: London, UK, 2015; pp. 1003–1009. [Google Scholar]
  26. Castro-Santos, L. Methodology Related to the Development of the Economic Evaluation of Floating Offshore Wind Farms in Terms of the Analysis of the Cost of Their Life-Cycle Phases. Ph.D. Thesis, Universidade da Coruña, Ferrol, Spain, 2013. [Google Scholar]
  27. Wayman, E.; Sclavounos, P.D.; Butterfield, S.; Jonkman, J.; Musial, W. Coupled Dynamic Modeling of Floating Wind Turbine Systems. In Proceedings of the Offshore Technology Conference, Houston, TX, USA, 1–4 May 2006; pp. 1–25.
  28. Lagerwey the Windmaster, Energy research Centre of the Netherlands (ECN). Study to Feasibility of Boundary Conditions for Floating Offshore Wind Turbines; ECN: Delft, the Netherlands, 2002. [Google Scholar]
  29. Nilsson, J.; Bertling, L. Maintenance Management of Wind Power Systems Using Condition Monitoring Systems—Life Cycle Cost Analysis for Two Case Studies. IEEE Trans. Energy Convers. 2007, 22, 223–229. [Google Scholar] [CrossRef]
  30. Ayee, G.; Lowe, M.; Gereffi, G. Wind Power: Generating Electricity and Employment; Center on Globalization Governande & Competitiveness, Duke University: Durham, NC, USA, 2009. [Google Scholar]
  31. Rademakers, L.W.M.M.; Braam, H.; Verbruggen, T.W. R&D needs for O&M of wind turbines; Energy Research Centre of the Netherlands: Amsterdam, the Netherlands, 2003; pp. 1–8. [Google Scholar]
  32. Zhang, J.; Gilbert, R. Reliability of Mooring Systems for Floating Production Systems; University of Texas at Austin: Austin, TX, USA, 2006. [Google Scholar]
  33. Snyder, B.; Kaiser, M.J. A comparison of offshore wind power development in europe and the U.S.: Patterns and drivers of development. Appl. Energy 2009, 86, 1845–1856. [Google Scholar] [CrossRef]
  34. Hunt, G.L. Maine Offshore Wind Energy. Wind Resources, Technologies and Energy Production; School of Economics, University of Maine: Orono, ME, USA, 2009. [Google Scholar]
  35. Doran, J.; Verholek, M. A Note on Vertical Extrapolation Formulas for Weibull Velocity Distribution Parameters. J. Appl. Meteorol. 1978, 17, 410–412. [Google Scholar] [CrossRef]
  36. Gualtieri, G.; Secci, S. Methods to extrapolate wind resource to the turbine hub height based on power law: A 1-h wind speed vs. Weibull distribution extrapolation comparison. Renew. Energy 2012, 43, 183–200. [Google Scholar] [CrossRef]
  37. Sauvaget, P.; David, E.; Guedes Soares, C. Modelling tidal currents on the coast of Portugal. Coast. Eng. 2000, 40, 393–409. [Google Scholar] [CrossRef]
  38. Silva, D.; Bento, A.R.; Martinho, P.; Guedes Soares, C. High Resolution local wave energy modelling in the Iberian Peninsula. Energy 2015, 91, 1099–1112. [Google Scholar] [CrossRef]
  39. Silva, D.; Martinho, P.; Guedes Soares, C. Wave power resources at Portuguese test sites from 11-year hindcast data. In Renewable Energies Offshore; Guedes Soares, C., Ed.; Taylor & Francis Group: London, UK, 2015; pp. 113–121. [Google Scholar]
  40. Salvação, N.; Bernardino, M.; Guedes Soares, C. Validation of a regional atmospheric model for assessing the offshore wind resources along the Portuguese coast. In Proceedings of the 32nd International Conference on Ocean, Offshore and Arctic Engineering (OMAE 2013), Nantes, France, 9–14 June 2013. Paper OMAE2013-11631.
  41. Salvação, N.; Guedes Soares, C. Offshore wind energy assessment for the Iberian coast with a regional atmospheric model. In Renewable Energies Offshore; Guedes Soares, C., Ed.; Taylor & Francis Group: London, UK, 2015; pp. 219–228. [Google Scholar]
  42. Yemm, R.; Pizer, D.; Retzler, C.; Henderson, R. Pelamis: Experience from concept to connection. Philos. Trans. A Math. Phys. Eng. Sci. 2012, 370, 365–380. [Google Scholar] [CrossRef] [PubMed]
Figure 1. General view of the methodology proposed.
Energies 09 00324 g001
Figure 2. Sub-costs of the method proposed.
Energies 09 00324 g002
Figure 3. Main components of the onshore and offshore electric cable.
Energies 09 00324 g003
Figure 4. Cases considered.
Energies 09 00324 g004
Figure 5. Illustration of the (a) small and (b) big wave farms of Case 1.
Energies 09 00324 g005
Figure 6. Illustration of the (a) single offshore wind turbine and (b) offshore wind farm of Case 2.
Energies 09 00324 g006
Figure 7. Life-cycle cost of (a) a 5.25 MW small wave farm and (b) a 110.25 MW big wave farm.
Energies 09 00324 g007
Figure 8. Life-cycle total cost of several wave farms in different locations.
Energies 09 00324 g008
Figure 9. Percentage of the total costs for (a) the 5.25 MW small wave farm and (b) the 110.25 MW big wave farm.
Energies 09 00324 g009
Figure 10. LCOE of several wave farms.
Energies 09 00324 g010
Figure 11. Life-cycle cost of a 5.08 MW (a) and 106.58 MW (b) floating offshore wind farm.
Energies 09 00324 g011
Figure 12. Life-cycle total cost of several wind farms in different locations.
Energies 09 00324 g012
Figure 13. Percentage of the total costs for (a) the single floating offshore wind turbine and (b) the farm of 21 floating offshore wind turbines.
Energies 09 00324 g013
Figure 14. LCOE of several wave farms.
Energies 09 00324 g014
Figure 15. Comparison operation (C5) and decommissioning (C6) costs of several renewable energy farms.
Energies 09 00324 g015
Table 1. Components of the device.
c1WINDWAVES 1
1BladesGenerator
2Rotor(Hydraulic motor)
3Bearing(Accumulators)
4Multiplier-generator(Control manifolds)
5HydraulicsTransformer
6Yaw system-
7Pitch system-
8Mechanical brake-
9Electrical system-
10Inverter-
11Hardware-
1 The components of the wave device are dependent on the type of system. It is a general approach, being the components in parenthesis specific to a wave energy converter with hydraulic system.
Table 2. Use of the components of the device once they were removed.
WINDWAVES
DUMPSCRAPDUMPSCRAP
  • Blades wind turbine
  • Nacelle wind turbine (steel)
  • Tower wind turbine (steel)
  • device
-
Table 3. Use of the general components once they were removed.
DUMPSCRAP
  • Mooring and anchoring
  • Substation
  • Floating platform (steel)
  • Electric cables (copper)
Table 4. Location parameters.
ConceptAguçadouraSão Pedro de Moel
Distance from farm to port (km)25.5043.60
Distance from farm to shipyard (km)39.4055.30
Depth (m)90.0090.00
Distance from farm to shore (km)8.008.00
Distance between shipyard and port (km)57.4498.61
Wave height (m)1.861.87
Wave period (s)9.109.00
Current speed (m/s)0.200.20
Scale parameter5.425.89
Shape parameter1.791.87
Table 5. Pelamis characteristics.
Rated Power (MW)0.75
Efficiency “wave-to-wire” (%)70
Device length (m)180
Device diameter (m)4
Platform weight (ton)443
Moorings weight (ton)2.8
Anchors weight (ton)35.5
Spacing between devices (number of diameters)87.5
Vessels required to transportation (units)1
Table 6. Offshore wind turbine characteristics.
Rated Power (MW)5075
Diameter of the rotor (m)126
Height of the tower (m)90
Rotor mass (kg)110,000
Nacelle mass (kg)240,000
Tower mass (kg)347,500
Table 7. Floating offshore wind platform characteristics.
Device Length (m)180
Device diameter (m)4
Platform weight (ton)696
Moorings weight (ton)26.8
Anchors weight (ton)4.1
Spacing between devices (number of diameters)4
Vessels required to transportation (units)1
Table 8. Sub-costs of a 5.25 MW and 110.25 MW wave farm.
Sub-CostsSão Pedro de MoelAguçadoura
Type Wave Farm5.25 MW110.25 MW5.25 MW110.25 MW
C110.100.100.100.10
C120.162.052.052.05
C133.035.243.035.24
C210.010.260.010.26
C316.1051.272.4451.27
C3213.01194.9118.20194.91
C330.411.040.051.04
C340.0510.440.5010.44
C354.558.084.628.08
C410.03---
C420.03311.790.56245.46
C430.091.190.101.19
C449.4010.4810.3810.47
C450.600.600.600.60
C510.385.970.435.31
C523.003.003.003.00
C5338.52532.1055.91522.74
C610.02---
C620.03311.940.57245.66
C630.070.830.070.83
C642.062.212.152.20
C650.038.550.418.55
C66−1.13−22.57−1.75−22.57
Table 9. Sub-costs of a 5.08 MW and 106.58 MW floating offshore wind farm.
Sub-CostsSão Pedro de MoelAguçadoura
Type Wind Farm5.08 MW106.58 MW5.08 MW106.58 MW
C110.100.100.100.10
C122.050.160.160.16
C133.035.173.035.17
C210.010.250.010.25
C312.44128.046.10128.04
C3218.2085.8413.0185.84
C330.058.570.418.57
C340.501.030.051.03
C354.628.014.558.01
C41-0.630.030.63
C420.7112.810.0310.10
C430.101.030.091.03
C4410.399.469.389.45
C450.600.600.600.60
C510.432.620.382.59
C523.003.003.003.00
C5365.27127.3529.16117.99
C61-0.320.020.32
C620.7212.770.0310.06
C630.070.720.070.72
C642.172.102.032.09
C650.410.630.030.63
C66−1.75−6.90−1.13−6.90

