
Responses of Ecosystem Service to Land Use Change in Qinghai Province


1
Key Laboratory of Land Surface Pattern and Simulation, Institute of Geographic Sciences and Natural Resources Research, Chinese Academy of Sciences, Beijing 100101, China
2
College of Architecture and Urban Planning, Chongqing Jiaotong University, Chongqing 400041, China
3
Center for Chinese Agricultural Policy, Chinese Academy of Sciences, Beijing 100101, China
*
Author to whom correspondence should be addressed.
Energies 2016, 9(4), 303; https://doi.org/10.3390/en9040303
Submission received: 27 December 2015
/
Revised: 30 March 2016
/
Accepted: 12 April 2016
/
Published: 21 April 2016
(This article belongs to the Special Issue Large Scale LUCC, Ecosystem Service, Water Balance and Energy Use)
Abstract
:Qinghai Province has a very fragile ecological environment and is an important component of the Qinghai-Tibet Plateau. To understand the disturbance caused by human activities to the local ecological system, it is necessary to evaluate the response of ecological service functions to land use change in Qinghai Province and to uncover the sensitivity of ecological service functions to land use change. This study uses a proxy-based method and proposes a sensitivity index to describe the degree of ecological service function response to the land use change in Qinghai Province. The findings were as follows. (1) From 1988 to 2008, the area of cultivated land, construction land and water in Qinghai Province increased, and forest land and grassland continuously decreased. The agricultural economy and the development of urbanization are the main driving factors in land use change in this area. Policies and eco-environmental engineering, such as the grain-for-green project, the Three-North shelterbelt project and the natural forest protection project, have certain effects on controlling the expansion of cultivated land. (2) The value of ecosystem services in Qinghai Province was 157.368 billion yuan, 157.149 billion yuan and 157.726 billion yuan in 1988, 2000 and 2008, respectively, decreasing and then increasing again. (3) The average sensitivity index values of ecological services in Qinghai Province for the periods 1988–2000 and 2000–2008 was 0.693 and 1.137, respectively. This means that for every 1% increase in land use change, the ecological service value fluctuated by 0.693% and 1.137% in those periods.
1. Introduction
The terrestrial ecosystem is the area where human and natural ecosystems interact most prominently. Humans obtain most products through management of the ecological system (such as cultivation, grazing and deforestation), but alongside the increase in population, social development and growing customer demand, expanding management and ignoring the mode of operations in the ecological system will harm both its function and human welfare [1]. Ecosystem services are the important link between the ecological system and human welfare. Knowledge of ecosystem service evolves along with the development of social economy. Carroll and Wilson [2] called natural ecosystems “Environmental Services”, including pest control, soil formation, water and soil conservation, climate regulation and material cycles. In 1977, Westman [3] tried to value the social benefits of natural ecosystems and called them “Nature’s Services”. In 1981, Ehrlich and Ehrlich [4] unified the concepts of “Environmental Services” and “Nature’s Services” and put forward the term “Ecosystem Services” for the first time. In 1997, Daily [5] and Costanza et al. [6] both classified ecosystem services and evaluated their economic value, which took research into ecosystem services to a new stage.
Along with gaining a deep understanding of ecosystem service, scholars have divided it according to different perspectives. Daily [5] believed that the term “ecosystem service” refers to the conditions and processes offered by the ecological system and the species contained therein, to meet the lifestyle demands of humans. Costanza et al. [6] believed that ecosystem services are the benefits (like products and services) that come directly and indirectly from ecological system functions, and divided them into 17 categories. The Millennium Ecosystem Assessment (MA) and Costanza define ecosystem service in basically the same way [7], but the former merged some of the seventeen service categories classified by Costanza and proposed four major service types: provision, regulation, support and culture.
Land is an important carrier of terrestrial ecosystems. By changing the distribution of regional resources, biodiversity and ecosystem type, land use change affects regional ecosystem service function [8,9,10]. At present, studies of the ecosystem service response to land use change mainly focus on two aspects. The first focus is the change in ecosystem service value in response to the change of land structure. For example, Zhao et al. [11] found that from 1990 to 2000, the large scale of land rehabilitation on Chongming Island led to a decrease of 62% in the ecosystem’s service value, and 71% was due to the shrinkage of wetland and tidal flats. Lautenbach et al. [12] used land use data to analyze the change in ecological services from 1964 to 2004 in Leipzig, Germany. It was believed that the land consolidation of 1964–1984 was one of the important driving forces in the change of ecological services. More attention was also paid to the effects of land use change on single ecological service functions, such as biodiversity [13], pollination [14], animal products [15] and soil organic carbon [16]. Flynn et al. [13] indicated that the intensive use of land may not only reduce biodiversity, but also potentially imperil the provisioning of ecosystem services. Priess et al. [14] believed that along with the decrease of forest area, pollination ability declines continuously. This will directly reduce the yield and net income of coffee. Yadav and Malanson [16] found that in the last 130 years, soil organic content declined constantly. It is necessary to take effective management measures to increase the organic carbon content in the soil.
Ecological sensitivity indicates the level of difficulty and potential for the occurrence of ecological environment problems in the evaluation of the disturbance of nature and human activities to the ecological system [17]. An analysis of ecological sensitivity can help us to recognize the future possible scenario of ecological safety based on the known features of current ecological change [18]. The research by Hendrey et al. [19] in the 1970s on the sensitivity of the water ecosystem to acid deposition was the earliest research on the sensitivity of an ecological system to environmental change. In 1990, scholars began to analyze climate variation, human activities and land use change as sensitivity factors affecting the ecological system. A report by the Intergovernmental Panel on Climate Change (IPCC) indicated that climate variations (e.g., air temperature, rainfall) will change the structure, composition and function of the ecosystem [20]. The Advanced Terrestrial Ecosystem Analysis and Modelling (ATEAM) project further extended study to the sensitivity factors that affect the ecosystem (e.g., drought/flood disaster, land use change and groundwater pollution were added). Jagtap et al. [21] analyzed the sensitivity of seaweed growth in coastal wetland ecosystems to human activities, earthquakes and meteorological factors. Bergengren et al. [22] analyzed the sensitivity of land plant communities to climate change. Although sensitivity analysis has been applied in many fields, there has been little study of the sensitivity of ecological service functions to land use change. Such a sensitivity analysis has great significance in areas where the ecological environment is fragile and can give an accurate evaluation of the possibility of land use change causing eco-environmental problems.
The Qinghai-Tibet Plateau is an area including the most abundant ecosystem types in China. It is called “The Third Pole”, as the elevation of 40% of its area is above 4000 m. The Qinghai-Tibet Plateau is also the headstream of many rivers in Asia (such as the Yellow River, the Yangtze River (Jinsha River), the Lancang River (the Mekong River) and the Nujiang River (the Salween River)). It is thus called the Asian “Water Tower”. Its unique geographic and climatic characteristics have an important influence on a series of ecosystem services, such as atmospheric circulation, climate regulation, water supply and the carbon cycle in China, Asia and even the Northern Hemisphere. At the same time, the Qinghai-Tibet Plateau is also the area with the most fragile ecological system. It suffers from the multiple effects of global drying and warming [23,24], massif uplifts [25,26] and human activities (such as over-grazing, tourism development and engineering construction). As a result, many ecological deterioration phenomena have been noted, such as rising snow lines [27], glacier recession [28,29,30], loss of soil organic matter [31,32] and desertification [33,34,35,36,37,38].
Many scholars have studied the response of ecosystem service functions on the Qinghai-Tibet Plateau to land use change. For example, Xie et al. [39] calculated the values of different ecological assets in the Qinghai-Tibet Plateau. The results indicated that the total ecological assets account for 17.68% of China and 0.61% of the world. Lu et al. [40] analyzed the effect of grassland destruction in the Qinghai-Tibet Plateau on soil conservation; and also the service values of organic carbon fixation, nutrient retention and reducing soil disuse. Wang et al. [41] assessed the economic value of ecosystem services in the Qinghai Lake watershed from 1977 to 2004. They found that the value of ecosystem services there was declining, and the development of the economy and ecology was not in harmony. Wang et al. [42] studied the changed value of wetland ecosystem services in the Ihasa River basin from 1976 to 2006. It was believed that the reduction of open water area, alpine meadow and grass swamp was the main cause of the lost value of the wetland; however, most of the above studies were based on the view that land use changes can affect the value of ecological service, rather than from a perspective considering their sensitivity.
Qinghai Province is the protective ecological barrier of the northeast part of the Qinghai-Tibet Plateau. Since the Reform and Opening-up, the fast development of agricultural economy (cultivation and animal husbandry production) and urbanization has improved the local economic level, but has also destroyed the original ecological environment. Land use is the direct interaction between human and natural ecosystems. It is also an important indicator of the change in regional economy and production activity. Some scholars have investigated the effects of land use change on ecosystem service function; however, although the ecosystem of the Qinghai Province is very fragile, few studies focus on the response of local ecosystem service functions to land use change from the perspective of sensitivity. The research objectives of this paper are therefore as follows: (1) to determine the main land use changes in Qinghai Province from 1988 to 2008; (2) to estimate the response of local ecosystem service functions to the land use change in this period; and (3) to reveal the sensitivity of ecosystem service functions to land use change in Qinghai Province.
2. Study Area
Qinghai Province is in the middle-latitude zone (89°35′–103°04′ E, 31°09′–39°19′ N), and covers a vast geographic area, which includes the Qinghai-Tibet Plateau and Loess Plateau (Figure 1). Its area is 71.75 × 10⁴ km2, one thirteenth of China’s total area. The elevation in the province ranges from 1625 m to 6692 m. The primary geomorphic type is a platform, with a proportion of 29.84%. The next most common types are high-, middle- and low-relief mountains, accounting for 22.14%, 16.06% and 13.47% of the land, respectively. With a continental plateau climate, Qinghai Province is cold, dry, windy, has less rainfall, low oxygen, a large diurnal temperature difference, long winters and short summers, four indistinct seasons and a great regional difference in climate [43]. The annual rainfall is 250–550 mm, and rainfall concentrates in July to September. The annual average temperature is 2–9 °C, and the frost-free season lasts for 100–200 days. The annual duration of sunshine is about 2700 h. The solar radiation is strong, with the total annual radiation reaching 690.8–753.6 kJ/cm2, and direct radiation accounts for more than 60% of total annual radiation. The annual absolute value exceeds 418.68 kJ/cm2.
Due to the special natural and ecological conditions, socioeconomic development in Qinghai Province is relatively closed and lagging behind eastern or central China. However, in the course of 30 years after reform and opening up, the urbanization process of Qinghai Province has been speeding up. Especially after 2000, addressing the great opportunities and challenges provided by the Campaign of Developing Western China, the West-to-East Gas Pipeline Project and Qinghai-Tibet Railway, the development of the region’s economy has boosted. From the aspects of industrial structure, tertiary industries have gradually become the dominant industry in Qinghai Province, while the proportion of primary industry gradually declined.
3. Research Method and Data Sources
3.1. Analysis of Land Use Change
3.1.1. Single Land Use Dynamic Degree
This index reflects the changes in the quantity of land of a certain use type in the research area over a period of time [44]. The calculation formula is as follows:
where Ua and Ub represent the area (hm2) of land of a certain use type at the beginning and end of the studied period, respectively; T represents the period studied (year); and K represents the single land use dynamic degree.
3.1.2. Comprehensive Land Use Dynamic Degree
This index reflects the annual rate of land use change in the research area. It is calculated as follows:
where represents the area (hm2) of type-i land that was converted during the period studied; represents the initial area (hm2) of type-i land; and ULAi represents the area (hm2) of type-i land that was not converted during the period studied.
3.2. Method of Ecological Service Value Assessment
Costanza et al. [6] divided the ecosystems into 16 types, including ocean, forest, grassland, wetland, desert and farmland. They also estimated the economic value of 17 ecological services, such as climate regulation, water regulation, soil and water conservation and material cycle, in different ecosystems on a global scale, but Costanza’s assessment results do not apply to some regions. Combining Chinese regional features, Xie et al. [45] carried out a questionnaire survey among 700 Chinese ecologists in 2002 and 2007 and established a new evaluation system for ecosystem service value. This system included the equivalents of the values of nine ecological services in six ecosystems (Table 1). In this table, the economic value of national average grain yield of 1 hm2 farmland every year is defined as “1”. Other equivalent factors are the contribution values relative to the farmland’s food production service.
Using the ecological service valuation (ESV) formula of Costanza and Table 1, we calculated the economic values of ecological service functions under different land use patterns in Qinghai Province.
3.2.1. Unit Price of the Farmland’s Food Production Service
According to Xiao et al. [23], the economic value of one ecological service equivalent factor is equal to one seventh of the market value of national average grain yield per unit area in the current year. Combining the sowing area, yield per unit area and national average price of the main crop in the study area, the economic value of the food production service per unit area of farmland was calculated using the following formula:
where Ea is the price of the food production service per unit area of farmland (yuan/hm2/a); i refers to the type of crop (including wheat, coarse cereal and tuber crop); mi is the sowing area of the crop i (hm2); pi is the national average price of the crop i (yuan/t); qi is the yield per unit area of the crop i (t/hm2/a); and M is the total sowing area of all crops (hm2).
This study chose wheat, coarse cereal and tuber crops as the main crops and counted their yield, sowing area, yield per unit area and price in 1988, 2000 and 2008. The economic value of the unit area of the crop in each year was then calculated. In order to make the data comparable, the economic values were converted into the fixed prices of 1988 using the production price index of agricultural products. The average unit price for the three years was regarded as the unit price of the food production service of farmland ecosystems in Qinghai Province, which was finally calculated as 227.53 yuan/hm2/a.
3.2.2. Unit Prices of Each Ecological Service Function
Using the equivalent factors of the Chinese ecosystem service value (Table 1) and the economic value of food production service per unit area of farmland in Qinghai Province (Equation (3)), we can obtain the unit price of each ecological service function. The formula is as follows:
where i refers to the type of ecological service function; j refers to the ecosystem type; Eij is the unit price of the ecological service i of ecosystem j (yuan/hm2/a); eij is the equivalent factor of the unit price of the ecological service i in ecosystem j.
3.2.3. Regional Ecological Service Value
The cultivated land, forest land, grassland, water area and unused land in the classification system of land use type correspond to the farmland, forest, grassland, river/lake and desert ecosystems, respectively. According to the unit price of each ecological service function and the area of different land use types, we can use Equations (5)–(7) to calculate the service value of each ecosystem (Equation (5)), the ecological service value of each land use type (Equation (6)), and the total value of ecological service in the research area (Equation (7)) [46].
where Aj is the area of type-j land; ESVi is the economic value of ecological service i over the total regional area; ESVj is the total ecological service value of type-j land; and ESV is the total value of regional ecological service.
3.3. Sensitivity of Ecological Service Function to Land Use Change
Sensitivity analysis aims to discuss the responses of sensitive subjects to sensitive factors or the impacts of sensitive factors on sensitive subjects. The sensitive subject is a system or individual that is affected by one or more factors. The main factor pushing the sensitive subject to respond is defined as the sensitive factor. According to the definition, we proposed a sensitivity index to analyze the sensitivity of ecological service function to land use change. In this index, the sensitive subject is the ecological system, and the sensitive factor is the change of land use. The sensitivity index can be expressed as the ratio of the change in ecological service value (percentage) to the land use dynamic degree (Equations (8) and (9)). The index reflects the degree of response of ecological service function to land use change 1%. The higher the sensitivity index, the more the ecological service function is sensitive to the land use change in this region.
where SEL is the sensitivity index (%); ESVend is the total value of ecological services at the end of the studied period (yuan/a), and ESVstart is the initial total value (yuan/a); CDI is the comprehensive land use dynamic degree (%); ΔLUTj is the area of type-j land that was converted in the studied period (km2); LUTj is the initial area of type-j land (km2); and T is the period studied (year).
3.4. Data Source
The land use data in this study came from the National Multi-Temporal Land Use Database (1:100,000), which is offered by the Data Center for Resources and Environmental Sciences, Chinese Academy of Sciences [47]. The data in this database are mainly sourced from Landsat TM/ETM remote sensing images and generated through visual interpretation [48,49]. There are six primary land use types: cultivated land, forestry areas, grassland, water areas, residential areas and unused land. Socioeconomic data come from the Qinghai Statistical Yearbooks [50] and the China Rural Statistical Yearbooks [51] of 1989, 2001 and 2009.
4. Results
4.1. Land Use Structure and Its Change in Qinghai Province
In 1988, grassland and unused land were the main land use types in Qinghai Province. Their area accounted for 90% of the total area of Qinghai Province (Figure 2). The next most common were forest land, water areas and cultivated land, with proportions of 3.96%, 3.89% and 1.11%, respectively. The area used for construction was the least, and its proportion was less than 0.15%.
From 1988 to 2008, the converted land in Qinghai Province reached 420,100 hm2, and the comprehensive dynamic degree was 0.02% (Table 3). From 2000 to 2008, the dynamic degree increased to 0.04%, indicating a more intense change in land use compared to the previous period. Despite this, land use change in Qinghai Province was relatively milder than those of other regions in China.
From 1988 to 2000, construction land increased the most, with a dynamic degree of 0.77%. It mainly expanded in the eastern region. The next greatest increase was in cultivated land, with a dynamic degree of 0.27%. The new cultivated land was distributed around the construction land. The water area decreased in this period, and the dynamic degree was −0.04%. Lakes in the region of Qinghai Lake and Tanggula Mountains were especially degraded to unused land. Forestry areas and grassland also shrank, and both had a dynamic degree of −0.01%. Compared to the previous period, the change in construction land between 2000 and 2008 was more intense. The dynamic degree increased from 0.77% to 4.64%, which was much higher than those of other land use types. Conversely, the dynamic degree of cultivated land dropped from 0.27% to 0.02%, with slackened growth. The area of water expanded, and the dynamic degree increased from −0.04% to 0.36%. The new water area was distributed mainly in high-altitude areas of the western part in Three Rivers Source area, as well as central and western regions of the Qaidam Basin. The degradation of grassland was aggravated, with the dynamic degree dropping from −0.01% to −0.03%, and grassland was mainly converted into unused and cultivated land. Conversion into unused land was common in the Three Rivers Source region, while in the eastern part, the reclamation of grassland was more common. The forest land area also decreased continuously, and the dynamic degree stayed the same.
4.2. Changes in the Economic Value of Ecosystem Service in Qinghai Province
In 1988, the economic value of ecological services in Qinghai Province was 157.368 billion yuan. Compared to 1988, the total value of ecological service in Qinghai Province decreased by 0.14%, but in 2008, it increased by 0.23% (Table 4). From 1988 to 2008, the proportion of grassland service value in Qinghai Province was more than 63%, which was the largest, but it decreased continuously with the greatest decrease (0.34% compared with 1988) among all land use types. Following grassland, rivers/lakes also contributed greatly to the ecosystem service value, with a proportion of 18.5%. The economic value of rivers/lakes decreased first and then increased. In 2008, it was 2.34% higher than that in 1988. With a tendency of constant decline, the forest service value was 0.13% lower in 2008 than in 1988. The proportion of desert service value was always low, being about 5.5% and presenting an increase-to-decrease tendency. The value of farmland ecosystem service also increased continuously, but it contributed less than 1% to the total value of ecosystem service. Compared to 1988, the farmland service value in 2008 increased by 3.29%, the largest increase among all land use types.
Among all ecological services, regulation services boasted the highest value, accounting for more than 55% of the total value (Table 5). The next were support, provision and culture service, which accounted for 6.4%, 30.0% and 8.4%, respectively. The values of each service and their proportions did not fluctuate greatly. From 1988 to 2008, the values of food production, hydrology regulation and waste regulation in Qinghai Province grew, but the values of raw material production, gas regulation, climate regulation, soil conservation and biodiversity maintenance service decreased.
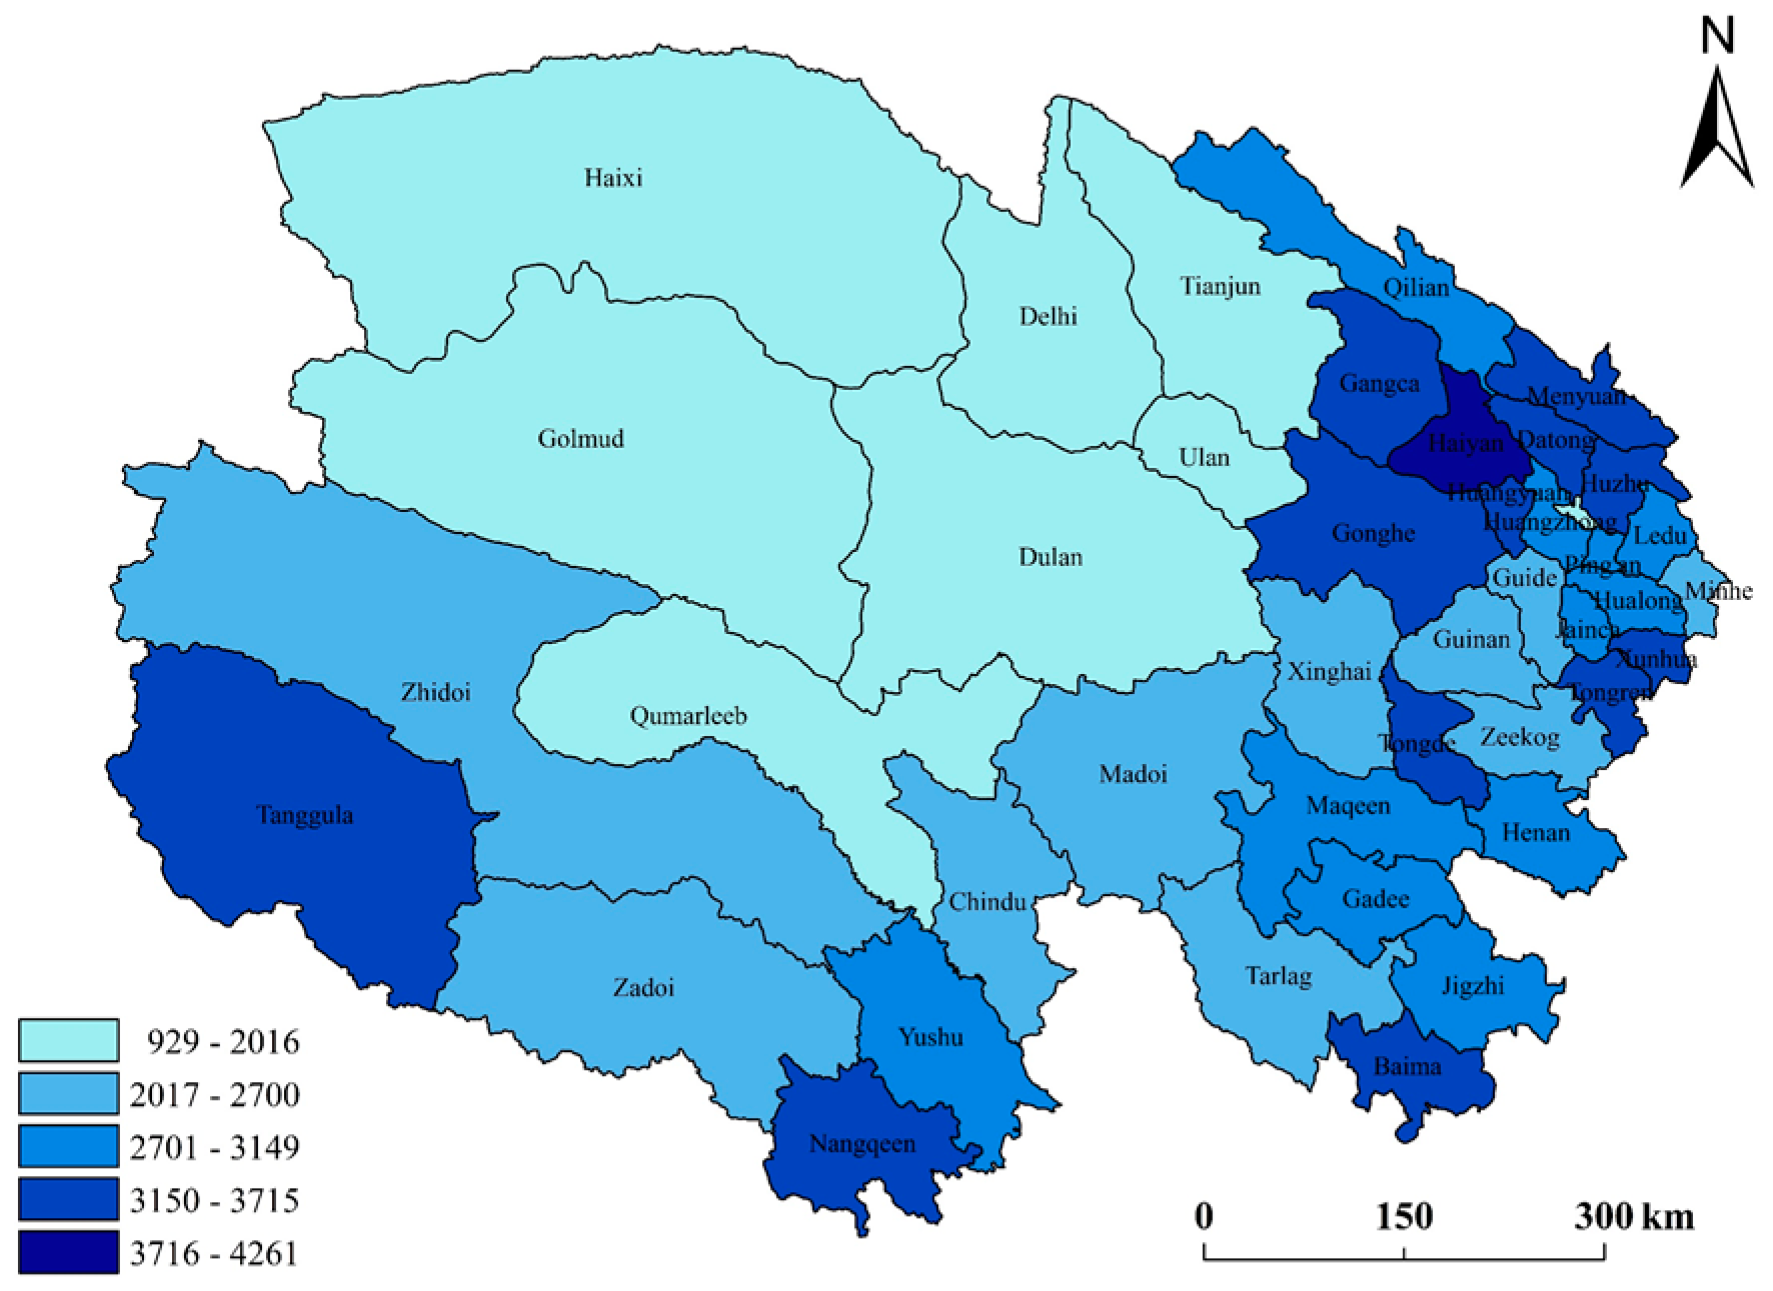
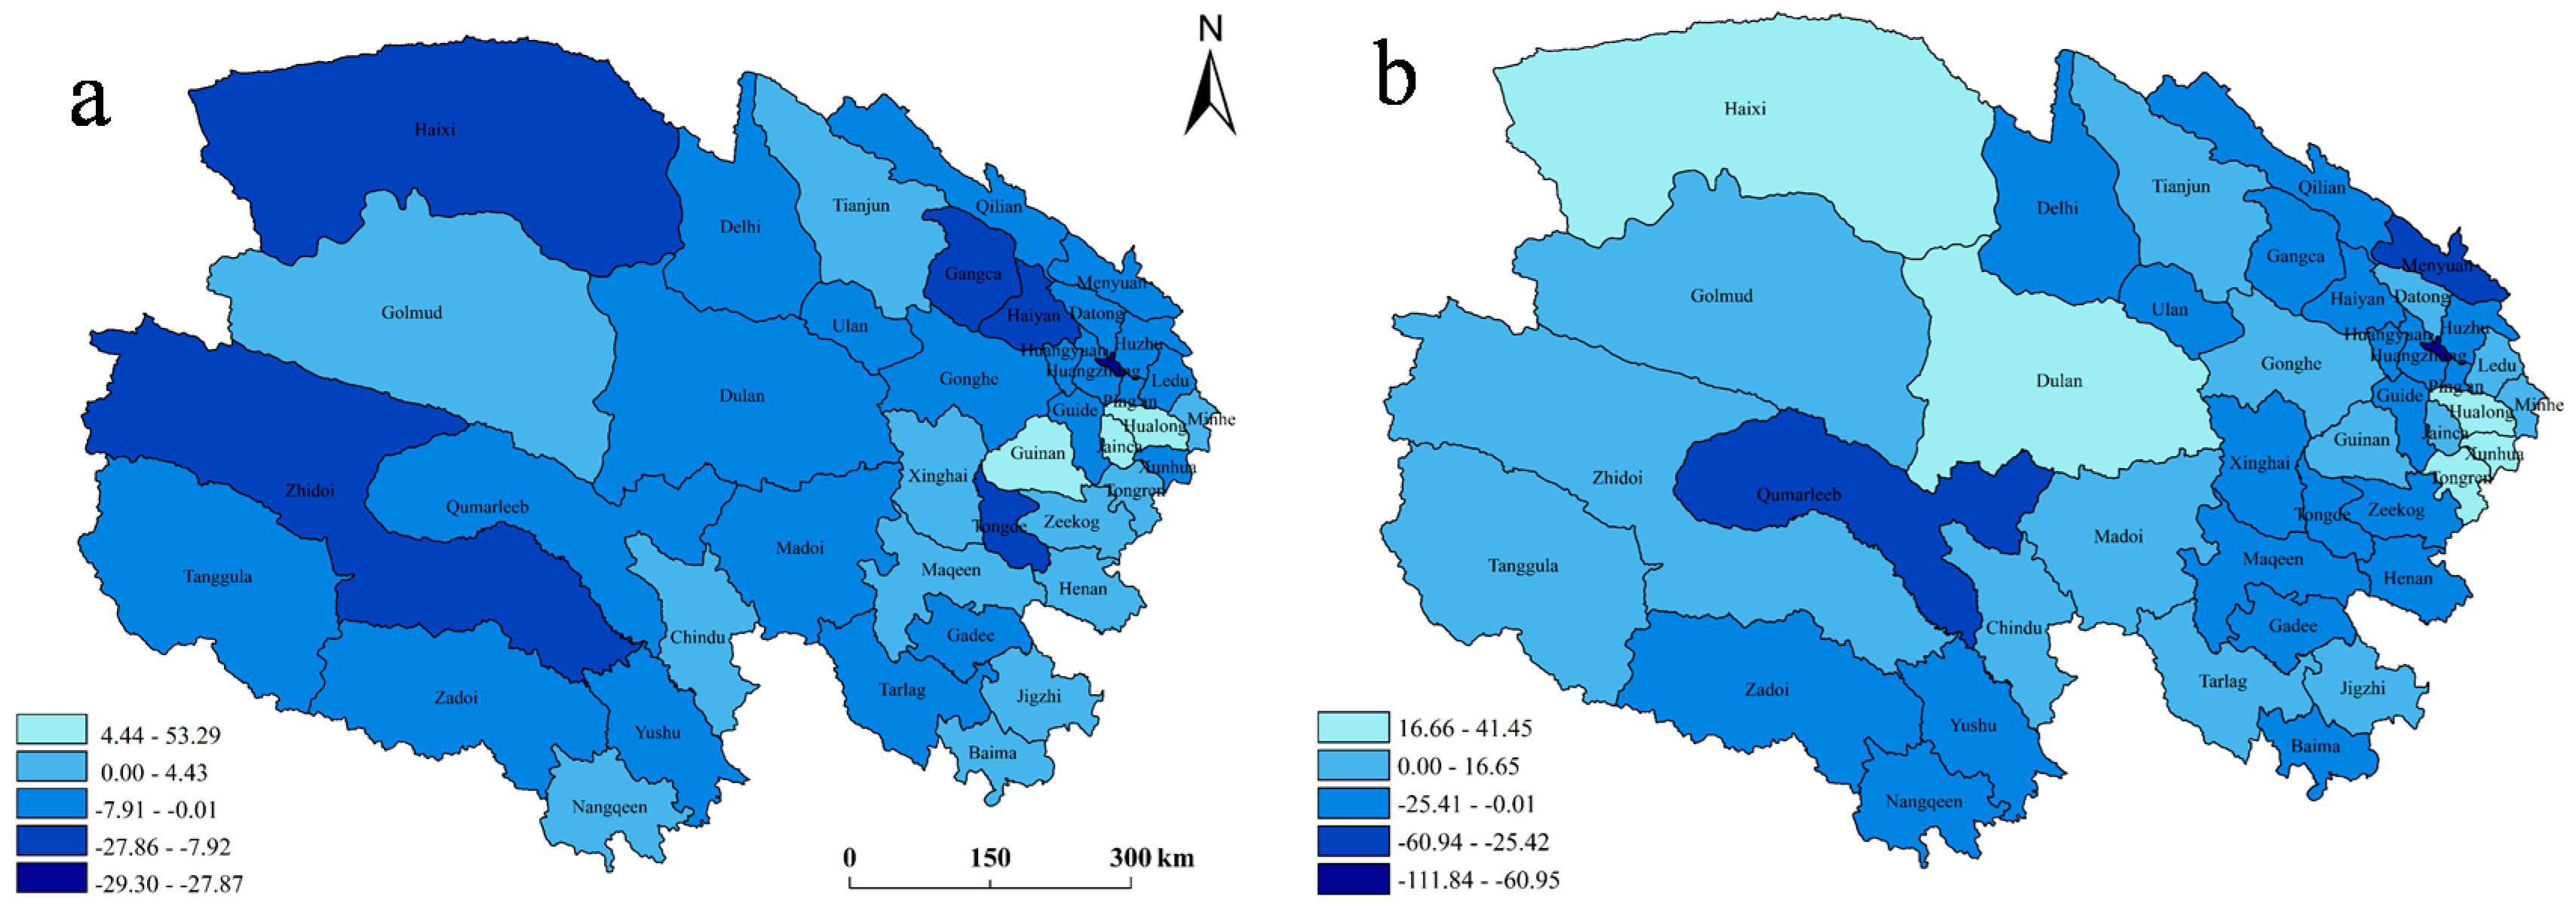
The ecological service value per unit area in Qinghai Province in 1988 was 929.23–4261.34 yuan/hm2 (Figure 3). The minimum and maximum were in Haixi Prefecture and Haiyan County, respectively. Spatially, there was a decreasing tendency in the eastern and Three Rivers Source region to the Qaidam Basin. Compared to 1988, the ecological service value per unit area in each county (or city) changed by −29.3–53.3 yuan/hm2 in 2000 (Figure 4a). The value increased in 35.71% of the counties, but declined in the remaining 64.29%, which were mostly distributed in the Qaidam region, Three Rivers Source region and the eastern part of Qinghai Province. From 2000 to 2008, the change in ecological service value per unit area was −111.84–41.45 yuan/hm2 (Figure 4b). The value increased in 50% of the counties, mainly located in the Qaidam region (except Golmud City) and high-altitude areas of Three Rivers Source region. Among these, the increasing range of Haixi Prefecture was the largest. The other 50% also showed a decreasing tendency in ecological service value per unit area. These counties are in the eastern part of Qinghai Province and the southern part of Three Rivers Source region. Of these, Qumarleeb saw the greatest decrease.
4.3. Sensitivity of Ecological Service Function to Land Use Change
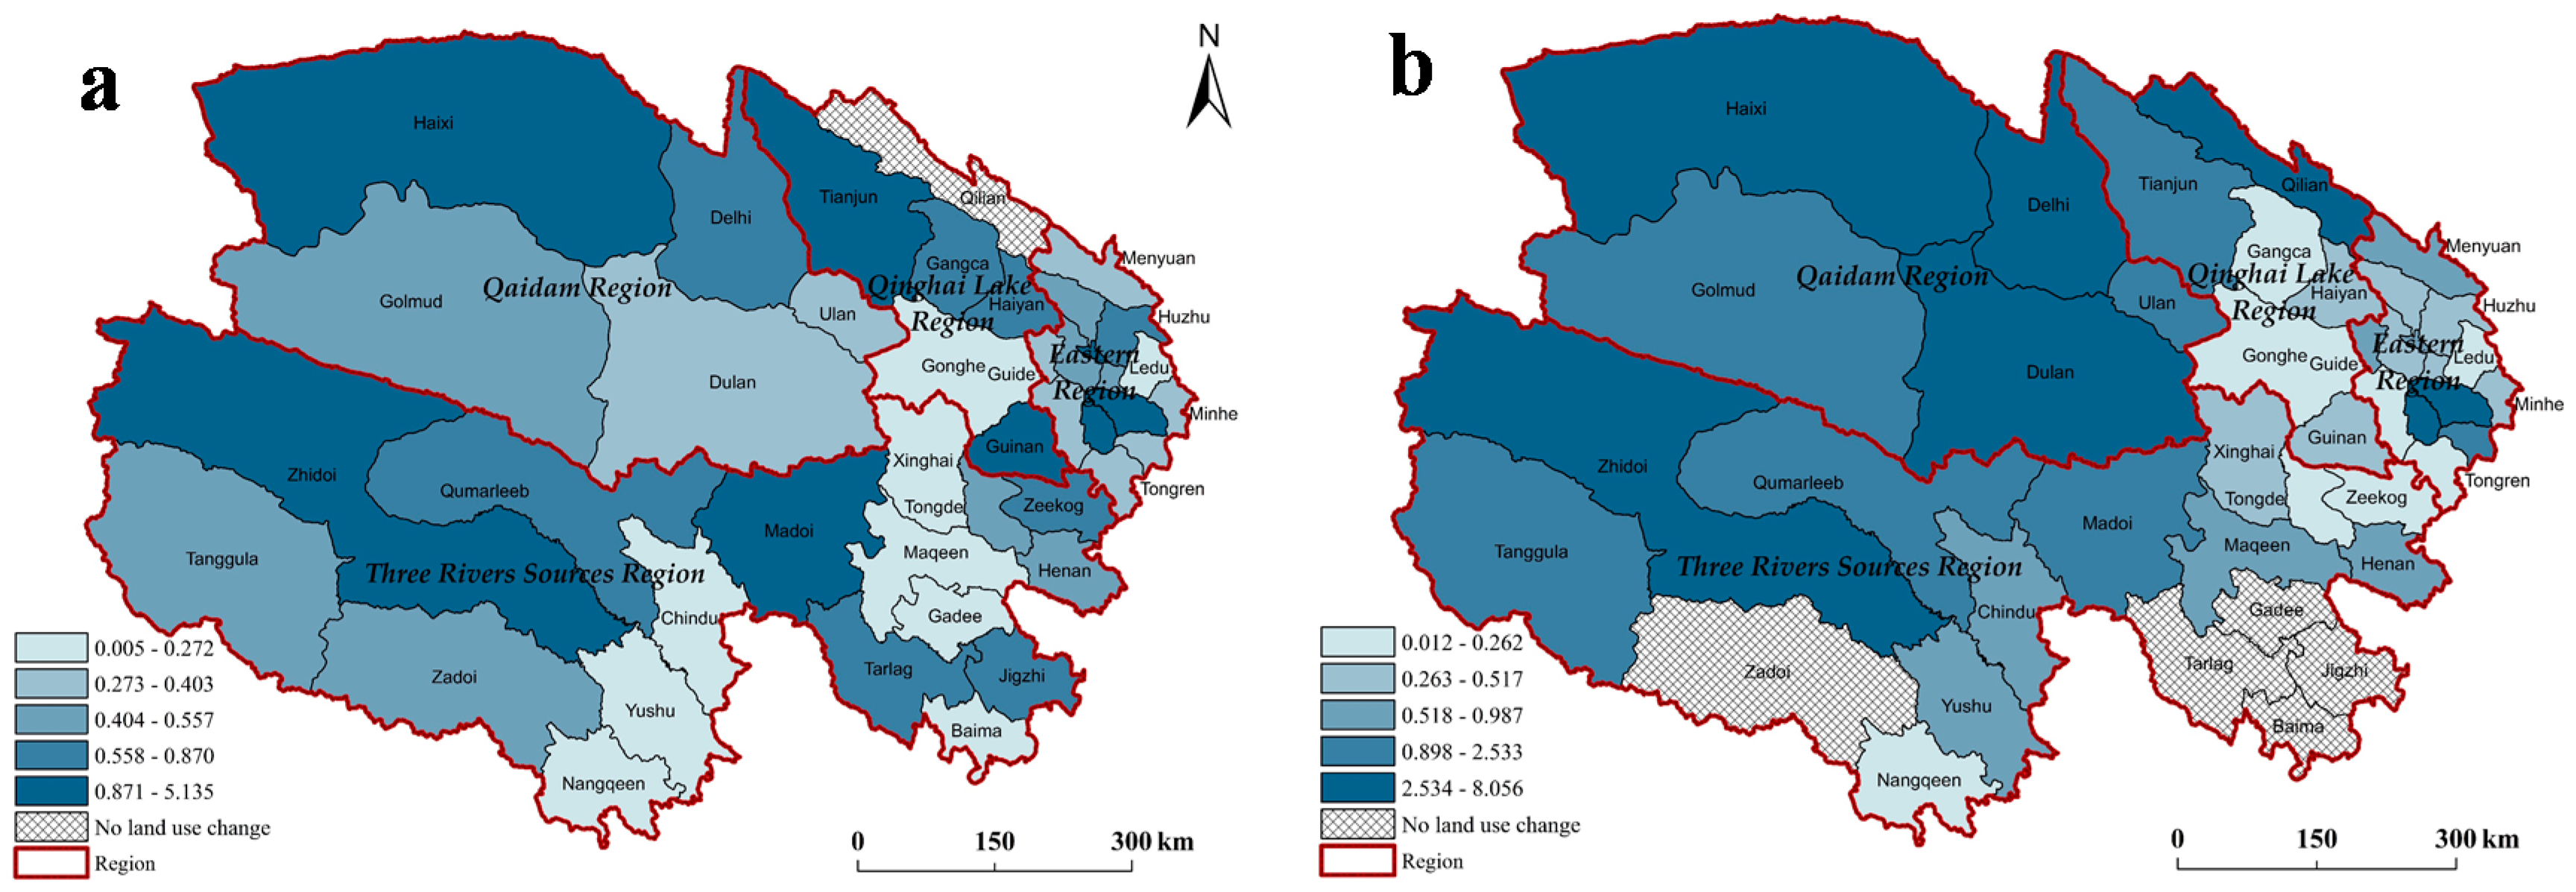
By combining the land use change and ecological service value change data in Qinghai Province and using Euqations (8) and (9), we obtained the sensitivity index of ecological service value in Qinghai Province in 1988–2000 and 2000–2008: 0.693 and 1.137 (Figure 5). This means that for every 1% increase in land use dynamic degree, the ecological service value fluctuated by 0.693% and 1.137% on average. From this, we can see that the sensitivity of ecological service function in Qinghai Province to land use change increased gradually. Compared to the 1988–2000 period, the change in ecological service function caused by the land use change of the same degree in 2000–2008 was increased 0.64 times.
Spatially, the sensitivity was higher in the northern part in Qaidam region (Haixi, Delhi and Tianjun), the Tanggula Mountains (Zhiduo, Tanggula Mountain Village, Qumarleeb and Zadoi) and the southeast of Qinghai Province (Maduo, Dari and Banma), but there was no great difference between counties. From 2000 to 2008, regional sensitivity was clearly divergent. The sensitivity was lower in the eastern area where human activities were frequent and increased gradually to the Three Rivers Source region and Qaidam region.
According to the change in the two periods, sensitivity decreased in 57.14% of the counties. However, the area of these counties only accounts for 11.98% of total area. They concentrated in the eastern part of Qinghai Province, and of these, the sensitivity of Zeku County decreased the most (0.60). The sensitivity of the remaining 42.86% increased, accounting for 88.02% of total area. Most are in the Three Rivers Source region and Qaidam region, where the sensitivity of Dulan County increased the most (3.57). In the four land use regions of Qinghai Province (Table 6), 100% and 91.77% of the areas in Qaidam region and the Three Rivers Source region experienced an increase in sensitivity, respectively. However, the areas with declining tendencies in sensitivity of the Eastern Region and Qinghai Lake Region were approximately equal to them with increasing tendencies.
5. Discussion
5.1. Driving Forces of Land Use Change in Qinghai Province
Both the transition of the natural environmental and social economic activities drive changes in land use, but in the short term, the effect of social economic activities is larger. Since 1988, driven by the Reform and Opening-up, Qinghai Province has exploited its superior resources to develop its industrial economy. Husbandry and the living standard of citizens have improved greatly, but at the same time, extensive resource utilization also brings ecological problems, including the sharply increasing area used as construction land and cultivated land and the decline of forestry areas, grassland and water areas to various degrees. Since 2000, along with the implementation of the Western Development Strategy, a series of engineering constructions, such as the “West-East Gas Pipeline Project” and “Qinghai-Tibet Railway”, have boosted social and economic development in Qinghai Province. During this period, the change in land use was more intense compared to the period of 1988–2000, especially the spread of construction land, with the dynamic degree increased nearly five times. Key ecological projects involving eco-environmental construction, such as returning farmland to forest or grassland, returning grazing land to grassland, the Three-North shelterbelt project, natural forest protection and the creation of nature reserves have brought positive effects in some regions. For example, the forest and grassland in the northeast of Qinghai Province (transition area of the Loess Plateau and the Qinghai-Tibet Plateau) is increasing; the unused land in the middle and west area of the Qaidam region is decreasing; and the water area is increasing; however, the forest land, grassland and water area are still declining in the Three Rivers Source region and the Qinghai Lake area. Most becomes unused land.
5.2. Main Factors Influencing Ecological Service Change in Qinghai Province
The warming and drying tendency of the climate has a negative effect on the value of ecological service in Qinghai Province, but the regulating factors in ecological service value fluctuation are human activities and land use change. Since 1988, due to the influence of the greenhouse effect (the temperature in the main pastoral regions rose 0.24–0.50 °C/10a, and the annual average increment of surface evaporation is 1.3–7.5 mm [53]), the climate has demonstrated a tendency to warming and drying, and natural runoff decreases, which restricts the growth and development of grazing grassland. When paying attention only to production, humans over-graze grasslands, reclaim them for crop farming and even abandon cultivation of the grasslands. Consequently, the grassland area decreased by 128,400 hm2, and the service value also decreased by 341 million yuan/a, which accounts for 0.34% of the initial value. The forest lands are scattered in the eastern area where human activities are intensive. Influenced by firewood cutting, deforestation and reclamation, the area of forest land decreased by 3500 hm2. Its ecological service value decreased by 23 million yuan/a, accounting for 0.13% of the initial value. Forest and grassland ecosystems play a critical role in soil conservation. The shrinking of these ecosystems is the main cause of water loss and soil erosion in Qinghai Province.
The unit price of river/lake ecological service is higher, and the area fluctuation of river/lake affects the economic value greatly. From 1988 to 2000, due to the effect of climate change (such as global warming and drying, stronger surface evapotranspiration and runoff decrease), the water area decreased by 14,000 hm2. The loss of ecological service value reached 144 million yuan, but since 2000, as the water area in the middle and western area of the Qaidam region and the west high-altitude areas in the Three Rivers Source region increased (an increase of five times compared to the period of 1988–2000), the ecological service value of the water area increased by 817 million yuan. The agricultural economy in Qinghai Province has developed continually. The area of cultivated land and the ecological service value also continue to increase, but restricted by ecological projects, such as returning farmland to forest (grassland), the increasing range of the service value of cultivated land declined from 3.28% in 1988–2000 to 0.20% in 2000–2008.
5.3. Response of Ecological Service Value to Land Conversion
The direction and quantity of land use transition determines changes in ecological service value. For example, the eastern part of Qinghai Province is the region with the most intensive economic activities. In 1988–2000 and 2000–2008, its comprehensive land use dynamic was 0.05% and 0.04%, respectively, equal to or higher than the whole dynamic degree in Qinghai Province (0.02% and 0.04%), but the rate of change in ecological service value in the two periods was only 0.05% and 0.003%, which is much lower than the whole rate of change in Qinghai Province (0.11% and 0.31%). This means that the quantity of land use transition is not the only factor in ecological service value fluctuation. From the equivalent factor table (Table 1), we see that the ecological service value per unit area can be ranked as: water area > forest > grassland > farmland > unused land. The direction of the land use transition can also therefore influence the fluctuation in ecological value.
From 1988 to 2008, the land use transition in eastern areas, affected by the development of urbanization and the husbandry economy, was mainly the transition between grassland, cultivated land and construction land. The difference in unit-area ecological service value was small, and the sensitivity was low, but in Qaidam and the Three Rivers Source region, where there is less human disturbance, the land use transition between grassland, unused land and water area dominated. These ecosystems made a great difference to unit-area ecological value, and their sensitivity was high. The sensitivity of three administrative regions (Mangya, Lenghu and Da Qaidam) in Haixi Prefecture was also higher during the two periods. This was mainly because large amounts of forest land and grassland in these regions were converted into unused land in 1988–2000, resulting in a sharp fall in ecological service value. From 2000 to 2008, however, there was a great transition from unused land to water areas in the East Taijinar and West Taijinar salt lake area, greatly increasing ecological service value.
5.4. Implications of Land Use Management According to the Sensitivity Analysis
The eco-environment of the high sensitivity regions is usually essential to human well-being and sustainable development. When the eco-environment in these regions is destroyed, it is very hard to reconstruct. Therefore, rational planning of land use and regulation of human activities will be necessary in the sensitive areas. The Three Rivers Source region whose sensitivity was relatively high and showed an increased tendency should avoid further disturbance by human activities, particularly for the large-scale construction activities. For land use management, the Three Rivers Source region should strengthen the construction of ecological engineering and implement more ecological protection planning. The Qaidam region, which has relative low ecosystem services and high sensitivity, should improve the ecosystem services by controlling the expansion of unused land (such as desertification land).
6. Conclusions
Affected by climate change and human activities, the structure and overall arrangement of land use in Qinghai Province changes constantly, and the ecological service value changes, as well. From 1988 to 2008, the land use change in Qinghai Province manifested as follows: cultivated land and construction land increased constantly; forest land and grassland decreased gradually; unused land increased first and then decreased, and the opposite happened to the water areas. In 2000–2008, urbanization and husbandry developed quickly, and land use change was more intense in 1988–2000. The eastern part of Qinghai Province and the middle and eastern part of the Qaidam Basin were the regions with the most active land use transition.
The value of ecological service in Qinghai Province was 157.368 million yuan, 157.149 million yuan and 157.726 million yuan in 1988, 2000 and 2008, respectively. The ecological service value declined first and then increased. The value of each ecosystem service can be ranked as grassland > river/lake > forest > desert > farmland. Due to the influence of the change in land utilization structure, the service value of the grassland, forest and desert ecosystem decreased by 0.34%, 0.13% and 0.03%, respectively, compared to 1988, but the service value of farmland and river/lake ecosystems increased by 3.49% and 2.34%. The change of the desert and river/lake ecosystem thus shows a certain fluctuation. Spatially, the average ecological service value decreased from the eastern and Three Rivers Source region to the Qaidam region. From 1988 to 2000, the average ecological service value in the eastern part decreased constantly, and the Three Rivers Source region and Qaidam region showed some fluctuation.
The sensitivity index reflects the response of ecological service value to land use change. In the periods 1988–2000 and 2000–2008, when the land use dynamic degree increased by 1%, the ecological service value fluctuated by 0.693% and 1.137% on average. The sensitivity of Qaidam and the Three Rivers Source region was relatively high and showed a tendency to increase, but the sensitivity in the eastern areas was the lowest, with a declining tendency.
Acknowledgments
The research was supported by the National Key Program for Developing Basic Science in China (Grant No. 2012CB955702) and the National Natural Science Foundation of China (Grant Nos. 91325302 and 41501192).
Author Contributions
Wei Song designed the research. Ze Han processed the data, developed the methodology, performed the research and wrote the manuscript. Wei Song reviewed the paper and supported the analysis of the results. Wei Song and Xiangzheng Deng supervised the research and contributed with valuable discussions and scientific advice.
Conflicts of Interest
The authors declare no conflict of interest.
References
- Fisher, B.; Turner, R.K.; Morling, P. Defining and classifying ecosystem services for decision making. Ecol. Econ. 2009, 68, 643–653. [Google Scholar] [CrossRef]
- Carroll, M.; Wilson, W.H.M. Man’s Impact on the Global Environment; MIT Press: Cambridge, UK, 1970. [Google Scholar]
- Westman, W.E. How much are nature’s services worth? Science 1977, 197, 960–964. [Google Scholar] [CrossRef] [PubMed]
- Ehrlich, P.R.; Ehrlich, A.H. Extinction: The Causes and Consequences of the Disappearance of Species; Random House: New York, NY, USA, 1981. [Google Scholar]
- Daily, G.C. Nature’s Services: Societal Dependence on Natural Ecosystems; Island Press: Washington, DC, USA, 1997; Volume 1, p. 392. [Google Scholar]
- Costanza, R.; d’Arge, R.; deGroot, R.; Farber, S.; Grasso, M.; Hannon, B.; Limburg, K.; Naeem, S.; O’Neill, R.V.; Paruelo, J.; et al. The value of the world’s ecosystem services and natural capital. Nature 1997, 387, 253–260. [Google Scholar] [CrossRef]
- Assessment, M.E. Ecosystems and Human Well-Being: Biodiversity Synthesis; Island Press: Washington, DC, USA, 2005; p. 102. [Google Scholar]
- Metzger, M.J.; Rounsevell, M.D.A.; Acosta-Michlik, L.; Leemans, R.; Schrotere, D. The vulnerability of ecosystem services to land use change. Agric. Ecosyst. Environ. 2006, 114, 69–85. [Google Scholar] [CrossRef]
- Nelson, G.C.; Bennett, E.; Berhe, A.A.; Cassman, K.; DeFries, R.; Dietz, T.; Dobermann, A.; Dobson, A.; Janetos, A.; Levy, M.; et al. Anthropogenic drivers of ecosystem change: An overview. Ecol. Soc. 2006, 11, 29. [Google Scholar]
- Foley, J.A.; Asner, G.P.; Costa, M.H.; Coe, M.T.; DeFries, R.; Gibbs, H.K.; Howard, E.A.; Olson, S.; Patz, J.; Ramankutty, N.; et al. Amazonia revealed: Forest degradation and loss of ecosystem goods and services in the amazon basin. Front. Ecol. Environ. 2007, 5, 25–32. [Google Scholar] [CrossRef]
- Zhao, B.; Kreuter, U.; Li, B.; Ma, Z.J.; Chen, J.K.; Nakagoshi, N. An ecosystem service value assessment of land-use change on Chongming Island, China. Land Use Policy 2004, 21, 139–148. [Google Scholar] [CrossRef]
- Lautenbach, S.; Kugel, C.; Lausch, A.; Seppelt, R. Analysis of historic changes in regional ecosystem service provisioning using land use data. Ecol. Indic. 2011, 11, 676–687. [Google Scholar] [CrossRef]
- Flynn, D.F.B.; Gogol-Prokurat, M.; Nogeire, T.; Molinari, N.; Richers, B.T.; Lin, B.B.; Simpson, N.; Mayfield, M.M.; DeClerck, F. Loss of functional diversity under land use intensification across multiple taxa. Ecol. Lett. 2009, 12, 22–33. [Google Scholar] [CrossRef] [PubMed]
- Priess, J.A.; Mimler, M.; Klein, A.M.; Schwarze, S.; Tscharntke, T.; Steffan-Dewenter, I. Linking deforestation scenarios to pollination services and economic returns in coffee agroforestry systems. Ecol. Appl. 2007, 17, 407–417. [Google Scholar] [CrossRef] [PubMed]
- O’Farrell, P.J.; Donaldson, J.S.; Hoffman, M.T. The influence of ecosystem goods and services on livestock management practices on the Bokkeveld plateau, South Africa. Agric. Ecosyst. Environ. 2007, 122, 312–324. [Google Scholar] [CrossRef]
- Yadav, V.; Malanson, G. Spatially explicit historical land use land cover and soil organic carbon transformations in Southern Illinois. Agric. Ecosyst. Environ. 2008, 123, 280–292. [Google Scholar] [CrossRef]
- Ouyang, Z.; Wang, X.; Miao, H. China’s eco-environmental sensitivity and its spatial heterogeneity. Acta Ecol. Sin. 2000, 20, 9–12. (In Chinese) [Google Scholar]
- Cramer, W. Advanced terrestrial ecosystem analysis and modelling. Reg. Environ. Change 2008, 8, 89–90. [Google Scholar] [CrossRef]
- Hendrey, G.R.; Galloway, J.N.; Norton, S.A.; Schofield, C.L.; Shaffer, P.W. Geological and Hydrochemical Sensitivity of the Eastern United States to Acid Precipitation; EPA-600/3-80-024; Brookhaven National Lab.: Upton, NY, USA, 1980.
- Watson, R.T.; Zinyowera, M.C.; Moss, R.H. Climate Change, 1995: Impacts, Adaptations and Mitigation of Climate Change: Scientific-Technical Analyses; Cambridge University Press: Cambridge, UK, 1996. [Google Scholar]
- Jagtap, T.; Komarpant, D.; Rodrigues, R. Status of a seagrass ecosystem: An ecologically sensitive wetland habitat from India. Wetlands 2003, 23, 161–170. [Google Scholar] [CrossRef]
- Bergengren, J.C.; Waliser, D.E.; Yung, Y.L. Ecological sensitivity: A biospheric view of climate change. Clim. Chang. 2011, 107, 433–457. [Google Scholar] [CrossRef]
- Xiao, Y.; Xie, G.; An, K. Economic value of ecosystem services in mangcuo lake drainage basin. J. Appl. Ecol. 2003, 14, 676–680. [Google Scholar]
- Zhang, Y.; Su, F.; Hao, Z.; Xu, C.; Yu, Z.; Wang, L.; Tong, K. Impact of projected climate change on the hydrology in the headwaters of the yellow river basin. Hydrol. Process. 2015, 29, 4379–4397. [Google Scholar] [CrossRef]
- Ren, G.; Conti, E.; Salamin, N. Phylogeny and biogeography of Primula sect. Armerina: Implications for plant evolution under climate change and the uplift of the Qinghai-Tibet Plateau. BMC Evol. Biol. 2015, 15. [Google Scholar] [CrossRef]
- Xu, X.; Keller, G.R.; Gao, R.; Guo, X.; Zhu, X. Uplift of the longmen shan area in the eastern tibetan plateau: An integrated geophysical and geodynamic analysis. Int. Geol. Rev. 2016, 58, 14–31. [Google Scholar] [CrossRef]
- Lei, L.P.; Zeng, Z.C.; Zhang, B. Method for detecting snow lines from MODIS data and assessment of changes in the Nianqingtanglha mountains of the Tibet plateau. IEEE J. Sel. Top. Appl. Earth Observ. Remote Sens. 2012, 5, 769–776. [Google Scholar]
- Liu, S.; Ding, Y.; Li, J.; Shangguan, D.; Zhang, Y. Glaciers in response to recent climate warming in Western China. Quat. Sci. 2006, 26, 762–771. (In Chinese) [Google Scholar]
- Wang, W.; Yao, T.; Yang, X. Variations of glacial lakes and glaciers in the Boshula mountain range, southeast Tibet, from the 1970s to 2009. Ann. Glaciol. 2011, 52, 9–17. [Google Scholar] [CrossRef]
- Wu, S.-S.; Yao, Z.-J.; Huang, H.-Q.; Liu, Z.-F.; Liu, G.-H. Responses of glaciers and glacial lakes to climate variation between 1975 and 2005 in the Rongxer basin of Tibet, China and Nepal. Reg. Environ. Chang. 2012, 12, 887–898. [Google Scholar] [CrossRef]
- Li, J.; He, N.; Wei, X.; Gao, Y.; Zuo, Y. Changes in temperature sensitivity and activation energy of soil organic matter decomposition in different Qinghai-Tibet Plateau grasslands. PLoS ONE 2015, 10. [Google Scholar] [CrossRef] [PubMed]
- Shang, W.; Zhao, L.; Wu, X.-D.; Li, Y.-Q.; Yue, G.-Y.; Zhao, Y.-H.; Qiao, Y.-P. Soil organic matter fractions under different vegetation types in permafrost regions along the Qinghai-Tibet Highway, north of Kunlun Mountains, China. J. Mt. Sci. 2015, 12, 1010–1024. [Google Scholar] [CrossRef]
- Li, Q.; Jia, Z.; Zhu, Y.; Wang, Y.; Li, H.; Yang, D.; Zhao, X. Spatial heterogeneity of soil nutrients after the establishment of Caragana intermedia plantation on Sand Dunes in Alpine Sandy Land of the Tibet Plateau. PLoS ONE 2015, 10. [Google Scholar] [CrossRef] [PubMed]
- Wang, X.; Ma, W.; Lang, L.; Hua, T. Controls on desertification during the early twenty-first century in the Water Tower region of China. Reg. Environ. Chang. 2015, 15, 735–746. [Google Scholar] [CrossRef]
- Zhang, X.; He, Y.; Shen, Z.; Wang, J.; Yu, C.; Zhang, Y.; Shi, P.; Fu, G.; Zhu, J. Frontier of the ecological construction support the sustainable development in Tibet Autonomous Region. Bull. Chin. Acad. Sci. 2015, 30, 306–312. [Google Scholar]
- Wen, L.; Dong, S.; Li, Y.; Wang, X.; Li, X.; Shi, J.; Dong, Q. The impact of land degradation on the C pools in alpine grasslands of the Qinghai-Tibet Plateau. Plant Soil 2013, 368, 329–340. [Google Scholar] [CrossRef]
- Wang, J. The moving tendency of holdridge life zone with its dry and wet climate changes of Gannan meadow in recent 40 years. J. Appl. Meteorol. Sci. 2012, 23, 604–608. (In Chinese) [Google Scholar]
- Ren, G.; Shang, Z.; Long, R.; Hou, Y.; Deng, B. The relationship of vegetation and soil differentiation during the formation of black-soil-type degraded meadows in the headwater of the Qinghai-Tibetan Plateau, China. Environ. Earth Sci. 2013, 69, 235–245. [Google Scholar] [CrossRef]
- Xie, G.; Lu, C.; Leng, Y.; Zheng, D.; Li, S. Ecological assets valuation of the Tibetan Plateau. J. Nat. Resour. 2003, 18, 189–196. (In Chinese) [Google Scholar]
- Lu, C.-X.; Yu, G.; Xiao, Y.; Xie, G.-D. Wind tunnel simulation and evaluation of soil conservation function of alpine grassland in Qinghai-Tibet Plateau. Ecol. Econ. 2013, 86, 16–20. [Google Scholar] [CrossRef]
- Wang, J.; Tian, J.; Li, X.; Ma, Y.; Yi, W. Evaluation of concordance between environment and economy in Qinghai Lake Watershed, Qinghai-Tibet Plateau. J. Geogr. Sci. 2011, 21, 949–960. [Google Scholar] [CrossRef]
- Wang, C.; Zhang, Y.; Wang, Z.; Bai, W. Changes of wetland ecosystem service value in the Lhasa River Basin of Tibetan Plateau. Resour. Sci. 2010, 32, 2038–2044. [Google Scholar]
- Li, Y.; Liu, Y. Evaluation of ecosystem service function value in Qinghai. J. Arid Land Resour. Environ. 2010, 5, 1–10. (In Chinese) [Google Scholar]
- Wang, X.; Bao, Y. Study on the methods of landuse dynamic change research. Prog. Geogr. 1999, 18, 81–87. (In Chinese) [Google Scholar]
- Xie, G.; Zhen, L.; Lu, C.; Xiao, Y.; Chen, C. Expert knowledge based valuation method of ecosystem services in China. J. Nat. Resour. 2008, 23, 911–919. (In Chinese) [Google Scholar]
- Zheng, J.; Yu, X.; Jia, G.; Xia, B. Dynamic evolution of the ecological service value based on LUCC in Miyun Reservoir Catchment. Trans. Chin. Soc. Agric. Eng. 2010, 9, 315–320. [Google Scholar]
- Data Center for Resources and Environmental Sciences, Chinese Academy of Sciences. Available online: http://www.resdc.cn (accessed on 19 October 2015).
- Liu, J. Study on national resources & environment survey and dynamic monitoring using remote sensing. J. Remote Sens. 1997, 1, 225–230. [Google Scholar]
- Liu, J. Macro-Scale Survey and Dynamic Study of Natural Resources and Environment of China by Remote Sensing; China Science and Technology Press: Beijing, China, 1996. [Google Scholar]
- Qinghai Bureau of Statistics. Qinghai Statistical Yearbooks (1989–2009). Available online: http://tongji.cnki.net/kns55/navi/HomePage.aspx?id=N2014110019&name=YQHTJ&floor=1 (accessed on 20 October 2015).
- National Bureau of Statistics of China. China Rural Statistical Yearbooks (2000–2009). Available online: http://tongji.cnki.net/kns55/navi/HomePage.aspx?id=N2014120439&name=YMCTJ&floor=1 (accessed on 21 October 2015).
- Qinghai Peoples Government. General Land Use Planning of Qinghai Province (2006–2020). 2010. Available online: http://www.guotuzy.cn/html/1312/n-163433.html (accessed on 19 October 2015).
- Zhang, T.; Yan, L.; Zhang, F.; Li, C.; Dong, Z.; Chai, X.; Li, Z. The impacts of climate change on the natural pasture grass in Qinghai Province. Plateau Meteorol. 2007, 4, 724–731. (In Chinese) [Google Scholar]
Figure 1.
Geographic position of Qinghai Province.
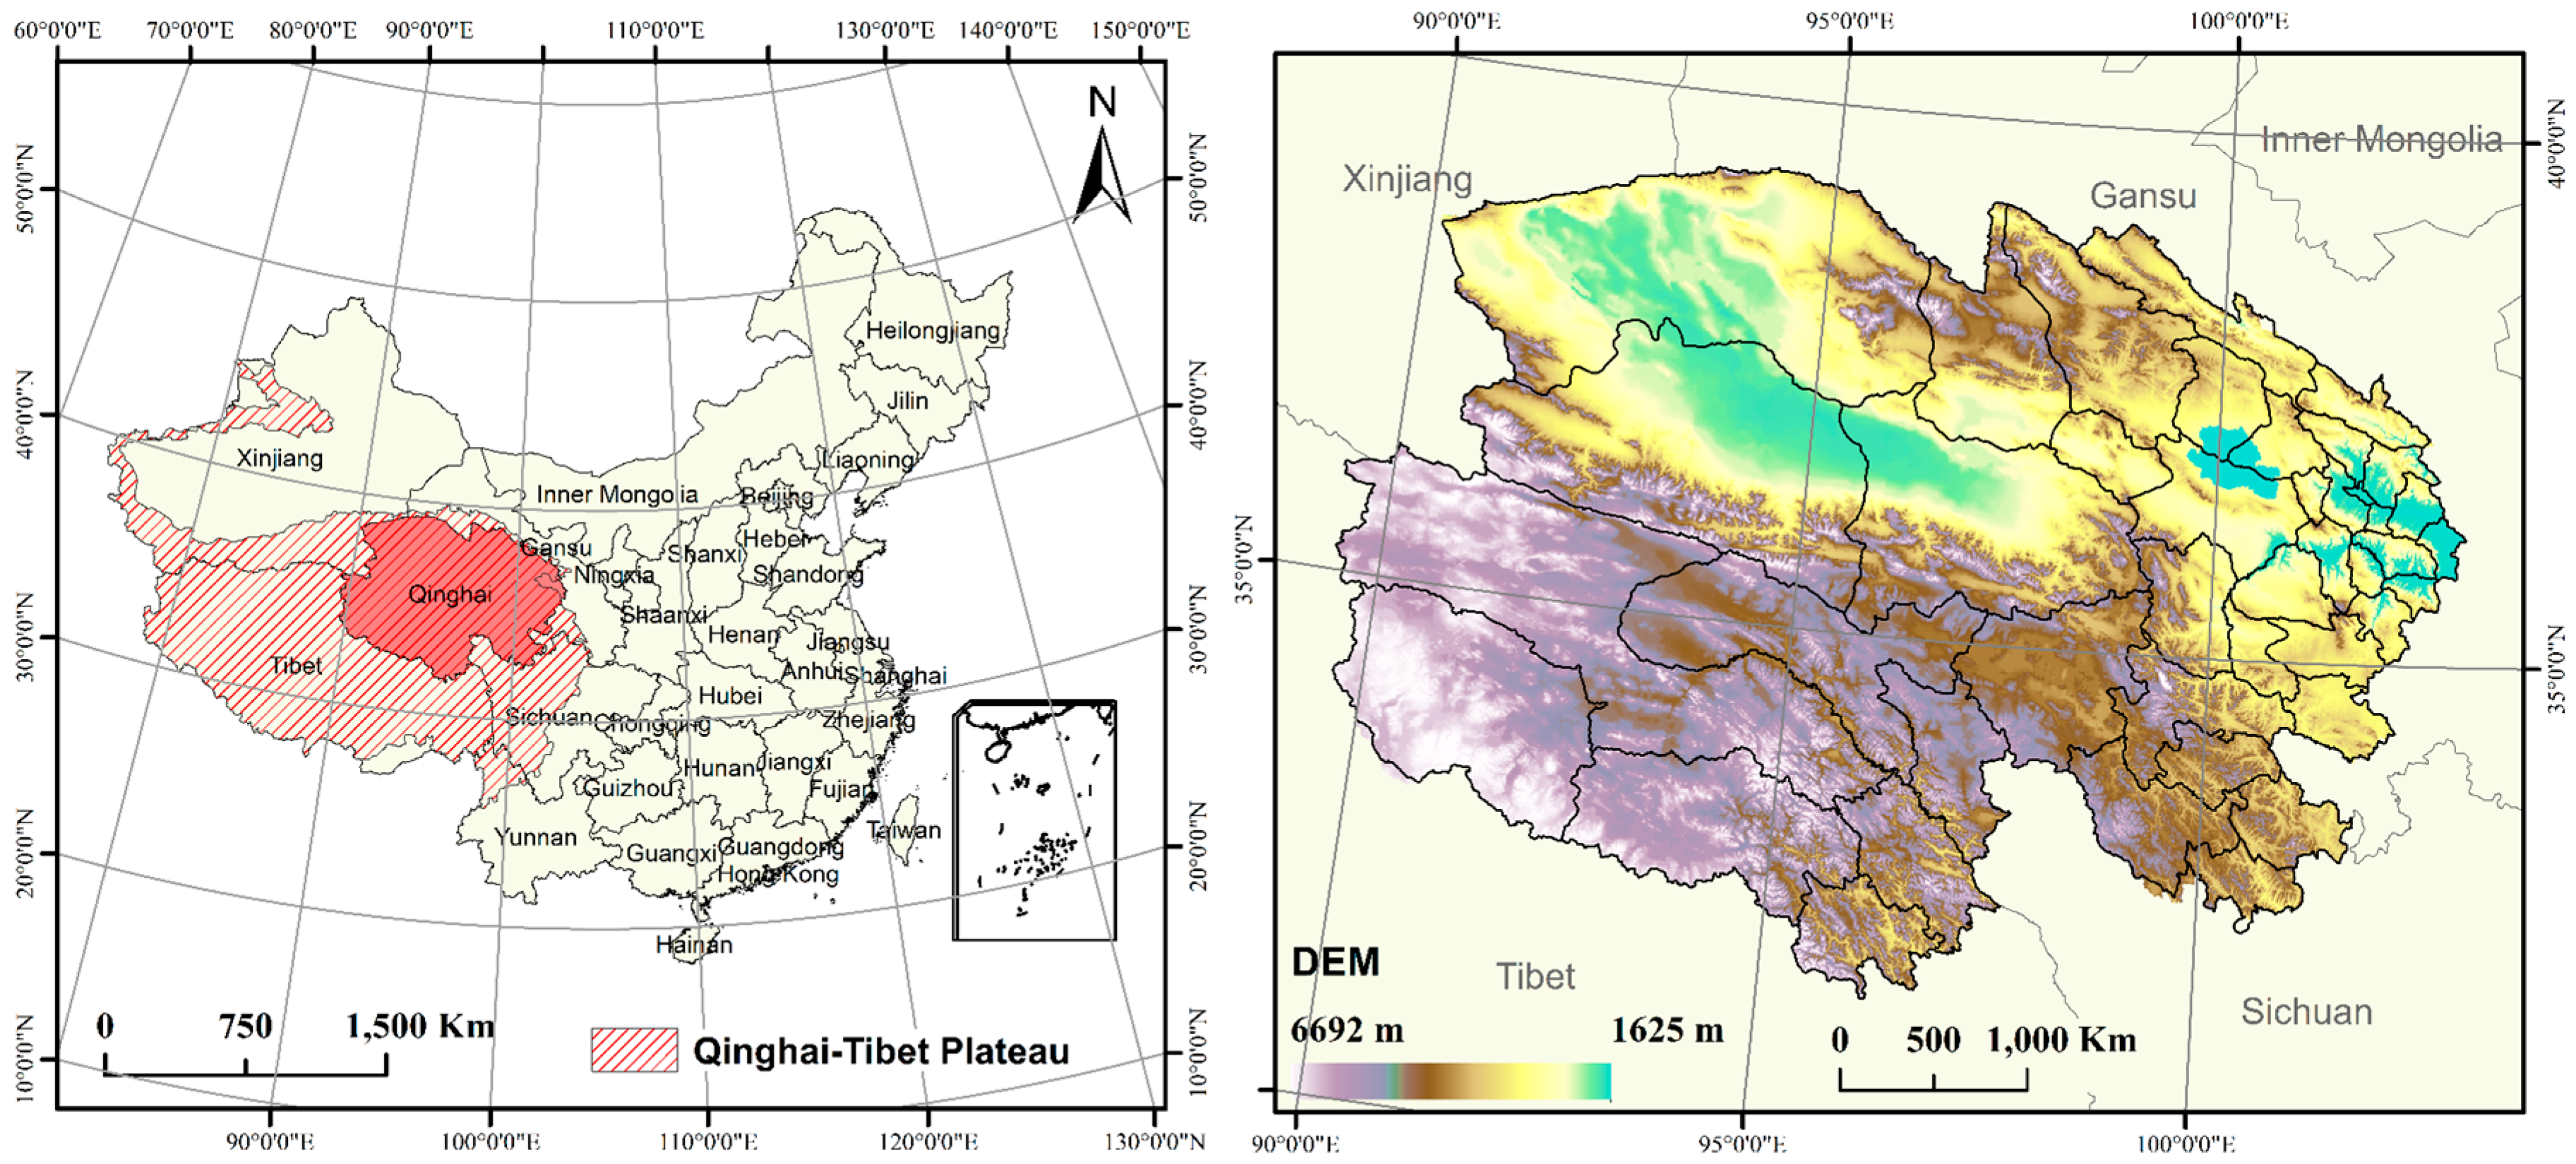
Figure 2.
Land use situation in Qinghai Province in: (a) 1988, (b) 2000 and (c) 2008.
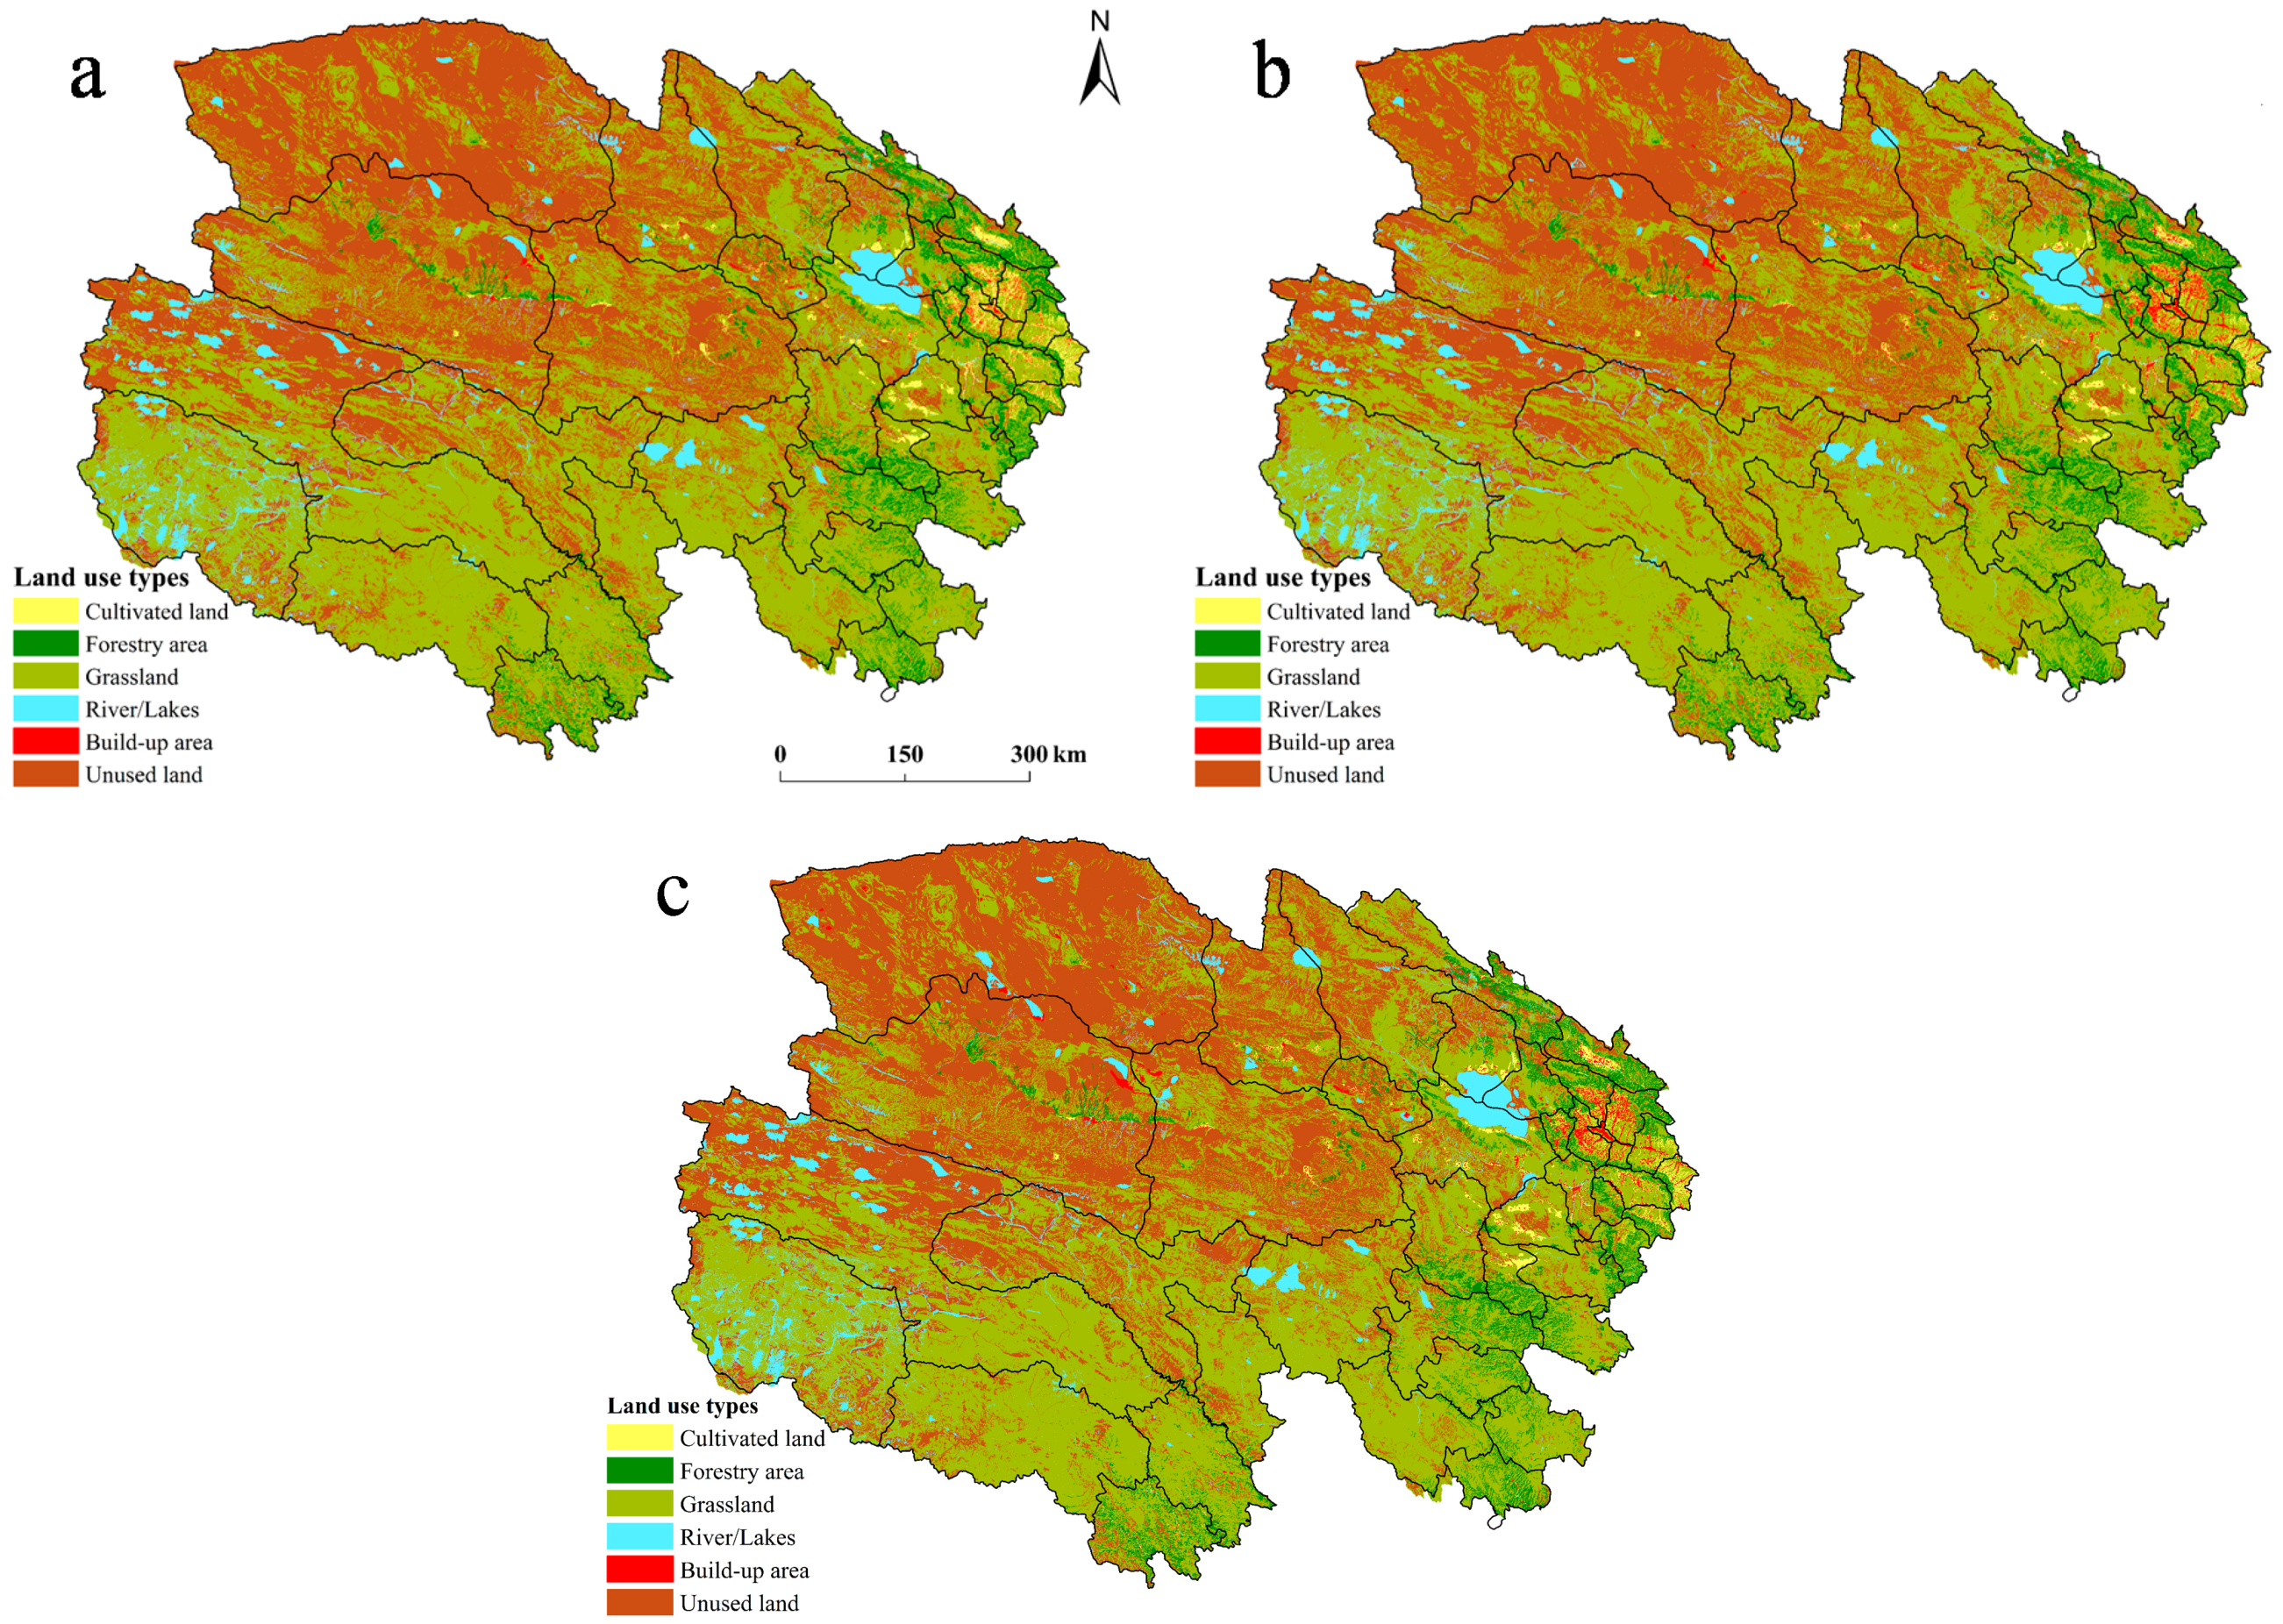
Figure 3.
Ecological service value per unit area of each town (city) in Qinghai Province in 1988 (yuan/hm2).
Figure 3.
Ecological service value per unit area of each town (city) in Qinghai Province in 1988 (yuan/hm2).

Figure 4.
Change of ecological service value per unit area of each town (city) in (a) 1988–2000 and (b) 2000–2008 (yuan/hm2).
Figure 4.
Change of ecological service value per unit area of each town (city) in (a) 1988–2000 and (b) 2000–2008 (yuan/hm2).

Figure 5.
Sensitivity of ecological service value in Qinghai Province in (a) 1988–2000 and (b) 2000–2008.
Figure 5.
Sensitivity of ecological service value in Qinghai Province in (a) 1988–2000 and (b) 2000–2008.


Table 1.
Equivalent value per unit area of the ecological service in China. Data source: the study by Xie et al. [45].
| Primary Type | Secondary Type | Forest | Grassland | Farmland | River/Lake | Desert |
|---|---|---|---|---|---|---|
| Provision | Food production | 0.33 | 0.43 | 1.00 | 0.53 | 0.02 |
| Raw material production | 2.98 | 0.36 | 0.39 | 0.35 | 0.04 | |
| Regulation | Gas regulation | 4.32 | 1.50 | 0.72 | 0.51 | 0.06 |
| Climate regulation | 4.07 | 1.56 | 0.97 | 2.06 | 0.13 | |
| Hydrology regulation | 4.09 | 1.52 | 0.77 | 18.77 | 0.07 | |
| Waste regulation | 1.72 | 1.32 | 1.39 | 14.85 | 0.26 | |
| Support | Soil conservation | 4.02 | 2.24 | 1.47 | 0.41 | 0.17 |
| Biodiversity maintenance | 4.51 | 1.87 | 1.02 | 3.43 | 0.40 | |
| Culture | Aesthetic landscape provision | 2.08 | 0.87 | 0.17 | 4.44 | 0.24 |
| Total | 28.12 | 11.67 | 7.90 | 45.35 | 1.39 | |
Table 2.
Values of each ecological service per unit area of ecosystem in Qinghai Province (unit: yuan/hm2/a).
| Primary Type | Secondary Type | Forest | Grassland | Farmland | River/Lake | Desert |
|---|---|---|---|---|---|---|
| Provision | Food production | 75.08 | 97.84 | 227.53 | 120.59 | 4.55 |
| Raw material production | 678.04 | 81.91 | 88.74 | 79.64 | 9.10 | |
| Regulation | Gas regulation | 982.93 | 341.30 | 163.82 | 116.04 | 13.65 |
| Climate regulation | 926.05 | 354.95 | 220.71 | 468.71 | 29.58 | |
| Hydrology regulation | 930.60 | 345.84 | 175.20 | 4270.74 | 15.93 | |
| Waste regulation | 391.35 | 300.34 | 316.27 | 3378.82 | 59.16 | |
| Support | Soil conservation | 914.67 | 509.67 | 334.47 | 93.29 | 38.68 |
| Biodiversity maintenance | 1026.16 | 425.48 | 232.08 | 780.43 | 91.01 | |
| Culture | Aesthetic landscape provision | 473.26 | 197.95 | 38.68 | 1010.23 | 54.61 |
| Total | 6398.14 | 2655.28 | 1797.49 | 10,318.49 | 316.27 | |
| Land Use Type | 1988–2000 | 2000–2008 | 1988–2008 |
|---|---|---|---|
| Cultivated land | 0.27 | 0.02 | 0.17 |
| Forestry areas | −0.01 | −0.01 | −0.01 |
| Grassland | −0.01 | −0.03 | −0.02 |
| Water areas | −0.04 | 0.36 | 0.12 |
| Construction land | 0.77 | 4.64 | 2.49 |
| Unused land | 0.01 | −0.01 | 0.00 |
| Comprehensive dynamic degree | 0.02 | 0.04 | 0.03 |
Table 4.
Economic value of different ecosystem services and the corresponding proportion in Qinghai Province from 1988 to 2008 (unit: a hundred million yuan; %).
| Ecosystem | 1988 | Change of ESVj | |||
|---|---|---|---|---|---|
| ESVj | Proportion | 1988–2000 | 2000–2008 | 1988–2008 | |
| Farmland | 14.35 | 0.91 | 0.47 | 0.03 | 0.50 |
| Forest | 181.66 | 11.54 | −0.12 | −0.11 | −0.23 |
| Grassland | 1003.09 | 63.74 | −1.18 | −2.23 | −3.41 |
| River/lake | 288.03 | 18.30 | −1.44 | 8.17 | 6.73 |
| Desert | 86.56 | 5.50 | 0.08 | −0.1 | −0.02 |
| Total | 1573.68 | 100.00 | −2.19 | 5.77 | 3.58 |
Table 5.
Change of ecological service value in Qinghai Province from 1988 to 2008 (unit: a hundred million yuan).
| Primary Type | Secondary Type | 1988 | Change of ESVi | |||
|---|---|---|---|---|---|---|
| ESVi | Proportion | 1988–2000 | 2008–2000 | 1988–2000 | ||
| Provision | Food production | 45.52 | 2.89 | 0.00 | 0.01 | 0.01 |
| Raw material production | 55.62 | 3.53 | −0.04 | −0.02 | −0.06 | |
| Regulation | Gas regulation | 165.12 | 10.49 | −0.14 | −0.21 | −0.35 |
| Climate regulation | 183.32 | 11.65 | −0.17 | 0.05 | −0.12 | |
| Hydrology regulation | 282.04 | 17.92 | −0.72 | 3.08 | 2.36 | |
| Waste regulation | 237.60 | 15.10 | −0.51 | 2.40 | 1.89 | |
| Support | Soil conservation | 234.37 | 14.89 | −0.16 | −0.38 | −0.54 |
| Biodiversity maintenance | 238.42 | 15.15 | −0.24 | 0.22 | −0.02 | |
| Culture | Aesthetic landscape provision | 131.67 | 8.37 | −0.21 | 0.61 | 0.40 |
| Total | 1573.68 | 100.00 | −2.91 | 5.77 | 3.58 | |
Table 6.
Change of sensitivity in different regions from 1988 to 2008 (unit: 104 km2; %). The division of the four regions in Qinghai Province is sourced from [52].
| Regions | Increase in Sensitivity | Decrease in Sensitivity | ||
|---|---|---|---|---|
| Area | Proportion | Area | Proportion | |
| Eastern Region | 1.87 | 54.96 | 1.54 | 45.04 |
| Qinghai Lake Region | 2.53 | 40.35 | 3.74 | 59.65 |
| Qaidam Region | 25.45 | 100.00 | 0.00 | 0.00 |
| Three Rivers Source Region | 26.03 | 91.77 | 2.34 | 8.23 |
| Total | 55.88 | 88.02 | 7.61 | 11.98 |
© 2016 by the authors; licensee MDPI, Basel, Switzerland. This article is an open access article distributed under the terms and conditions of the Creative Commons Attribution (CC-BY) license (http://creativecommons.org/licenses/by/4.0/).
Share and Cite
MDPI and ACS Style
Han, Z.; Song, W.; Deng, X. Responses of Ecosystem Service to Land Use Change in Qinghai Province. Energies 2016, 9, 303. https://doi.org/10.3390/en9040303
AMA Style
Han Z, Song W, Deng X. Responses of Ecosystem Service to Land Use Change in Qinghai Province. Energies. 2016; 9(4):303. https://doi.org/10.3390/en9040303
Chicago/Turabian StyleHan, Ze, Wei Song, and Xiangzheng Deng. 2016. "Responses of Ecosystem Service to Land Use Change in Qinghai Province" Energies 9, no. 4: 303. https://doi.org/10.3390/en9040303
Note that from the first issue of 2016, this journal uses article numbers instead of page numbers. See further details here.