Article

An Experimental Study on the Potential Usage of Acetone as an Oxygenate Additive in PFI SI Engines

1
School of Information Engineering, Wuhan University of Technology, Wuhan 430070, China
2
School of Energy Science and Engineering, Central South University, Changsha 410083, China
3
Department of Mechanical Science and Engineering, University of Illinois at Urbana-Champaign, Urbana, IL 61801, USA
4
School of Mechanical Engineering, Beijing Institute of Technology, Beijing 100081, China
*
Author to whom correspondence should be addressed.
Energies 2016, 9(4), 256; https://doi.org/10.3390/en9040256
Submission received: 29 January 2016 / Revised: 24 March 2016 / Accepted: 25 March 2016 / Published: 31 March 2016

Abstract

:
To face the challenges of fossil fuel shortage and stringent emission norms, there is growing interest in the potential usage of alternative fuels such as bio-ethanol and bio-butanol in internal combustion engines. More recently, Acetone–Butanol–Ethanol (ABE), the intermediate product of bio-butanol fermentation, has been gaining a lot of attention as an alternative fuel. The literature shows that the acetone in the ABE blends plays an important part in improving the combustion performance and emissions, owing to its higher volatility. Acetone and ethanol are the low-value byproducts during bio-butanol production, so using acetone and ethanol as fuel additives may have both economic and environmental benefits. This study focuses on the differences in combustion, performance and emission characteristics of a port-injection spark-ignition engine fueled with pure gasoline (G100), ethanol-containing gasoline (E10 and E30) and acetone-ethanol-gasoline blends (AE10 and AE30 at A:E volumetric ratio of 3:1). The tests were conducted at 1200 RPM, under gasoline maximum brake torque (MBT) at 3 bar and 5 bar brake mean effective pressure (BMEP). Performance and emission data were measured under various equivalence ratios. Based on the comparison of combustion phasing, brake thermal efficiency, brake specific fuel consumption and various emissions of different fuels, it was found that using acetone as an oxygenate additive with the default ECU calibration (for gasoline) maintained the thermal efficiency and showed lower unburned HC emissions.

Graphical Abstract

1. Introduction

With significantly increasing vehicle production all over the world, the problems of unsustainable fossil-fuel consumption and environmental pollution become more and more severe. There is a growing demand for the replacement of fossil fuels [1]. Meanwhile, there is growing interest in oxygenate additives and alternative fuels which could decrease engine-out emissions to meet the stricter exhaust emission legislations. However, oxygenate additives such as methyl tertiary butyl ether (MTBE) added to gasoline was reported to have a largely negative environmental impact [2,3] such as the issues with polluting the ground water [4]. In recent years, bio-ethanol is one of the alternative fuels that have been used to partly replace gasoline in SI engines all over the world. U.S. and Brazil are the two largest producers of bio-ethanol; most of the gasoline in the U.S. contains up to 10% ethanol and up to 20%–25% in Brazil, and it has been widely used in conventional cars without modification [5]. Meanwhile, higher ethanol content fuels, such as E85 in the U.S., and pure ethanol in Brazil, have also been successfully used in “flex-fuel” vehicles. Such strategies can reduce the reliance on petroleum fuels and enhance energy independence [6].
Compared to gasoline produced from non-renewable fossil oil, bio-ethanol is known as a sustainable energy source and can be produced from various kinds of biomass such as sugarcane, corn, sugar beet, cassava and red seaweed [7,8]. Using bio-ethanol as an alternative fuel additive can decrease greenhouse gas emissions and help mitigate global warming [9]. Ethanol has a higher latent heat of vaporization as well as a higher octane number than that of gasoline and it contains 34.7% oxygen by weight, which could provide advantages such as increasing volumetric efficiency, knock suppression, performance improvement, more complete burning, and emission reduction [10,11,12].
Many studies have been conducted on the combustion and emission analysis of gasoline blended with ethanol in spark ignition (SI) engines. He et al. [3] studied emission characteristics in an electronic fuel injection (EFI) engine with E0, E10 and E30 and found that the engine-out total hydrocarbon emissions (THC) were drastically reduced and a lower THC, carbon monoxide (CO) and Nitrogen Oxide (NOx) emissions were achieved at idle conditions. Kumar et al. [13] reported that improved engine performance and lower emissions could be obtained with higher ethanol percentages with proper optimization. Ceviz et al. [14] found that the coefficient of variation (COV) in indicated mean effective pressure, CO and THC emissions decreased using ethanol-unleaded gasoline blends. Schifter et al. [15] showed that the combustion rate, efficiency and fuel consumption increased, whereas HC and CO emissions decreased with 0%–20% ethanol additives in a single cylinder engine. Turner et al. [16] reported that ethanol and its faster flame speed could lead to a reduced combustion initiation duration and faster combustion, while also improving the stability, efficiency and engine-out emissions. Ozsezen et al. [17] examined ethanol-gasoline blends on a vehicle with the four cylinder gasoline engine, and reported a slight increase of the wheel power and brake specific fuel consumption (BSFC) compared to gasoline. Jia et al. [18] showed that CO and HC emissions were lower with E10, while NOx were found to have no significant reduction.
However, the cold start behavior of the engine becomes poor with increasing ethanol content due to its high latent heat of vaporization [19,20]. Acetone might be one of the potential oxygenate fuels which could be used because of its similar latent heating value relative to gasoline. Acetone (as also known as dimethyl ketone) may originate not only from coal, natural gas or petroleum sources but also from microbial fermentation [21]. It has been claimed that using acetone as an additive in gasoline could reduce emissions and increase efficiency due to its low flash point and smaller carbon chain [22,23]. Some investigation has been reported as the beneficial effect of acetone in the blended fuels by our previous researches: Nithyanandan et al. [24] tested a few blends of gasoline and ABE (A:B:E = 3:6:1) mixture, ranging from 0% to 80% volume ratio, in a PFI engine and found that a small amount of ABE addition (<40%) can enhance thermal efficiency and reduce emissions. Then, Nithyanandan et al. [25] studied the combustion performance and emissions of ABE-gasoline blends (30% ABE by volume) by the different component volumetric ratio (ABE30 (3:6:1) and ABE30 (6:3:1)) in a single cylinder SI engine at different loads; the results showed that the combustion efficiency might be enhanced by acetone. Meng [26] reported the preliminary experimental investigation using G100, E30 and AE30 as the test fuels, and the results showed that AE30 has the advantages of HC emission and the brake thermal efficiency due to the acetone ingredient. Wu et al. [27] invested the impact of acetone in ABE-diesel blends in a constant volume chamber and found that a high fraction of acetone could lower soot formation due to a shorter combustion duration and stronger premixed combustion, as well as enhance the combustion efficiency.
In recent years, the industrial-scale production of bio-butanol has been developed rapidly in many counties and companies via ABE fermentation from agricultural sources. However, the high-cost of bio-butanol production limits the usage of it as an alternative fuel [24,27]. Acetone and ethanol are the low-value byproducts (at the volume ratio of 3:1) based on the economic evaluation of bio-butanol production [28]. Using acetone and ethanol from industrial ABE fermentation as alternative fuel additives in the vehicle engine have both economic and environmental benefits. In addition, there are no studies carried out on the experimental investigation of using acetone and ethanol as gasoline additives.
The aim of this work is to investigate the potential usage of acetone and ethanol as gasoline alternative fuel additives in the in-use vehicle by the comparable analysis. A more detailed research about the combustion, performance and emission characteristics were investigated by the experiments which had been done on a port fuel injection SI engine fueled with pure ethanol-free gasoline (G100), ethanol-containing gasoline (E10 and E30) and acetone-ethanol-gasoline blends (AE10 and AE30). Blends containing 90% and 70% gasoline (by volume) were tested to represent commercial gasoline.

2. Experimental Setup and Methods

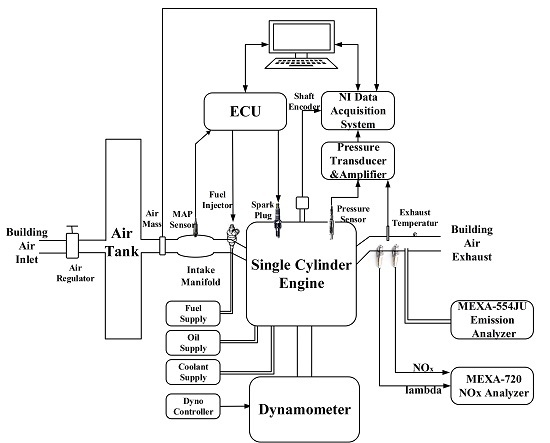
2.1. Engine Test Bench

The experiments were conducted on a single cylinder port fuel injection (PFI) research engine that has less than 30 KW (40 HP) and 52 Nm (38 lb-ft) peak output and the general specifications are shown in Table 1. Two iron castings produced by Ford are used to modify the original V8 engine to the single-cylinder engine. The cylinder head is from the left bank of the V8 engine and the single cylinder bore aligns with cylinder two on the head. Rocker arms from cylinders one, three and four were removed to reduce the frictional losses. The other modifications made to the engine have been detailed in ref [29]. A GE type TLC-15 dynamometer controlled by a DYN-LOC IV controller and DTC-1 digital throttle controller from DyneSystems is coupled with the engine. The engine is controlled by a calibrated Megasquirt II V3.0 Engine Control Unit (ECU), which allows on-line adjustment to change the fuel injecting time and spark advanced angle. A Bosch injector # 0280150558 rated at 440 cm3/min at a fuel pressure of 3 bar is selected to guarantee enough fuel mass for lower stoichiometric air-fuel ratio fuels. The schematic of the engine test bench is shown in Figure 1.
For the data acquisition, the in-cylinder pressure was measured using a Kistler type 6125B pressure transducer together with an AVL 3057-AO1 charge amplifier and indexed against a crankshaft position signal from a BEI XH25D shaft encoder. Air mass flow, temperature of intake manifold and exhaust gas were also measured by the sensors. All the measurements are recorded by a National Instruments (NI) data acquisition system with LabVIEW code. The NOx and lambda measurements were performed through a Horiba MEXA-720 NOx non-sampling type meter in the exhaust manifold of the engine. Measurements of unburned hydrocarbon (UHC), carbon dioxide (CO2) and carbon monoxide (CO) were made using a Horiba MEXA-554JU sampling type meter. Exhaust gas temperature was measured using a type-K thermocouple located in the exhaust manifold [30].
The calibration process can correct systemic errors and all instruments used in this study were calibrated before the experiments. The H/C and O/C atom ratio settings in analyzers were adjusted based on the properties of the fuel blends. The Horiba MEXA-554JU analyzer (Horiba Ltd.: Shanghai, China) was calibrated with the standard gas before each experiment and purged after each measurement.

2.2. Uncertainty Analysis

All the physical quantities measured by the instruments and sensors are subject to uncertainties. Uncertainties in the experiments can arise from the instrument selection, condition, calibration, environment, observation, hysteresis, linearity, repeatability, bias noise, reading and test planning [31]. The accuracy of the experiments can be proved by the uncertainty analysis followed by the method described by Holman [32]. The primary measurements in this study are listed in Table 2, and the percentage uncertainties [33,34] were also estimated based on the specifications and calibration certificates.
In order to have reasonable limits of uncertainties for the computed values such as brake power, brake thermal efficiency and brake specific fuel consumption, the estimated uncertainty in the calculated result can be obtained on the basis of the uncertainties in the primary measurements. Following the analysis method about the product functions, the combined uncertainty of the calculated result can be obtained by Equation (1).
w R R = ( a i w x i x i ) 2 ; R = x 1 a 1 x 2 a 2 x n a n
where R is the calculate result and x is the independent measurement. The calculated uncertainty of break power, brake thermal efficiency (BTE) and brake specific fuel consumption (BSFC) is 0.32%, 1.83% and 1.83%, respectively. It should be noted that the measurements and calculated uncertainties in the main engine characteristics do not have noticeable influences on the variation of the engine characteristics.

2.3. Fuels

Five test fuels were used in this study—G100, E10, E30, AE10 and AE30. Ethanol-free gasoline (Research Octane Number (RON) = 92), referred to as G100, (100% gasoline) was used as the baseline fuel for all the blends. Two ethanol-gasoline splash blends were prepared with 10%, 30% ethanol by volume in gasoline, referred to as E10 and E30. In the recent previous studies [25,26] investigating the acetone impact, ABE blends were used, in which acetone, butanol and ethanol were in the ratio of 3:6:1. So in this study, acetone and ethanol mixtures were prepared at a volume ratio of A:E = 3:1. In addition, two acetone-ethanol-gasoline blends referred to as AE10 and AE30 were prepared using 10%, 30% (by volume) acetone-ethanol mixtures in gasoline. For example, AE10 has 7.5%, 2.5% and 90% acetone, ethanol and gasoline by volume, respectively. The acetone and ethanol used are analytical grade with 99.5% and 99.8% purity, respectively, and supplied by Decon Laboratories, Inc. Properties of the neat fuels are listed in Table 3. Furthermore, Table 4 shows the calculated properties of the test fuel blends.
It is well known that acetone and ethanol contain oxygen, and such kind of oxygenate additives incorporated into gasoline would alter the physicochemical properties like density, volatility, octane rating and, especially, enthalpy of combustion. However, these properties directly affect the engine combustion, performance and the level of emissions [37].
The addition of ethanol and acetone would increase the blends’ latent heat of vaporization, which would cause a charge-cooling effect during the intake process. As a consequence a positive effect on volumetric efficiency is expected with increasing additive content [8]. The different laminar flame speeds (LFS) of acetone and ethanol compared to gasoline would also have an effect on the combustion process as LFS plays an important role in the early combustion phase [38]. However, the LFS also strongly depends on pressure and temperature. So, at the same engine load, the combustion phasing of the blends would be determined by the balance of increase in LFS and the reduction in temperature due to charge cooling [30]. Due to the differences in stoichiometric air/fuel ratio, the injected fuel mass will vary slightly at the same engine operation conditions which might change the brake specific fuel consumption (BSFC). Acetone has a lower viscosity, a lower boiling point of 56 °C and a higher vapor pressure than ethanol (as calculated by Antoine equation [39]), which consequently makes it more volatile, and this could help the blend’s spray collapse significantly [40]. Fuel-borne oxygen in the additives would cause a more complete combustion and influence the energy efficiency [41].

3. Test conditions and Procedure

The effect of acetone and ethanol addition to pure gasoline was investigated at different loads and equivalence ratios. The results under stoichiometric conditions are first presented and discussed in detail, and then some results over the range of equivalence ratio are presented for completeness.

3.1. Test Conditions

In this study the engine speed was fixed at 1200 RPM. The throttle plate was fully opened and the engine load was set to 3 bar and 5 bar BMEP (brake mean effective pressure) by setting the intake manifold pressure to 60 kPa and 90 kPa. The equivalence ratio of the fuels was swept from rich to lean, i.e., φ = 0.83–1.25. To perform an analysis of the oxygenate additives blended fuels in the common SI engines without any specific modifications, the spark timing was set to gasoline MBT (maximum brake torque, 19° BTDC (before top dead center) at 3 bar and 25° BTDC at 5 bar). The measured engine torque, lambda and NOx were averaged over a 60-s period, while the UHC, CO and exhaust gas temperature were recorded directly from the displayed data. Each experiment was performed three times in a temperature-controlled laboratory. Each experiment began at the cold-start condition; once the engine was warmed up, data were recorded at steady state at each operating point. The data displayed in the resulting plots show the averaged results for the data sets at each operating point. The test conditions are summarized in Table 5.

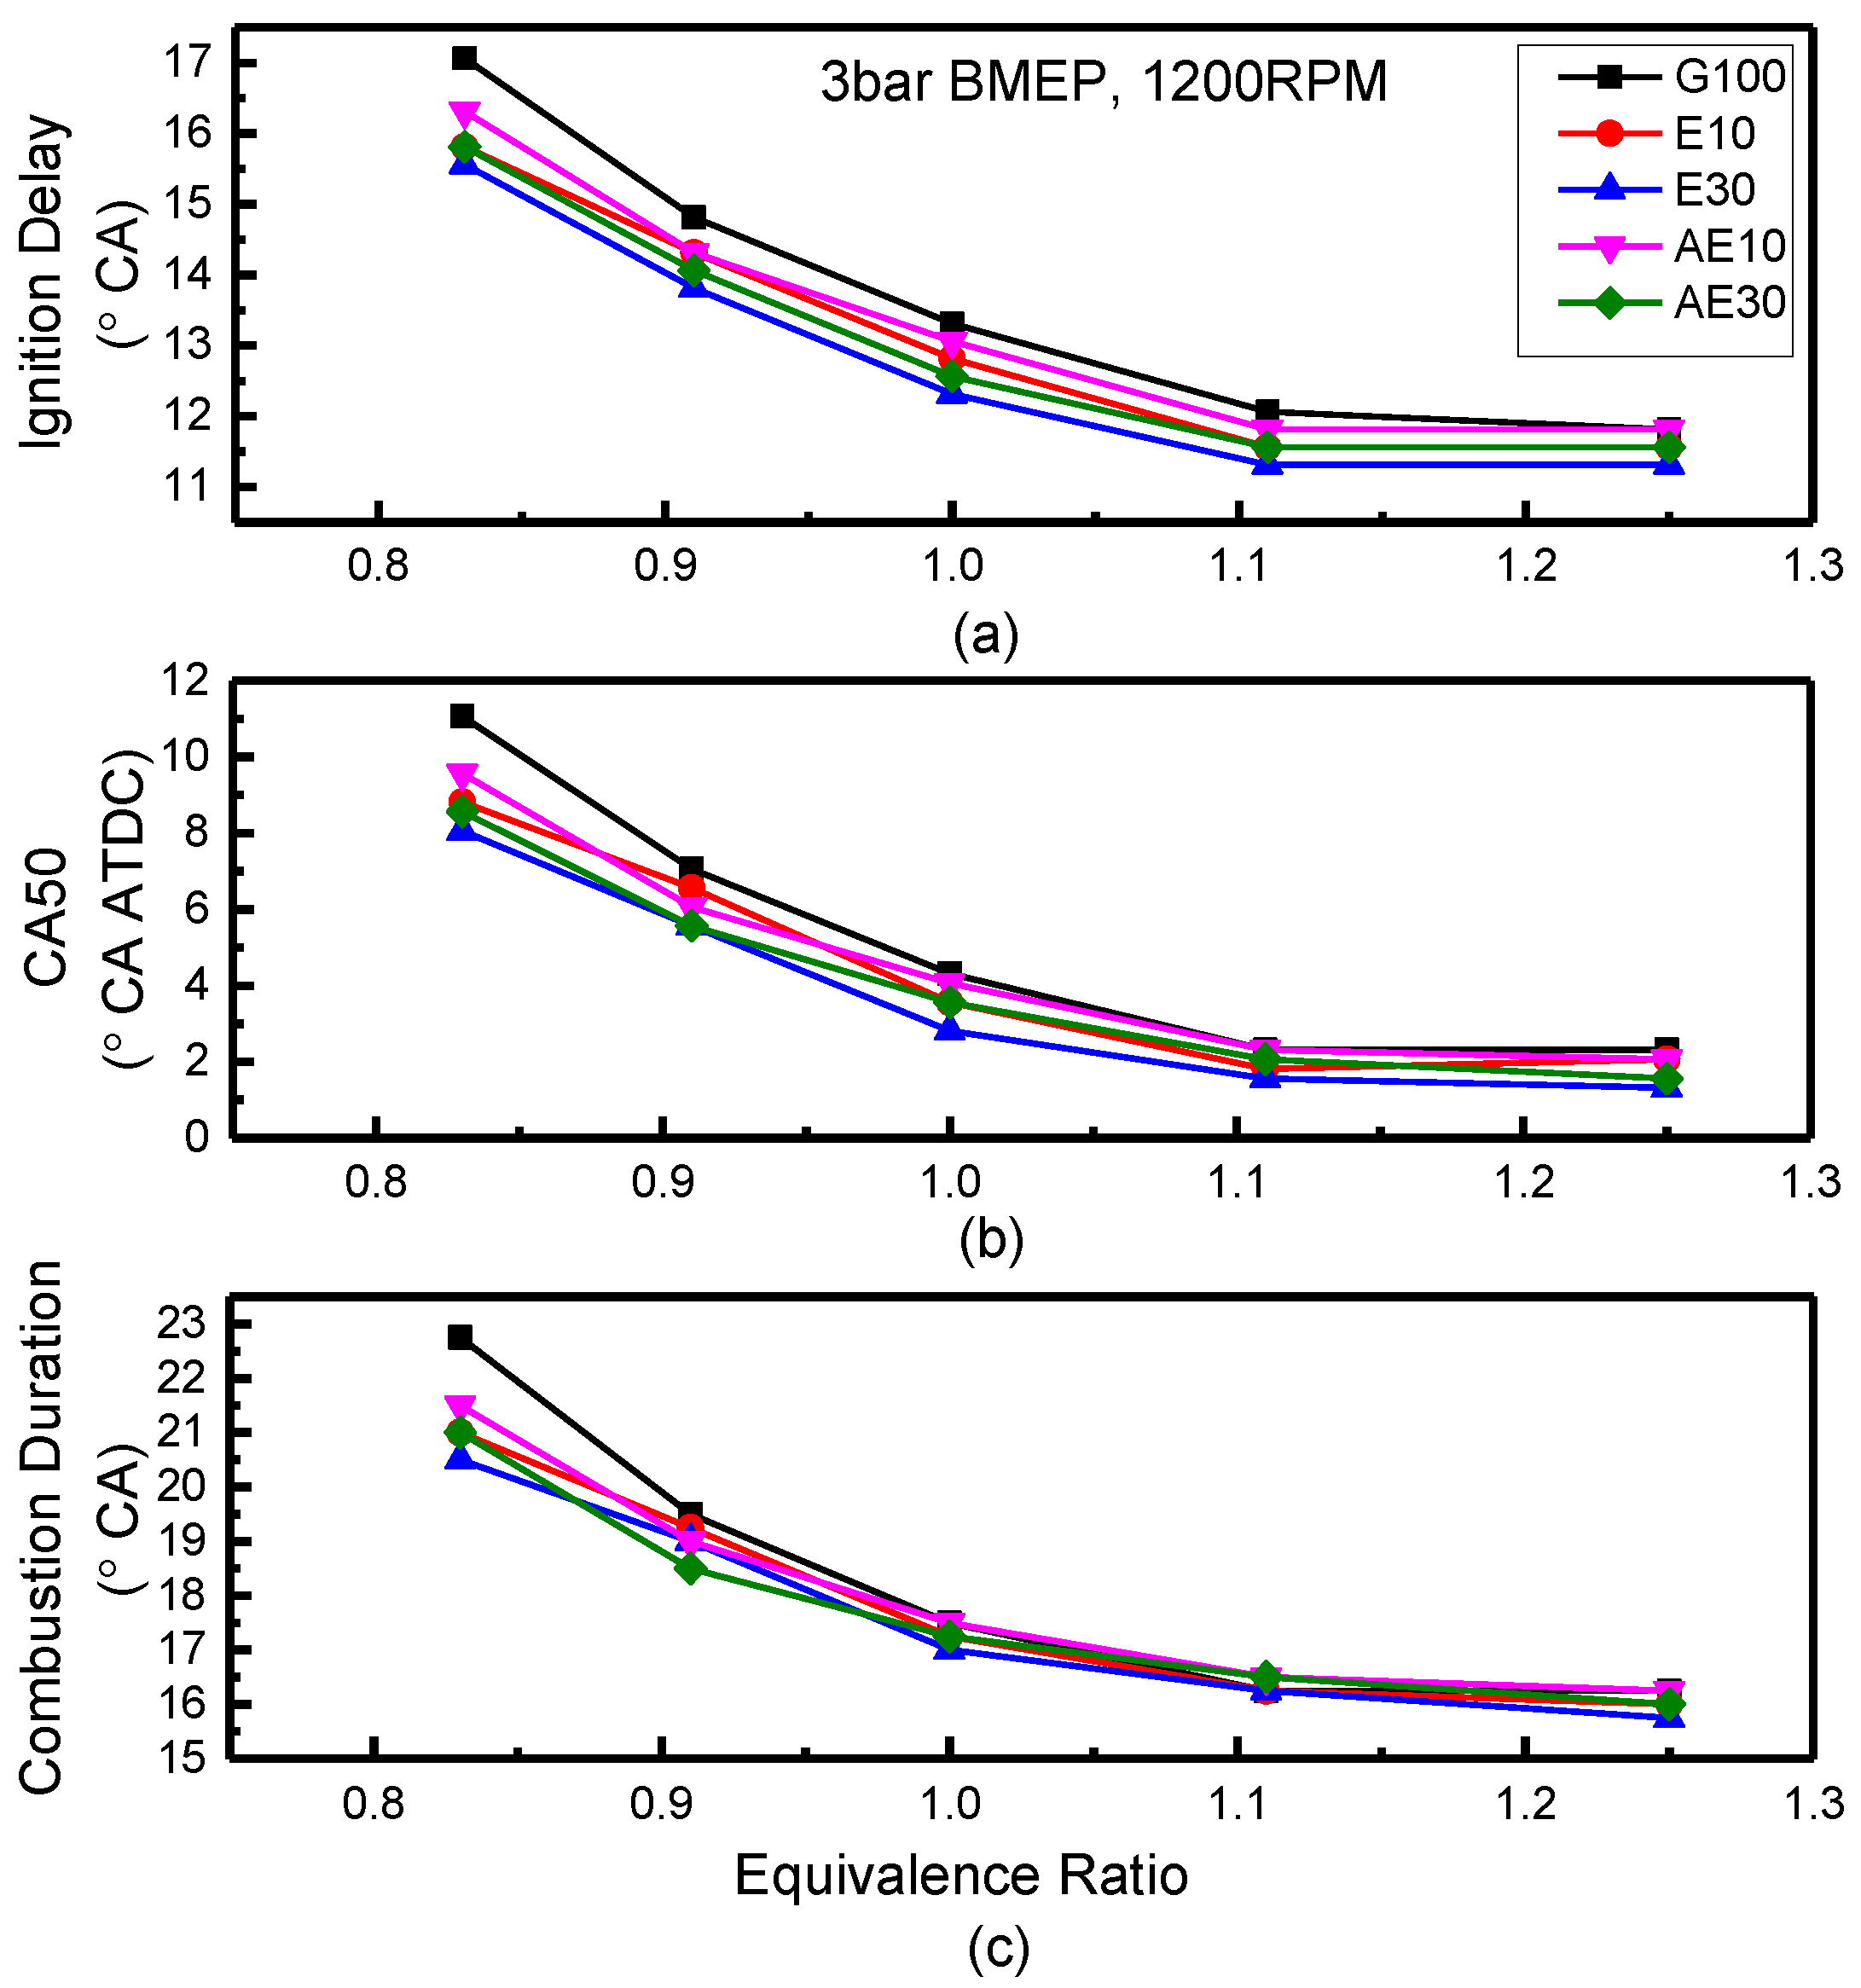
3.2. Engine Combustion Characteristics Analysis

The engine combustion characteristics are first analyzed based on the in-cylinder pressure traces. Although the experiments were performed at both 3 bar and 5 bar BMEP, only the 3 bar combustion results are shown for the sake of brevity. The results under 5 bar BMEP were quite similar and showed the same trends.

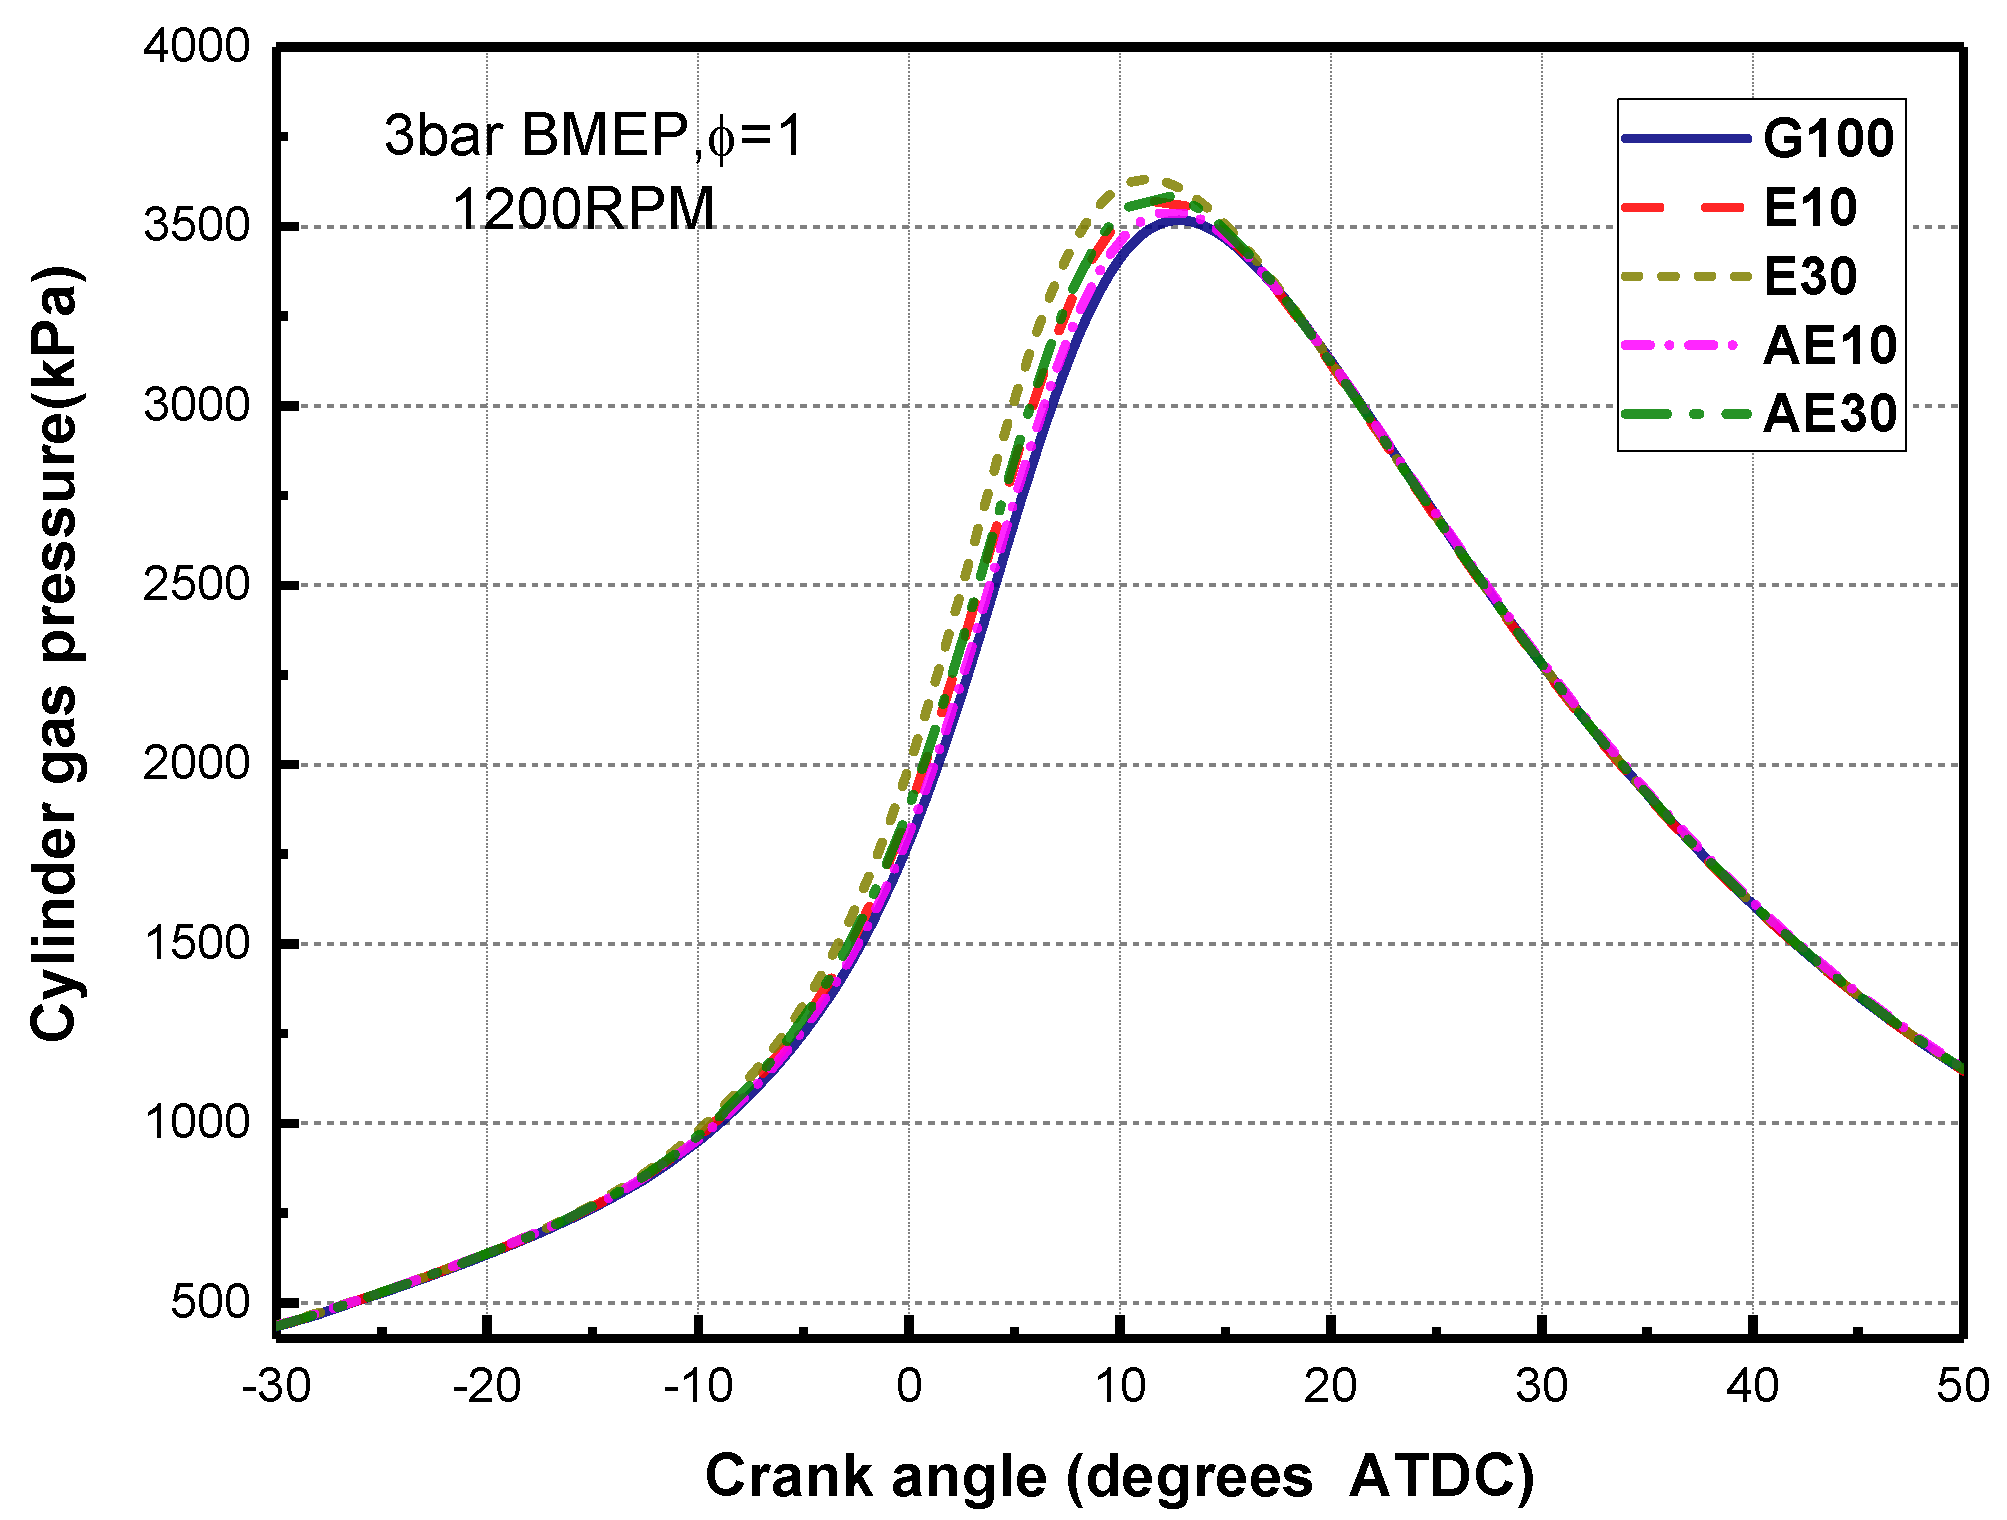
3.2.1. In-Cylinder Pressure Traces

The engine combustion characteristics are analyzed based on the in-cylinder pressure traces of different fuels as described above. All the in-cylinder pressure are the mean trace of several 25 consecutive engine cycle samples recorded over a 60 s period. As shown in Figure 2, E30 shows the highest peak pressure and it is advanced relative to the other fuels, while G100 has the lowest peak cylinder pressure and the most retarded combustion phasing. Comparing the two groups of data, i.e., AE10 and E10 with AE30 and E30, the fuels with acetone show slightly lower in-cylinder pressure and retarded phasing (moving from left to right along the x axis) relative to the ethanol-gasoline blends. Note that the spark timing was maintained constant, and the faster combustion of ethanol-gasoline blends is due to ethanol’s higher laminar flame speed. This is discussed in detail in the following section.

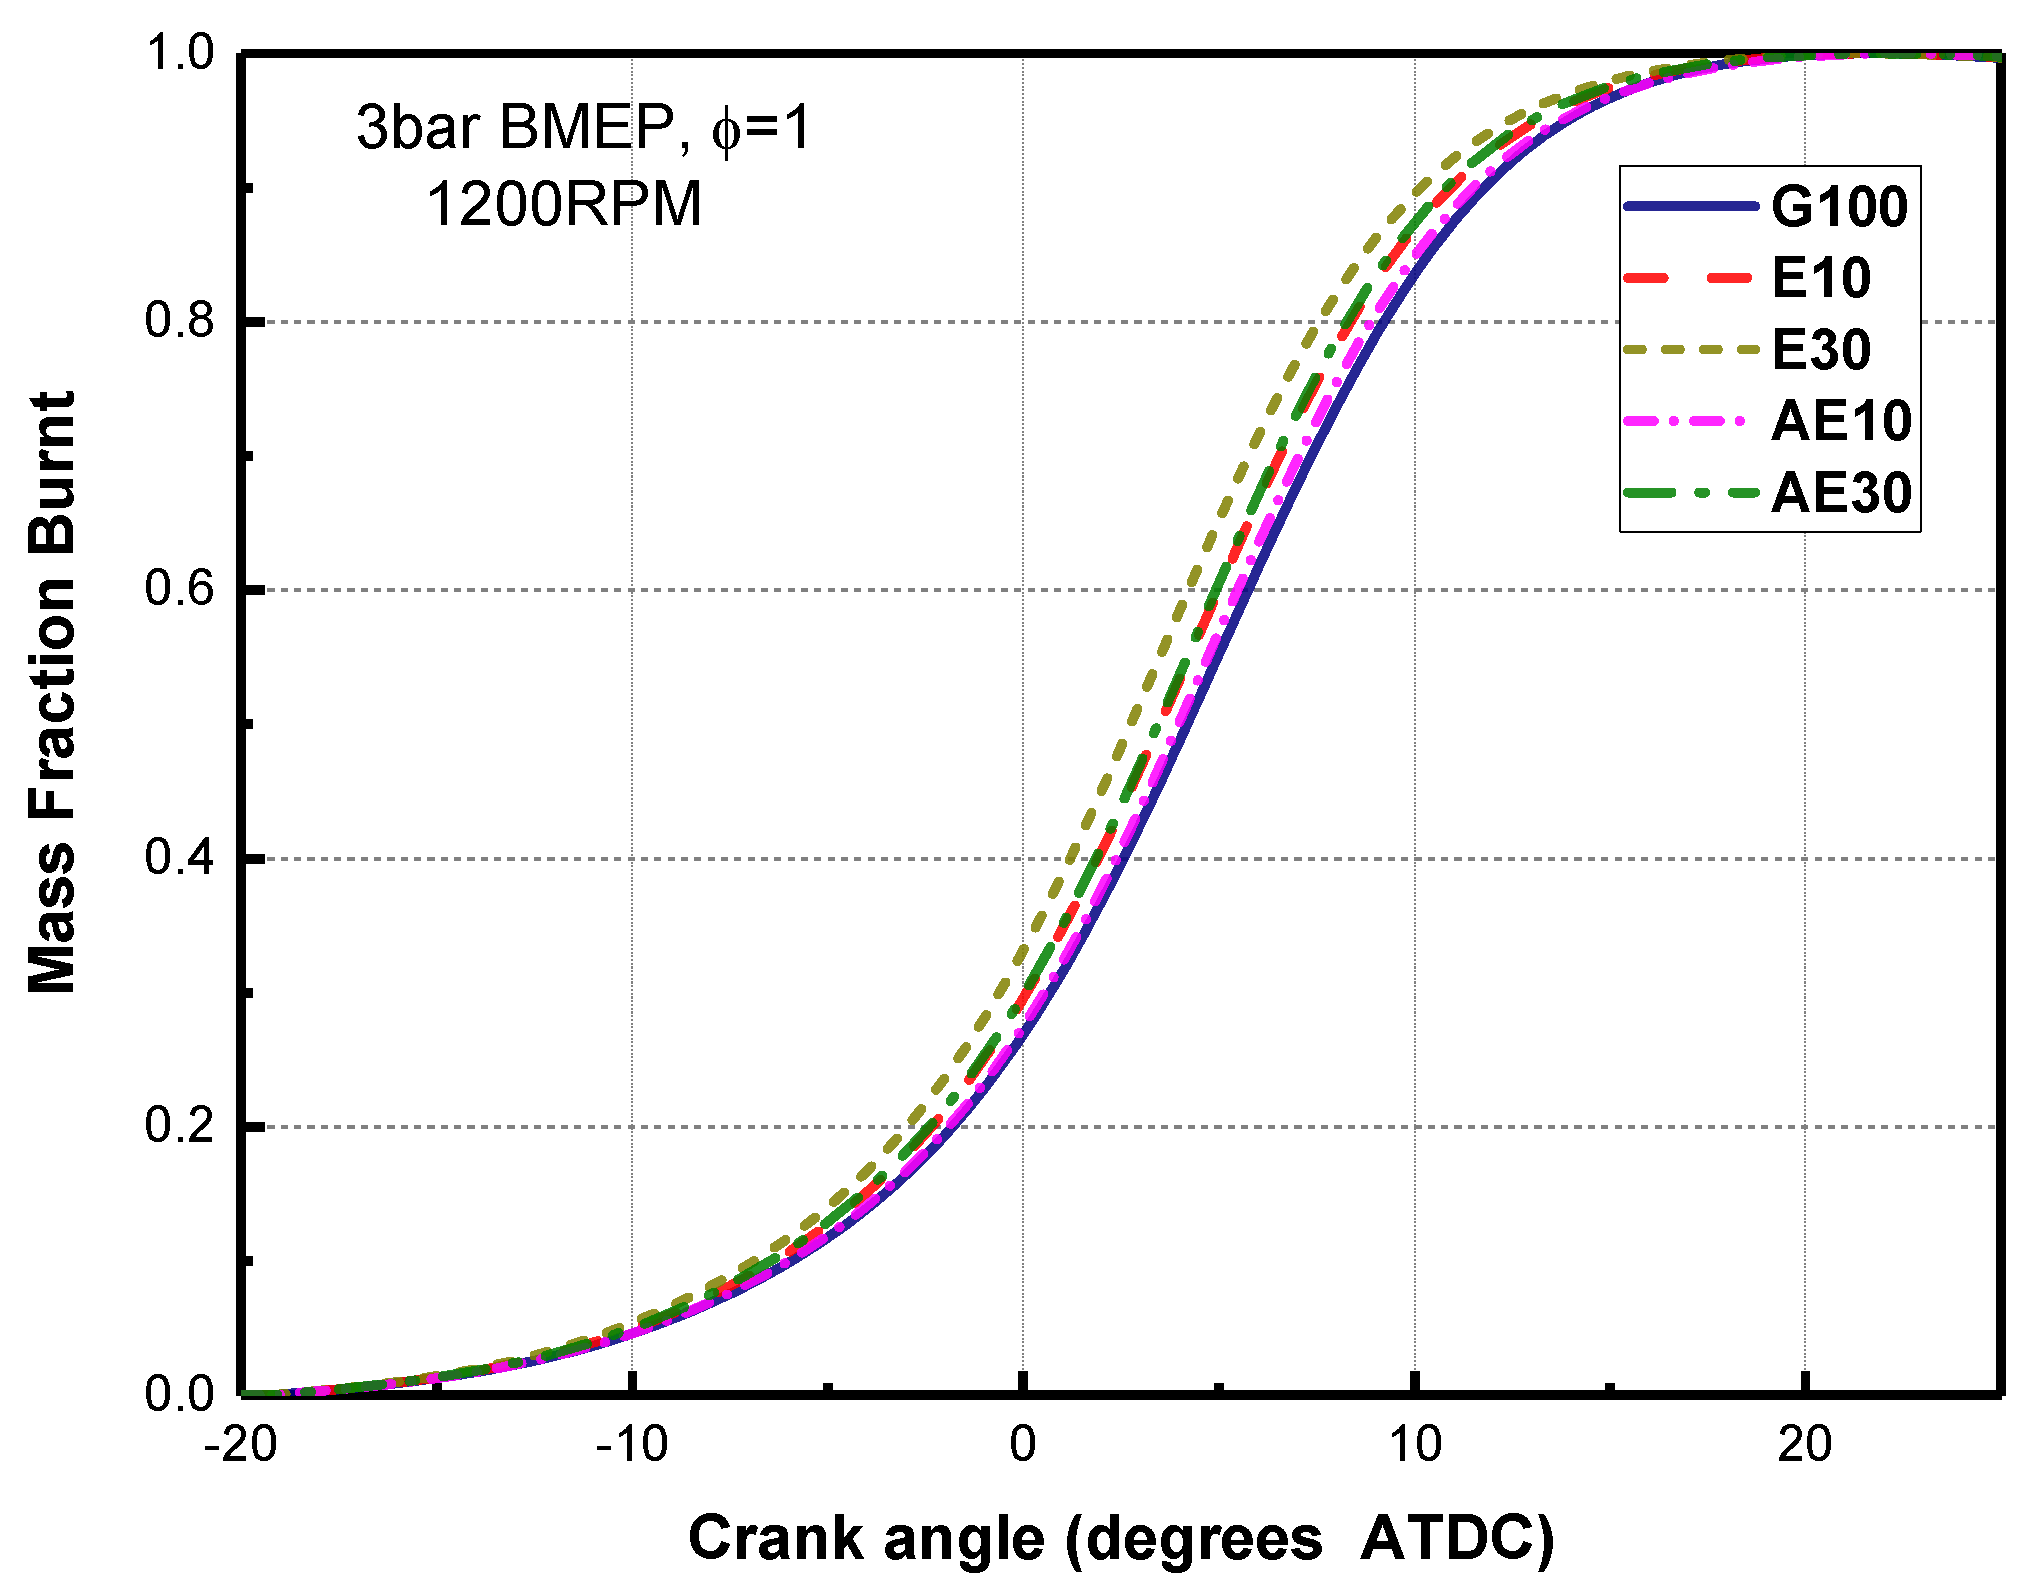
3.2.2. Normalized Mass Fraction Burnt (MFB)

The normalized MFB profile is a quantity with the scale of 0 to 1 describing the cumulative percentage of fuel consumed during the combustion process as a function of crank angle, which can be used to evaluate combustion phasing. It is calculated following the procedure developed by Rassweiler and Withrow [42]. Figure 3 presents the normalized MFB profiles of different fuels at the stoichiometric ratio.
The MFB is divided into three separate combustion phases as described by Heywood [43]. Based on the calculation of the MFB trace in Figure 3, the first stage of combustion considered as ignition delay is the crank angle interval between the spark discharge and the 10% MFB location, expressed as 0%–10% MFB, and the combustion duration is defined as the crank angle interval between 10% and 90% MFB [38]. The 90%–100% MFB duration is the flame termination period in which the flame extinguishes on the combustion chamber surfaces.
Figure 4 shows the ignition delays and combustion durations of different fuels under stoichiometric conditions. It is seen that G100 has the highest ignition delay while the ethanol-gasoline blends have a lower value than the acetone-ethanol-gasoline blends. E30 and AE30 have a lower ignition delay than E10 and AE10 respectively. This is because this period of early combustion during which flame development occurs, the combustion rate is mainly affected by the LFS (laminar flame speed) of the fuel-air mixture. Ethanol has a higher LFS than that of acetone and gasoline has the lowest. On the other hand, the latent heat of vaporization would also impact the combustion rate because of the charge cooling effect [44]; however, the decrease of pre-ignition temperature due to charge cooling by adding ethanol and acetone is not obvious. This is due to the engine using PFI, which would reduce the charge cooling effect. Figure 4 shows the combustion duration of different fuels. E30 has the shortest duration; G100 and AE10 have the longest duration; however, there is no big difference among these test fuels. Factors such as in-cylinder mixture motion turbulence, flame quenching, dilution, and heat loss dominate this phase of the combustion process [45]. Improved laminar flame speed as the ethanol and acetone concentration is insignificant compared to these other factors because the bulk charge is burned as the turbulent flame during this rapid-burning period.
The 50% MFB location, also known as CA50 (Crankshaft Angle where 50% of the fuel has burned), is shown for different fuels in Figure 5. CA50 represents the center of combustion and shown in terms of CAD ATDC. E10 and AE30 have similar combustion phasing because the decrease in the combustion rate due to the reduction in ethanol content from E10 to AE30, is compensated by the acetone content. This also shows that the impact of acetone on combustion phasing is less pronounced than that of ethanol due to its relatively lower LFS. Similar trends were observed in Reference [15], where the combustion phasing was advanced relative to that of G100 with the increase of ethanol and acetone content. As a consequence, the combustion phasing should be optimized by retarding the spark timing to obtain the maximum brake torque based on the amount of ethanol and acetone.
Figure 6 shows the ignition delay, combustion duration and CA50 location of the different fuels at varying equivalence ratios. All the fuels behave similarly in that the durations are longer at the leaner conditions and shorter at richer conditions. This is due to faster flame development at richer conditions. As described in Ref. [43], the flame burning velocity varies based on the air fuel mixture equivalence ratio. The combustion slows down when the mixture becomes leaner while the peak burning velocity is achieved at a slightly richer (than stoichiometric) condition and then begins to decrease with further enrichment. It also appears that the differences in the combustion duration are further apparent relative to G100 at leaner equivalence ratios, showing the enhancement of combustion rate due to ethanol and acetone; on the other hand, the LFS is more sensitive to the equivalence ratio at leaner conditions [43]. The center of combustion is retarded progressively as the mixture becomes leaner. G100 has the longest ignition delay and E30 shows the shortest at all the test points as LFS has the main impact on the early combustion rate.

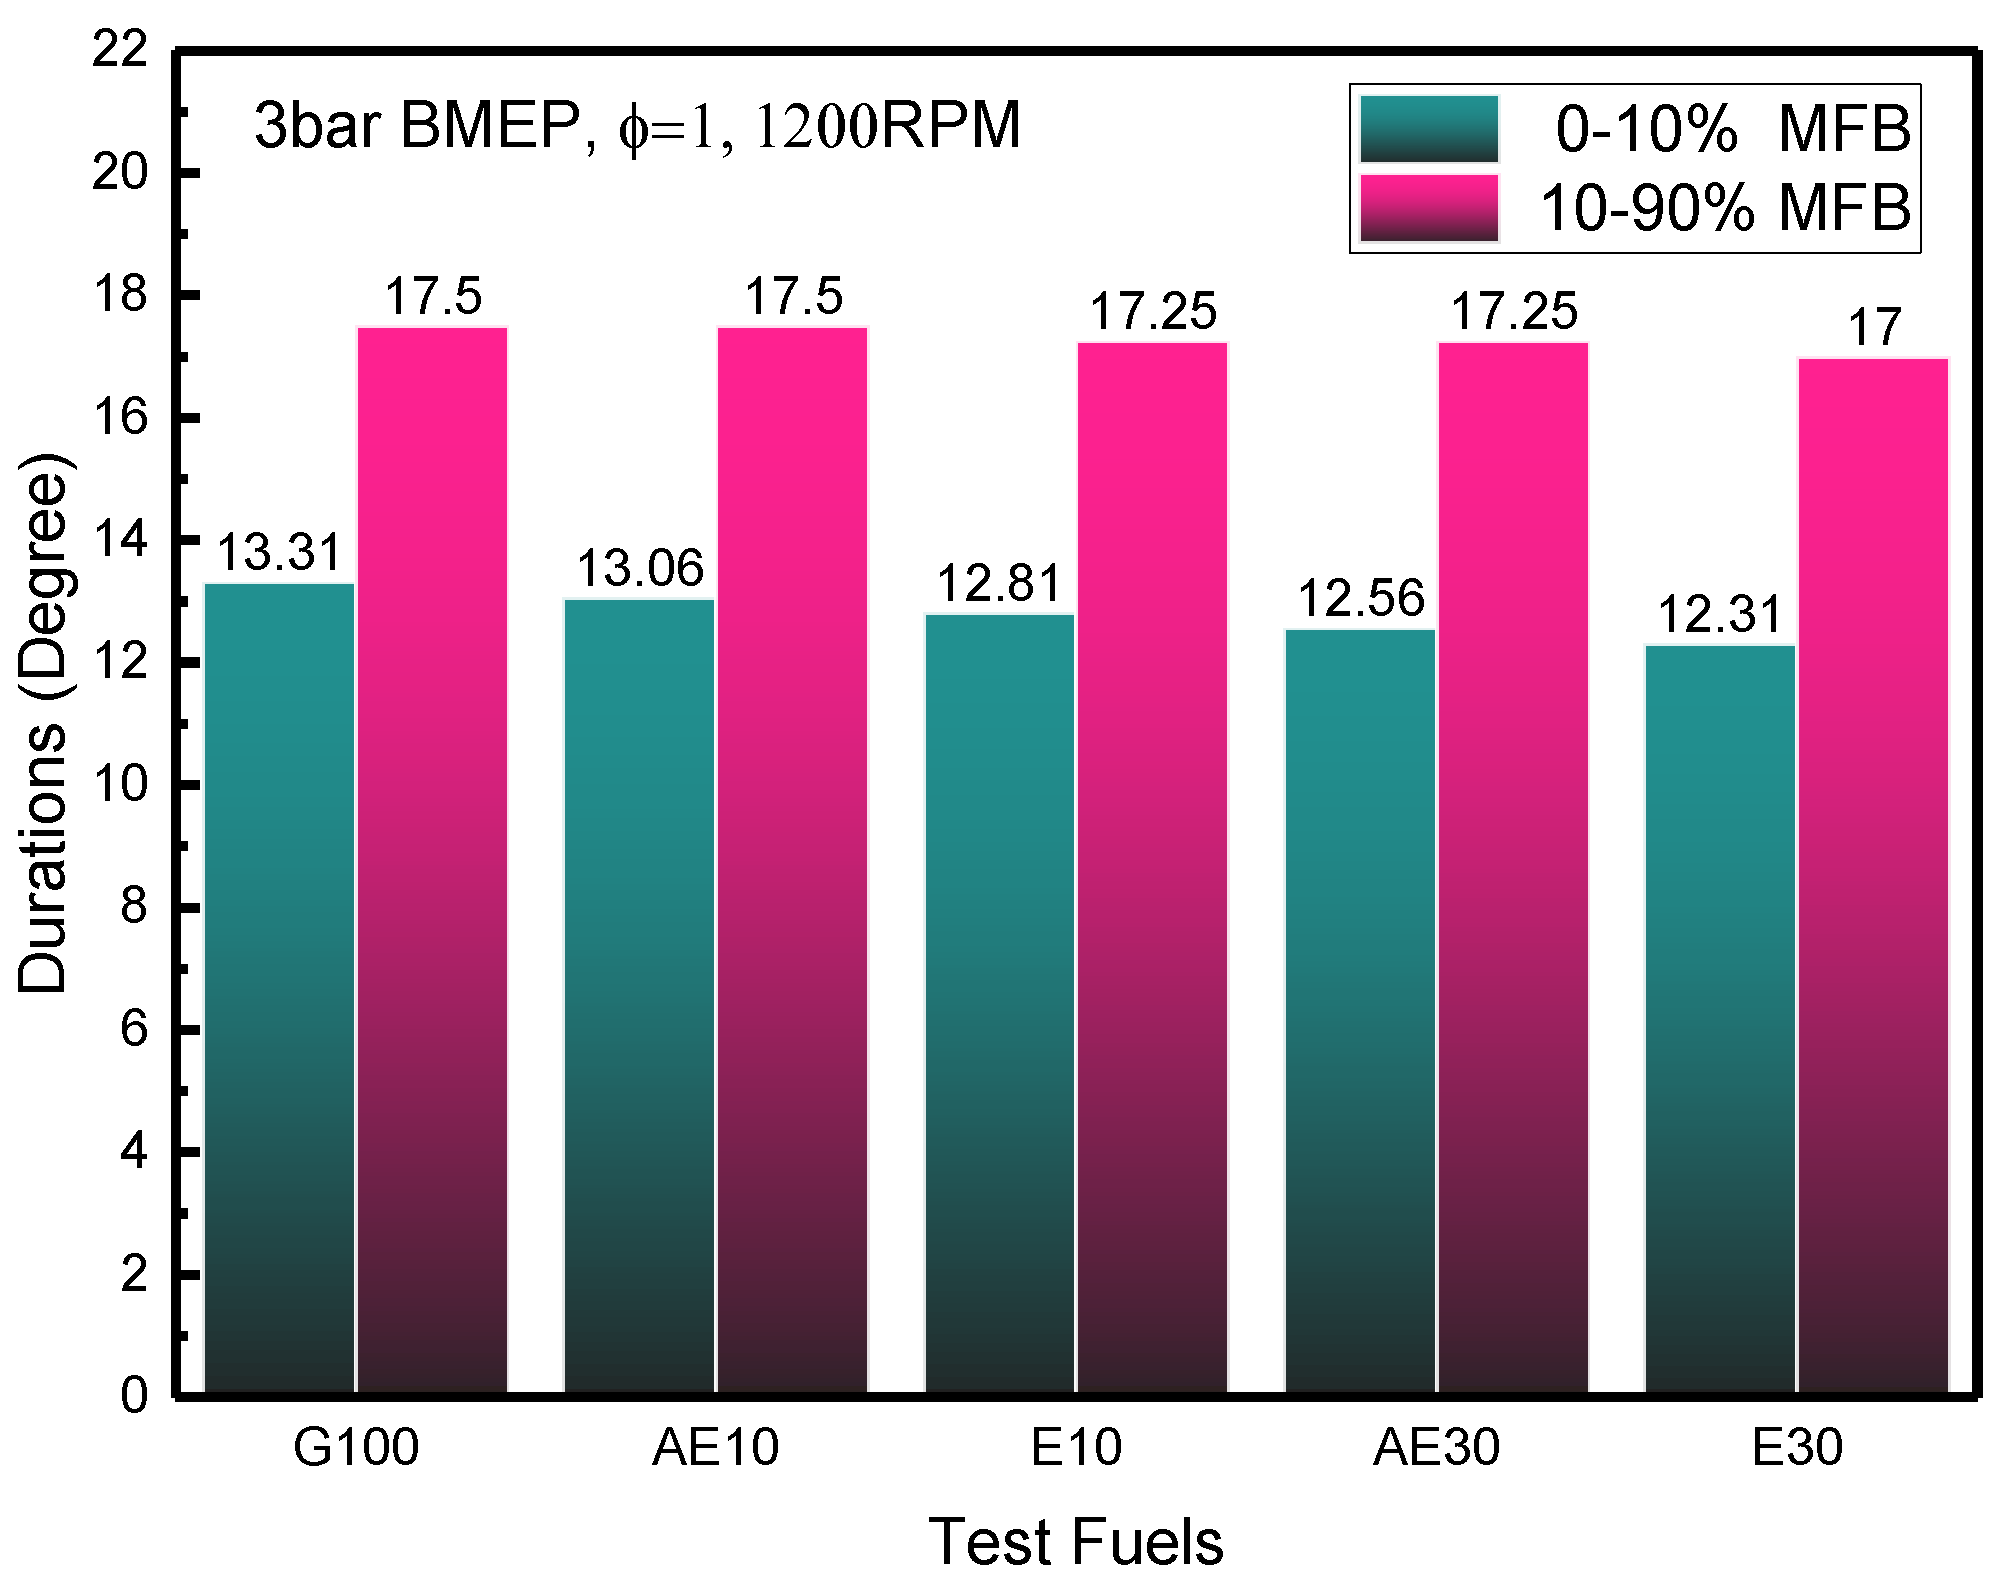
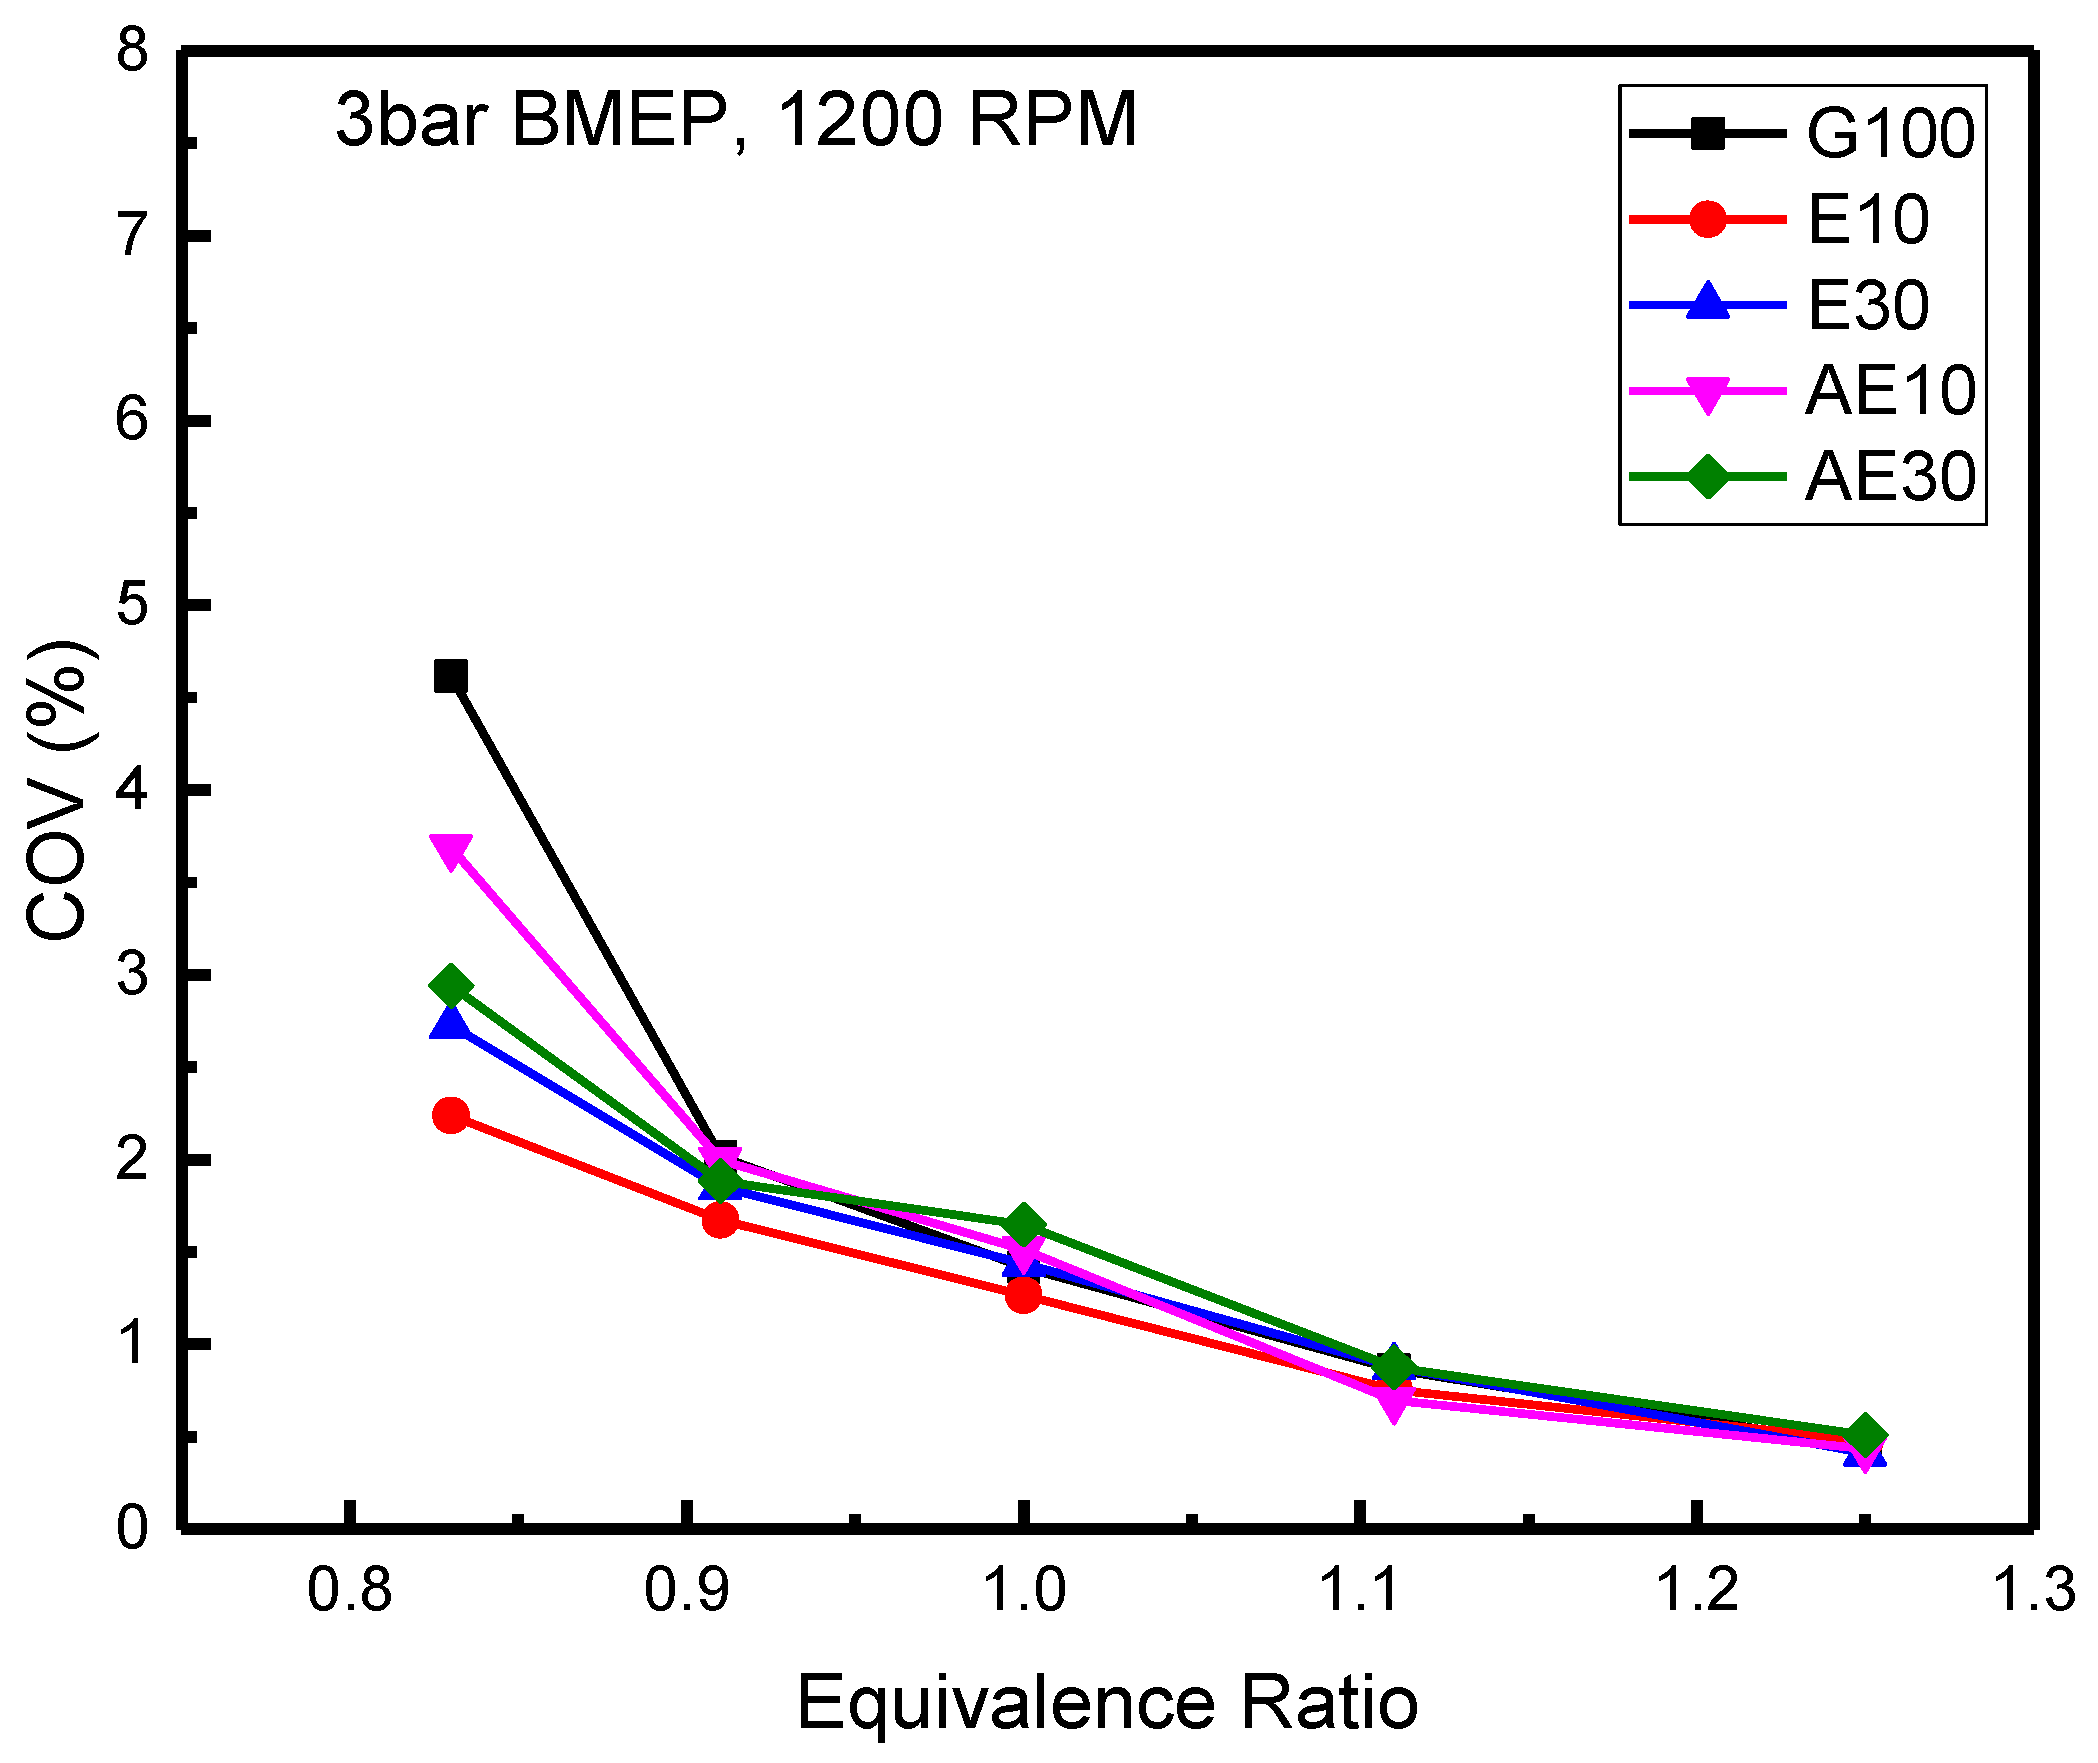
3.2.3. Coefficient of Variance (COV)

Using alternative fuels should not compromise combustion stability, as it is known to impact engine efficiency [46]. The COV of indicated mean effective pressure (IMEP) is used here for the comparison of combustion stability. With the recorded in-cylinder pressure traces of a series of consecutive combustion cycles, the COV can be calculated by the standard deviation of IMEP ( δ I M E P ):
C O V I M E P = δ I M E P / I M E P ¯ × 100
I M E P ¯ = i = 1 n I M E P i / n
δ I M E P = i = 1 n ( I M E P i I M E P ¯ ) 2 / n
In this experiment, data from more than 200 combustion events were acquired to calculate the COV. Figure 7 shows the COV of different fuels at different equivalence ratios. No significant variation between different fuels is seen in the results. It also can be observed that the COV value increases as the mixture becomes leaner; similar results were seen in Ref. [47]. Heywood [43] reported that drivability problems in vehicles normally arise when COV exceeds 10% in conventional combustion engines. The different fuels at the stoichiometric ratio show a rather small COV value (<2%) indicating stable combustion [46] and E10 has been shown to have a relatively small COV value with the similar results in an existing literature [14]. In addition, when the air fuel mixture is quite lean (around φ = 0.83), G100 has the highest COV value indicating that the ethanol and acetone addition may improve the combustion stability.

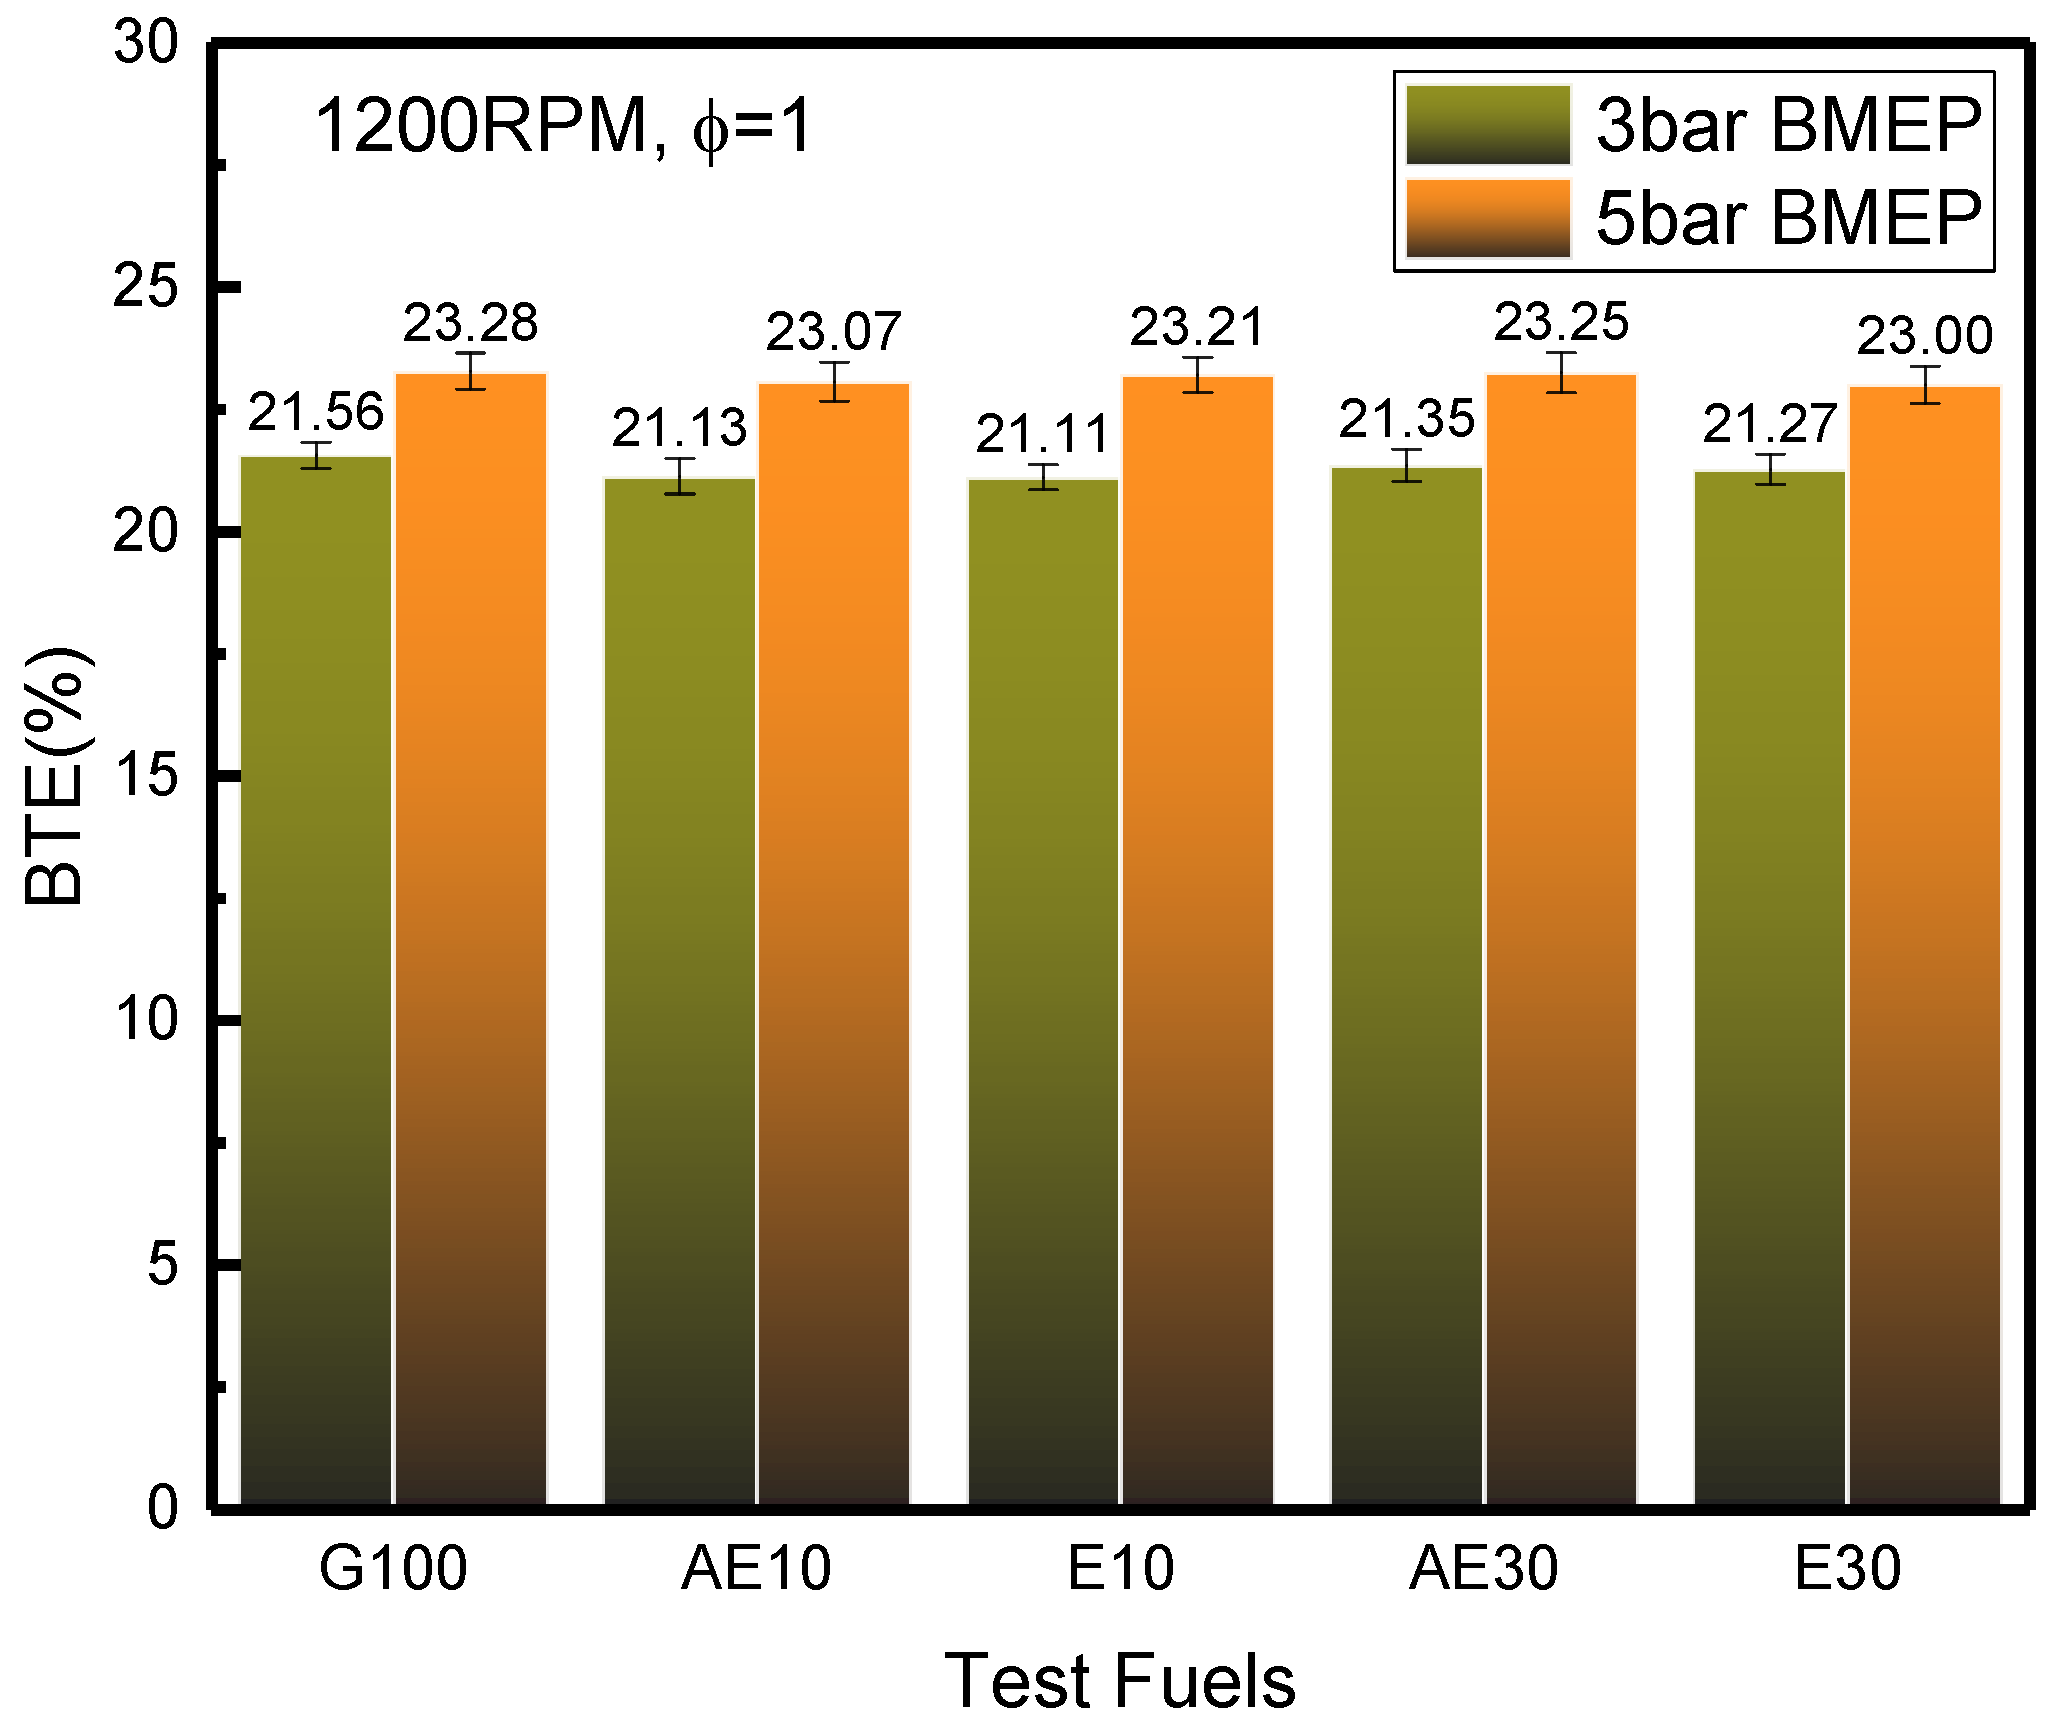
3.3. Engine Efficiency Analysis

3.3.1. Brake Thermal Efficiency

Brake thermal efficiency (BTE) indicates how well an engine can convert the chemical energy in the fuel to mechanical energy and represents the different fuels’ energy conversion efficiency. However, the fuel energy input changes with the fuel properties, mainly based on the lower heating value as calculated for the fuel blends in Table 4. Figure 8 shows the BTE of different fuels at stoichiometric conditions at 3 bar and 5 bar BMEP. It is clearly seen that the BTE is higher with higher engine load due to the relative reduction in heat loss, [48] engine friction and pumping losses [46]. At both loads, G100 has the highest BTE as the spark timing in the ECU MAP is based on the gasoline calibration. The other fuels have a relatively advanced combustion phasing and might result in a faster pressure rise rate during the compression process and lower the net useful work. To optimize the efficiency of the fuels with oxygenate additives, spark timing should be retarded to achieve maximum output power. As E10 and AE30 have a relatively similar phasing as shown in Figure 2 and Figure 5, the obvious increase of BTE by 0.17%–1.14% is due to the higher oxygen content in the AE30 which enhances the combustion process. However, the combustion phasing and oxygen content of the fuel have the contradicting effects on the BTE, so that the result of E10 and E30 shows a rather small change. On the other hand, the test engine is a single cylinder that has only a small change of output torque with different fuels. With adding acetone, AE10 and AE30 are observed a decreased BTE by 1.99% and 0.97% compared with G100 at 3 bar (0.9% and 0.13% at 5 bar), respectively. Meanwhile, the results show that the difference in BTE relative to that of G100 is relatively small while using the oxygenated fuels without optimizing the spark timing.

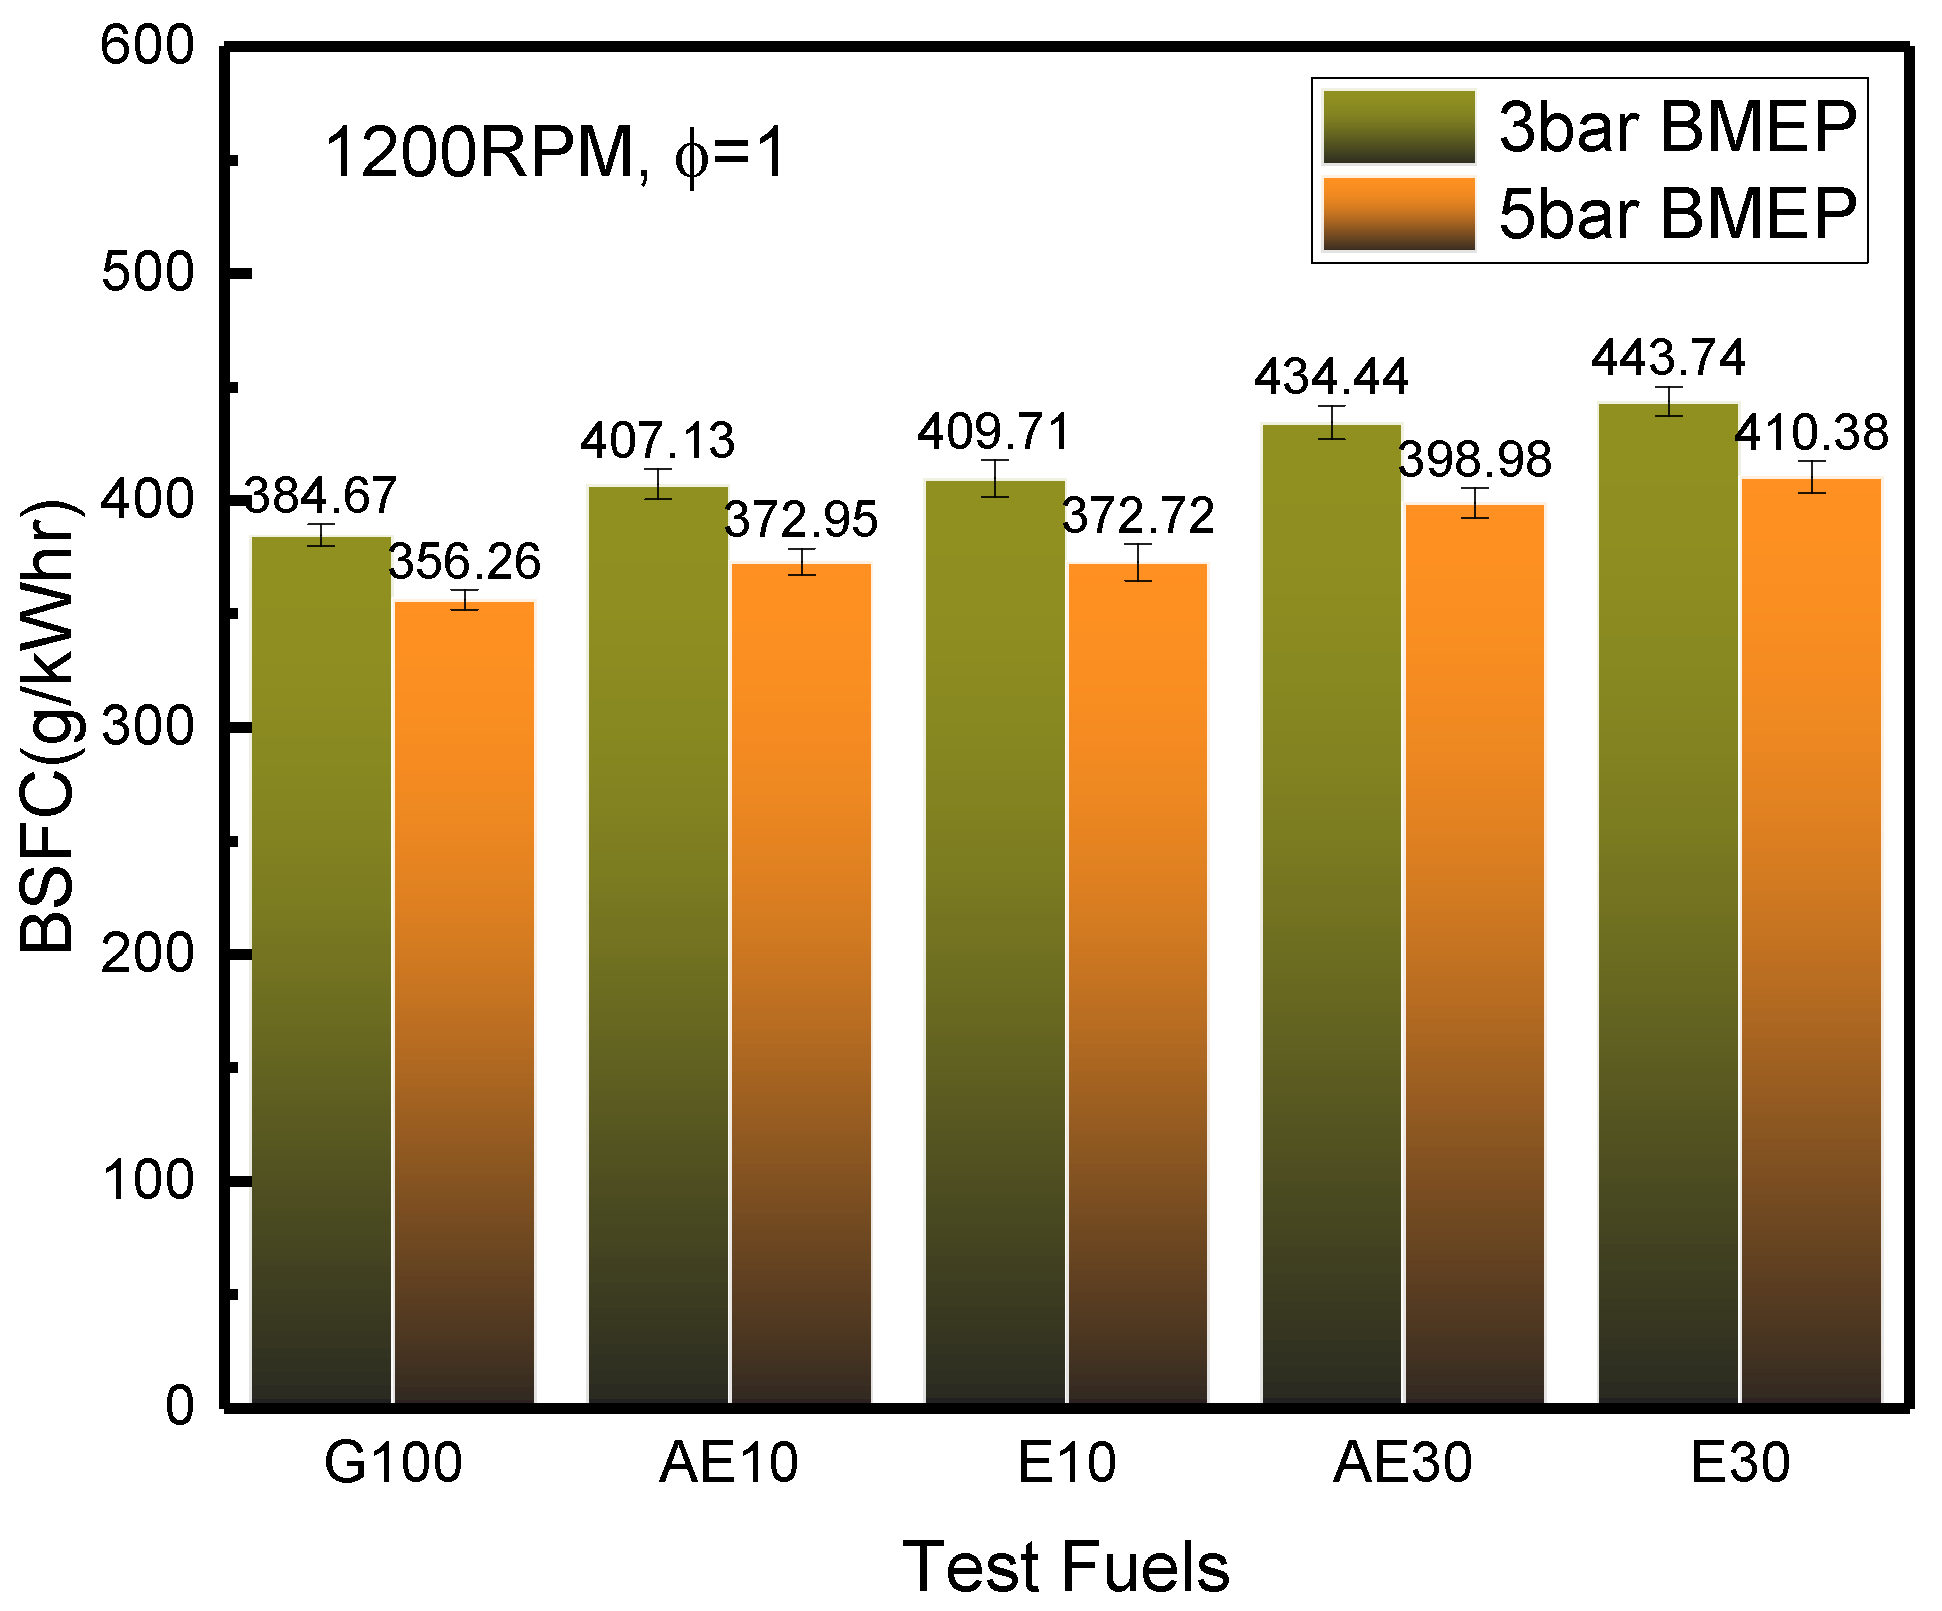
3.3.2. Brake Specific Fuel Consumption

Brake specific fuel consumption (BSFC) is the fuel mass consumed per unit power output, which indicates engine performance. As described in Figure 9, the BSFC rises as E% and AE% increases compared to pure gasoline. At 3 bar BMEP, E10, E30, AE10 and AE30 cause 6.51% and 15.35% and 5.97% and 15.16% increments in BSFC compared to G100, as well as 3.62% and 15.19% and 4.68% and 13.94% at 5 bar BMEP, respectively. Such an increase is due to the lower stoichiometric air/fuel ratio of the fuels blends as well as the differences in energy density as shown in Table 4. As the air mass intake is the same at a fixed engine speed and load, more fuel mass is needed for lower stoichiometric air-fuel ratio fuel blends. In addition, with increasing load, the BSFC decreases due to the BTE increase leading to a more economic operation and the higher percentage increase in brake power compared to the increase in fuel consumption [48]. The BSFC of ethanol fuel blends is found to be higher than that of the acetone-ethanol fuel blends at the same blend ratio mainly because acetone has a relatively higher lower heating value (LHV) and energy density than ethanol. The non-MBT timing also has an effect on the BSFC value of different fuel blends as the efficiency is not maximized. In summary, the differences in BSFC result from a combination of lower energy density as well as variations in the fuel conversion efficiency due to the combustion phasing differences shown earlier [30]. Finally, using acetone to replace some parts of the ethanol as an oxygenated additive in the commercial gasoline might reduce the BSFC.

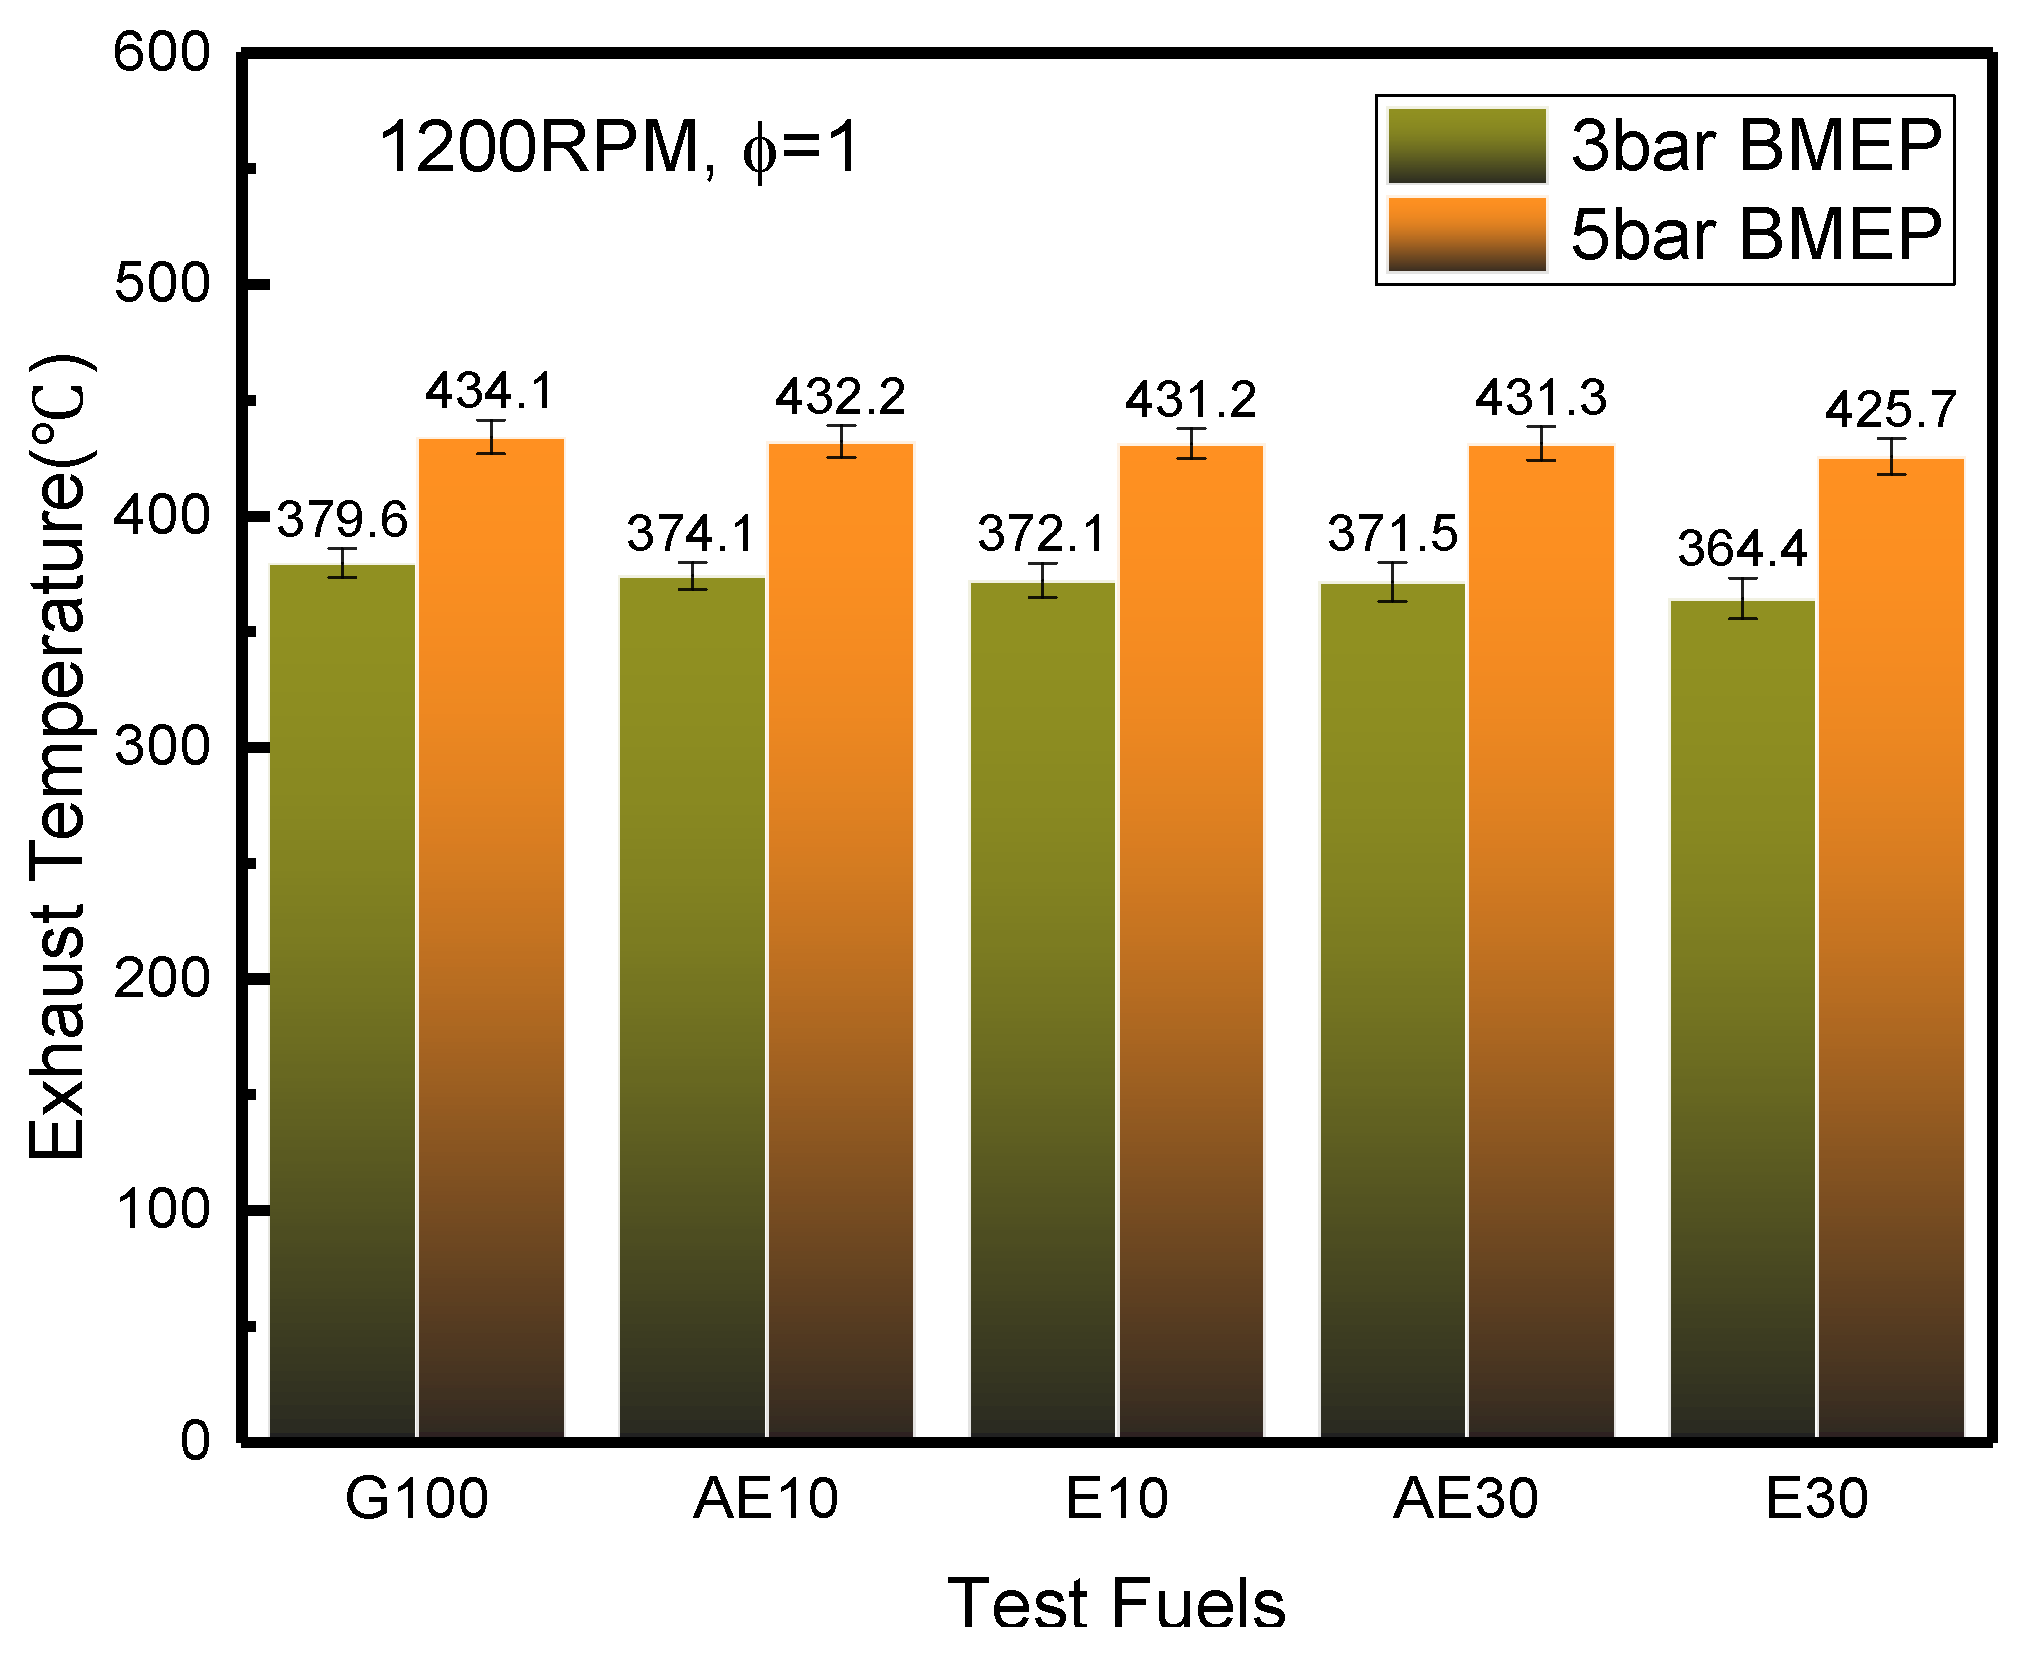
3.4. Engine Emission Analysis

In this section, the regulated gaseous SI engine emissions including CO, HC and NOx are analyzed at both 3 bar and 5 bar loads at different equivalence ratios. The exhaust gas was sampled near the exhaust manifold as raw emissions without the use of a catalytic converter.

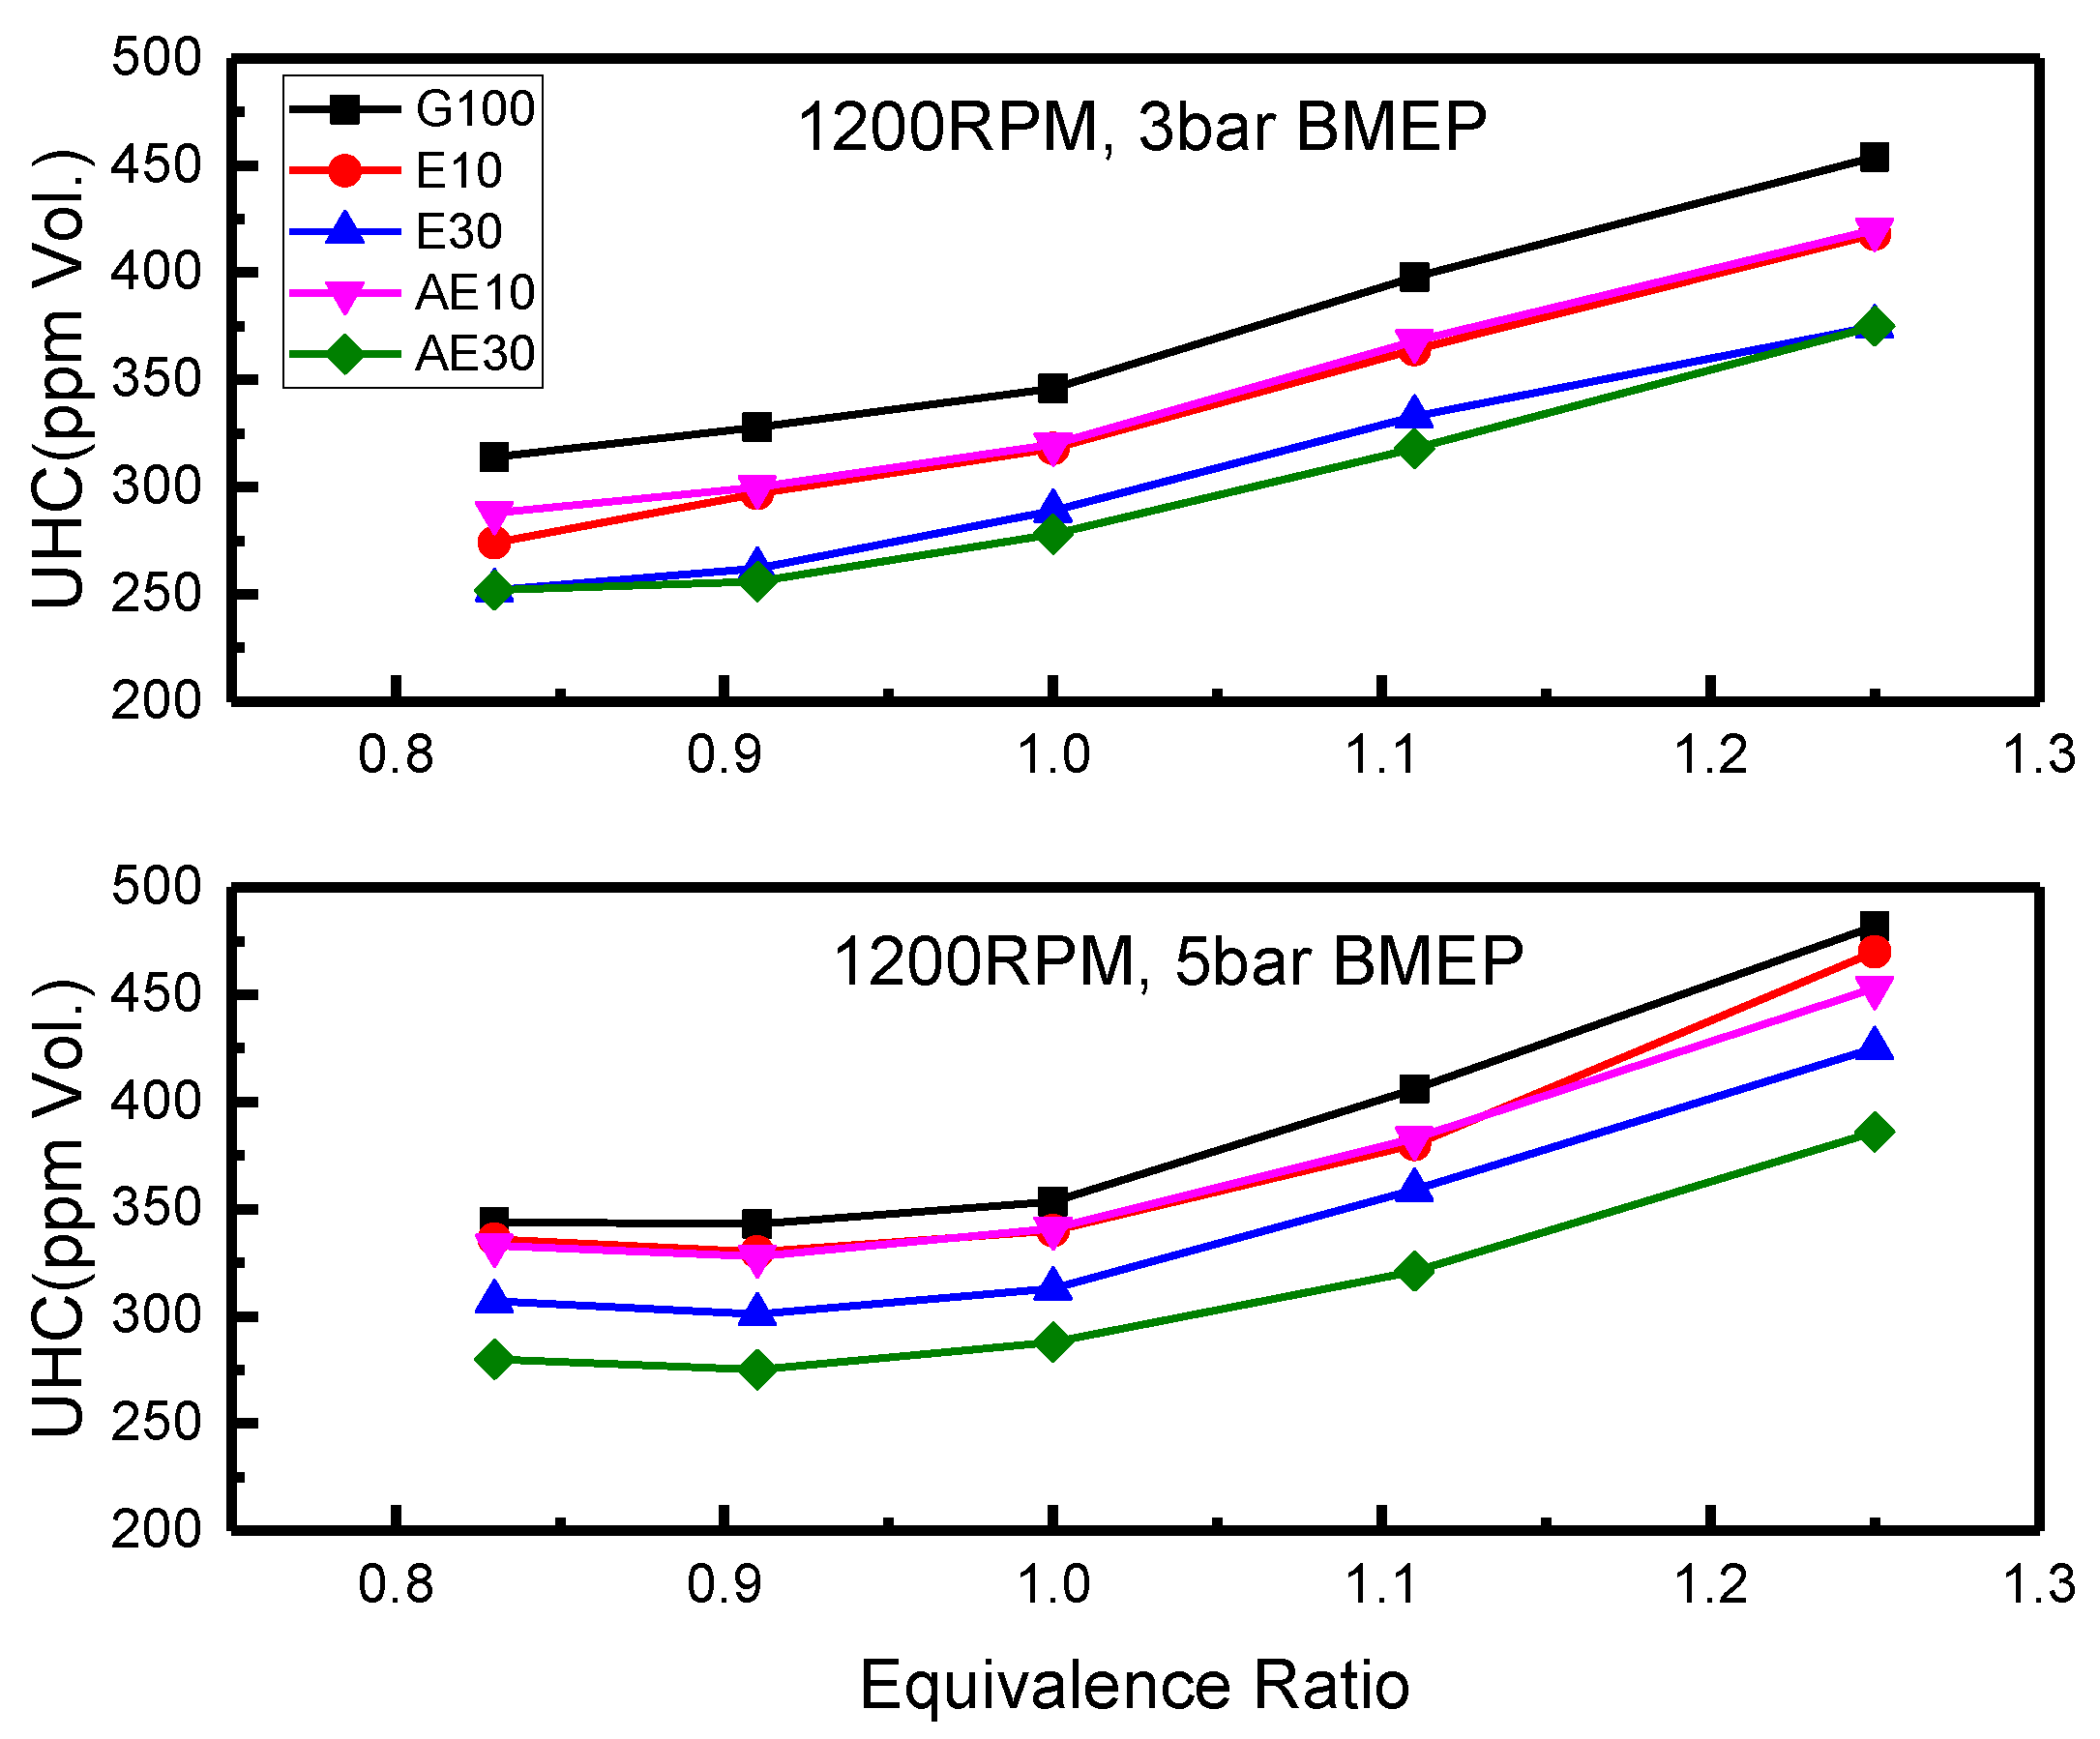
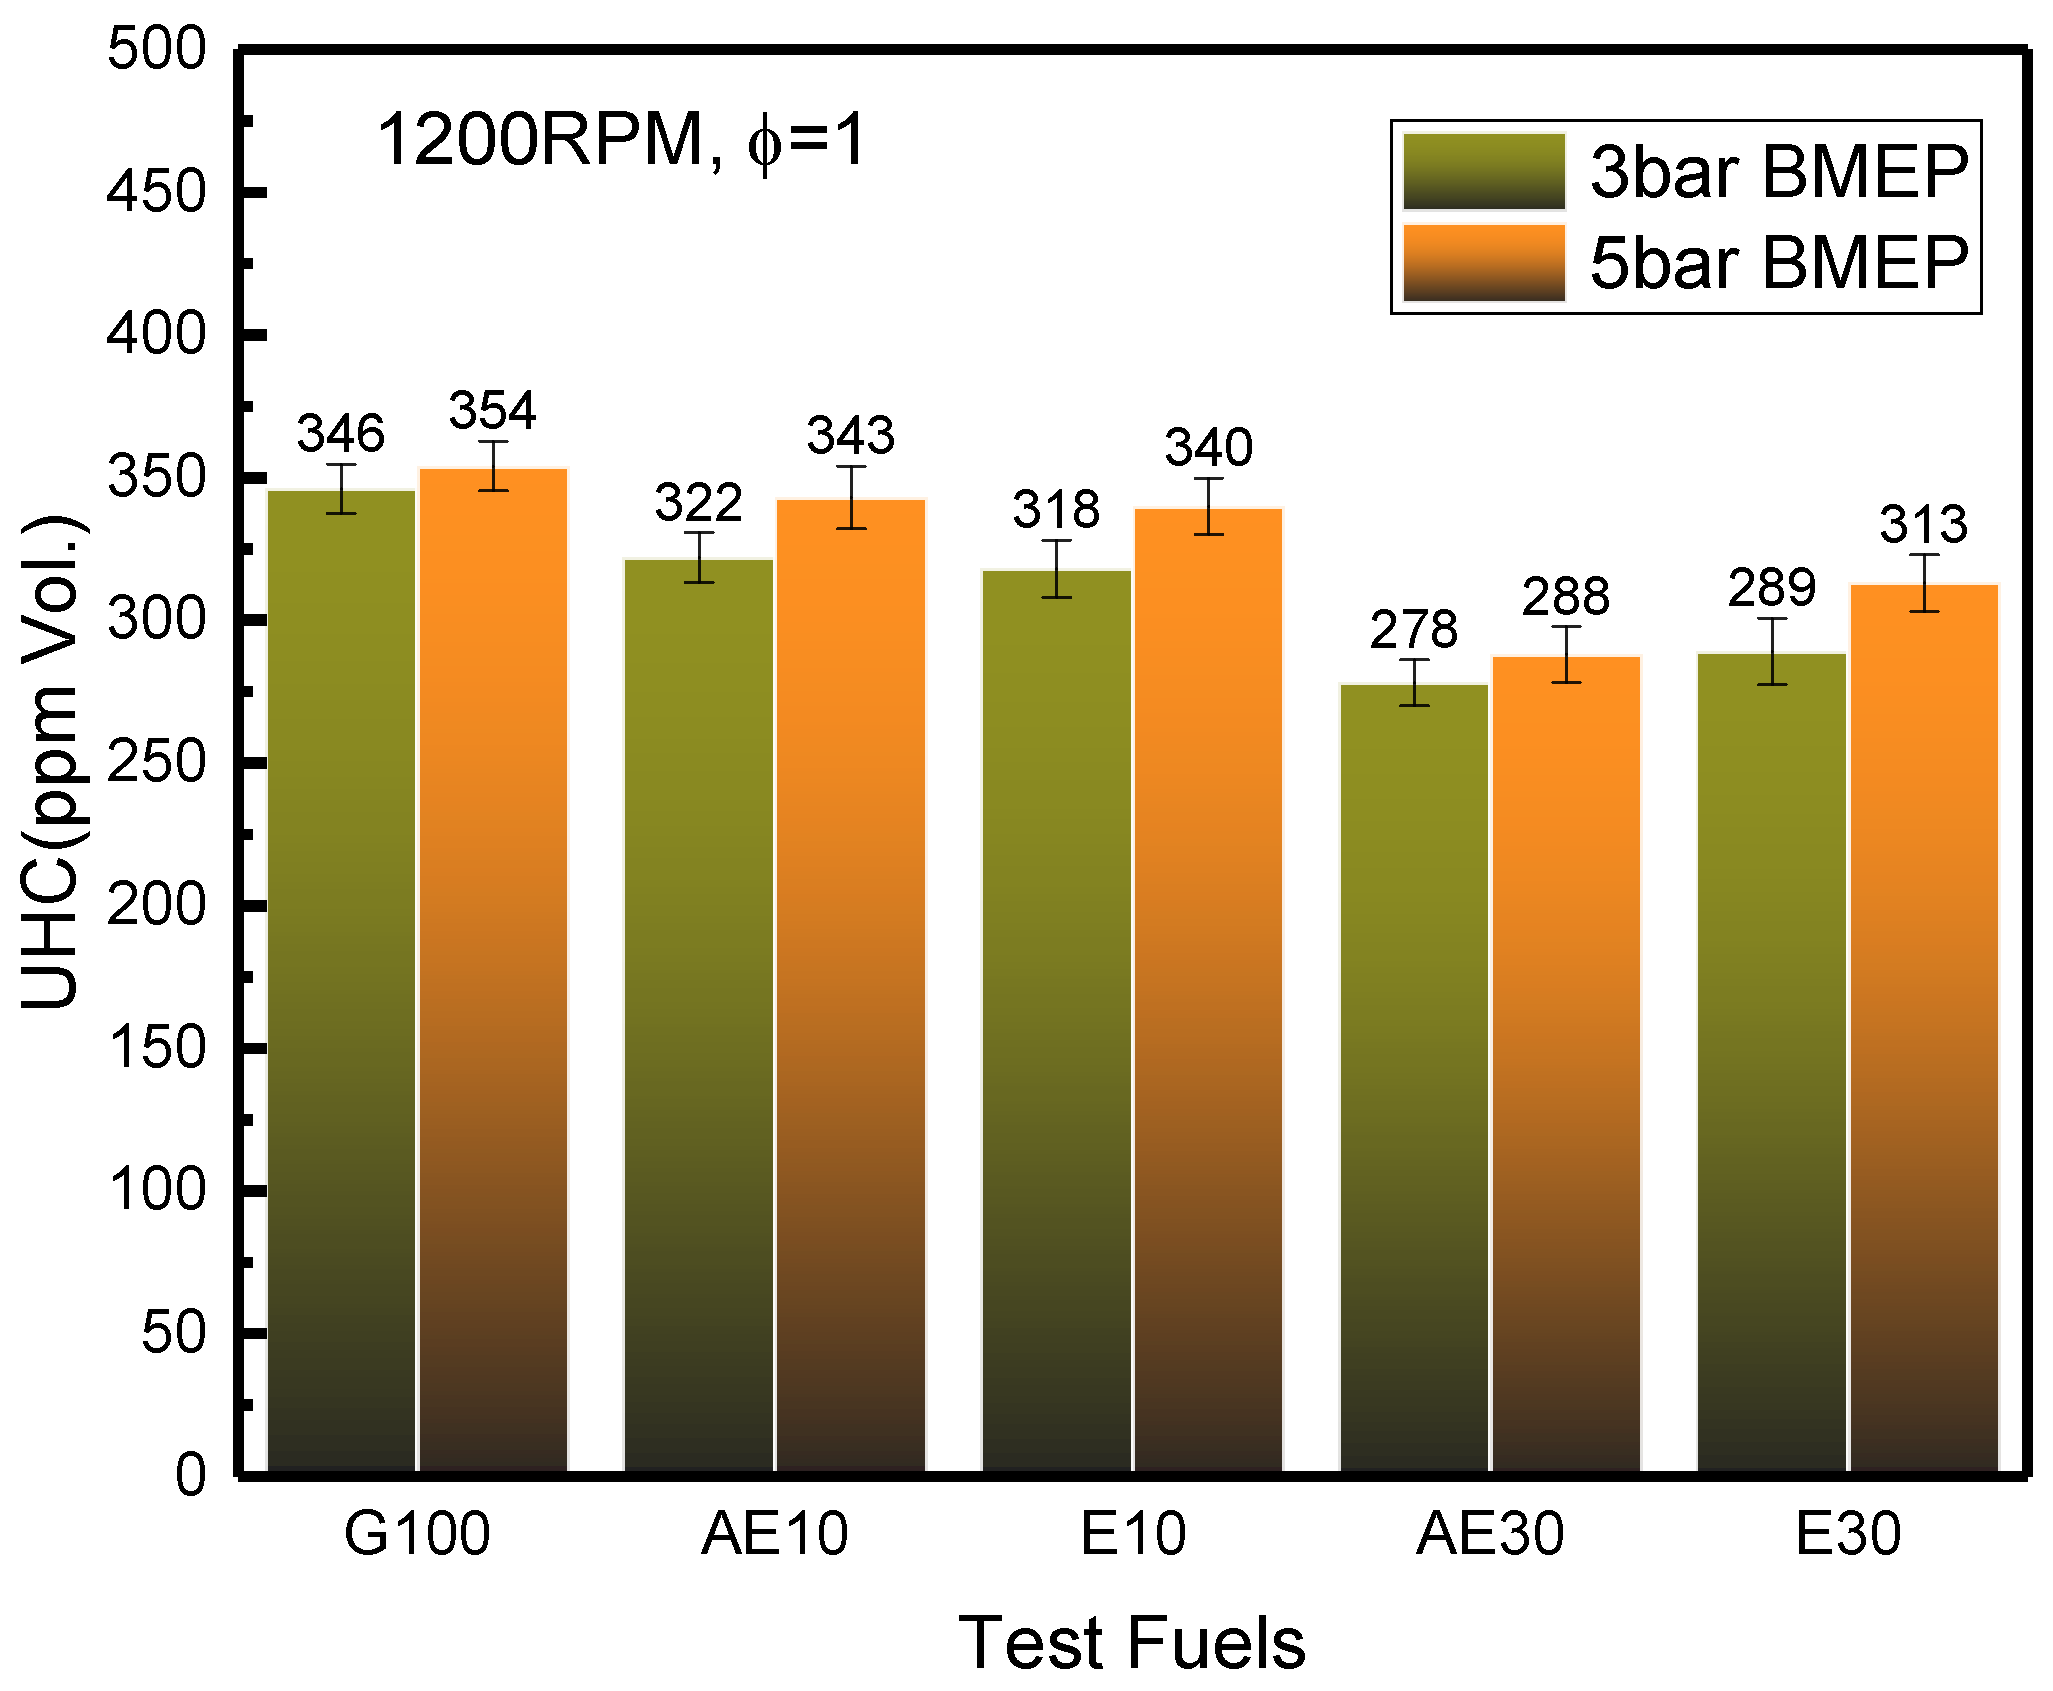
3.4.1. Unburned Hydrocarbon (UHC)

The UHC emissions are the consequence of incomplete combustion of the hydrocarbon fuel and can provide an insight into combustion completion. As described in the reference, [49] there is an estimation of the relative importance of the various sources contributing to engine-out HC emissions at part load in a warmed-up engine: mixture in the crevices about 38%, oil layers and deposits about 16% each, flame quenching about 5%, and in-cylinder liquid fuel effects about 20%, exhaust valve leakage less than 7%. So, the engine-out HC emissions are primarily a result of engine configuration, fuel structure, oxygen availability, and residence time [4]. Figure 10 shows the UHC emission under stoichiometric conditions at different loads.
There is a slight increase in HC emission at higher engine loads likely due to higher fuel injection resulting in more unburned fuel in the crevice and oil layers [50]. At the stoichiometric ratio, the HC emission is lower with the increase of additive blends as AE30 and E30 show a 19.7% and 16.47% at 3 bar (18.6% and 11.6% at 5 bar) decrease relative to G100, respectively (Figure 10). This behavior can be justified by the fuel-borne oxygen that could improve combustion quality and thus reduce unburned fuel. There is a negligible difference in HC emissions between AE10 and E10 as the fuel composition variation is rather small. However, AE30 shows a 3.8%–8% decrease relative to E30 at stoichiometric ratio. It can also be observed in Figure 11, which presents the UHC of blended fuels at various equivalence ratio, that AE30 has the lowest HC emissions at all the test points. This might be explained by the relatively higher BTE and better volatility of acetone leading to an improvement of the fuel pre-mixing, better combustion and post-flame oxidation. In addition, with richer air-fuel mixtures, the UHC emissions rise sharply for all the test fuels due to the lack of oxygen causing incomplete combustion [3]. From the analysis above, the acetone additive in the ethanol–gasoline has a more effective role in the HC decrease. Comparing this conclusion with the previous work, although Nithyanandan [25] reported a higher HC with ABE (6:3:1) at higher loads, ABE30 (3:6:1) still shows a relative HC reduction than that of gasoline; apart from that, the butanol effect in the fuel cannot be neglected.

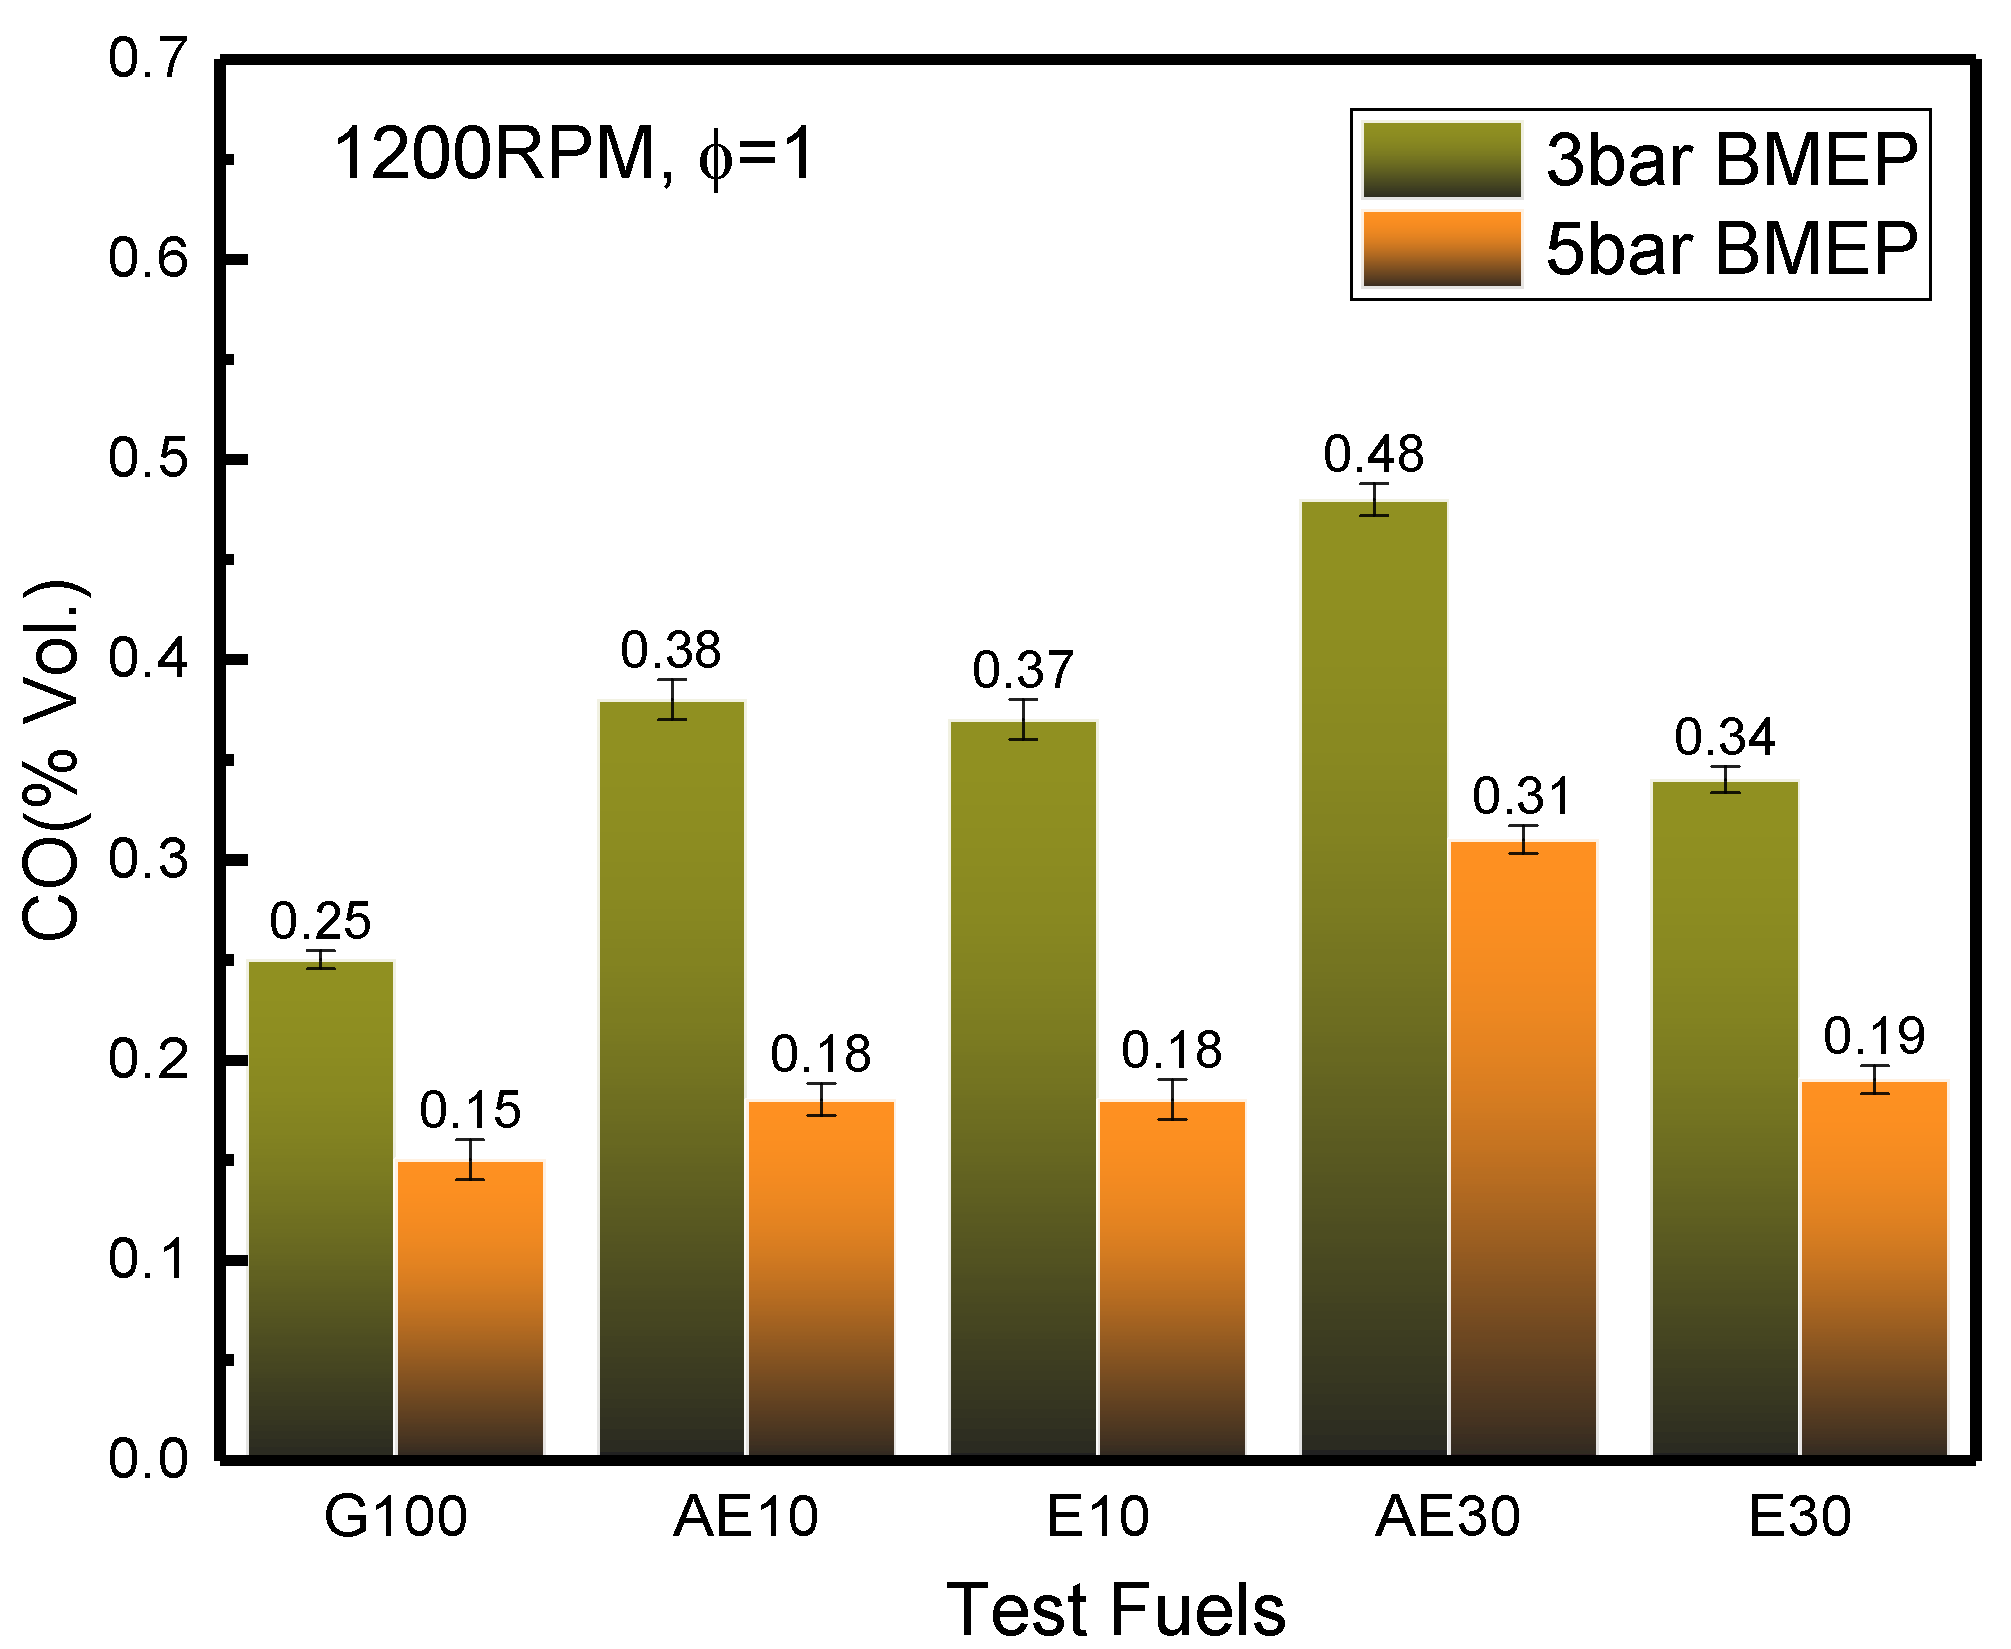
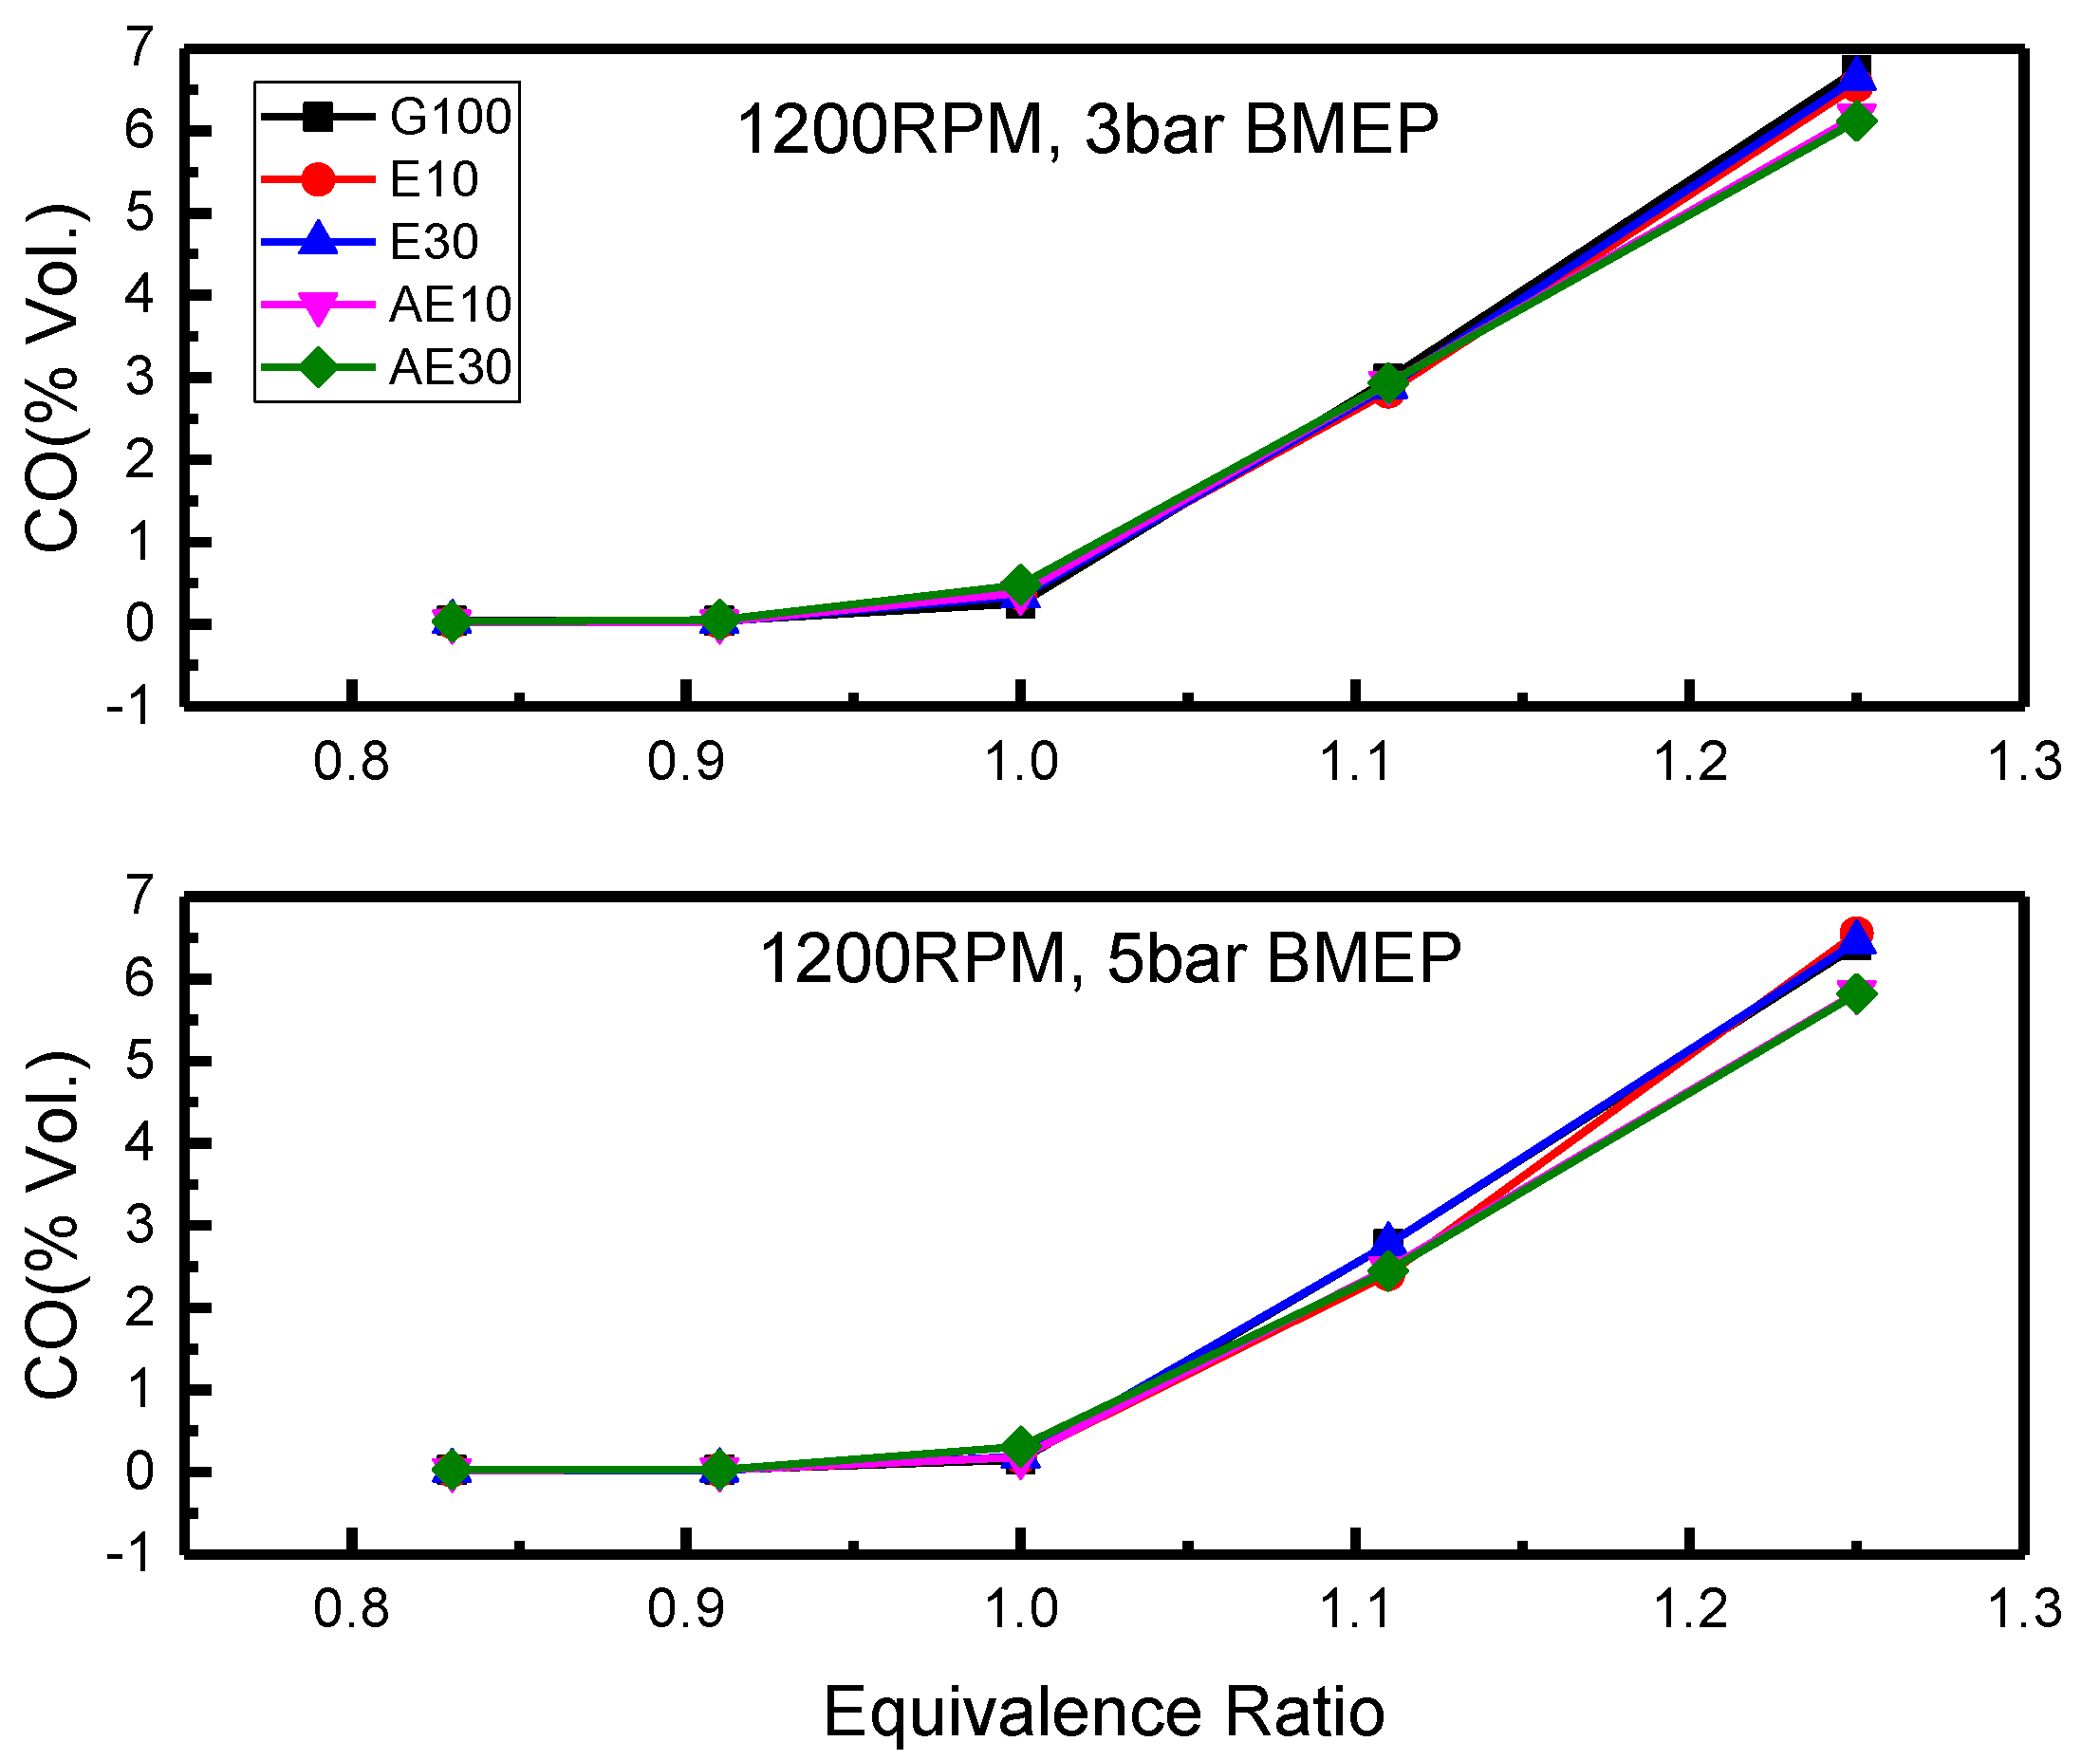
3.4.2. Carbon Monoxide (CO)

Carbon monoxide (CO) from the internal combustion engines is a product of incomplete combustion due to insufficient amount of air in the air-fuel mixture or insufficient time in the cycle [51], and is mainly controlled by the air-fuel ratio in the cylinder. Production of carbon monoxide primarily occurs in fuel-rich combustion when there is a lack of O2 to fully form CO2. Figure 12 presents the CO emissions under stoichiometric conditions both at 3 bar and 5 bar BMEP. For all the fuels, CO emissions decrease at higher load due to a better combustion achieved by more oxygen in the mixture and higher BTE, as well as in the higher cylinder temperature, which could improve the CO oxidation efficiency. Similar results on the impact of load can be found in Ref. [10,46,52] using different fuel blends. G100 has the lowest CO emission both at 3 bar and 5 bar and higher CO emissions were observed with addition of ethanol and acetone which seems different from the results in existing literatures [8,16,47] about oxygenate fuels. It might be explained with the trends in Figure 10, the oxygenated fuel blends have a relatively lower BTE at the gasoline MBT causing the CO emission to be increased. In addition, the oxygen content in the fuel reduces the gross heating value of the fuel, which lowers the combustion temperature and further retards the oxidation reaction of the carbon monoxide [53]. AE10, E10 and E30 have negligible differences and AE30 has the highest CO emissions, which could be coupled with the lowest HC emission of AE30. This could be explained by unburned gases returning to the cylinder from the crevice, which might partially react during the expansion and exhaust stroke during post-flame oxidation [50]. However, the slight CO exhaust differences among the fuels should not cause any problems with the use of three-way catalytic converters. The CO emission of different fuel blends under different equivalence ratios is shown in Figure 13. Mixtures richer than stoichiometric produce high levels of CO and are extremely sensitive to small changes in equivalence ratio. However, mixtures at stoichiometric and leaner conditions produce little CO emissions and are relatively insensitive to equivalence ratio changes. No major differences can be observed among different fuel blends. Meanwhile, adding acetone to the fuel blends seems to make it less sensitive to the equivalence ratio at richer conditions; this might have be advantageous under fuel-rich operation such as full load and transient accelerating.

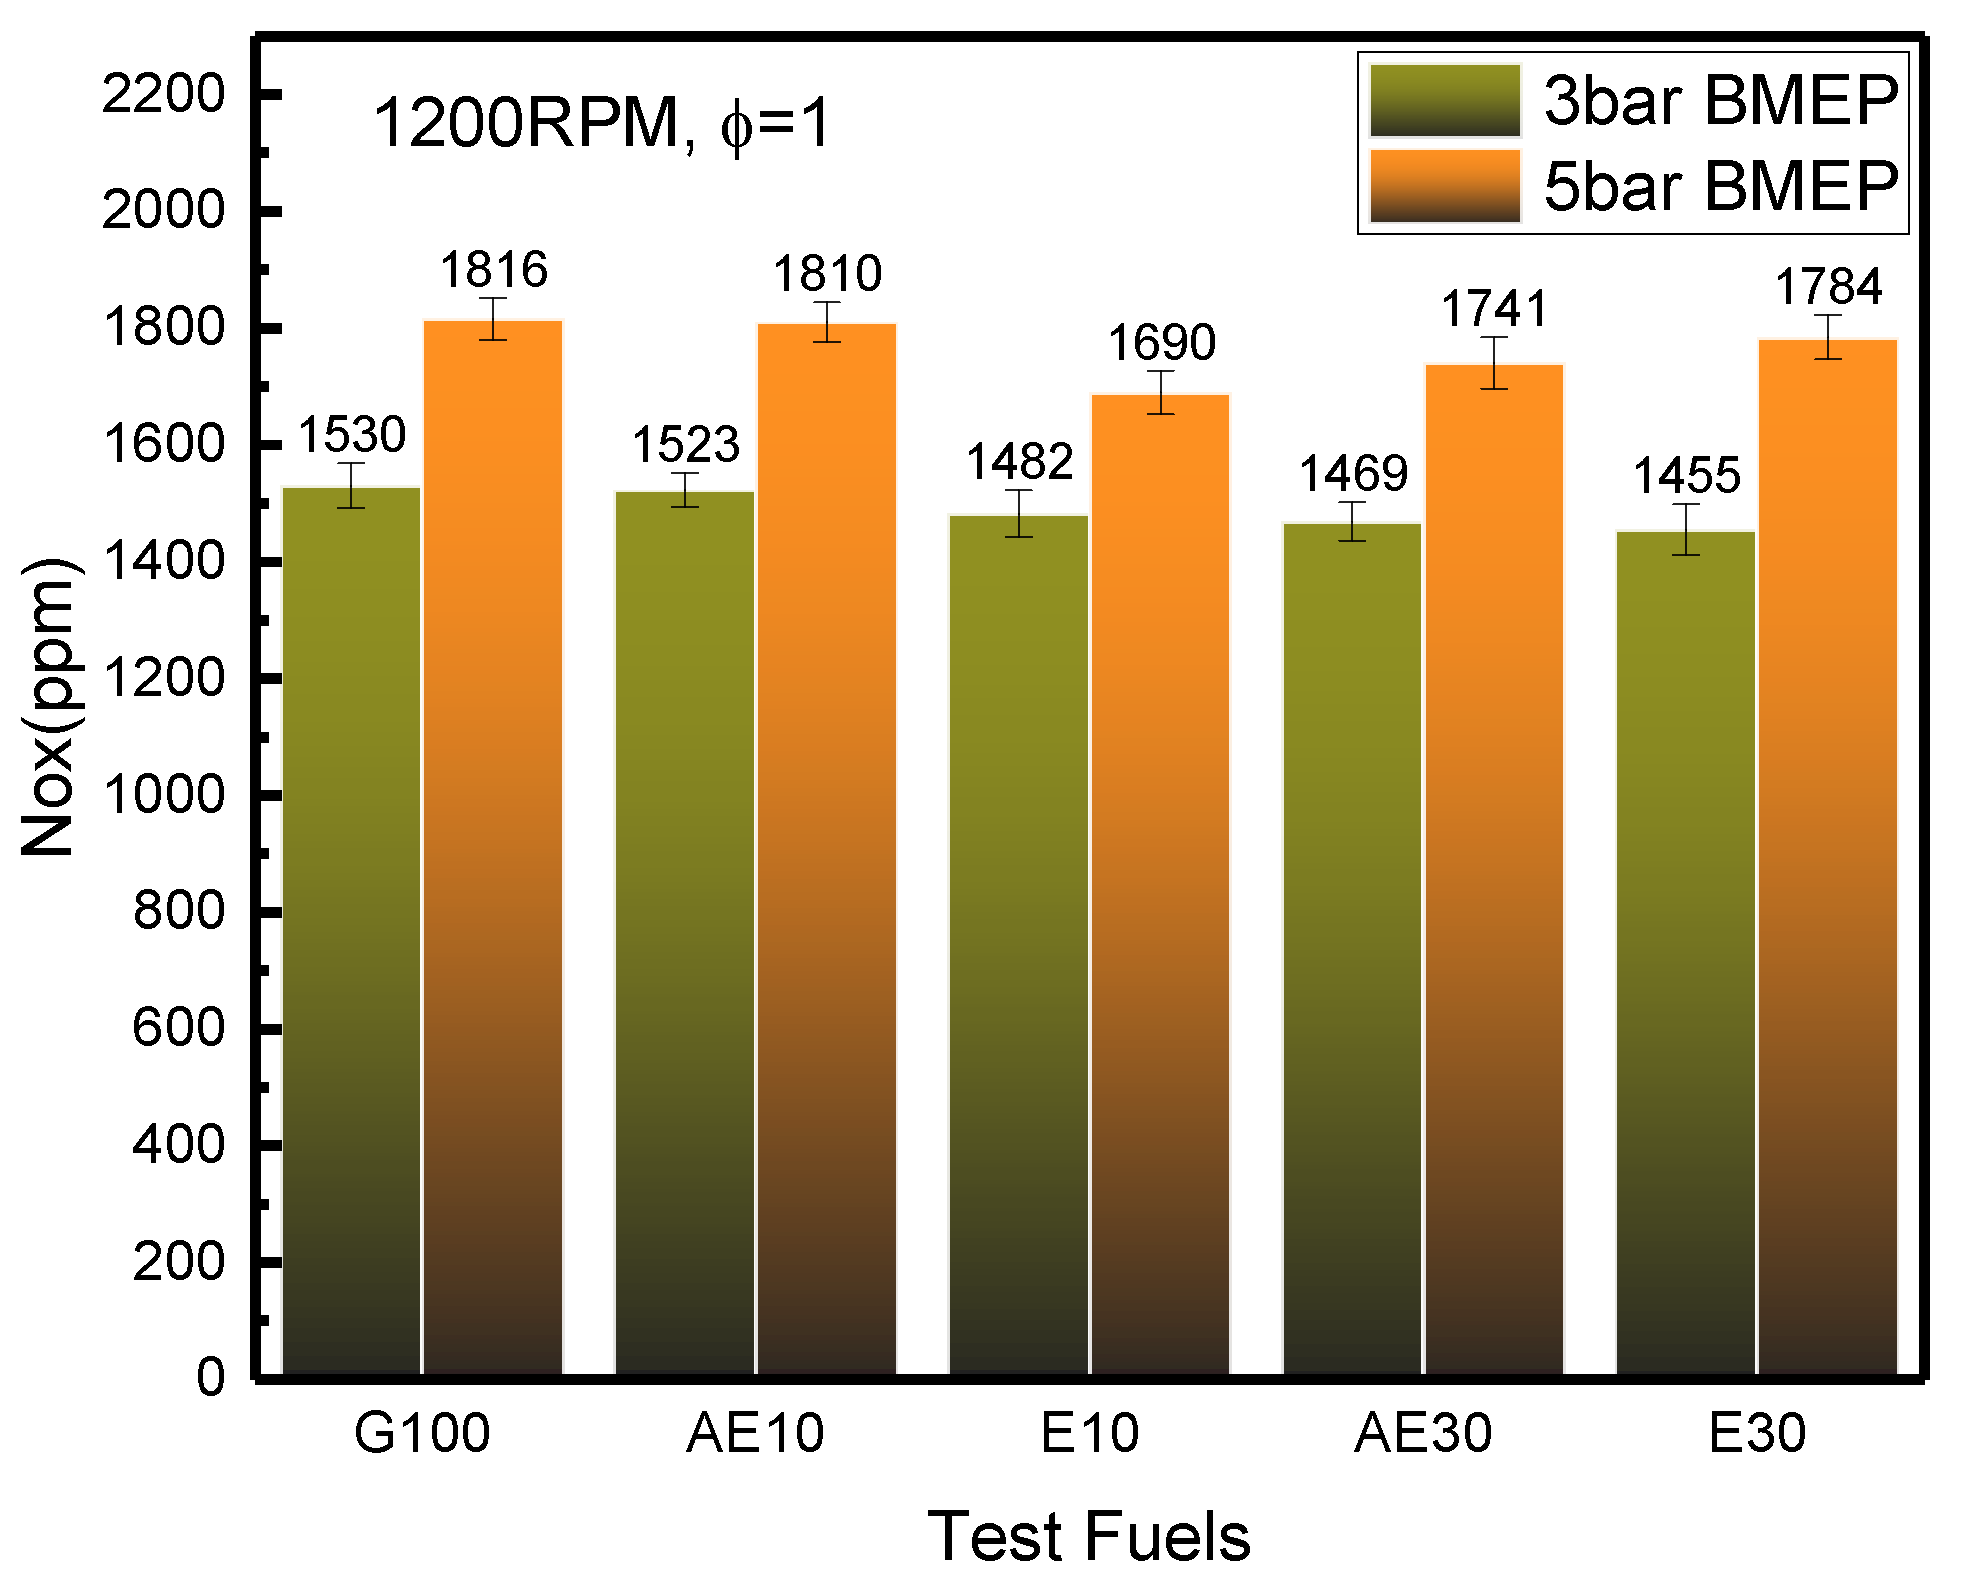
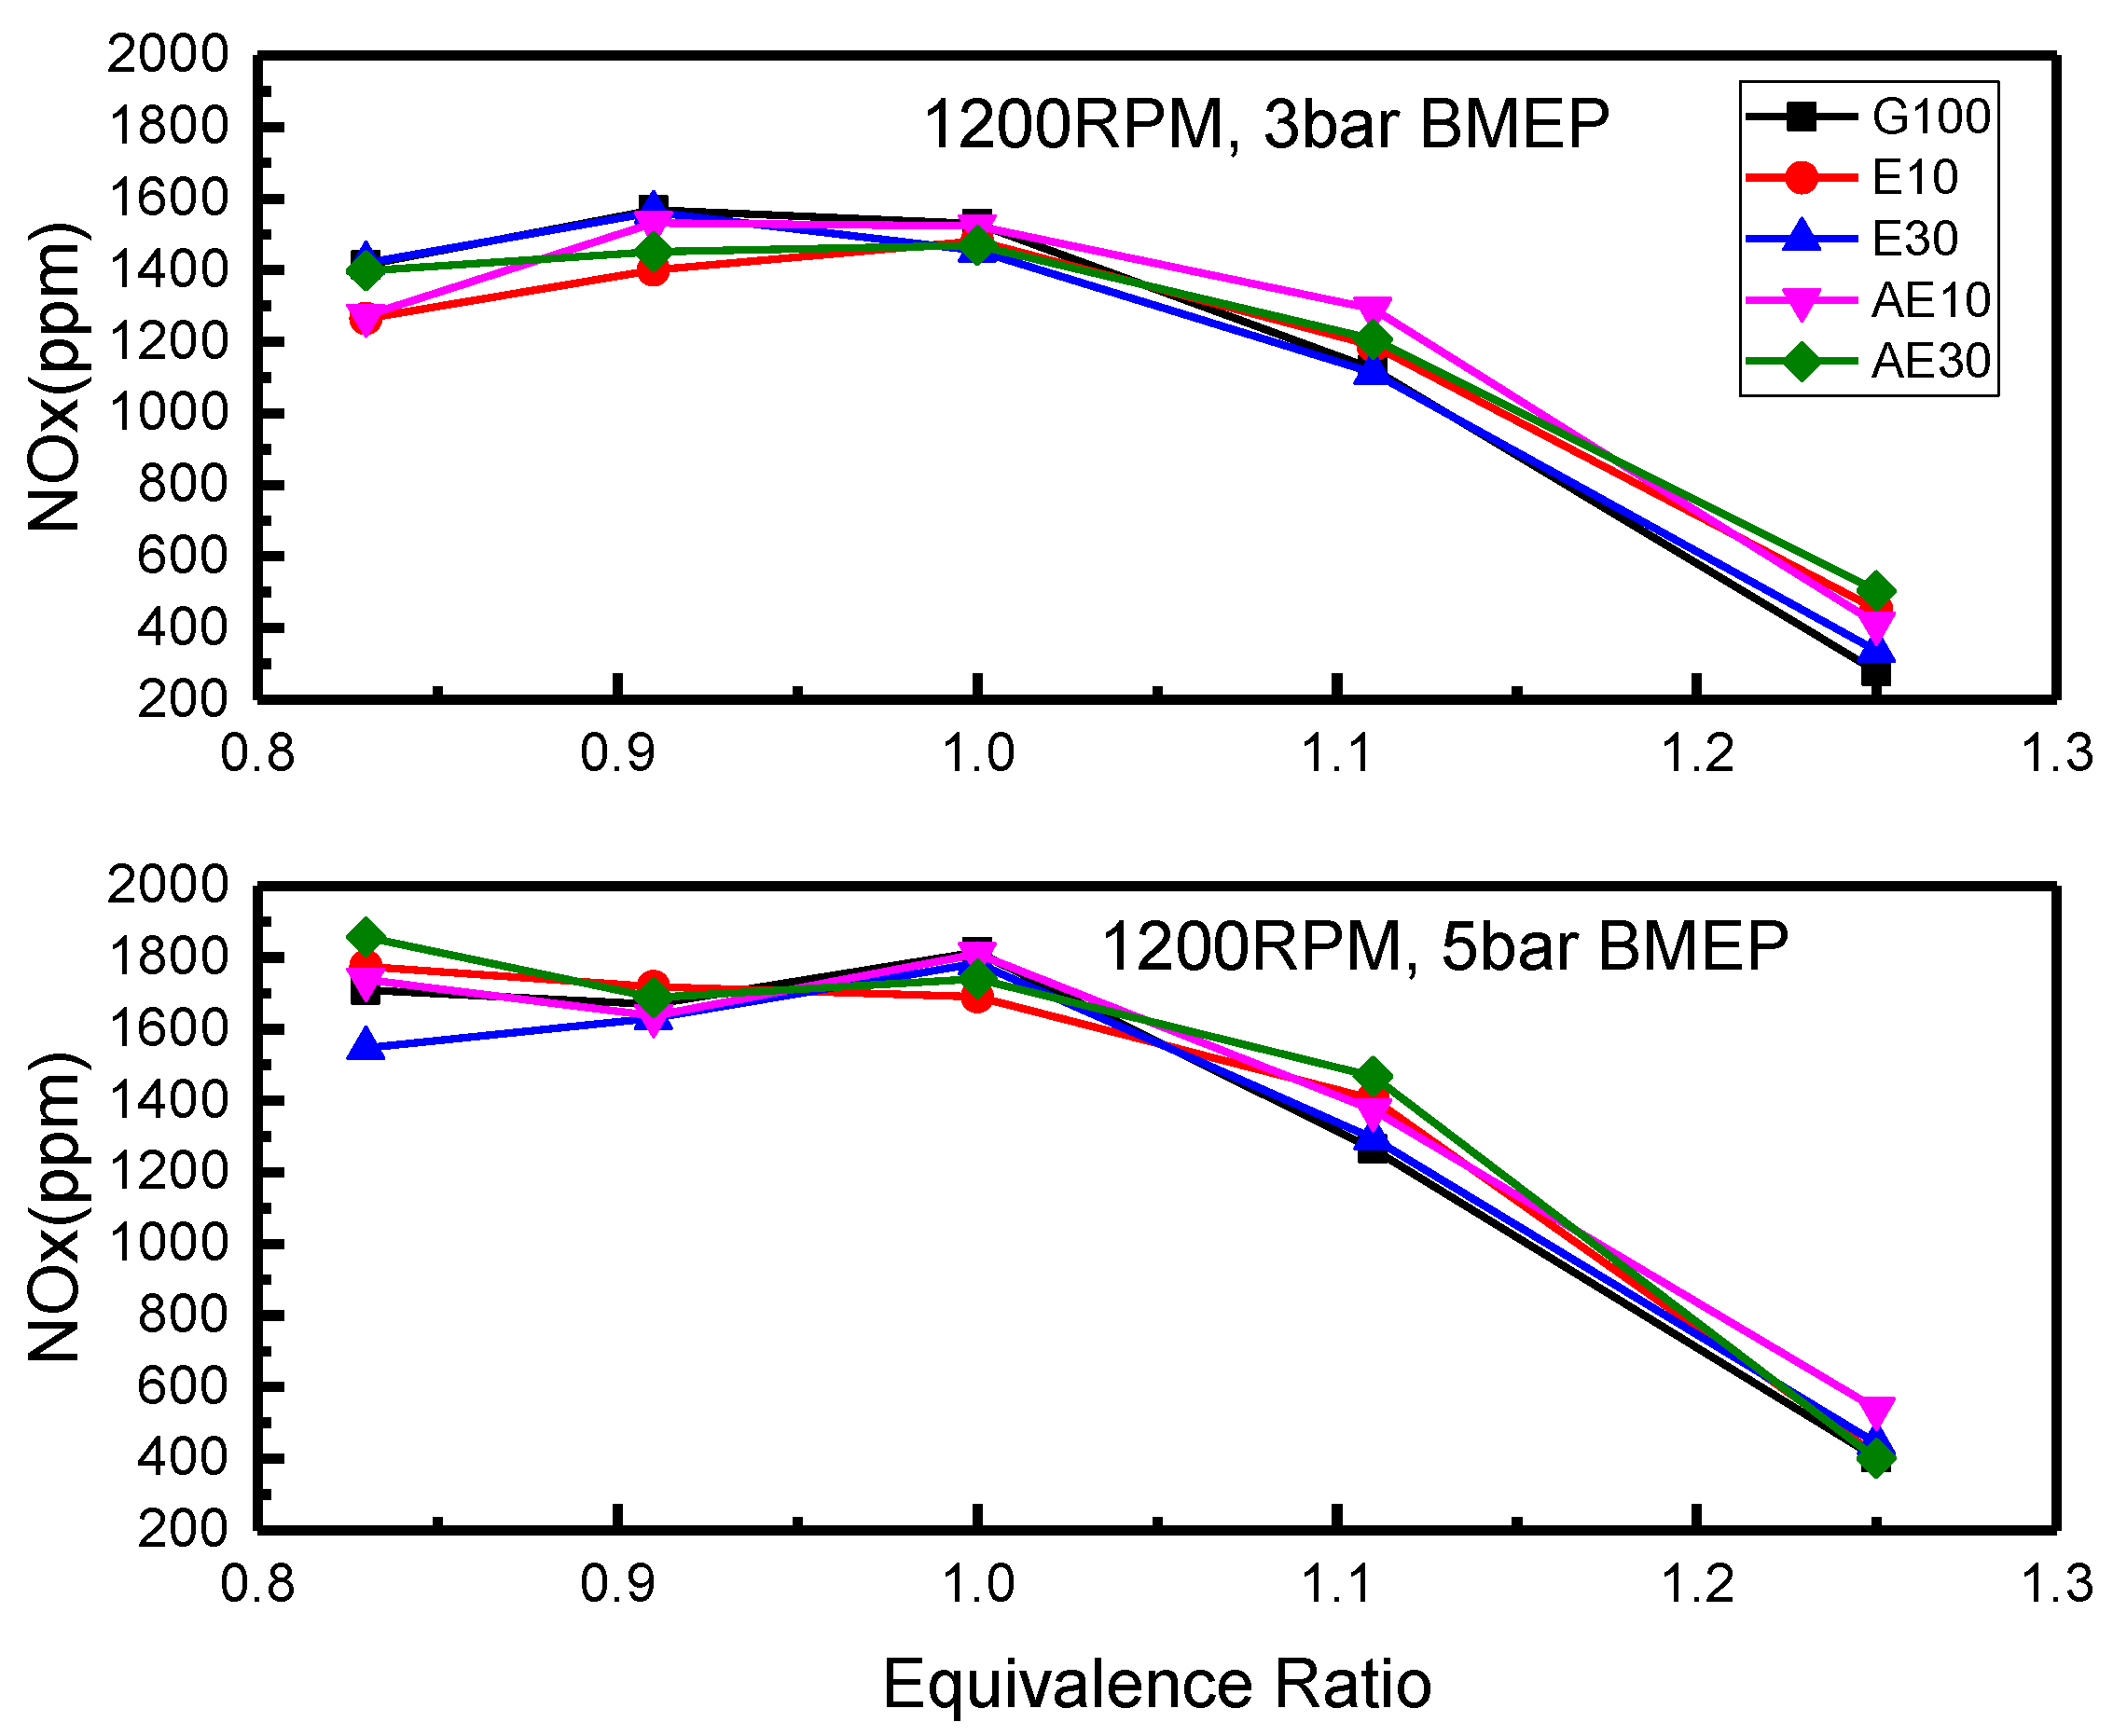
3.4.3. Nitrogen Oxide (NOx)

Nitrogen Oxide (NOx) is a mixture of compounds such as: nitric oxide (NO), nitrogen dioxide (NO2), nitrous oxide (N2O), dinitrogen trioxide (N2O3), dinitrogen tetroxide (N2O4), and dinitrogen pentoxide (N2O5) [54]. High temperature and high oxygen concentrations result in high NOx formation rates [43]. Figure 14 shows the NOx emissions for different fuel blends tested under stoichiometric conditions. At higher load, NOx emission is much higher than that at lower load because more fuel consumption results in a higher in-cylinder temperature. While combustion temperature measurements were not taken directly, the effect is supported by the exhaust manifold temperature data, which change proportionally with the maximum cylinder temperature as shown in Figure 15 (as all other conditions are held constant). All the fuel blends produce a lower exhaust temperature compared with G100, which can be explained based on the parameters in Table 3: the lower LHV and higher latent heat of vaporization of oxygenated fuels both have the effect of reducing the in-cylinder peak temperature. However, the heat capacity of the combustion products also has a relationship with the exhaust gas temperature. Based on the stoichiometric chemical reactions of gasoline, ethanol and acetone with same air mass presented in Ref. [39], ethanol produces more triatomic combustion molecules than acetone and gasoline, thus increasing the heat capacity resulting in lower in-cylinder temperature. On the other hand, higher LHV and lower latent heat of acetone also result a higher in-cylinder temperature than that of ethanol. As a consequence, it can be observed that E30 has the lowest exhaust temperature in Figure 15. The NOx emission at 3 bar has the same trends with the exhaust gas temperature, however the result at 5 bar seems to have a different trends with temperature. E30 has the lowest exhaust temperature, however, a relatively higher NOx emission at higher load based on more fuel-borne oxygen may contribute to NOx formation. So the engine-out NOx emission is dependent on both the temperature and the oxygen concentration.
NOx emissions of all the test fuel blends, measured at various equivalence ratios are presented in Figure 16. It is seen that the NOx emissions have increasing trends for all fuels at both loads when the equivalence ratio approaches 1. This is due to a higher flame temperature under stoichiometric conditions, where the NOx emission is increased particularly by the increase of thermal NO [10]. The relationship of laminar flame adiabatic temperature and equivalence ratio can be found in Ref. [55], and the maximum temperature is found at slightly rich conditions. Under fuel-lean conditions, there is enough available oxygen and the NOx decrease is primarily influenced by the laminar flame adiabatic temperature decrease. When the air fuel mixture becomes richer, the NOx formation becomes lower due to the lack of oxygen and is mainly affected by the oxygen concentration [39], so, G100 shows a relatively lower NOx compared to the oxygenate additive fuels because no oxygen content exists in the gasoline molecules. However, there is no clear correlation between the fuel type and the NOx emission reduction ability as shown in Figure 16. Engine operating condition has more influence on NOx emissions rather than different fuels in SI engines similar with the conclusions made by Hsieh [10]. Meanwhile, there are still some inconsistencies in NOx emission results observed by other researchers [54].

4. Conclusions

A single cylinder research PFI engine was used to experimentally evaluate the combustion, performance and emission behavior when using acetone as an oxygenate additive in ethanol-containing gasoline. Four splash-blended fuels (E10, E30, AE10 and AE30) were compared to ethanol-free gasoline (G100), used as a baseline. The tests were conducted at 1200 RPM, gasoline MBT, at both 3 bar and 5 bar BMEP, and the in-cylinder pressure trace, performance and emission data were measured under varying equivalence ratios. A detailed analysis of fuel property differences such as density, lower heating value, laminar flame speed, latent heat of vaporization, and oxygen content were expected to influence the engine combustion, efficiency and emissions behavior.
The conclusions from the experiment can be drawn as follows:
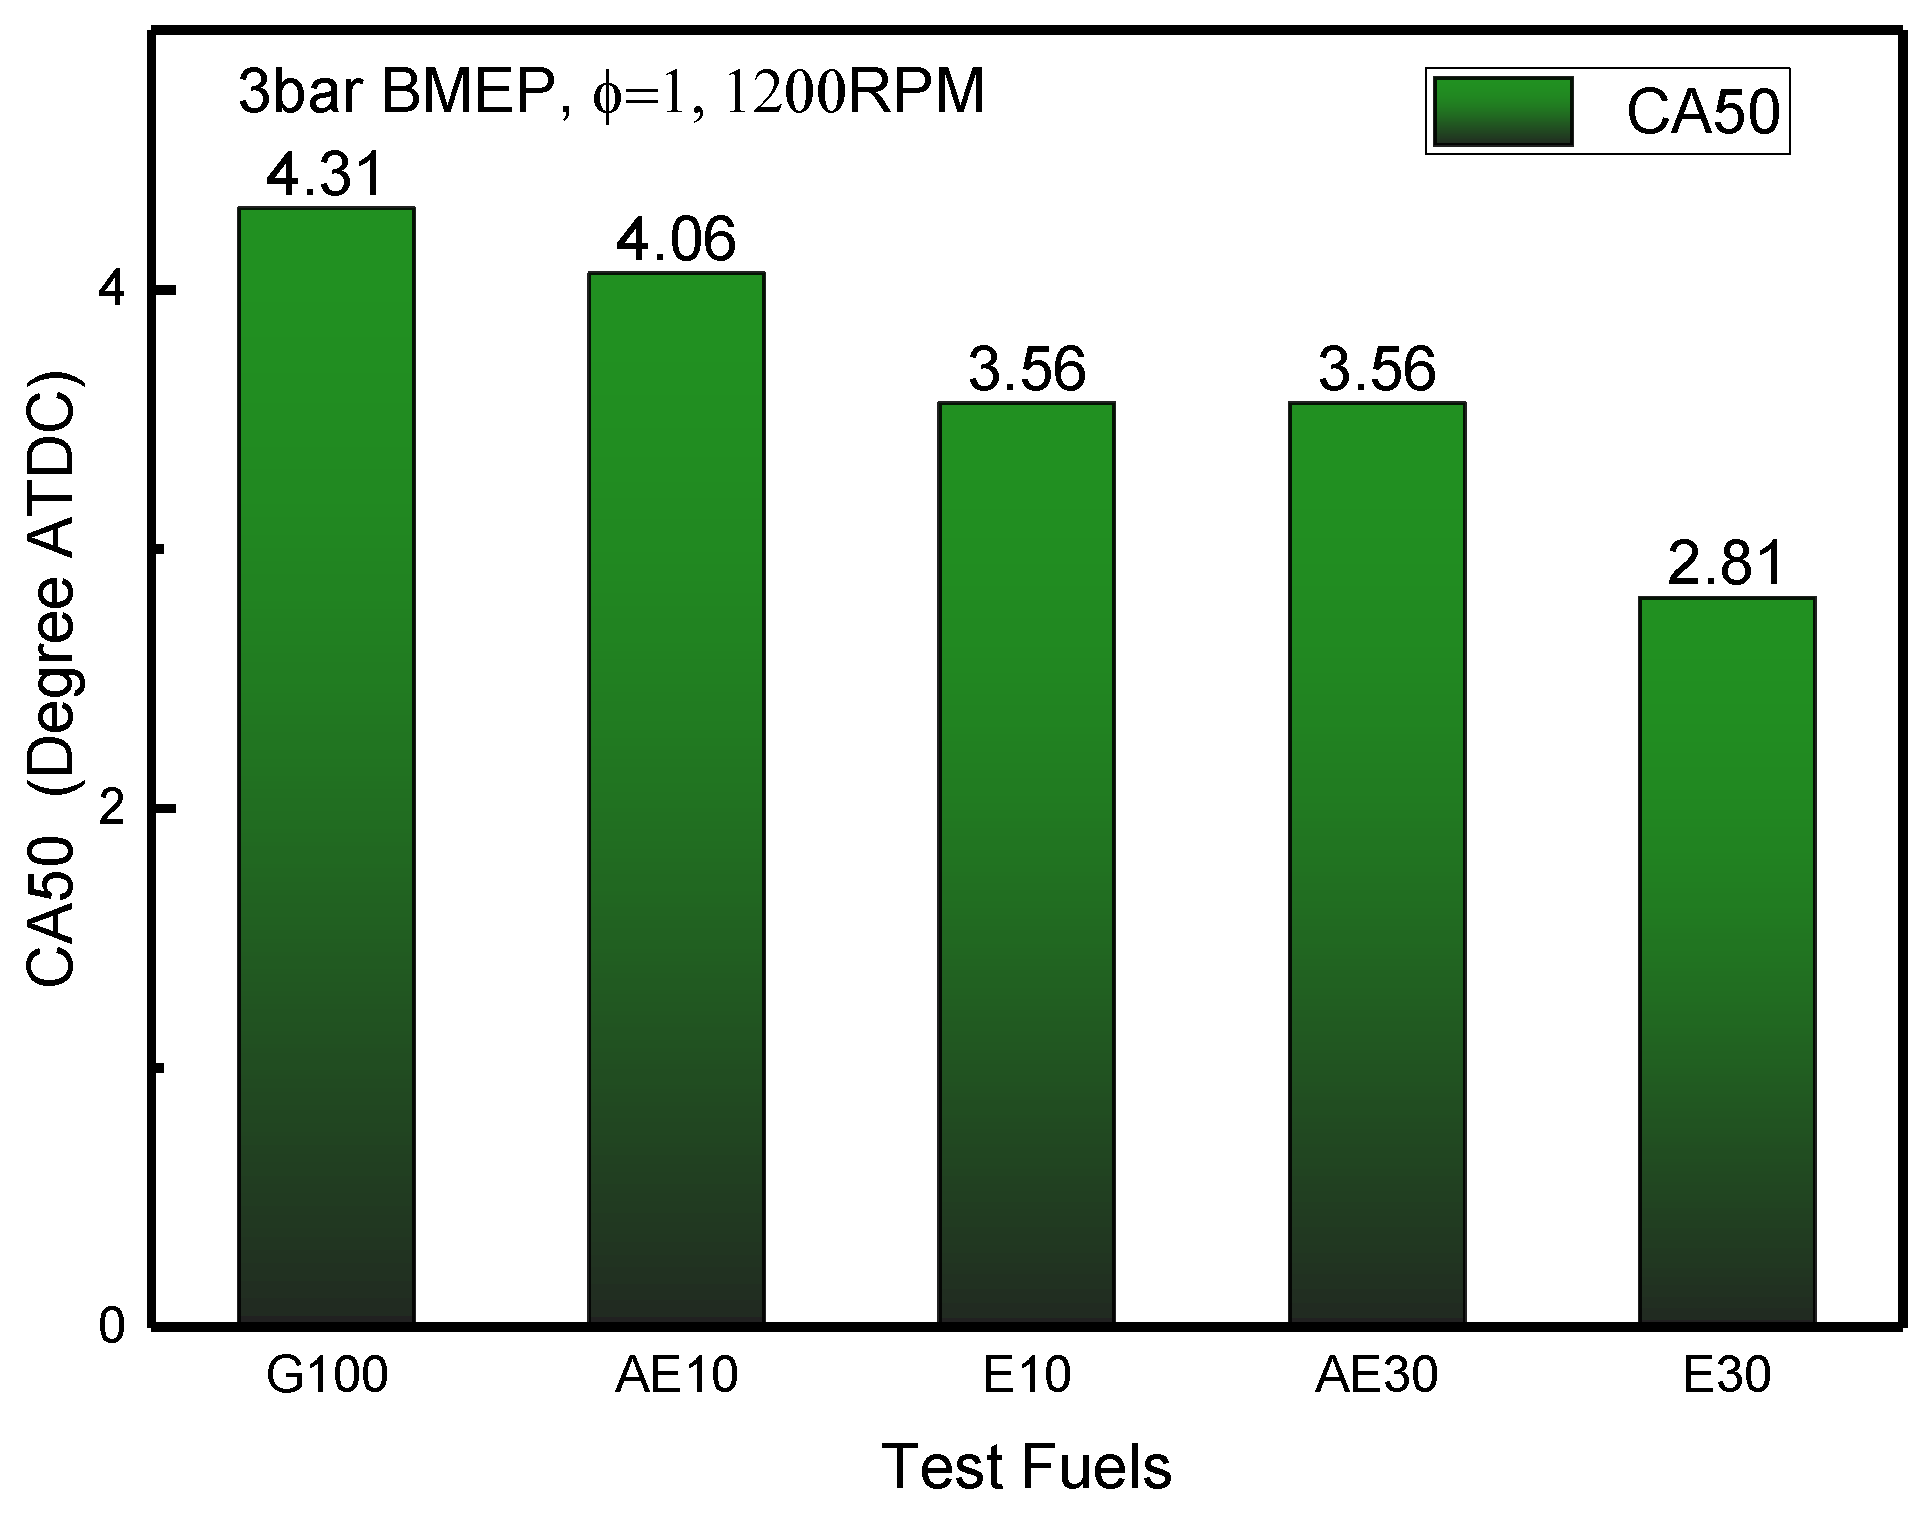
  • Acetone has a relatively lower laminar flame speed than that of ethanol; AE10 and AE30 have retarded phasing compared to ethanol-gasoline blends (E10 and E30) at gasoline MBT, implying that using acetone as an oxygenate additive could narrow the differences relative to pure gasoline without any modifications on commercial engines
  • There is a negligible reduction in BTE with acetone addition relative to pure gasoline and ethanol-containing gasoline; meanwhile, the BSFC can be improved relative to ethanol–gasoline due to the higher LHV of acetone.
  • No combustion stability problems were caused by acetone addition based on the COV-IMEP calculation. E10 has been shown to have a relatively small COV value compare with other blends.
  • AE30 shows the lowest HC emission under different equivalence ratios because of the better volatility of acetone leading to an improvement in the fuel pre-mixing, better combustion and post-flame oxidation. Compared with G100, E10 and E30 also show the improvement of HC emission as the ethanol addition increases.
  • Higher CO emission from AE30 at stoichiometric ratio might be due to more unburned gases returning from the crevice and partially reacting during the expansion and exhaust stroke in the form of post-flame oxidation. In addition, the AE blends were less sensitive to the equivalence ratio at fuel-rich conditions in terms of CO emission, which might reduce CO at full load and transient accelerating.
  • The NOx emissions were more influenced by engine operating conditions rather than due to different fuels (negligible changes).
In summary, there is potential usage of acetone as an oxygenate additive to commercial ethanol-containing gasoline for reduction in HC emissions without an efficiency penalty, without modifications to the default engine ECU calibration. Future work will involve studying the influence of the water contained in the bio-ethanol and the measurement of unregulated emissions such as aldehyde and acetone using the chromatography.

Acknowledgments

This material is based upon work supported by the National Science Foundation under Grant No. CBET-1236786. Any opinions, findings, and conclusions or recommendations expressed in this publication are those of the authors and do not necessarily reflect the views of the National Science Foundation. This work also supported by International S&T Cooperation Program of China (NO. 2012DFA11180) and Nature Science Foundation of Hubei Province (2014CFB485).

Author Contributions

All authors have cooperated for the preparation of the work. Lei Meng and Chia-fon F. Lee conceived and designed the experiments; Lei Meng and Yuqiang Li performed the experiments and analyzed the data; Chunnian Zeng contributed to set up the electronic controller and instruments; and Lei Meng, Karthik Nithyanandan and Timothy H. Lee wrote and revised the paper.

Conflicts of Interest

The authors declare no conflict of interest.

References

  1. Li, Y.; Liao, S.; Liu, G. Thermo-economic multi-objective optimization for a solar-dish Brayton system using NSGA-II and decision making. Int. J. Electr. Power Energy Syst. 2015, 64, 167–175. [Google Scholar] [CrossRef]
  2. Furuholt, E. Life cycle assessment of gasoline and diesel. Resour. Conserv. Recycl. 1995, 14, 251–263. [Google Scholar] [CrossRef]
  3. He, B.-Q.; Wang, J.-X.; Hao, J.-M.; Yan, X.-G.; Xiao, J.-H. A study on emission characteristics of an EFI engine with ethanol blended gasoline fuels. Atmos. Environ. 2003, 37, 949–957. [Google Scholar] [CrossRef]
  4. Wallner, T.; Miers, S.A.; McConnell, S. A comparison of ethanol and butanol as oxygenates using a direct-injection, spark-ignition engine. J. Eng. Gas. Turbines Power 2009, 131. [Google Scholar] [CrossRef]
  5. Balat, M.; Balat, H. Recent trends in global production and utilization of bio-ethanol fuel. Appl. Energy 2009, 86, 2273–2282. [Google Scholar] [CrossRef]
  6. Szulczyk, K.R.; McCarl, B.A.; Cornforth, G. Market penetration of ethanol. Renew. Sustain. Energy Rev. 2010, 14, 394–403. [Google Scholar] [CrossRef]
  7. Sadeghinezhad, E.; Kazi, S.N.; Badarudin, A.; Togun, H.; Zubir, M.N.M.; Oon, C.S.; Gharehkhani, S. Sustainability and environmental impact of ethanol as a biofuel. Rev. Chem. Eng. 2014, 30, 51–72. [Google Scholar] [CrossRef]
  8. Costagliola, M.A.; de Simio, L.; Iannaccone, S.; Prati, M.V. Combustion efficiency and engine out emissions of a S.I. engine fueled with alcohol/gasoline blends. Appl. Energy 2013, 111, 1162–1171. [Google Scholar] [CrossRef]
  9. Macedo, I.C.; Seabra, J.E.A.; Silva, J.E.A.R. Green house gases emissions in the production and use of ethanol from sugarcane in Brazil: The 2005/2006 averages and a prediction for 2020. Biomass Bioenergy 2008, 32, 582–595. [Google Scholar] [CrossRef]
  10. Hsieh, W.; Chen, R.; Wu, T.; Lin, T. Engine performance and pollutant emission of an SI engine using ethanol-gasoline blended fuels. Atmos. Environ. 2002, 36, 403–410. [Google Scholar] [CrossRef]
  11. Park, C.; Choi, Y.; Kim, C.; Oh, S.; Lim, G.; Moriyoshi, Y. Performance and exhaust emission characteristics of a spark ignition engine using ethanol and ethanol-reformed gas. Fuel 2010, 89, 2118–2125. [Google Scholar] [CrossRef]
  12. Masum, B.M.; Kalam, M.A.; Masjuki, H.H.; Rahman, S.M.A.; Daggig, E.E. Impact of denatured anhydrous ethanol-gasoline fuel blends on a spark-ignition engine. RSC Adv. 2014, 4, 51220–51227. [Google Scholar] [CrossRef]
  13. Kumar, A.; Khatri, D.S.; Babu, M.K.G. An Investigation of Potential and Challenges with Higher Ethanol-gasoline Blend on a Single Cylinder Spark Ignition Research Engine. SAE Tech. Paper 2009. [Google Scholar] [CrossRef]
  14. Ceviz, M.A.; Yüksel, F. Effects of ethanol-unleaded gasoline blends on cyclic variability and emissions in an SI engine. Appl. Therm. Eng. 2005, 25, 917–925. [Google Scholar] [CrossRef]
  15. Schifter, I.; Diaz, L.; Rodriguez, R.; Gómez, J.P.; Gonzalez, U. Combustion and emissions behavior for ethanol-gasoline blends in a single cylinder engine. Fuel 2011, 90, 3586–3592. [Google Scholar] [CrossRef]
  16. Turner, D.; Xu, H.; Cracknell, R.F.; Natarajan, V.; Chen, X. Combustion performance of bio-ethanol at various blend ratios in a gasoline direct injection engine. Fuel 2011, 90, 1999–2006. [Google Scholar] [CrossRef]
  17. Ozsezen, A.N.; Canakci, M. Performance and combustion characteristics of alcohol-gasoline blends at wide-open throttle. Energy 2011, 36, 2747–2752. [Google Scholar] [CrossRef]
  18. Jia, L.; Shen, M.; Wang, J.; Lin, M. Influence of ethanol-gasoline blended fuel on emission characteristics from a four-stroke motorcycle engine. J. Hazard Mater. 2005, 123, 29–34. [Google Scholar] [CrossRef] [PubMed]
  19. Silva, N.R.; Sodré, J.R. Using Additive to Improve Cold Start in Ethanol-Fuelled Vehicles. SAE Tech. Paper 2000. [Google Scholar] [CrossRef]
  20. Charoenphonphanich, C.; Imerb, W.; Karin, P.; Chollacoop, N.; Hanamura, K. Low Temperature Starting Techniques for Ethanol Engine without Secondary Fuel Tank. SAE Tech. Paper 2011. [Google Scholar] [CrossRef]
  21. Luo, H.; Ge, L.; Zhang, J.; Ding, J.; Chen, R.; Shi, Z. Enhancing acetone biosynthesis and acetone-butanol-ethanol fermentation performance by co-culturing Clostridium acetobutylicum/Saccharomyces cerevisiae integrated with exogenous acetate addition. Bioresource Technol. 2016, 200, 111–120. [Google Scholar] [CrossRef] [PubMed]
  22. Narasimhan, M.J., Jr.; Thirmulachar, M.J. Acetone-Gasoline Mixture for Automobiles; Pollution Control; Efficiency. U.S. Patent 4,372,753, 8 February 1983. [Google Scholar]
  23. Yang, C. Alcohol, Ketone and Ether with Silicon Compounds. U.S. Patent 5,688,295, 18 November 1997. [Google Scholar]
  24. Nithyanandan, K.; Chia-fon, F.L.; Wu, H.; Zhang, J. Performance and Emissions of Acetone-Butanol-Ethanol (ABE) and Gasoline Blends in a Port Fuel Injected Spark Ignition Engine. In Proceedings of the ASME 2014 Internal Combustion Engine Division Fall Technical Conference, Columbus, IN, USA, 19–22 October 2014.
  25. Nithyanandan, K.; Zhang, J.; Yuqiang, L.; Wu, H.; Lee, C. Investigating the Impact of Acetone on the Performance and Emissions of Acetone-Butanol-Ethanol (ABE) and Gasoline Blends in an SI Engine. SAE Tech. Paper 2015. [Google Scholar] [CrossRef]
  26. Meng, L.; Li, Y. Experimental Study on Performance and Emission of Acetone-Ethanol and Gasoline Blends in a PFI Spark Ignition Engine. SAE Tech. Paper 2016. [Google Scholar] [CrossRef]
  27. Wu, H.; Nithyanandan, K.; Zhou, N.; Lee, T.H.; Lee, C.F.; Zhang, C. Impacts of acetone on the spray combustion of Acetone-Butanol-Ethanol (ABE)-Diesel blends under low ambient temperature. Fuel 2015, 142, 109–116. [Google Scholar] [CrossRef]
  28. Gu, Y.; Jiang, Y.; Wu, H. Current status and prospects of biobutanol manufacturing technology. Chin. J. Biotechnol. 2010, 26, 914–923. [Google Scholar]
  29. Wigg, B.; Coverdill, R.; Lee, C.; Kyritsis, D. Emissions Characteristics of Neat Butanol Fuel Using a Port Fuel-Injected, Spark-Ignition Engine. SAE Tech. Paper 2011. [Google Scholar] [CrossRef]
  30. Nithyanandan, K.; Wu, H.; Huo, M.; Lee, C. A Preliminary Investigation of the Performance and Emissions of a Port-Fuel Injected SI Engine Fueled with Acetone-Butanol-Ethanol (ABE) and Gasoline. SAE Tech. Paper 2014. [Google Scholar] [CrossRef]
  31. Ganapathy, T.; Gakkhar, R.P.; Murugesan, K. Influence of injection timing on performance, combustion and emission characteristics of Jatropha biodiesel engine. APPL ENERG 2011, 88, 4376–4386. [Google Scholar] [CrossRef]
  32. Holman, J.P. Experimental methods for engineers. In McGraw-Hill Series in Mechanical Engineering; McGraw-Hill: New York, NY, USA, 2001. [Google Scholar]
  33. Mani, M.; Nagarajan, G. Influence of injection timing on performance, emission and combustion characteristics of a DI diesel engine running on waste plastic oil. Energy 2009, 34, 1617–1623. [Google Scholar] [CrossRef]
  34. Devan, P.K.; Mahalakshmi, N.V. Performance, emission and combustion characteristics of poon oil and its diesel blends in a DI diesel engine. Fuel 2009, 88, 861–867. [Google Scholar] [CrossRef]
  35. Wallner, T.; Miers, S.A. Combustion Behavior of Gasoline and Gasoline/Ethanol Blends in a Modern Direct-Injection 4-Cylinder Engine. SAE Tech. Paper 2008. [Google Scholar] [CrossRef]
  36. Chong, C.T.; Hochgreb, S. Measurements of laminar flame speeds of acetone/methane/air mixtures. Combust Flame 2011, 158, 490–500. [Google Scholar] [CrossRef]
  37. Cataluña, R.; Da Silva, R.; de Menezes, E.W.; Ivanov, R.B. Specific consumption of liquid biofuels in gasoline fuelled engines. Fuel 2008, 87, 3362–3368. [Google Scholar] [CrossRef]
  38. Szwaja, S.; Naber, J.D. Combustion of n-butanol in a spark-ignition IC engine. Fuel 2010, 89, 1573–1582. [Google Scholar] [CrossRef]
  39. Zhang, J.; Nithyanandan, K.; Li, Y.; Lee, C.; Huang, Z. Comparative Study of High-Alcohol-Content Gasoline Blends in an SI Engine. SAE Tech. Paper 2015. [Google Scholar] [CrossRef]
  40. Aleiferis, P.G.; Malcolm, J.S.; Todd, A.R.; Cairns, A.; Hoffmann, H. An optical study of spray development and combustion of ethanol, Iso-octane and gasoline blends in a DISI engine. SAE Tech. Paper 2008. [Google Scholar] [CrossRef]
  41. Chang, Y.; Lee, W.; Lin, S.; Wang, L. Green energy: Water-containing acetone-butanol-ethanol diesel blends fueled in diesel engines. Appl. Energy 2013, 109, 182–191. [Google Scholar] [CrossRef]
  42. Rassweiler, G.M.; Withrow, L. Motion pictures of engine flames correlated with pressure cards. SAE Tech. Paper 1938. [Google Scholar] [CrossRef]
  43. Heywood, J.B. Internal Combustion Engine Fundamentals; Mcgraw-hill: New York, NY, USA, 1988; Volume 930. [Google Scholar]
  44. Price, P.; Twiney, B.; Stone, R.; Kar, K.; Walmsley, H. Particulate and hydrocarbon emissions from a spray guided direct injection spark ignition engine with oxygenate fuel blends. SAE Tech. Paper 2007. [Google Scholar] [CrossRef]
  45. Cooney, C.P.; Yeliana; Worm, J.J.; Naber, J.D. Combustion Characterization in an Internal Combustion Engine with Ethanol-Gasoline Blended Fuels Varying Compression Ratios and Ignition Timing. Energy Fuel 2009, 23, 2319–2324. [Google Scholar] [CrossRef]
  46. Cooney, C.; Wallner, T.; McConnell, S.; Gillen, J.C.; Abell, C.; Miers, S.A.; Naber, J.D. Effects of blending gasoline with ethanol and butanol on engine efficiency and emissions using a direct-injection, spark-ignition engine. In Proceedings of the ASME 2009 Internal Combustion Engine Division Spring Technical Conference, Milwaukee, WI, USA, 3–6 May 2009.
  47. Dernotte, J.; Mounaim-Rousselle, C.; Halter, F.; Seers, P. Evaluation of butanol-gasoline blends in a port fuel-injection, spark-ignition engine. Oil Gas. Sci. Technol. Revue Inst. Français. Pétrole 2010, 65, 345–351. [Google Scholar] [CrossRef]
  48. Ramadhas, A.S.; Muraleedharan, C.; Jayaraj, S. Performance and emission evaluation of a diesel engine fueled with methyl esters of rubber seed oil. Renew Energy 2005, 30, 1789–1800. [Google Scholar] [CrossRef]
  49. Cheng, W.K.; Hamrin, D.; Heywood, J.B.; Hochgreb, S.; Min, K.; Norris, M. An overview of hydrocarbon emissions mechanisms in spark-ignition engines. SAE Tech. Paper 1993. [Google Scholar] [CrossRef]
  50. Vera, J.; Ghandhi, J. Investigation of Post-Flame Oxidation of Unburned Hydrocarbons in Small Engines. SAE Tech. Paper 2011. [Google Scholar] [CrossRef]
  51. Koç, M.; Sekmen, Y.; Topgül, T.; Yücesu, H.S. The effects of ethanol-unleaded gasoline blends on engine performance and exhaust emissions in a spark-ignition engine. Renew Energy 2009, 34, 2101–2106. [Google Scholar] [CrossRef]
  52. Liu, S.; Cuty Clemente, E.R.; Hu, T.; Wei, Y. Study of spark ignition engine fueled with methanol/gasoline fuel blends. Appl. Therm. Eng. 2007, 27, 1904–1910. [Google Scholar] [CrossRef]
  53. Can, Ö.; Celikten, I.; Usta, N. Effects of ethanol addition on performance and emissions of a turbocharged indirect injection diesel engine running at different injection pressures. Energy Convers. Manag. 2004, 45, 2429–2440. [Google Scholar] [CrossRef]
  54. Masum, B.M.; Masjuki, H.H.; Kalam, M.A.; Rizwanul Fattah, I.M.; Palash, S.M.; Abedin, M.J. Effect of ethanol-gasoline blend on NOx emission in SI engine. Renew. Sustain. Energy Rev. 2013, 24, 209–222. [Google Scholar] [CrossRef]
  55. Zhang, X.; Tang, C.; Yu, H.; Li, Q.; Gong, J.; Huang, Z. Laminar Flame Characteristics of Iso-Octane/n-Butanol Blend—Air Mixtures at Elevated Temperatures. Energy Fuel 2013, 27, 2327–2335. [Google Scholar] [CrossRef]
Figure 1. Schematic of the engine test bench.
Energies 09 00256 g001
Figure 2. In-cylinder press trace at 3 bar BMEP, φ = 1, 1200 RPM, gasoline MBT.
Energies 09 00256 g002
Figure 3. Mass Fraction Burned (MFB) at 3 bar BMEP, φ = 1, 1200 RPM, gasoline MBT.
Energies 09 00256 g003
Figure 4. Durations of 0%–10% MFB and 10%–90% MFB, at 3 bar BMEP, φ = 1, 1200 RPM.
Energies 09 00256 g004
Figure 5. CA50 location at 3 bar BMEP, φ = 1, 1200 RPM.
Energies 09 00256 g005
Figure 6. Ignition delay (a), combustion duration (b) and CA50 location (c) with varying equivalence ratio at 3 bar BMEP, 1200 RPM.
Energies 09 00256 g006
Figure 7. COV with different equivalence ratios at 3 bar, 1200 RPM.
Energies 09 00256 g007
Figure 8. Brake thermal efficiency (BTE) at 1200 RPM, φ = 1.
Energies 09 00256 g008
Figure 9. Brake specific fuel consumption (BSFC) at 1200RPM, φ = 1.
Energies 09 00256 g009
Figure 10. Unburned hydrocarbon (UHC) emissions at 1200RPM, φ = 1.
Energies 09 00256 g010
Figure 11. Unburned hydrocarbon (UHC) emissions with equivalence ratio varying at 1200 RPM, 3 bar (top) and 5 bar (bottom).
Energies 09 00256 g011
Figure 12. Carbon monoxide (CO) emissions at 1200RPM, φ = 1.
Energies 09 00256 g012
Figure 13. Carbon monoxide (CO) emissions with equivalence ratio varying at 1200RPM, 3 bar (top) and 5 bar (bottom).
Energies 09 00256 g013
Figure 14. Nitrogen Oxide (NOx) emissions at 1200 RPM, φ = 1.
Energies 09 00256 g014
Figure 15. Exhaust manifold temperature at 1200 RPM, φ = 1.
Energies 09 00256 g015
Figure 16. Nitrogen Oxide (NOx) emissions with equivalence ratio varying at 1200 RPM, 3 bar (top) and 5 bar (bottom).
Energies 09 00256 g016
Table 1. Engine specifications.
ParametersValue
Displaced Volume575 cc
Stroke90.1 mm
Bore90.3 mm
Connecting Rod Length150.7 mm
Compression Ratio9.6:1
Number of Valves4
Fuel InjectionPort Fuel Injection (PFI)
Table 2. List of measurements and the instrument measuring rang, accuracy and percentage uncertainties.
MeasurementsMeasuring RangeAccuracy (±)Percentage Uncertainties (± %)
Engine speed1–5000 RPM0.2%0.1
Torque0–300 N∙m0.5% FS0.3
Exhaust Gas Temperature0–900 °C1 °C0.15
CO emission0%–10% volume0.06%0.6
HC emission0–10,000 ppm12 ppm0.12
CO2 emission0%–20% volume0.5%0.5
NOx emission0–3000 ppm3%0.18
AFR4–2000.3 0.1
Air flow mass0–800 g/min1%1.8
Table 3. Neat fuel properties of blended fuels [4,25,35,36].
ParameterGasolineAcetoneEthanol
Molecular formulaC4–C12C3H6OC2H5OH
Oxygen (Mass %)02735
Density (kg/m3)715-765790790
Energy Density (MJ/l)32.2023.3821.17
Lower Heating Value (MJ/kg)43.429.626.8
Octane Number92117100
Self-ignition temperature (°C)~300465420
Boiling Temperature(°C)25–21556.278
Stoichiometric A/F ratio14.79.59
Latent Heat of Vaporization (25 °C) (kJ/kg)380-500518904
Laminar Flame Speed (LFS) (cm/s)~33 a~34 b~48 c
Ignition Limits in Air (volume %) [Lower-Upper]0.6–82.6–12.83.5–15
a p = 1 atm, T = 325 K; b p = 1 atm, T = 298 K; c p = 1 atm, T = 343 K.
Table 4. Calculated properties of blended fuels for test.
Fuel TypeLower Heating Value (MJ/kg)Density (kg/m3)Energy Density of Stoichiometric Air-Fuel Mixture (MJ/L)Stoichiometric Air/Fuel RatioOxygen (Mass %)
G10043.473031.714.70
E1041.673630.613.903.75
E3038.174828.512.7311.06
AE10(3:1)41.873630.813.943.17
AE30(3:1)38.874829.012.859.36
Table 5. Test conditions.
Engine Speed1200 RPM
Throttle Position100%
Engine Load (BMEP)3 bar, 5 bar
Equivalence Ratio0.83–1.25
Spark TimingGasoline MBT
Fuel Pressure3 bar

