Article

Enhancement of Fire Safety of an Existing Green Building due to Natural Ventilation

1
Department of Architecture, National Taiwan University of Science and Technology, Taipei 10607, Taiwan
2
Department of Safety, Health and Environmental Engineering, National Kaohsiung First University of Science and Technology, No.1, Daxue Rd., Yanchao Dist., Kaohsiung City 82445, Taiwan
3
Institute of Fire Science, WuFeng University, Chiayi 62153, Taiwan
*
Author to whom correspondence should be addressed.
Energies 2016, 9(3), 192; https://doi.org/10.3390/en9030192
Submission received: 16 December 2015 / Revised: 3 February 2016 / Accepted: 4 March 2016 / Published: 14 March 2016

Abstract

:
In recent years, natural ventilation technology is extensively used in order to improve indoor environment quality and reduce power consumption of air-conditioning systems in green buildings. However, the effect of natural ventilation on fires needs to be evaluated carefully, and how to make these energy-saving buildings safe is a topic worth studying. This study uses Fire Dynamics Simulator on some fire safety enhancement measures for an existing green building without installation of a smoke exhaust system. Since the building is located on a school campus, it does not require a smoke exhaust system according to Taiwan fire regulations. Referential results, obtained after a series of improvement strategies are tested, show that kiln natural ventilation can generate a comfortable air flow. Unfortunately, due to the stack effect, hot air and fatal smoke are blown into the evacuation route area behind the room when a fire occurs. The findings showed that there are two feasible improvement measures, “controlling the off state of each air inlet” and “setting up an exhaust port in the rear of room”, which can effectively resolve the fire safety issues; the construction of which can be undertaken at a reasonable cost.

1. Introduction

1.1. Energy-Saving Trend of Buildings

In recent years, energy-saving buildings have become of increasing interest worldwide, with green buildings being the best known [1,2,3]. In order to use engineering technology for environmental protection and energy savings, various countries have established evaluation indexes, by which the quantized data of a building’s energy consumption can be evaluated. This green strategy is an important step toward reducing the environmental impact of high energy use.
Table 1 shows the present quantitative indexes of energy consumption values for green buildings in various countries [4,5,6,7]. In 1990, the British Building Research Establishment (BRE) first proposed the BREEAM system (Building Research Establishment Environmental Assessment Method) for green building evaluation, which is used to analyze the environmental load of buildings. The U.S. LEED (Leadership in Energy and Environmental Design) system in 1996, the Canadian GBTool (Green Building Tool) system in 1998 and Taiwan’s EEWH (Ecology, Energy Saving, Waste Reduction, Health) evaluation system in 1999 soon followed. Many building designers use these indexes in their designs of environmentally friendly and energy-saving buildings.
Taiwan is a hot and humid region. The key indexes in the EEWH evaluation system are Ecology, Energy Saving, Waste Reduction and Health. There are nine evaluation items as principal axes, including biodiversity, greening, on-site water retention, daily energy saving, CO2 reduction, waste reduction, water resource, sewage and garbage improvement, and indoor health and environment. Unlike the evaluation indexes of European and American countries, the EEWH evaluation system is set up particularly for the wet, hot climate of Taiwan [8,9].

1.2. Fire Safety of Energy-Saving Buildings

For a sustainable building, the “safety” and the “energy saving” of buildings are of equal importance. In recent years, many studies have analyzed the fire safety issues for energy-saving buildings or green buildings, including building material fire resistance, roof fire prevention, glass curtain wall, fire rescue and so on [10,11,12,13,14]. Other studies have researched the ventilation of buildings and its effect on fires [15,16,17].
In order to maintain the indoor comfort level, building designers rely on a good ventilation system. Natural ventilation can reduce the power consumption of air-conditioning systems in spring and summer when the outside air temperature is not too high. Many architects and air-conditioning system engineers have gradually come to accept this as part of their design strategy [18,19].
As to fire safety, natural ventilation may not have a positive effect on the building fire scene as the enhanced stack effect results in a negative situation. The Edo period of Japan, also known as Tokugawa period, is the period between 1603 and 1868 in the history of Japan. At that time in Japan, the effect of natural ventilation on a building fire was considered. Figure 1A,B displays the fire suppression stone of a barn in Takayama, Gifu Prefecture, Japan. This stone was used to block the ventilation opening in the external wall when the barn was on fire. The fire gradually decreased by reducing the inflow of outside air, and so reduced the damage to the stored grain [20]. The findings of this study demonstrated that the present building energy-saving evaluation indices have not taken into consideration the ventilation effect during fires. Meanwhile, fire regulations would benefit from taking the natural ventilation effect into consideration.

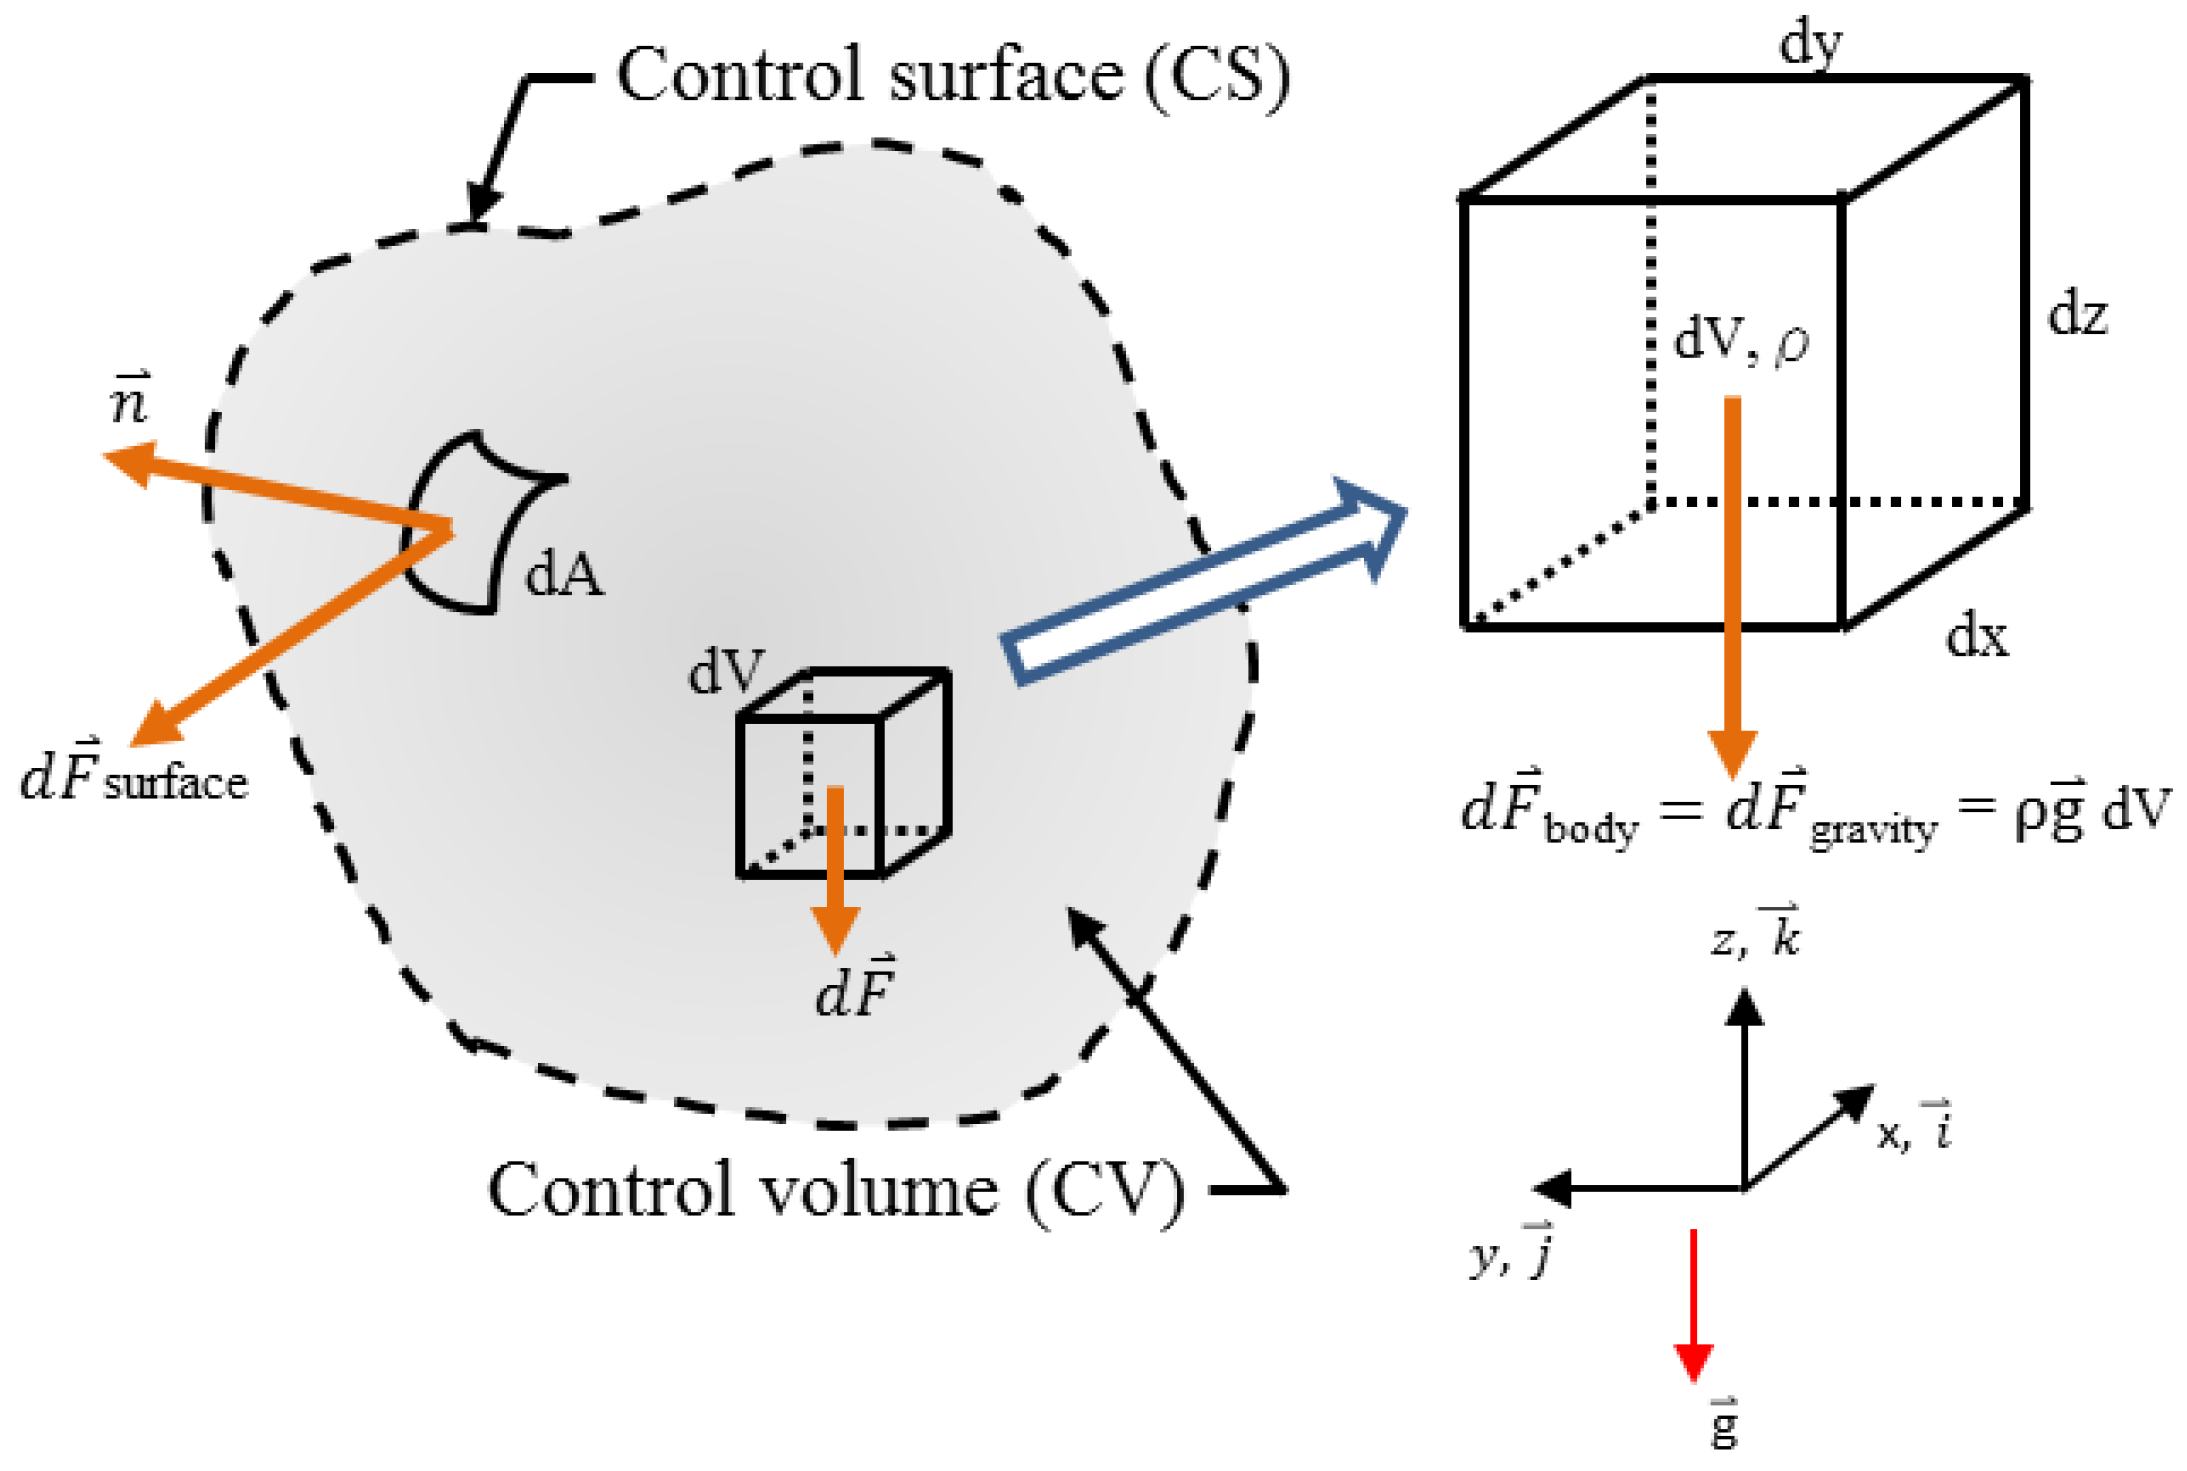
1.3. Stack Effect Due to the Momentum Conservation in the Fluid

According to the principle of fluid mechanics, the fluid stress is as shown in Figure 2 and expressed as Equation (1) by control volume theory [21]. At ordinary times, the air density is regarded as a constant value, as the temperature difference between the inside and outside of a building is not large. At this point, the buoyancy of the indoor air is not significant. The environmental terminal pressure difference is an important influencing factor:
F = F b o d y + F s u r f a c e = = F b o d y + ( F p r e s s u r e + F v i s c o u s ) = C V ρ g d V + C S σ i j n d A
Herein,
F: force (N)σij: fluid stress in x,y,z direction
ρ: density (kg/m3) n : normal vector
g: gravity vector (m/s2)
When a building is on fire, the fire scene temperature can rise hundreds of degrees Celsius. The stack effect occurs when the density of the heated air decreases sharply, making the buoyancy phenomenon readily apparent. The characteristic of this effect is that the fresh outside air admitted into the fire scene actively keeps the flames going [22]. The aforementioned barn fire suppression stone was used to prevent the outside air from flowing into the barn, thereby gradually reducing the fire until it was extinguished.
Due to the deficiencies in Taiwan’s fire prevention code, some rooms in school buildings are not required to install smoke exhaust systems. However, rooms of the same size and use in other buildings (e.g., commercial buildings) must be equipped with smoke exhaust systems. This study used the Fire Dynamics Simulator (FDS) to analyze a room in an existing green building, particularly as regards the hot air and smoke flow phenomena that occur with an indoor fire in a building with natural ventilation. The proposed countermeasures required to enhance fire safety in such buildings were determined by analyzing the smoke diffusion phenomenon at the fire scene.

2. Description of Study Case

2.1. Building Characteristics

The indoor space, 22.5 m (L) × 16 m (W), with an area of about 360 m2, is used as an exhibition hall, which accommodates about 350 persons for static activities. The building could save 65.1% of the energy consumed by equipment using various energy-saving engineering methods. The energy consumption could be reduced by 10.1% using natural ventilation [23,24]. The room’s interior décor includes wood fiber-based acoustic material and activated carbon for effective sound insulation and the removing of odors, but these materials are both flammable.
Two engineering technologies can be used to enhance the energy savings:
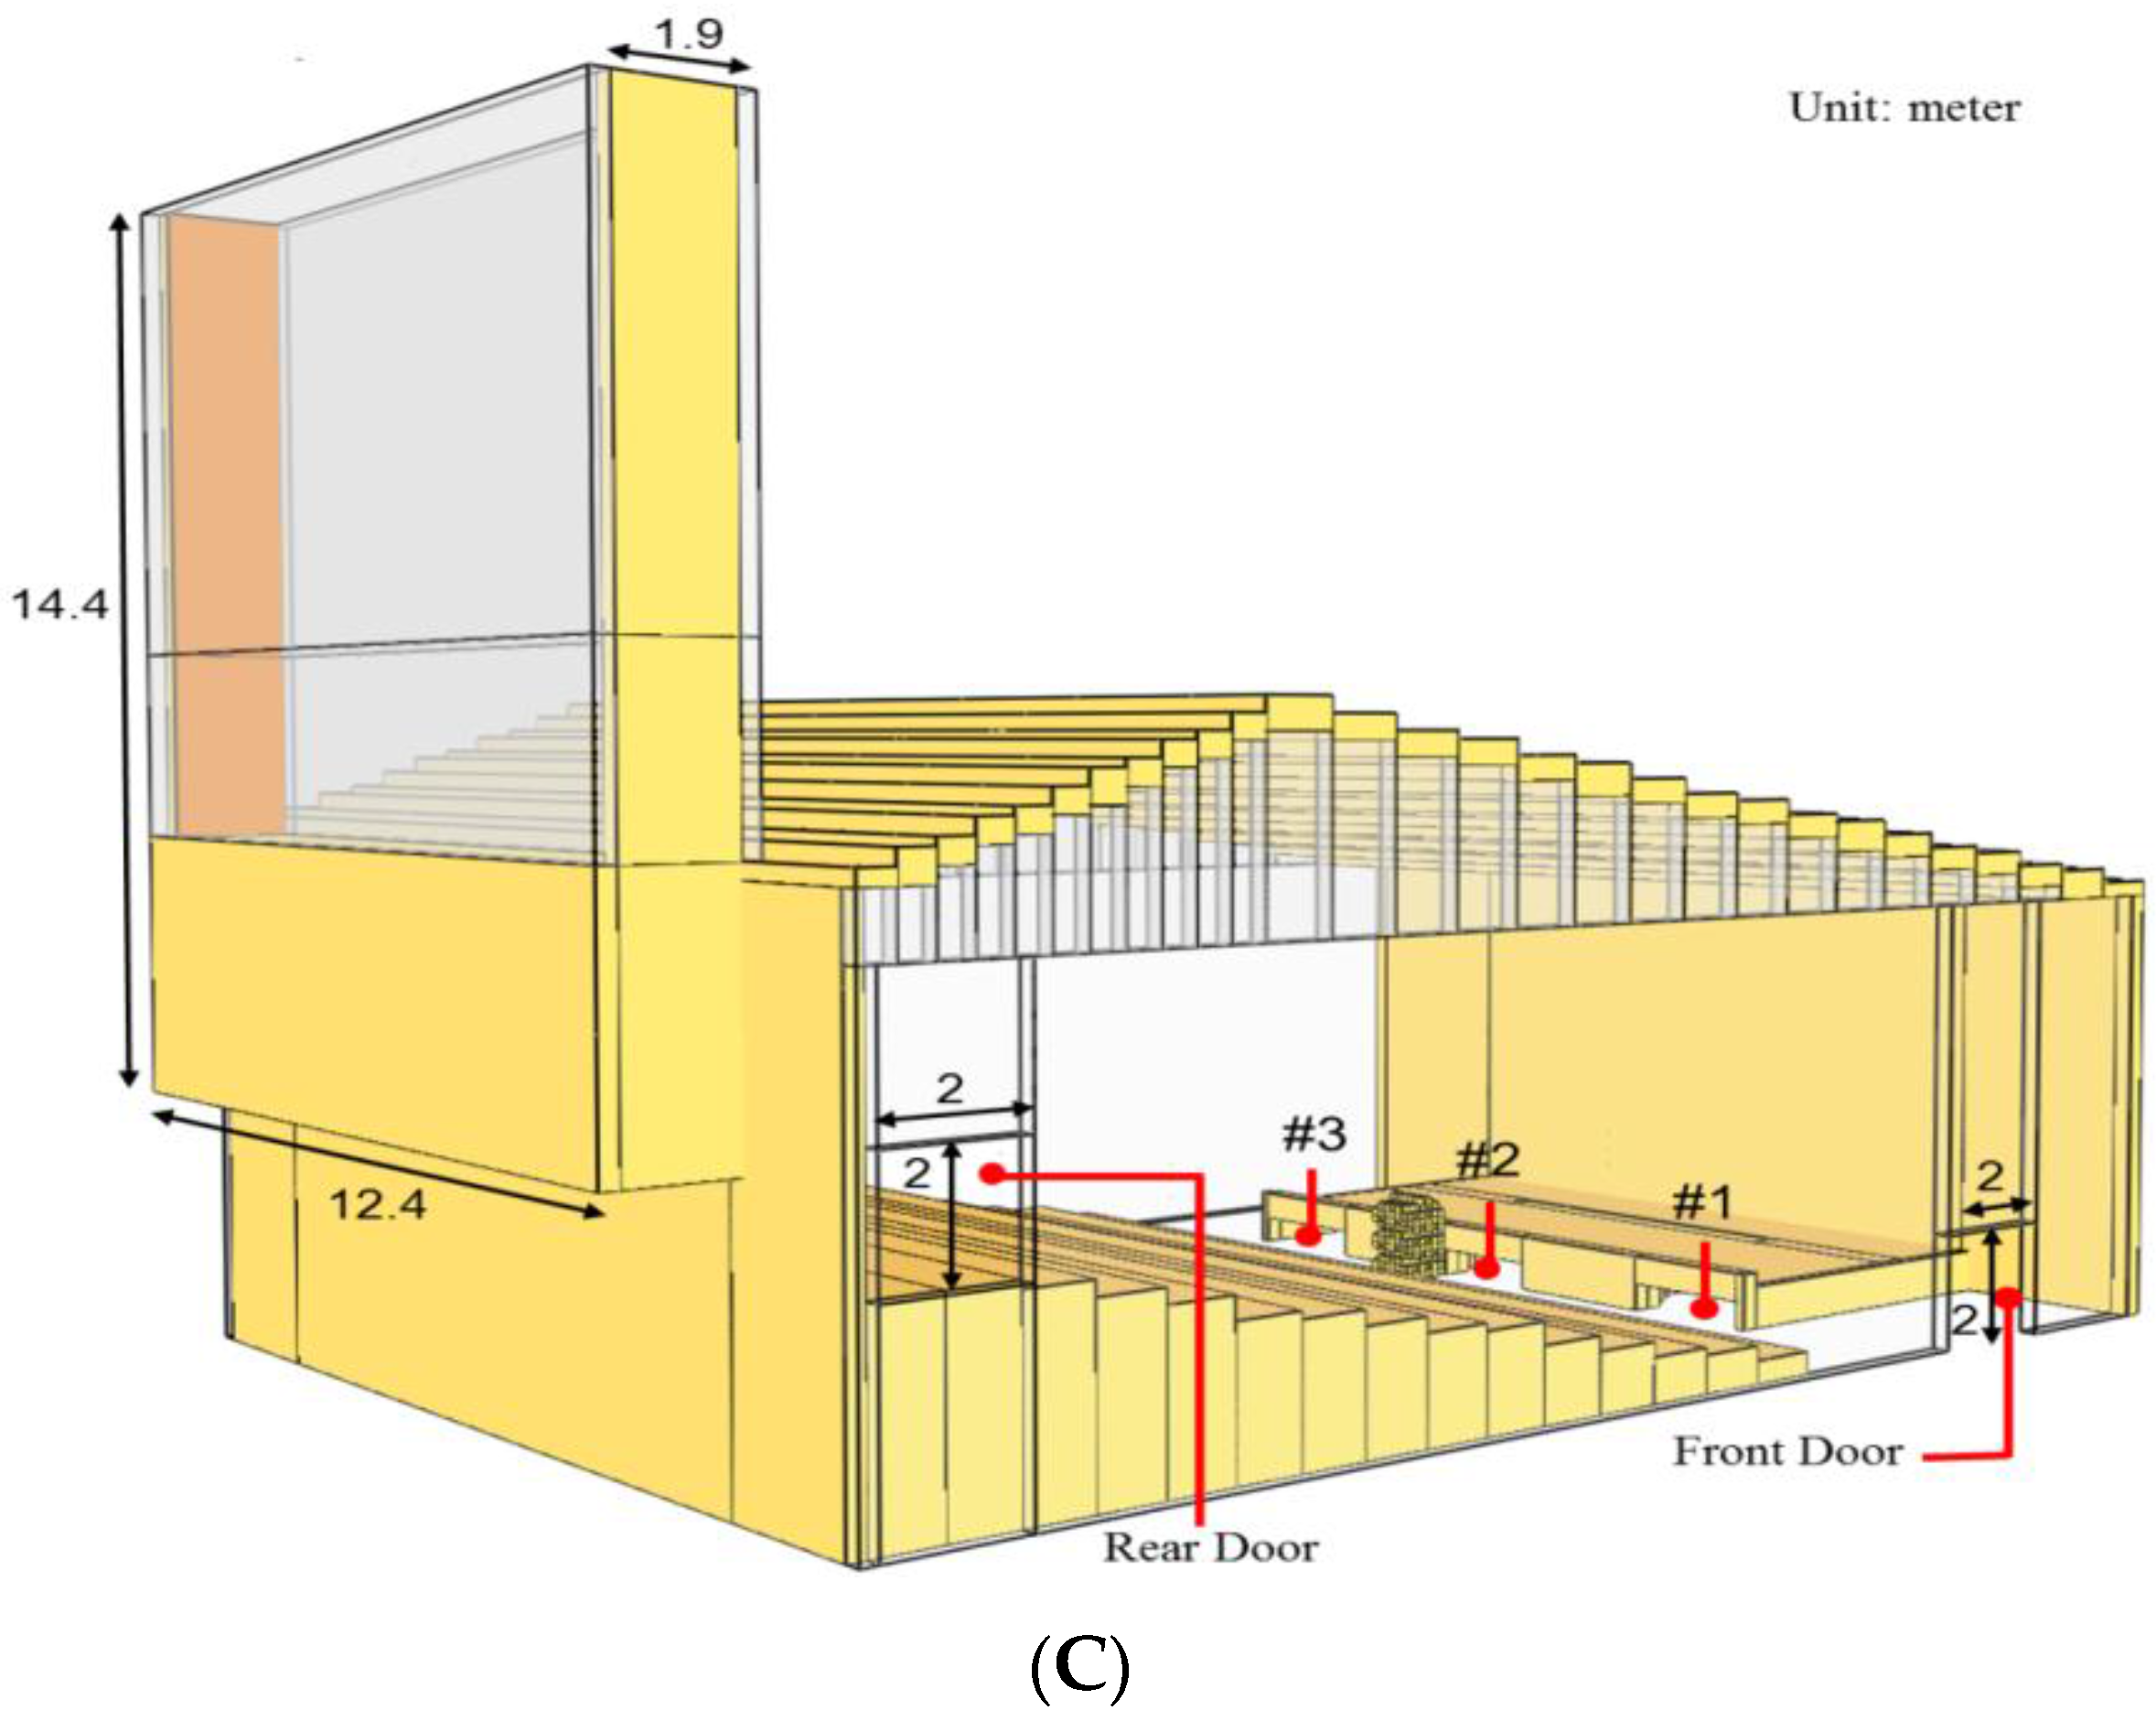
  • Special opening design: three openings under the platform are created to allow natural wind into the room when the outside air temperature is not too high. There is an opening in the rear wall through which the imported air flows back outdoors. The planned air flow path is about 1 m above the ground, just above the seats. The gentle air flow helps keep the ambient air at a comfortable temperature.
  • Metal ventilation tower: on the principle of the stack effect, the air discharged from the rear of room to the outside flows through a metal chimney. As the solar irradiation heats the periphery of the metal chimney, the air flow is heated and the velocity of the ascending air flow is accelerated. More outside air is imported to increase the indoor air change rate.
This study evaluated the effects of a fire in the exhibition room, including the fire indexes of air flow temperature, visibility and smoke height. These indexes were used to evaluate the results of the improvement strategies [25]. The safety standards for fire scenes in Taiwan are shown in Table 2 [26].

2.2. Regional Meteorology

The building in this study is located in the southern city of Taiwan. According to the statistics of the Taiwan Weather Bureau, the monthly average temperature in the region is between 15 and 30 °C. The outdoor average wind speed is 3.7 m/s in spring and fall [27]. The building was designed to incorporate natural ventilation to take advantage of moderate outside air temperatures in spring and fall in order to save energy by reducing the operation time for the air-conditioning system.

3. Methodology

3.1. Research on Building Performance Simulation

Numerical simulations on the performance of building devices can obtain valuable findings with lower research costs and time as well as more flexible setting [28,29,30,31]. Field construction of complex shapes can accurately simulate the actual fire situation, and the fire hazards in buildings can be simulated using three methods. The latter two modes are currently the most commonly used for fire simulations [32,33,34].
(1)
Algebraic Equation [35]
(2)
Zone Model
(3)
Field Model
In terms of the Zone Model, the building space is divided into several large zones. The physical and chemical properties in each zone are assumed to be homogeneous. The growth of the fire, flow of smoke and the temperature and concentration distributions in each zone are predicted using energy, momentum, mass and component conservation principles. Due to the recessive type model, fewer assumptions are needed; therefore, the fire phenomena can be traced more carefully with the correct descriptions, although the computation time is significant [35,36].
For the Field Model, the building space is divided into numerous fine grids. The conservation equation of different physical quantities is computed using the numerical method. The Field Model, which is applicable to the simulation of a fire scene in building with a complicated shape, is used to predict the velocity, pressure, temperature, and concentration values of each grid in the course of a fire carefully and correctly [35,36].

3.2. Features of FDS

The FDS program is three-dimensional numerical CFD software that simulates the air flow driven by fire buoyancy using LES (Large Eddy Simulation) calculations, instead of RANS (Reynolds-averaged Navier-Stokes), as the main mode. The first version of FDS was released in January 2000 and soon received considerable attention. It is now, internationally, the most commonly used computational fluid dynamics (CFD) model for determining the fire-driven flow of the smoke and the heat transfer phenomena generated by fires in buildings [37].
FDS uses a variety of governing equations for its calculations that can accurately predict the velocity, pressure, temperature and smoke-density values at different points in an interior space during a fire. FDS Version 6 software is an excellent tool for fire simulation, as it can describe the phenomenon of a fire’s buoyancy-driven gas flow, according to the National Institute of Standards and Technology Buildings and Fire Research Laboratory [37,38].
The fluid velocity, temperature, density and pressure are calculated by the energy equation, the momentum equation, other equations and the spatial average of total pressure equations of temperature, density and pressure; in the governing equations, the spatial coordinates of the second-order differential term are derived from the central difference method. The time derivative term from the second-step of the Runge–Kutta method needs to be discretized. The conservation equations for mass, momentum and energy for a Newtonian fluid are as shown in Equations (2)–(5) [37,39]:
  • Conservation of Mass:
    ρ t + ρ u = m ˙ b
  • Conservation of Momentum (Newton’s Second Law)
    t ( ρ u ) + ρ u u + p = ρ g + f b + τ i j
  • Conservation of Energy (First Law of Thermodynamics)
    t ( ρ h ) + ρ h u = D p D t + q ˙ q ˙ b q ˙ + ε
  • Equation of State for a Perfect Gas
    p = ρ R T W ¯
Herein,
ρdensity (kg/m3) m ˙ b mass production rate per unit volume (kg/s m3)
fbexternal force vector (N/m3) q ˙ heat release rate per unit volume (kg/s m3)
ggravity vector (m/s2) q ˙ b energy transferred (kg/s m3)
hsensible enthalpy (kJ) q ˙ heat flux vector (J/s m2)
ppressure (pa)εdissipation rate (kg/s m3)
Runiversal gas constant (J/K·mol) τ i j viscous stress tensor (N/m2)
Ttemperature (°C) W ¯ molecular weight of the gas mixture (g/mol)
uvelocity vector u(u,v,w) (m/s)

4. Setting of Simulated Conditions

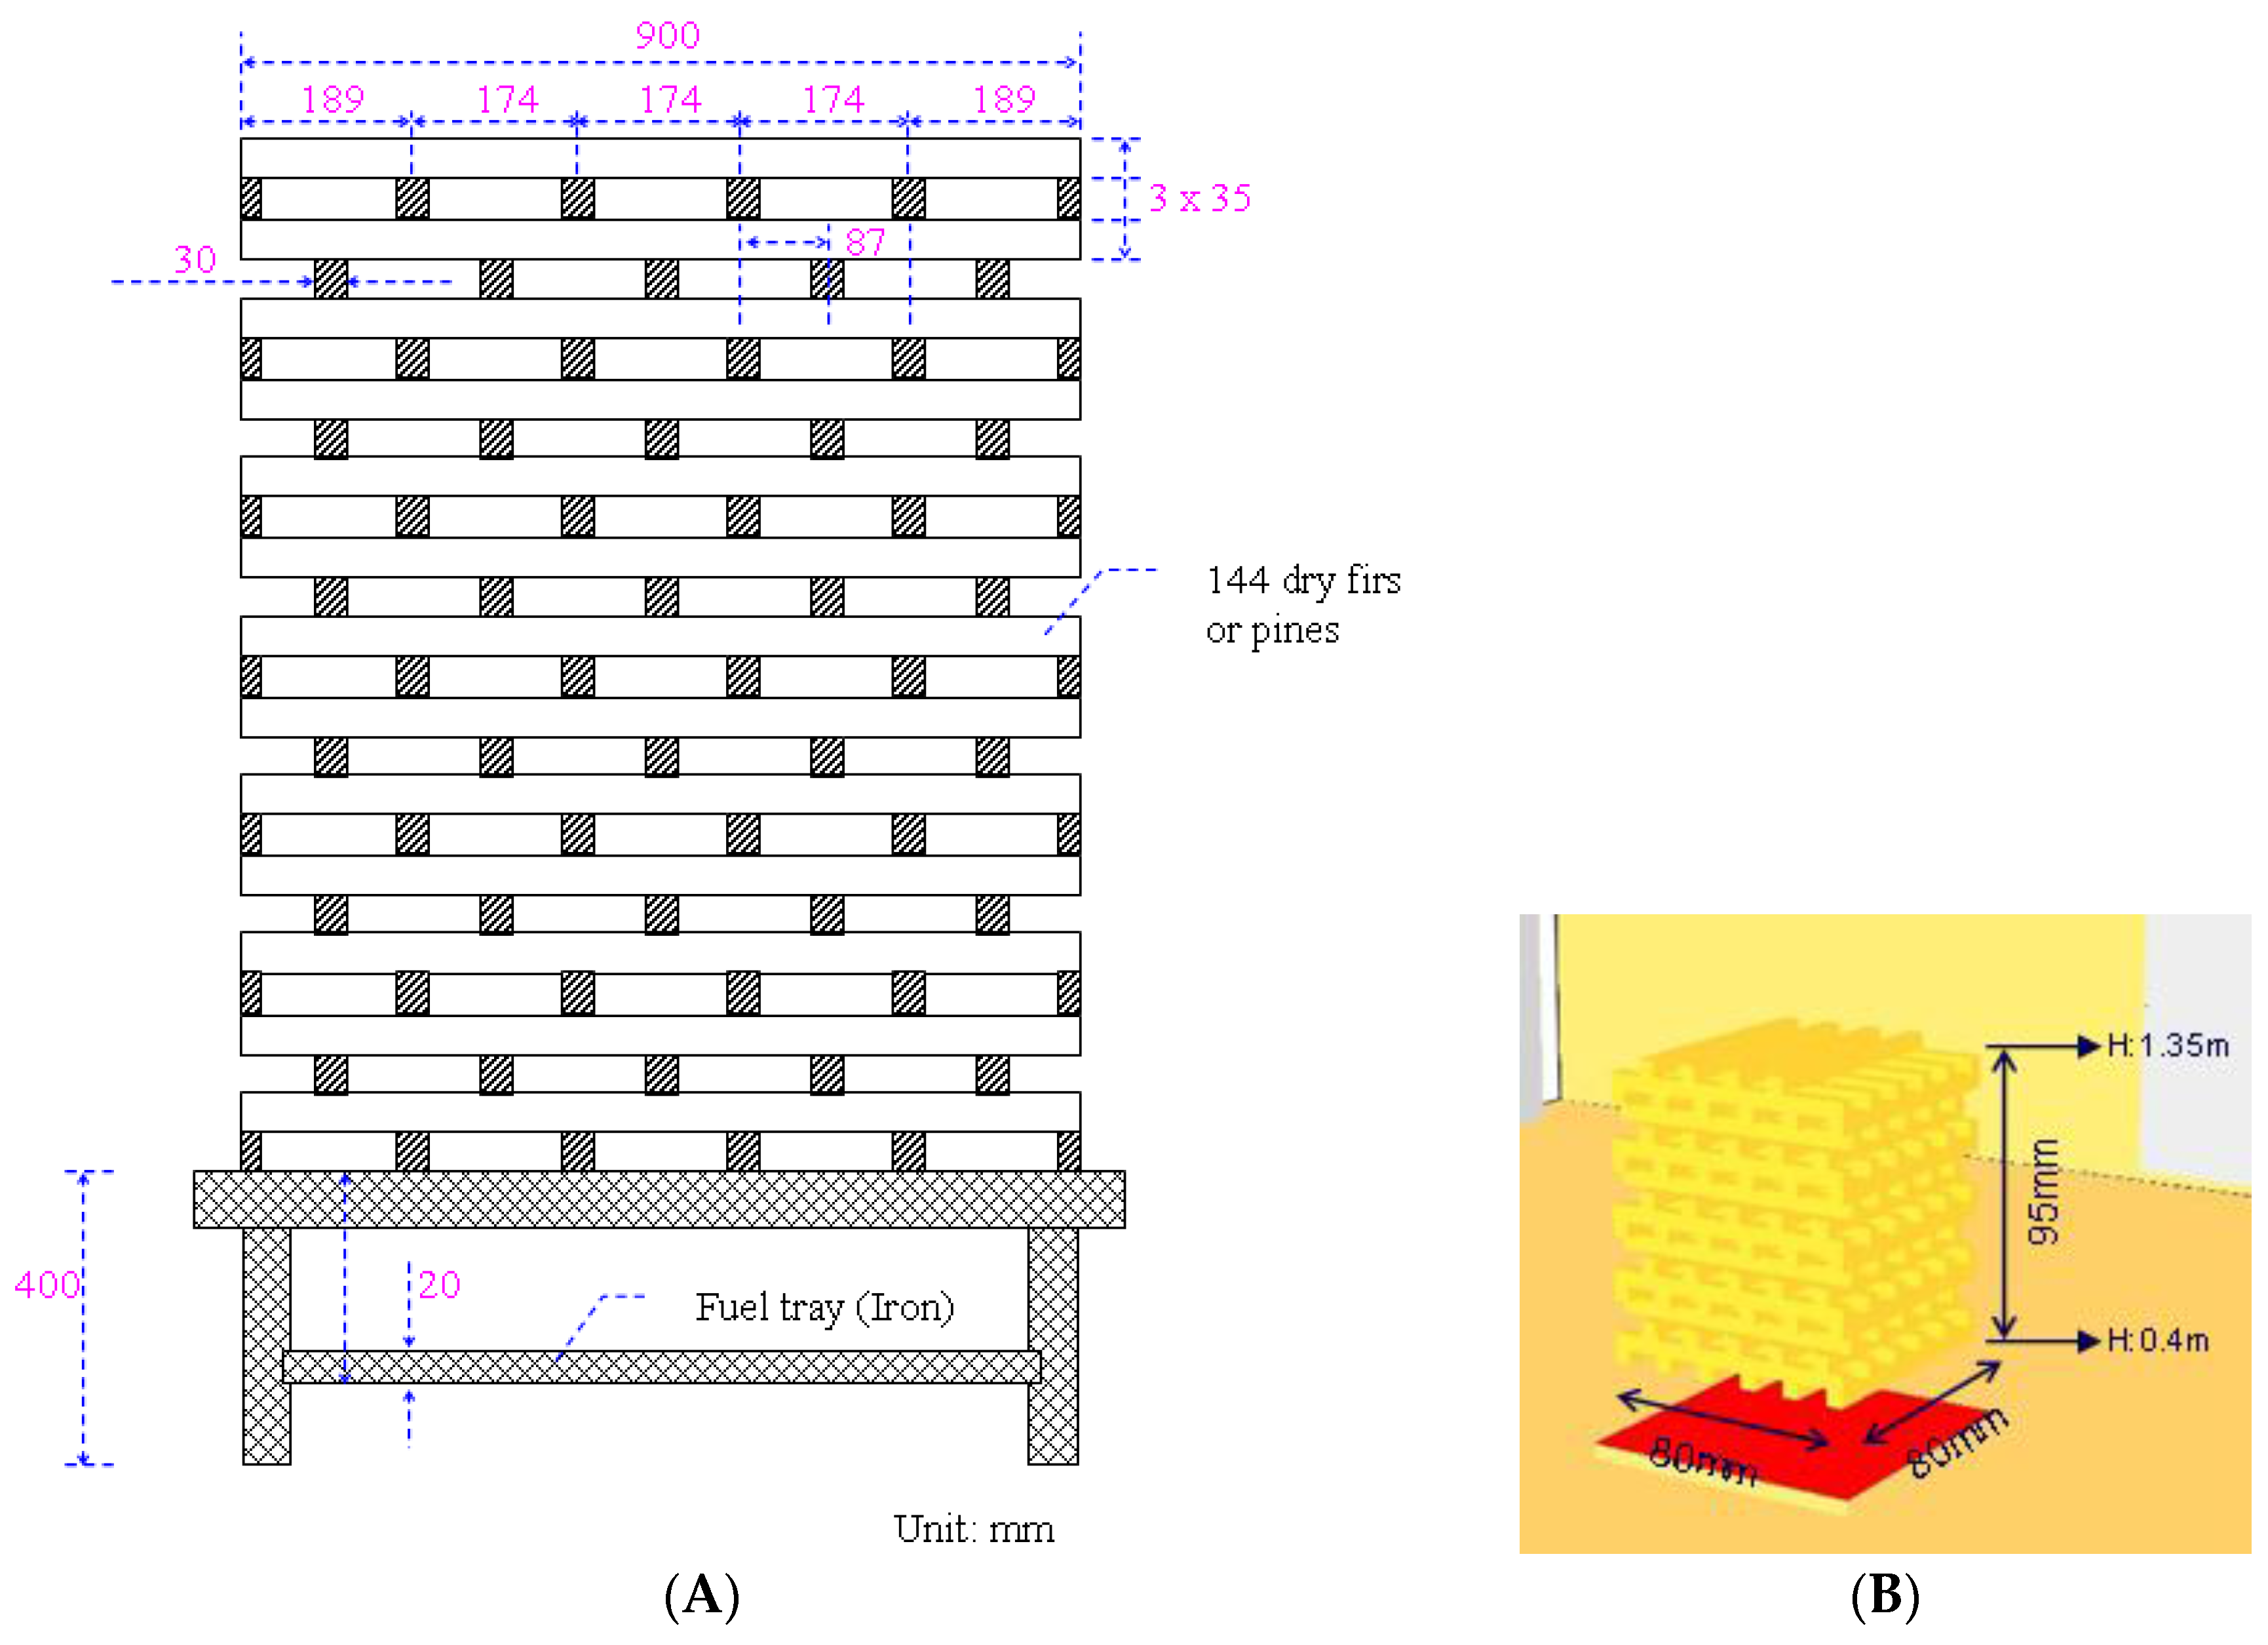
4.1. Woodpile Model in Numerical Simulation

For the wood HRR combustion curve, the relevant setup parameters refer to the test report of VTT (Valtion Teknillinen Tutkimuskeskus) in 2007 [40], as shown in the curve in Figure 3. Since most of the interior of the building was made of wood material, the fire growth model was a standard-size woodpile model, in reference to the extinguishing capabilities of the Approval Directions for Fire Extinguisher published in Taiwan in July 2013 [41]. The experiment adopted the A-2 model, with the overall structure composed of a 30 mm × 35 mm × 900 mm stack. The 144 wood pieces had a total surface area of about 16 m2 and weighed about 54 kg. The configuration height of the woodpile was from 0.4 to 1.3 m, as shown in Figure 4A. The combustion took into consideration the wood heat release rate (HRR), as shown in Table 3 [42].
The size of each wood piece was limited to the grid size during the simulation, defined as 50 mm × 50 mm × 800 mm. As the heat release rate of the numerical simulation needed to be consistent with that of the experiment, the total surface area of the wood in the experiment was 17.15 m2. The surface area of one piece of wood for the simulation was 0.165 m2, for a total of about 104 pieces of wood, which were stacked in orderly layers crosswise. The spread geometry is shown in Figure 4B.

4.2. Analysis of Grid Parameters

The grid test tests the accuracy of the simulation of the CFD calculation of the programming grid in time and space in regard to the physical convergence divergence behavior. Therefore, the selection and burn-related physical quantities are examined to verify the accuracy of the grid of convergence as related to the combustion phenomena. FDS models generate outputs of the temperature, pressure, CO concentration and so on. In this study, the combustion mode of wood was set as the phenomenon of natural spread, not a compulsive burning rate. The heat release rate curve of a woodpile in original status simulation is shown in Figure 5. The maximum heat release rate is 1.49 MW. The accuracy of the grid was controlled for less than 0.1 × D* cm, adopting Baum’s proposed Equation (6). The number of grid cells for each simulation model is about 7.8 million. A grid size of 10 cm was adopted for the fire-state simulation of the room and, nearby, the fire source used an encrypted grid of 5.0 cm [43].
D * = [ Q ρ 0 × C p × T 0 × g ] 2 / 5 = [ Q 1116 ] 2 5 = ( 1.49 × 10 3 / 1116 ) 2 / 5 = 1.123 ( m )
Herein,
  • Q: heat release rate (kW)
  • ρ0: air density (kg/m3)
  • Cp: specific heat (J/kg- °C)
  • T0: ambient temperature (K)
  • G: gravity (m/s2)

4.3. Description of Fire Scenario

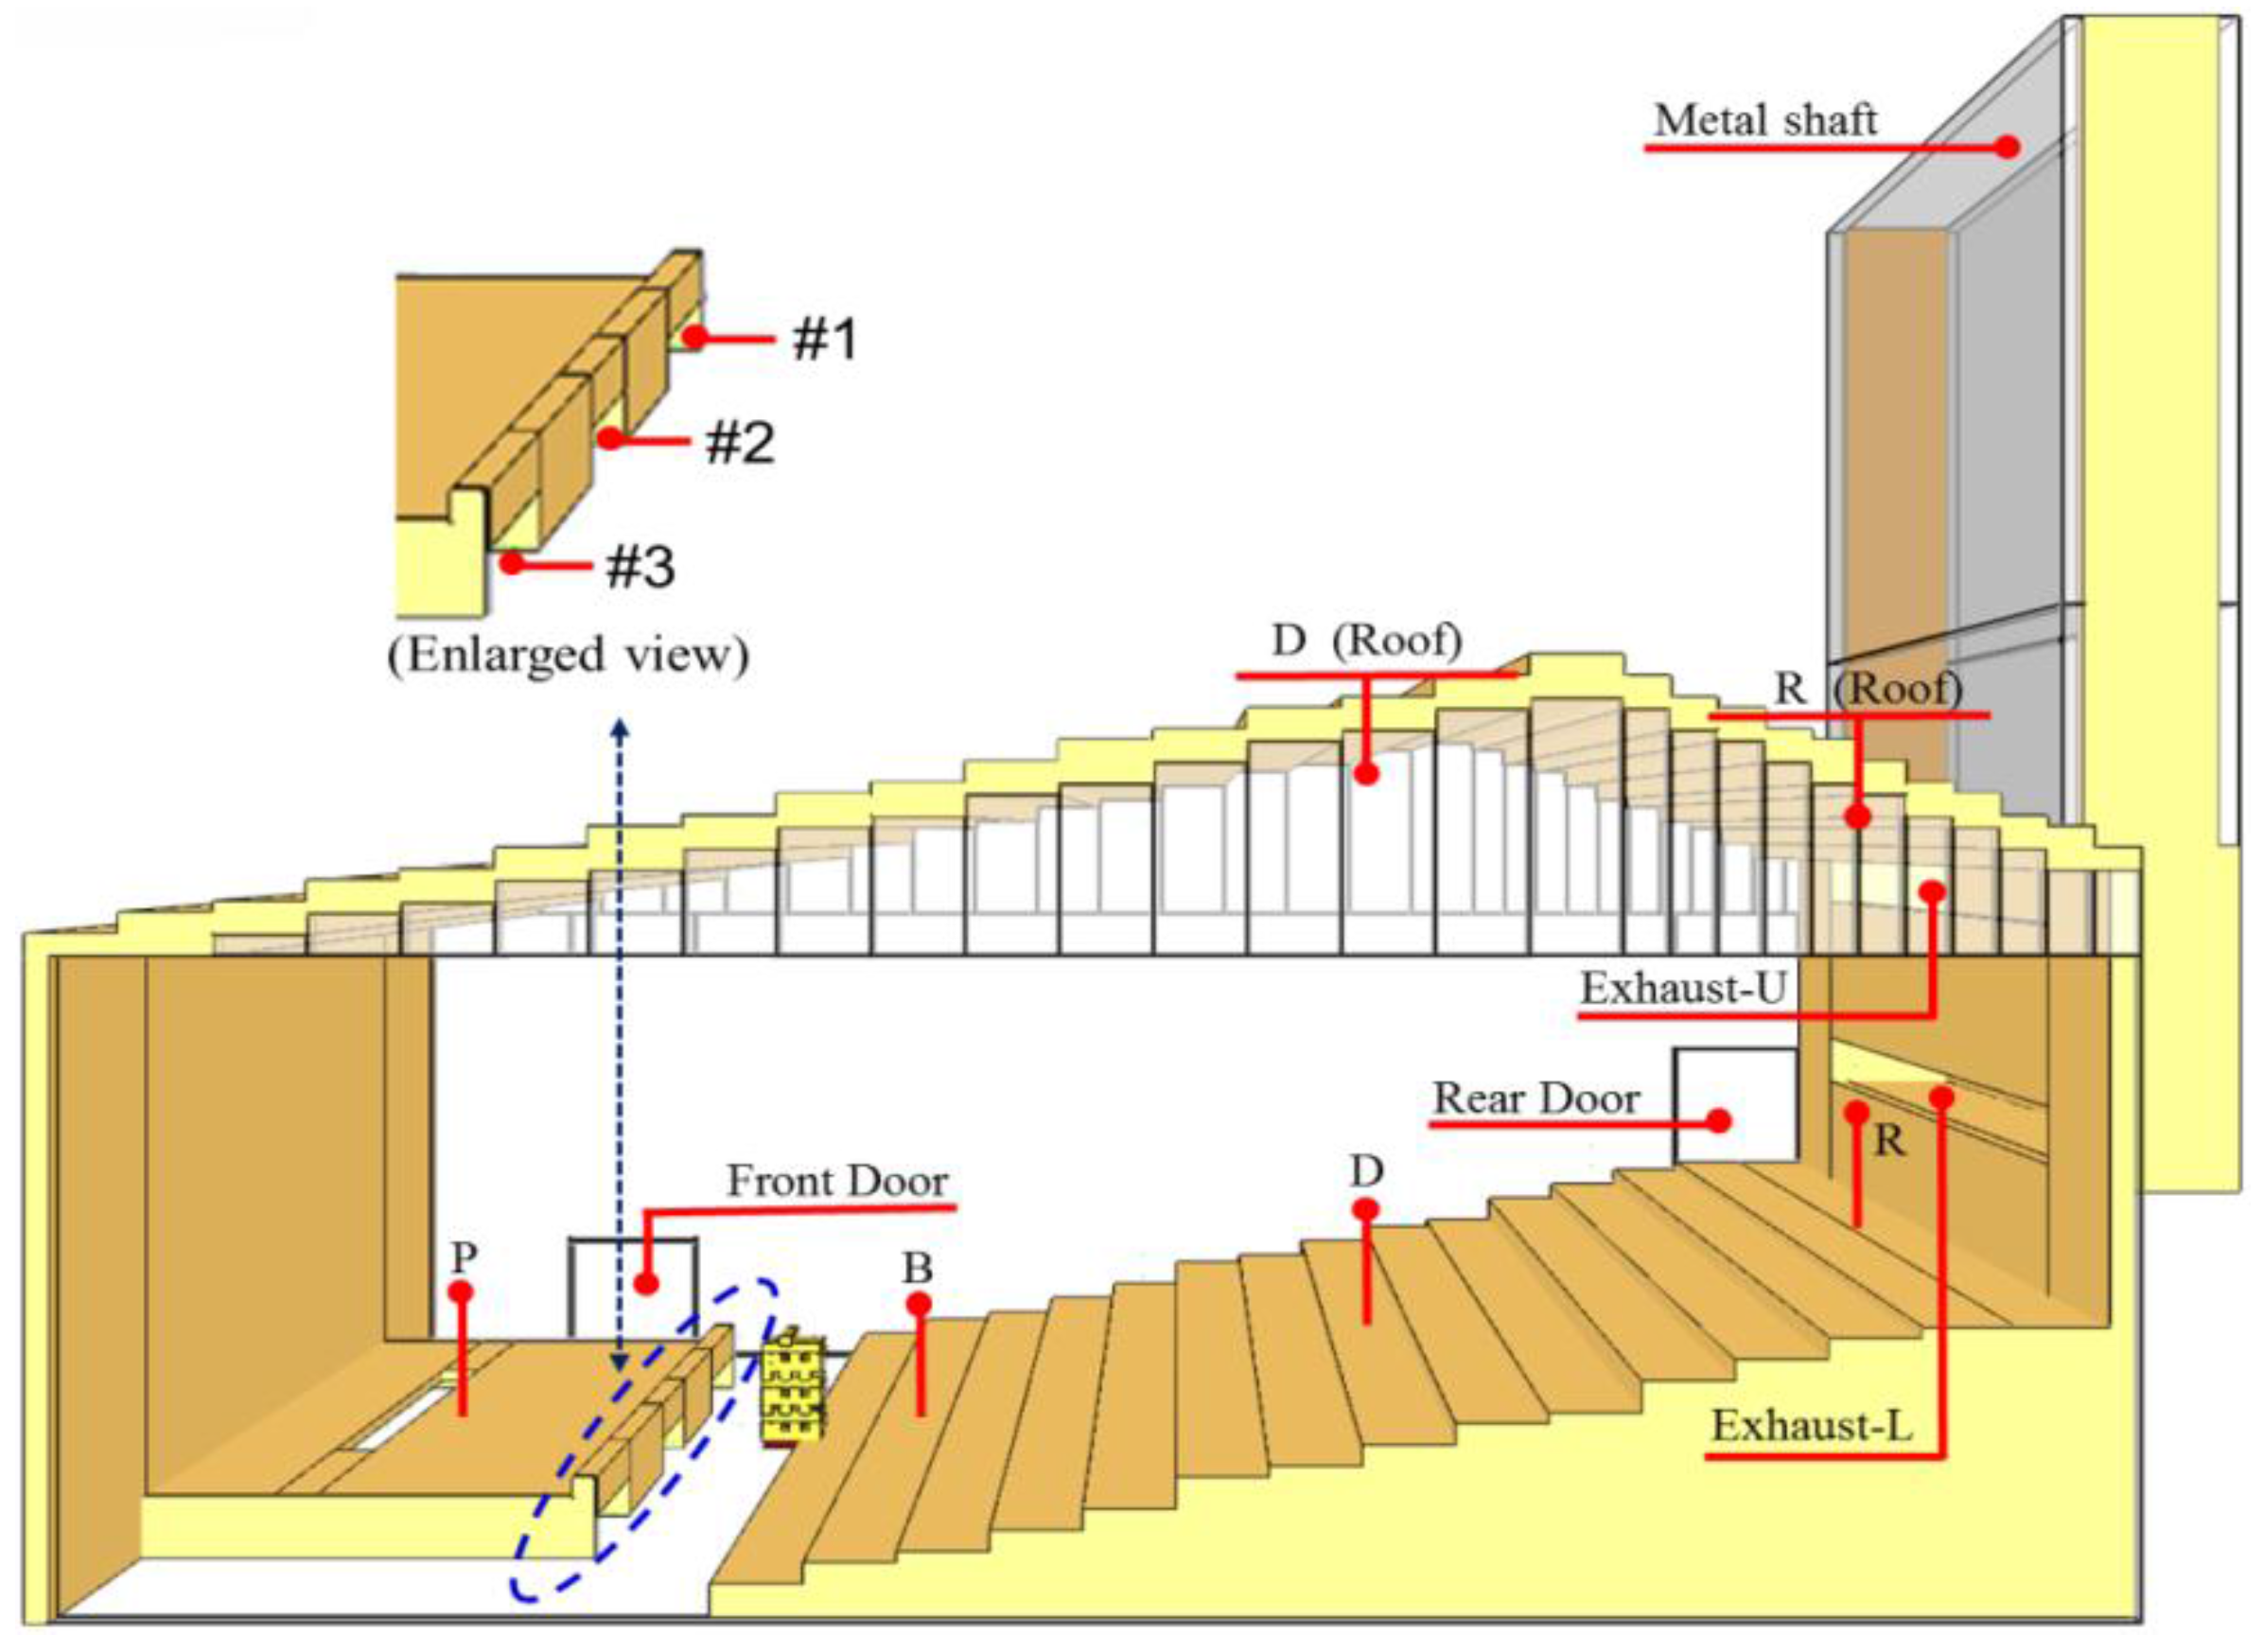
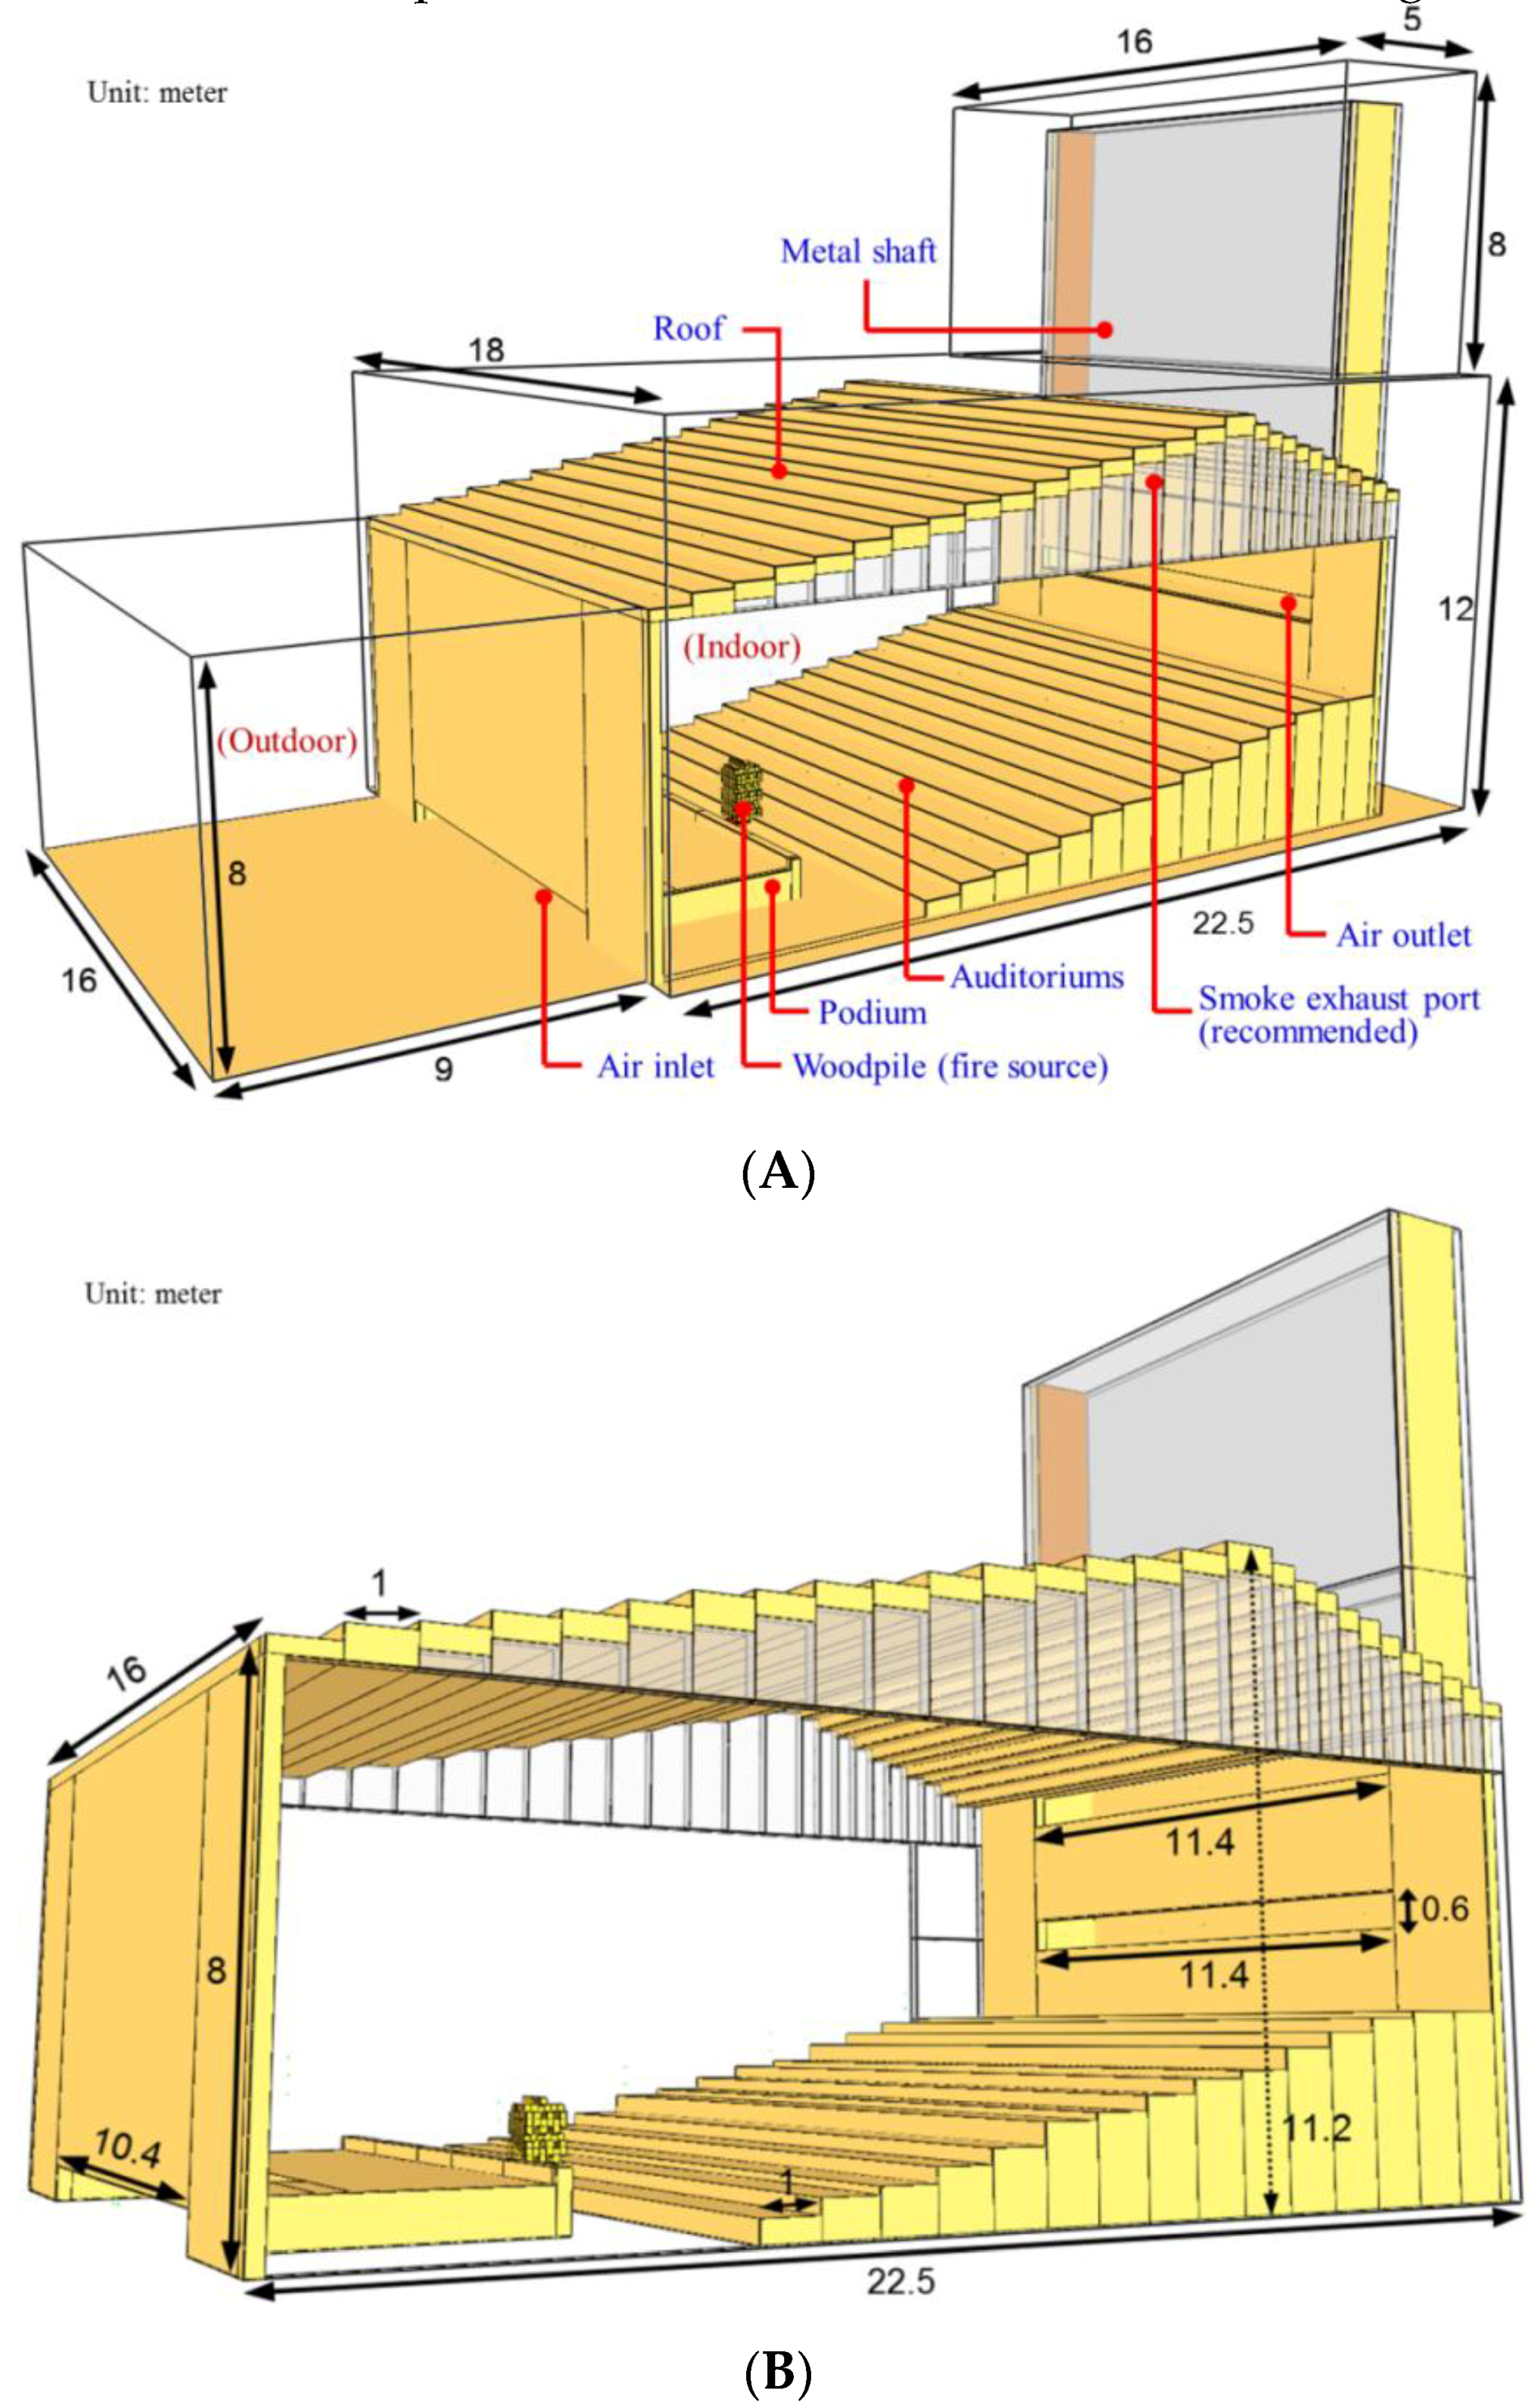
  • The model size was 31.5 m (length) × 16 m (width) × 12 m (height); the number of grid points was about 7.5 million. Please refer to Figure 6A–C for the size marking. The size of each opening under the platform was 1.8 m (width) × 0.4 m (height); the calculated hydraulic diameter (Dh) was about 0.65 m. The hydraulic diameter is multiplied by 14, about 9 m as exterior space; the air flow field will be the fully-developed flow.
  • As the combustible materials in the building were mostly wood, the fire occurred in front of the platform. The object on fire was a standard sized wood model; the extinguishment test refers to the Approval Directions for Fire Extinguisher released in Taiwan in July 2013.
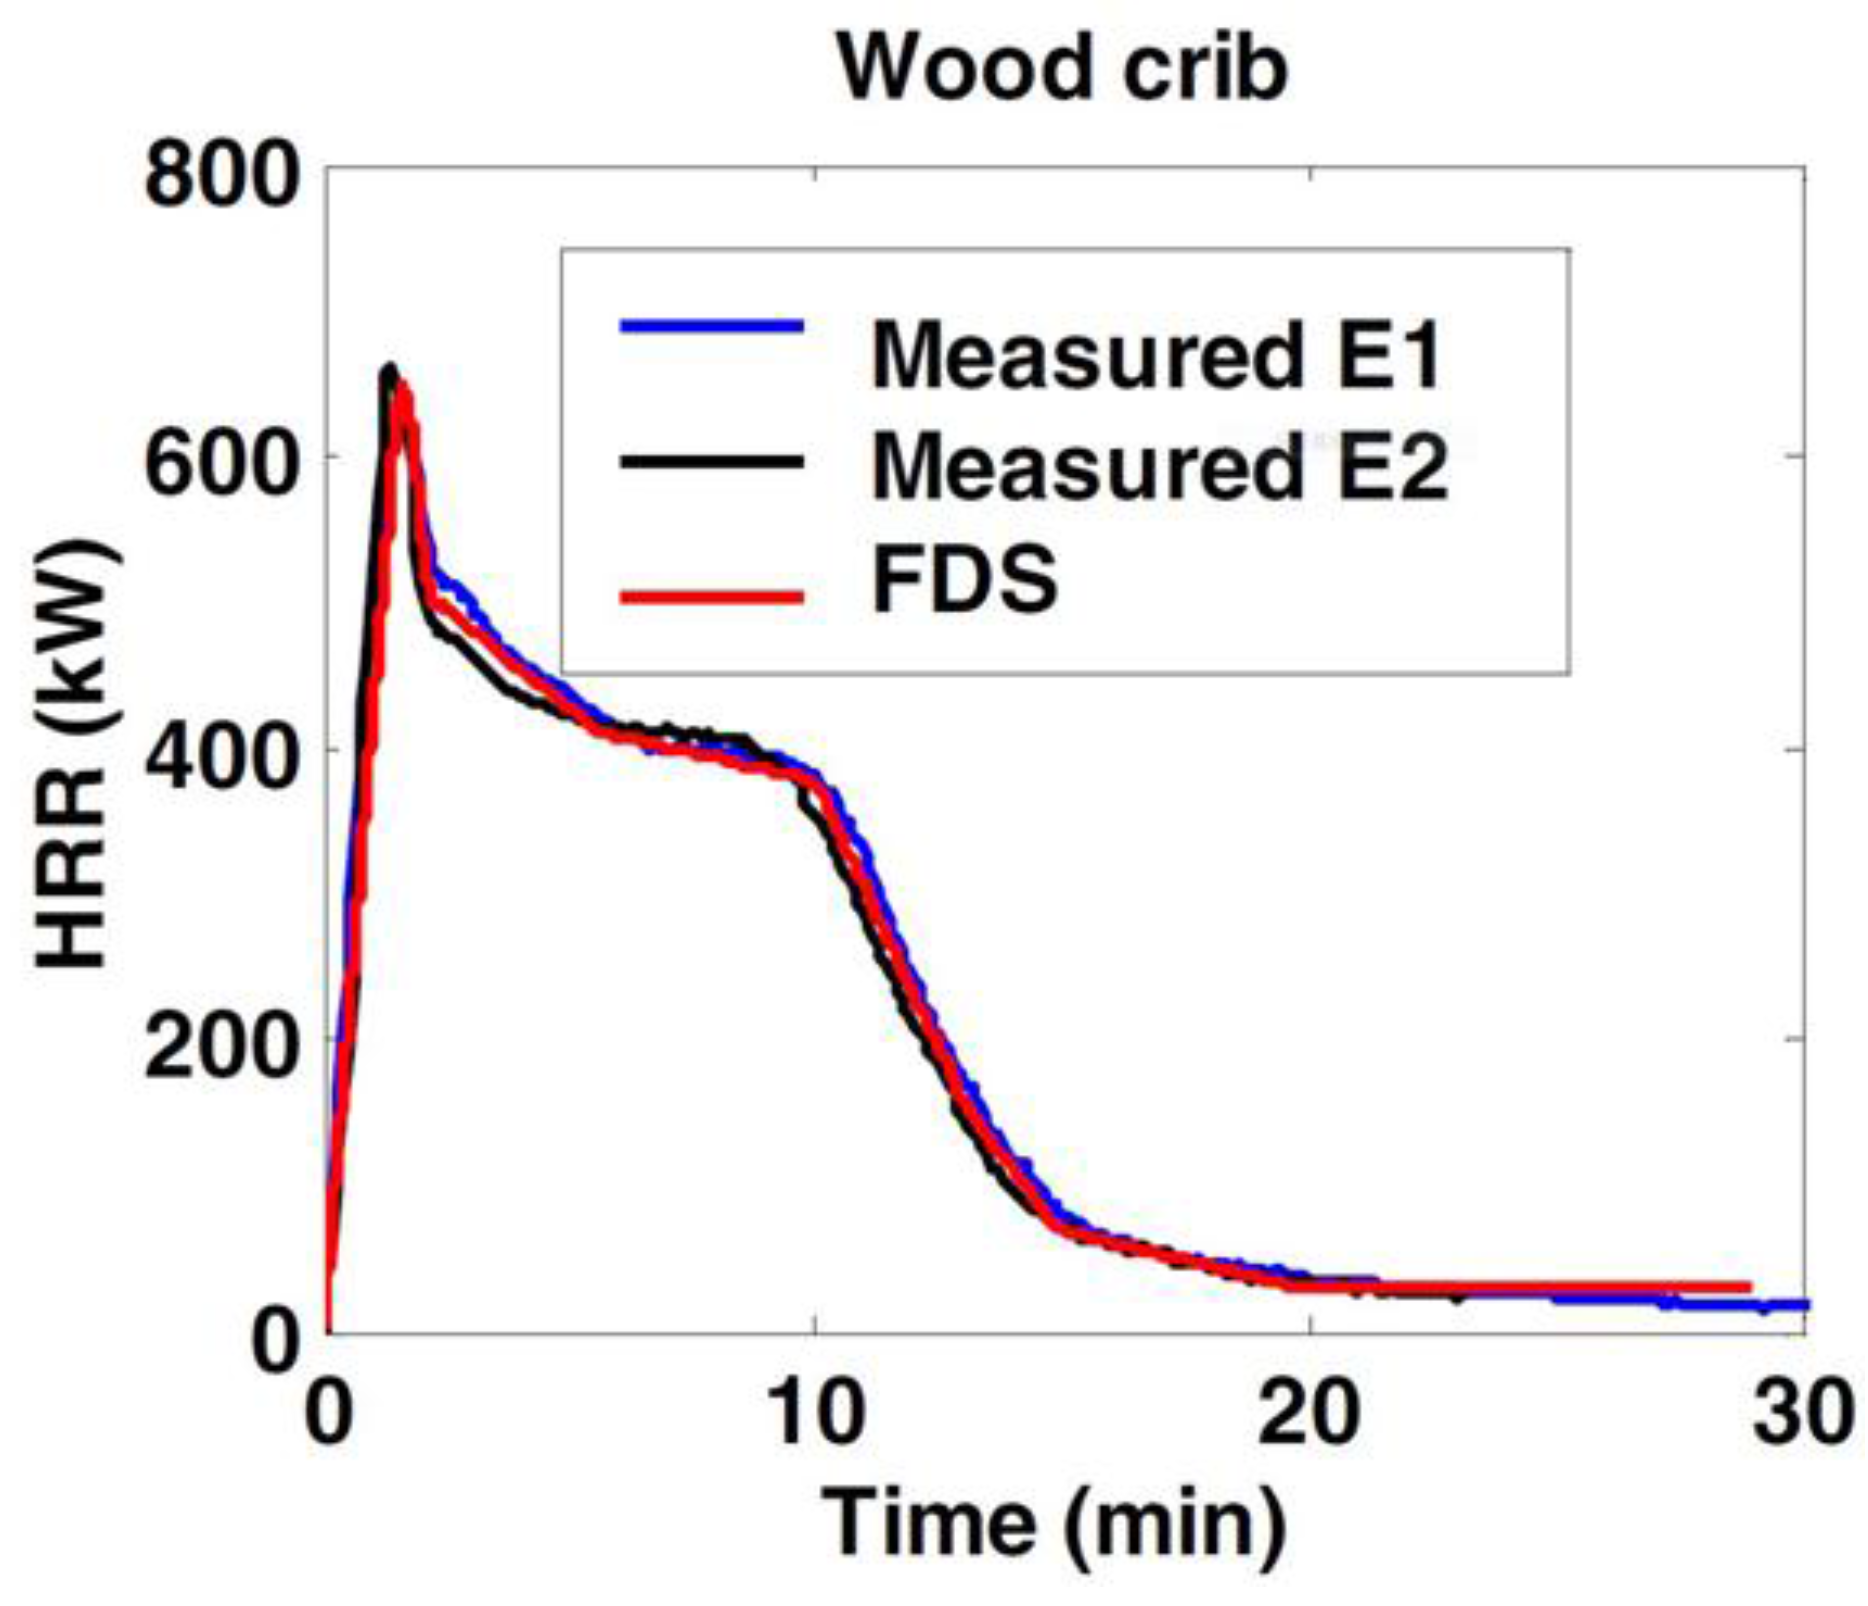
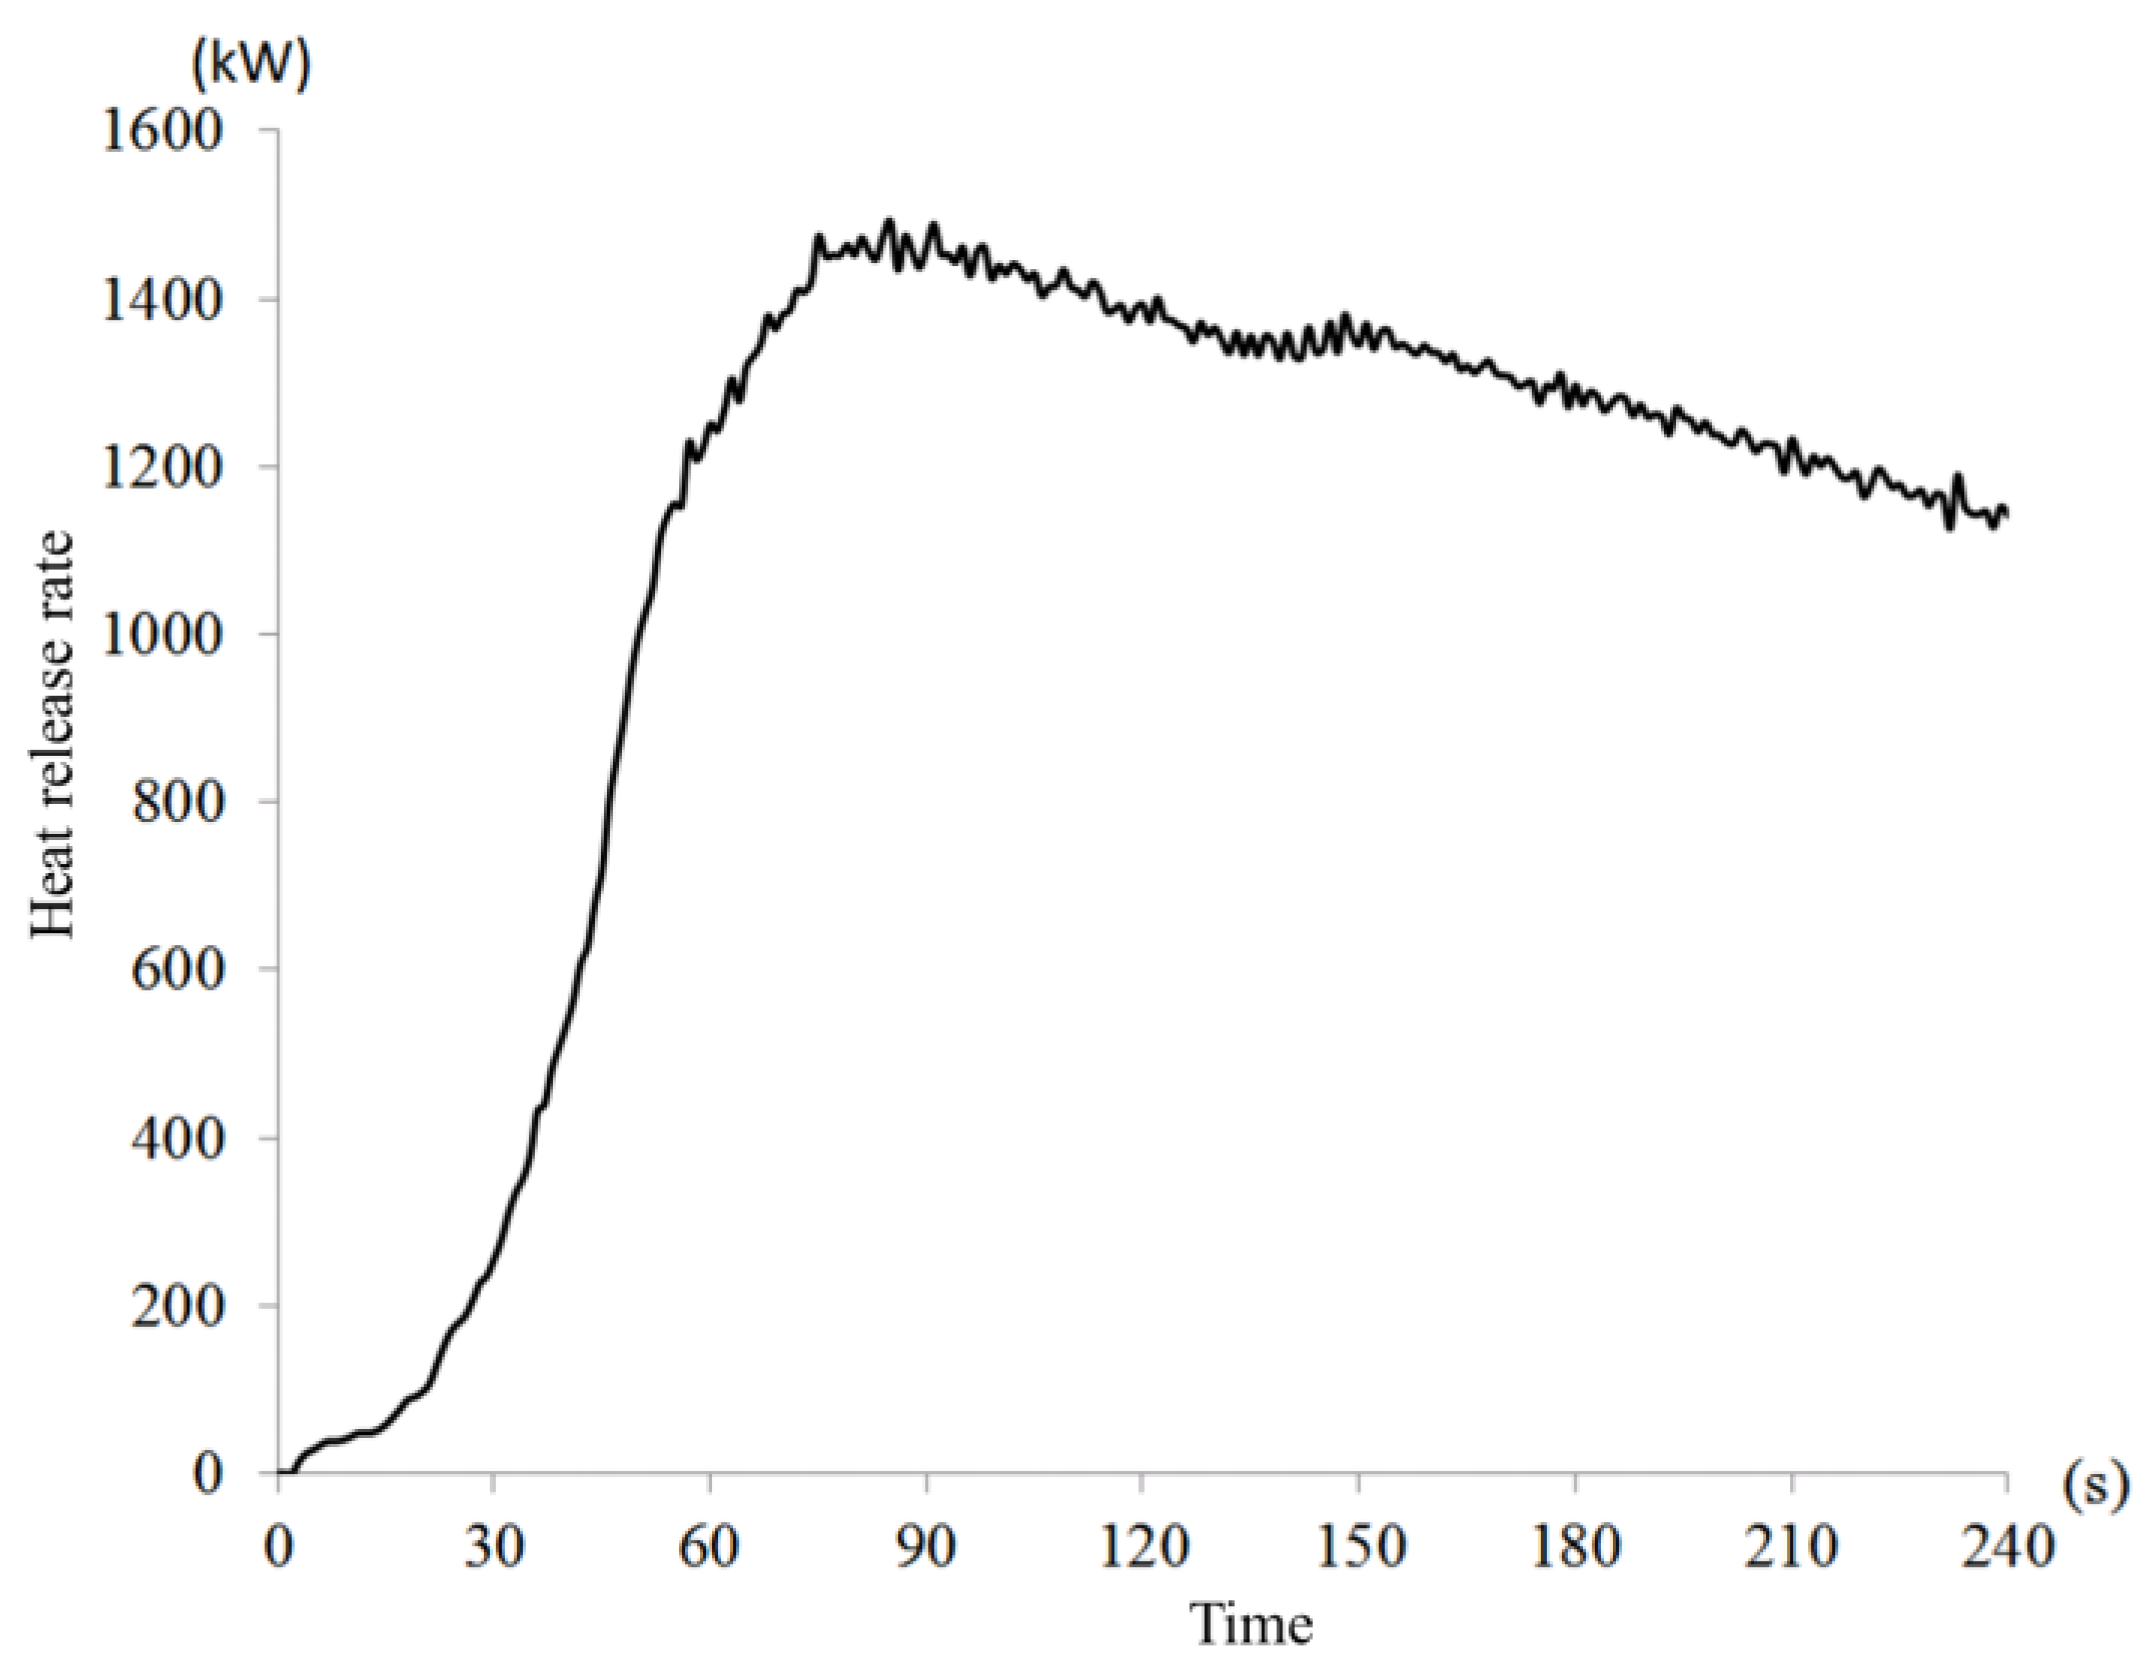
  • For the wood HRR combustion curve, the setup parameters refer to the test report of Valtion Teknillinen Tutkimuskeskus in 2007; the values are listed in Table 3.
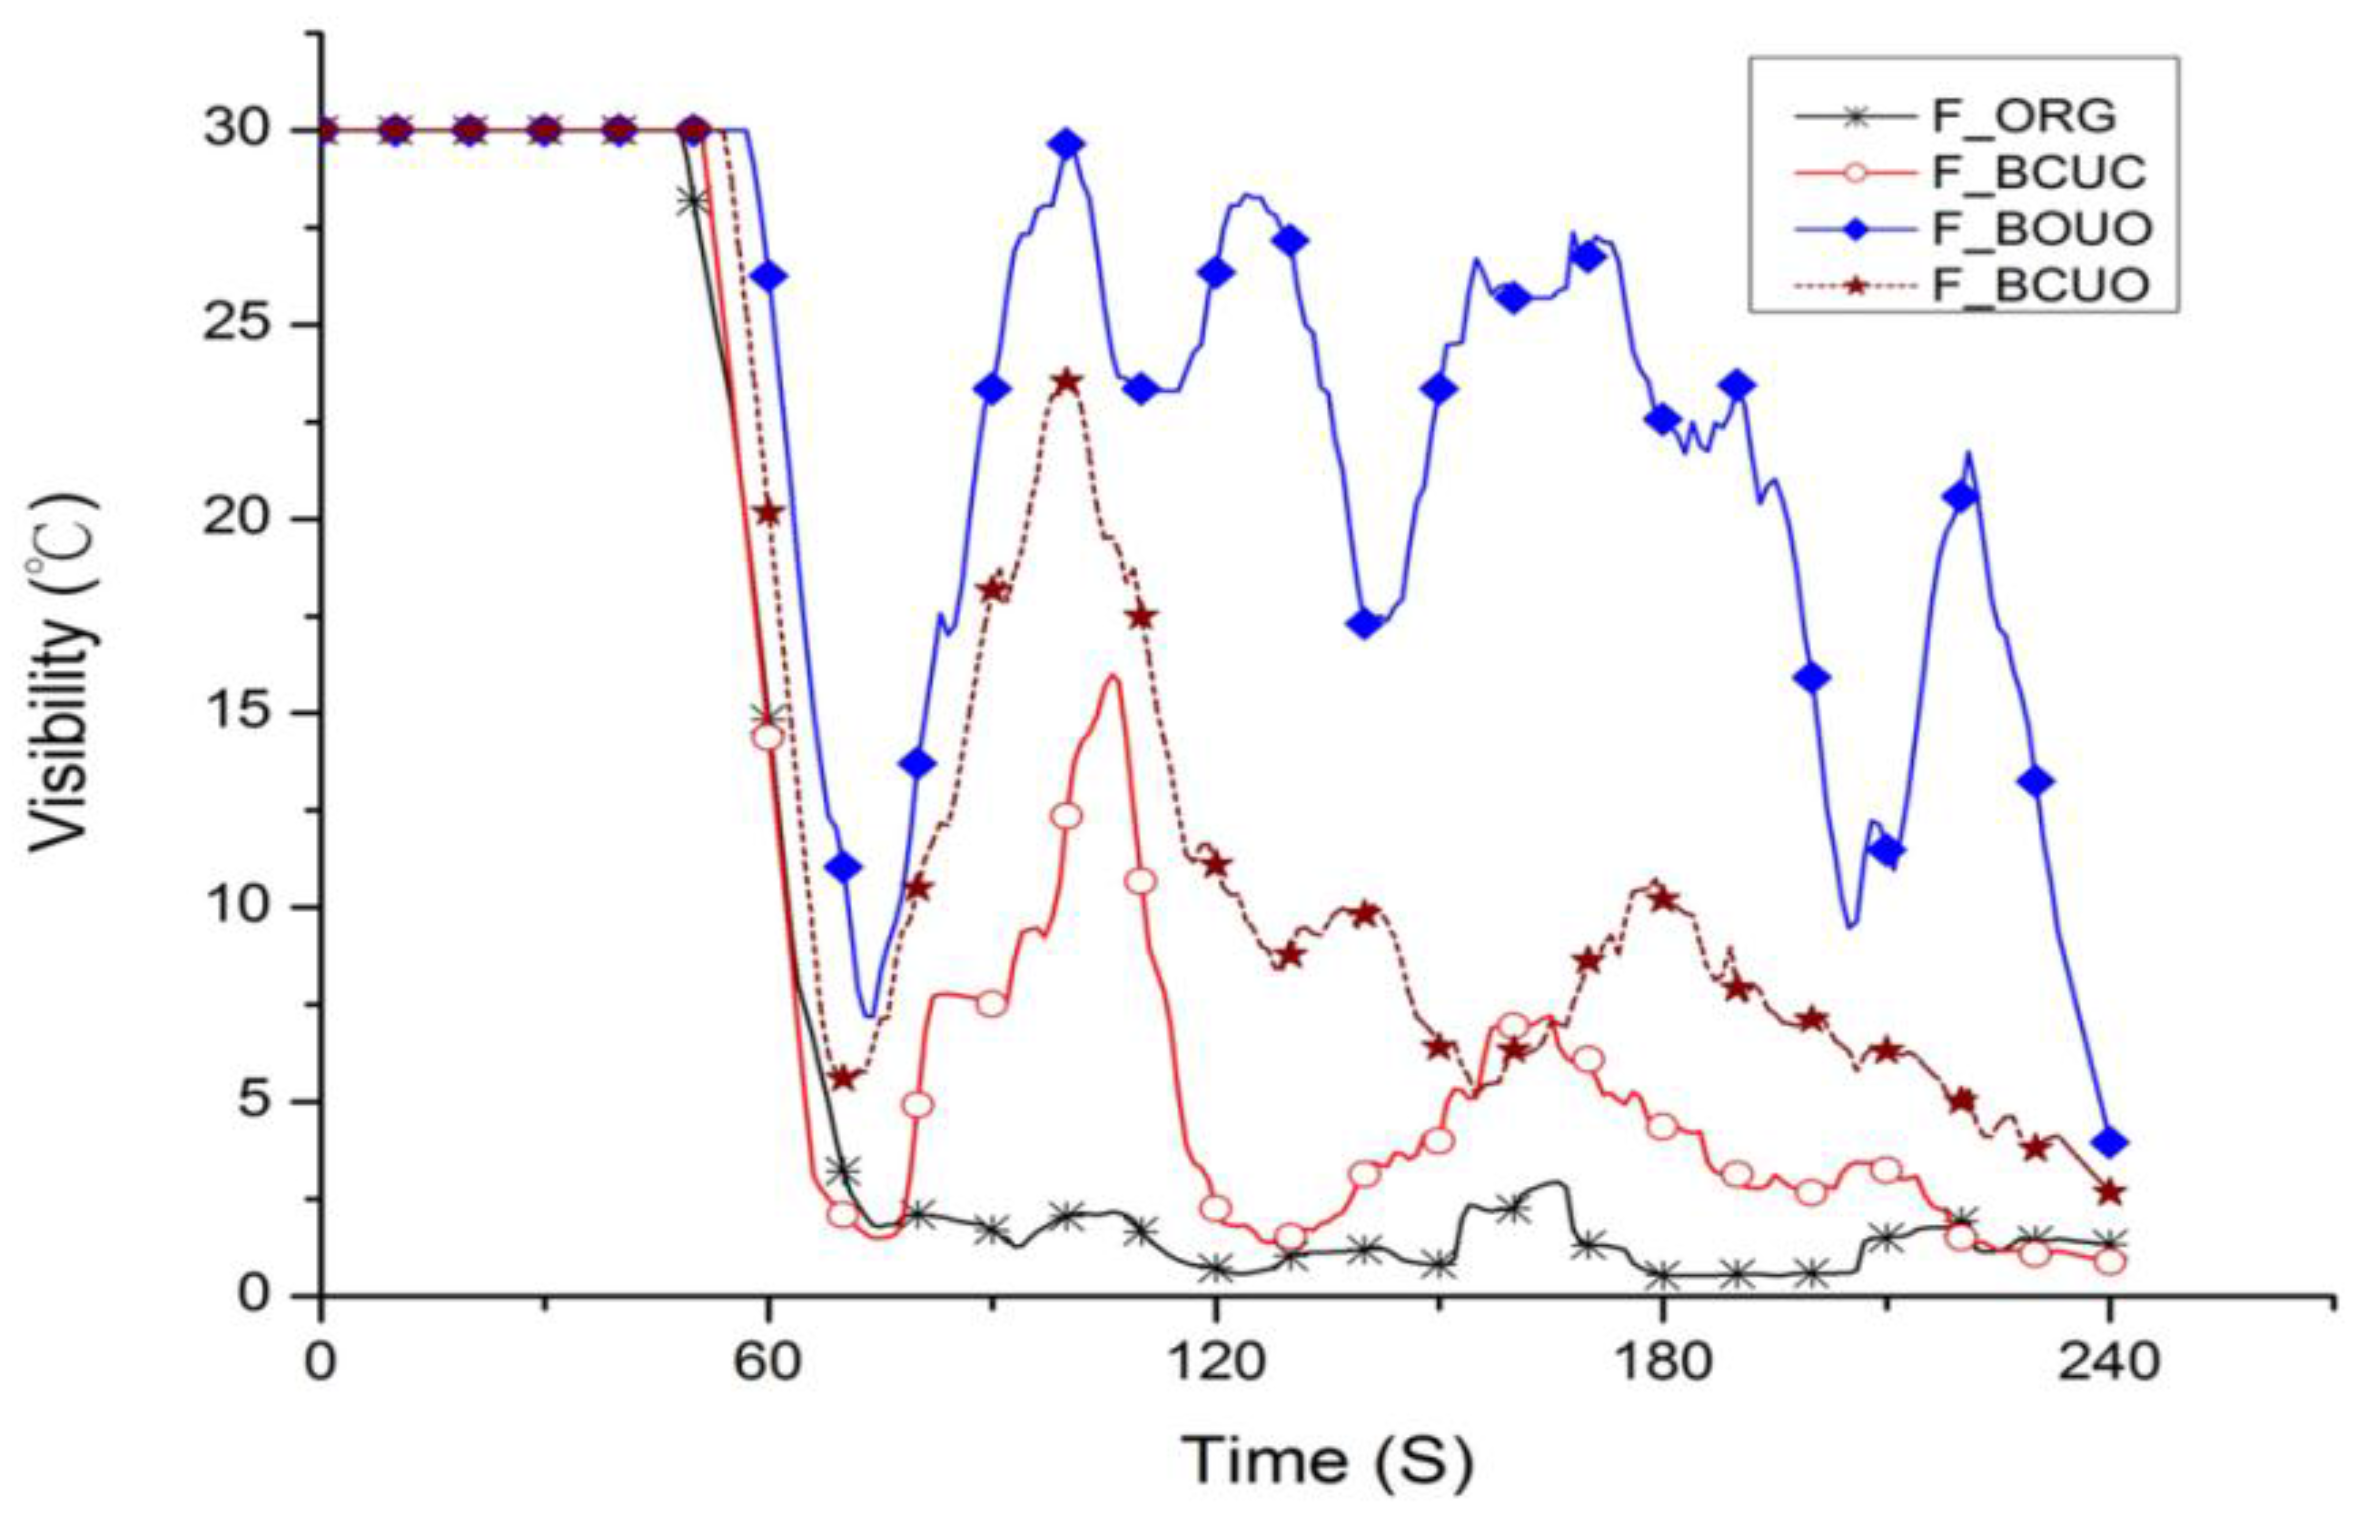
  • Considering the actual breathing position of the people in the building, the visibility of the smoke layer was measured at 1.8 m above the ground.
  • The temperature and visibility changes in the monitoring positions and the air flow variation at the tower’s top air outlet were recorded, as shown in Figure 7.
There were seven fire scenarios simulated for analysis. First, the indoor fire scenario when a fire occurs was simulated using the original indoor and outdoor environment conditions. Secondly, three improvement schemes were analyzed, each aiming at the least change, as described below:
  • The first mode involves the effect on the indoor fire scenario when the air inlet under the platform is closed.
  • In the second mode, a 0.8 m (H) × 11.2 m (W) smoke exhaust port is opened above the back wall. The indoor smoke is exhausted through the rear metal shaft when the fire occurs. The area is 9.12 m2, accounting for about 2.5% of the total floor area. The bottom of the opening is within 80 cm of the top of the wall. The air inlet is designed with reference to Taiwan’s fire prevention code. According to specifications, if natural smoke extraction is used, the smoke exhaust port area should be at least 2% of the total floor area.
  • In the third mode, the air inlet under the platform is closed, so the smoke emission effect of the upper smoke exhaust port and lower air outlet in the back wall can be analyzed.
The effect of the outside air flow is then determined. When the outside air velocity increases from 1.5 m/s (defined as Light Air on the Beaufort scale) to 3.3 m/s (defined as a Light Breeze on the Beaufort scale), the effect on the indoor fire is analyzed. As the natural inflow phenomenon is similar to the make-up effect, the fire scenario when only one air inlet is opened is also discussed. The No. 2 air inlet is opened, and then the No. 3 air inlet is opened. The various scenarios are described in Table 4.

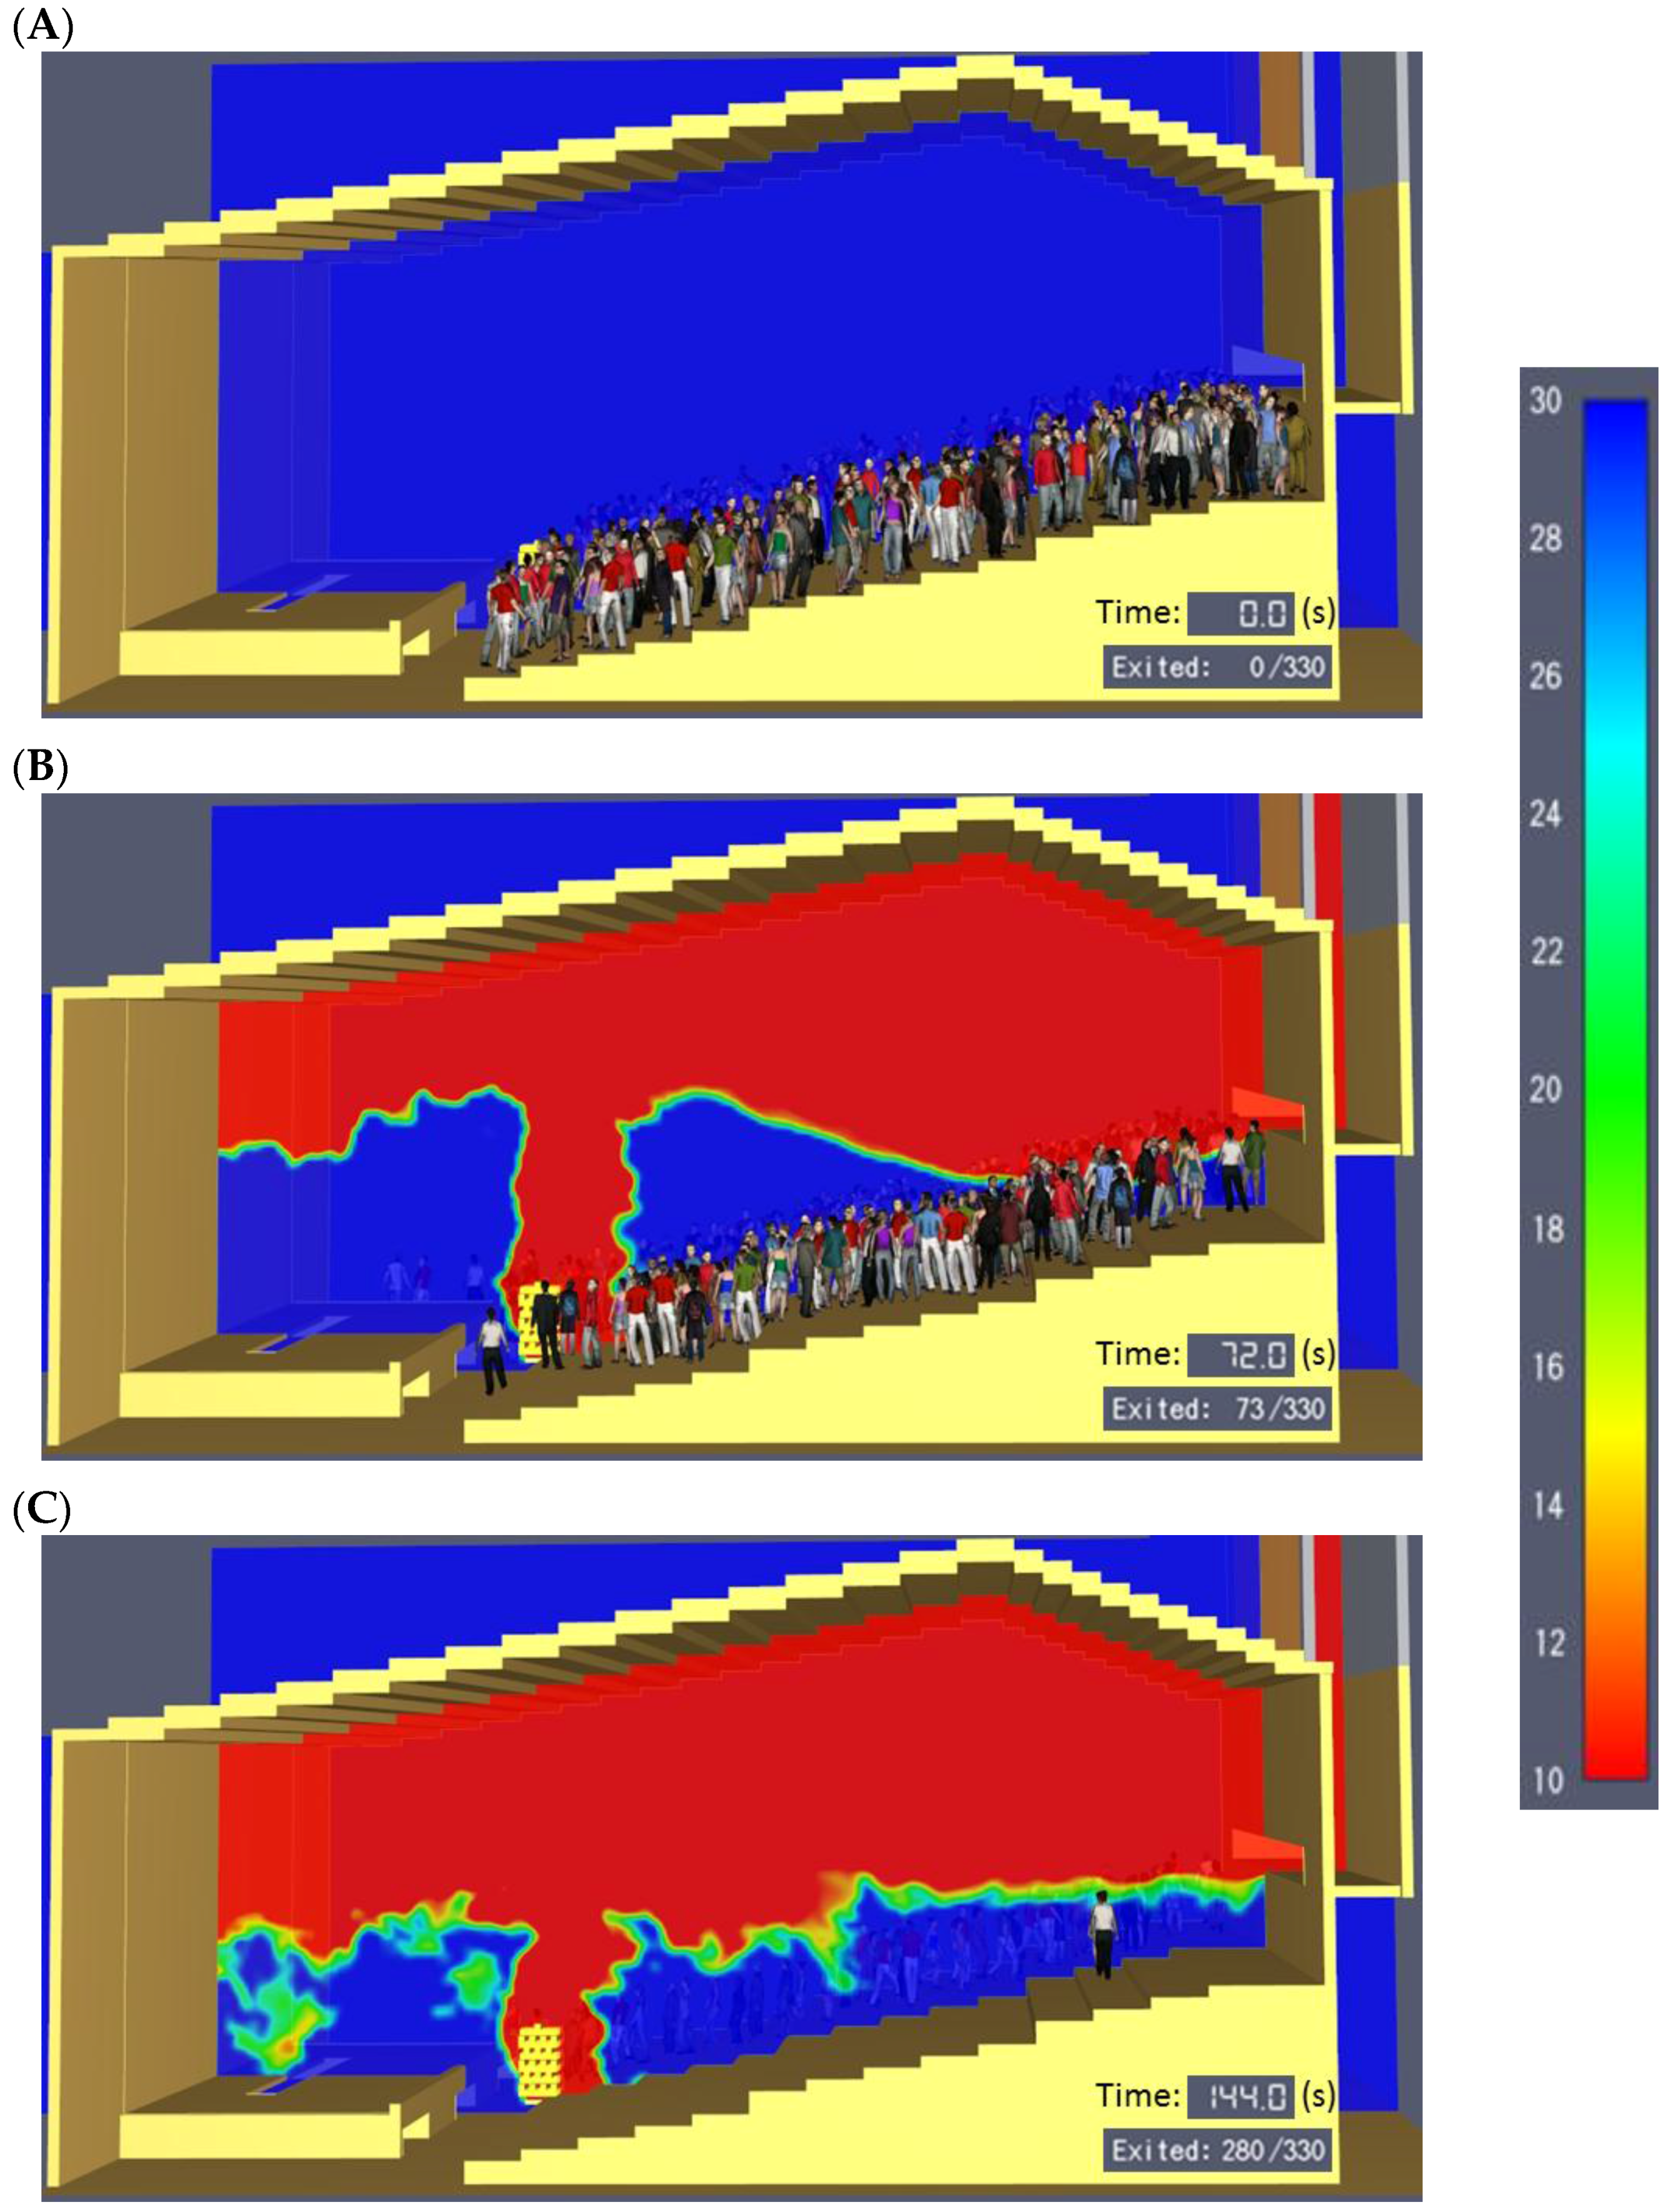
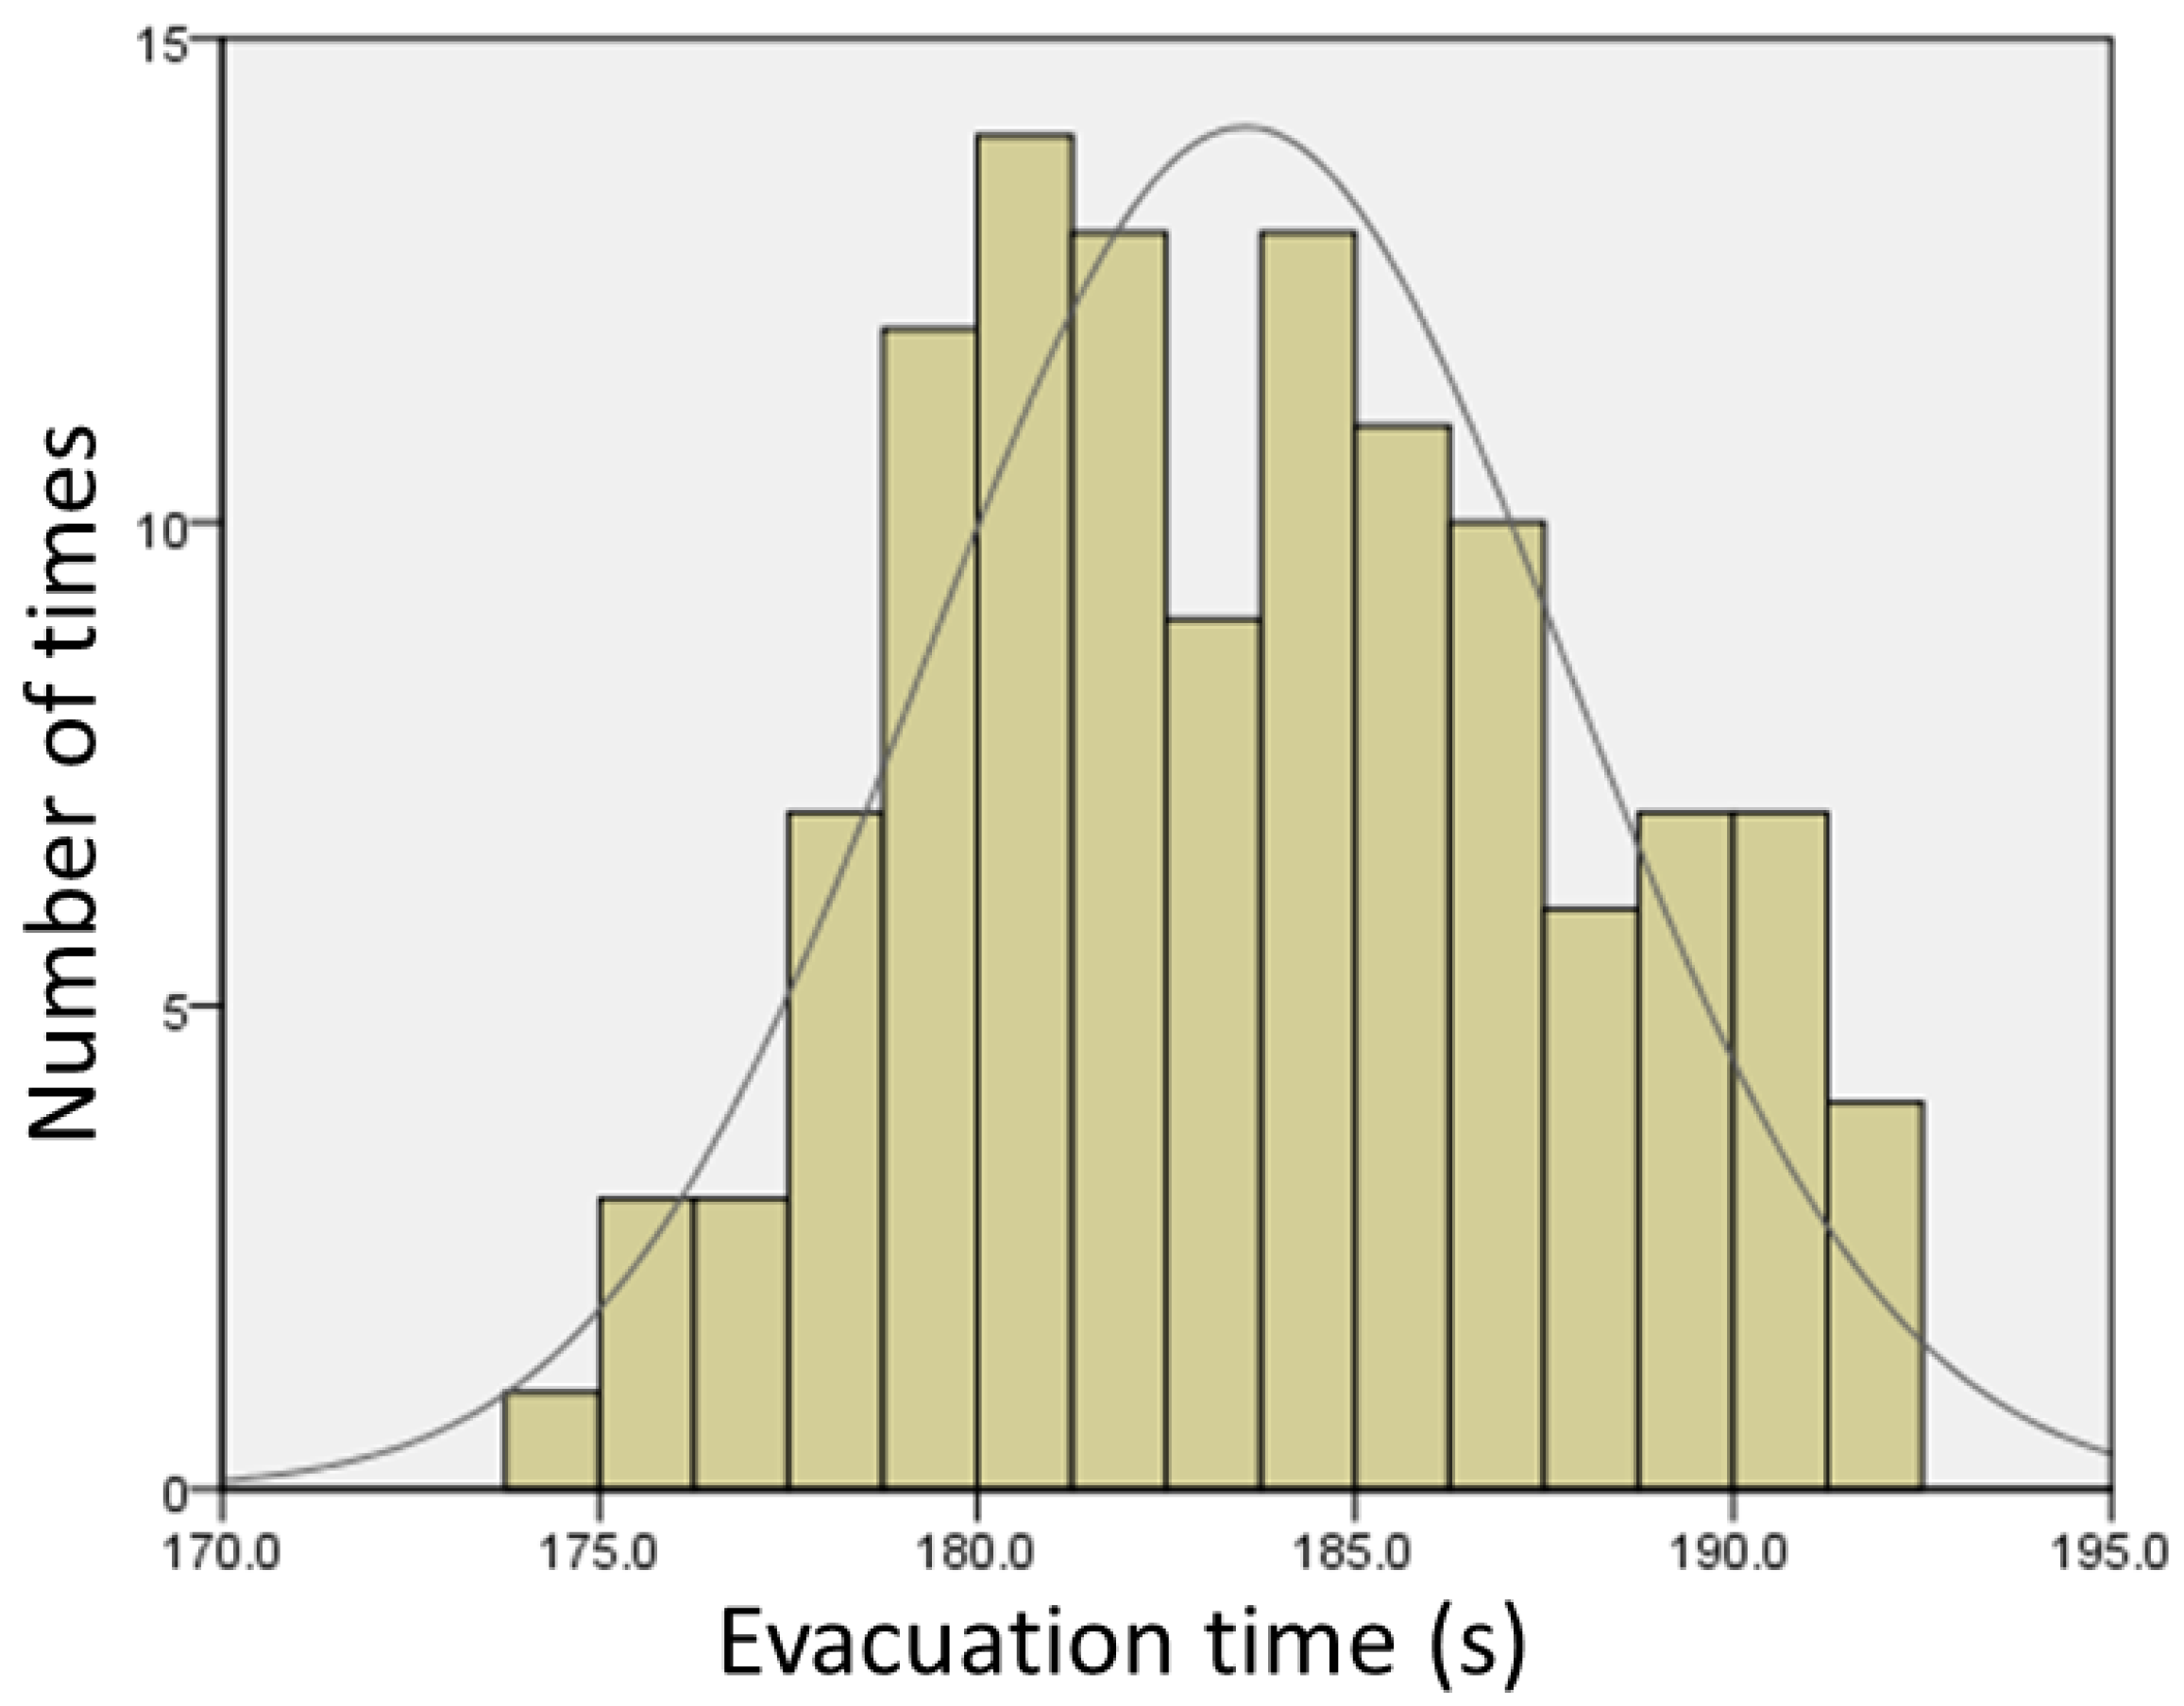
4.4. Evacuation Time under the Original Status of the Room

Since the evacuation process in a room is a complex and stochastic phenomenon, Averill determined five major challenges in the multidisciplinary field of pedestrian and evacuation dynamics (PED) in 2010 [44]. This study conducted an analysis model under the original status of the target room using professional software, Pathfinder, to predict the evacuation process of the occupants. The analysis of the maximum evacuation time is one of crucial factors to provide the effectiveness evaluation of various enhancement measurements on fire safety.
Pathfinder is an emergency evacuation simulator, which includes an integrated user interface and three-dimensional animation. Evacuation time contains two main stages: Pre-movement time, and Travel time [45,46], as shown in Equation (7).
tevac = tPMT + ttrav
Herein,
tevac: Evacuation time (s);
tPMT: Pre-movement time, the time between that when everyone realized an emergency situation and that when they begin to move toward the general exports or emergency exits (s);
ttrav: Travel time, the time required for occupants to move to a safe area.
The parameter of the evacuation model under the original status of the room is listed in Table 5. According to Purser’s study results, Pre-movement time is set to occupants hear the fire alarm sounds and then confirm whether the fire occurred. The former time is between 15 and 20 s, with an average of 17 s. The latter time is between 17 and 40 s, with an average time of 29 s. Therefore Pre-movement time in this study was set from 32 to 60 s [45].
Pathfinder has the ability to display a wide range randomness of the evacuation process in a building for possessing powerful features. In this study, the evacuation simulation has been carried out 120 times and the results were analyzed in order to obtain the maximum evacuation time. Figure 8 shows the distribution of stochastic simulation results.
Color scale on the right indicates the visibility. The exited number in the lower right corner of each figure represents the number of people have left this room. The occupancy capacity is 330 persons according to the official information.
The study executed the modeling and analysis through Pathfinder to obtain the maximum evacuation time. The results showed the maximum evacuation time people completely leave the room was 183.5 s. The people evacuation situation at different time points for the original status is shown in Figure 9.

4.5. Measurement Points and Evaluated Period

In order to record the spreading of the heat and smoke at the fire scenario, the recording positions were in the central auditorium and at 1.8 m on the rear platform, defined as points D and R, respectively. The evacuated persons will pass by the two points that are in the aisle. The observation lays stress on the point R near the back door.
Since the maximum evacuation time obtained through Pathfinder was 183.5 s (approximately 3 min), the risk analysis of early and extended time were conducted. Therefore, this study focused on the indoor situation of the room from 60 s to 240 s after fire initialization in each case to evaluate the dangers.

5. Results and Discussion

5.1. Natural Ventilation State

This study analyzed the temperature distribution of the indoor air flow under natural ventilation conditions. The set environmental conditions were as follows.
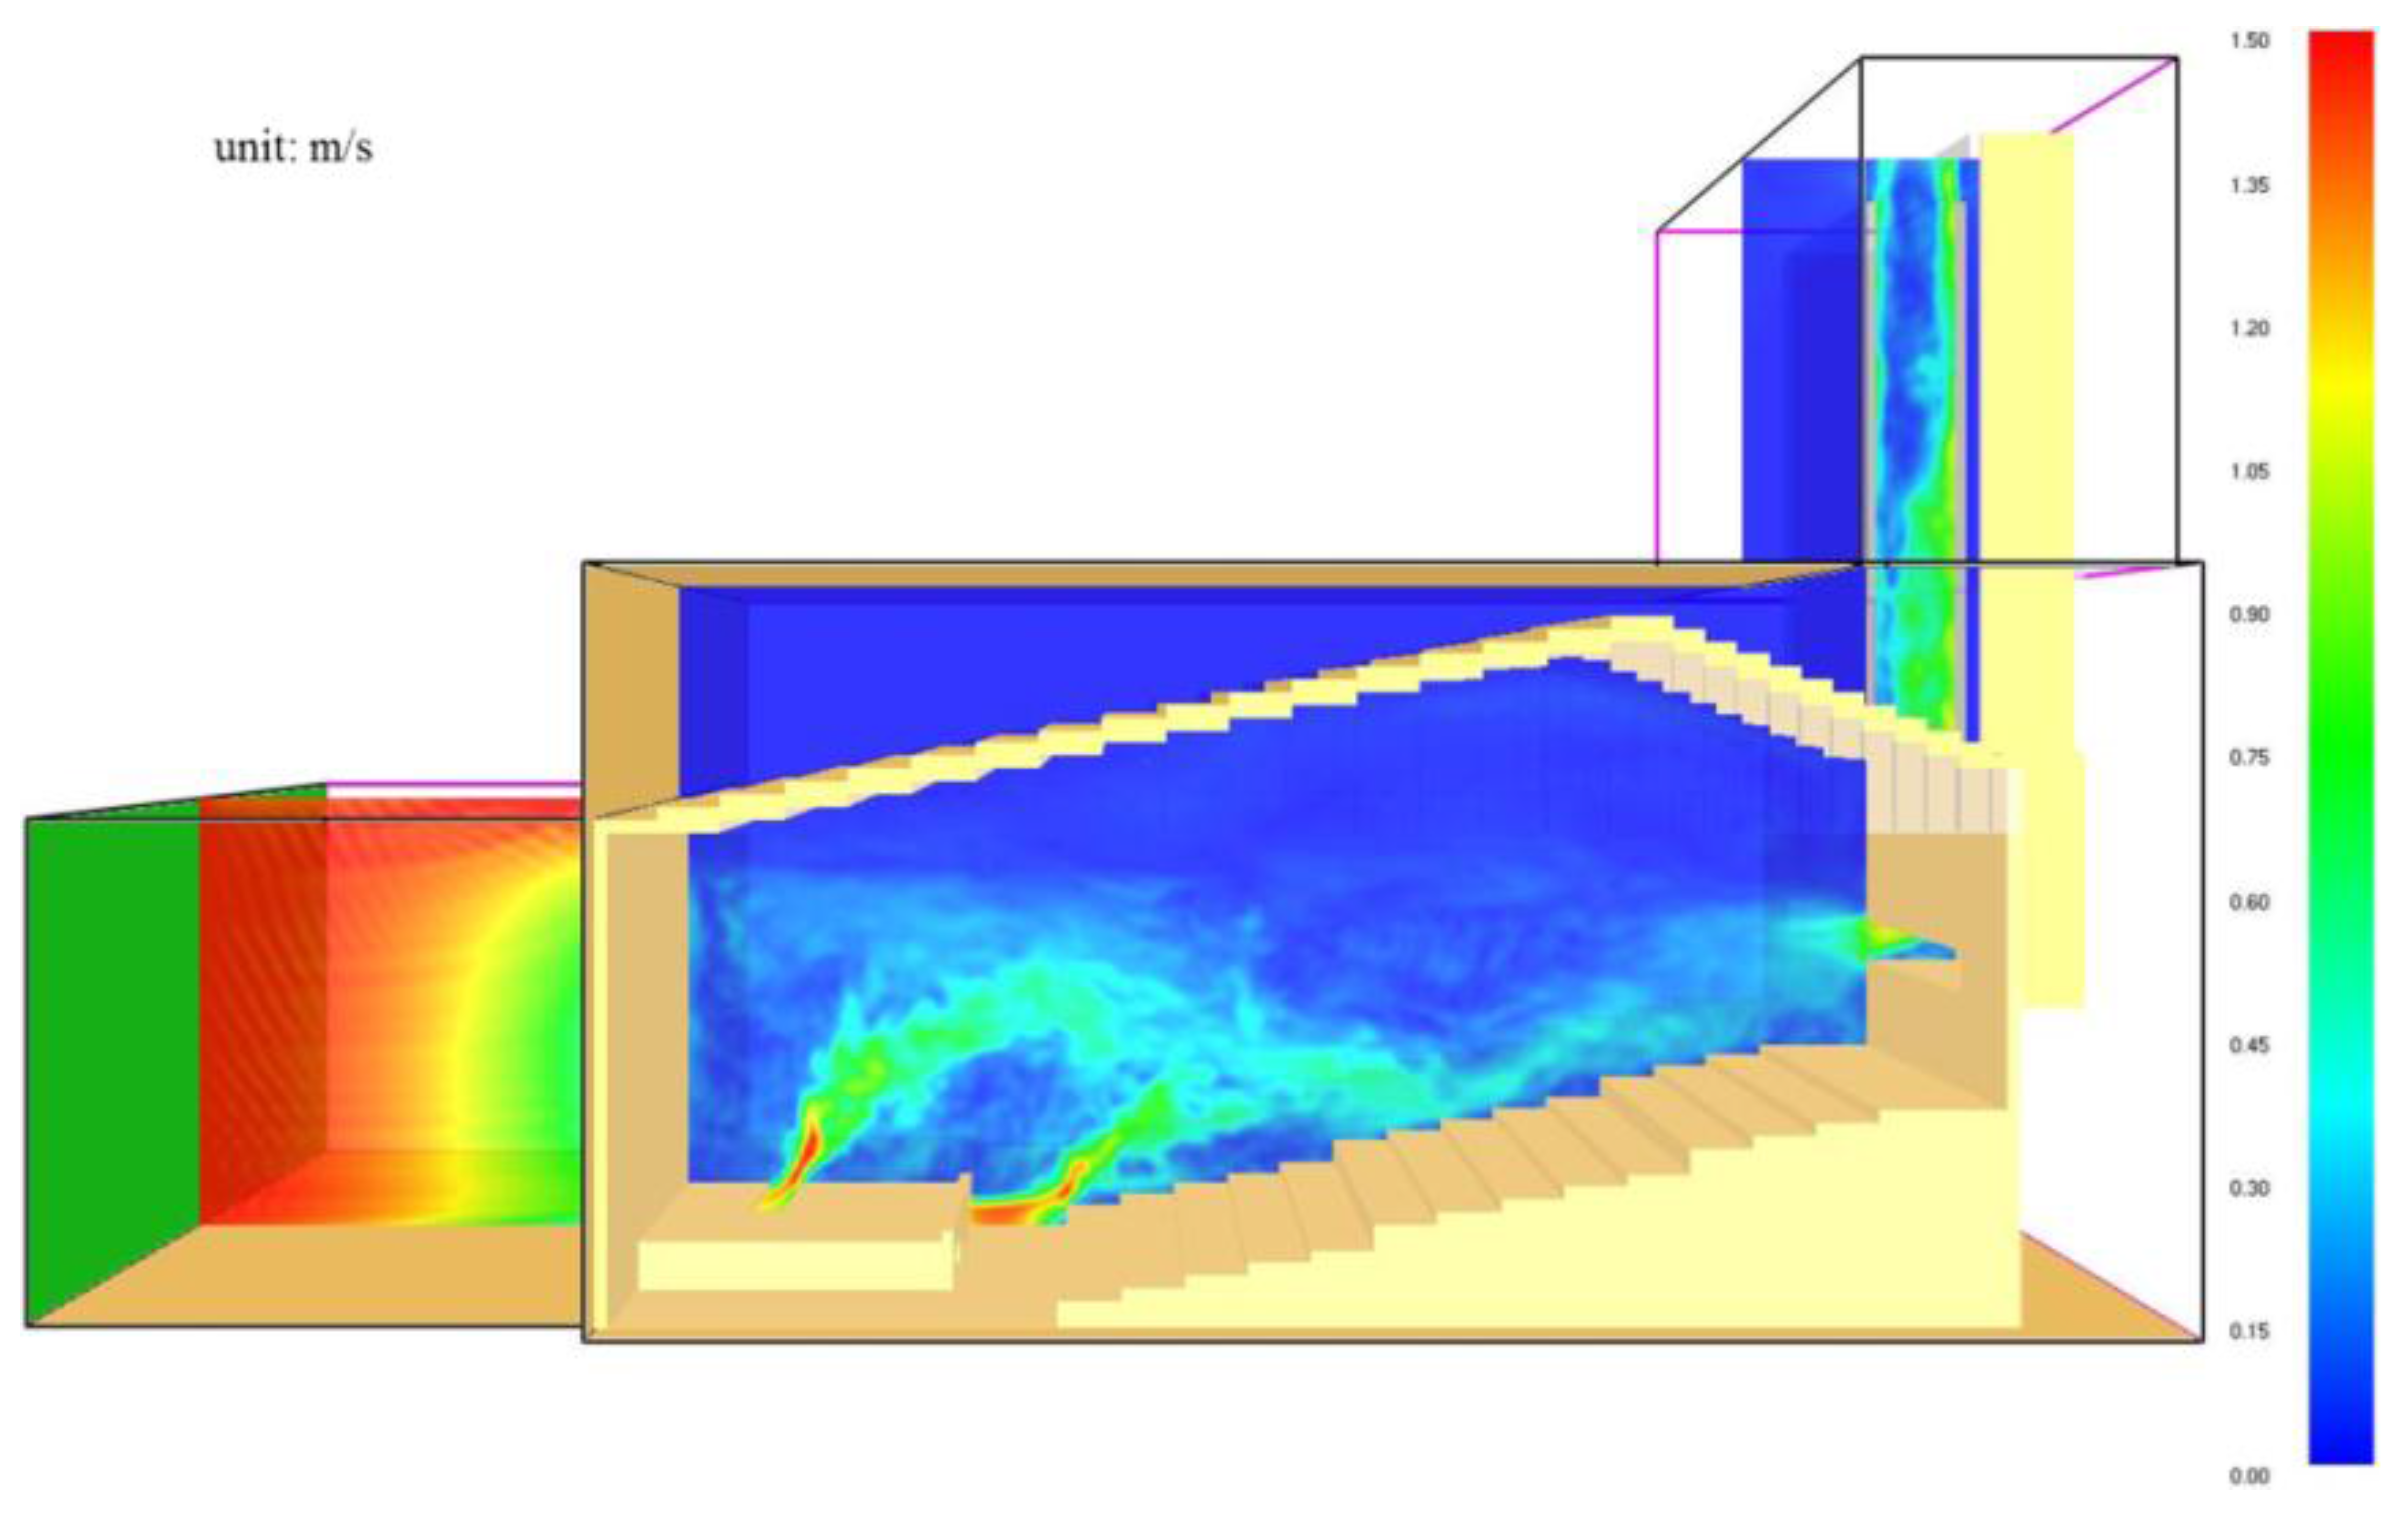
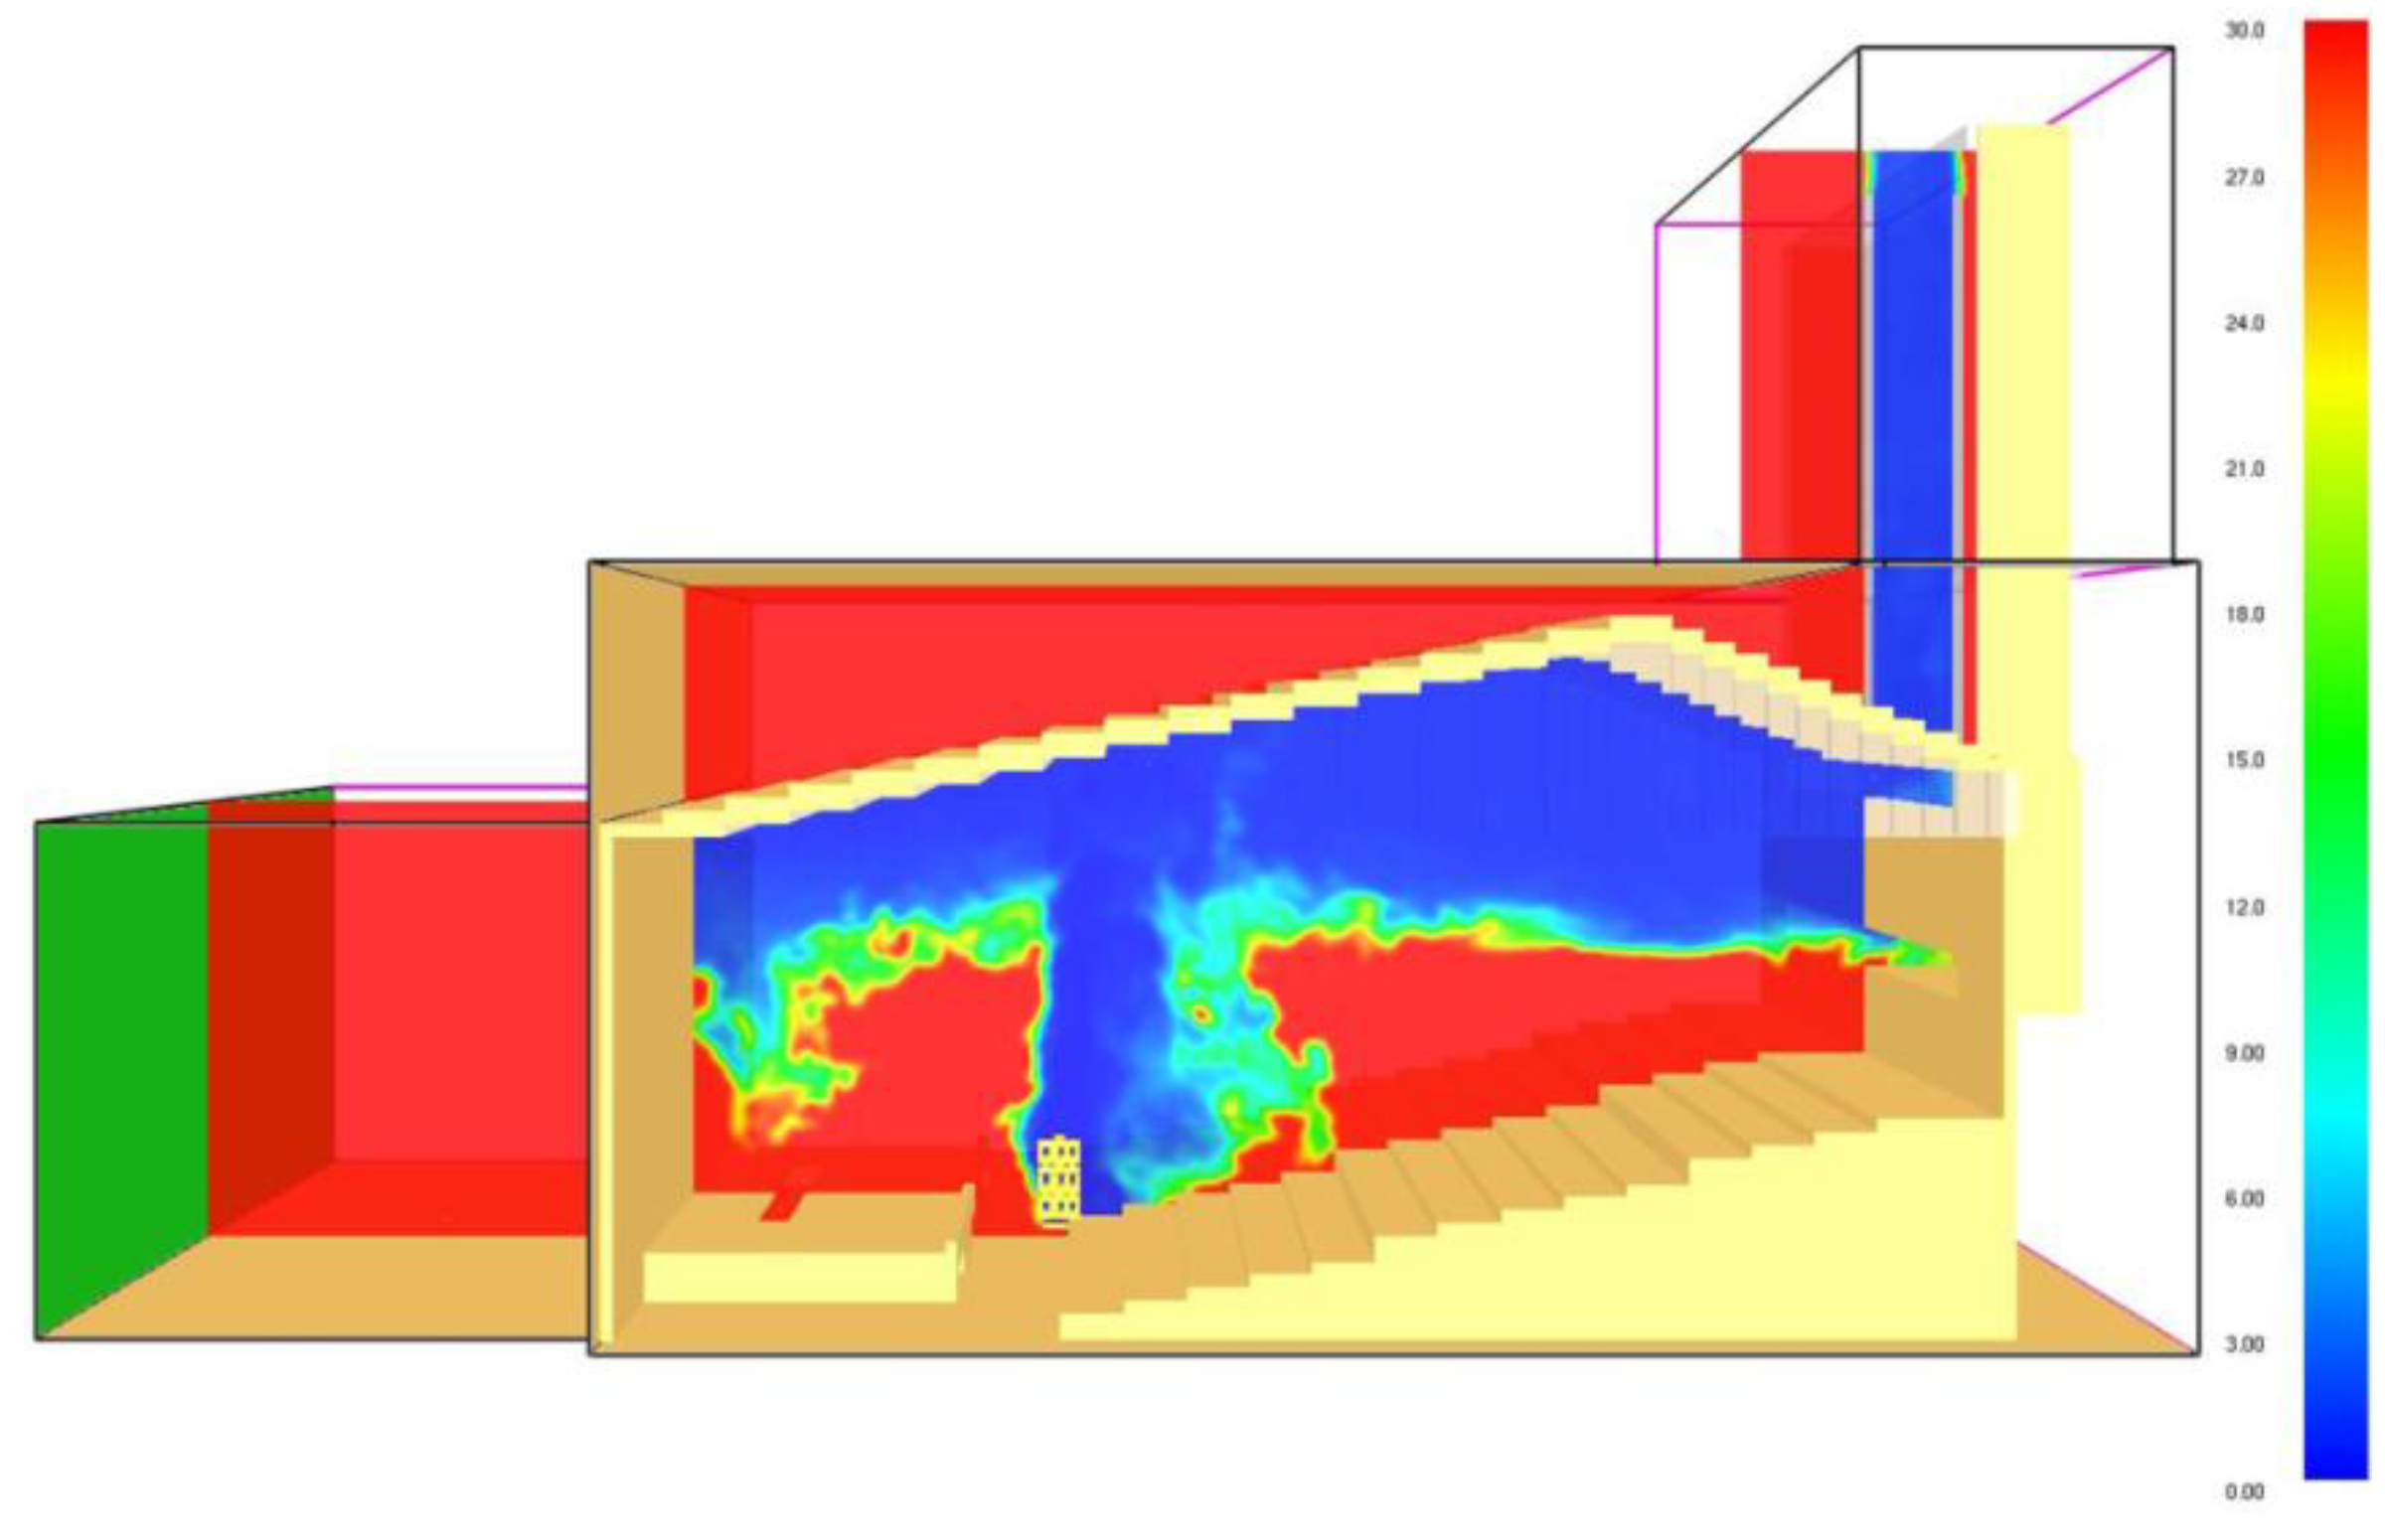
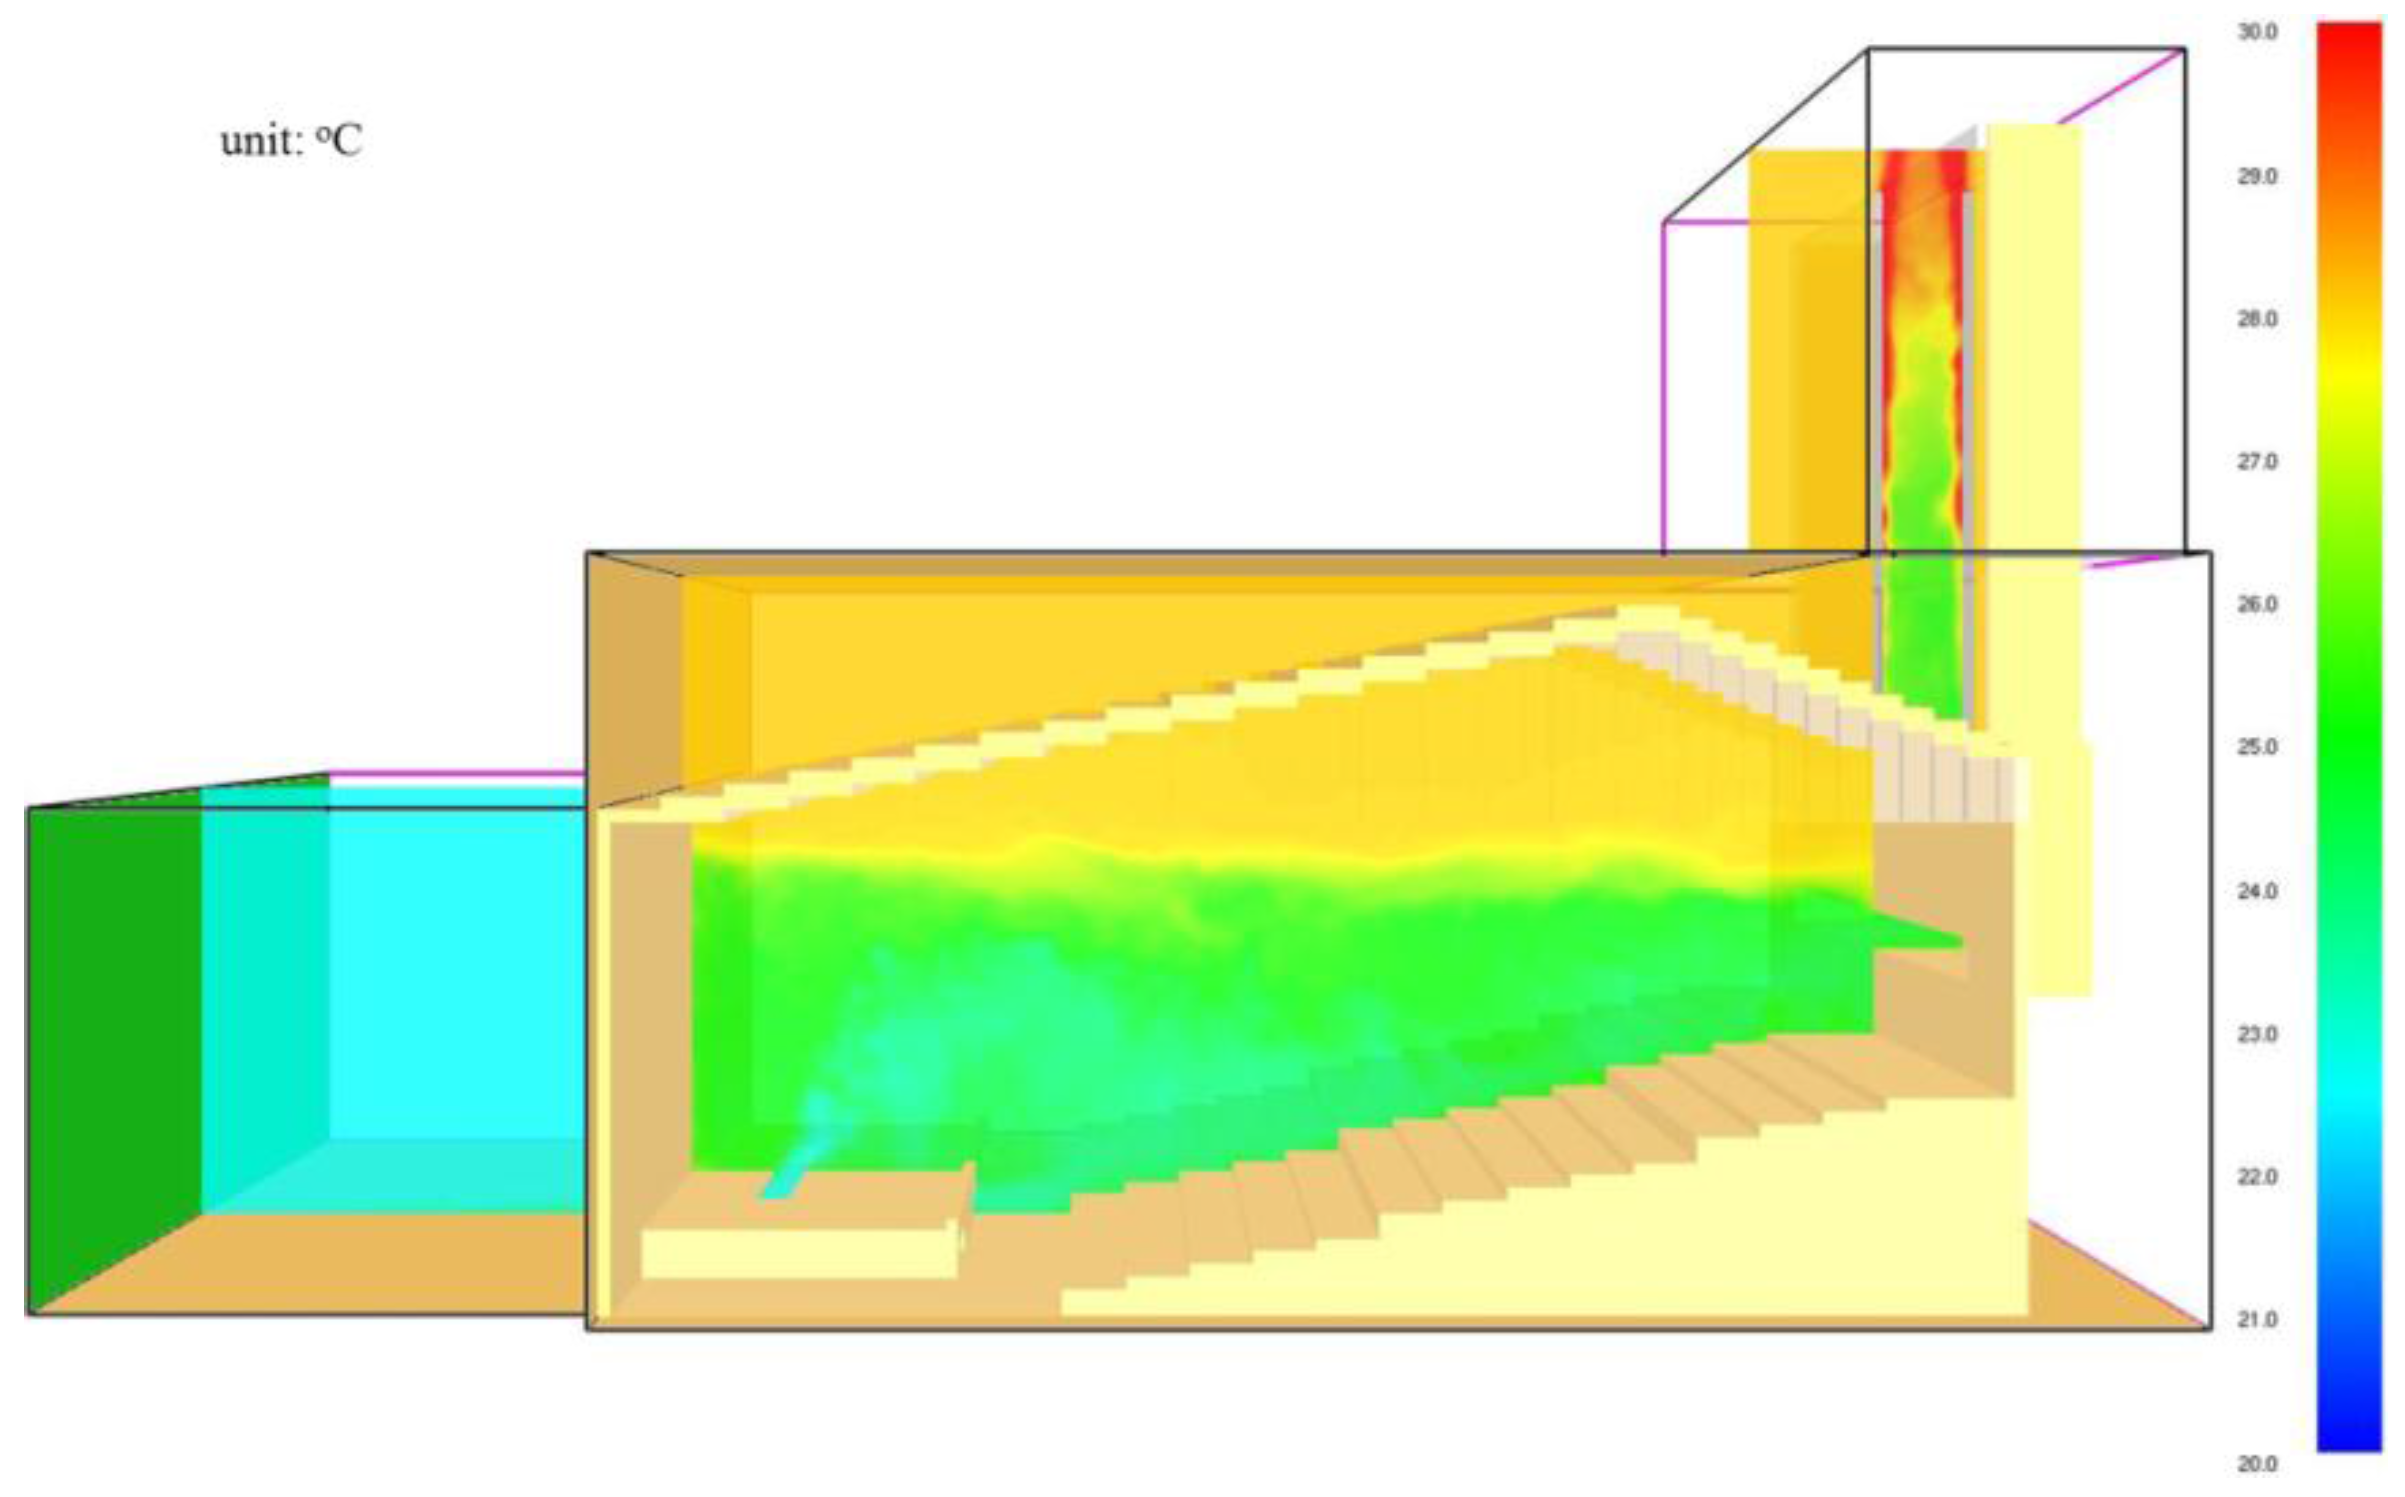
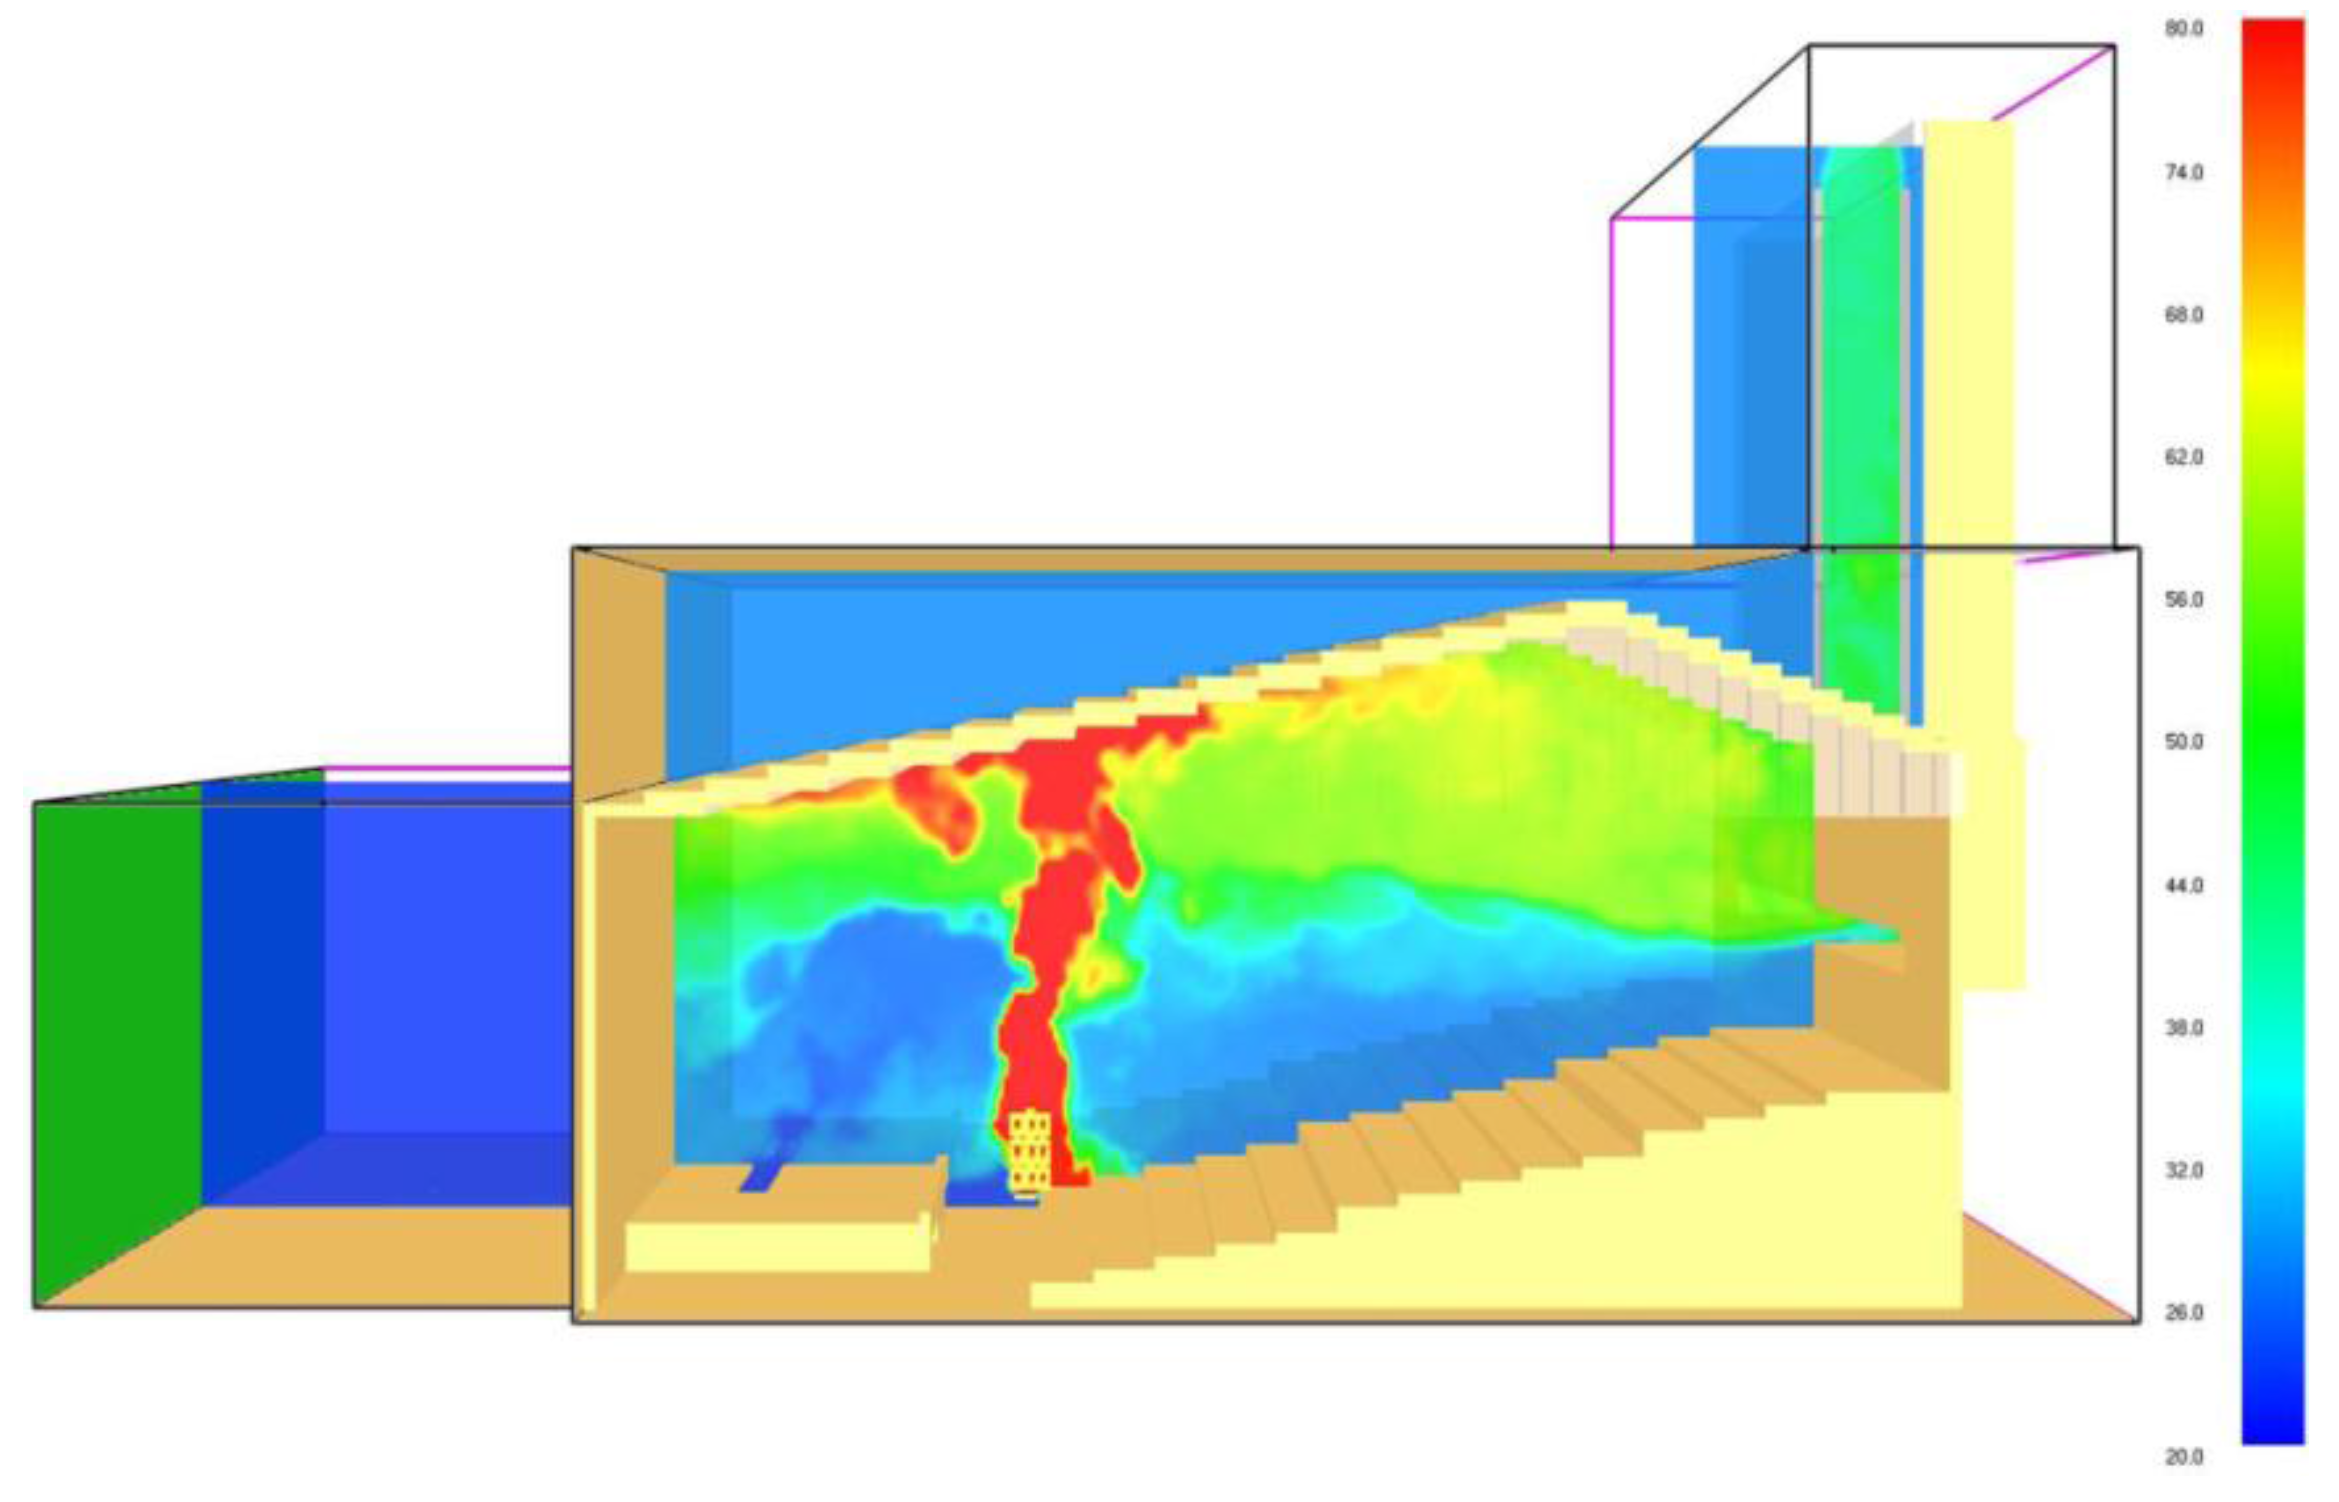
  • Considering the indoor steady state, the state of the indoor center section was captured after 240 s of simulation to analyze the indoor condition. Figure 10 displays the temperature distribution. It was observed that the temperature stratification of the space was excellent. The upper part had a higher temperature of above 27.5 °C, while the lower seats, which were influenced by natural wind, had a temperature of 23 to 26 °C.
  • The air flow distribution is shown in Figure 11. It was observed that the air flow pattern at the height of seats was that of air flowing in from the front platform and flowing out through the air outlet in the back wall. The air flow was obvious in the rear metal chimney, with a flow rate higher than 0.6 m/s.
The aforementioned temperature stratification effect showed that the indoor environment matched the design, resulting in an acceptable human comfort level.

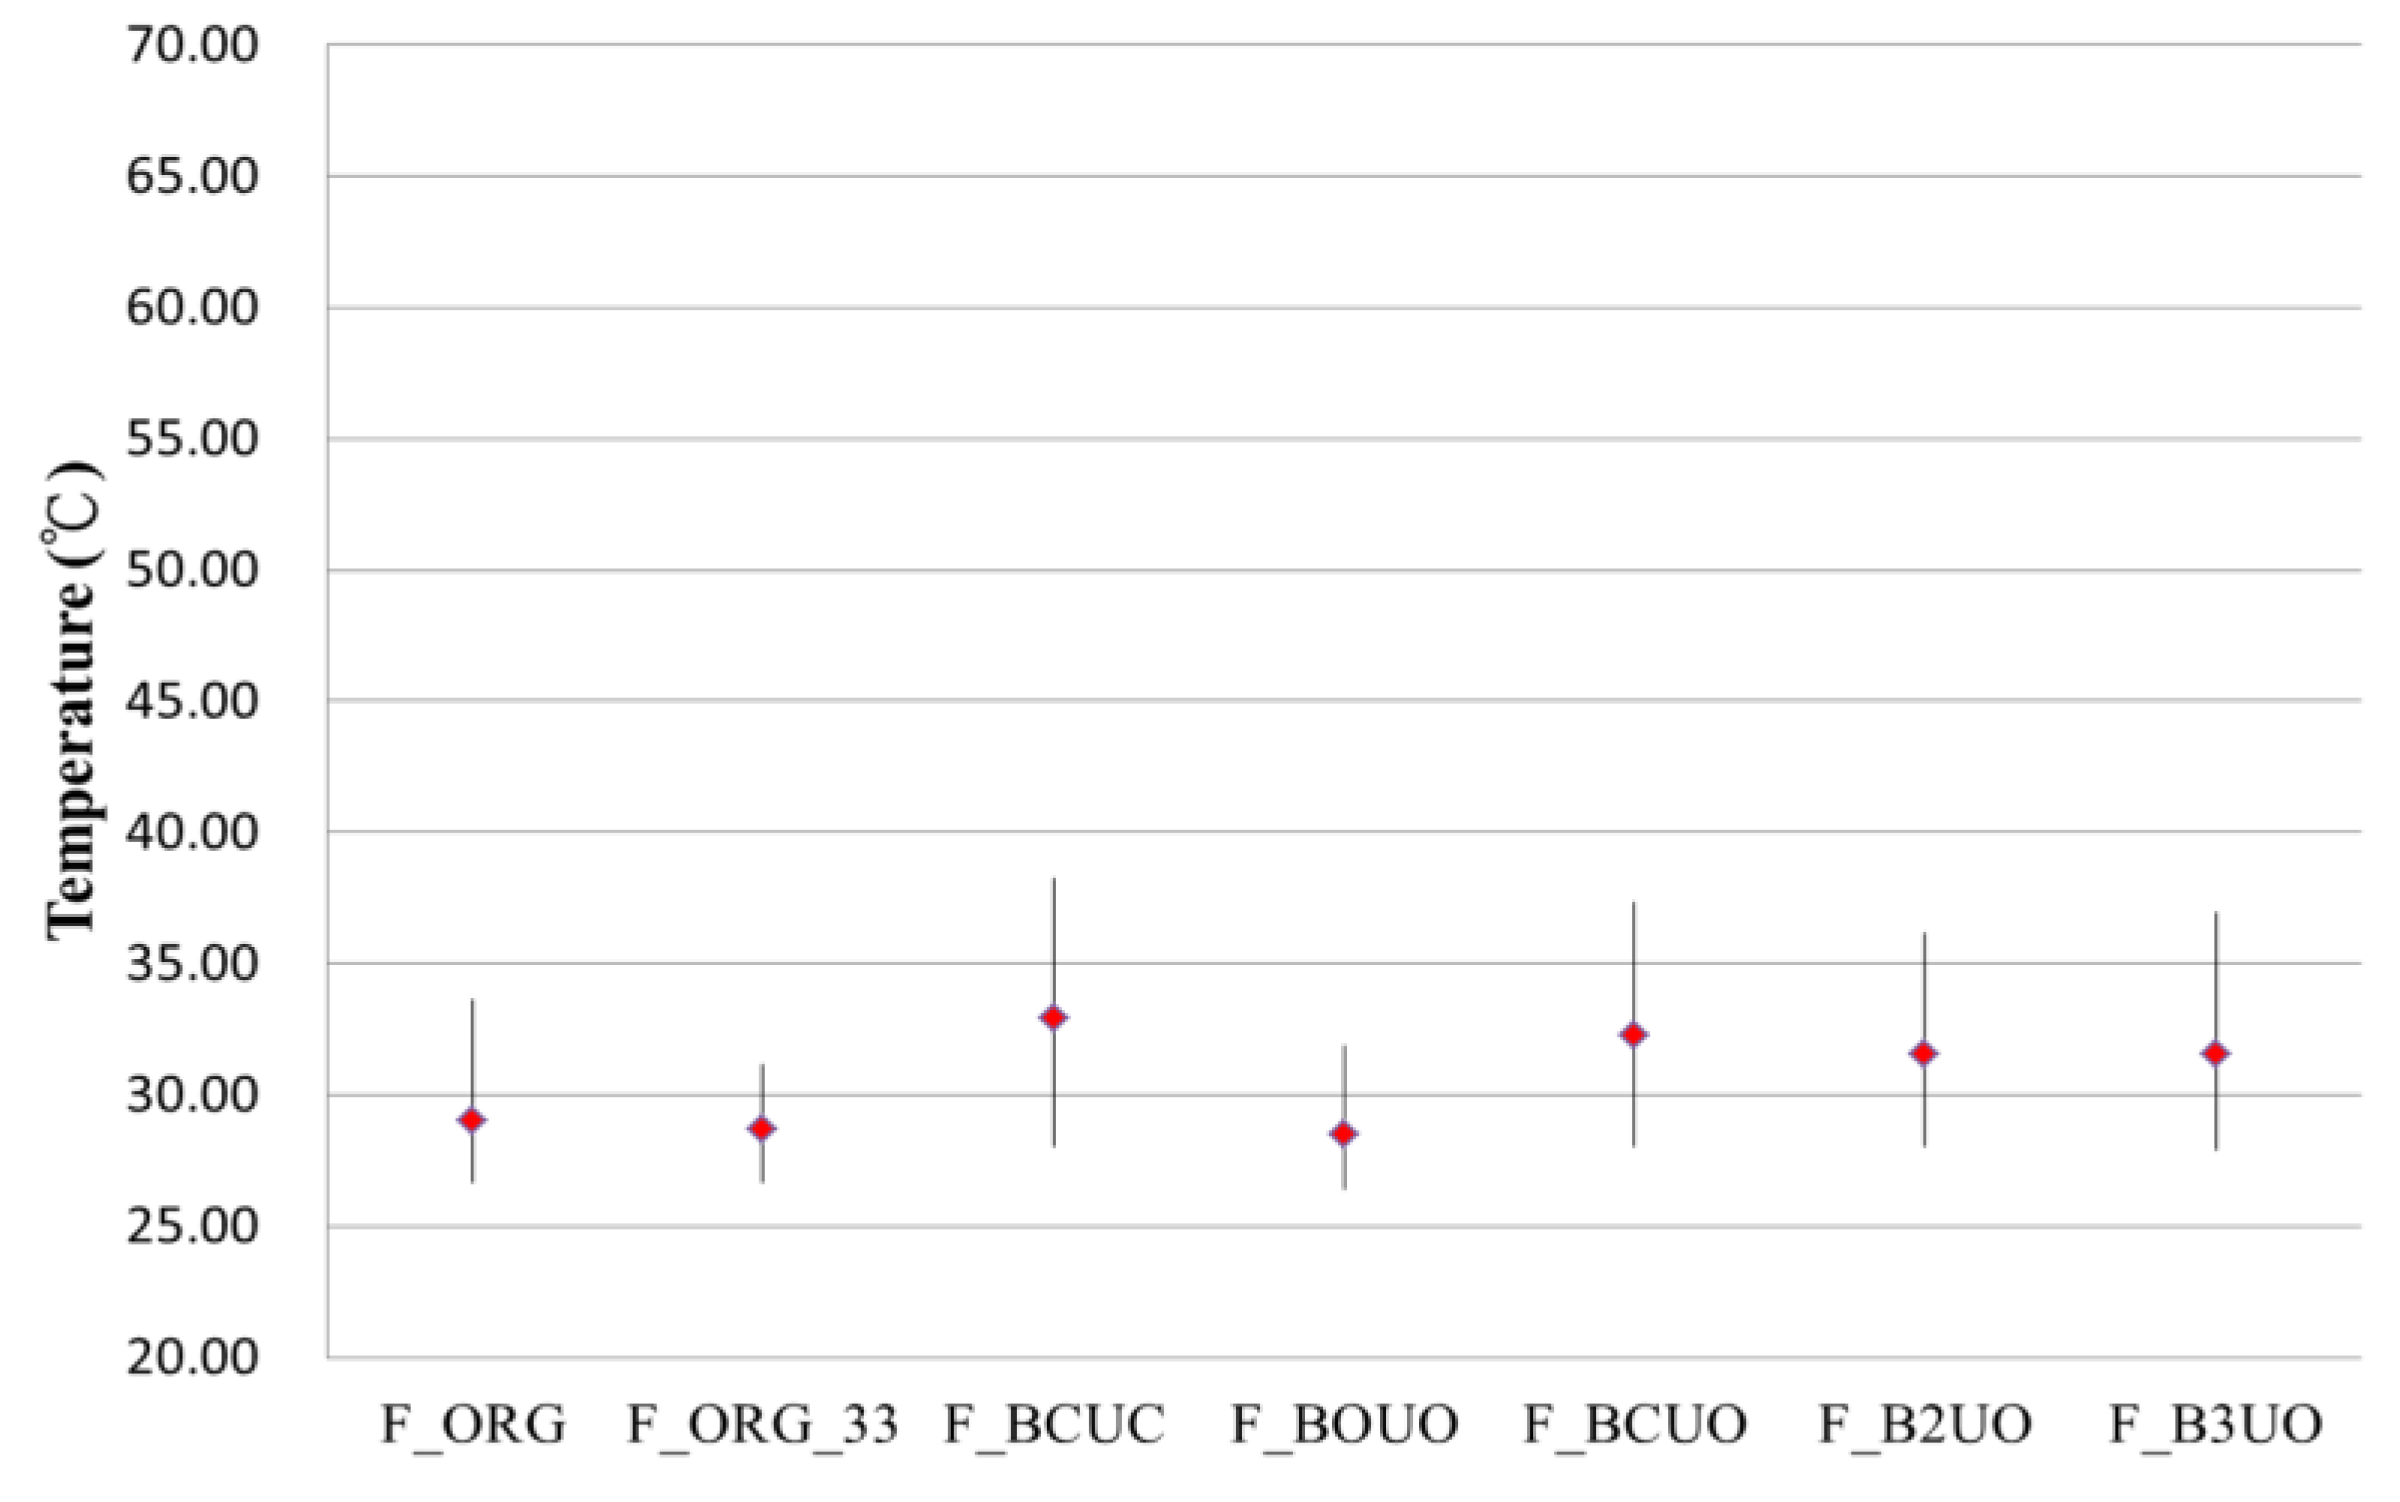
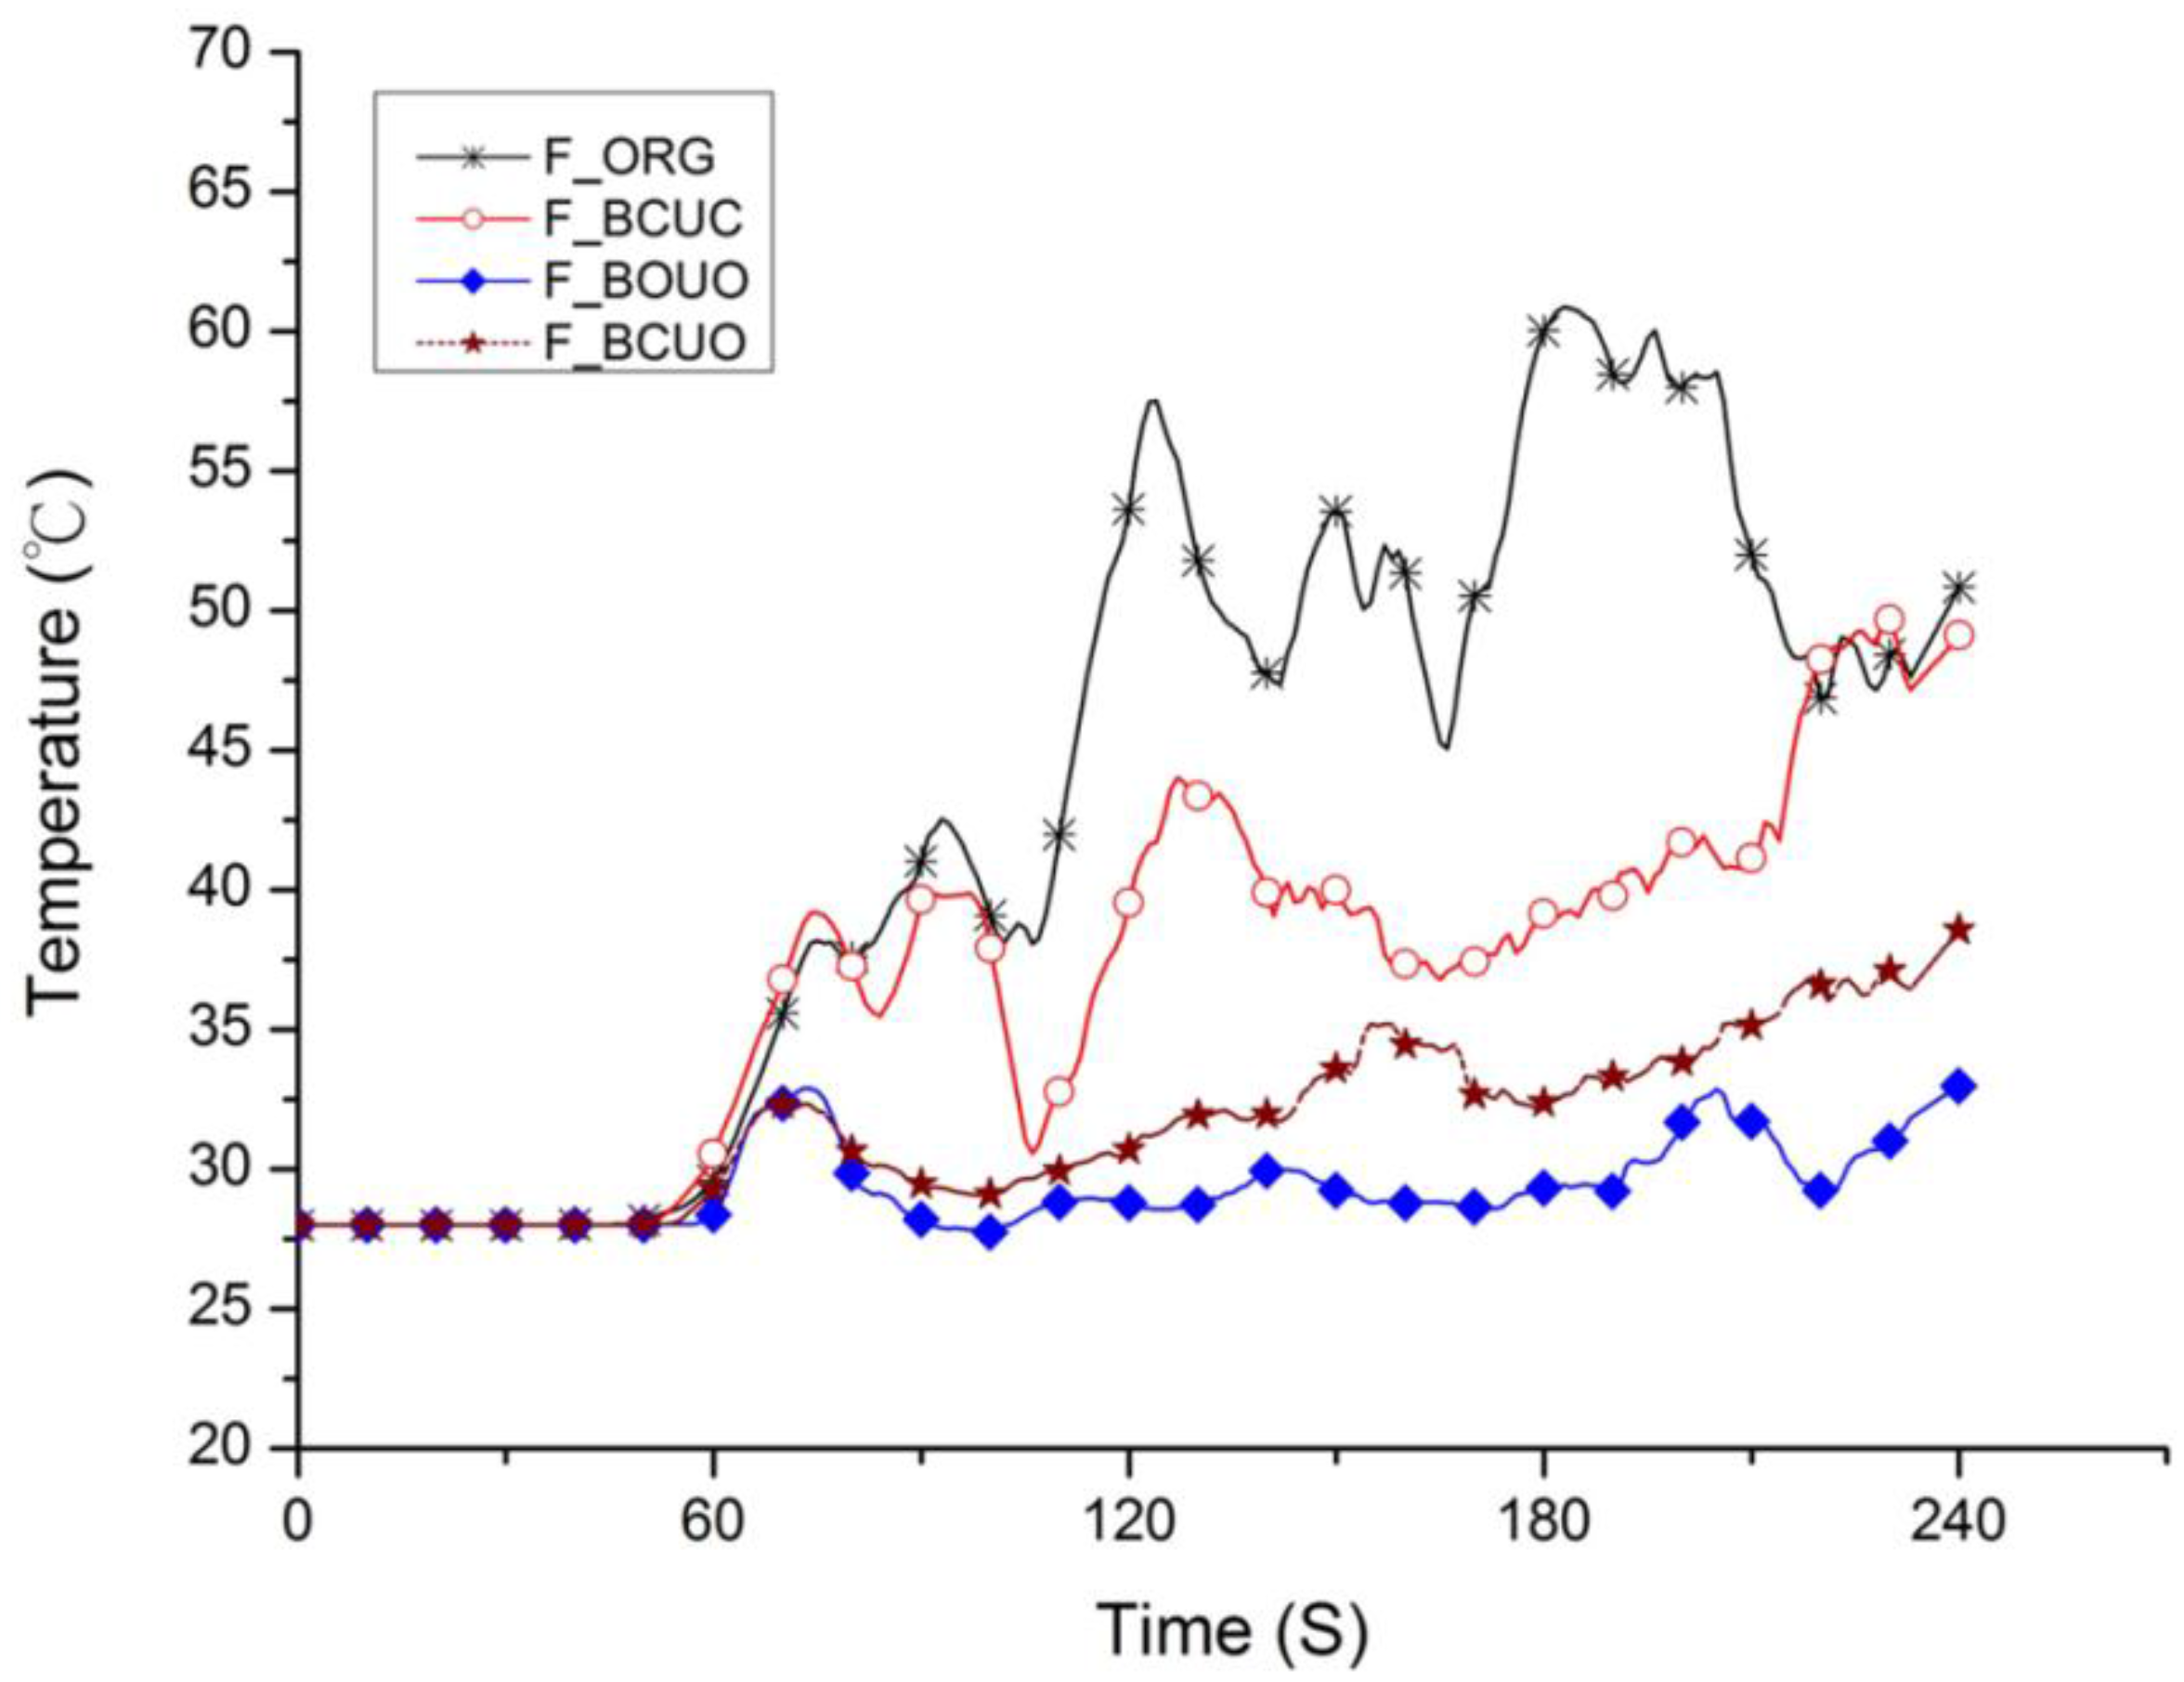
5.2. Indoor Fire State

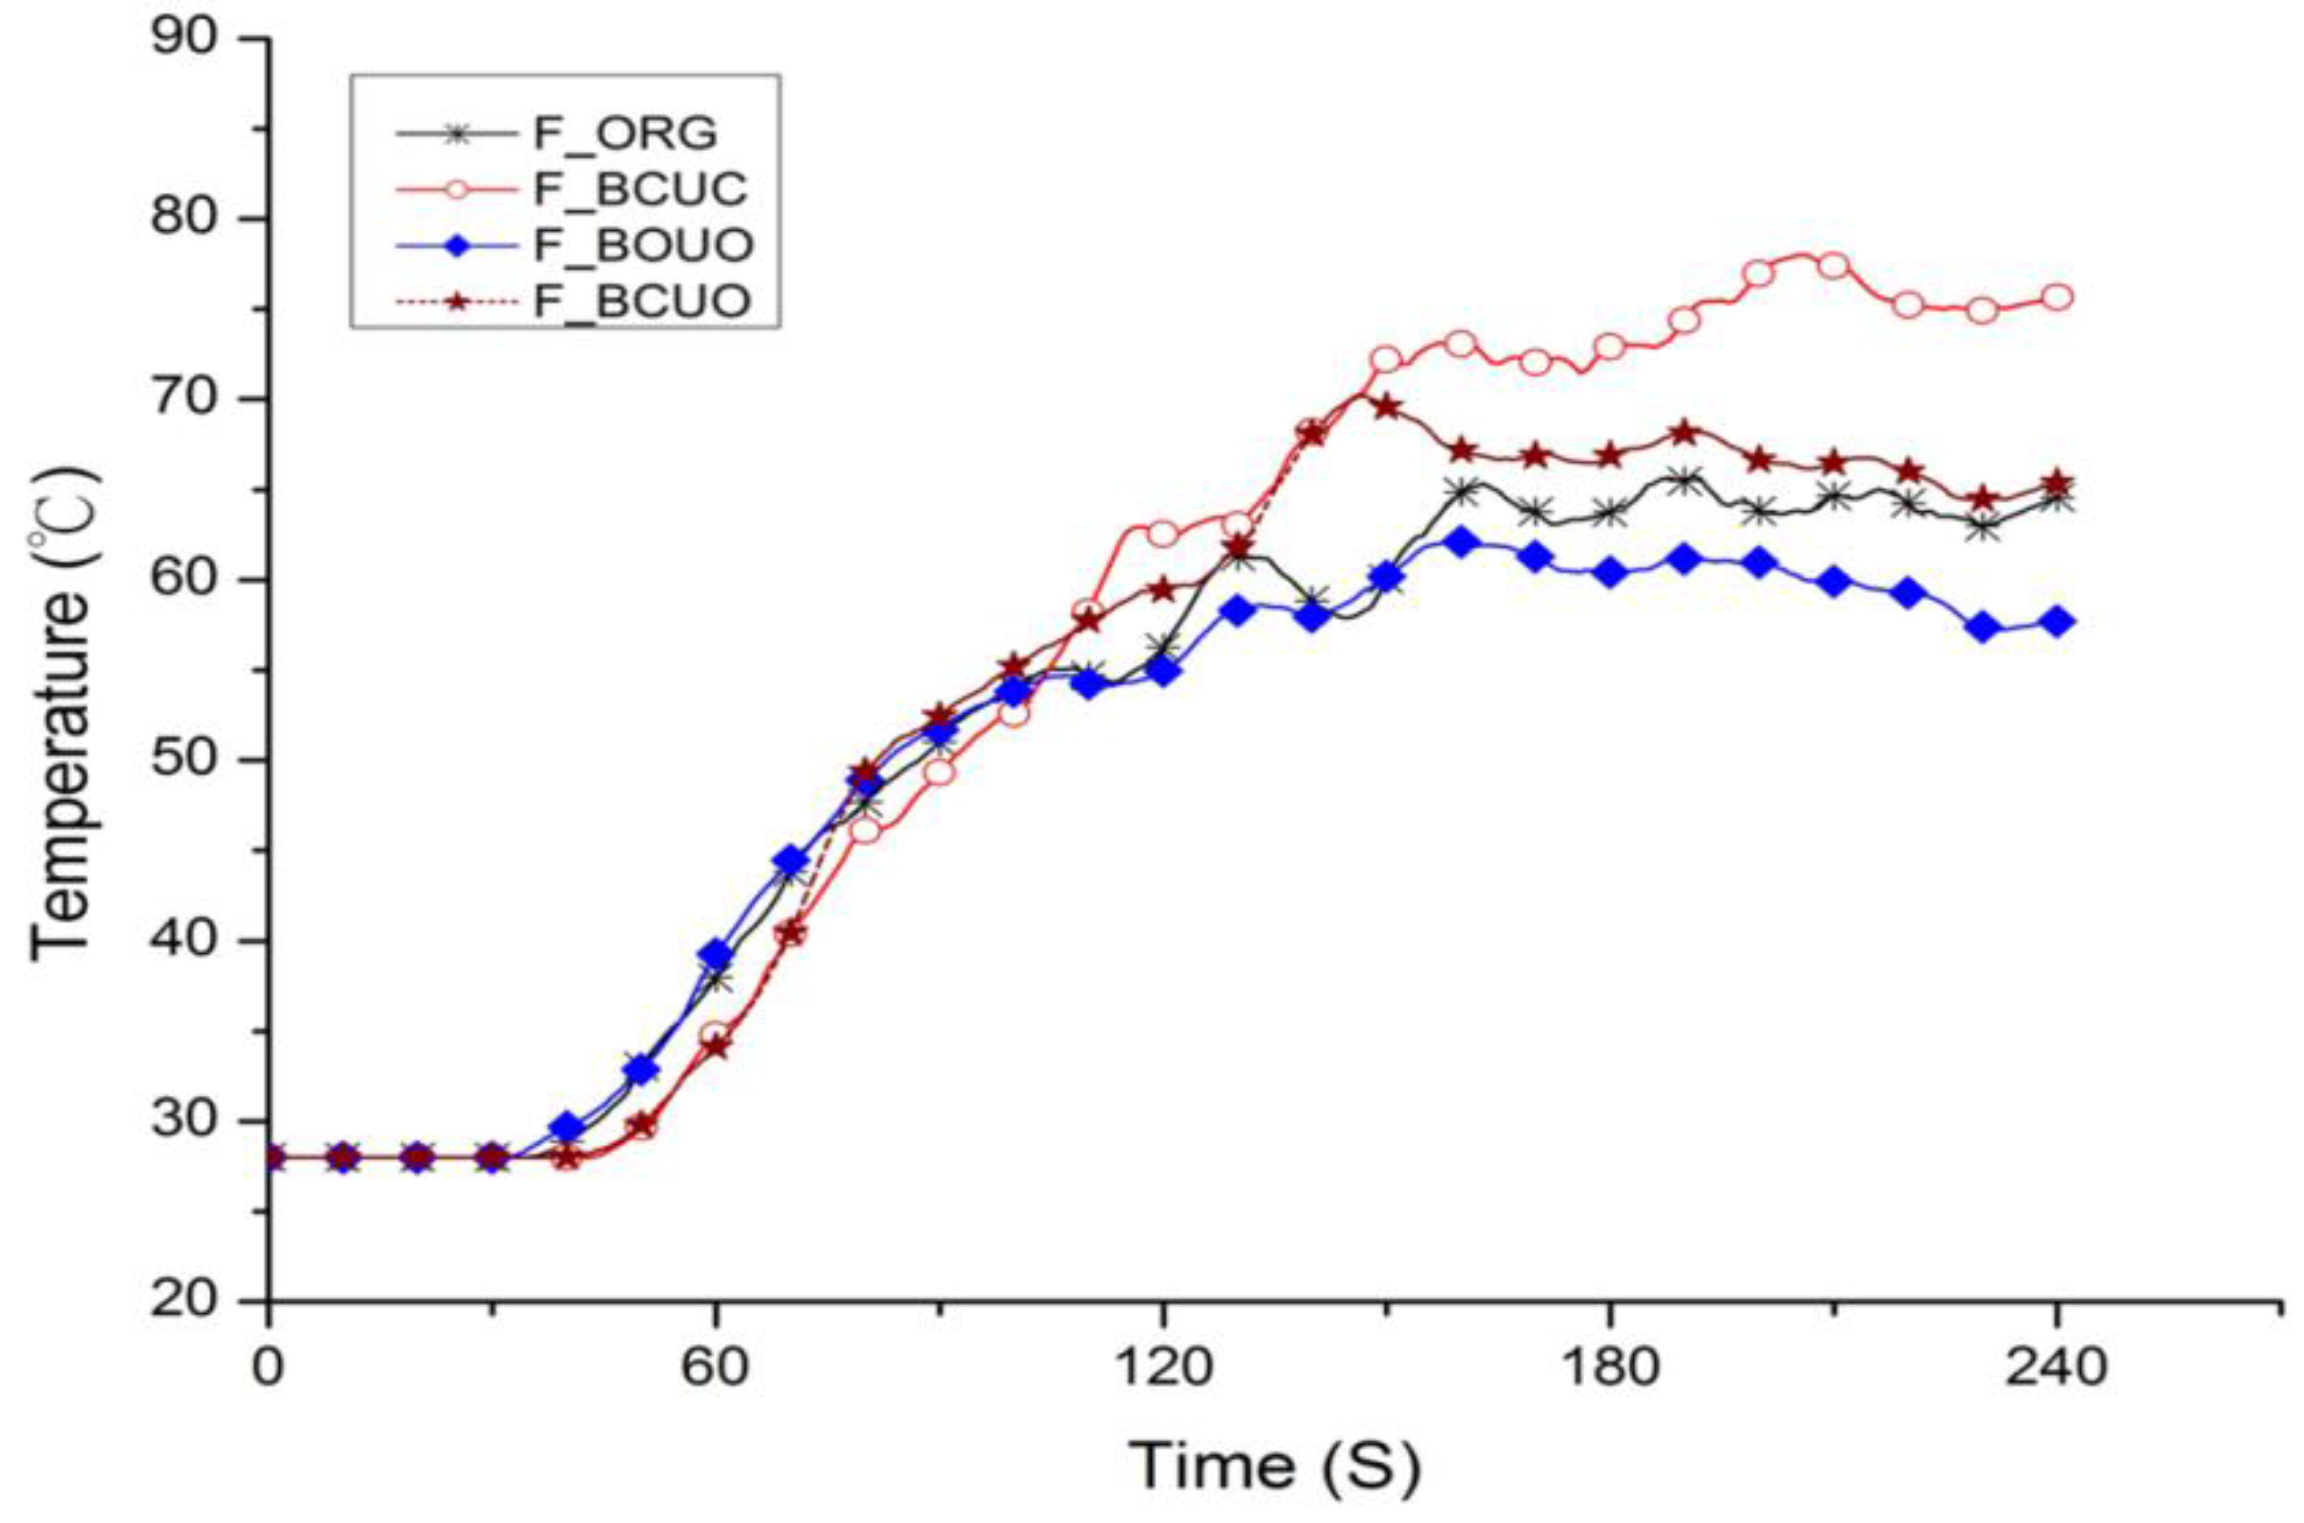
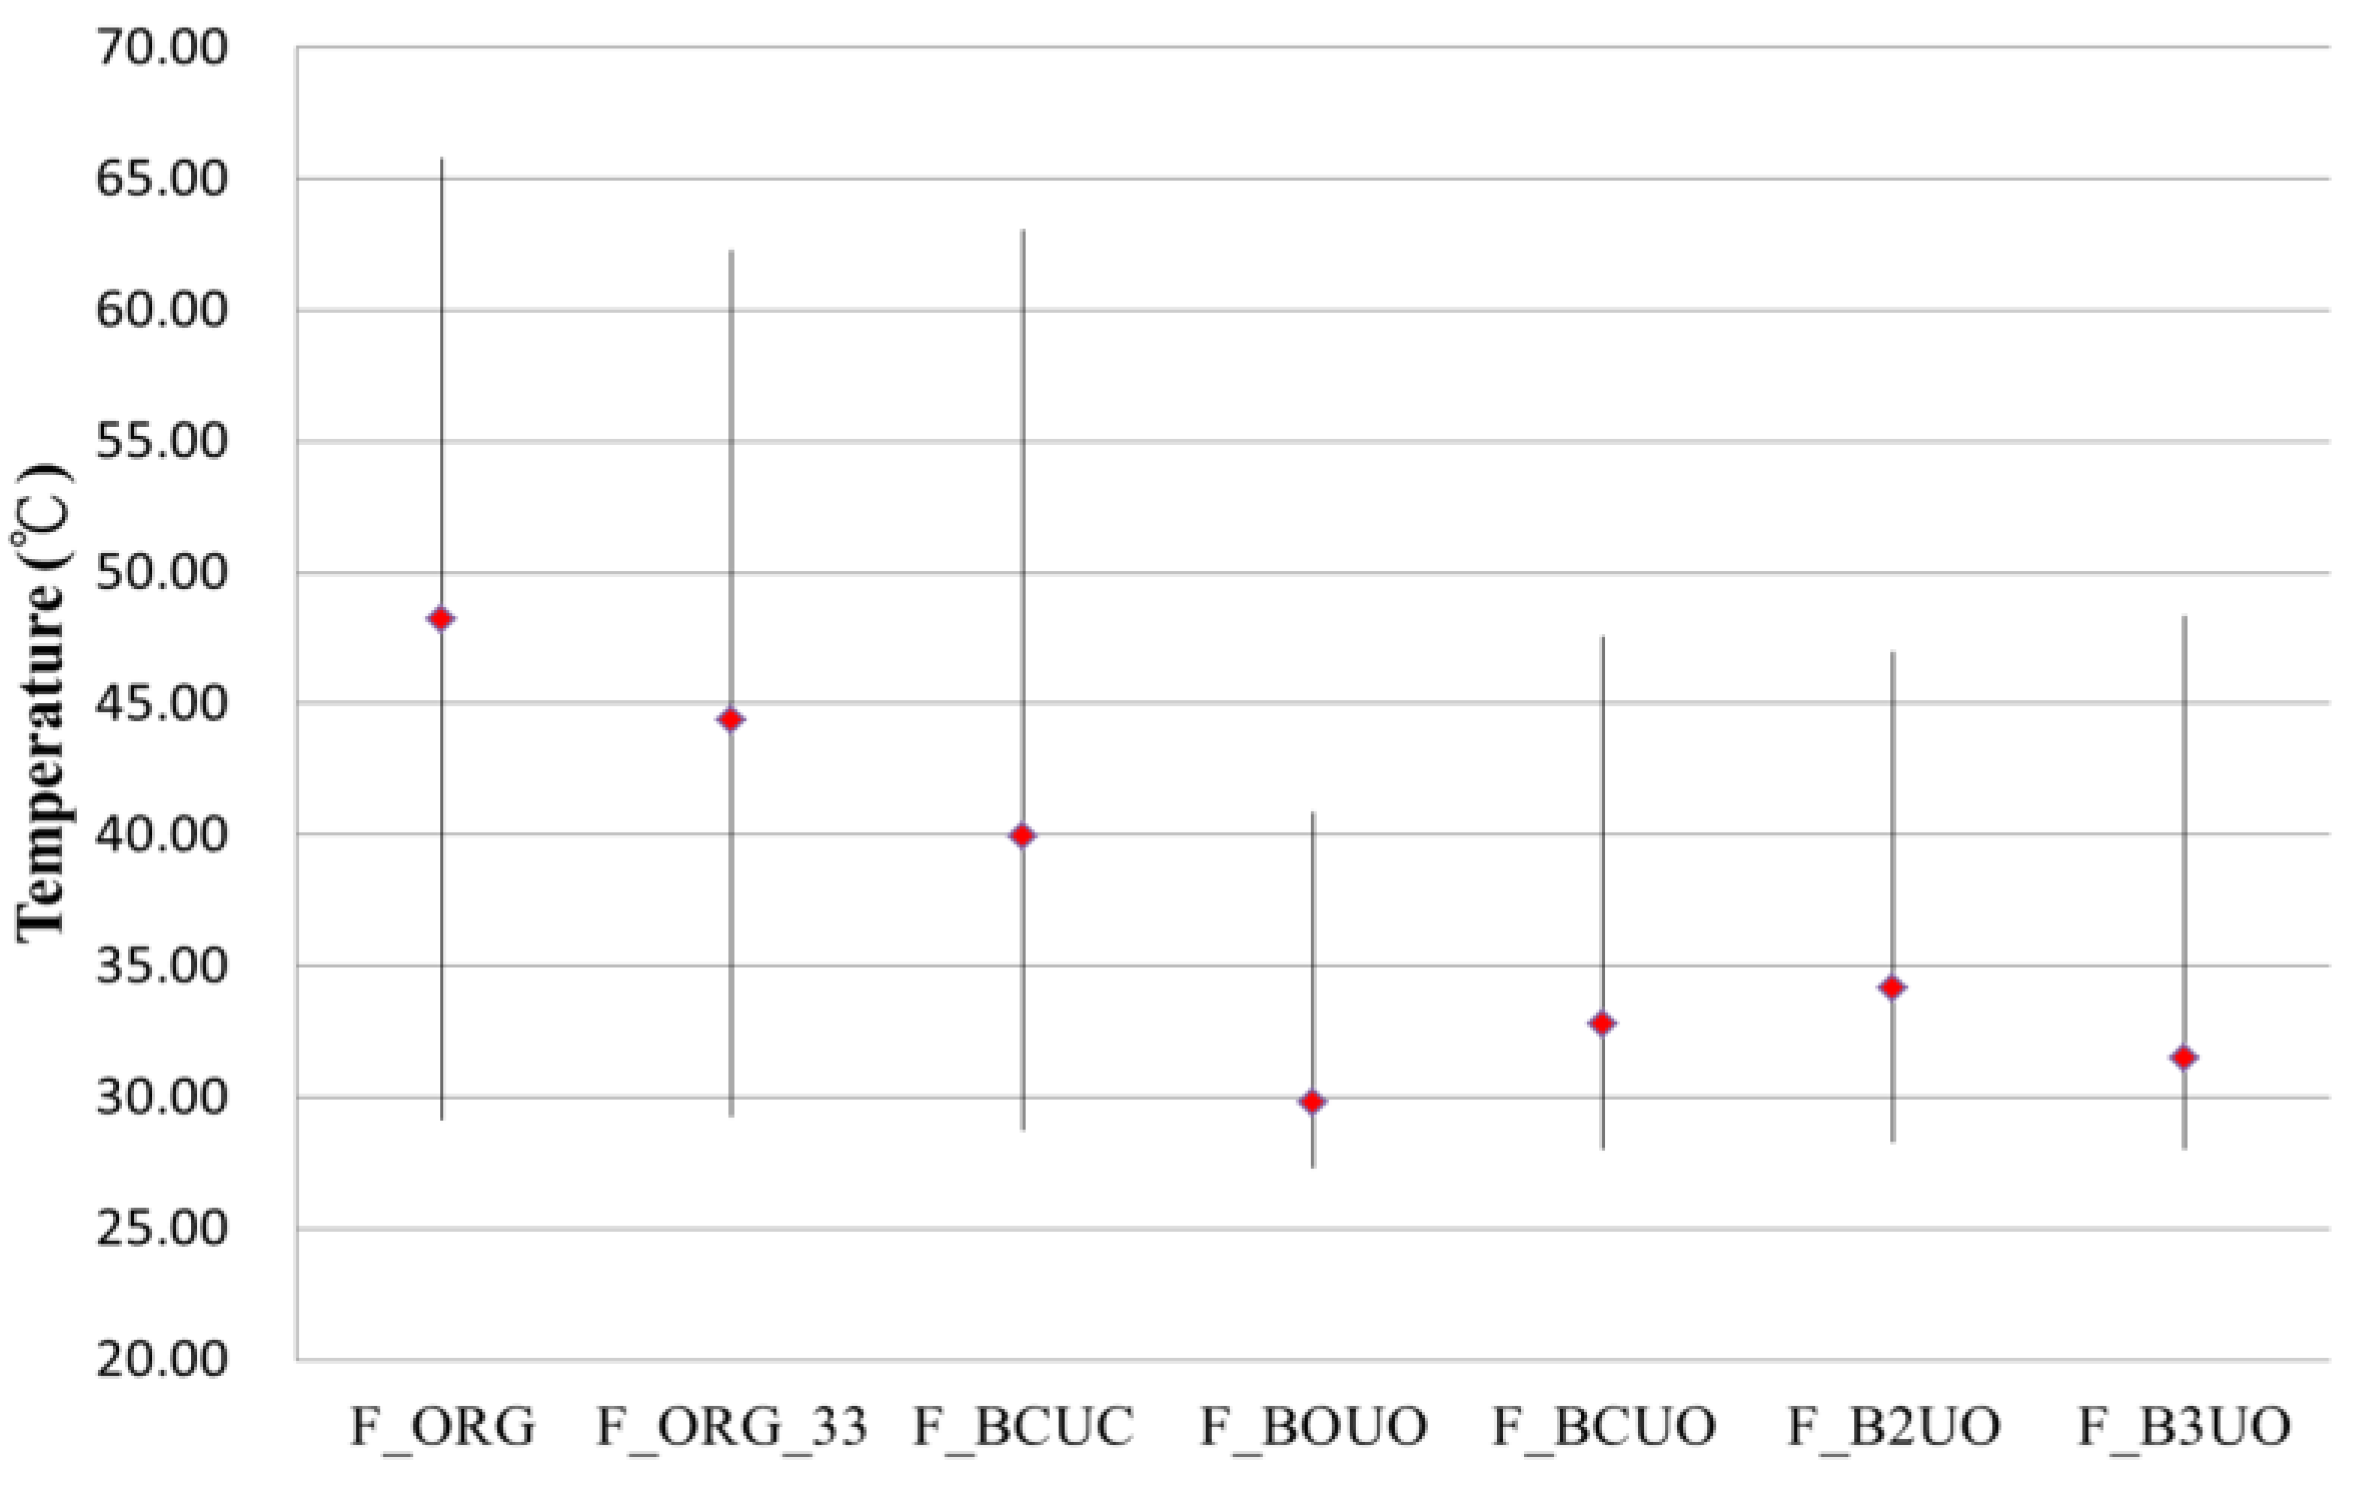
5.2.1. Temperature Variations

Case F_ORG is the simulation case of the exhibition room fire. Figure 12 and Figure 13 display the maximum and minimum temperature distributions at measuring points D and R, from 60 s to 240 s in each case, as well as the average temperature value. The front and back doors were assumed to be opened as people got up to leave the room.
As Figure 12 shows, the temperature of Point D at a height of 1.8 m on the central aisle was 26 to 32 °C; the mean was 29.5 °C, which was a tolerable environment. Figure 13 shows the temperature distribution at Point R at a height of 1.8 m on the rear aisle. The temperature value was 30–61 °C, and the mean was 48 °C, which was higher than at Point D. This phenomenon demonstrated that there was heat storage in the rear of the room. The analysis result showed that the heat storage resulted from the front natural wind.
In terms of the variance in indoor temperature at the fire scene, Figure 14 illustrates the time-varying temperature curve of Point D of Case F_ORG. No significant temperature change was observed. The maximum temperature was lower than 30 °C. Figure 15 shows the temperature variation curve of Point R of Case F_ORG. The result was similar to the data of Figure 13. It was observed that the temperature changed drastically after 90 s and the temperature value markedly increased, to higher than 50 °C.

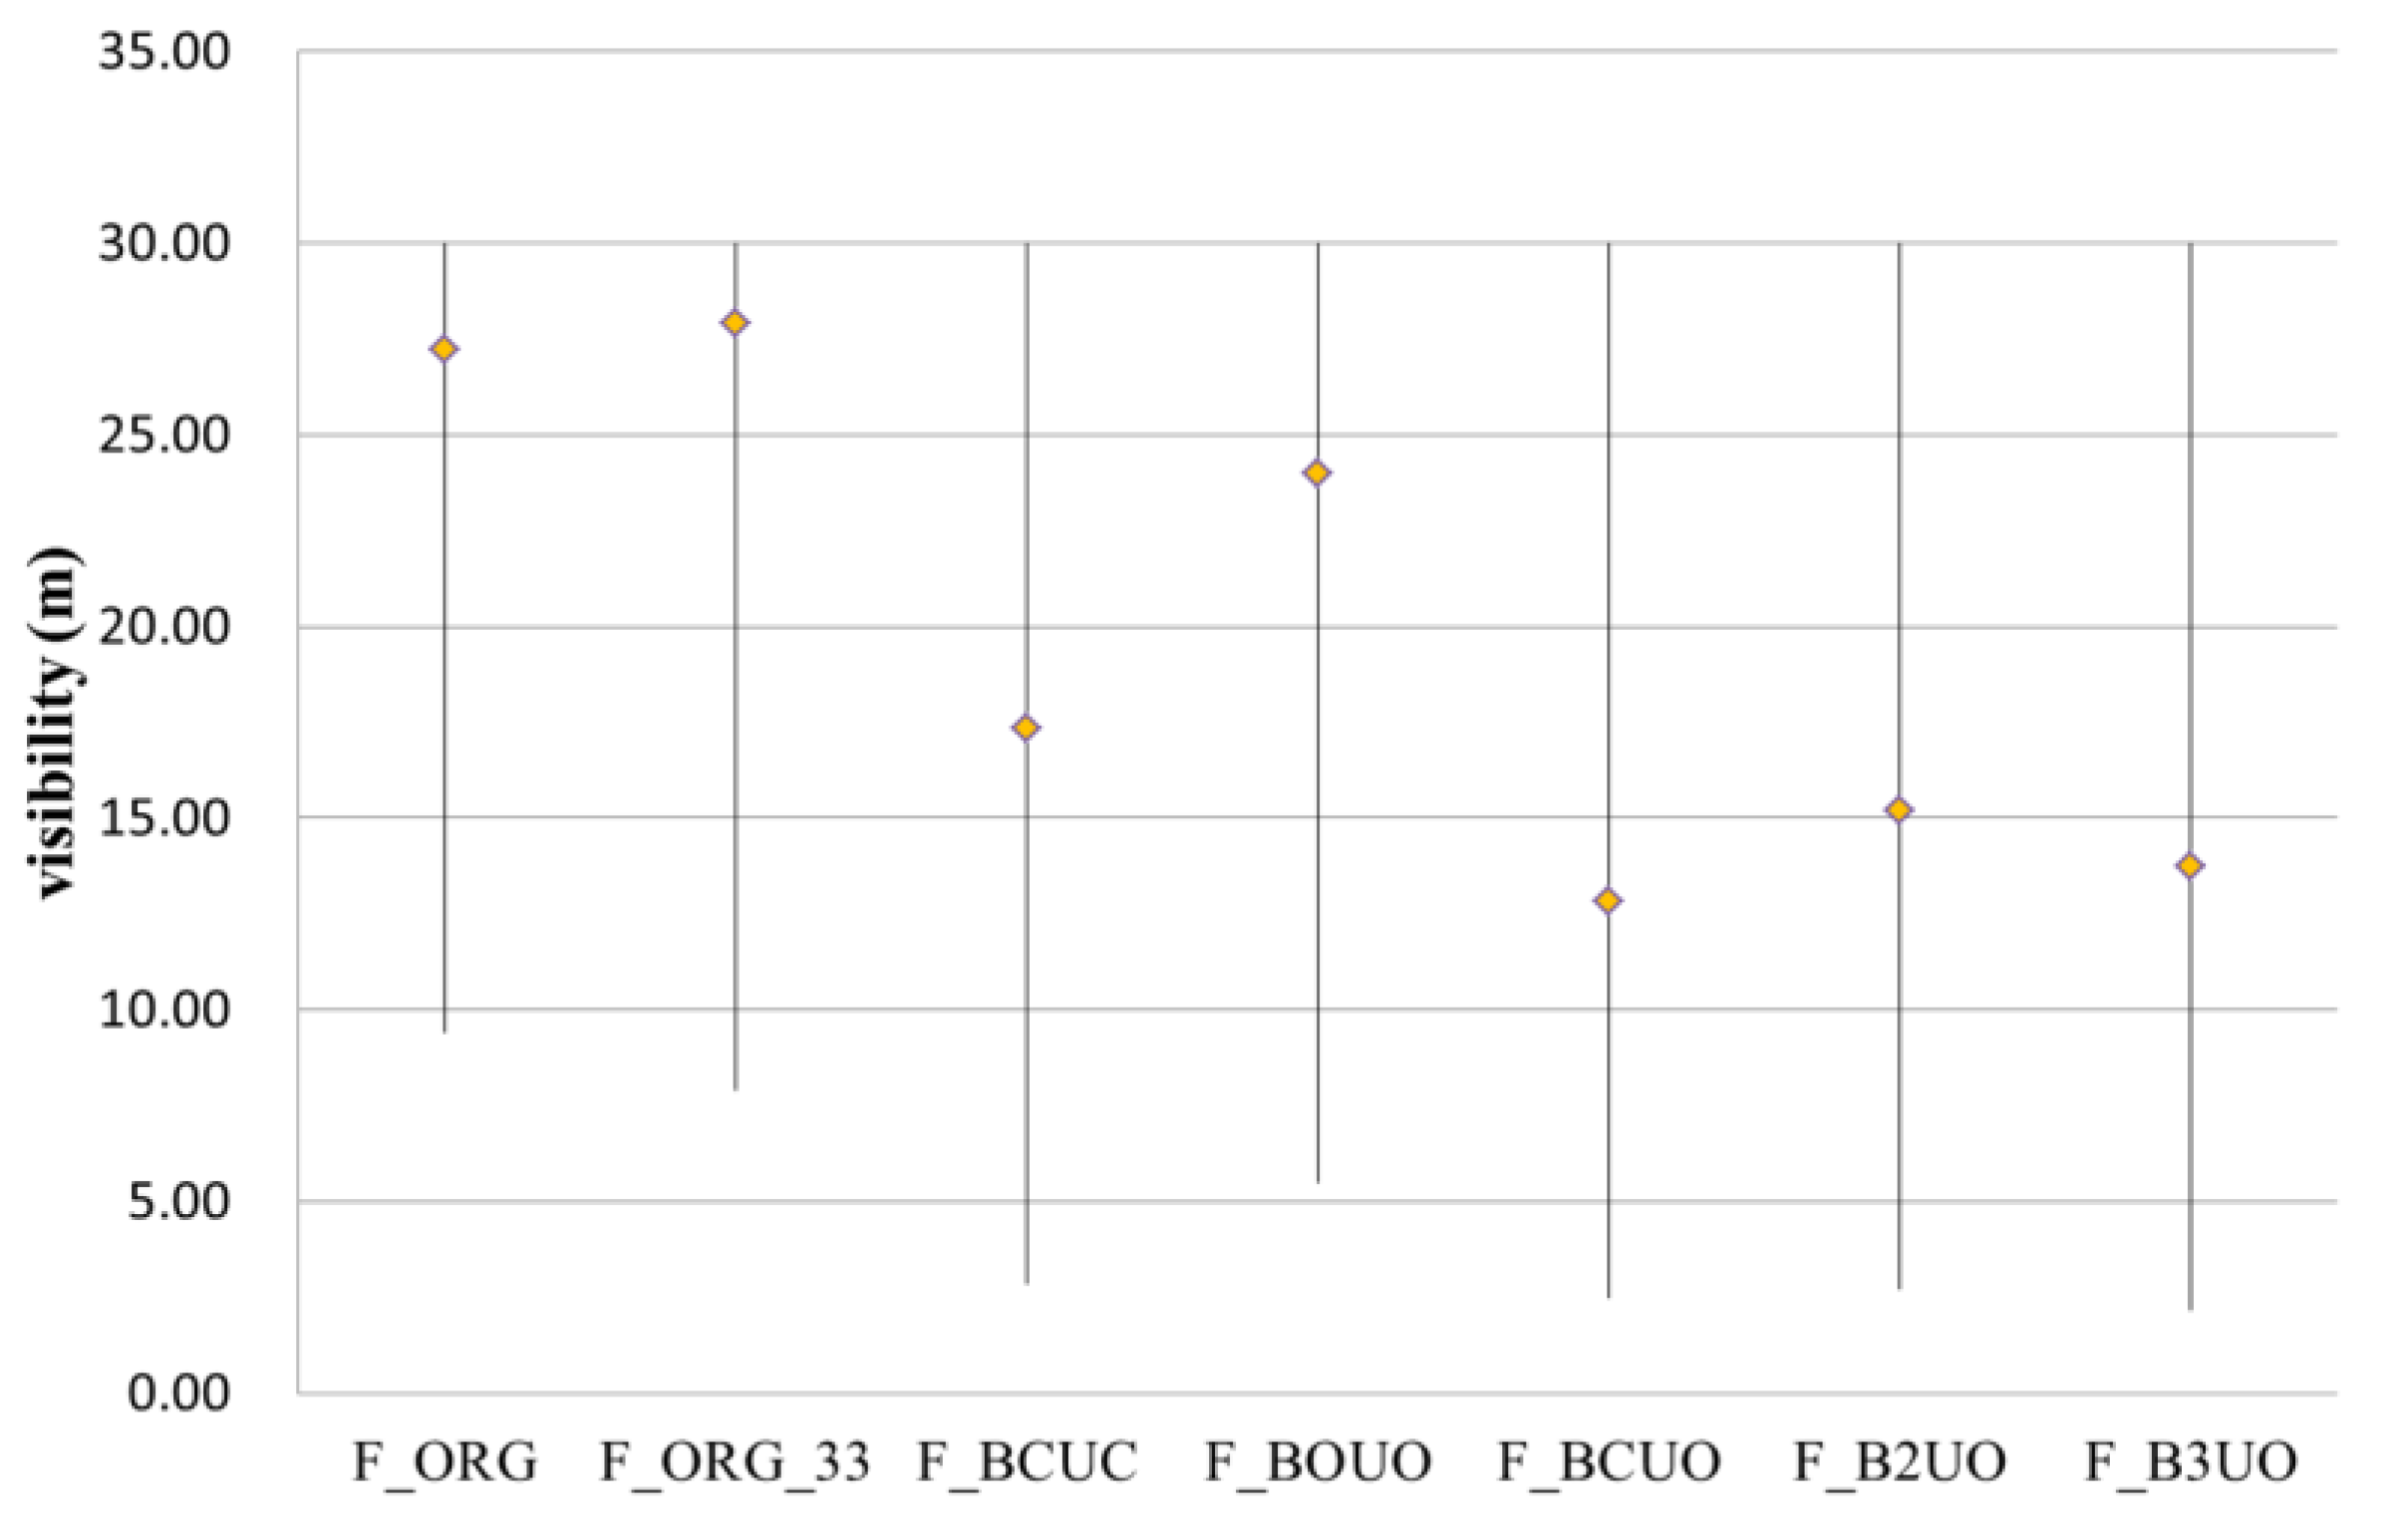
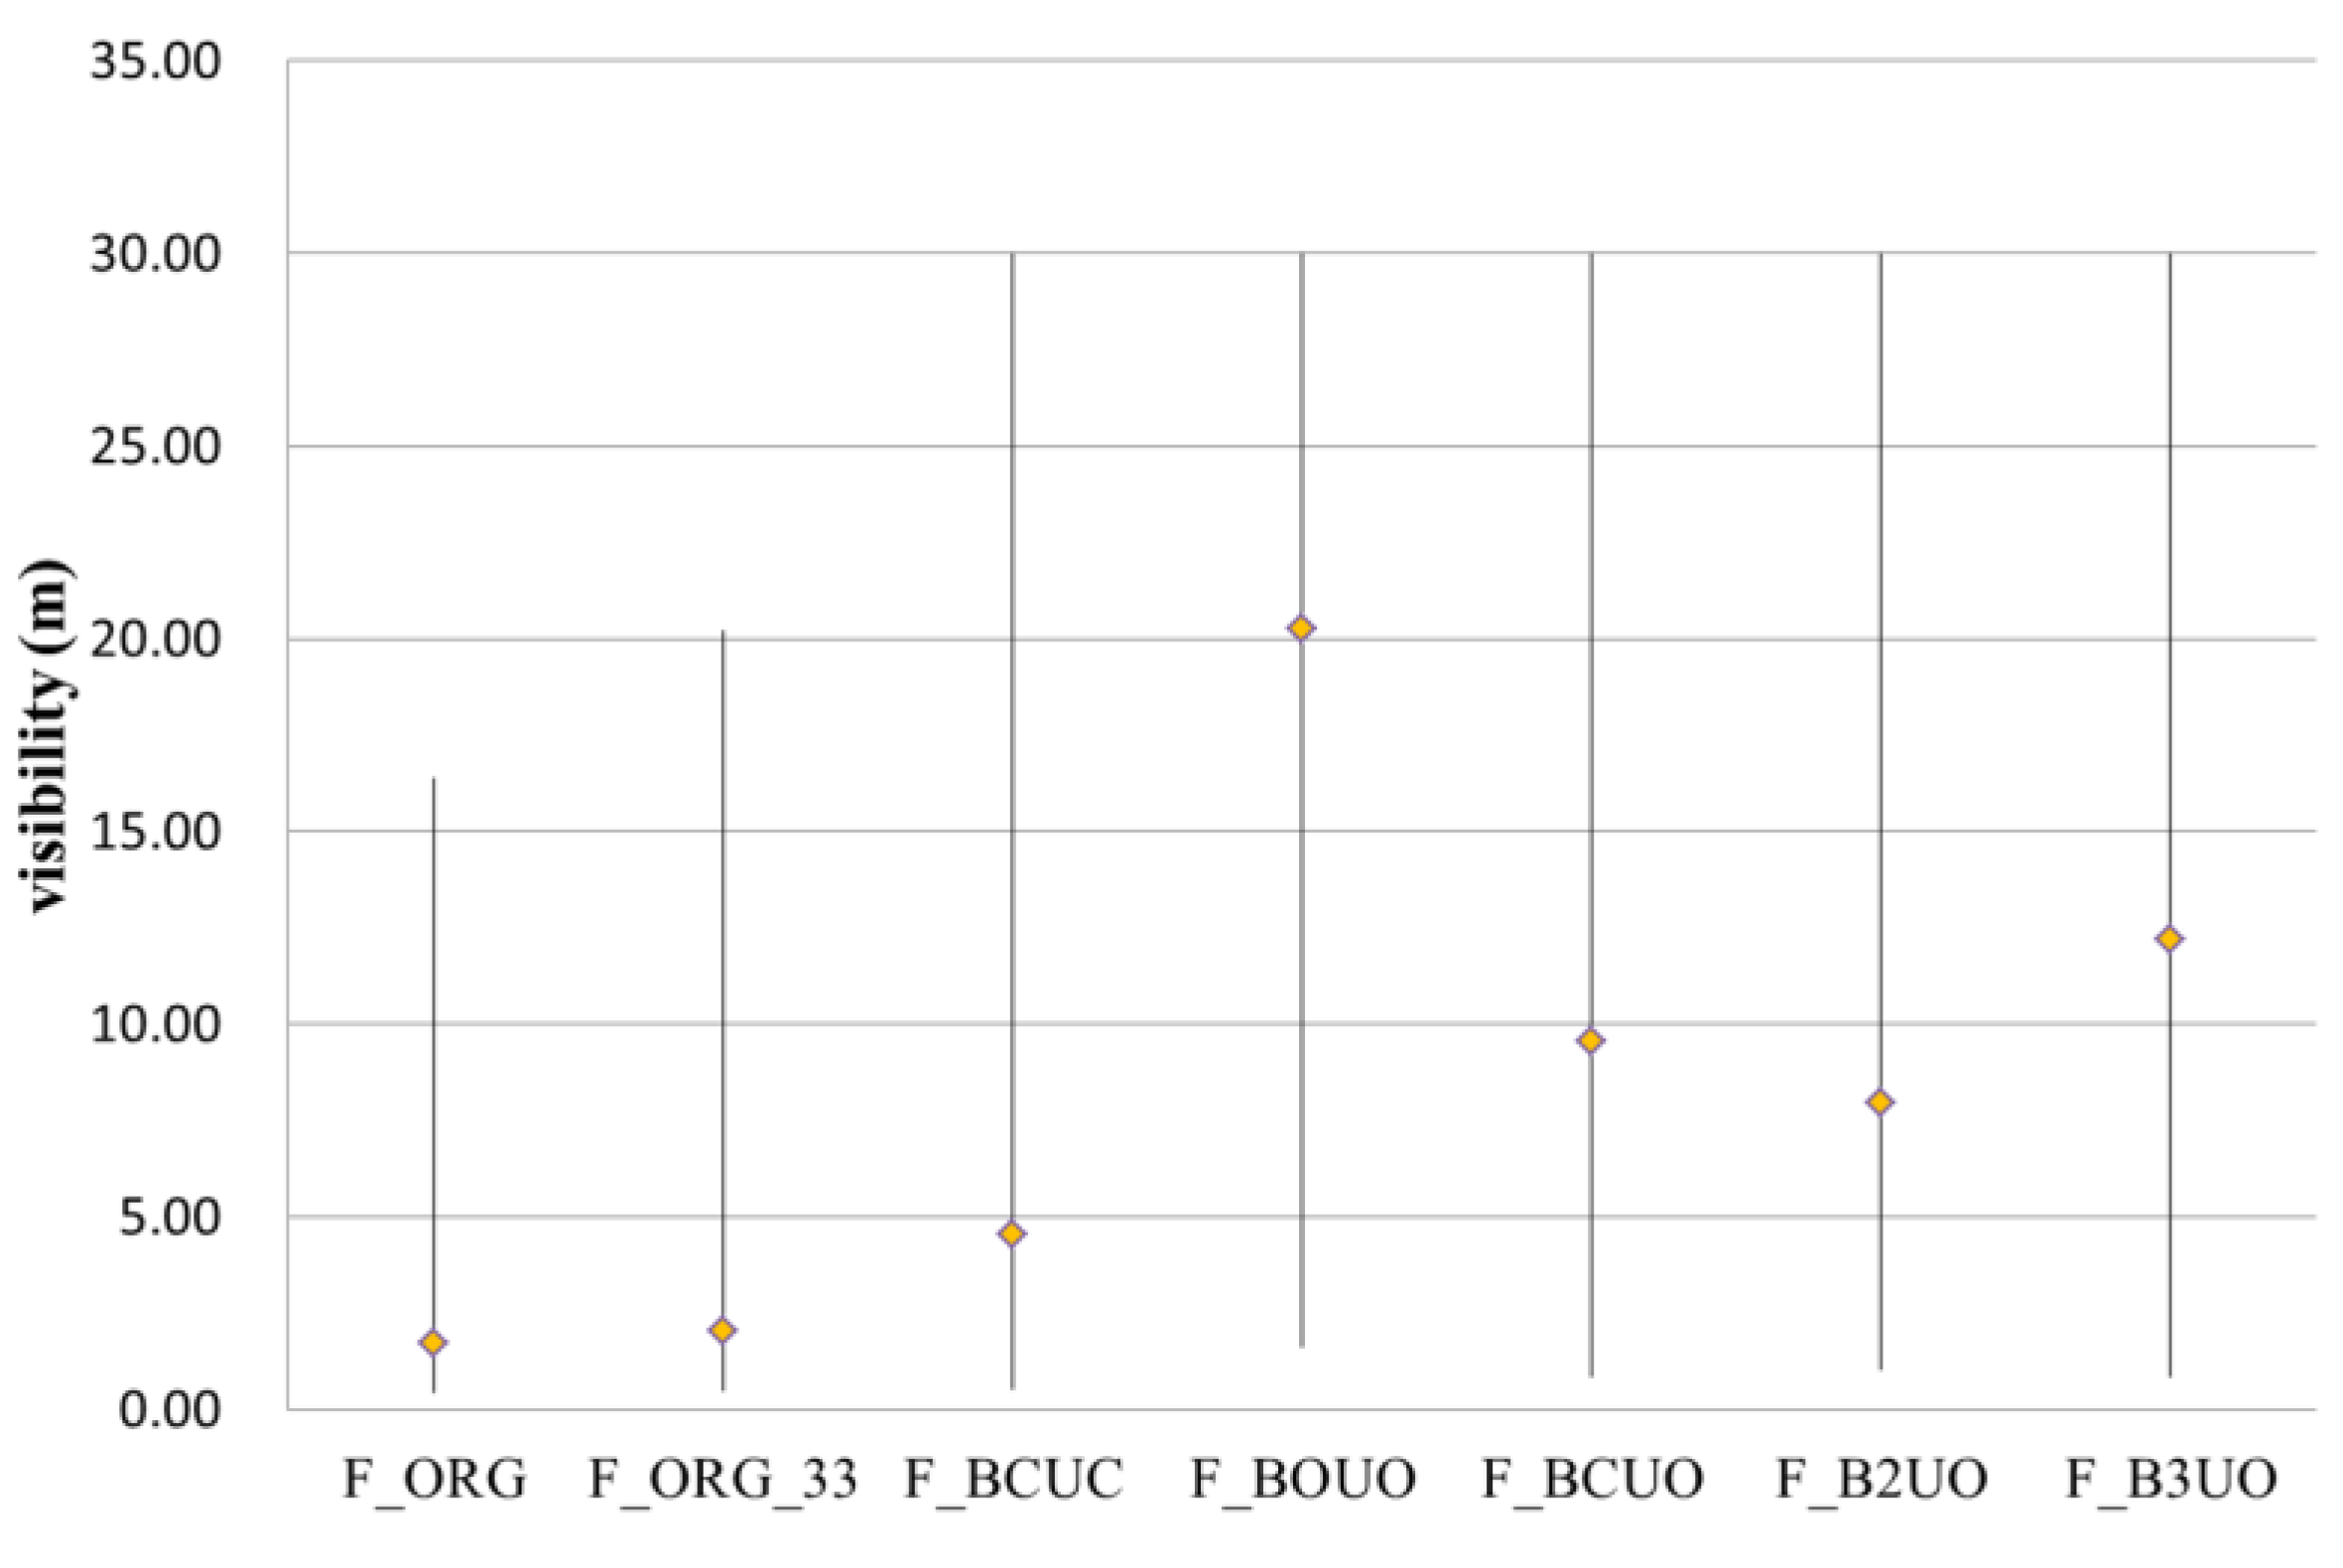
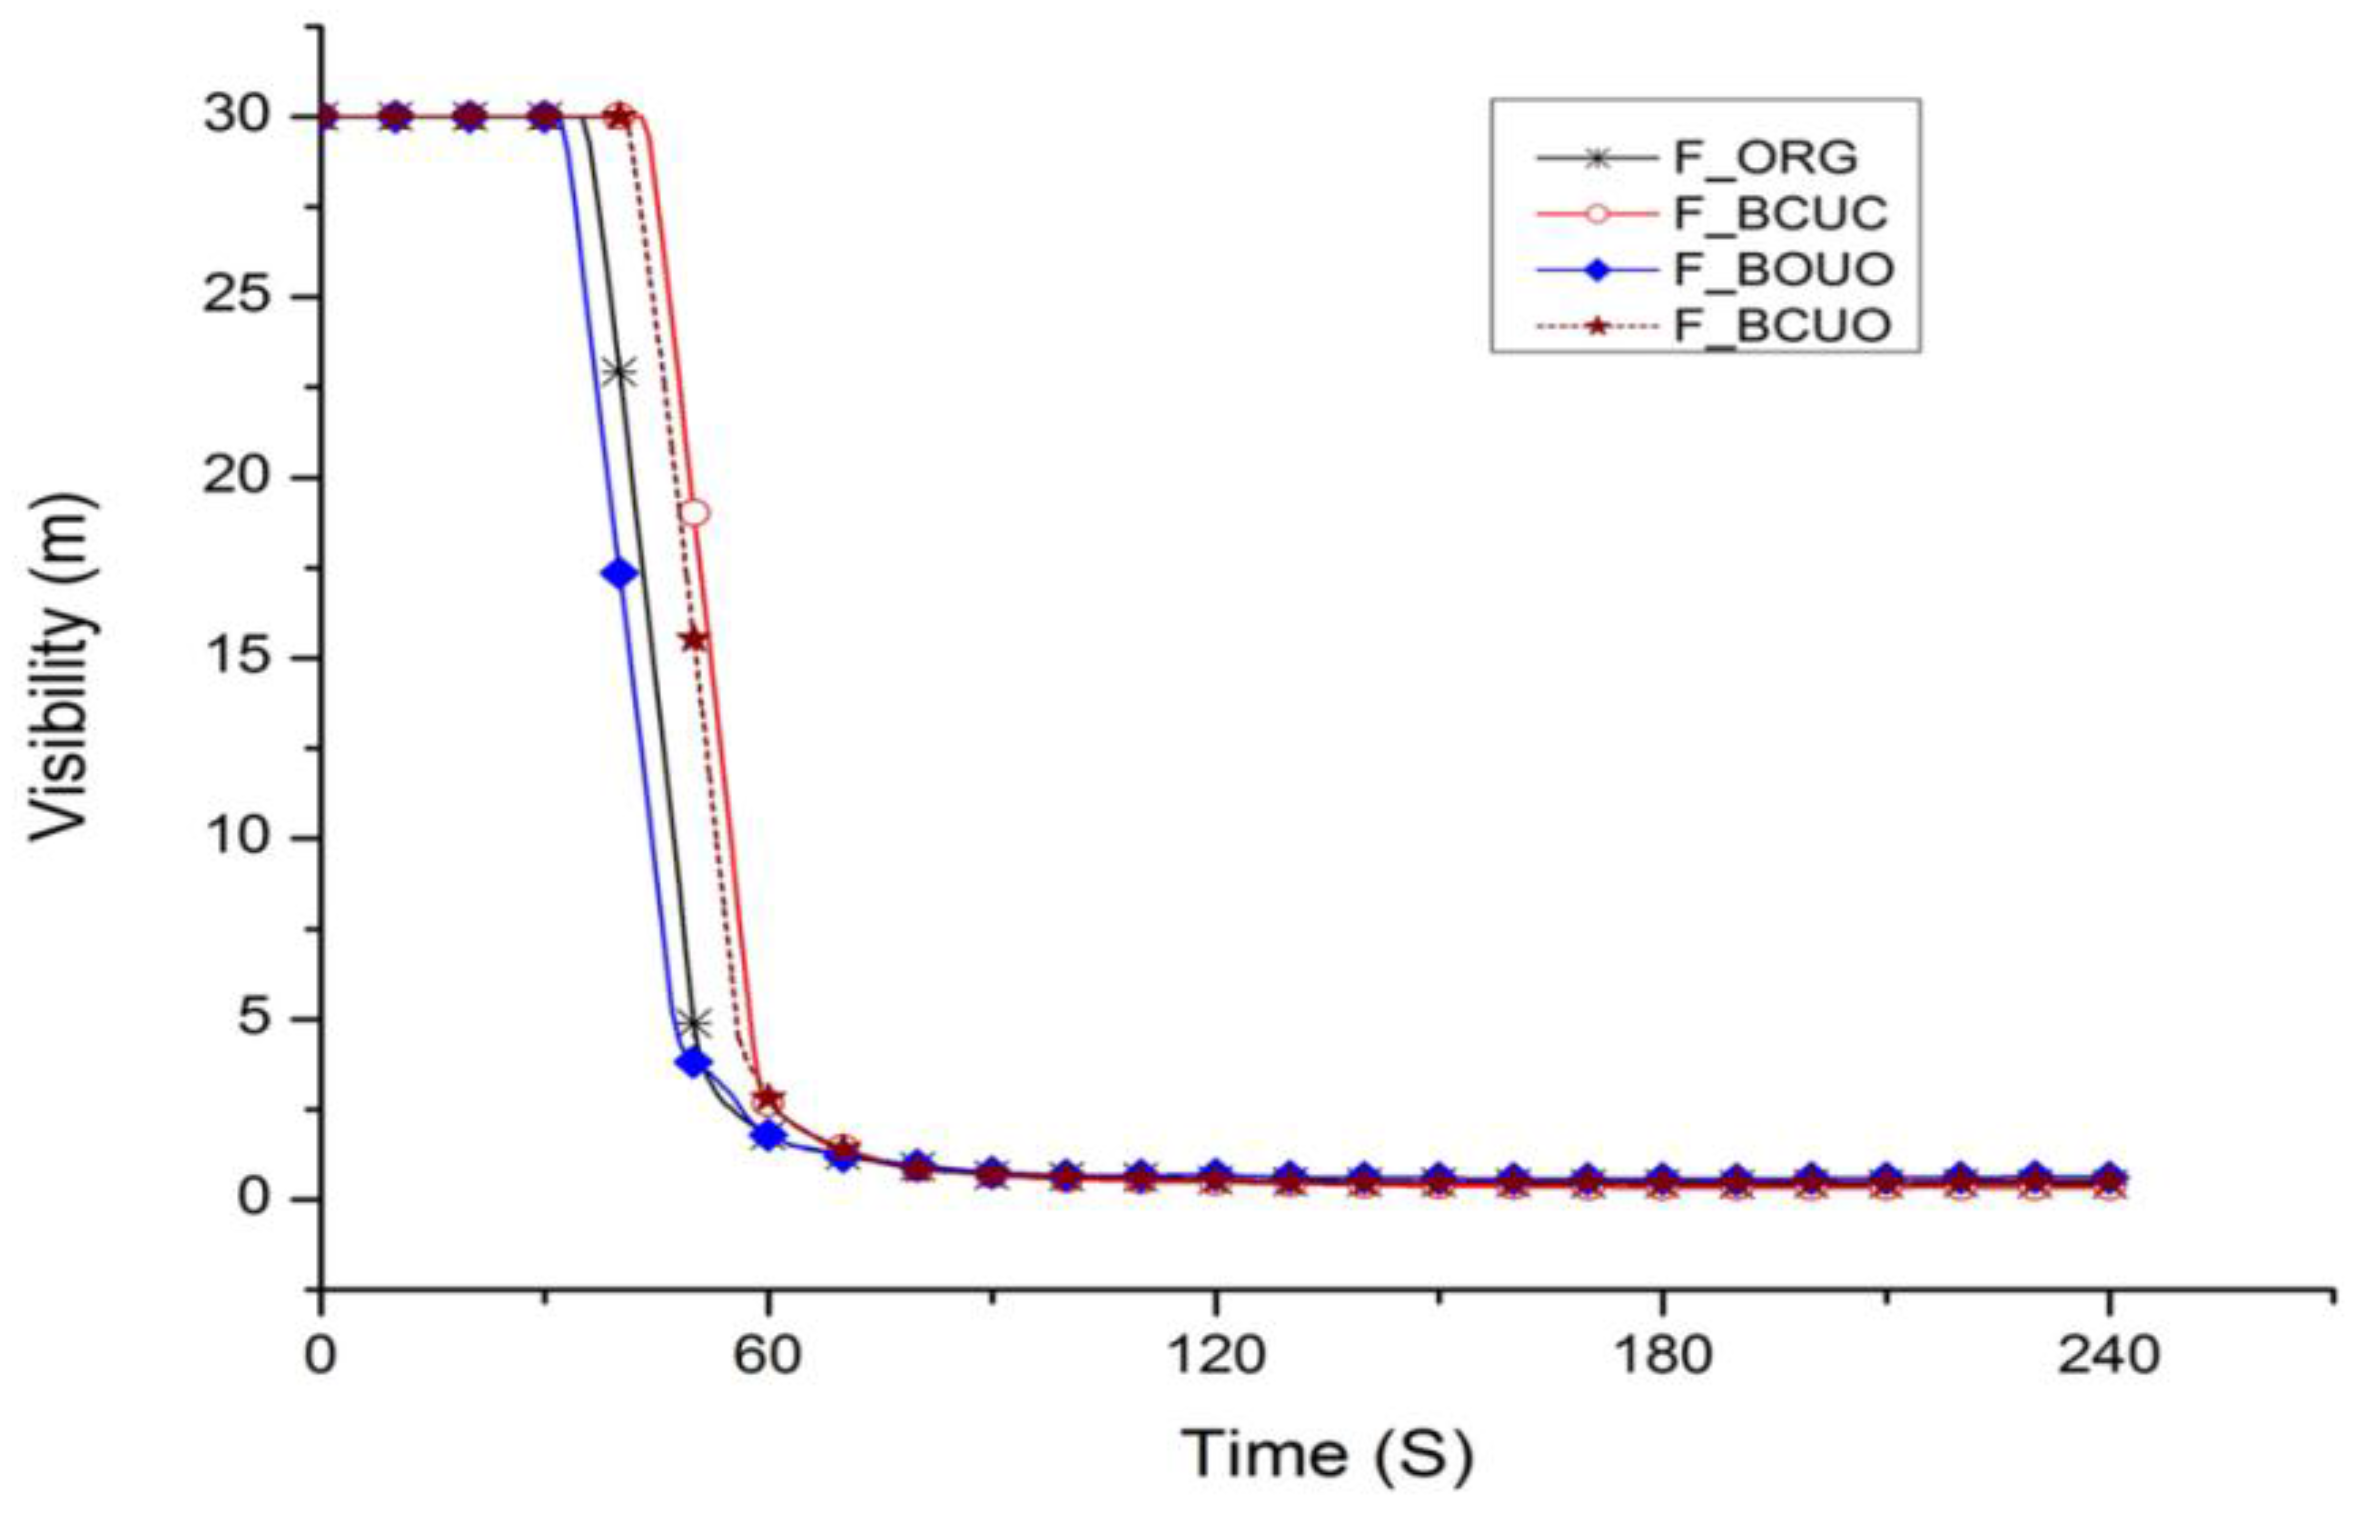
5.2.2. Variance in Visibility

Figure 16 and Figure 17 show the visibility distribution between 60 s and 240 s at measuring points D and R in the various cases, including the maximum and minimum. Figure 16 displays the visibility at center Point D of Case F_ORG as 15 and 30 m, for a mean of 27.5 m. The visibility was more than 10 m, which is a permissible environment. As Figure 17 shows, the visibility at Point R in the rear of room was less than 15 m; the mean was 2.0 m. The rear smoke storage was obvious.
As Figure 18 shows, the visibility at Point D of Case F_ORG varied with time. The value was only 15 m at 175 s, but more than 20 m at the other time points. Compared with other cases, the visibility at center point D of Case F_ORG was fair. Referring to Figure 11, this phenomenon resulted from the natural wind from the bottom of the platform, and the visibility at Point D did not deteriorate. However, as Figure 19 displays, the visibility at the rear point R of Case F_ORG was very low, and lower than 10 m at the 60 s time point of the fire. The environment at Point R made it difficult to escape. Therefore, when a fire occurs, the obvious hazardous environment would be at the rear of the interior. Since the exhibition room was located in a school, it was exempted from installing the fume extractors otherwise required according to law of Taiwan. This study proposes some mitigation strategies.

5.3. Smoke Emission Improvement Strategies

As heat and smoke accumulate in the rear of the interior when a fire occurs, personal safety can be compromised. The three improvement measures this paper proposes are as follows:
(A) 
Improvement strategy 1: Case F_BCUC
The first improvement method is to close the air inlet under the platform in order to analyze the fire scene without air inflow. As noted in Table 4, the case symbol is Case F_BCUC. As Figure 12 shows, the temperature at Point D rose slightly during the 60 to 240 s period. Compared with Case F_ORG, the maximum value and mean of the temperature increased by about 5 °C, so the conditions were still tolerable. Figure 14 shows a temperature maximum value at Point D for Case F_BCUC of about 37.5 °C, so slightly higher than that of Case F_ORG. This may have been due to the lack of natural air inflow, as the natural air inlet was closed, allowing the temperature to rise gradually. Figure 13 shows that the maximum temperature at the rear Point R decreased slightly, with the mean decreasing by about 9 °C. This phenomenon showed that only some of the heat accumulated in the back, as there was no natural draught. In the case without a smoke exhaust system, this phenomenon allowed people to escape the fire more easily. In the same way, Figure 15 shows that the temperature at Point R of Case F_BCUC was lower than that of Case F_ORG by over 10 °C, thus proving the effect that natural ventilation had on the indoor fire scenario.
In terms of visibility, Figure 16 shows the visibility at Point D of Case F_BCUC to be much lower than that of Case F_ORG. The minimum decreased to less than 5 m, and the mean decreased to 17.5 m. When there was no natural draught inflow, the smoke accumulated and the visibility gradually decreased. As Figure 17 shows, the visibility at the rear Point R of Case F_BCUC increased, which meant that without the natural draught, the smoke was not blown to the back of the interior. This phenomenon is a positive as regards the evacuation of people from the premises. The mean increased by about 3 m, but remained below 10 m. It was observed that without the smoke exhaust system, the rear smoke accumulation was still apparent, but less severe than that of Case F_ORG.
Figure 18 shows the visibility variation at Point D of Case F_ BCUC. The visibility was less than 10 m after 155 s, which was more severe than for Case F_ORG. It was proved again that smoke accumulated when there was no natural draught inflow. As Figure 19 shows, the visibility at Point R was a little better, but after 110 s it was less than 10 m. The result showed that when a fire occurs, if the air inlet under the platform is closed, the heat and smoke can be prevented from flowing to the rear escape route, but that any improvement in the fire scene conditions is limited.
(B) 
Improvement strategy 2: Case F_BOUO
The second improvement method, Case F_BOUO, involved an open smoke exhaust port set in the upper end of the indoor back wall. The effect of this exhaust port on the removal of smoke from the fire scene was analyzed.
As Figure 12 shows, the temperature at Point D of Case F_BOUO was decreased slightly from 60 to 240 s. In comparison to Case F_ORG, the maximum and average temperature values were similar. Figure 12 and Figure 14 show the temperature at Point D to be the lowest of the various cases. As compared with Case F_ORG and Case F_BCUC, the ambient environment was better.
As Figure 13 shows, there was an obvious change in the maximum temperature at the rear Point R. The mean was about 19 °C lower than that of Case F_ORG. The heat storage in the rear of the interior was greatly reduced. Figure 15 indicates that the temperature change at Point R was the lowest of the various cases. The temperature was lower than 32.5 °C. The upper smoke exhaust port in the back wall was effective. As it was in a high position, the smoke was efficiently removed and the heat and smoke storage in the rear of interior reduced.
As to the indoor states of Case F_ORG and Case F_BOUO, Figure 20 and Figure 21 show the temperature distribution of the longitudinal section in the center of the room at 120 s, and Figure 22 and Figure 23 show the distribution of visibility at 120 s. As shown in Figure 20 and Figure 22, there was an ascending fire plume at the fire point for Case F_ORG, with more hot air in the back. Therefore, the temperature and visibility change at Point D was slight. Compared with Case F_BOUO, Figure 20 shows that the high-temperature layer of Case F_ORG was apparently lower, especially in the rear position. Figure 22 shows the obvious smoke storage, possibly related to the original design mode, with the hot air still flowing out through the lower air outlet in the rear wall and resulting in the storage of heat and smoke. Figure 21 proves that the fire scene environment was effectively improved after the installation of the upper smoke exhaust port. Figure 21 and Figure 23 show that due to the flow of the natural draught, the temperature and smoke distribution at Point D of Case F_BOUO was disordered, but that the temperature and smoke at Point R were better.
As Figure 16 and Figure 18 show, the visibility at center point D of Case F_BOUO decreased slightly, to less than 10 m after 205 s. Generally speaking, the indoor environment was not severe. Figure 17 and Figure 19 show that the visibility at the rear Point R was slightly less than 10 m at the 70 to 80 s mark, but fair in the other periods. According to this data, the environment for the Case F_BOUO fire scenario was better, meaning that the smoke exhaust port effectively improved the fire scene environment.
(C) 
Improvement strategy 3: Case F_BCUO
The third improvement method, Case F_BCUO, involved the closing of the air inlet under the platform. The purpose here was to analyze the effect of the smoke exhaust port in the back wall and the interruption of the inflow on the fire scene.
Figure 12 shows a comparison of Case F_BCUO and Case F_ORG, and the increase in temperature at center Point D. The average and maximum temperature value increased by 4 and 6 °C, respectively, displaying a phenomenon similar to that of Case F_BCUC. As Figure 13 shows, the temperature at Point R decreased, the maximum value was reduced by 22 °C and the mean decreased from 49 °C to 33 °C, a reduction of 16 °C. It was observed that the amount of indoor heat storage was reduced as a result of the installation of an air inlet in the upper part of the back wall. The improvement in the indoor conditions was not as good as that of Case F_BOUO. As Figure 15 shows, the temperature change trend of Case F_BCUO was the second best of the scenarios.
In terms of visibility, Figure 16 shows that visibility at Point D of Case F_BCUO decreased. The minimum decreased to 2.5 m, and the mean decreased to 13 m. The indoor conditions were similar to that of Case F_BCUC. It was obvious that without the natural draught inflow, the heat and smoke accumulated. As Figure 18 shows, the visibility at Point D of Case F_ BCUO was less than 10 m at 130 s, and worse than that of Case F_ORG or Case F_ BCUC, even though the conditions were not severe. An appropriate make-up effect is necessary for natural smoke discharge at a fire scene.
As Figure 17 and Figure 19 show, the visibility at Point R was slightly better than that of Case F_ORG or Case F_ BCUC at 75 to 120 s. However, the visibility was less than 10 m after 120 s. The center deteriorated in this case, but the hot air and smoke storage in the rear of the interior was improved to some extent. As Point R was located in the important escape route, the upper smoke exhaust port in the back wall improved the conditions of the escape route. If a make-up port were installed, the improvement effect would be better. This trend was found by comparing Case F_ BCUO with Case F_BOUO.
The condition under the ceiling at rear Point R indoors was observed; as the results in Figure 24 show, Case F_BOUO had the least severe hot air storage, with a maximum temperature lower than 63 °C. The maximum temperature of Case F_BCUC without the outside air inflow was close to 80 °C, higher than that of Case F_ORG. However, Figure 13 and Figure 17 show that the temperature and visibility were better than that of Case F_ORG. This phenomenon was similar to the smoke control strategy of “storage”.
In addition, Figure 25 shows that the visibility decreased rapidly before 90 s, meaning that the smoke accumulated rapidly. According to the comparison between Case F_BCUC and Case F_BCUO, when the air inlet under the platform was closed, the rate of the decrease in visibility was slightly lower (comparison between Case F_ORG and Case F_BOUO). The flow of natural draught accelerated the storage of smoke under the rear ceiling indoors.

5.4. Effect of Natural Draught

In Case F_ORG_33, the outside natural wind velocity increased from 1.5 m/s to about 3.3 m/s. Figure 12 and Figure 13 show the temperature distribution at measuring points D and R. The variance in Point D was slight as compared with Case F_ORG. The mean temperature at Point R was about 3 °C lower than that of Case F_ORG. Figure 16 and Figure 17 show the visibility at points D and R. The visibility at Point D was reduced, and the variance at Point R was slight. The strong natural wind had little effect on the diffusion of dense smoke, and the visibility at Point R remained poor, which meant that natural ventilation impacted the indoor fire scene and must be handled properly.

5.5. Evaluation of Make-up Effect

This research proved that the inflow of natural wind has a considerable influence on diffusing heat and smoke to the rear of the building interior. In addition, the make-up effect was evaluated. Case F_B2UO and Case F_B3UO change some conditions of Case F_BOUO. When the smoke exhaust port was set in the upper part of the back wall, only the No. 2 or No. 3 air inlet was opened. The other air inlets were closed.
Figure 12 and Figure 13 show the indoor temperature distribution, and Figure 16 and Figure 17 show the distribution of visibility. The temperature at Point D rose slightly, as compared with Case F_ORG, with the mean and maximum increasing by about 3 °C, meaning that the hot air accumulated gradually. The mean temperatures at Point R were reduced by over 15 °C. The visibility at Point D tended to be worse; Case F_B3UO was relatively severe. However, the state of Point R of the escape route was improved; Case F_B3UO was relatively good. The air flow cycle at the air inlet and the rear air outlet and rear door made for favorable evacuation conditions. The improvement results of the safety level of the building using the different measurement are summarized in Table 6. The results show that smoke exhaust is the most crucial factor. The appropriate position of make-up ports is also important.
In a stable external condition, the air inlet under the platform had different air inflows. Table 7 indicates the air inflows of the various cases at different time points. The air flow of Case F_ORG was 11.09 m3/s at 120 s, and the air flow increased to 12.51 m3/s at 240 s. When the natural wind increased to 3.3 m/s, the air flow of Case F_ORG_33 was 10.82 m3/s at 120 s and 12.45 m3/s at 240 s. Considering the error factor of the numerical simulation, the variation was not obvious. The air flow of Case F_BOUO at 120 and 240 s was 13.73 and 14.45 m3/s, respectively, which are increases of 23.8% and 15.5%, respectively. The smoke exhaust port in the indoor back wall increased the outside air input; this was related to the exhaust smoke level.
The air flow of Case F_B2UO at 120 and 240 s was 9.43 and 10.28 m3/s, respectively, and that of Case F_B3UO was 10.01 and 11.46 m3/s, respectively. If the air inlet was close to the fire source, due to the obstruction of combustible material and the counter diffusion of hot air, there was minimal air input. As showed in Figure 13 and Figure 17, the different make-up port positions had significant effects on the indoor fire scene environment.

5.6. Effect of Smoke Extraction

The displacement of the metal shaft in different cases was analyzed, as shown in Table 8. The exhaust smoke level of Case F_ORG was 20.93 m3/s at 120 s, and it increased to 24.15 m3/s at 240 s. When the natural wind increased to 3.3 m/s, the exhaust smoke level of Case F_ORG_33 was 19.89 and 24.09 m3/s, respectively, at 120 and 240 s. In this case, the exhaust smoke level was influenced slightly by the natural wind change.
Three improvement cases were analyzed, and the exhaust smoke levels at 240 s were sequenced as below; the percentage is the ratio of increase or decrease.
Case F_BOUO (30.25 m3/s; 25.3%) > Case F_BCUO (28.78 m3/s; 19.2%) > Case F_BCUC (24.10 m3/s; −0.2%)
When the air inlet was set in the upper part of the back wall, the indoor environment was improved due to the increase in the level of exhaust smoke. This demonstrated there to be a significant stack effect, and accounted for the visibility increase at Point R of Case F_BOUO and Case F_BCUO, as shown in Figure 17. However, as there was no make-up effect, the increase in the visibility at Point R of Case F_BCUO was limited. Referring to the result in Figure 19, Case F_B2UO was compared with Case F_B3UO, and the exhaust smoke level of the two cases at 240 s was 28.75 (+19.0%) and 30.65 (+26.9%) m3/s, respectively, higher than for Case F_ORG. This was the same trend as in Figure 17, showing that the increase in the exhaust smoke level of Case F_B3UO was directly correlated with the better visibility at Point R.
In addition, the emission of smoke through the lower air outlet or upper smoke exhaust port in the wall was analyzed. Table 9 and Table 10 show the outflow of smoke. The metal shaft wall surface temperature was high because it was in the sun, and the gas in it heated and expanded. The exhaust smoke level was slightly higher than the sum in Table 9 and Table 10.
Table 10 indicates that with an upper smoke exhaust port, the smoke could be removed in large quantities. For example, the exhaust smoke level of Case F_ORG through the lower air outlet was 24.12 m3/s at 240 s. The exhaust smoke level of Case F_BOUO decreased to 12.78 m3/s. The upper smoke exhaust port removed smoke at 17.36 m3/s, the latter one accounting for 57.6%. A great deal of smoke could be removed through the upper air inlet, as with Case F_BCUO. At 240 s, the exhaust smoke level through the lower air outlet and the upper smoke exhaust port was 11.68 and 17.02 m3/s, respectively, the latter one accounting for 59.3%. As there was no make-up effect, the total exhaust smoke level of Case F_BCUO was lower than that of Case F_BOUO by 1.47 m3/s. The upper outlet was reduced by 0.34 m3/s, and the lower outlet was reduced by 1.10 m3/s, or 2.9 and 6.5%, respectively, which meant that the effect on the lower exhaust flow was significant.
The total exhaust smoke level of Case F_B3UO was higher than that of Case F_BOUO, because the upper air inlet had a higher exhaust smoke level (18.40 > 17.36 m3/s), an increase of about 6.0%.

6. Conclusions

The current research trend focuses on energy-saving buildings and how to make them “energy saving” and “safe” simultaneously. This study focused on fire safety enhancement measures for an energy-saving building. By law, the space is exempted from fume extractors, but some improvement strategies can be undertaken, despite the interior space having been constructed with highly flammable materials. This study proved that kiln natural ventilation generated a sufficient air flow to create a comfortable environment. However, natural wind enters the room, blowing the heat and smoke to the rear escape route indoors when a fire occurs.
Most evaluation indices have not taken into consideration the ventilation effect during fires. The results show that smoke exhaust is the most crucial factor. The appropriate position of make-up ports is also important. If there is no smoke exhaust system, closing the natural air inlet is slightly helpful for the evacuation of people, but the improvement is limited. If one smoke exhaust port is opened, according to the existing smoke exhaust system setup specifications, in the back wall indoors, the heat and smoke can be removed effectively, which improves the safety of the building.
The findings showed that the risk of smoke diffusion could be reduced by reducing the inlet air flow, which explains why the barns in Japan in the Edo period used fire suppression stones. The findings of this study also showed that when a fire occurs, the position of the air inlet port influenced the diffusion of dense smoke. Therefore, the need to control the off state of each air inlet and to set up an exhaust port in the rear of room are the major findings of this study. The installation of the necessary equipment would have a modest cost, and it could work in conjunction with the existing fire detection system.

Acknowledgments

The authors gratefully acknowledge the financial support for this project from the Ministry of Science and Technology under Grant no. NSC 100-2221-E-274-007.

Author Contributions

Hong-Sheng Huang and Chung-Hwei Su conceived and designed the simulation scenarios. Furthermore, Chung-Hwei Su contributed to draft writing and language editing. Cheng-Bang Li performed the simulation. Ching-Yuan Lin supervised the article content and provided the advice for improvement from the original manuscript. Hong-Sheng Huang and Chun-Chou Lin analyzed the data of the numerical results.

Conflicts of Interest

The authors declare no conflict of interest.

References

  1. Dall’O, G.; Bruni, E.; Panza, A. Improvement of the Sustainability of Existing School Buildings According to the Leadership in Energy and Environmental Design (LEED)® Protocol: A Case Study in Italy. Energies 2013, 6, 6487–6507. [Google Scholar] [CrossRef] [Green Version]
  2. GhaffarianHoseini, A.; Dahlan, N.D.; Berardi, U.; GhaffarianHoseini, A.; Makaremi, N.; GhaffarianHoseini, M. Sustainable energy performances of green buildings: A review of current theories, implementations and challenges. Renew. Sustain. Energy Rev. 2013, 25, 1–17. [Google Scholar] [CrossRef]
  3. Huang, K.T.; Huang, W.P.; Lin, T.P.; Hwang, R.L. Implementation of green building specification credits for better thermal conditions in naturally ventilated school buildings. Build. Environ. 2015, 86, 141–150. [Google Scholar] [CrossRef]
  4. Xiaoping, M.; Huimin, L.; Qiming, L. A comparison study of mainstream sustainable/green building rating tools in the world. In Proceedings of the MASS’09. International Conference on Management and Service Science, Wuhan, China, 20–22 September 2009; pp. 1–5.
  5. Alyami, S.H.; Rezgui, Y. Sustainable building assessment tool development approach. Sustain. Cities Soc. 2012, 5, 52–62. [Google Scholar] [CrossRef]
  6. Kibert, C.J. Chapter 4: Green Building Assessment. In Sustainable Construction: Green Building Design and Delivery; John Wiley & Sons, Inc: New York, NY, USA, 2012. [Google Scholar]
  7. Lin, H.T.; Zhuang, H.W.; Chang, C.Y.; Chen, C.N. Green Building Assessment Handbook; Basic, ABRI: Taipei, Taiwan, 2012. (In Chinese) [Google Scholar]
  8. Lin, H.T. Policy and Evaluation System for Green Building in Subtropical Taiwan. In Tropical Sustainable Architecture: Social and Environmental Dimensions; Bay, J.-H., Ong, B.L., Eds.; Architectural Press: Oxford, UK, 2006; pp. 101–124. [Google Scholar]
  9. Yang, K.H.; Hwang, R.L. An improved assessment model of variable frequency-driven direct expansion air-conditioning system in commercial buildings for Taiwan green building rating system. Build. Environ. 2007, 42, 3582–3588. [Google Scholar] [CrossRef]
  10. Chow, W.K. Fire safety in green or sustainable buildings: Application of the fire engineering approach in Hong Kong. Archit. Sci. Rev. 2003, 46, 297–303. [Google Scholar] [CrossRef]
  11. Tidwell, J.; Murphy, J.J. Bridging the Gap: Fire Safety and Green Buildings. National Association of State Fire Marshals, 2010; Available online: http://www.firemarshalsarchives.org/pdf/FireSafetyGreenBuildingHiResFINALv3sec.pdf (accessed on 10 December 2015).
  12. Meacham, B.; Poole, B.; Echeverria, J.; Cheng, R. Fire Safety Challenges of Green Buildings. Springer Science and Business Media. Final Report. 2013. Available online: file:///D:/Administrator/Downloads/rffiresafetygreenbuildings.pdf (accessed on 10 December 2015).
  13. Yau, A.; Ho, S.K. Fire Risk Analysis and Optimization of Fire Prevention Management for Green Building Design and High Rise Buildings: Hong Kong Experience. Nang Yan Bus. J. 2014, 3, 41–54. [Google Scholar]
  14. Chow, W.K. Performance-based approach to determining fire safety provisions for buildings in the Asia-Oceania regions. Build. Environ. 2015, 91, 127–137. [Google Scholar] [CrossRef]
  15. Ding, W.; Minegishi, Y.; Hasemi, Y.; Yamada, T. Smoke control based on a solar-assisted natural ventilation system. Build. Environ. 2004, 39, 775–782. [Google Scholar] [CrossRef]
  16. Chow, W.K.; Zhao, J.H. Scale modeling studies on stack effect in tall vertical shafts. J. Fire Sci. 2011, 29, 531–542. [Google Scholar] [CrossRef]
  17. Su, C.H.; Lin, Y.C.; Shu, C.M.; Hsu, M.C. Stack effect of smoke for an old-style apartment in Taiwan. Build. Environ. 2011, 46, 2425–2433. [Google Scholar] [CrossRef]
  18. Schulze, T.; Eicker, U. Controlled natural ventilation for energy efficient buildings. Energy Build. 2013, 56, 221–232. [Google Scholar] [CrossRef]
  19. Asdrubali, F.; Buratti, C.; Cotana, F.; Baldinelli, G.; Goretti, M.; Moretti, E.; Vergoni, M. Evaluation of green buildings’ overall performance through in situ monitoring and simulations. Energies 2013, 6, 6525–6547. [Google Scholar] [CrossRef]
  20. Su, C.H.; Huang, H.S.; Lin, C.C.; Lin, C.Y. Numerical Simulation of The Impact of Natural Ventilation on Fire Safety in Green Buildings. In the 2nd Asia conference of International Building Performance Simulation Association (ASim2014), Nagoya, Japan, 28–29 November 2014; 2014; pp. 115–122. [Google Scholar]
  21. Munson, B.R.; Young, D.F.; Okiishi, T.H.; Huebsch, W.W. Chapter 5: Finite Control Volume Analysis. In Fundamentals of Fluid Mechanics; John Wiley & Sons, Inc: New York, NY, USA, 2010. [Google Scholar]
  22. Ding, W.; Hasemi, Y.; Yamada, T. Natural ventilation performance of a double-skin façade with a solar chimney. Energy Build. 2005, 37, 411–418. [Google Scholar] [CrossRef]
  23. Wu, Y.T. Ventilation Efficiency Analysis of Passive Solar Chimney—A Case Study of the Exhibition Room in the Magic School of Green Technology. M.Sc. Thesis, Department of Architecture, National Cheng Kung University, Tainan, Taiwan, 2010. [Google Scholar]
  24. Chien, C.H.; Lin, H.T.; Chou, J.H.; Su, T.C. Buoyancy Ventilation Efficiency Analysis of a Conference Hall. Appl. Mech. Mater. 2011, 71, 2442–2446. [Google Scholar] [CrossRef]
  25. Milke, J.A.; Hugue, D.E.; Hoskins, B.L.; Carroll, J.P. Tenability Analyses in Performance-Based Design Methods for appraising the effects of exposure to smoke or heat from a fire. Fire Prot. Eng. 2005, 28, 50. [Google Scholar]
  26. Chang, B.L.; Tang, C.H. The Simulating Situation and the Escaping Strategy for Disabilities in the Huge Underground Space; Project Report; Ministry of the Interior, Building Research Institute, 2012; Available online: http://ir.lib.pccu.edu.tw/retrieve/46616/RRPG10101–0478–2732835[1].pdf (accessed on 10 December 2015). (In Chinese)
  27. Wang, Y.C.; Lin, H.T. Energy-Saving Techniques of Full-Scale Green Building Analysis Research-Taiwan’s First Zero-Carbon Green Building. Appl. Mech. Mater. 2012, 121, 3058–3066. [Google Scholar] [CrossRef]
  28. Zhaia, Z.Q.; Chen, Q.Y. Solution characters of iterative coupling between energy simulation and CFD programs. Energy Build. 2003, 35, 493–505. [Google Scholar] [CrossRef]
  29. Goldsworthy, M. Dynamic coupling of the transient system simulation and fire dynamics simulation programs. J. Build. Perform. Simul. 2012, 5, 105–114. [Google Scholar] [CrossRef]
  30. Arendt, K.; Krzaczek, M. Co-simulation strategy of transient CFD and heat transfer in building thermal envelope based on calibrated heat transfer coefficients. Int. J. Therm Sci. 2014, 85, 1–11. [Google Scholar] [CrossRef]
  31. Su, C.H.; Tsai, K.C.; Xu, M.Y. Computational analysis on the performance of smoke exhaust systems in small vestibules of high-rise buildings. J. Build. Perform. Simul. 2015, 8, 239–252. [Google Scholar] [CrossRef]
  32. Xiao, B. Comparison of Numerical and Experimental Results of Fire Induced Doorway Flows. Fire Technol. 2012, 48, 595–614. [Google Scholar] [CrossRef]
  33. Doheim, R.M.; Yohanis, Y.G.; Nadjai, A.; Elkadi, H. The impact of atrium shape on natural smoke ventilation. Fire Saf. J. 2014, 63, 9–16. [Google Scholar] [CrossRef]
  34. Suard, S.; Koched, A.; Pretrel, H.; Audouin, L. Numerical simulations of fire-induced doorway flows in a small scale enclosure. Int. J. Heat Mass Transf. 2015, 81, 578–590. [Google Scholar] [CrossRef]
  35. Yi, L.; Chow, W.K.; Li, Y.Z.; Huo, R. A simple two-layer zone model on mechanical exhaust in an atrium. Building and environment. 2005, 40, 869–880. [Google Scholar] [CrossRef]
  36. Klote, J.H.; Ferreira, M.J.; Kashef, A.; Turnbull, P.G.; Milke, J.A. Chapter20: Computational Fluid Dynamics. In Handbook of Smoke Control Engineering; American Society of Heating Refrigerating and Air-Conditioning Engineers: Atlanta, GA, USA, 2012; pp. 405–416. [Google Scholar]
  37. McGrattan, K.; McDermott, R.; Weinschenk, C.; Overholt, K. Fire dynamics simulator (Version 6); User’s Guide. NIST Special Publication 1019 (6); National Institute of Standards and Technology: Gaithersburg, MD, USA, 2015. [Google Scholar]
  38. Grandison, A.J.; Patel, M.K.; Galea, E.R. Development of Standards for Fire Field Models. Report on SMARTFIRE Phase 2 Simulations; Research Report 1/2003; Office of the Deputy Prime Minister, Fire Research Division: London, UK, 2003. [Google Scholar]
  39. Wang, Y.; Chatterjee, P.; de Ris, J.L. Large eddy simulation of fire plumes. Proc. Combust. Inst. 2011, 33, 2473–2480. [Google Scholar] [CrossRef]
  40. Rinne, T.; Hietaniemi, J.; Hostikka, S. Experimental Validation of the FDS Simulations of Smoke and Toxic gas Concentrations. VTT: Finlan, 2007; Available online: http://www.vtt.fi/inf/pdf/workingpapers/2007/W66.pdf (accessed on 10 December 2015).
  41. Ministry of the Interior of Taiwan. Approval Directions for Fire Extinguisher. National Fire Agency: Taipei, Taiwan, 2013; pp. 3–5. (In Chinese) [Google Scholar]
  42. Chen, Y.H.; Su, C.H.; Tseng, J.M.; Li, W.J. Experimental and numerical analysis of the cooling performance of water spraying systems during a fire. PLoS ONE 2015, 10, e0118306. [Google Scholar] [CrossRef] [PubMed]
  43. Baum, H.R.; MaCaffery, K.B. Fire Induced Flow Field-Theory and Experiment. Fire Saf. Sci. 1989, 129–148. [Google Scholar] [CrossRef]
  44. Averill, J.D. Pedestrian and Evacuation Dynamics. In Five Grand Challenges in Pedestrian and Evacuation Dynamics; Springer US: New York, NY, USA, 2011; pp. 1–11. [Google Scholar]
  45. Purser, D. Comparisons of Evacuation Efficiency and Pre-Travel Activity Times in reSponse to a Sounder and Two Different Voice Alarm Messages. In Pedestrian and Evacuation Dynamics; Springer: Berlin, Germany, 2008; pp. 121–134. [Google Scholar]
  46. Fraser, S.A.; Wood, N.J.; Johnston, D.M.; Leonard, G.S.; Greening, P.D.; Rossetto, T. Variable population exposure and distributed travel speeds in least-cost tsunami evacuation modelling. Nat. Hazard. Earth Syst. Sci. 2014, 14, 2975–2991. [Google Scholar] [CrossRef]
  47. Korhonen, T.; Hostikka, S. Fire Dynamics Simulator with Evacuation: FDS+ Evac. Technical Reference and User’s Guide; VTT Technical Research Centre of Finland: Helsinki, Finland, 2009; p. 119. [Google Scholar]
  48. Kuligowski, E.D. Computer Evacuation Models for Buildings. In SFPE Handbook of Fire Protection Engineering; Springer: New York, NY, USA, 2016; pp. 2152–2180. [Google Scholar]
Figure 1. (A) Exterior of a Japanese barn during the Edo period (1603–1868). (B) A fire suppression stone used in Edo period barns.
Energies 09 00192 g001
Figure 2. Force distribution on the fluid.
Energies 09 00192 g002
Figure 3. Heat release rate curve of wood model [40].
Energies 09 00192 g003
Figure 4. (A) The woodpile model (standard model for Fire Extinguisher Approval testing); and (B) an isometric view of the wood model.
Energies 09 00192 g004
Figure 5. Heat release rate curve of the woodpile model in simulation.
Energies 09 00192 g005
Figure 6. Building appearance: (A) front isometric view; (B) side view; and (C) rear isometric view.
Energies 09 00192 g006aEnergies 09 00192 g006b
Figure 7. Position and symbol definition of measuring points.
Energies 09 00192 g007
Figure 8. The results of stochastic simulation statistics on the implementation of 120 times.
Energies 09 00192 g008
Figure 9. People evacuation situation for Case F_ORG (A) time = 0 s, (B) time = 72 s, (C) time = 144 s.
Energies 09 00192 g009
Figure 10. Temperature profile in the normal situation.
Energies 09 00192 g010
Figure 11. Velocity profile of the normal ventilation.
Energies 09 00192 g011
Figure 12. Temperature variations from 60 s to 240 s at Point D (at a height of 1.8 m).
Energies 09 00192 g012
Figure 13. Temperature variations from 60 s to 240 s at Point R (at a height of 1.8 m).
Energies 09 00192 g013
Figure 14. Temperature curves at Point D (at a height of 1.8 m).
Energies 09 00192 g014
Figure 15. Temperature curves at Point R (at a height of 1.8 m).
Energies 09 00192 g015
Figure 16. Visibility variations from 60 s to 240 s at Point D (at a height of 1.8 m).
Energies 09 00192 g016
Figure 17. Visibility variations between 60 s and 240 s at Point R (at a height of 1.8 m).
Energies 09 00192 g017
Figure 18. Visibility curves at Point D (at a height of 1.8 m).
Energies 09 00192 g018
Figure 19. Visibility curves at Point R (at a height of 1.8 m).
Energies 09 00192 g019
Figure 20. Temperature profile in Case F_ORG (at 120 s).
Energies 09 00192 g020
Figure 21. Temperature profile in Case F_BOUO (at 120 s).
Energies 09 00192 g021
Figure 22. Visibility profile in Case F_ORG (at 120 s).
Energies 09 00192 g022
Figure 23. Visibility profile in Case F_BOUO (at 120 s).
Energies 09 00192 g023
Figure 24. Temperature curves of the roof above Point R.
Energies 09 00192 g024
Figure 25. Visibility curves of the roof above Point R.
Energies 09 00192 g025
Table 1. Global green building assessment indices.
CountryAssessment IndexCountryAssessment Index
AustraliaGreen StarMexicoSICES
CanadaLEED-CanadaNew ZealandGreen Star NZ
ChinaGBASRussiaLEED-Russia
DenmarkBEATSouth AfricaGreen Star
HollandEcoQuantumTaiwanEEWH
JapanCASBEEUKBREEAM
KoreaCBCSUSALEED
Table 2. Safety standards in a fire in Taiwan.
Physical FactorCritical Level
Environmental temperaturelower than 60 °C
Visibilityless than 10 m
Table 3. Scenario description in the different simulation cases.
ParametersNumerical SimulationEntity
Size50 mm × 50 mm × 800 mm30 mm × 35 mm × 900 mm
Heat Release Rate Per Unit Area (HRRPUA)175 kW/m2-
Density369.6 kg/m3-
Combustion heat17,900 kJ/kg-
Ignition temperature384 °C-
Volume0.002 m3/each0.000945 m3/each
Surface Area0.165 m2/each0.1191 m2/each
The total number104 sticks144 sticks
The total surface Area17.16 m217.1504 m2
Table 4. The codings of fire scenarios.
Case No.Description
F_ORGoriginal status under light air (1.5 m/s)*
F_ORG33original status under light breeze (3.3 m/s)**
Openings
Beneath the podium
Upper opening
on the rear wall
F_BCUCAll (No. 1, 2, 3) closeclose
F_BOUOAll openopen
F_BCUOAll closeopen
F_B2UONo. 2 openopen
F_B3UONo. 3 openopen
Case CodingsF_:in Fire situation
ORG:ORiGinal status (natural wind speed is 1.5 m/s)
_33:ORiGinal status in 3.3 m/s wind speed
B:openings Beneath the podium
U:Upper opening on the rear wall
C/O:Close/Open
2/3:No. 2/3 inlet opened below the podium
*: Light air defined in Beaufort Wind Scale; **: Light breeze defined in Beaufort Wind Scale.
Table 5. Parameters of the evacuation model under the original status of the room
Simulation ParametersValue
Occupancy330 persons*(Referring to official information)
Dimensions of the front and rear door2 m (W) × 2 m (H)
Area of the room22.5 m (L) × 16 m (W)
Pre-movement timefrom 32 to 60 s [45]
Walking speedfrom 0.8 ± 0.3 to 1.35 ± 0.20 m/s [47,48]
Shoulder breadthfrom 0.21 ± 0.015 to 0.27 ± 0.02 m [47]
* The percent of male adults, female adults, children and elderly people are all 25%.
Table 6. The situation of Point D and R in various scenarios.
Time
(s)
Case No.Point DPoint R
Temperature
(°C)
Visibility
(m)
Temperature
(°C)
Visibility
(m)
60F_ORG26.730.029.313.3
F_ORG3326.730.029.313.1
F_BCUC28.030.030.95.0
F_BOUO26.830.028.030.0
F_BCUO28.030.028.030.0
F_B2UO28.030.029.810.7
F_B3UO28.030.028.130.0
120F_ORG27.930.050.40.6
F_ORG3328.230.044.11.1
F_BCUC31.017.941.01.5
F_BOUO28.030.028.330.0
F_BCUO31.519.129.517.2
F_B2UO30.230.033.25.4
F_B3UO30.822.233.26.2
183F_ORG30.427.163.80.5
F_ORG3330.823.838.22.5
F_BCUC34.87.134.86.2
F_BOUO28.029.631.612.1
F_BCUO33.35.931.514.0
F_B2UO34.04.134.54.8
F_B3UO32.15.735.12.6
Table 7. Total flow rates of inlets below the podium for different cases.
Time
(s)
Flow Rate (m3/s)
F_ORGF_ORG_33F_BCUCF_BCUOF_BOUOF_B2UOF_B3UO
12011.0910.82
(−2.4%) *
--13.73
(+23.8%)
9.43
(−15.0%)
10.01
(−9.7%)
18012.2012.26
(+0.5%)
--14.32
(+17.4%)
10.39
(−14.8%)
11.50
(−5.7%)
24012.5112.45
(−0.5%)
--14.45
(+15.5%)
10.28
(−17.8%)
11.46
(−8.4%)
*: Compared with Case F_ORG. A positive sign means the increase percentage in the flow rate, and a negative sign indicates the reduce percentage.
Table 8. Flow rate of the metal shaft.
Time
(s)
Flow Rate (m3/s)
F_ORGF_ORG_33F_BCUCF_BCUOF_BOUOF_B2UOF_B3UO
12020.9319.89
(−5.0%) *
18.23
(−12.9%)
26.02
(+24.3%)
29.54
(+41.1%)
26.56
(+26.9%)
27.25
(+30.2%)
18023.5623.93
(+1.6%)
22.70
(−3.7%)
29.24
(+24.1%)
30.32
(+28.7%)
29.04
(+23.3%)
31.61
(+34.2%)
24024.1524.09
(−0.2%)
24.10
(−0.2%)
28.78
(+19.2%)
30.25
(+25.3%)
28.75
(+19.0%)
30.65
(+26.9%)
*: Compared with Case F_ORG. A positive sign means the increase percentage in the flow rate, and a negative sign indicates the reduce percentage.
Table 9. Flow rate of the air outlet (Exhaust-L).
Time
(s)
Flow Rate (m3/s)
F_ORGF_ORG_33F_BCUCF_BCUOF_BOUOF_B2UOF_B3UO
12020.8419.80
(−5.0%)
18.14
(−13.0%)
10.05
(−51.8%)
11.99
(−42.5%)
10.61
(−49.1%)
10.64
(−48.9%)
18023.5123.89
(+1.6%)
22.67
(-3.6%)
11.85
(−49.6%)
12.68
(−46.1%)
12.40
(−47.3%)
12.50
(−46.8%)
24024.1224.05
(−0.3%)
24.11
(−0.0%)
11.68
(−51.6%)
12.78
(−47.0%)
12.01
(−50.2%)
12.18
(−49.5%)
*: Compared with Case F_ORG. A positive sign means the increase percentage in the flow rate, and a negative sign indicates the reduce percentage.
Table 10. Flow rate of the smoke exhaust port (Exhaust-U).
Time
(s)
Flow Rate (m3/s)
F_ORGF_ORG_33F_BCUCF_BCUOF_BOUOF_B2UOF_B3UO
120---15.87
(−9.0%)
17.4315.85
(−9.1%)
16.51
(−5.3%)
180---17.33
(−1.2%)
17.5416.56
(−5.6%)
19.05
(+8.6%)
240---17.02
(−2.0%)
17.3616.65
(−4.1%)
18.40
(+6.0%)
*: Compared with Case F_ BOUO. A positive sign means the increase percentage in the flow rate, and a negative sign indicates the reduce percentage.

