Article

Comparisons of Modeling and State of Charge Estimation for Lithium-Ion Battery Based on Fractional Order and Integral Order Methods

Faculty of Transportation Engineering, Kunming University of Science and Technology, Kunming 650500, China
*
Author to whom correspondence should be addressed.
Energies 2016, 9(3), 184; https://doi.org/10.3390/en9030184
Submission received: 7 January 2016 / Revised: 27 February 2016 / Accepted: 1 March 2016 / Published: 10 March 2016

Abstract

:
In order to properly manage lithium-ion batteries of electric vehicles (EVs), it is essential to build the battery model and estimate the state of charge (SOC). In this paper, the fractional order forms of Thevenin and partnership for a new generation of vehicles (PNGV) models are built, of which the model parameters including the fractional orders and the corresponding resistance and capacitance values are simultaneously identified based on genetic algorithm (GA). The relationships between different model parameters and SOC are established and analyzed. The calculation precisions of the fractional order model (FOM) and integral order model (IOM) are validated and compared under hybrid test cycles. Finally, extended Kalman filter (EKF) is employed to estimate the SOC based on different models. The results prove that the FOMs can simulate the output voltage more accurately and the fractional order EKF (FOEKF) can estimate the SOC more precisely under dynamic conditions.

1. Introduction

Currently, lithium-ion batteries have attained substantial attention due to their high safety, long life, and high energy density [1,2]. It now becomes the main energy storage medium in electric vehicles (EVs), power grid and consumer electronic devices. In order to safely and effectively utilize lithium-ion batteries, it is necessary to build a precise model to capture the battery inner dynamic and static performance, thereby precisely estimating battery statuses including state of charge (SOC) and state of health (SOH).
The lithium-ion battery can be regarded as a highly nonlinear, time-variant system, which brings certain difficulty to model and simulate the battery performance. The commonly accepted modeling methods include electrochemical model method [3,4,5,6], black box model method [7,8], and equivalent circuit model (ECM) method [9,10,11]. Among all the candidates, the electrochemical model can precisely describe the inner chemical reaction process based on the measured values of battery current, voltage and surface temperature. The black box model usually adopts artificial neural network (ANN) and supported vector machine (SVM) to generate the nonlinear relationship with respect to the measurements. This kind of method relies on huge experimental data to train the model sufficiently thus ensuring its precision and adaption. Therefore, it needs considerable experiment and computation labor, which is not applicable in real implementation. Compared with these two model methods, the ECM method is usually composed of an open circuit voltage (OCV) source, one or two resistor-capacitor networks, as well as a resistor connected in series topology. This kind of model can be easily adapted for different driving cycles, and has been widely adopted in battery management system (BMS) of EVs. The order of ECM may vary due to the different chemical characteristics of battery materials. In [9,12], different structures of ECM are compared, which state that the one order Thevenin model is relatively simple and has high precision, and two and higher order models are more precise while inducing costs of more parameters and more dimensional matrix calculations. By contrast, a partnership for a new generation of vehicles (PNGV) model [13], which is based on the Thevenin model, connects in series with a capacitor to express the variation of OCV induced by accumulation of load current, thereby improving the model precision. Based on the above merits, these two kinds of methods, i.e., Thevenin and PNGV models, have been widely employed in the BMS.
Traditionally, the widely adopted modeling method of lithium-ion battery is based on the centralized integral order calculus (IOC). This method is relatively simple, however, the battery inner parameters including capacitance, resistance, which are with diffused and decentralized characteristics [6,14,15], may vary during battery operation. In addition, the variation of current and voltage not only relates to the current status, but also can be influenced by the past statuses. This is the so-called memory effect [16]. Therefore, it is quite difficult to adopt the traditional IOC model to accurately depict the battery inner distributed performance and memory effect. The fractional order model (FOM) can extend the application of integral order model (IOM), and can more precisely describe the gradually varied quantity and distributed parameters. Hence, the FOMs have been more and more widely applied in modeling [15,16] and controlling nonlinear systems [17,18,19], including the lithium-ion battery system.
According to the electrochemical impedance spectroscopy (EIS) of the lithium-ion battery, the low frequency section can be described by a constant phase element (CPE), and a parallel connection of a CPE and a resistor [20] can be employed to describe spectroscopy of the medium frequency section, which is usually a half compressed circle. In [21], the CPE has been accurately presented by the fractional order calculus (FOC) method. Based on the FOC method, many researchers have made efforts to build electrochemical models and ECM models, and have gained certain achievements. In [5,6], the electrochemical model of the lithium-ion battery has been built based on FOC. In [20,22,23], the fractional order ECM of different structures for the lithium-ion battery is built considering the CPE, and the experiments show acceptable precision. Moreover, in [5], the fractional differential equation is employed to partially describe the electrochemical characteristics of the lithium-ion battery, and thus reduces the quantity of model parameters. Furthermore, only three parameters are adopted to build the FOM for lithium-ion battery in [6], of which the error is declared within 0.5%. By this way, this model can greatly simplify the electrochemical model complexity.
In order to determine the structure and composition of FOM for lithium-ion battery, it is imperative to accurately identify model parameters. In [6], the voltage response curve when the battery is discharged with a step current has been classified into three sections, and the voltage drop, curvature and gradient are respectively introduced to fit three parameters of the fractional order electrochemical model. This method relies on appropriate section partition of voltage response curve and high fitting precision. For ECM based on the FOC method, the model orders as well as the resistor and capacitor parameters need to be identified step by step [20,22]. First, the angular of CPE is analyzed based on the impedance spectroscopy to determine the order. There exists a defect that the measurement of impedance scope needs particular equipment with appreciable cost [22,23]. In [20], a least square identification method is applied to identify the ohm resistance and resistance-capacitance parameters, while this method can only be feasible in premise of commensurate orders [24]. In [22], a Levenberg–Marquardt optimal algorithm is introduced to solve the gradient. In [23], the FOM of the lithium-ion battery is proposed, however, the parameter identification of FOC model is not yet finished.
The main purpose of modeling the battery is to estimate the battery inner statuses, including SOC and SOH. The SOC estimation is an essential task of the BMS, which represents the available battery capacity ratio, compared with the current rated capacity. The widely accepted estimation method is the coulomb counting method, which is also called ampere-hour counting method [8,25]. This method is easy to implement, however, this method can be easily affected by the current measurement and system noise, and also needs to know the initial SOC value. The accumulation of these issues can deteriorate the SOC estimation. A simple method based on the relationship between OCV and SOC is direct and easy to implement; however, it needs a highly precise OCV estimation or measurement [26,27]. Essentially, the coulomb counting method and the interpolation method based on OCV are both open-loop methods [28], and cannot be regulated with the help of output measurement. Extended Kalman filter (EKF) is an optimal state estimation for nonlinear systems, and has been widely applied to estimate the battery SOC [29,30,31,32,33]. In [29,30], EKF together with an optimization algorithm for identifying model parameters is applied to estimate the SOC on board. In [31,32,33], a double EKF based algorithm is proposed to realize parameters identification and status estimation simultaneously. Actually, its internal principle is that it can filter the system state noise and measurement noise, and simultaneously utilize the feedback of output voltage to regulate the SOC estimation obtained by the coulomb counting method [28,34,35,36]. Thus, the SOC estimation precision can be improved to some extent. In addition, this estimation method is independent of initial SOC value, which is an essential and difficult task for the coulomb counting method. Another merit is that the recursive formulations can be easily applied in the embedded computer system, and therefore have been substantially employed in real application [35,36].
In this paper, based on the widely adopted Thevenin and PNGV models, the fractional order Thevenin (FOThevenin) and fractional order PNGV (FOPNGV) models have been built and compared. Genetic algorithm (GA) is applied to simultaneously identify the orders of FOM and resistor and capacitor parameters for the lithium-ion battery. The precisions of these two models are compared and analyzed. Finally, EKF is applied to estimate the SOC, and the results based on different FOM and IOM are compared and summarized.

2. Fractional Order Model of Lithium-Ion Battery

2.1. FOC Definition

Actually, there are a variety of definitions for FOC [37]. Among all of them, Grünwald–Letnikov defined it with a discrete form, which is widely applied in numerical solution for FOC. Here, the α-order FOC for state x at time step k can be defined
Δ α x k = 1 T s α j = 0 k ( 1 ) j ( α j ) x k j ,
( α j ) = { 1 j = 0 α ( α 1 ) ( α ( j 1 ) ) j ! j > 0 ,
where Δ is the differential operator, N 1 < α < N , T s is the sample time, k N + . According to the definition, the α-order FOC of x during sample k is the weighed sum of initial state till end state, and the weighed coefficient is related with sample time T s , the calculus order and the distance j . When the distance is closer, the absolute value of weighed coefficient is larger, and vice versa. In real applications, when the distance from state x is longer, the absolute value of weighed coefficient is smaller. To decrease memory storage size and computation burden, the sum of the items can be reduced under the premise of meeting the calculation precision. Therefore, a recursive sum window, of which the length is L , can be considered, and thus
Δ α x k = { 1 T s α j = 0 k ( 1 ) j ( α j ) x k j     k < L 1 T s α j = 0 L ( 1 ) j ( α j ) x k j     k L
Based on Equation (3), it can be observed that by using a recursive window of length L , the weighed sum of states, which are near the current state, is selected to determine the FOC. In order to determine the recursive length L , the weighed coefficient in Equation (1) can be defined,
ω j α = ( 1 ) j ( α j ) ,
where the recursive calculation can be expressed as
{ ω 0 α = 1 j = 0 ω j α = ( 1 α + 1 j ) ω j 1 α j > 0   .
As shown in Figure 1, it can be observed that when α is selected at 0.5 and 0.99 respectively, which are near the mean and maximum values of the fractional order of the FOMs, the amount of calculation decreases rapidly. When the fractional order becomes larger, the calculation declines faster. Moreover, when j is larger than 70, the calculation is less than 0.001, and the corresponding voltage is 1 mV, thereby being enough to ensure the precision. Considering the voltage sample precision and amount of calculation, L is set to be 70, thus it can improve the calculation speed and decrease the demand of memory capacity without compromising the precision.

2.2. Fractional Order Models of Thevenin and PNGV

During the SOC calculation of lithium-ion battery, Thevenin and PNGV models have been widely adopted due to the limited parameters quantity and high precision. Their ECM schematics are shown in Figure 2, where V o c is open circuit voltage source, R p is an equivalent polarization resistor, C p denotes the equivalent polarization capacitor, R 0 represents the equivalent immediate resistor, C b is the capacitor which represents the variation of V o c induced by load current I , and U p , U 0 , U b and U t are the voltage drop of R p , R 0 , C b and terminal voltage of the battery, respectively.
For Thevenin model, the voltage equations can be formulated,
{ U t = V o c U p U 0 Δ α U p = U p R p C p + i C p   ,
where α is the fractional derivation order of the medium frequency section for the EIS of the battery, 0 < α 1 . When α is equal to 1, Equation (6) turns into integral order of Thevenin (IOThevenin) model. Here, we suppose x = [ U p ] , and y = V o c U t , the FOThevenin model can be expressed,
{ Δ α x = A x + B u y = C x + D u ,
where A = 1 / ( R p C p ) , B = 1 / C p , C = 1 , D = R 0 . According to Equation (1), its discrete form can be written as
Δ α x k = 1 T s α j = 0 k ( 1 ) j ( α j ) x k j   .
Thus, Equation (7) can be further formulated,
A x k 1 + B u k 1    = 1 T s α ( x k α x k 1 + j = 2 k ( 1 ) j ( α j ) x k j ) .
Now, x k can be solved,
x k = ( T s α A + α I ) x k 1 + T s α B u k 1 j = 2 k ( 1 ) j ( α j ) x k j ,
where I is identity matrix of 1 × 1 , and correspondingly, the output equation can also be discretized as
y k = C x k + D u k .
Hence, Equations (10) and (11) together determine the FOC discrete state equation and output equation of Thevenin model.
Similarly, the voltage equations of PNGV model can be written
{ U t = V o c U p U 0 U b Δ α U p = U p R p C p + i C p Δ β U b = i C b ,
where α and β are the fractional derivation orders of low frequency section and medium frequency section for the EIS of the battery respectively. When α and β both equal 1, the model is transferred into the integral order PNGV (IOPNGV) model. Like the above process, the PNGV FOC discrete state space function can be formulated with U p and U b as state variants, and output variant y of V o c U t .
x k = ( ( T s α 0 0 T s β ) A + ( α 0 0 β ) I ) x k 1 + ( T s α T s β ) B u k 1 j = 2 k ( 1 ) j ( α j ) x k j ,
where I are 2 × 2 identity matrices, and A = [ 1 R p C p 0 0 0 ] , B = [ 1 C p 0 0 1 C b ] .
The output equation of FOPNGV is mostly same as that of IOThevenin model, and the only difference is that C = [ 1 1 ] . After building these two kinds of FOMs, parameters identification is carried out to estimate the model parameters and validate the model precision.

3. Parameter Identification

GA is an intelligent optimization algorithm that simulates the evolution process. It can be applied to identify the orders and values of resistance and capacitance simultaneously. GA has been successfully applied in parameters identification [38,39] and optimal control [40,41] by means of a series of actions including crossover, elitism selection and mutation. In this paper, GA is employed to identify the model parameters offline with global optimal solution during the whole SOC range.
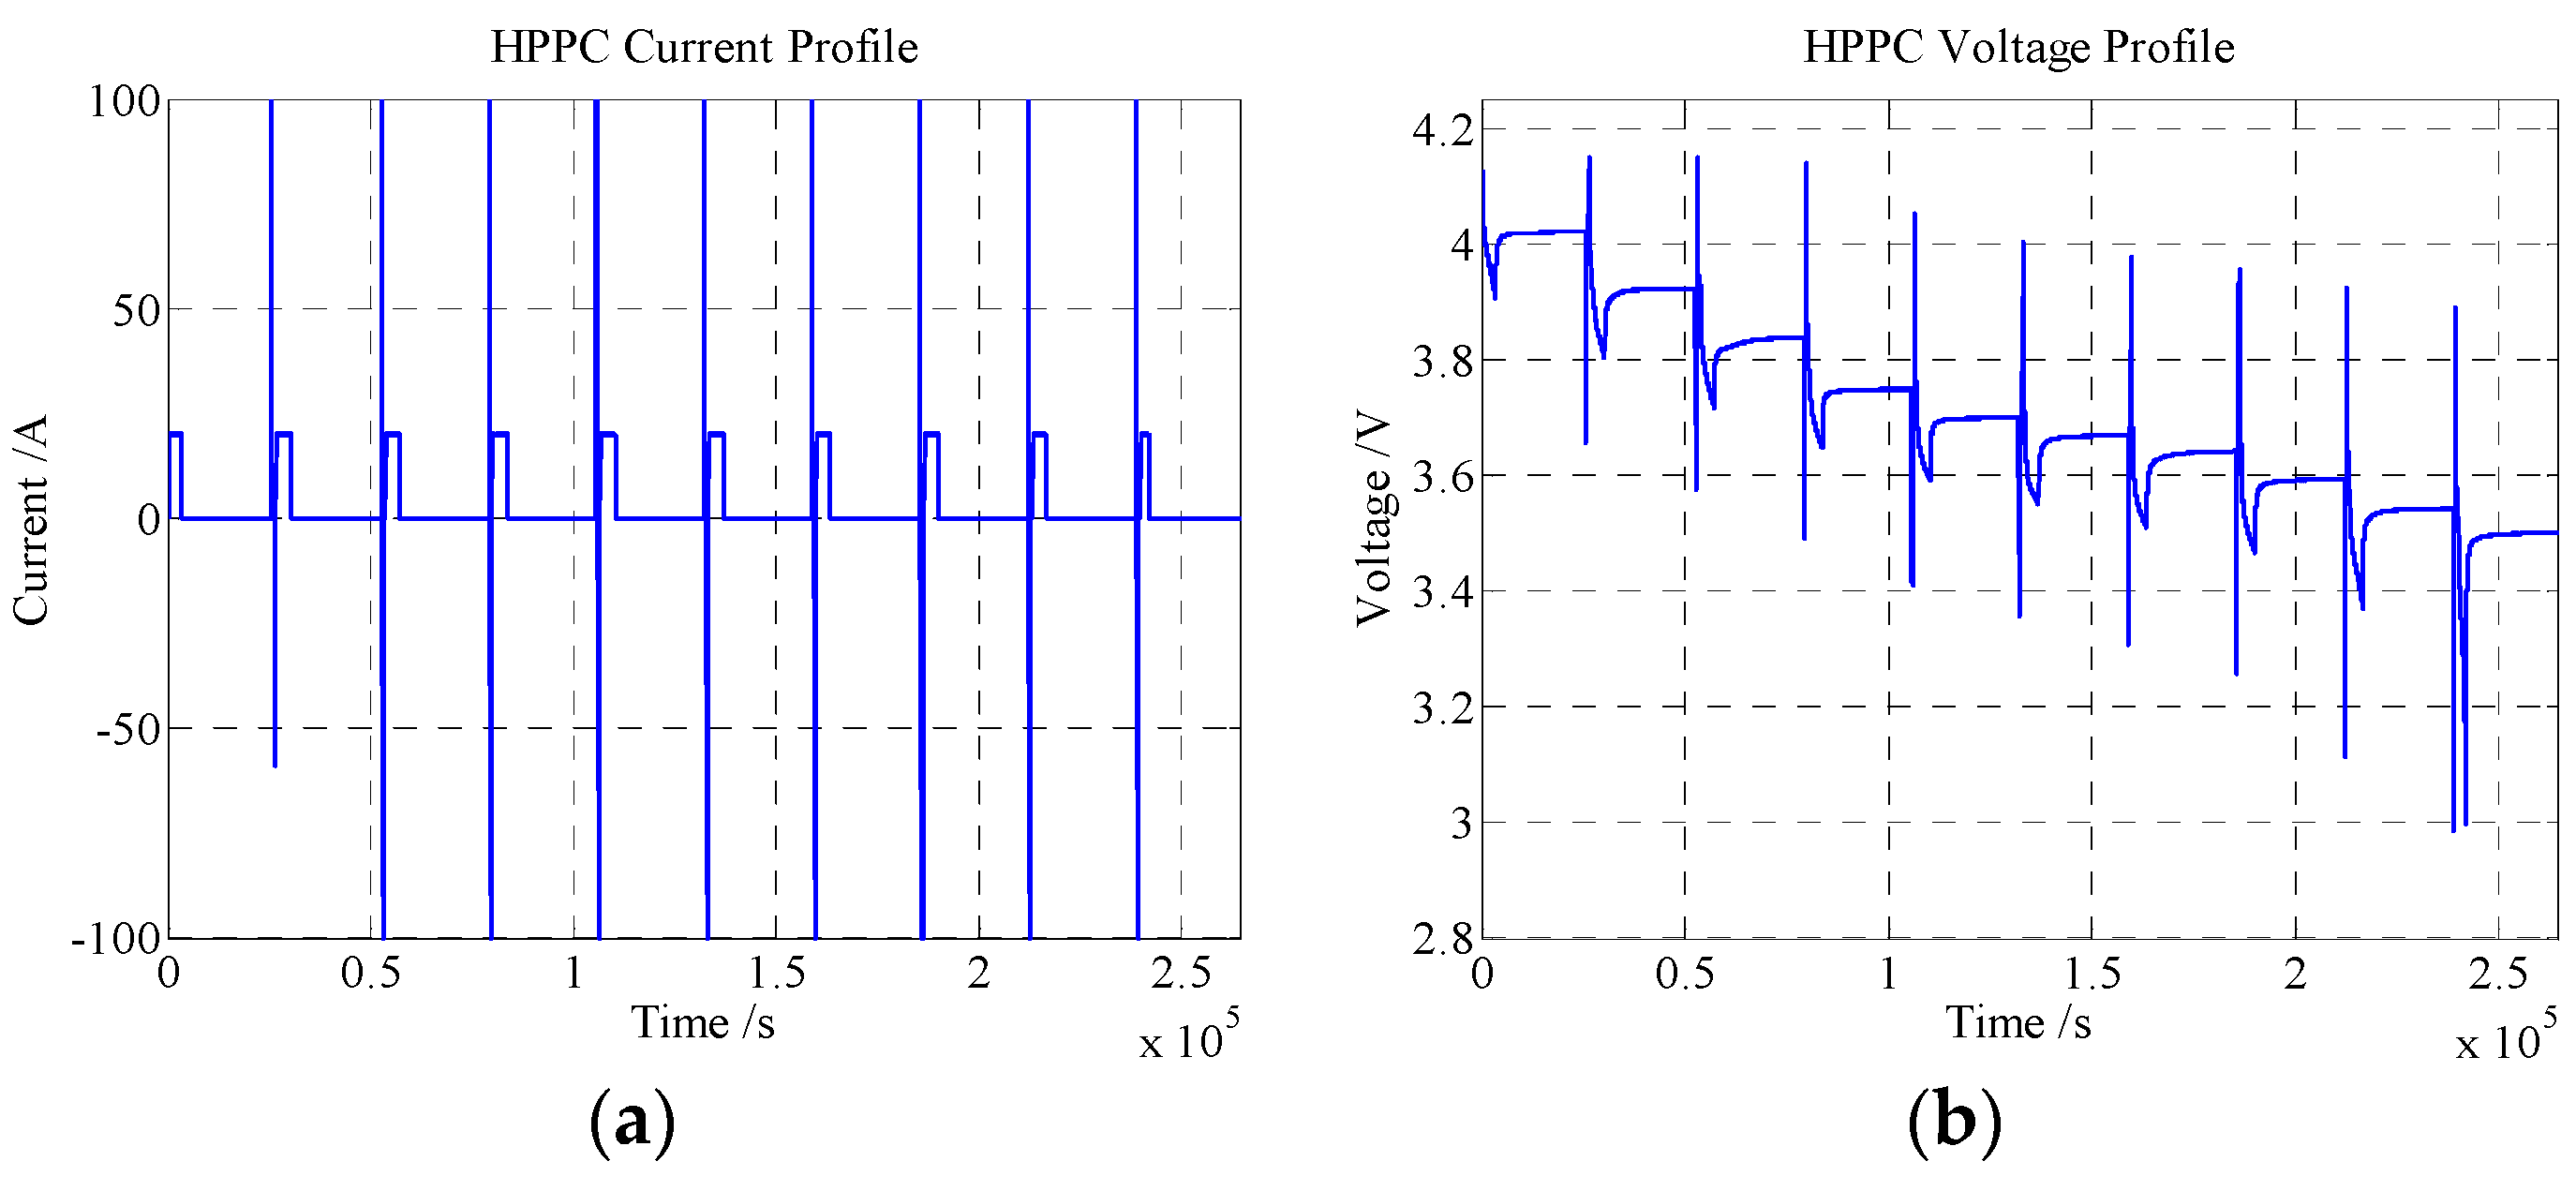
In order to identify the model parameters, the hybrid pulse power characterization (HPPC) experiment is usually carried out to provide the extreme characterization of battery. The research object in this paper is a lithium-ion polymer battery, consisting of Li (NiCoMn) O2-based cathode and graphite-based anode. The energy density is 174 Wh/kg and the nominal voltage and maximum charging voltage are, respectively, 3.65 V and 4.15 V. Meanwhile, the OCV curve can be determined based on the voltage measurement after the recommended standstill release. In this paper, the calibrated battery capacity is 20 Ampere-hour (Ah) for the research. After fully charged, the battery is left to be standstill to measure the OCV, followed by discharging the battery of 10% capacity. Then, the battery is set to be standstill after the battery inner electrochemical reaction reach balanced. Now, the OCV value with respect to 90% SOC can be quantified. The steps can be repeated until the battery is fully discharged. During the experiment, a combined current pulse test, which includes 5C current charge and 5C current discharge, is followed after measuring the OCV, where C denotes the battery rated capacity value with unit Ah. The main purpose of this pulse test is to excite the battery dynamic performance. In this paper, both the pulse durations are 10 s, respectively, and there exist an interval of 40 s between them. The current and voltage response curves are shown in Figure 3. It can be clearly observed that the voltage ranges from around 4.13 V to 2.98 V when the battery is discharged from 100% to 0% SOC. Finally, the voltage returns back to 3.50 V after fully discharged.
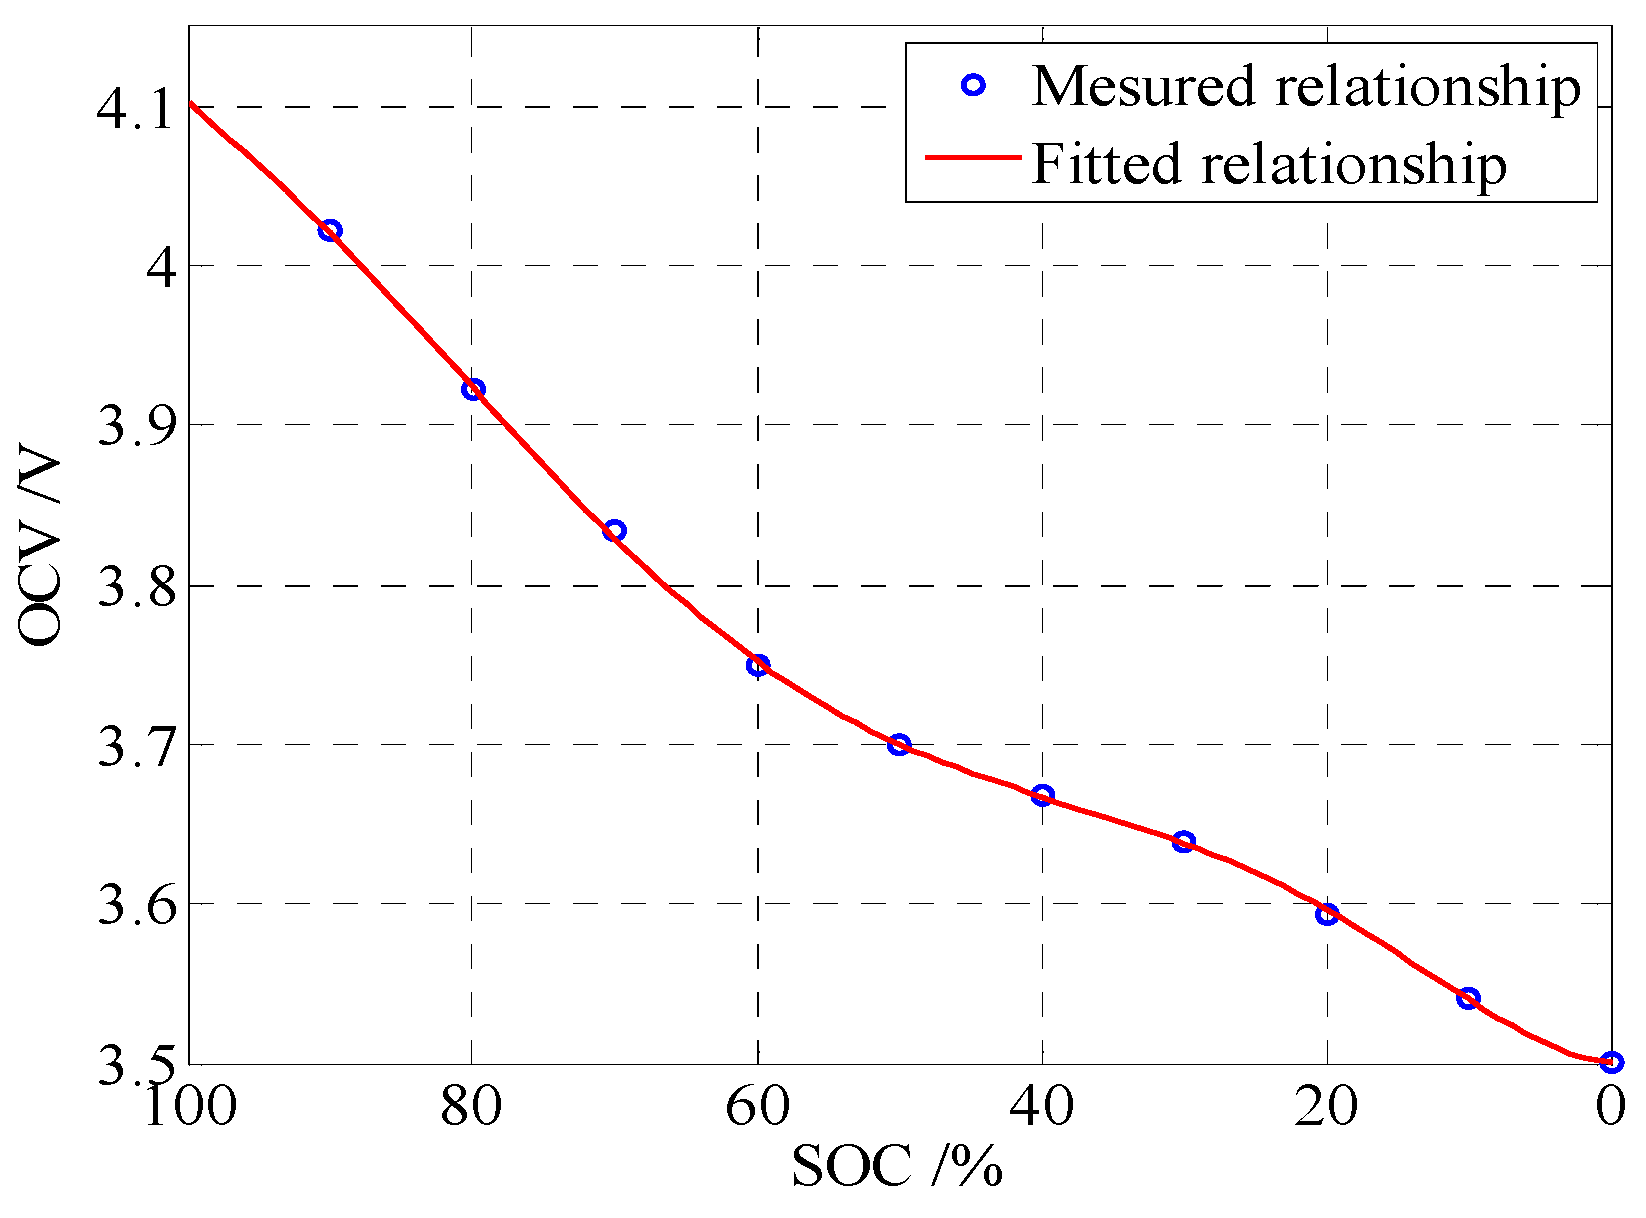
Based on the measured OCV curve, shown in Figure 4, a six-order polynomial equation is employed to simulate the voltage variation,
V o c ( z ) = k 0 z 6 + k 1 z 5 + k 2 z 4 + k 3 z 3 + k 4 z 2 + k 5 z + k 6 .
Here, z represents SOC, and k 0 , k 1 , k 2 , k 3 , k 4 , k 5 , and k 6 are equation coefficients, which equal 8.408, 39.03, −22.05, 5.175, 0.05808 and 3.501, respectively.
During the identification process, a fitness value of GA is introduced to evaluate the model precision based on the root mean square error of output voltage,
F i t = 1 n k = 1 n e k 2 ,
where e k = y k y ^ k and y k = V o c U t ( k ) is the voltage difference between OCV and terminal voltage. y ^ k is the estimated value of y k . The parameter identification process is illustrated in Figure 5. This parameter identification method based on GA can be both applied in the lithium-ion battery FOM and IOM.
The parameter identification results of these four types of lithium-ion battery models, i.e., FOPNGV, FOThevenin, IOPNGV and IOThevenin models, are shown in Figure 6, respectively. It is necessary to mention that the parameters listed in the figure are interpolated with SOC. From Figure 6a, it can be seen that R 0 varies from 2 milliohm to 8 milliohm when the SOC ranges from 10% to 90%. It can also be observed that R 0 of the FOMs is larger than that of IOMs when the SOC is more than 20%. For the FOPNGV model, R 0 varies from 8 milliohm to 3 milliohm. For the IOPNGV model, R 0 decreases from 6.5 milliohm to 3 milliohm during 10% to 20% SOC, and varies from 2 milliohm to 3 milliohm when the SOC ranges from 20% to 90%. The variation of Rp is shown in Figure 6b, and it can be summarized that Rp is always less than 1 ohm, and is less than 0.2 ohm during 20% to 50% SOC, while it varies obviously during 50% to 70% SOC and can reach 0.4 ohm. The changing characteristics of Cp and Cb are shown in Figure 6c,d respectively. When the SOC is more than 20%, Cp maintains at around 80 kF, and is almost same for these four models. Cb ranges from 20 kF to 100 kF within the SOC of 10% to 90%, and shows varying consistency between the FOPNGV and IOPNGV models. It is relatively steady with a higher capacitance value when the SOC is above 20%, and there is an obvious decline when the SOC is below 20%. The order α of the fractional-order is shown in Figure 6e. For the FOPNGV model, α is steady and its mean value is around 0.56, while for the FOThevenin model, α fluctuates largely and its mean value is 0.61. For the FOPNGV model, β is shown in Figure 6f. Its steady value is 0.56 when the SOC is above 20%, and there is a considerable increment when the SOC is below 20%. Therefore, α and β can be seen as the commensurate order when the SOC is above 20% for the FOPNGV model, while β of the FOPGNV model varies obviously when the SOC is below 20% and α of the FOThevenin model fluctuates from 0.95 to 0 during 0% to 100% SOC. Thus, α and β cannot be treated as the commensurate orders.
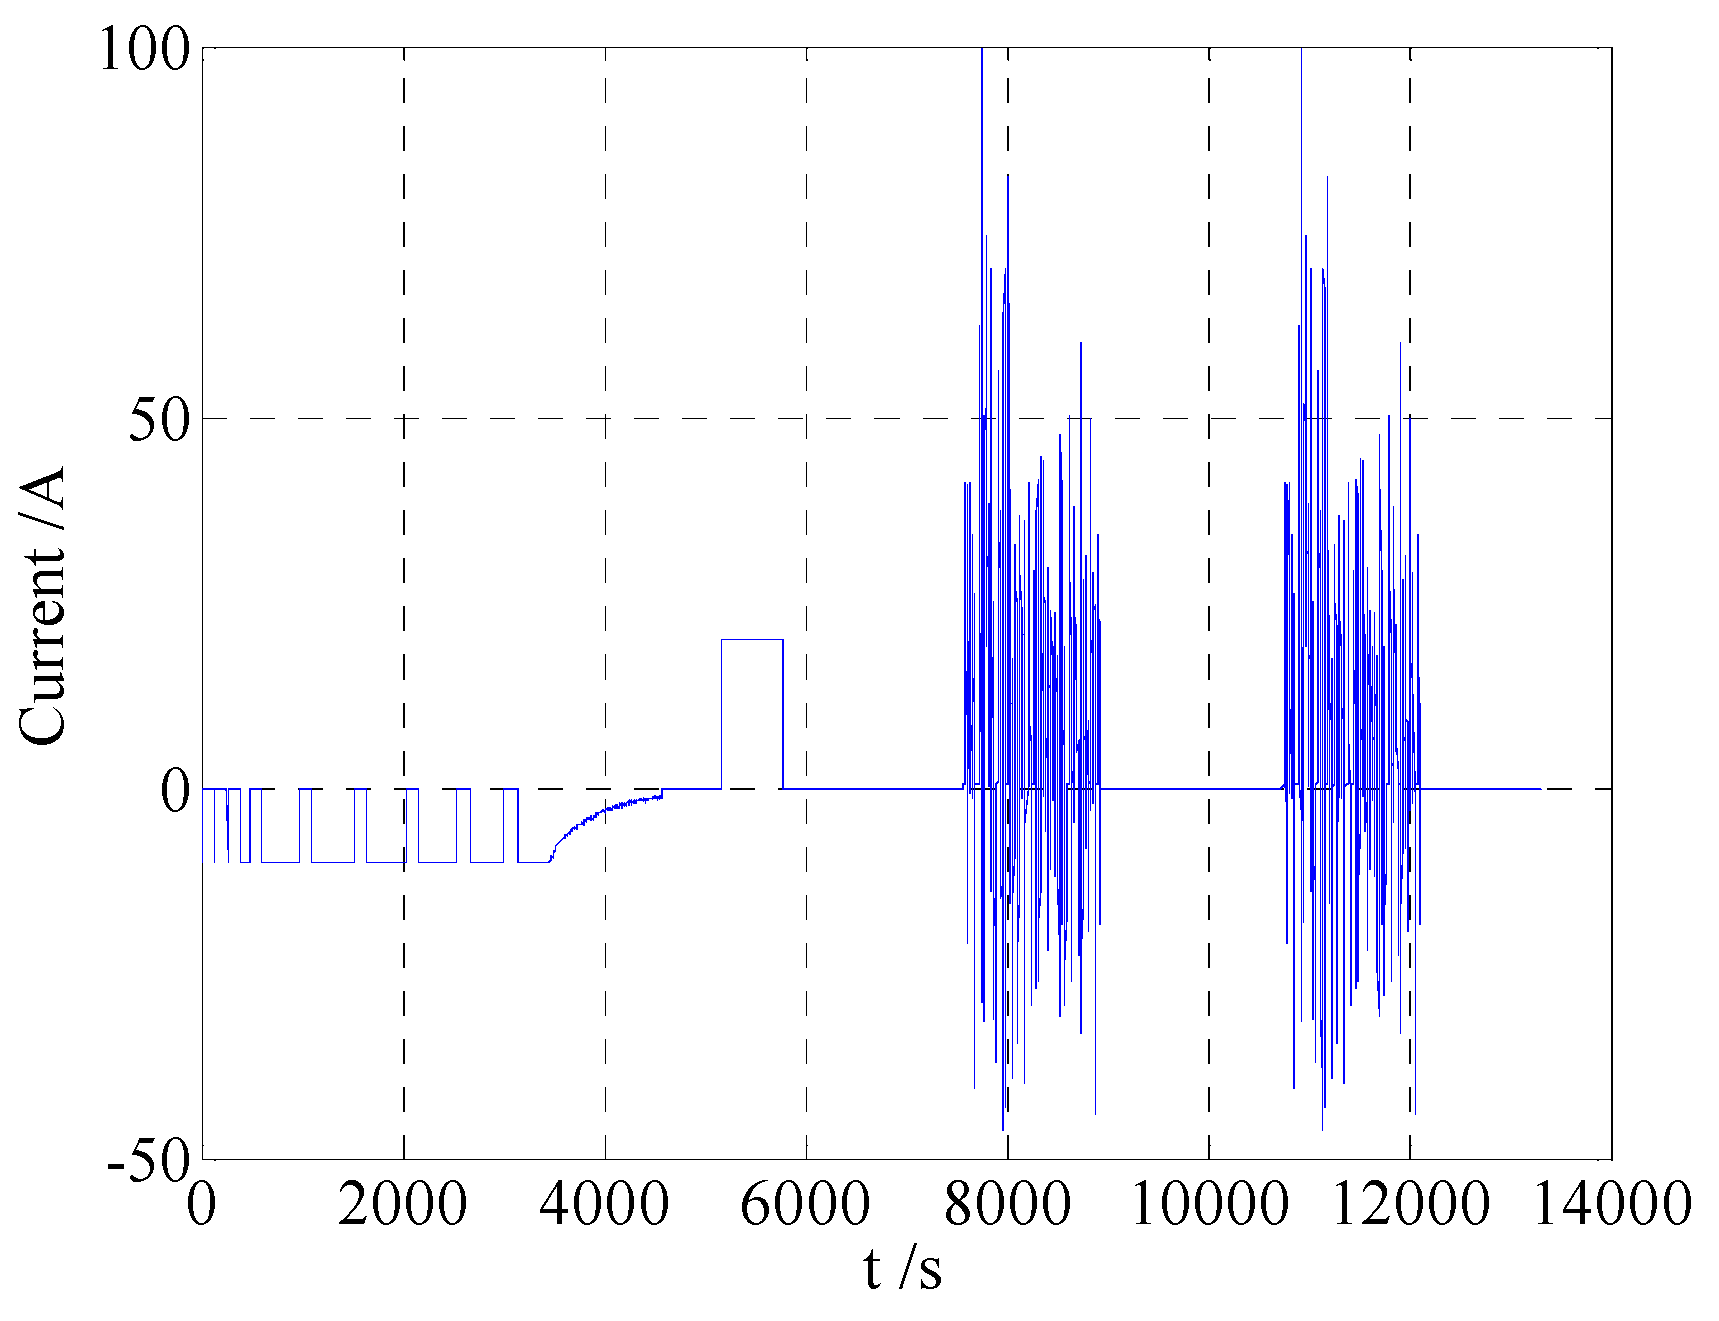
The current profile of a hybrid cycle is shown in Figure 7, which can be supplied to justify the model parameters. The hybrid cycle can be used to simulate the step-pulse current charge, constant current discharge, standstill test and Urban Dynamometer Driving Schedule (UDDS) dynamic condition. Firstly, a multi-step pulse current inspiration is used to charge the battery from 60% SOC until full and thus the SOC calibration can be finished. Then, the battery discharges to 83.5% with 1C current, followed by a standstill interval, until the battery reaches inner balanced. Finally, two UDDS cycle experiments are subsequently conducted to verify the model dynamic performance. From Figure 7, it can observed that the test cycles during 3200 s to 5000 s, 6000 s to 7600 s, and 9000 s to 10,600 s are in static test conditions and the test cycles during 5200 s to 5700 s, 7600 s to 9000 s, and 10,800 s to 12,200 s are in dynamic test conditions.
Figure 8 shows the voltage estimation errors of these four types of models. It can be observed that, under static test conditions, the output voltage errors including mean absolute error (MAE) and standard deviation (SD) of the IOMs are 0.063, 0.064, 0.397, and 0.610 respectively, which are obviously less than those of the FOMs, as listed in Table 1. Under dynamic conditions, as shown in Table 2, the output voltage MAE and SD of the FOMs are, respectively, 0.019, 0.091, 2.311 and 3.758, which are less than those of the IOMs. Under the same driving conditions, the voltage output errors of the PNGV models, independent of FOM or IOM, are less than those of Thevenin models, as shown in Table 1 and Table 2, respectively. The reason why the PNGV models are with less voltage error is that the capacitor Cb of the PNGV model can describe the OCV variation induced by the accumulation of the load current and the characterization of low frequency variation for the battery, thereby bringing higher precision. The experiments state that under dynamic driving condition test, the variation of the orders of the FOM reflects the tracking performance for the historical voltage of the capacitor. Therefore, it can describe the memory effect of the voltage of the capacitor and can improve the precision of the voltage variation for the capacitor, thereby bringing the improvement of tracking the battery terminal voltage. To sum up, the FOMs can better capture the dynamic performance, compared with the IOMs. It is necessary to note that from Table 1 and Table 2, the MAEs of the terminal voltage for the FOPNGV and FOThevenin models are less than 1.5 mV, and even less than 0.1 mV under dynamic conditions, proving that the accuracies of the FOMs calculated with recursive length L = 70 can satisfy the modeling demand.

4. SOC Estimation

4.1. FOC EKF Application

The calculation process of FOC EKF can be formulated based on the following seven equations, including FOC state space equation, output equation, time-variant update of state, time domain estimation of estimation error covariance, calculation of Kalman gain, the state update of measurement, and the measurement update of estimated error covariance [30,31,32,33].
Fractional-order state equation,
Δ γ x k = f ( x ^ k 1 , u k 1 ) + w k
Output equation,
y ^ k = h ( x k , u k ) + v k
Time domain update of the state,
x k = ( T s γ Δ γ x k + γ 1 x ^ k 1 ) j = 2 k ( 1 ) j γ j x ^ k j
Time domain update of the estimation error variance,
P k = ( A k 1 + γ 1 ) P k 1 ( A k 1 + γ 1 ) T + Q k 1 + j = 2 k γ j P k j γ j T
Kalman gain matrix calculation,
K k = P k C k T ( C k P k C k T + R k ) 1
Measurement update of the state,
x ^ k = x k + K k ( y k y ^ k )
Measurement update of the estimation error variance,
P k = ( I K k C k ) P k ,
where ( ) and ( ) ^ are, respectively, a priori and a posteriori estimations of the state x , ( ) T indicates the matrix transpose, ( ) 1 denotes the inverse matrix, w k represents the noise of the system state, v k expresses the measurement noise, w k and v k are white noise which is independent of each other and their mean value is 0, Q k and R k are the variance of w k and v k , and
{ Δ γ x k = [ Δ γ 1 x 1 , k Δ γ N x N , k ] , γ k = diag [ ( γ 1 k ) ( γ N k ) ] A k 1 = [ f ( x , u k 1 ) x ] x = x ^ k 1 , C k = [ h ( x , u k ) x ] x = x k .
Especially, the discrete equation of SOC estimation based on the coulomb counting method can be shown as
z k = z k 1 i k T s 3600 × C n ,
where C n is the battery rated capacity. According to Equations (10) and (13), the SOC estimation based on FOThevenin and FOPNGV models can be determined. In the FOThevenin model, the state x is set as x = [ U p   z ] T , of which the corresponding order is [ α     1 ] , 0 < α 1 . In addition,
{ A k 1 + γ = [ f ( x , u k 1 ) x ] x = x ^ k 1 + [ α 0 0 1 ] = [ T s α × 1 R p , k 1 C p , k 1 + α 0 0 1 ] x = x ^ k 1 B k 1 = [ f ( x ^ k 1 , u ) u ] u = u k 1 = [ T s α × 1 C p , k 1 0 0 T s C n × 3600 ] u = u k 1 C k = [ h ( x , u k ) x ] x = x k = [ 1    g ( v o c , z ) z ] x = x k D k = [ h ( x k , u ) u ] u = u k = [ R 0 , k ] .
In the FOPNGV model, the state x is [ U p     U b     z ] T , of which the corresponding order is [ α     β     1 ] , 0 < α 1 , 0 < β 1 .
{ A k 1 + γ 1 = [ f ( x , u k 1 ) x ] x = x ^ k 1 +     [ α 0 0 0 β 0 0 0 1 ] = [ T s α × 1 R p , k 1 C p , k 1 + α 0 0 0 β 0 0 0 1 ] x = x ^ k 1 B k 1 = [ f ( x ^ k 1 , u k 1 ) u k 1 ] u = u k 1 = [ T s α × 1 C p , k 1 0 0 0 T s β × 1 C b , k 1 0 0 0 T s C n × 3600 ] u = u k 1 C k = [ h ( x , u k ) x ] x = x k = [ 1 1 g ( v o c , z ) z ] x = x k D k = [ h ( x k , u ) u ] u = u k = [ R 0 , k ] .
In the next step, these algorithms are implemented to verify their performance by experiments.

4.2. Experiment Validation

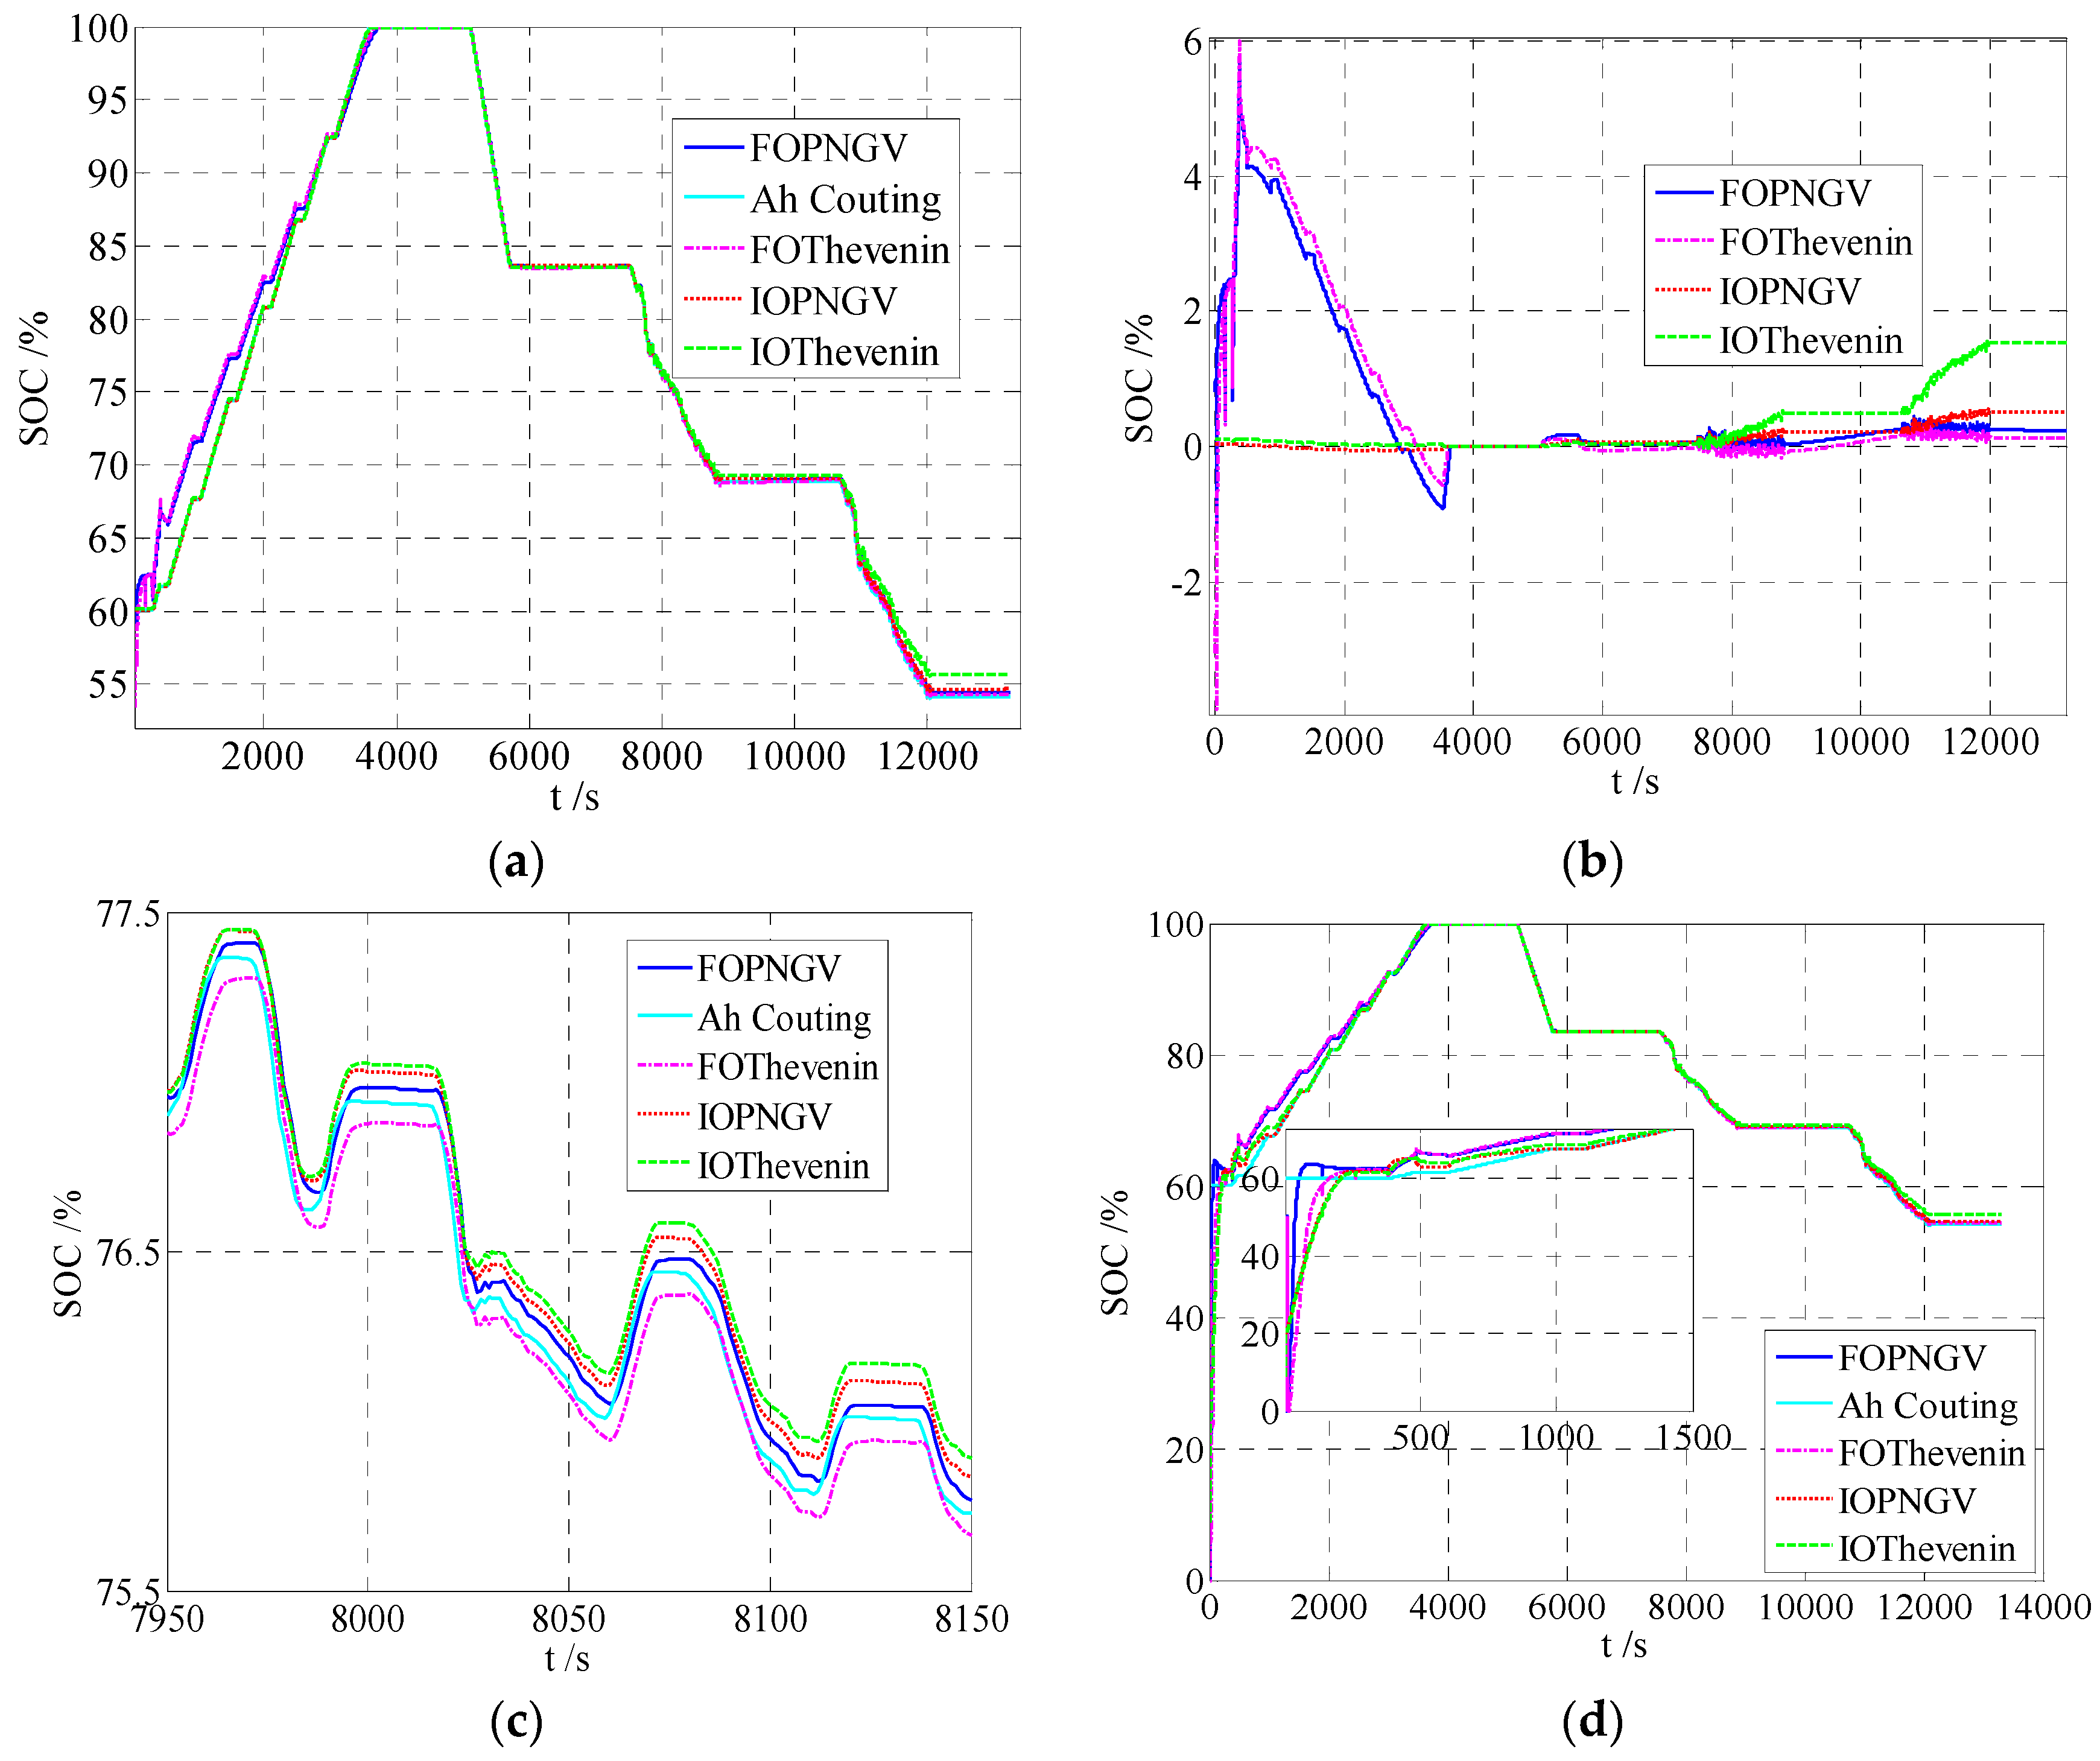
Under hybrid cycle tests presented in Figure 7, the SOC estimation based on EKF is shown in Figure 9a. Since the initial SOC has been calibrated in advance, the SOC estimation based on the coulomb counting method can be regarded as the reference value in view of the highly precise measurement. It can be observed that compared with IOPNGV and IOThevenin estimation, the SOC estimation based on FOPNGV and FOThevenin can have larger oscillation during convergence phase due to the error accumulation, as shown in Figure 9b. During the beginning period of pulse current, i.e., when t is less than 4000 s, the estimation error of FOC Kalman filter is within 6%, of which largest error occurs during the first pulse current excitation, and the estimation error of IOC Kalman filter is less than 1%. After tracking the referred SOC value ( t > 4000 s), the estimation MAEs based on the FOPNGV and FOThevenin models reduces by 36.9% and 92.0%, compared with those based on the IOPNGV and IOThevenin models. The enlarged SOC estimation curve under UDDS cycle test (t > 7000 s) is shown in Figure 9c. The estimation error of FOC extended Kalman filter is less than 0.5%, and the IOC extended Kalman filter for SOC estimation error is less than 2% (t > 4000 s). It can be concluded that under the same driving conditions, the SOC estimation error based on FOPNGV and IOPNGV models is less than the corresponding Thevenin model (t > 4000 s).
In order to examine the convergence performance with different initial values, the initial SOC values are set to be 30% when four EKF are taken into effect. The SOC estimation curves are shown in Figure 9d. It can be found that the FOMs have faster convergence speed than the IOMs. After 53 and 158 samples, the SOC estimation based on FOPNGV model and FOThevenin model can converge to the real value. The convergence samples amount for IOPNGV and IOThevenin models are 200 and 204, respectively. However, there exist obvious oscillations for IOC model estimation in the initial period due to the accumulated error.

5. Conclusions

In this paper, the FOThevenin and FOPNGV models of lithium-ion batteries are built based on conventional IOMs, and GA is employed to identify the model parameters and fractional order simultaneously. Based on four FOMs and IOMs, EKF is applied to estimate the SOC and experiments are performed to verify the model precision by hybrid cycle test. The results prove that the PNGV model, independent of FOC method and IOC method, is with higher precision compared with the Thevenin model. Correspondingly, the SOC estimation is also more accurate. The order of FOM varies with the SOC, and FOMs can therefore simulate the battery terminal voltage variation more precisely. The SOC estimation based on FOMs can converge to real value with faster speed and has with less errors under dynamic cycles.
To sum up, the findings in this paper supply a new way to dynamic modeling and SOC estimation for the lithium-ion battery in the BMS. As our next step for this work, the research will focus on the influence of temperature and aging to FOMs of the battery and the corresponding fractional order EKF application for SOC estimation. In addition, hardware implementation of the proposed algorithms in EVs will be taken into account.

Acknowledgments

The research is supported by National Science Foundation (51567012) of China in part, the key project of the education department of Yunnan province (2015Z023) in part, the talent training program of Yunnan province (KKSY201302084) in part, and the innovation fund of advanced techniques for new energy vehicles of Kunming University of Science and Technology (14078368) in part. The authors would like to thank them their support and help. The authors would also like to thank the reviewers for their corrections and helpful suggestions.

Author Contributions

Renxin Xiao conceived this paper, built the fractional models and carried out the simulations. Zheng Chen discussed the fractional order extended Kalman filter (FOEKF) algorithm and revised the paper. Jiangwei Shen conducted the hybrid pulse power characterization (HPPC) experiment. Xiaoyu Li and Erdong Pan carried out the hybrid test cycle experiment. Wensheng Yan provided some valuable suggestions.

Conflicts of Interest

The authors declare no conflict of interest.

References

  1. Wu, H.; Yuan, S.; Zhang, X.; Yin, C.; Ma, X. Model parameter estimation approach based on incremental analysis for lithium-ion batteries without using open circuit voltage. J. Power Sources 2015, 287, 108–118. [Google Scholar] [CrossRef]
  2. Wang, Y.; Zhang, C.; Chen, Z. A method for state-of-charge estimation of LiFePO4 batteries at dynamic currents and temperatures using particle filter. J. Power Sources 2015, 279, 306–311. [Google Scholar] [CrossRef]
  3. Smith, K.A. Electrochemical Modeling, Estimation and Control of Lithium Ion Batteries; The Pennsylvania State University: University Park, PA, USA, 2006. [Google Scholar]
  4. Smith, K.; Rahn, C.D.; Wang, C.Y. Model-based electrochemical estimation and constraint management for pulse operation of lithium ion batteries. IEEE Trans. Control Syst. Technol. 2010, 18, 654–663. [Google Scholar] [CrossRef]
  5. Sabatier, J.; Merveillaut, M.; Francisco, J.M.; Guillemard, F.; Porcelatto, D. Lithium-ion batteries modeling involving fractional differentiation. J. Power Sources 2014, 262, 36–43. [Google Scholar] [CrossRef]
  6. Sabatier, J.; Francisco, J.M.; Guillemard, F.; Lavigne, L.; Moze, M.; Merveillaut, M. Lithium-ion batteries modeling: A simple fractional differentiation based model and its associated parameters estimation method. Signal Process. 2015, 107, 290–301. [Google Scholar] [CrossRef]
  7. Shen, W. State of available capacity estimation for lead-acid batteries in electric vehicles using neural network. Energy Convers. Manag. 2007, 48, 433–442. [Google Scholar] [CrossRef]
  8. Hansen, T.; Wang, C.J. Support vector based battery state of charge estimator. J. Power Sources 2005, 141, 351–358. [Google Scholar] [CrossRef]
  9. He, H.; Xiong, R.; Guo, H.; Li, S. Comparison study on the battery models used for the energy management of batteries in electric vehicles. Energy Convers. Manag. 2012, 64, 113–121. [Google Scholar] [CrossRef]
  10. Hu, X.; Li, S.; Peng, H. A comparative study of equivalent circuit models for Li-ion batteries. J. Power Sources 2012, 198, 359–367. [Google Scholar] [CrossRef]
  11. Gomez, J.; Nelson, R.; Kalu, E.E.; Weatherspoon, M.H.; Zheng, J.P. Equivalent circuit model parameters of a high-power Li-ion battery: Thermal and state of charge effects. J. Power Sources 2011, 196, 4826–4831. [Google Scholar] [CrossRef]
  12. Zhou, C.; Yang, G.; Su, J. PWM strategy with minimum harmonic distortion for dual three-phase permanent-magnet synchronous motor drives operating in the overmodulation region. IEEE Trans. Power Electron. 2016, 31, 1367–1380. [Google Scholar] [CrossRef]
  13. PNGV Battery Test Manual Revision 3, DOE/ID-10597. Idaho National Engineering and Environmental Laboratory: Idaho Falls, ID, USA, 2001. Available online: http://avt.inel.gov/battery/pdf/pngv_manual_rev3b.pdf (accessed on 6 January 2016).
  14. Sabatier, J.; Cugnet, M.; Laruelle, S.; Grugeon, S.; Sahut, B.; Oustaloup, A.; Tarascon, J. A fractional order model for lead-acid battery crankability estimation. Commun. Nonlinear Sci. Numer. Simul. 2010, 15, 1308–1317. [Google Scholar] [CrossRef]
  15. Bertrand, N.; Sabatier, J.; Briat, O.; Vinassa, J.-M. Embedded fractional nonlinear supercapacitor model and its parametric estimation method. IEEE Trans. Ind. Electron. 2010, 57, 3991–4000. [Google Scholar]
  16. Jesus, I.S.; Machado, J.T. Development of fractional order capacitors based on electrolyte processes. Nonlinear Dyn. 2009, 56, 45–55. [Google Scholar] [CrossRef]
  17. Oustaloup, A.; Mathieu, B.; Lanusse, P. The crone control of resonant plants: Application to a flexible transmission. Eur. J. Control 1995, 1, 113–121. [Google Scholar] [CrossRef]
  18. Oustaloup, A.; Cois, O.; Lanusse, P.; Melchior, P.; Moreau, X.; Sabatier, J. The crone aproach: Theoretical developments and major applications. In Proceedings of the Fractional Differentiation and Its Applications, Porto, Portugal, 19–21 July 2006; pp. 324–354.
  19. Podlubny, I.; Dorcak, L.; Kostial, I. On fractional derivatives, fractional-order dynamic systems and PI D controllers. In Proceedings of the 36th Conference on Decision & Control, San Diego, VA, USA, 10–12 December 1997; pp. 4985–4990.
  20. Xu, J.; Mi, C.C.; Cao, B.; Cao, J. A new method to estimate the state of charge of lithium-ion batteries based on the battery impedance model. J. Power Sources 2013, 233, 277–284. [Google Scholar] [CrossRef]
  21. Petras, I. Fractional-Order Nonlinear Systems: Modeling, Analysis and Simulation; Springer Science & Business Media: New York, NY, USA, 2011. [Google Scholar]
  22. Yuan, S.; Wu, H.; Zhang, X.; Yin, C. Online estimation of electrochemical impedance spectra for lithium-ion batteries via discrete fractional order model. In Proceedings of the IEEE Vehicle Power and Propulsion Conference, Beijing, China, 15–18 October 2013; pp. 1–6.
  23. Zhong, F.; Li, H.; Zhong, S.; Zhong, Q.; Yin, C. An SOC estimation approach based on adaptive sliding mode observer and fractional order equivalent circuit model for lithium-ion batteries. Commun. Nonlinear Sci. Numer. Simul. 2015, 24, 127–144. [Google Scholar] [CrossRef]
  24. Das, S.; Pan, I. Fractional Order Signal Processing: Introductory Concepts and Applications; Springer Science & Business Media: New York, NY, USA, 2011. [Google Scholar]
  25. Ng, K.S.; Moo, C.S.; Chen, Y.P.; Hsieh, Y.C. Enhanced coulomb counting method for estimating state-of-charge and state-of-health of lithium-ion batteries. Appl. Energy 2009, 86, 1506–1511. [Google Scholar] [CrossRef]
  26. Chiang, Y.H.; Sean, W.Y.; Ke, J.C. Online estimation of internal resistance and open-circuit voltage of lithium-ion batteries in electric vehicles. J. Power Sources 2011, 196, 3921–3932. [Google Scholar] [CrossRef]
  27. He, H.; Xiong, R.; Guo, H. Online estimation of model parameters and state-of-charge of lifepo4 batteries in electric vehicles. Appl. Energy 2012, 89, 413–420. [Google Scholar] [CrossRef]
  28. Zou, Z.; Xu, J.; Mi, C.; Cao, B.; Chen, Z. Evaluation of model based state of charge estimation methods for lithium-ion batteries. Energies 2014, 7, 5065–5082. [Google Scholar] [CrossRef]
  29. Sepasi, S.; Roose, L.R.; Matsuura, M.M. Extended kalman filter with a fuzzy method for accurate battery pack state of charge estimation. Energies 2015, 8, 5217–5233. [Google Scholar] [CrossRef]
  30. Sepasi, S.; Ghorbani, R.; Liaw, B.Y. A novel on-board state-of-charge estimation method for aged li-ion batteries based on model adaptive extended kalman filter. J. Power Sources 2014, 245, 337–344. [Google Scholar] [CrossRef]
  31. Plett, G.L. Extended kalman filtering for battery management systems of LIPB-based hev battery packs: Part 1. Background. J. Power Sources 2004, 134, 252–261. [Google Scholar] [CrossRef]
  32. Plett, G.L. Extended kalman filtering for battery management systems of LIPB-based hev battery packs: Part 2. Modeling and identification. J. Power Sources 2004, 134, 262–276. [Google Scholar] [CrossRef]
  33. Plett, G.L. Extended kalman filtering for battery management systems of LIPB-based hev battery packs: Part 3. State and parameter estimation. J. Power Sources 2004, 134, 277–292. [Google Scholar] [CrossRef]
  34. Xu, J.; Cao, B.; Chen, Z.; Zou, Z. An online state of charge estimation method with reduced prior battery testing information. Int. J. Electr. Power Energy Syst. 2014, 63, 178–184. [Google Scholar] [CrossRef]
  35. He, Z.; Gao, M.; Wang, C.; Wang, L.; Liu, Y. Adaptive state of charge estimation for Li-ion batteries based on an unscented kalman filter with an enhanced battery model. Energies 2013, 6, 4134–4151. [Google Scholar] [CrossRef]
  36. Chen, Z.; Fu, Y.; Mi, C.C. State of charge estimation of lithium-ion batteries in electric drive vehicles using extended kalman filtering. IEEE Trans. Veh. Technol. 2013, 62, 1020–1030. [Google Scholar] [CrossRef]
  37. Sierociuk, D.; Dzielinski, A. Fractional kalman filter algorithm for the states, parameters and order of fractional system estimation. Int. J. Appl. Math. Comput. Sci. 2006, 16, 129–140. [Google Scholar]
  38. Chen, Z.; Mi, C.C.; Fu, Y.; Xu, J.; Gong, X. Online battery state of health estimation based on genetic algorithm for electric and hybrid vehicle applications. J. Power Sources 2013, 240, 184–192. [Google Scholar] [CrossRef]
  39. Zhang, L.; Wang, L.; Hinds, G.; Lyu, C.; Zheng, J.; Li, J. Multi-objective optimization of lithium-ion battery model using genetic algorithm approach. J. Power Sources 2014, 270, 367–378. [Google Scholar] [CrossRef]
  40. Chen, Z.; Mi, C.C.; Xiong, R.; Xu, J.; You, C. Energy management of a power-split plug-in hybrid electric vehicle based on genetic algorithm and quadratic programming. J. Power Sources 2014, 248, 416–426. [Google Scholar] [CrossRef]
  41. Herrera, V.I.; Saez-de-Ibarra, A.; Milo, A.; Gaztanaga, H.; Camblong, H. Optimal energy management of a hybrid electric bus with a battery-supercapacitor storage system using genetic algorithm. In Proceedings of the IEEE International Conference on Electrical Systems for Aircraft, Railway, Ship Propulsion and Road Vehicles, Aachen, Germany, 3–5 March 2015; pp. 1–6.
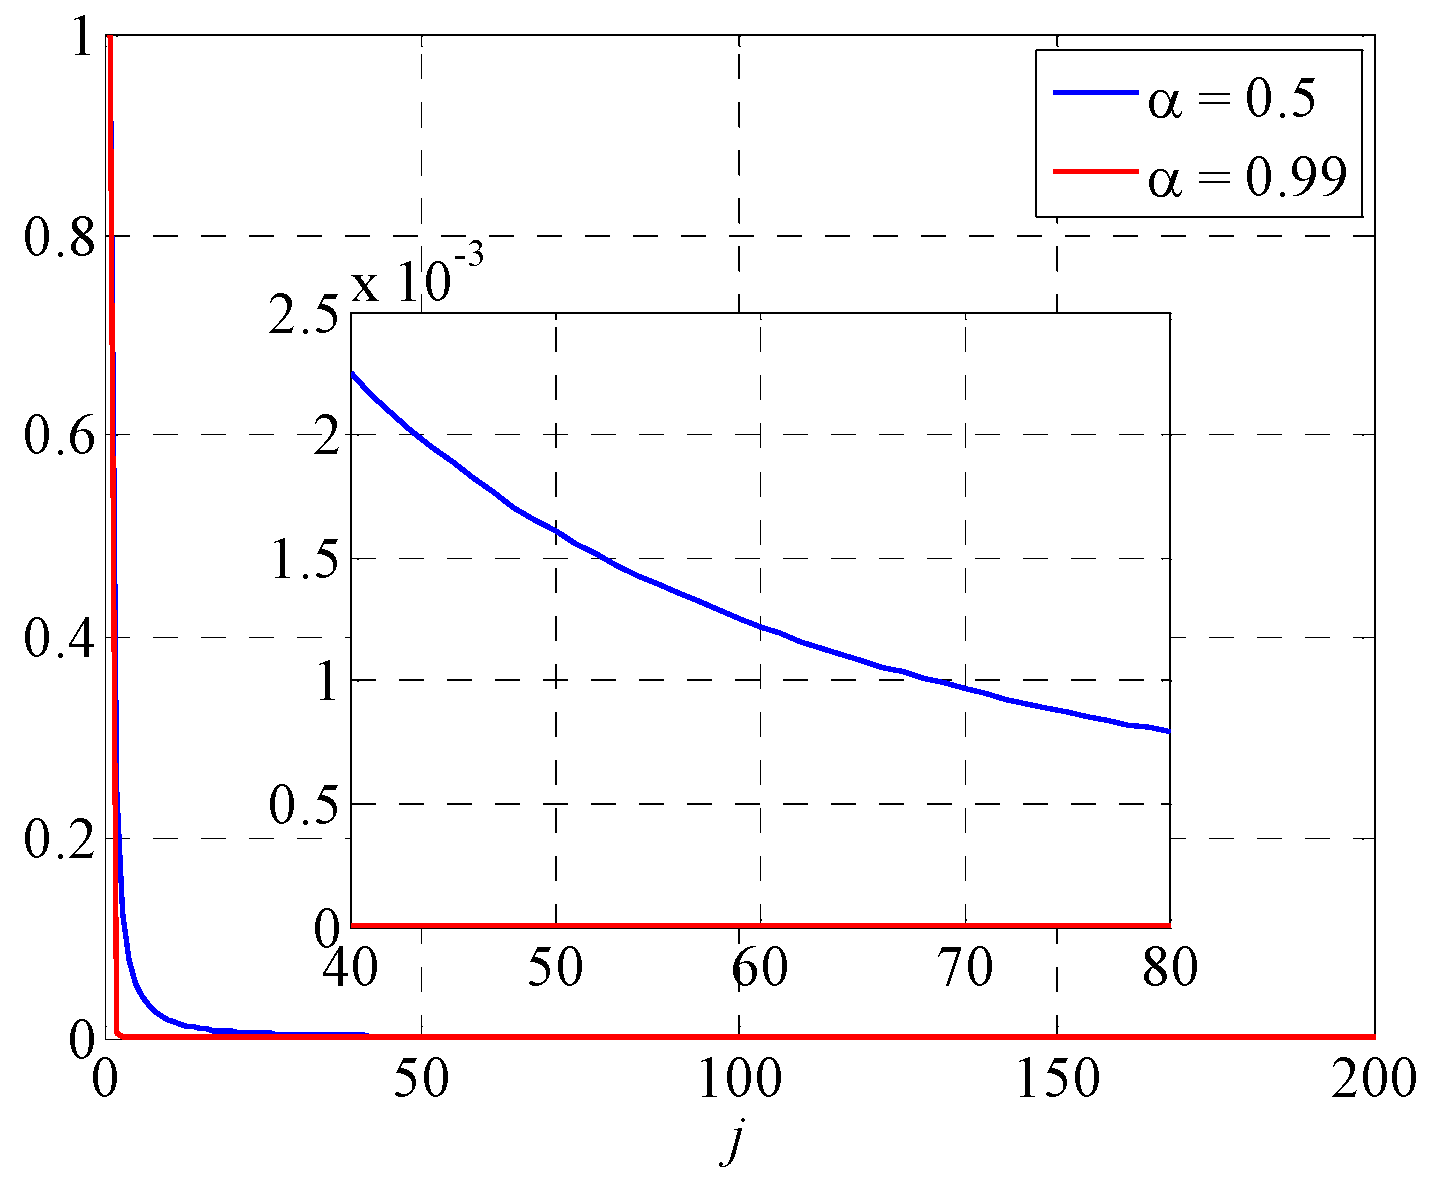
Figure 1. Recursive calculation of weighed coefficient.
Energies 09 00184 g001
Figure 2. Schematic diagram of equivalent circuit models: (a) Thevenin model; (b) PNGV model.
Energies 09 00184 g002
Figure 3. HPPC test (a) Current profile; (b) Voltage response.
Energies 09 00184 g003
Figure 4. Relationship between OCV and SOC.
Energies 09 00184 g004
Figure 5. Parameter identification for lithium-ion battery.
Energies 09 00184 g005
Figure 6. The relationship between the parameters and SOC (a) R0; (b) Rp; (c) Cp; (d) Cb ; (e) α; (f) β.
Energies 09 00184 g006
Figure 7. The current profile of the hybrid cycle test.
Energies 09 00184 g007
Figure 8. Terminal voltage estimation error under hybrid cycle.
Energies 09 00184 g008
Figure 9. EKF for SOC estimation of the lithium-ion battery: (a) estimation under hybrid driving cycles; (b) estimation error of (a); (c) estimation under UDDS driving cycles; (d) convergence of EKF.
Energies 09 00184 g009
Table 1. Terminal output errors under static conditions (Unit: mV).
ModelsFOPNGVFOTheveninIOPNGVIOThevenin
MAE1.3021.4480.0630.064
SD1.3001.3910.3970.610
Table 2. Terminal output errors under dynamic conditions (Unit: mV).
ModelsFOPNGVFOTheveninIOPNGVIOThevenin
MAE0.0190.0910.0500.206
SD2.3113.7582.5403.001