Technical Note

Evaluation of Cell Disruption of Chlorella Vulgaris by Pressure-Assisted Ozonation and Ultrasonication

1
School of Environment and Architecture, University of Shanghai for Science and Technology, Shanghai 200093, China
2
Hebei Province Environmental Monitoring Center, Shijiazhuang 050056, China
*
Author to whom correspondence should be addressed.
Energies 2016, 9(3), 173; https://doi.org/10.3390/en9030173
Submission received: 21 December 2015 / Revised: 20 February 2016 / Accepted: 1 March 2016 / Published: 8 March 2016
(This article belongs to the Special Issue Algae Fuel 2015)

Abstract

:
This study evaluated the effectiveness of pressure-assisted ozonation (PAO) in Chlorella vulgaris (C. vulgaris) cell disruption, and compared the disruption result with that of the ultrasonication (US) by using four quantification indicators: cell counting, ultra violet (UV) absorbance, turbidity and visible light absorbance. It was found that under the condition of 0.8 MPa and 80 cycles, PAO treatment achieved cell rupture of 80.3%, with the power of 1080 W and treatment time of 60 min, US achieved cell rupture of 83.8%. Cell counting was a reliable indicator and applicable to both PAO and US treatments. Turbidity and visible light absorbance gave similar results and featured as the simplest operation. UV absorbance reflected the metabolite release due to cell breakage; however, it was less reproducible when it was applied to quantify the cell rupture by PAO. Its trend indicated that during cell disruption metabolite degradation occurred, especially after significant rupture in the case of excessive PAO treatment. The cellular morphology of C. vulgaris cells during PAO and US treatments was investigated by scanning electron microscope (SEM) which certified that the cells damage was caused by both physical and chemical attack.

Graphical Abstract

1. Introduction

New energy from biomass has attracted more and more attention recently because of the low carbon emission, reproducible and environmentally friendly characteristics [1,2]. Chlorella vulgaris (C. vulgaris) is green eukaryotic microalgae and belongs to the family of Chlorellaceae and genus of Chlorella [3]. It is very commonly found in both fresh water and saline water. C. vulgaris has high photosynthetic efficiency as well as high biomass productivity and is strongly resistant against harsh conditions and invaders, which make it ideal as a source of proteins, enzyme, lipids, carbohydrates, pigments, vitamins and minerals [3,4,5,6,7]. To break the hard cell wall and release the internal components of C. vulgaris, multiple cell disruption techniques have been employed, the most frequently used techniques include high pressure homogenization, autoclaving, enzymatic lysis, bead milling, grinding, etc. [8,9,10,11]. As the most crucial part of the microalgae utilization process, a feasible cell disruption technique is usually characterized by having the ability to continuously treat high-solids-content biomass, higher disruption rates, minimal damage to the integrity of target components and lower capital cost [12]. Since the quality of the target components is susceptible to different cell disruption methods applied, appropriate method should be carefully chosen depending on the utilization purpose. In order to accurately assess the success of cell disruption process, many quantitative evaluation methods have been used to determine the extent of microbial cell disruption. The quantitative methods could be categorized into direct measures (microscopic counts) and indirect measures (measurement of released internal cell components), each has its scope of application as different quantitative methods usually generate different measures [13,14].
The aim of this research is to test the cell disruption effectiveness of C. vulgaris using two disruption methods, pressure-assisted ozonation (PAO) and ultrasonication (US), and evaluate the cell disruption with four common quantification indicators, cell counting, UV absorbance (260 nm), turbidity and visible light absorbance (680 nm).
PAO was originally proposed by Hong et al. [15,16] for the advanced degradation of recalcitrant organic contaminants in water or sediment. Later, it was found that this technique could improve the solubility of activated sludge, thus enhance the solids reduction and biogas production in the anaerobic digestion of PAO treated activated sludge [17,18]. In one of the most recent studies, PAO was reported to be able to disrupt the C. vulgaris cells for lipid extraction, in which the extracted lipid was weighed to quantify the cell disruption, however no other quantification indicators was examined and compared [19]. This research will provide a more extensive insight into the process of cell disruption by PAO.
US is one of the most frequently used laboratory bench scale cell disruption methods. The application of US on microorganisms cell rupture started as early as 1960s. It has the advantages of short proceed time, high efficiency and easy operation, and has been successfully applied in enhancing the extraction of oil, proteins or other metabolites from many types of microorganisms [20,21,22,23]. In the presented study, US was selected as a representative mechanical cell disruption method to compare with PAO and to evaluate the working efficiency of the new technique.

2. Results

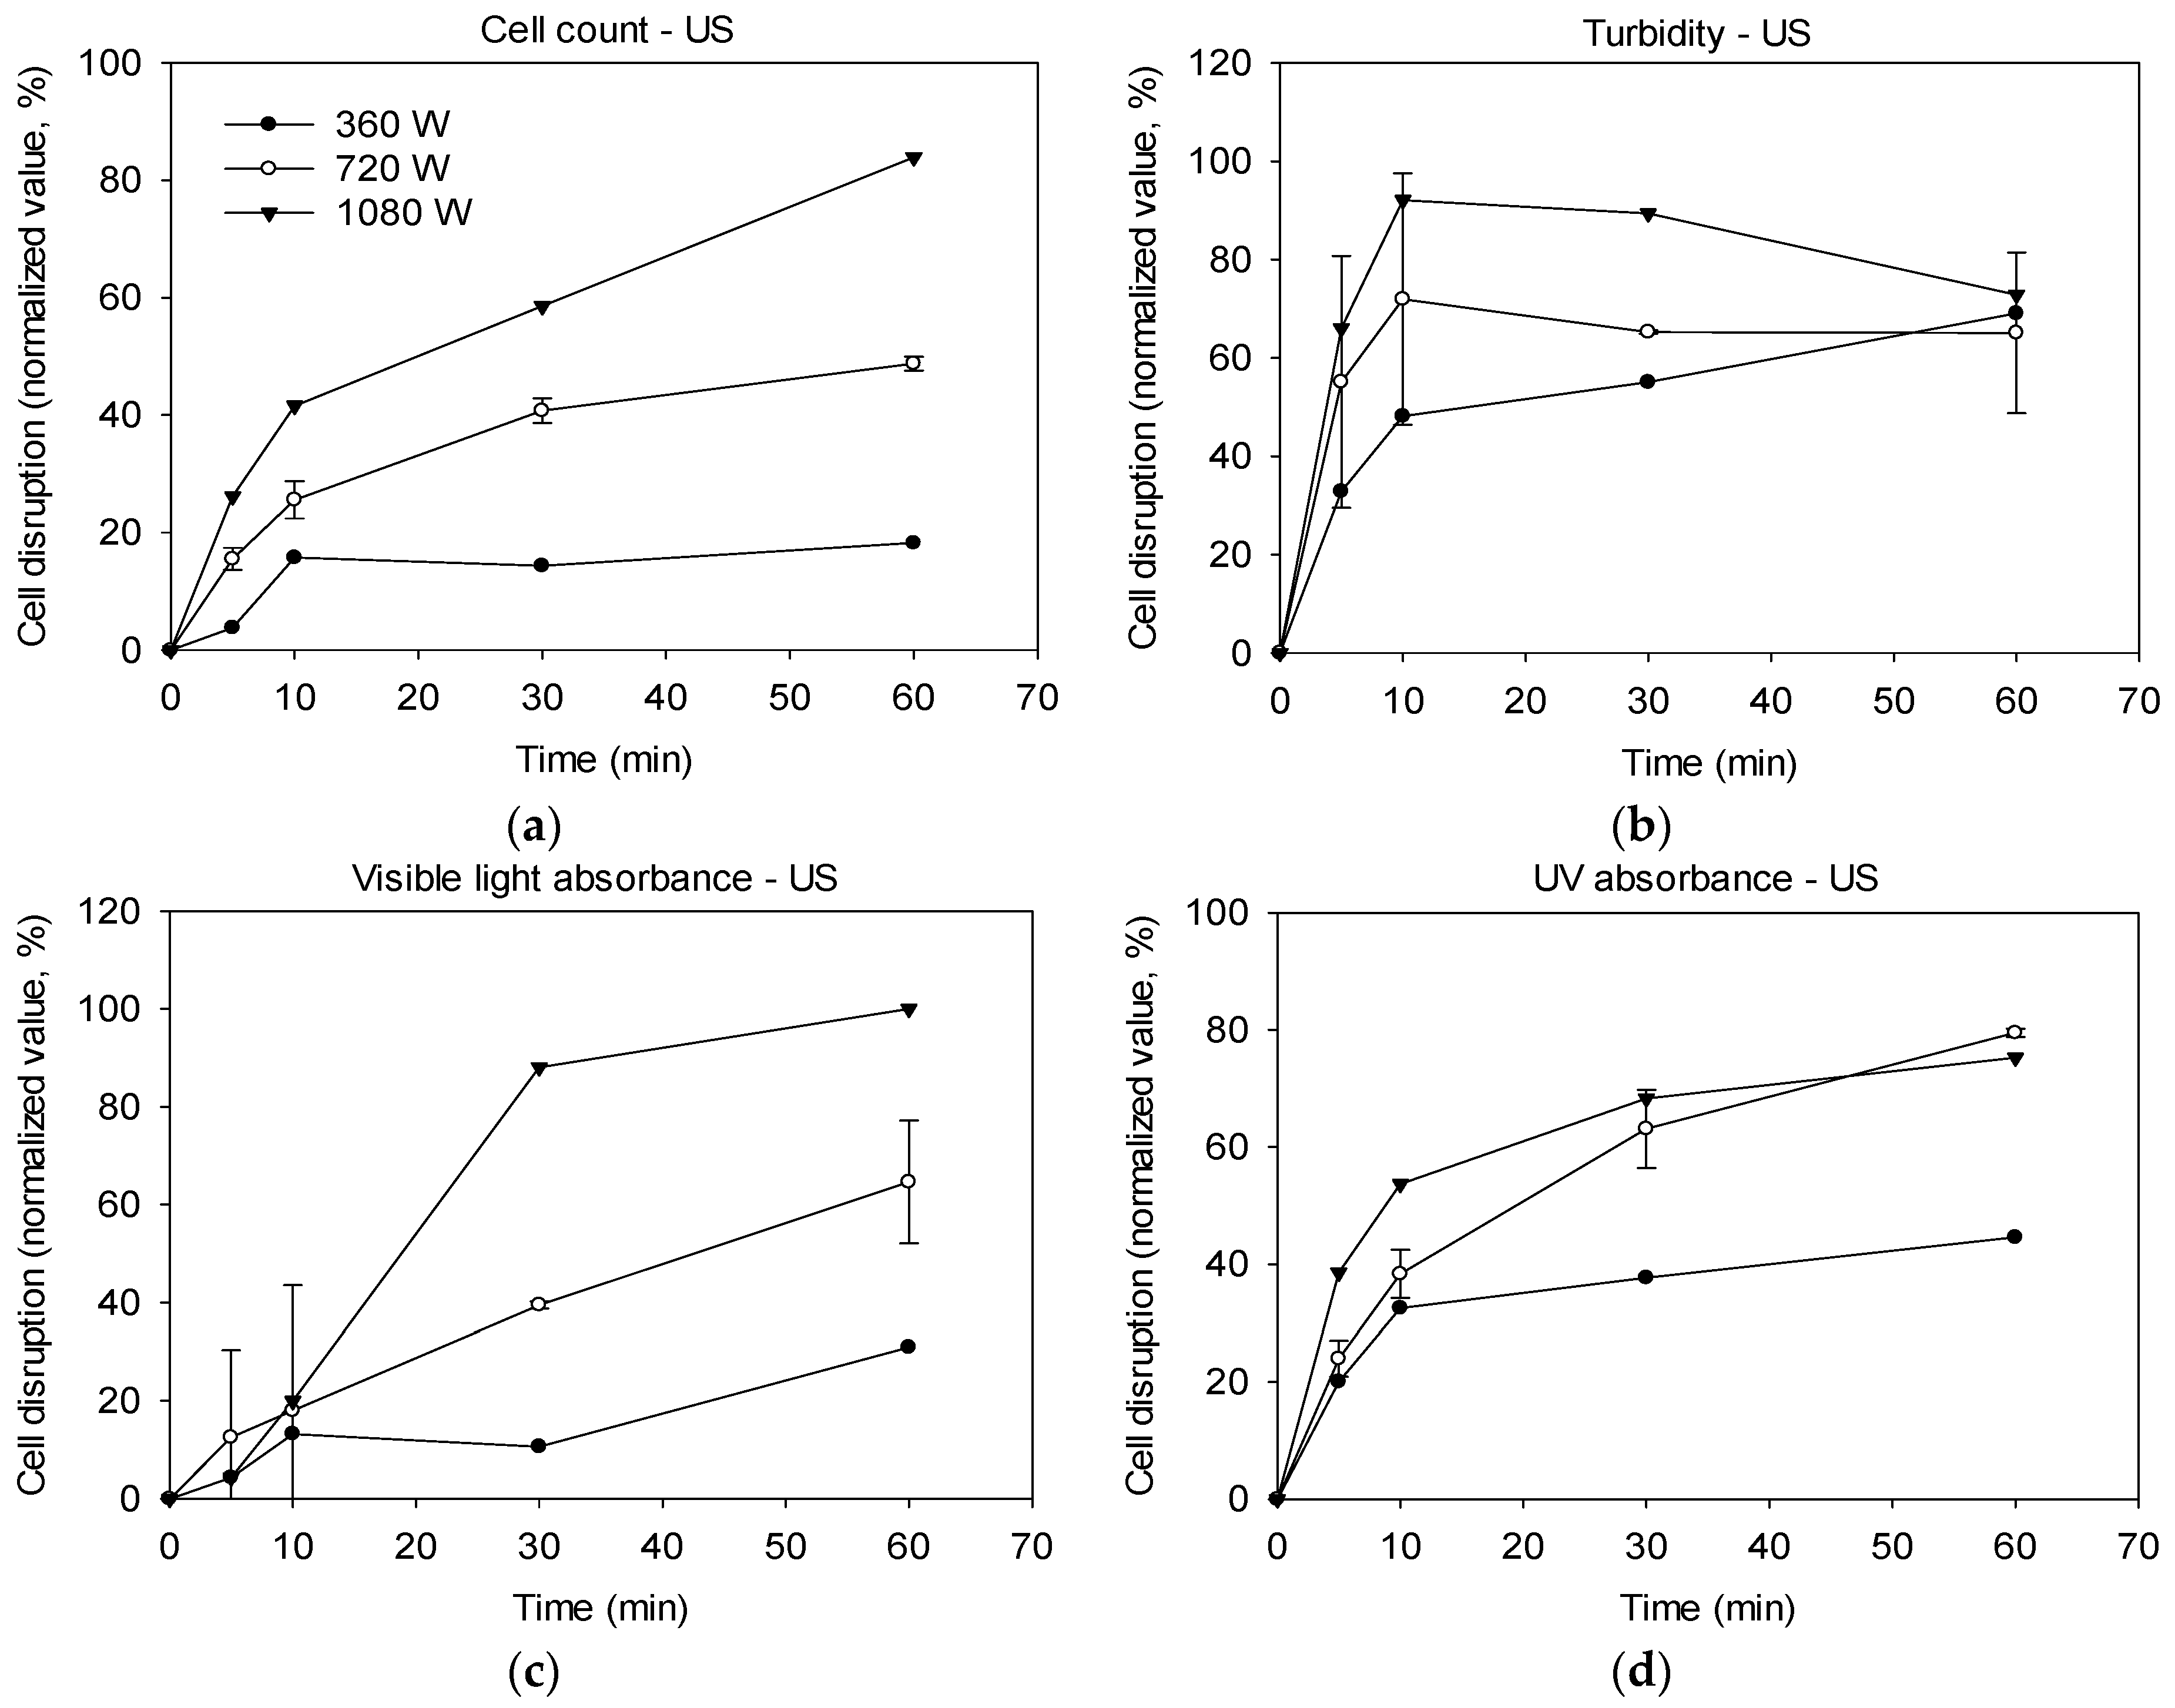
2.1. Cell Disruption by Ultrasonication

Figure 1 presented the results of cell disruption with US quantified using four different indicators of turbidity, visible light absorbance, cell count and UV absorbance. Theoretically, the cell disruption rate ranged between 0 and 100%, which was more applicable when cell count was used as the quantification method as the quantity of C. vulgaris cells could be measured absolutely before and after disruption, and in the case of complete disruption when all cells are disrupted, the minimum observed intact cell quantity is zero. One of the limitations of cell count is that it is hard to reflect the extent of cell fragmentation quantitatively. Nevertheless, because of its accuracy and reproducibility, cell count still could be taken as a reliable benchmark for other measurement indicators in C. vulgaris cell quantification.
For turbidity, visible light absorbance and UV absorbance, it was difficult to obtain the values that corresponded to the fully disrupted cells, so the minimum or maximum observed cell quantity was introduced to normalize the data. Thus, this normalization might lead to higher disruption rate than actual value, however, the disrupted cell debris, the organic components issued from broken cells and the degradation products of cellular metabolites during US treatment all contributed to the measured value, which made the results uncertain and complicated.
As depicted in Figure 1, when cell count was used as indicator, the disruption rate increased as the processing time and ultrasonic power increasing with a distinct tendency: the highest C. vulgaris cell disruption proportion of 83.8% was obtained at the processing time of 60 min and the ultrasonic power of 1080 W, indicating that US was effective for C. vulgaris cell disruption.
The curves of turbidity, visible light absorbance and UV absorbance followed similar trends with those of cell count: the cell disruption proportions obtained under the same condition of 1080 W and 60 min were 72.8%, 100% and 75.3% for turbidity, visible light absorbance and UV absorbance, respectively. However, the tendency was more ambiguous. For turbidity, at lower ultrasonic power of 360 W, the cell disruption proportion increased with the treatment time. At higher ultrasonic power, the cell disruption curves ascended first and after descended. The main reason accounting for the fluctuation might be the degradation of the C. vulgaris cellular metabolites by US.
Under exposure to intense ultrasonic energy, the cells were torn into smaller fragments by mechanical energy of cavitation, the cell shape changed from round to irregular, and the decreasing solid mass led to reduced turbidity. After cell breaking, the cellular metabolites such as protein, lipid, nucleic acid and chlorophyll were released into surrounding culture medium, which brought increased UV absorbance in the liquid. The metabolites were subsequently subjected to oxidation by free radicals produced from the reactions between ultrasonic waves and water [24]. As reported, most of the biomolecules could react with the active radicals [25]. The lipids were decomposed and the unsaturated fatty acids were reduced as a result of ultrasonic oxidation [19,26]. Chlorophyll was oxidized and lost color, thus exhibited decreased visible light absorbance. Excessive US might also cause protein degradation or thermal denaturation due to the temperature augmentation in the US treatment system, which has been certified in the literatures [27,28]. Some new particles might have been formed during this period, and as a result caused increased turbidity. For this reason, cell count curves had the most distinct trend and the narrowest error bar. Thus, it is recommended that cell count be applied as a reliable indicator to evaluate cell disruption during US treatment.

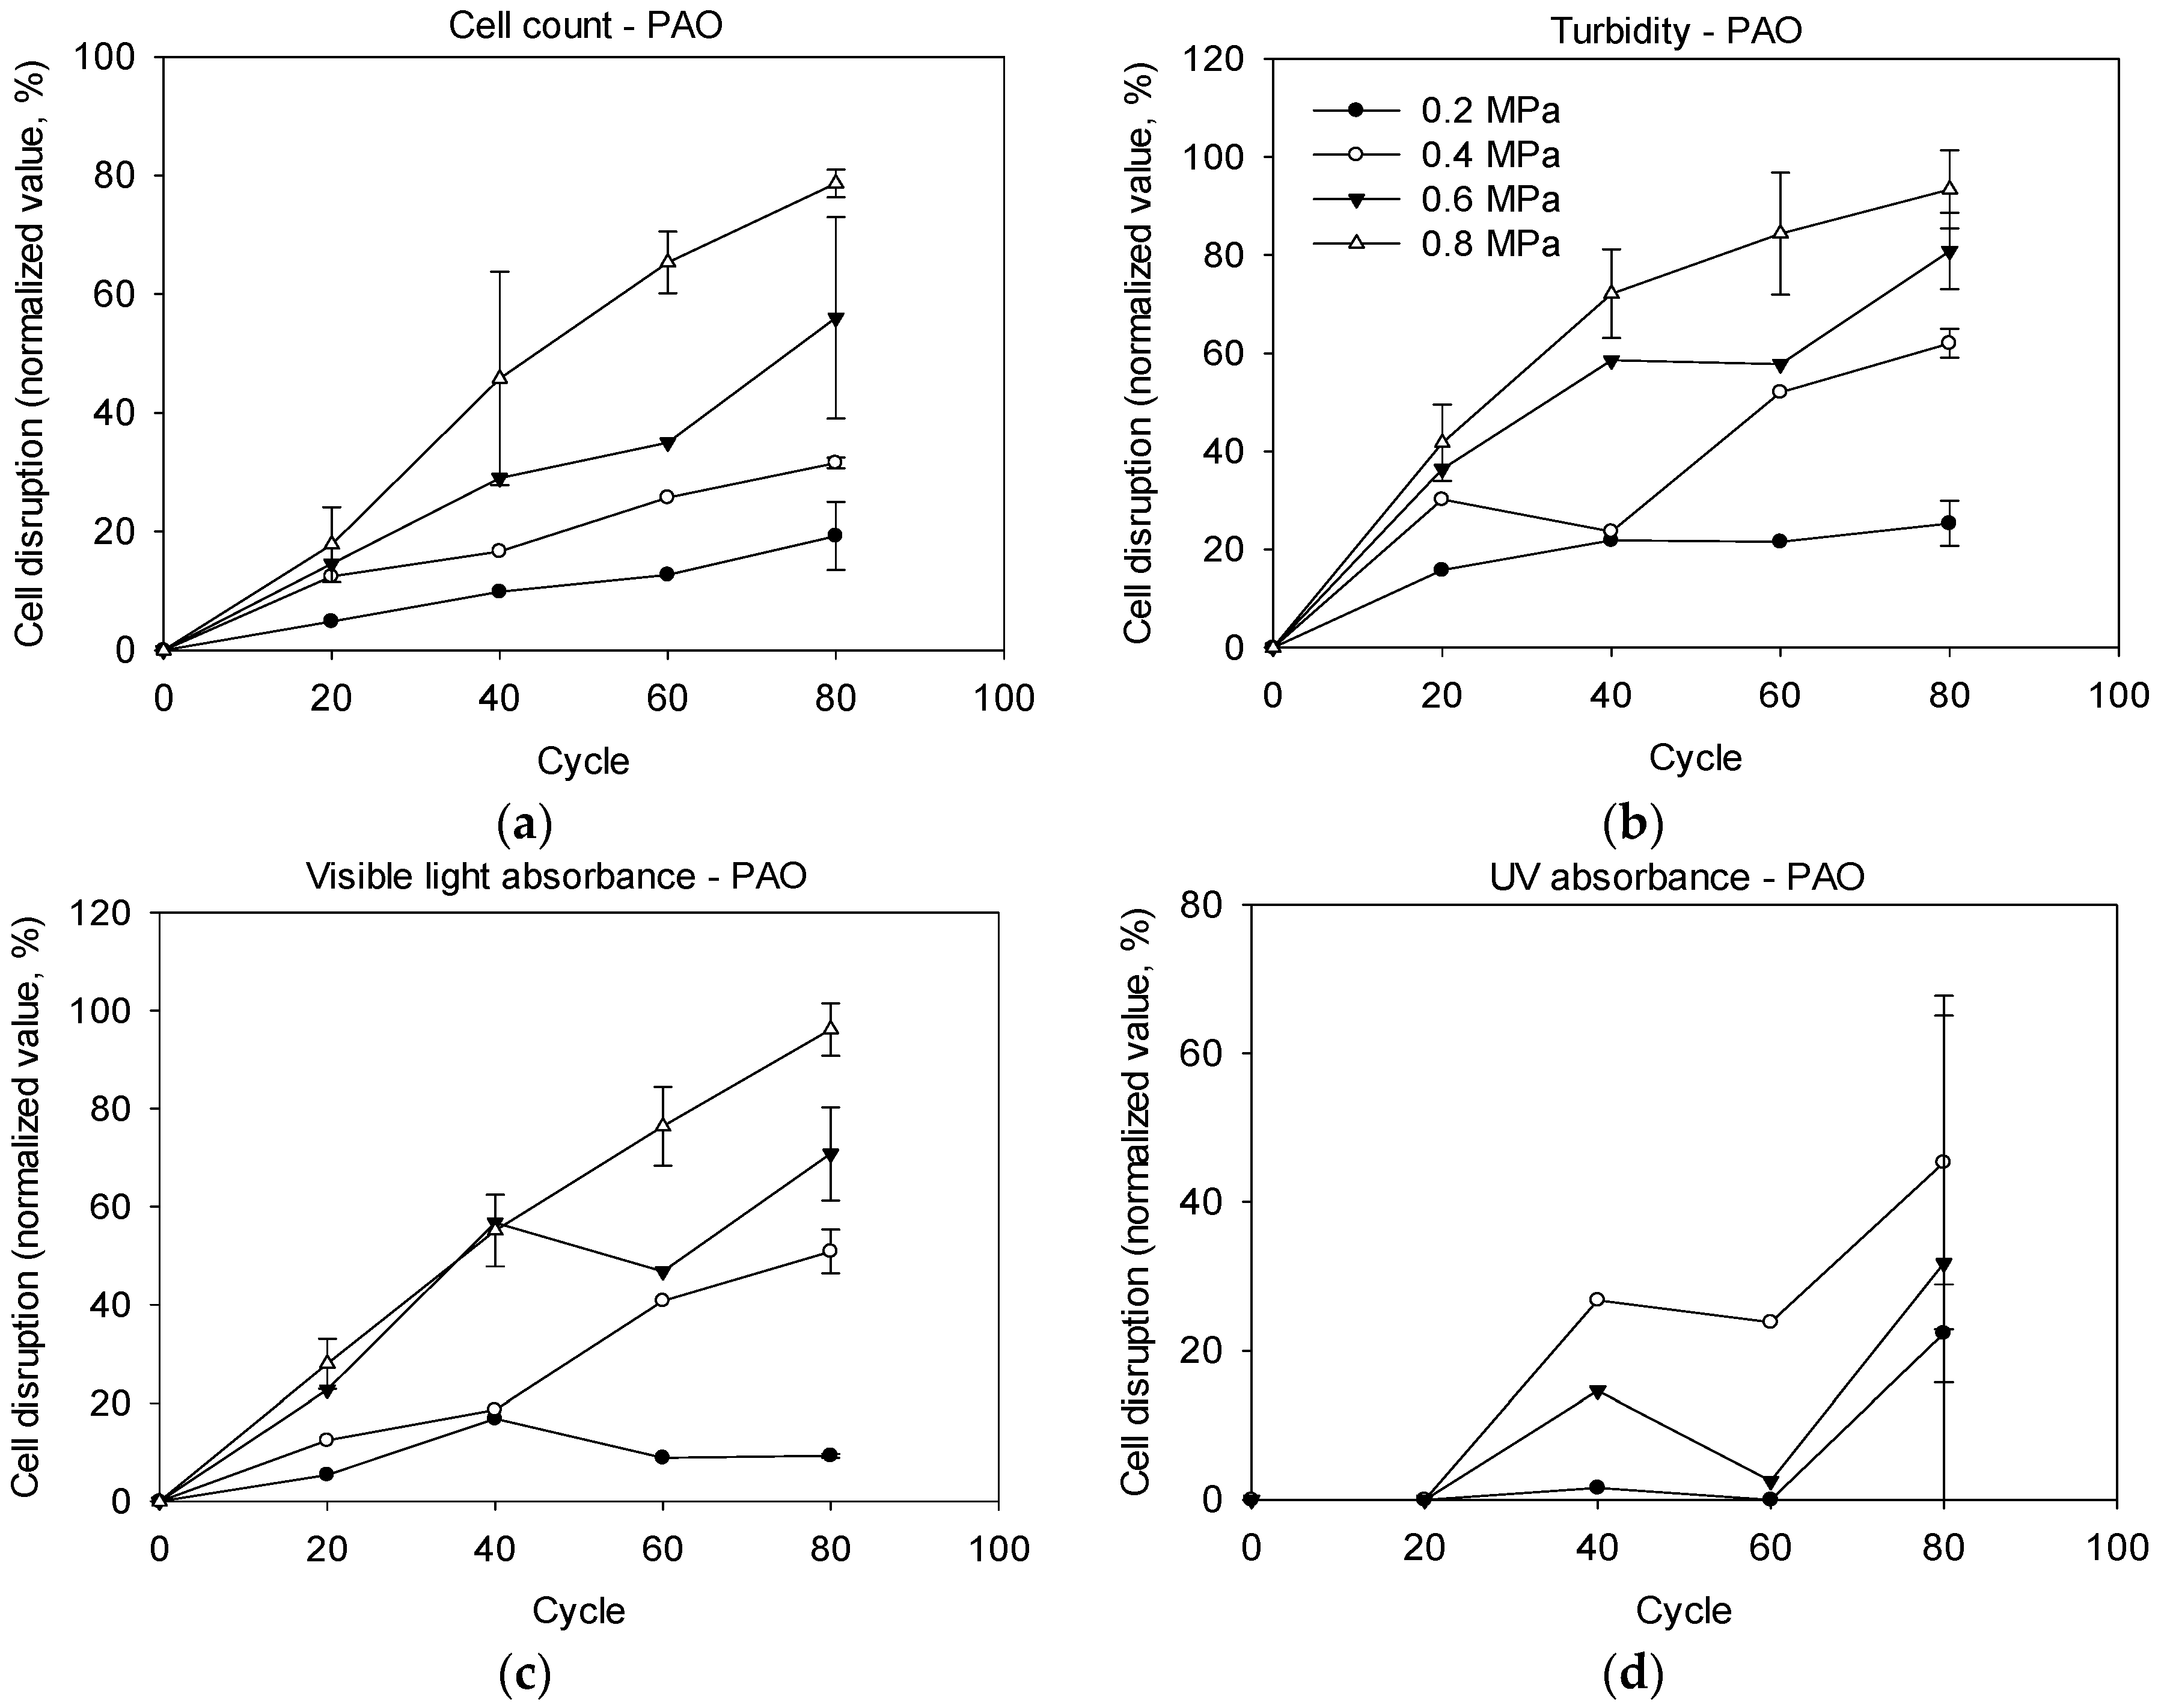
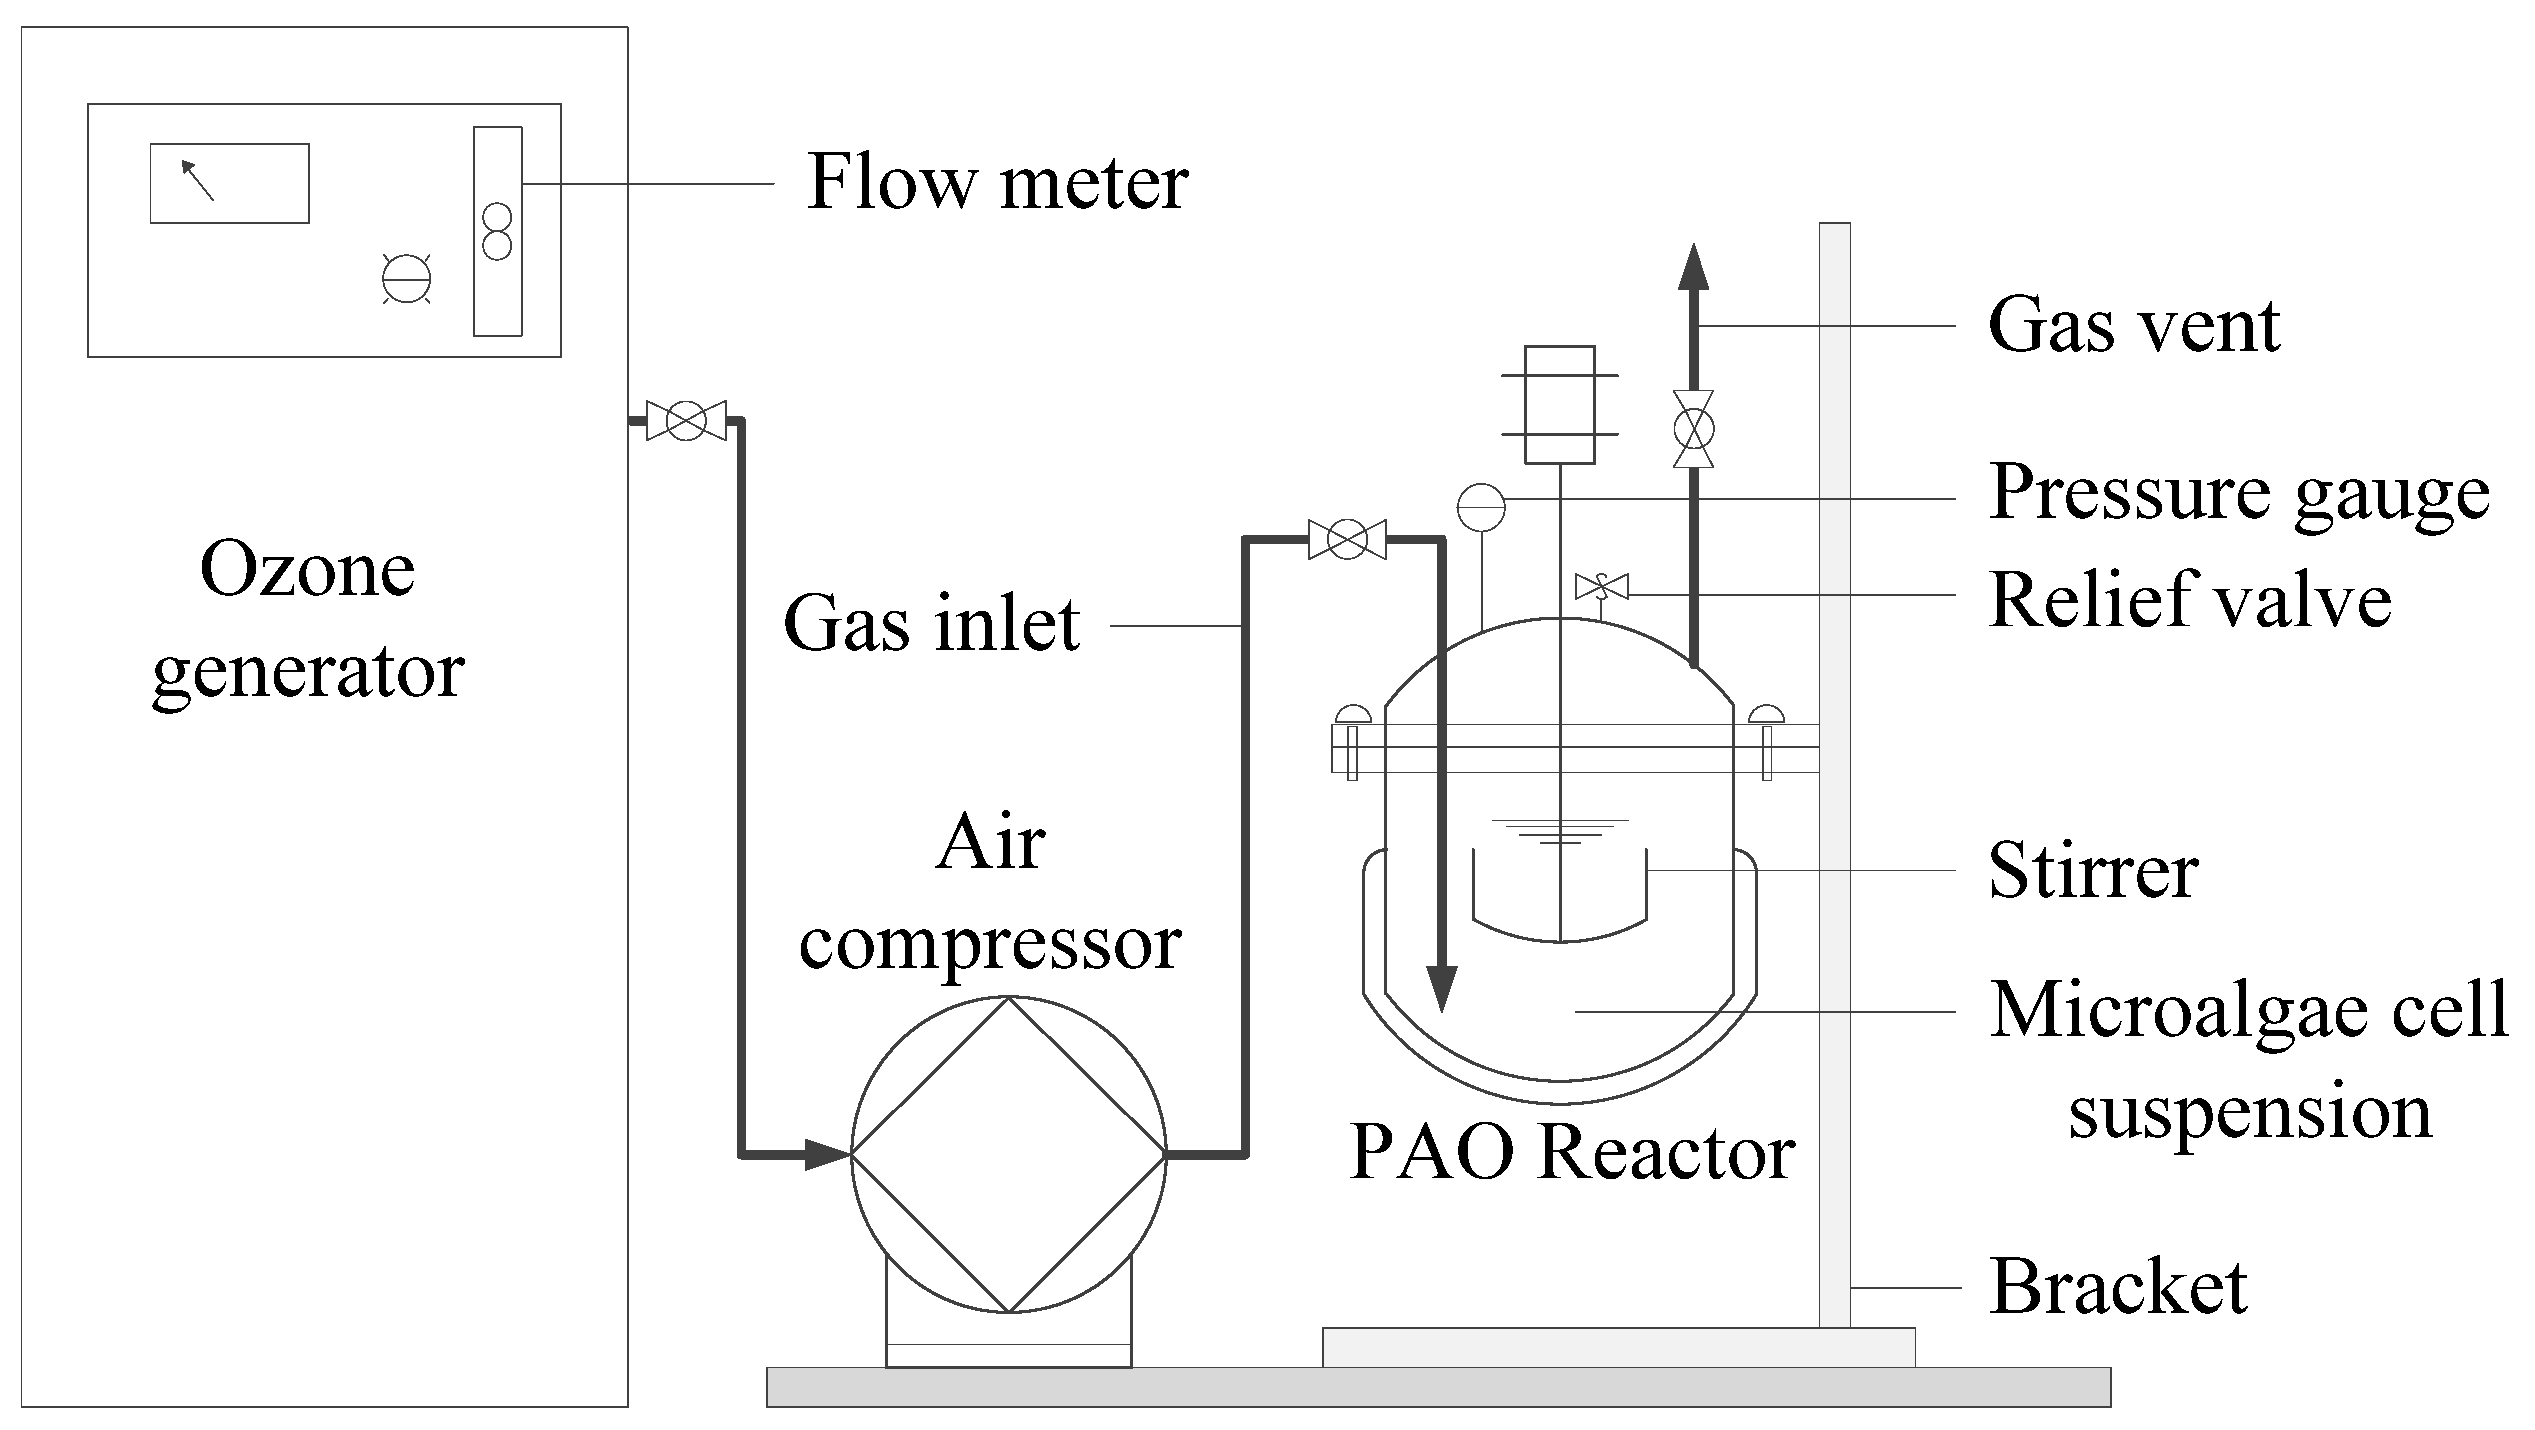
2.2. Cell Disruption by Pressure-Assisted Ozonation

Observing the curves in Figure 2, it can be found that when using cell count as quantification indicator, the results followed the most distinct trends, turbidity and visible light absorbance had similar trends with that of cell count yet with sharper fluctuations. UV absorbance curves fluctuated dramatically with wild error bars. The cell disruption proportions obtained under the same condition of 80 cycles and 0.8 MPa were 87.7%, 92.4% and 7.6% for turbidity, visible light absorbance and UV absorbance, respectively. This might be interpreted as cell count is the most reliable among the four indicators in both cases, PAO and US disruption. Manual cell counting is more accurate than automated cell counting considering the interference caused by cell debris. For PAO, as the processing pressure and cycles increased, the aqueous ozone concentrations were also increased. For example, under the pressures of 0.2, 0.4, 0.6 and 0.8 MPa, when the cycle number was 80, the aqueous ozone concentrations in the suspension were 0.5, 0.8, 1.2 and 2.4 mg·L−1, respectively.
The fortified conditions brought about increased cell disruption rates accordingly. Under the PAO treatment condition of 0.8 MPa and 80 cycles (corresponding to a processing time of around 40 min), the C. vulgaris cell disruption proportion reached 80.3%. The cell disruption rate depended on the cell wall fracturability or its resistance to US and PAO processes. The results in this study indicated that C. vulgaris cell was more sensitive to PAO than US. Generally, PAO shortened the treatment time by one-third while achieving disruption rates close to that of US. In PAO treatment, during the compression phase, the exerted pressure enhanced the mass transfer of ozone into the aqueous media, and promoted the penetration rate or migration of dissolved ozone into the cell wall of C. vulgaris. During decompression phase, the compressed gas within the cells expanded at high speed until the concomitant shear force and impulsive force broke through the cell wall and membrane. At the same time, the cells undermined by improved ozonation in return became more fragile to the mechanical shock induced by successive compression and decompression.
Generally, the curves of turbidity were not as smooth as those of cell counting, thus turbidity might be less applicable than cell counting. Basically, along with the cell disruption proceeding, as cell components degrade, the solid mass concentration reduced and the light scattering of the treated cell suspension decreased, which led to decreased turbidity of cell suspension, and manifested increased cell disruption rate, and its curves aligned well with cell count in this study [14,29].
The validity of UV absorbance as quantification indicator of C. vulgaris cell disruption by PAO is highly questionable. During PAO treatment, the C. vulgaris cells undertook the severe attack by cooperated oxidation and pressurization. The cytoplasm from broken algal cells and the materials that built up the cell wall and membrane were released into the media, which had been expected to contribute to and increase the UV absorbance in the media. Conversely, Figure 2 indicated that the UV absorbance curves did not demonstrate this evident tendency, especially under the harshest condition of 0.8 MPa. Moreover, the UV absorbance exhibited a substantial underestimation of the disruption proportion compared to the other three indicators. When the PAO pressure increased to 0.8 MPa, the cell disruption proportions indicated by UV absorbance were only 9.9%, 10.6%, 6.2%, and 7.6% at cycles of 20, 40, 60 and 80, respectively, and this probably suggested obvious degradation or transformation of cellular compounds.

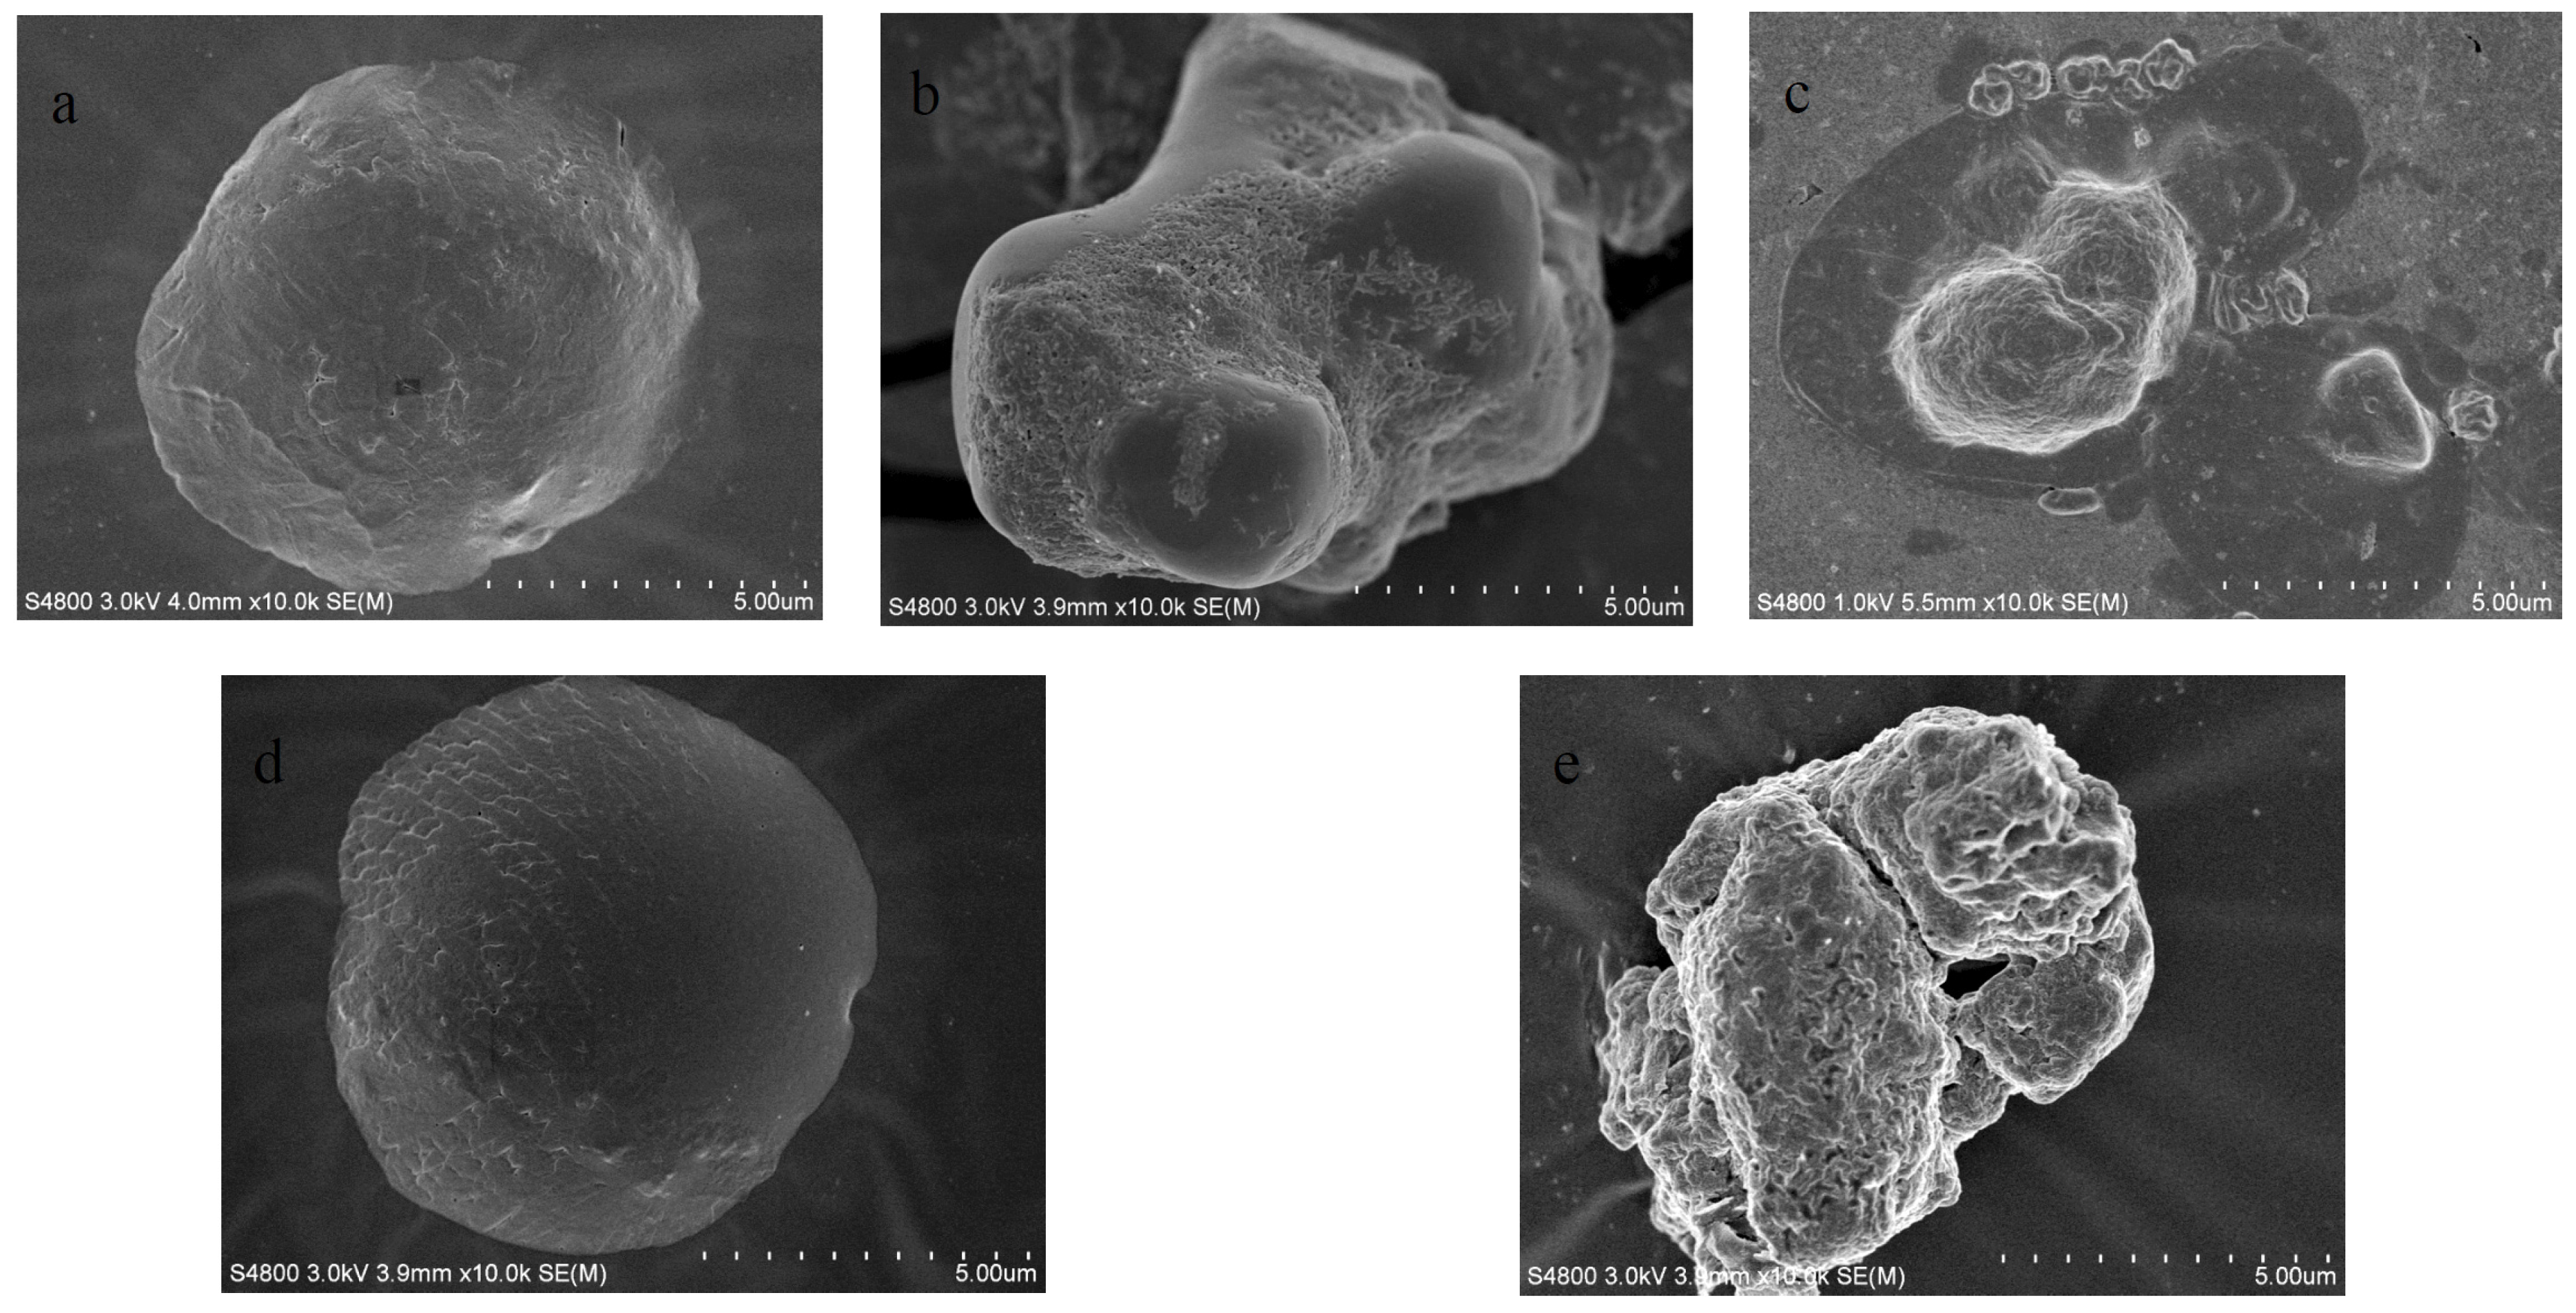
2.3. Scanning Electron Microscope Observation

It is meaningful to examine the cellular morphology to further understand the cell disruption mechanisms of US and PAO. The impact of US and PAO on the cellular morphology of C. vulgaris cells was investigated using scanning electron microscope (SEM). Figure 3 shows the SEM images of unicellular C. vulgaris cell before and after treatments. Under the PAO treatment condition of 0.8 MPa and 20 cycles, the intact C. vulgaris cells with smooth spherical surface were greatly distorted to anomalous shape. After 80 cycles PAO treatment under 0.8 MPa, the cells were severely lysed into fragments. When treated using US with power of 1080 W for 5 min, the cells shape remained normal, and the surface of the cells was only slightly roughened; however, when extending the US treatment time to 60 min, the cells were found to have shrunken greatly and shriveled with many punctures at the surface. This result revealed the C. vulgaris cells form during different stages of PAO and US treatment and testified some previous surmises that the cells damage was caused by both physical and chemical attack, and PAO was a fiercer method than US in cell disruption.
It is useful to compare the energy cost during US and PAO for C. vulgaris cell disruption. To assess the efficiency of the two cell disruption methods, the energy delivered and the time consumed for US and PAO are presented in Table 1. Since PAO could be applied to a broad range of biomass concentrations, it made PAO more suitable for scaled up applications; thus, the costs varied regarding different biomass concentrations. By comparing the energy cost during PAO and US for C. vulgaris cell disruption, it was found that PAO consumed only 40% of the energy consumed by US treatment to reach similar cell disruption rate.

3. Discussion

3.1. Effectiveness of Ultrasound

Longer processing time and stronger ultrasound energy input usually resulted in higher concentrations of the released internal organic matter, which could be observed from the UV absorbance value. However, UV absorbance was not able to provide the identity of these cellular metabolites, and its responsiveness was not constant across all organic species [14]. Thus, if the original metabolites endured varied degrees of degradation during US treatment to generate new species of products that have much higher or much lower UV absorbance, errors became inevitable. Some cellular metabolites, such as lipids, may form micelles by adhering to the cell debris to form particles and thus separate from the aqueous medium, which would cause UV absorbance under estimation [30].
Some vulnerable components such as chlorophyll were significantly and rapidly degraded and converted to low-molecular-weight organic acids such as lactic acid, citric acid, succinic acid, etc., which led to reduced amounts of chlorophyll and loss of green color in the microalgae suspension, and exhibited decreased visible light absorbance. This phenomenon was consistent with that reported by Matile et al. [31].
Under the milder condition of low ultrasonic power (360 W), the damage of cellular metabolites was not very significant, or negligible, thus generating relative regular curves, as shown in Figure 1. It is interesting to notice that at the two higher levels of ultrasonic power (720 W and 1080 W), the curves of turbidity, visible light absorbance and UV absorbance are very close to each other, which might imply that US energy of 720 W in this study was a threshold to maximize the permeability of C. vulgaris cell by partly disrupting its surface barriers without fully disintegrating it [32].

3.2. Effectiveness of Pressure-Assisted Ozonation

Ozone is a strong oxidizing agent, which has been used to control biological growth in water treatment plants by its high efficiency of direct molecular reactions and indirect active radical reactions [33]. Ozone was previously reported to be able to lyse microalgae, liberate biopolymers such as proteins, cleave aromatic rings and decrease the molecular weights of natural organic compounds [34]. Different cell components have different degrees of susceptibility to ozonation, they might be mineralized into CO2 and H2O; be partly oxidized, like lipids [19]; extensively degraded, such as cellulose; and others have high tolerance to ozonation, like oxalic acid [35]. Various factors led to the presented UV absorbance findings; thus, using UV absorbance as the quantification indicator for cell disruption by PAO needs to be undertaken with caution.
The C. vulgaris cell disruption by conventional bubbling ozonation (CBO) without compression-decompression cycles was investigated and compared with that of PAO, and the results presented in Table 2 affirmed that the incorporating of moderate pressure effectively enhanced the cell disruption by ozonation. When using cell count, turbidity and visible light absorbance as indicators, it was observed that PAO achieved approximately 2.5 times improvement of C. vulgaris cell disruption with similar ozone dosage in equal treatment time. However, when using UV absorbance as indicator, CBO showed no cell disruption, which might indicate very limited cytoplasm issue and small extent of cell fragmentation.

3.3. Comparation of Different Works

Table 3 compared the present work with some other techniques, including bead milling, microwave, autoclaving and enzymatic lysis. To summarize, when using PAO as cell disruption treatment, there are three main advances with respect to existing methods: (1) PAO could treat cell suspension without drying process, reducing costs; (2) PAO could achieve considerably high cell disruption in short time (less than 1 h); and (3) the cell residue after PAO treatment would be more readily liquefied in the subsequent treatment, such as anaerobic digestion.

4. Materials and Methods

4.1. Microalga Sample Preparation

C. vulgaris was obtained from Institute of Hydrobiology, Chinese Academy of Sciences, Wuhan, China and cultivated as described in an earlier research [39]. In brief, the microalgae were cultivated in 4-L Erlenmeyer flasks containing 2 L growth media under the temperature of 25 °C in an incubator (PGX-350B, SAIFE Co., Ningbo, China). The illumination was supplied by cool white fluorescent lamps with light: dark cycles of 12:12 h and light intensity of 9600 lx. The growth media contains 75 mg·L−1 MgSO4·7H2O, 36 mg·L−1 CaCl2·2H2O, 20 mg·L−1 Na2CO3, 6 mg·L−1 ferric ammonium citrate, 6 mg·L−1 citric acid, 2.86 mg·L−1 H3BO3, 1.86 mg·L−1 MnCl2·4H2O, 1 mg·L−1 Na2EDTA, 0.39 mg·L−1 Na2MoO4·2H2O, 0.22 mg·L−1 ZnSO4·7H2O, 0.08 mg·L−1 CuSO4·5H2O and 0.05 mg·L−1 Co(NO3)2·6H2O. The microalgae were collected during stationary phase, and then the algal density was monitored by a spectrophotometer (723 N, Jingke Industrial Co. Ltd., Shanghai, China) at 540 nm.

4.2. Cell Disruption

Cell disruption by PAO [19]: the ozone-air mixture was generated by an ozone generator (3A-OA-10, Tonglin Technology, Beijing, China, Power 500 W) with dry air as feeding gas, the stream was fed into a 1-L stainless steel reactor containing 300 mL C. vulgaris suspension using an air compressor (Danchai Machine Co. Ltd., Danyang, China, Power 520 W). When the designated pressure (e.g., 1.0 MPa) in the headspace of the sealed reactor was achieved, the pressure was rapidly vented to ambient level, thus completing a single pressure cycle. The designated pressure and the number of successive compression–decompression cycles were varied to identify ideal conditions for cell disruption. The time used to complete a whole cycle was about 30 s when the target pressure was 0.8 MPa. Figure 4 illustrates the PAO system set-up. The ozone concentration was determined by the indigo colorimetric method [40].
Cell disruption by US: The sonication probe of an ultrasonicator (JYP-1200L, Zhixin Instrument Co., Ltd., Shanghai, China, Power 1200 W) was inserted into the center of a 200 mL-C. vulgaris suspension placed in a 500-mL beaker, the US was operated at 20 kHz in pulse mode of 10 s on/10 s off. Experiments were conducted in batch mode with varying acoustic power and treatment time.
Before PAO or US treatment, the C. vulgaris cell suspension was diluted with water to give a turbidity of 280 NTU, which was equivalent to approximately 10,000 cells per mL.

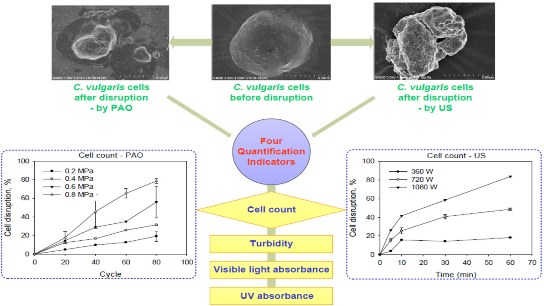
4.3. Quantitative Evaluation of Cell Disruption

Cell counting was performed by manually counting 90 squares of a hemacytometer chamber (Bright-Line, Hausser Scientific, Horsham, PA, USA) using a microscope (LEICA DME, Wetzlar, Germany) with a color video camera (TK-C1481BEC, Victor Company of Japan, Ltd., Yokohama, Japan). UV absorbance of the C. vulgaris suspension supernatant was measured by a UV-Vis spectrophotometer (UV-2600, SHIMADZU, Kyoto, Japan) at 260 nm using a 1 cm path length quartz cell. The supernatant was obtained by centrifuging the microalgae suspension at 14,000 rpm for 30 min. Visible light absorbance of the microalgae suspension was measured at 680 nm using a 1 cm path length quartz cell. The turbidity of the microalgae suspension was determined using a turbidity meter (2100P, HACH Company, Loveland, OH, USA). All analyses were taken in triplicate. The untreated and treated microalgae suspensions were freeze-dried and subjected to observation using a SEM (S-4800, HITACHI, Tokyo, Japan).

4.4. Data Analysis

The data on cell disruption were analyzed according to a normalization method proposed by Spiden et al. [14]. The purpose of the normalization is to facilitate the comparison of the utility of different quantification indicators.
For cell counting, the cell disruption rates were calculated by Equation (1):
D t = c i c t c i 100
For turbidity and visible light absorbance (680 nm), the cell disruption rates were calculated by Equation (2):
D t = c i c t c i c min 100
where Dt represents the cell disruption proportion at point t, ci represents the initial cell quantity, ct represents the cell quantity at point t, and cmin represents the minimum observed cell quantity by observing turbidity or visible light absorbance.
For UV absorbance (260 nm), which represented the released cell metabolite quantity, the cell disruption rates were calculated using Equation (3):
D t = x t x i x max x i 100
where xt represents the metabolite concentration at point t, xi represents the initial metabolite concentration in the suspension supernatant, and xmax represents the maximal observed cell metabolite release.

5. Conclusions

Compared with US, PAO is an effective cell disruption method with higher efficiency. Cell counting is a reliable method for evaluating C. vulgaris cell disruption but it is also tedious. UV absorbance was a representative indirect quantitative method; however it is not applicable in the case of significant metabolite degradation. When US and PAO were applied to cell disruption, careful control of treatment condition is necessary to maximize the disruption and prevent any detrimental effects on desired products. For its high destruction effect to microalgae, PAO process could be considered as a promising technique for algal removal in the case of eutrophication.

Acknowledgments

The authors would like to thank Chinese Natural Science Foundation (Project No. 51208299), the Innovation Program of Shanghai Municipal Education Commission (Grant No. 15ZZ075), “Chen Guang” project supported by Shanghai Municipal Education Commission and Shanghai Education Development Foundation (Grant No. 11CG52) and the Hujiang Foundation of China (Grant No. B14003) for funding support.

Author Contributions

Yuanxing Huang prepared the manuscript, and contributed partially to the manuscript revision. Shengnan Qin carried out the experiments and was responsible for data acquisition. Daofang Zhang analyzed experimental data with theoretical explanation for typical phenomenon. Liang Li proposed the research hypothesis, designed experiments, and assisted with manuscript editing and revision process. Yan Mu helped with literature research and statistical analysis.

Conflicts of Interest

The authors declare no conflict of interest.

Abbreviations

USUltrasonication
PAOPressure-assisted ozonation
UVUltra violet
SEMScanning electron microscope

References

  1. Sun, J.; Sun, B.; Wang, S. The status and prospect of vehicle alternative fuel. Energy Res. Inf. 2014, 30, 125–128. [Google Scholar]
  2. Jiang, L.; Yu, H. Research status on gasification and pyrolysis characteristics of biomass components. Energy Res. Inf. 2015, 31, 9–13. [Google Scholar]
  3. Safi, C.; Zebib, B.; Merah, O.; Pontalier, P.Y.; Vaca-Garcia, C. Morphology, composition, production, processing and applications of Chlorella vulgaris: A review. Renew. Sustain. Energy Rev. 2014, 35, 265–278. [Google Scholar] [CrossRef]
  4. Ebrahiminezhad, A.; Rasoul-Amini, S.; Ghoshoon, M.B.; Ghasemi, Y. Chlorella vulgaris, a novel microalgal source for l-asparaginase production. Biocatal. Agric. Biotechnol. 2014, 3, 214–217. [Google Scholar] [CrossRef]
  5. Frumento, D.; Casazza, A.A.; Al Arni, S.; Converti, A. Cultivation of Chlorella vulgaris in tubular photobioreactors: A lipid source for biodiesel production. Biochem. Eng. J. 2013, 81, 120–125. [Google Scholar] [CrossRef]
  6. Kitada, K.; Machmudah, S.; Sasaki, M.; Goto, M.; Nakashima, Y.; Kumamoto, S.; Hasegawa, T. Supercritical CO2 extraction of pigment components with pharmaceutical importance from Chlorella vulgaris. J. Chem. Technol. Biotechnol. 2009, 84, 657–661. [Google Scholar] [CrossRef]
  7. Přibyl, P.; Cepák, V.; Zachleder, V. Production of lipids and formation and mobilization of lipid bodies in Chlorella vulgaris. J. Appl. Phycol. 2013, 25, 545–553. [Google Scholar] [CrossRef]
  8. Günerken, E.; D'Hondt, E.; Eppink, M.H.M.; Garcia-Gonzalez, L.; Elst, K.; Wijffels, R.H. Cell disruption for microalgae biorefineries. Biotechnol. Adv. 2015, 33, 243–260. [Google Scholar] [CrossRef] [PubMed]
  9. Lee, J.Y.; Yoo, C.; Jun, S.Y.; Ahn, C.Y.; Oh, H.M. Comparison of several methods for effective lipid extraction from microalgae. Bioresour. Technol. 2010, 101, S75–S77. [Google Scholar] [CrossRef] [PubMed]
  10. Postma, P.R.; Miron, T.L.; Olivieri, G.; Barbosa, M.J.; Wijffels, R.H.; Eppink, M.H.M. Mild disintegration of the green microalgae Chlorella vulgaris using bead milling. Bioresour. Technol. 2015, 184, 297–304. [Google Scholar] [CrossRef] [PubMed]
  11. Samarasinghe, N.; Fernando, S.; Lacey, R.; Faulkner, W.B. Algal cell rupture using high pressure homogenization as a prelude to oil extraction. Renew. Energy 2012, 48, 300–308. [Google Scholar] [CrossRef]
  12. Yap, B.H.J.; Dumsday, G.J.; Scales, P.J.; Martin, G.J.O. Energy evaluation of algal cell disruption by high pressure homogenisation. Bioresour. Technol. 2015, 184, 280–285. [Google Scholar] [CrossRef] [PubMed]
  13. Middelberg, A.P.J. Process-scale disruption of microorganisms. Biotechnol. Adv. 1995, 13, 491–551. [Google Scholar] [CrossRef]
  14. Spiden, E.M.; Scales, P.J.; Kentish, S.E.; Martin, G.J.O. Critical analysis of quantitative indicators of cell disruption applied to Saccharomyces cerevisiae processed with an industrial high pressure homogenizer. Biochem. Eng. J. 2013, 70, 120–126. [Google Scholar] [CrossRef]
  15. Hong, P.K.A.; Nakra, S.; Jimmy Kao, C.M.; Hayes, D.F. Pressure-assisted ozonation of PCB and PAH contaminated sediments. Chemosphere 2008, 72, 1757–1764. [Google Scholar] [CrossRef] [PubMed]
  16. Cha, Z.; Lin, C.F.; Cheng, C.J.; Hong, P.K.A. Removal of oil and oil sheen from produced water by pressure-assisted ozonation and sand filtration. Chemosphere 2010, 78, 583–590. [Google Scholar] [CrossRef] [PubMed]
  17. Cheng, C.J.; Andy Hong, P.K.; Lin, C.F. Improved solubilization of activated sludge by ozonation in pressure cycles. Chemosphere 2012, 87, 637–643. [Google Scholar] [CrossRef] [PubMed]
  18. Cheng, C.J.; Hong, P.K.A. Anaerobic digestion of activated sludge after pressure-assisted ozonation. Bioresour. Technol. 2013, 142, 69–76. [Google Scholar] [CrossRef] [PubMed]
  19. Huang, Y.; Hong, P.K.A.; Zhang, D.; Li, L. Comparison of cell rupturing by ozonation and ultrasonication for algal lipid extraction from Chlorella vulgaris. Environ. Technol. 2014, 35, 931–937. [Google Scholar] [CrossRef] [PubMed]
  20. Bystryak, S.; Santockyte, R.; Peshkovsky, A.S. Cell disruption of S. cerevisiae by scalable high-intensity ultrasound. Biochem. Eng. J. 2015, 99, 99–106. [Google Scholar] [CrossRef]
  21. Cheung, Y.C.; Liu, X.X.; Wang, W.Q.; Wu, J.Y. Ultrasonic disruption of fungal mycelia for efficient recovery of polysaccharide-protein complexes from viscous fermentation broth of a medicinal fungus. Ultrason. Sonochemistry 2015, 22, 243–248. [Google Scholar] [CrossRef] [PubMed]
  22. Monks, L.M.; Rigo, A.; Mazutti, M.A.; Vladimir Oliveira, J.; Valduga, E. Use of chemical, enzymatic and ultrasound-assisted methods for cell disruption to obtain carotenoids. Biocatal. Agric. Biotechnol. 2013, 2, 165–169. [Google Scholar] [CrossRef]
  23. Yusaf, T.; Al-Juboori, R.A. Alternative methods of microorganism disruption for agricultural applications. Appl. Energy 2014, 114, 909–923. [Google Scholar] [CrossRef]
  24. Wang, M.; Yuan, W.; Jiang, X.; Jing, Y.; Wang, Z. Disruption of microalgal cells using high-frequency focused ultrasound. Bioresour. Technol. 2014, 153, 315–321. [Google Scholar] [CrossRef] [PubMed]
  25. Show, K.Y.; Lee, D.J.; Tay, J.H.; Lee, T.M.; Chang, J.S. Microalgal drying and cell disruption—Recent advances. Bioresour. Technol. 2015, 184, 258–266. [Google Scholar] [CrossRef] [PubMed]
  26. Pingret, D.; Fabiano-Tixier, A.-S.; Chemat, F. Degradation during application of ultrasound in food processing: A review. Food Control 2013, 31, 593–606. [Google Scholar] [CrossRef]
  27. Chisti, Y.; Moo-Young, M. Disruption of microbial cells for intracellular products. Enzym. Microbial. Technol. 1986, 8, 194–204. [Google Scholar] [CrossRef]
  28. Liu, D.; Zeng, X.-A.; Sun, D.-W.; Han, Z. Disruption and protein release by ultrasonication of yeast cells. Innov. Food Sci. Emerg. Technol. 2013, 18, 132–137. [Google Scholar] [CrossRef]
  29. Wileman, A.; Ozkan, A.; Berberoglu, H. Rheological properties of algae slurries for minimizing harvesting energy requirements in biofuel production. Bioresour. Technol. 2012, 104, 432–439. [Google Scholar] [CrossRef] [PubMed]
  30. Gerde, J.A.; Montalbo-Lomboy, M.; Yao, L.; Grewell, D.; Wang, T. Evaluation of microalgae cell disruption by ultrasonic treatment. Bioresour. Technol. 2012, 125, 175–181. [Google Scholar] [CrossRef] [PubMed]
  31. Matile, P.; Hortensteiner, S.; Thomas, H. Chlorophyll degradation. Annu. Rev. Plant Physiol. Plant Mol. Biol. 1999, 50, 67–95. [Google Scholar] [CrossRef] [PubMed]
  32. Azencott, H.R.; Peter, G.F.; Prausnitz, M.R. Influence of the Cell Wall on Intracellular Delivery to Algal Cells by Electroporation and Sonication. Ultrasound Med. Biol. 2007, 33, 1805–1817. [Google Scholar] [CrossRef] [PubMed]
  33. Miao, H.; Tao, W. The mechanisms of ozonation on cyanobacteria and its toxins removal. Sep. Purif. Technol. 2009, 66, 187–193. [Google Scholar] [CrossRef]
  34. Cheng, Y.-L.; Juang, Y.-C.; Liao, G.-Y.; Ho, S.-H.; Yeh, K.-L.; Chen, C.-Y.; Chang, J.-S.; Liu, J.-C.; Lee, D.-J. Dispersed ozone flotation of Chlorella vulgaris. Bioresour. Technol. 2010, 101, 9092–9096. [Google Scholar] [CrossRef] [PubMed]
  35. Blanca Roncero, M.; Colom, J.F.; Vidal, T. Why oxalic acid protects cellulose during ozone treatments? Carbohydr. Polym. 2003, 52, 411–422. [Google Scholar] [CrossRef]
  36. Doucha, J.; Lívanský, K. Influence of processing parameters on disintegration of Chlorella cells in various types of homogenizers. Appl. Microbiol. Biotechnol. 2008, 81, 431–440. [Google Scholar] [CrossRef] [PubMed]
  37. Zheng, H.; Yin, J.; Gao, Z.; Huang, H.; Ji, X.; Dou, C. Disruption of Chlorella vulgaris Cells for the Release of Biodiesel-Producing Lipids: A Comparison of Grinding, Ultrasonication, Bead Milling, Enzymatic Lysis, and Microwaves. Appl. Biochem. Biotechnol. 2011, 164, 1215–1224. [Google Scholar] [CrossRef] [PubMed]
  38. Fu, C.C.; Hung, T.C.; Chen, J.Y.; Su, C.H.; Wu, W.T. Hydrolysis of microalgae cell walls for production of reducing sugar and lipid extraction. Bioresour. Technol. 2010, 101, 8750–8754. [Google Scholar] [CrossRef] [PubMed]
  39. Huang, Y.; Li, L.; Song, C. Effect of nitrogen and phosphorus levels on the lipid production of Chlorella vulgaris and evaluation of ultrasound-assisted lipid extraction. Fresenius Environ. Bull. 2013, 22, 2848–2854. [Google Scholar]
  40. Indigo Colorimetric Method, Standard Methods, 21st ed.; 4500-O3 B; American Public Health Association: Washington, DC, USA, 2005.
Figure 1. Chlorella vulgaris (C. vulgaris) cell disruption by ultrasonication (US) quantified using four different indicators: (a) cell count; (b) turbidity; (c) visible light absorbance; and (d) ultra violet (UV) absorbance.
Energies 09 00173 g001
Figure 2. C. vulgaris cell disruption by PAO quantified with 4 different indicators: (a) cell count—pressure-assisted ozonation (PAO); (b) turbidity—PAO; (c) visible light absorbance—PAO; (d) UV absorbance—PAO.
Energies 09 00173 g002
Figure 3. Scanning electron microscope (SEM) micrographs of C. vulgaris cells before and after treatment: (a) before treatment; (b) PAO: 0.8 MPa, 20 cycle; (c) PAO: 0.8 MPa, 80 cycle; (d) US: 5 min; 1080 W and (e) US: 60 min, 1080 W.
Energies 09 00173 g003
Figure 4. Experimental setup of PAO.
Energies 09 00173 g004
Table 1. The energy delivered and the time consumed for US and PAO.
TreatmentTime (min)Energy Dissipated (kJ·mL−1)Disruption Rate (%)Treatment Condition
PAO408.1680.30.8 MPa, 80 cycle, power of 1020 W
US6019.4483.8Power of 1080 W
Table 2. C. vulgaris cell disruption by PAO and conventional bubbling ozonation (CBO) compared using the four indicators.
Treatment *Disruption rate (%) **Operation Condition
Cell CountTurbidityVisible Light AbsorbanceUV Absorbance
CBO34.625.660.60.0Bubbling ozonation for 40 min under ambient pressure
PAO80.387.792.47.60.8 MPa, 80 cycle
* Aqueous ozone concentrations were 2.6 and 2.4 mg·L–1 for CBO and PAO, respectively; ** normalized values.
Table 3. Comparison of different techniques for Chlorella cell disruption.
MethodConditionsOutcomeReferences
Bead millingGlass beads 0.25–0.5 mm85% cell disintegration[36]
Algae dry weight 158 g·L−1
Beads filling 70%
Feed rate 62 kg·h−1
Time 60 min
Bead millingZrO2 beads 1 mm97% cell disintegration[10]
Beads filling 65%
Biomass concentration 87.5 g·kg−1
Agitator speed 9 m·s−1
Time 10 min
Microwave treatment2450 MHz,17% (w/w) lipid yield[37]
100 °C
Biomass concentration 5 g·L−1
Time 25 min
Autoclaving125 °C10% (w/w) lipid yield[9]
1.5 MPa
Biomass concentration 5 g·L−1
Time 5 min
Enzymatic lysisCellulase 5 mg·L−124% (w/w) lipid yield[37]
55 °C
pH 4.8
Biomass concentration 5 g·L−1
Time 600 min
Enzymatic lysisImmobilized cellulose 140 mg/m260% cell wall hydrolysis[38]
50 °C
pH 4.6
Biomass concentration 20 g·L−1
Time 50 h
PAOAqueous ozone concentrations 2.4 mg·L−180.3% cell disruption; 24% (w/w) lipid yieldThis work and [19]
0.8 MPa
80 cycles
Time 40 min

