1. Introduction
The current study originated from an industrial demand for heat recovery from electrolysis cell side-linings at temperatures in the range 400–650 °C. In aluminum electrolysis, about 50% of the total supplied energy is currently lost as heat to the surroundings. About 35% of the total heat loss is through the walls of the electrolysis cells [
1], which corresponds to
ca. 2.4 kWh/kg of produced aluminum. Cooling panels in the side walls of the electrolysis cells were proposed by Aune
et al. [
2] for improved process control, as well as for high temperature heat recovery. The panels were specified to utilize evaporation and condensation of a working fluid and the recovered heat can be used for, for instance, electricity production. The temperature of the recovered heat depends on the position of the cooling panels in the side-linings of the cells; in the current study, a position corresponding to a temperature range 400–650 °C was specified. The main components of the electrolyte bath are cryolite (Na
3AlF
6) and alumina (Al
2O
3) [
1]. The melting point of aluminum is 660 °C, but the cryolite (in which the alumina is dissolved) requires a temperature of 1010 °C for melting [
1]. The electrolyte bath is very corrosive, but with a working temperature of 400–650 °C in the cooling panels it is possible to create and maintain a protective frozen ledge on the inside of the cell walls.
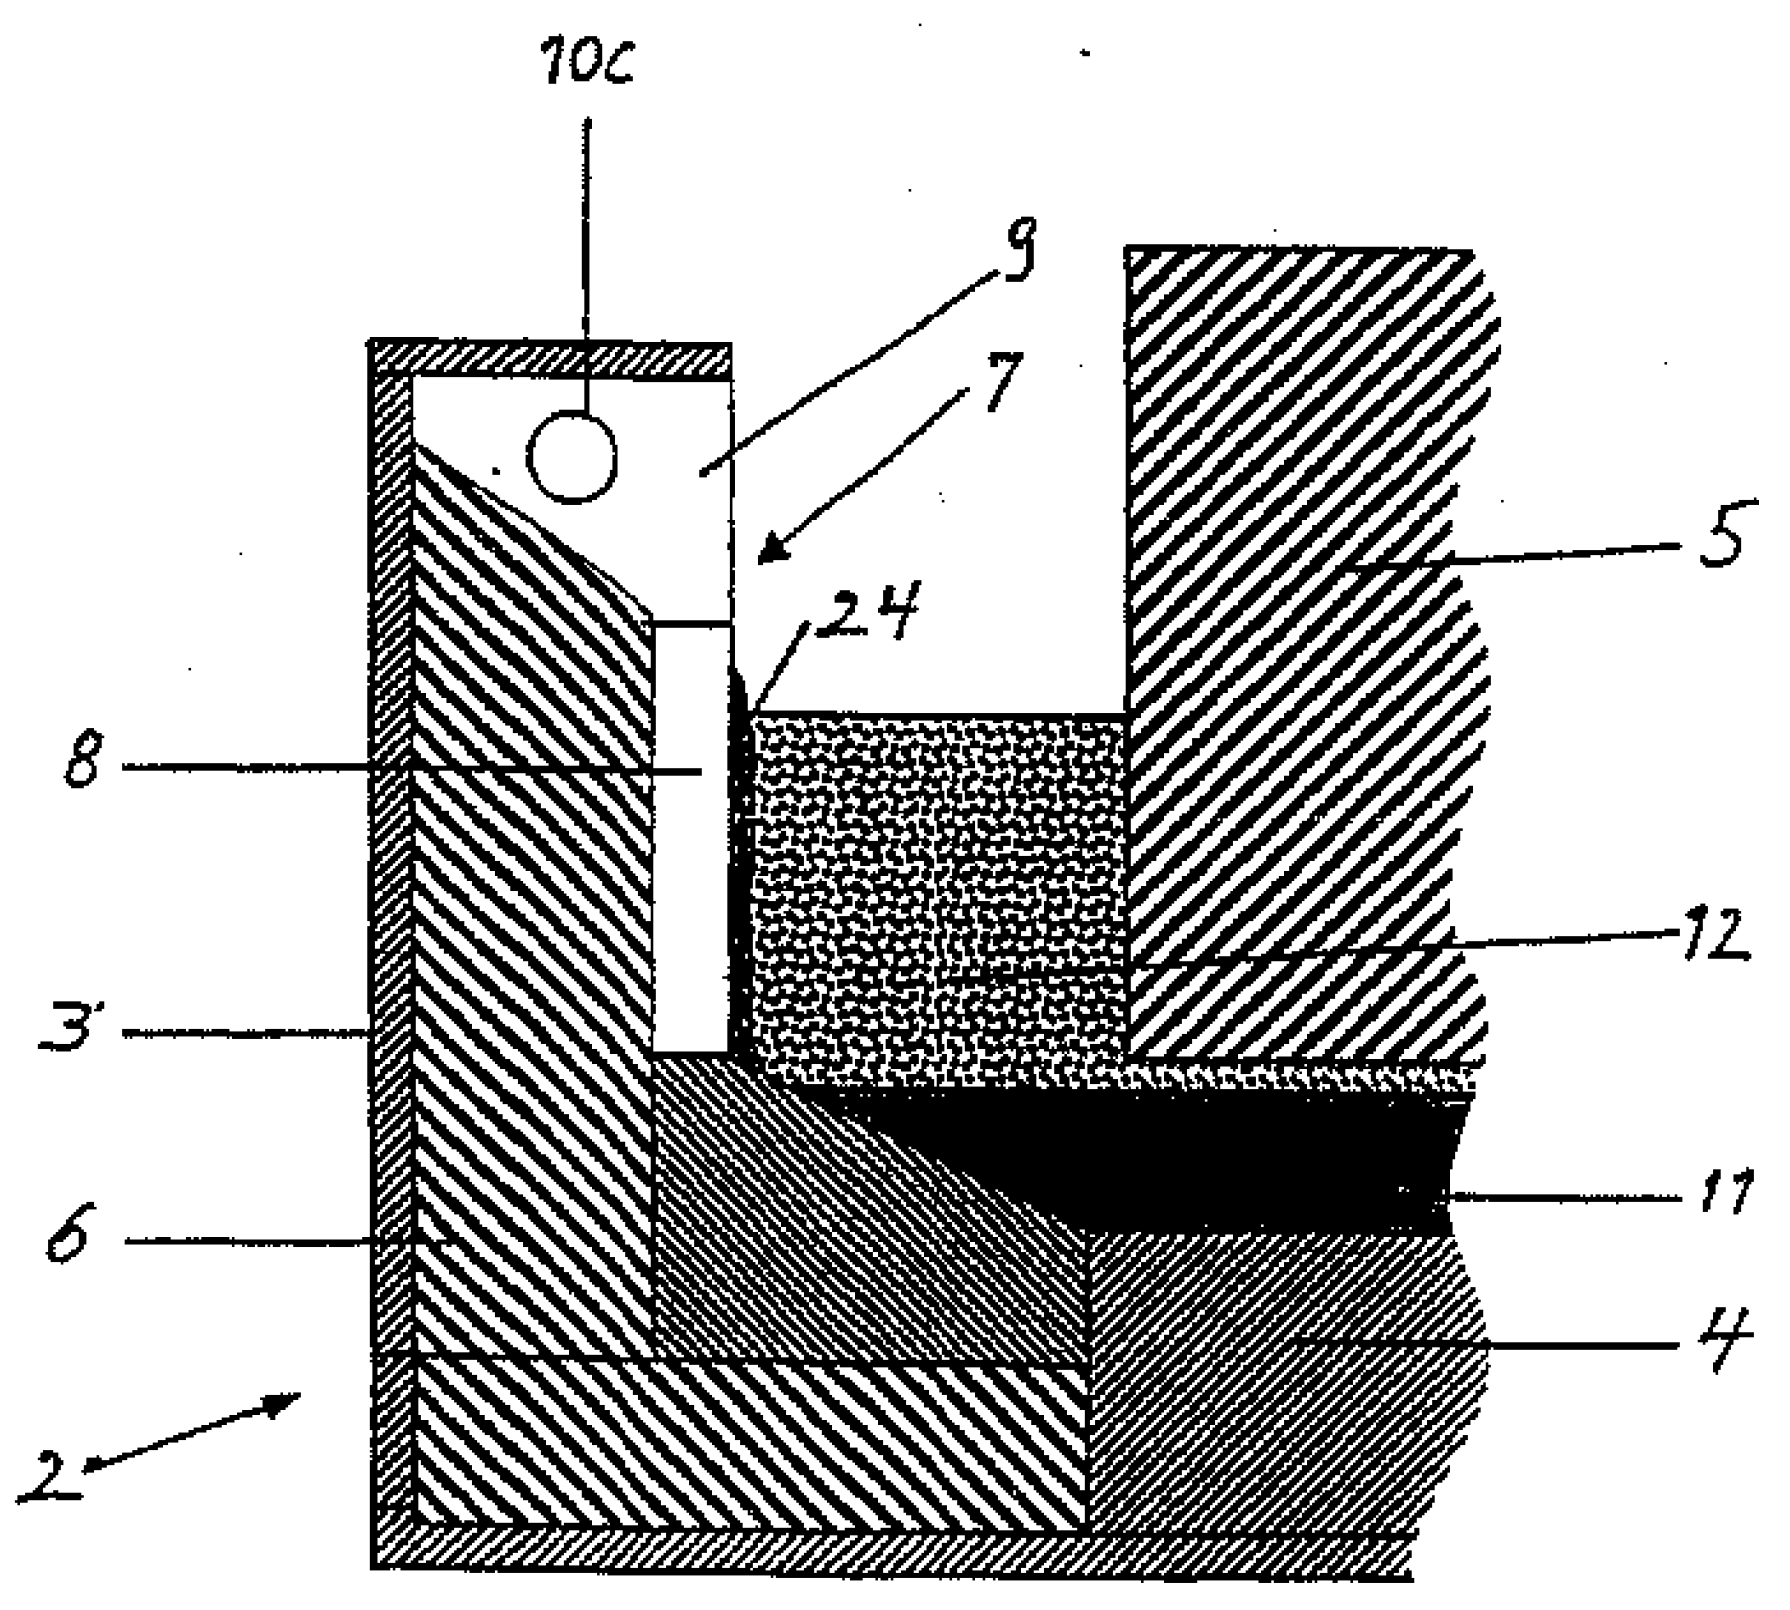
Figure 1 shows a sketch of the cross section of an electrolysis cell equipped with a wall cooling panel [
2] (only a part of the cell is shown). The captions in
Figure 1 are listed in
Table 1. The protective frozen side ledge (24) is formed on the cooling panel. The panel can be exposed to hot spots if the protective frozen side ledge breaks down. In such cases, the hot molten electrolyte (12) can come directly in contact with the cooling panel evaporator (8), through cracks in the frozen side ledge. The cooling panel represents the first stage in a heat recovery system, in which heat is transferred from the cooling panel evaporator (8) via the condenser (9) to a cooling circuit (10C) by evaporation and condensation of a working fluid.
The current paper reports:
A vertical flat heat pipe considered for use as cooling panel;
Experimental results obtained for the built heat pipe, in a laboratory test rig;
A thermal resistance network for the built heat pipe;
Results from an analytical spreadsheet model of the built heat pipe;
A numerical study of the thermal expansion of the heat pipe, using finite-element (FEM) analysis; and
A numerical hot spot analysis, undertaken to determine the most vulnerable position(s) of hot spots on a vertical flat heat pipe wick.
Heat pipes of many forms and for many applications have been proposed and are analyzed in textbooks (for instance, [
3,
4,
5,
6]); a review including recent advances was given recently by Faghri [
7]. In some areas, for instance computer cooling, heat pipe technology is well established; however, due to new areas of application for heat pipes the components, materials, and physical processes of heat pipes are still receiving considerable attention. Reay and Harvey [
8] recently reviewed the role of heat pipes in intensified unit operations, and pointed specifically at chemical reactors as highly relevant application areas. Heat pipe technology is in the current study considered for the cooling panels of the aluminum electrolysis cells.
In traditional “capillary heat pipes” the inner surfaces of the evaporator, the condenser, and the adiabatic section are all covered by a wick material, or have grooves serving as capillary pumps, wetting the surface. The capillary pressure is the driving force for the flow and distribution of the working fluid in the wick/groove, and in many cases the performance of the wick/groove will be the main limiting factor of the heat pipe. Wicks are still being developed and improved in order to best fit the application requirements. For instance, advanced bimodal wicks have been designed by sintering fine wick structures to coarse wick structures [
9]. Another advanced wick has a graded structure which reflects the pressure gradient inside the heat pipe [
10]. Several references on wicks of sintered, groove and mesh type were listed in a recent review by Chan
et al. [
11]. Faghri [
3] divided wicks into two groups; homogeneous and composite, and stated that homogeneous wicks are usually chosen due to simple design, manufacture, and installation (
i.e., lower costs), even though the composite wicks usually have better performance. Wicks can be made of compressed nickel foam, and the development and testing of such wicks were reported in an earlier paper [
12]. This type of wick has the advantage that the wick properties can be selected within a wide range by choosing the degree of compression [
13].
Heat pipe wicks are characterized by their porosity, permeability, thermal conductivity, and effective pore radius with regard to a specific fluid. The wick porosity and permeability are properties of the pore structure only [
14], independent of the fluid applied. The effective pore radius depends on the contact angle between the wick structure and the fluid applied and is, therefore, not fluid independent. The porosity is usually determined according to a standardized procedure [
15]. Various methods exist for the determination of the permeability and the effective pore radius, and in most cases these properties are determined by use of a model fluid and without exposing the wick to a heat flux, for instance as in [
16]. Shirazy and Fréchette [
17] recently questioned the validity of the effective pore radius determined this way for the calculation of the wick heat transfer capacity (the capillary limit). They had experienced that wicks made of copper foam performed much better in heat pipes than predicted from existing correlations for the capillary limit. Their explanation was that the effective pore radius will decrease during evaporation due to meniscus recession, and thereby increase the wick heat transfer capacity (compared to the value calculated from an effective pore radius determined from an experiment in which the wick was not exposed to heat). More studies of this hypothesis and comparative studies between the different methods for the determination of the permeability and the effective pore radius will increase the reliability of wick heat transfer capacity predictions.
With regard to working fluid, attention is here given to the alkali metal potassium, which is a commonly-used working fluid in traditional heat pipes for the temperature range 500–1000 °C [
4,
7]. Alkali metals are very reactive, but excellent working fluids in heat pipes when treated correctly. Potassium has to be handled in a high-quality glove box filled with inert gas (such as Ar), or under vacuum, due to the reactivity with oxygen and water (moisture). Hydrogen gas will be produced in the reaction between potassium and water. Potassium will also tend to remove oxide from the surface of steel [
18]. Chemical compatibility between the envelope material and the working fluid is essential in order to avoid corrosion and/or inert gas generation. Ten years of successful operation was reported for a heat pipe made of stainless steel 718 envelope and 316L wick material, utilizing sodium as a working fluid at 750 °C operating temperature [
19]. In industry, lifetimes of years are usually needed and expected for heat pipes, often with harsh thermal, chemical, and mechanical loads. Compatibility between the heat pipe and its surroundings is, therefore, equally important to the internal compatibility between the envelope, wick, and working fluid. Metals are the dominating envelope and wick materials, but high temperature wickless heat pipes (thermosyphons) of ceramic material are also being developed; results from promising experiments with sodium and zinc as working fluids were reported recently [
20]. Nickel is compatible with potassium [
4], but starts oxidizing rapidly at about 350 °C [
21] and a protective/reducing gas atmosphere of 5 %(v) H
2, 95 %(v) Ar is therefore often used during the heat treatments and preparations of the nickel wicks and heat pipe envelopes. Stainless steel 304 is also reported to be compatible with potassium [
4], and may be a more economical choice than nickel for heat pipes for industrial applications.
Panels/heat pipes in the side lining of the aluminum electrolysis cells should be as slim as possible. Attention must, therefore, be given to the sonic limit for the vapor flow, especially when alkali metal working fluids are applied, due to their low vapor densities [
22]. The entrainment and flooding limits will also be important if the vapor and condensate are in direct contact and flowing in opposite directions in a heat pipe/thermosyphon.
2. Experimental Characterization
An experimental study was carried out to investigate the performance of a flat vertical heat pipe under temperature and heat flux conditions expected in the walls of aluminum electrolysis cells (including hot spot heat fluxes). The hypothesis was that a wick in the evaporator section would be a robust solution for the distribution of working fluid over the evaporator surface under varying temperature and heat flux conditions.
The Heat Pipe
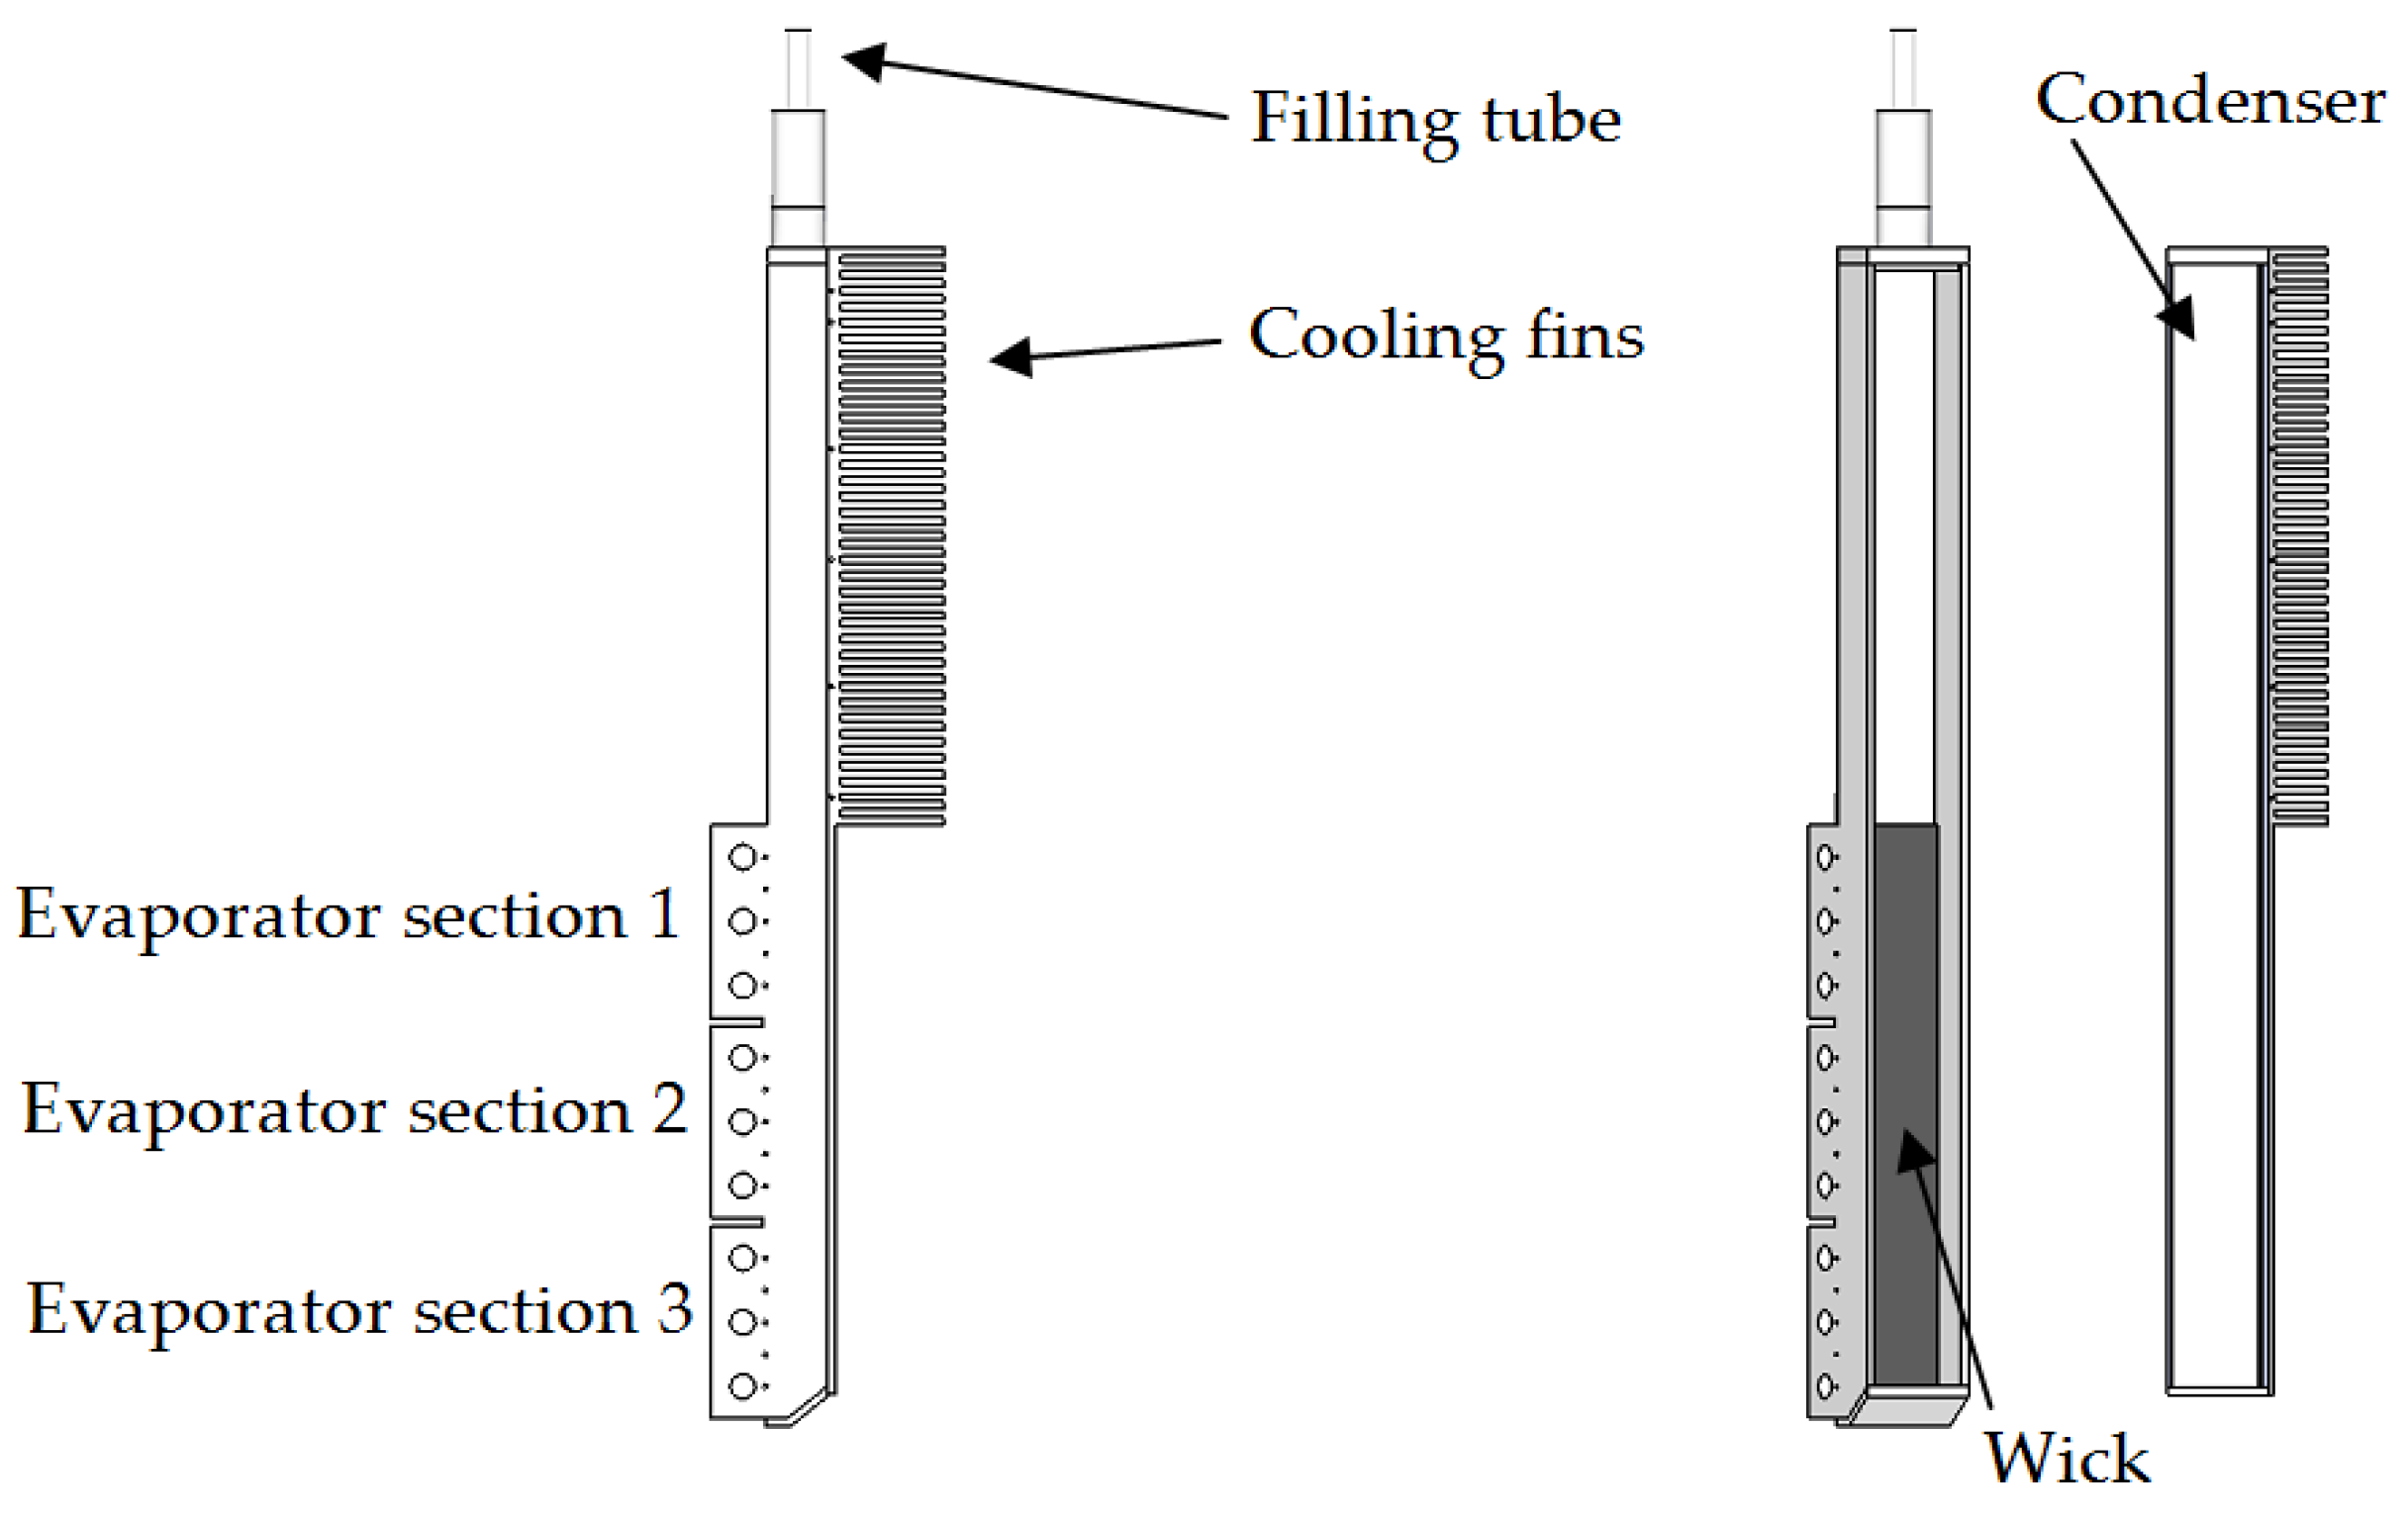
An experimental heat pipe was made specifically for this study. The built experimental heat pipe is shown in
Figure 2, to the left fully assembled, to the right split in two.
For the current experimental study, nickel was selected both for the envelope and the wick, due to its relatively high thermal conductivity and reported compatibility with potassium. The heat pipe was designed “as slim as possible”, according to the requirements for the cooling panel for electrolysis cell walls. However, the dimensions of the flow channel were chosen such that the sonic limit, the entrainment limit, and the flooding limit were unlikely to cause problems. Correlations available in reference [
3,
4] for predicting these limits were used in the design process. The flow channel width was chosen so large that the sidewalls of the heat pipe would likely not cause significant disturbance of the fluid flow.
The experimental heat pipe had no adiabatic section, due to manufacturing limitations. The total height of the evaporator was 150 mm. The inner height of the condenser section was 142 mm. The inner width of the flow channel was 25 mm and the depth 11.55 mm. A wick, 25 mm × 150 mm × 1.15 mm, consisting of four layers of compressed and sintered nickel foam was attached to the evaporator surface by use of electron beam spot welding. The evaporator was divided in three sections where each had three cartridge heaters. The motivation for having multiple sections was to be able to impose a non-uniform heat flux distributions over the evaporator surface. The cartridge heaters were mounted into the heat pipe having force fit tolerances, hence no thermal paste was necessary. The supplied power to each evaporator section was controlled by phase angle firing thyristors. Each cartridge heater was rated 225 W at 240 V, and had a maximum work temperature of 760 °C. For an ideal case without heat losses the nine cartridge heaters could, from their specifications, provide a maximum uniform heat flux of 540 kW/m2. The temperatures in the evaporator wall were measured by 3 × 5 type N thermocouples, Ø1 mm, installed in pockets in each section of the evaporator wall. Similar thermocouples were also installed in pockets in the condenser wall and on the outside of the heat pipe adiabatic walls (the walls opposite of the evaporator, respective condenser surfaces). LabView® together with modules NI 9214, NI 9219, NI 9225, and NI 9227 from National Instruments® were used for data recording and parameter control. The uncertainty of the measurement of the power supplied to the cartridge heaters was less than 1%. The thermocouples attached to the logging system were calibrated by use of a JOFRA RTC-700 calibrator (accuracy ± 0.11 K). The amount of potassium filled into the heat pipe was 10.2 g, which was estimated to be sufficient for full wetting of the wick, with a good safety margin, for all planned experimental operating conditions.
The outside of the condenser section was equipped with fins and was cooled by nitrogen gas. The heat taken up by the nitrogen gas was calculated from the measured nitrogen flow rate and the temperature increase of the nitrogen over the condenser (). The inlet temperature of the nitrogen was kept at 50 °C. The nitrogen flow rate was determined from the volume flow rate measured by use of a Sierra 620S insertion flow meter in the cooling circuit. The range of the Sierra flow meter was 0–23.45 Nm3/h and the uncertainty ± 0.28% = 0.066 Nm3/h, where N in this particular case was defined as 15 °C and 1 atm. The heat loss to the surroundings was the difference between the heat supplied to the heat pipe by the cartridge heaters and the heat taken up by the nitrogen gas. For safety reasons, the heat pipe was in a container filled with nitrogen gas during the experiments.
4. Results and Discussion
4.1. Thermal Resistance Model
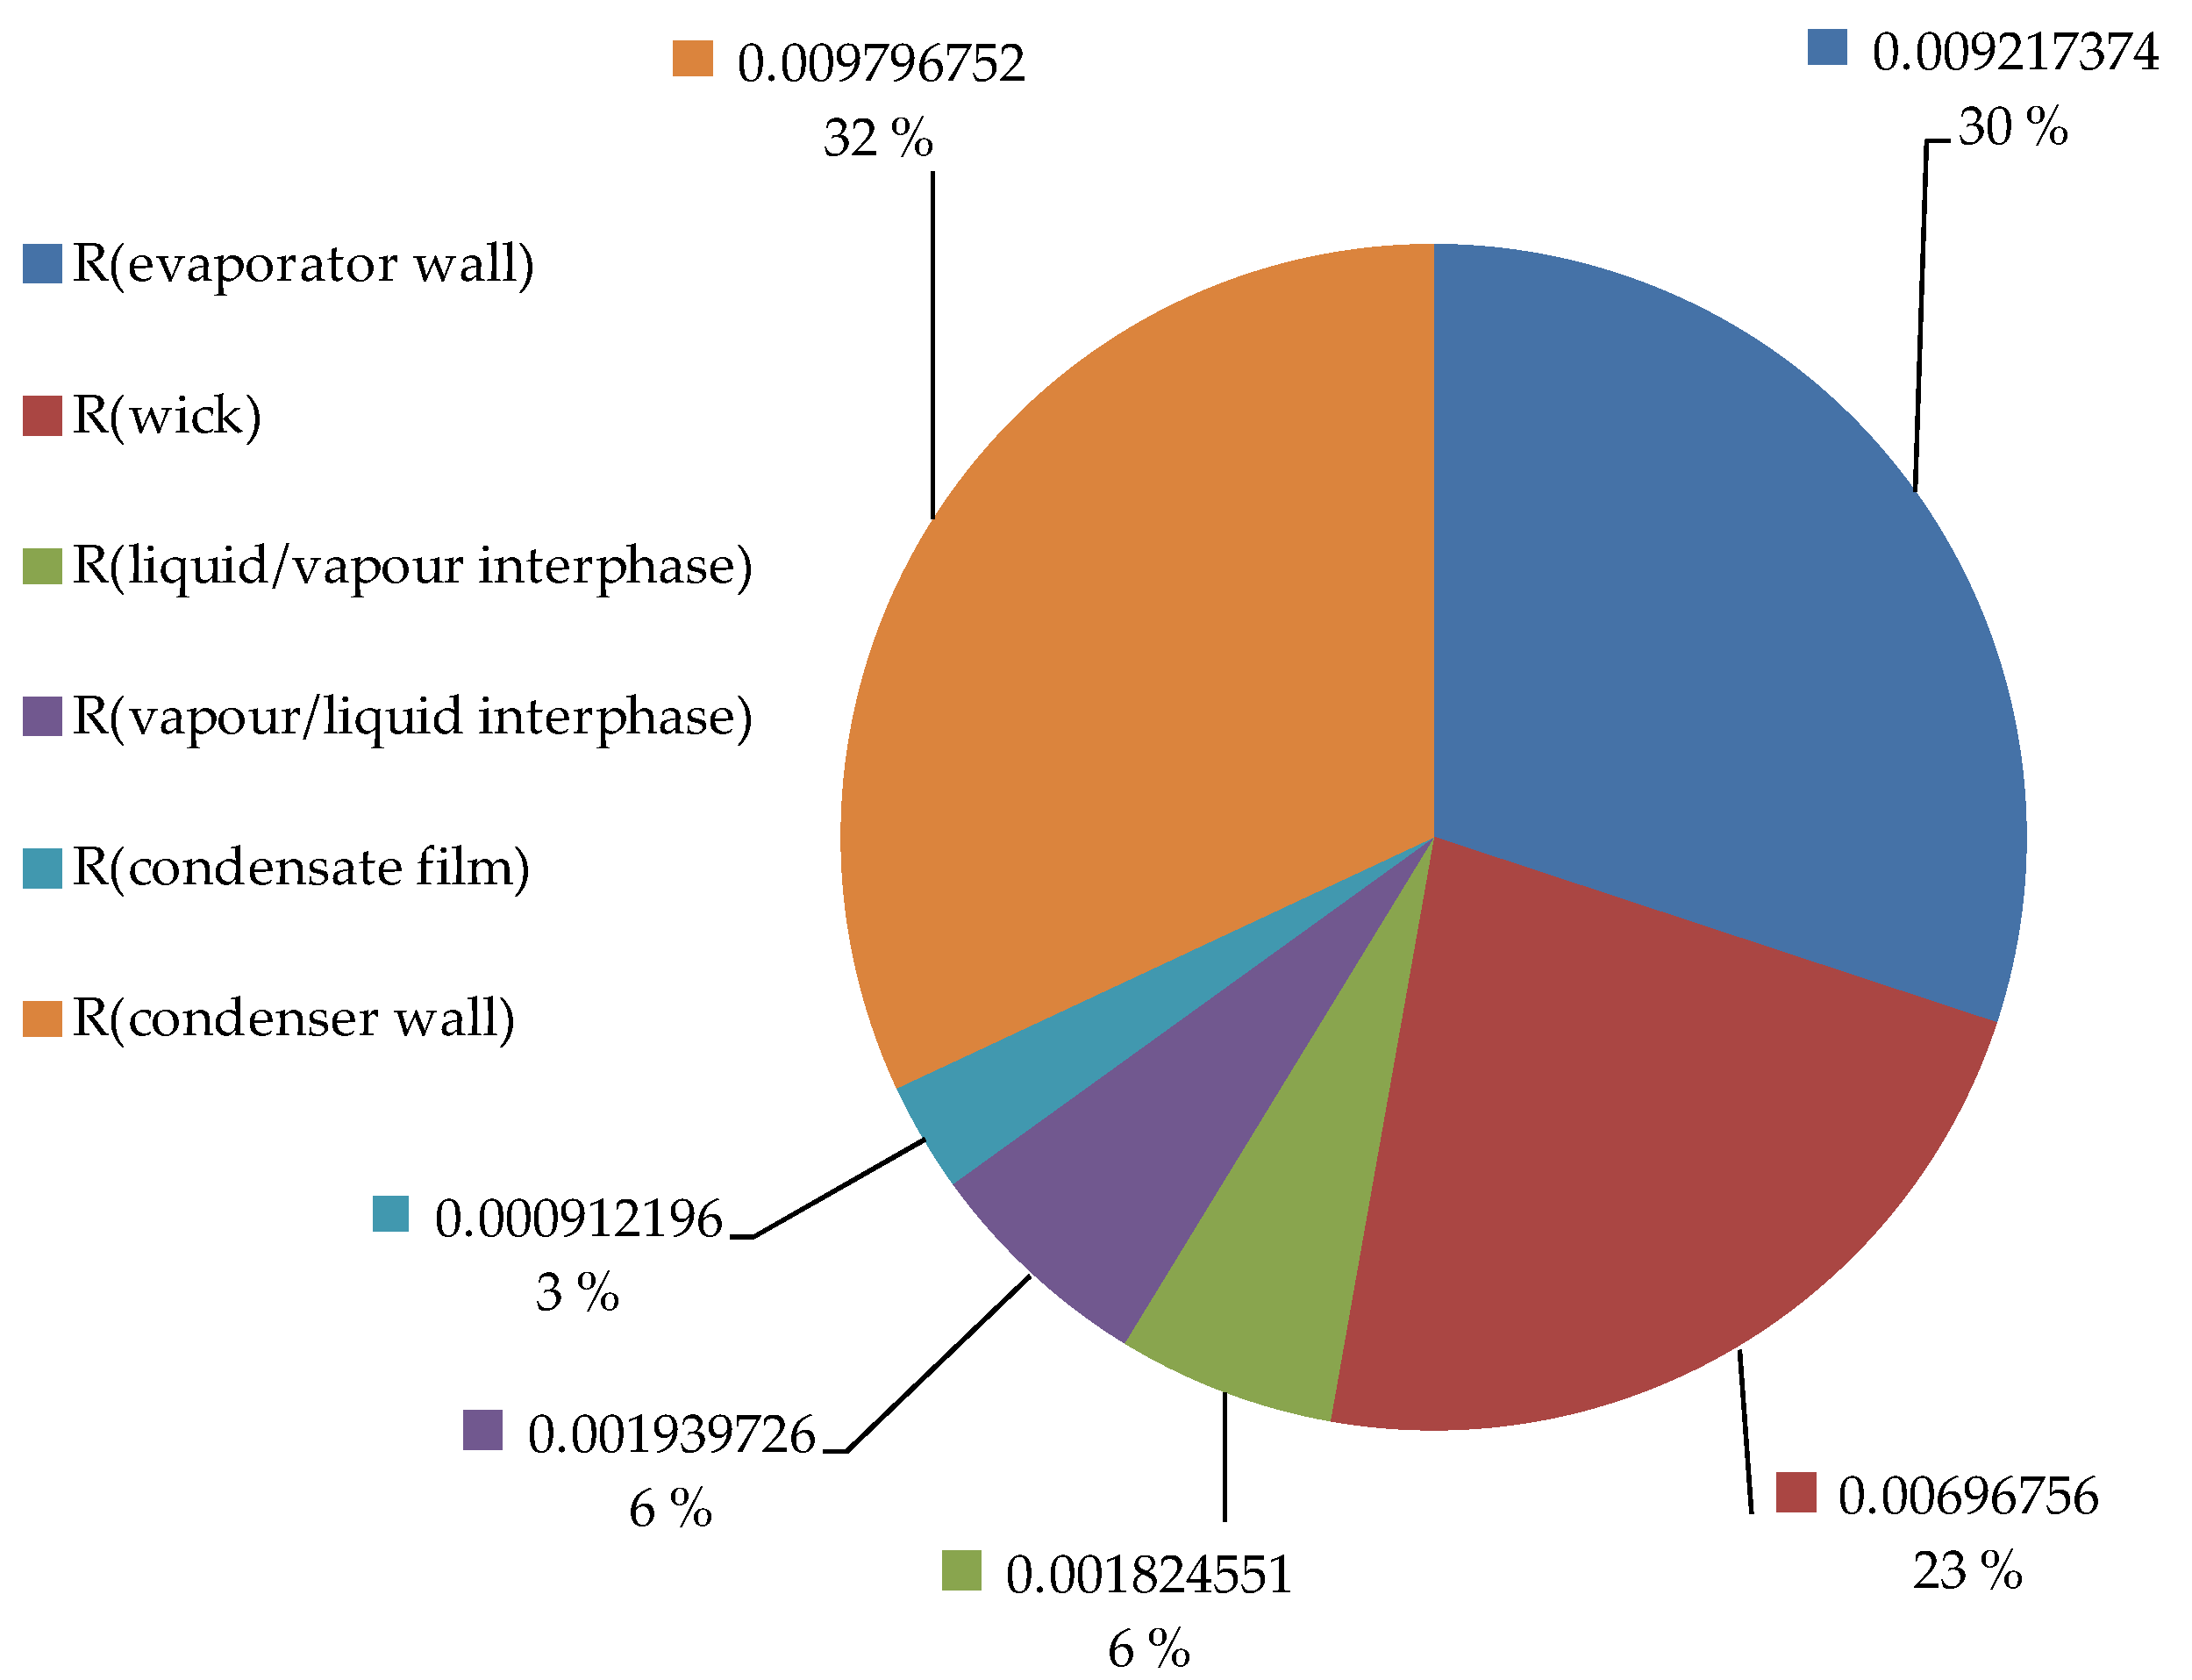
Using the developed model, the magnitudes of the heat pipe related thermal resistances were calculated and are compared in
Figure 4 for an operating temperature of about 500 °C. The thermal resistance on the coolant side has been omitted in
Figure 4 as this resistance depends on the cooling fluid (in this case N
2-gas) and is not related to the heat pipe characteristics (for the experimental heat pipe setup, the coolant-side resistance represented 85% of the total resistance due to the poor heat transfer characteristics of the nitrogen gas).
Figure 4 shows the relative magnitudes of the resistances associated with the heat pipe, for 2 mm envelope wall thickness overall. The thermal resistances associated with the conduction through the evaporator and condenser walls were the largest, followed by the thermal resistance of the wick, the interfacial resistances, and finally the thermal resistance of the condensate film. The interfacial thermal resistance at the vapor/liquid interface was about twice the thermal resistance of the condensate film, which emphasizes that interfacial thermal resistances can be important in studies of metal vapor condensation [
25]. The magnitude and relative importance of the interphase thermal resistances increase with decreasing temperature; however, at an operating temperature of 500 °C the thermal resistances associated with the condensation of the potassium constitute only a small part of the total thermal resistance. The total thermal resistance between the evaporator and condenser external surfaces is 0.031 K/W, representing an effective axial thermal conductivity of the heat pipe of 10,560 W/(m·K) for an effective length of 14.6 cm and an outer axial cross-sectional area of 451 × 10
−6 m
2. For comparison, this represents a thermal conductivity of 26.4 times the thermal conductivity of copper (400 W/(m·K) [
24]).
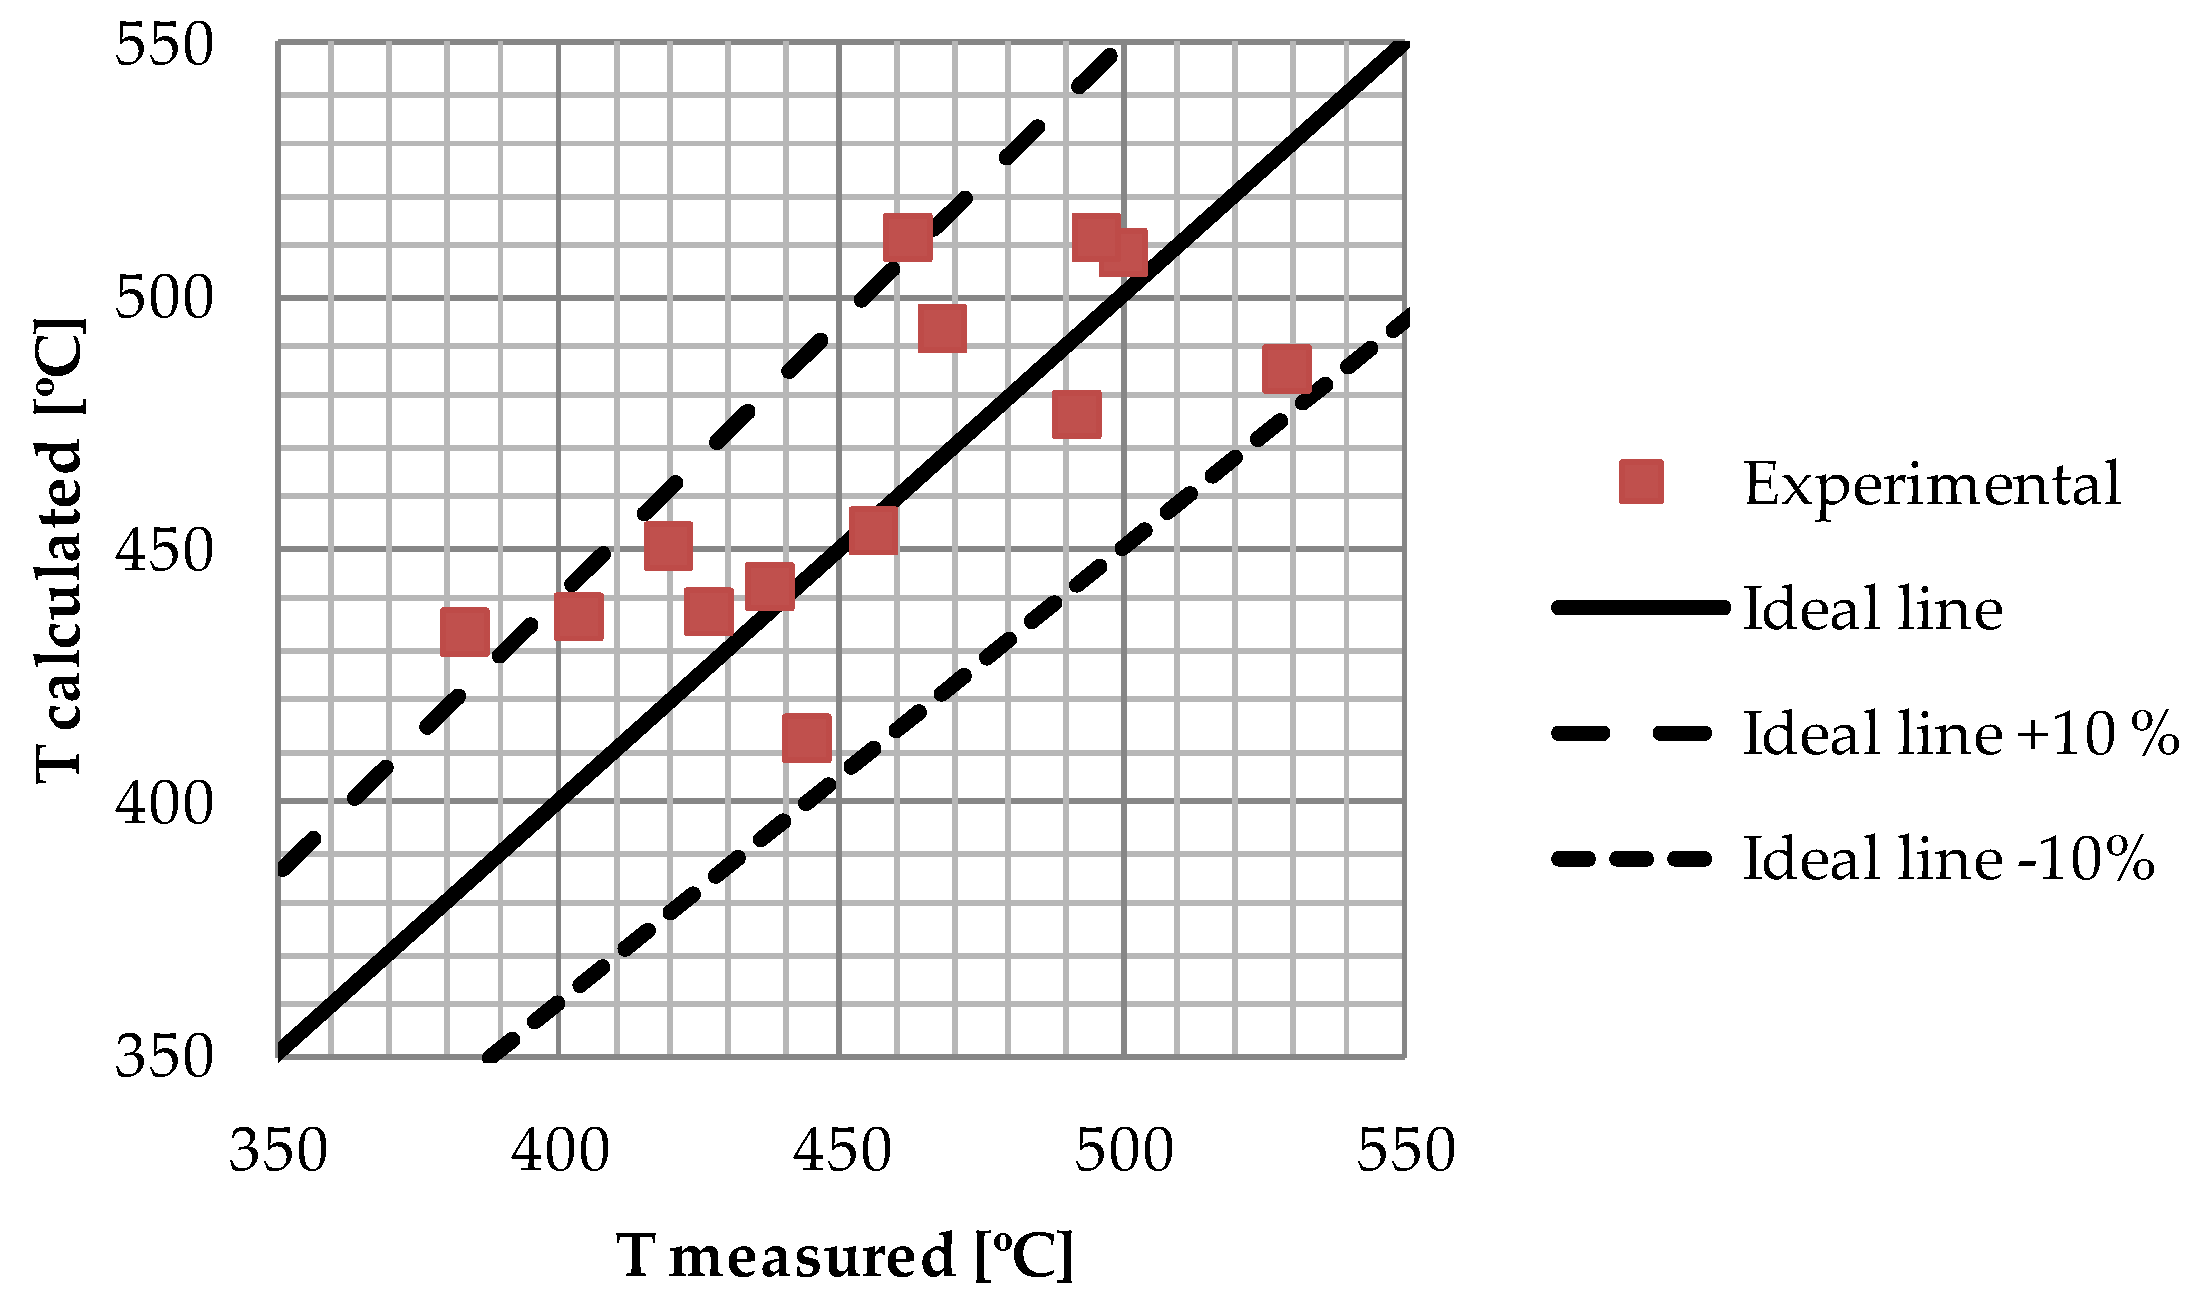
In
Figure 5 the heat pipe operating temperatures calculated by use of the spreadsheet model are compared to measured operating temperatures.
For the limited set of data comparisons the simplified thermal resistance model seems to reproduce the experiments to within ±10%. The points in
Figure 5 were obtained at a wide range of experimental conditions; heat fluxes were in the range from 38 kW/m
2 to 360 kW/m
2 and N
2 flow rates between 2.3 Nm
3/h and 17.2 Nm
3/h. The main reason for the prediction deviation is related to transient heat losses to the insulation and safety chamber not fully accounted for in the spreadsheet model.
4.2. Performance Limitations of the Wick, Analytical, and Experimental Results
The capillary pressure in a heat pipe wick can never be higher than the vapor pressure of the working fluid. This will limit the performance of the heat pipe wick, as it is the capillary pressure (or the vapor static pressure) that will be the “driving force” in Equation (5).
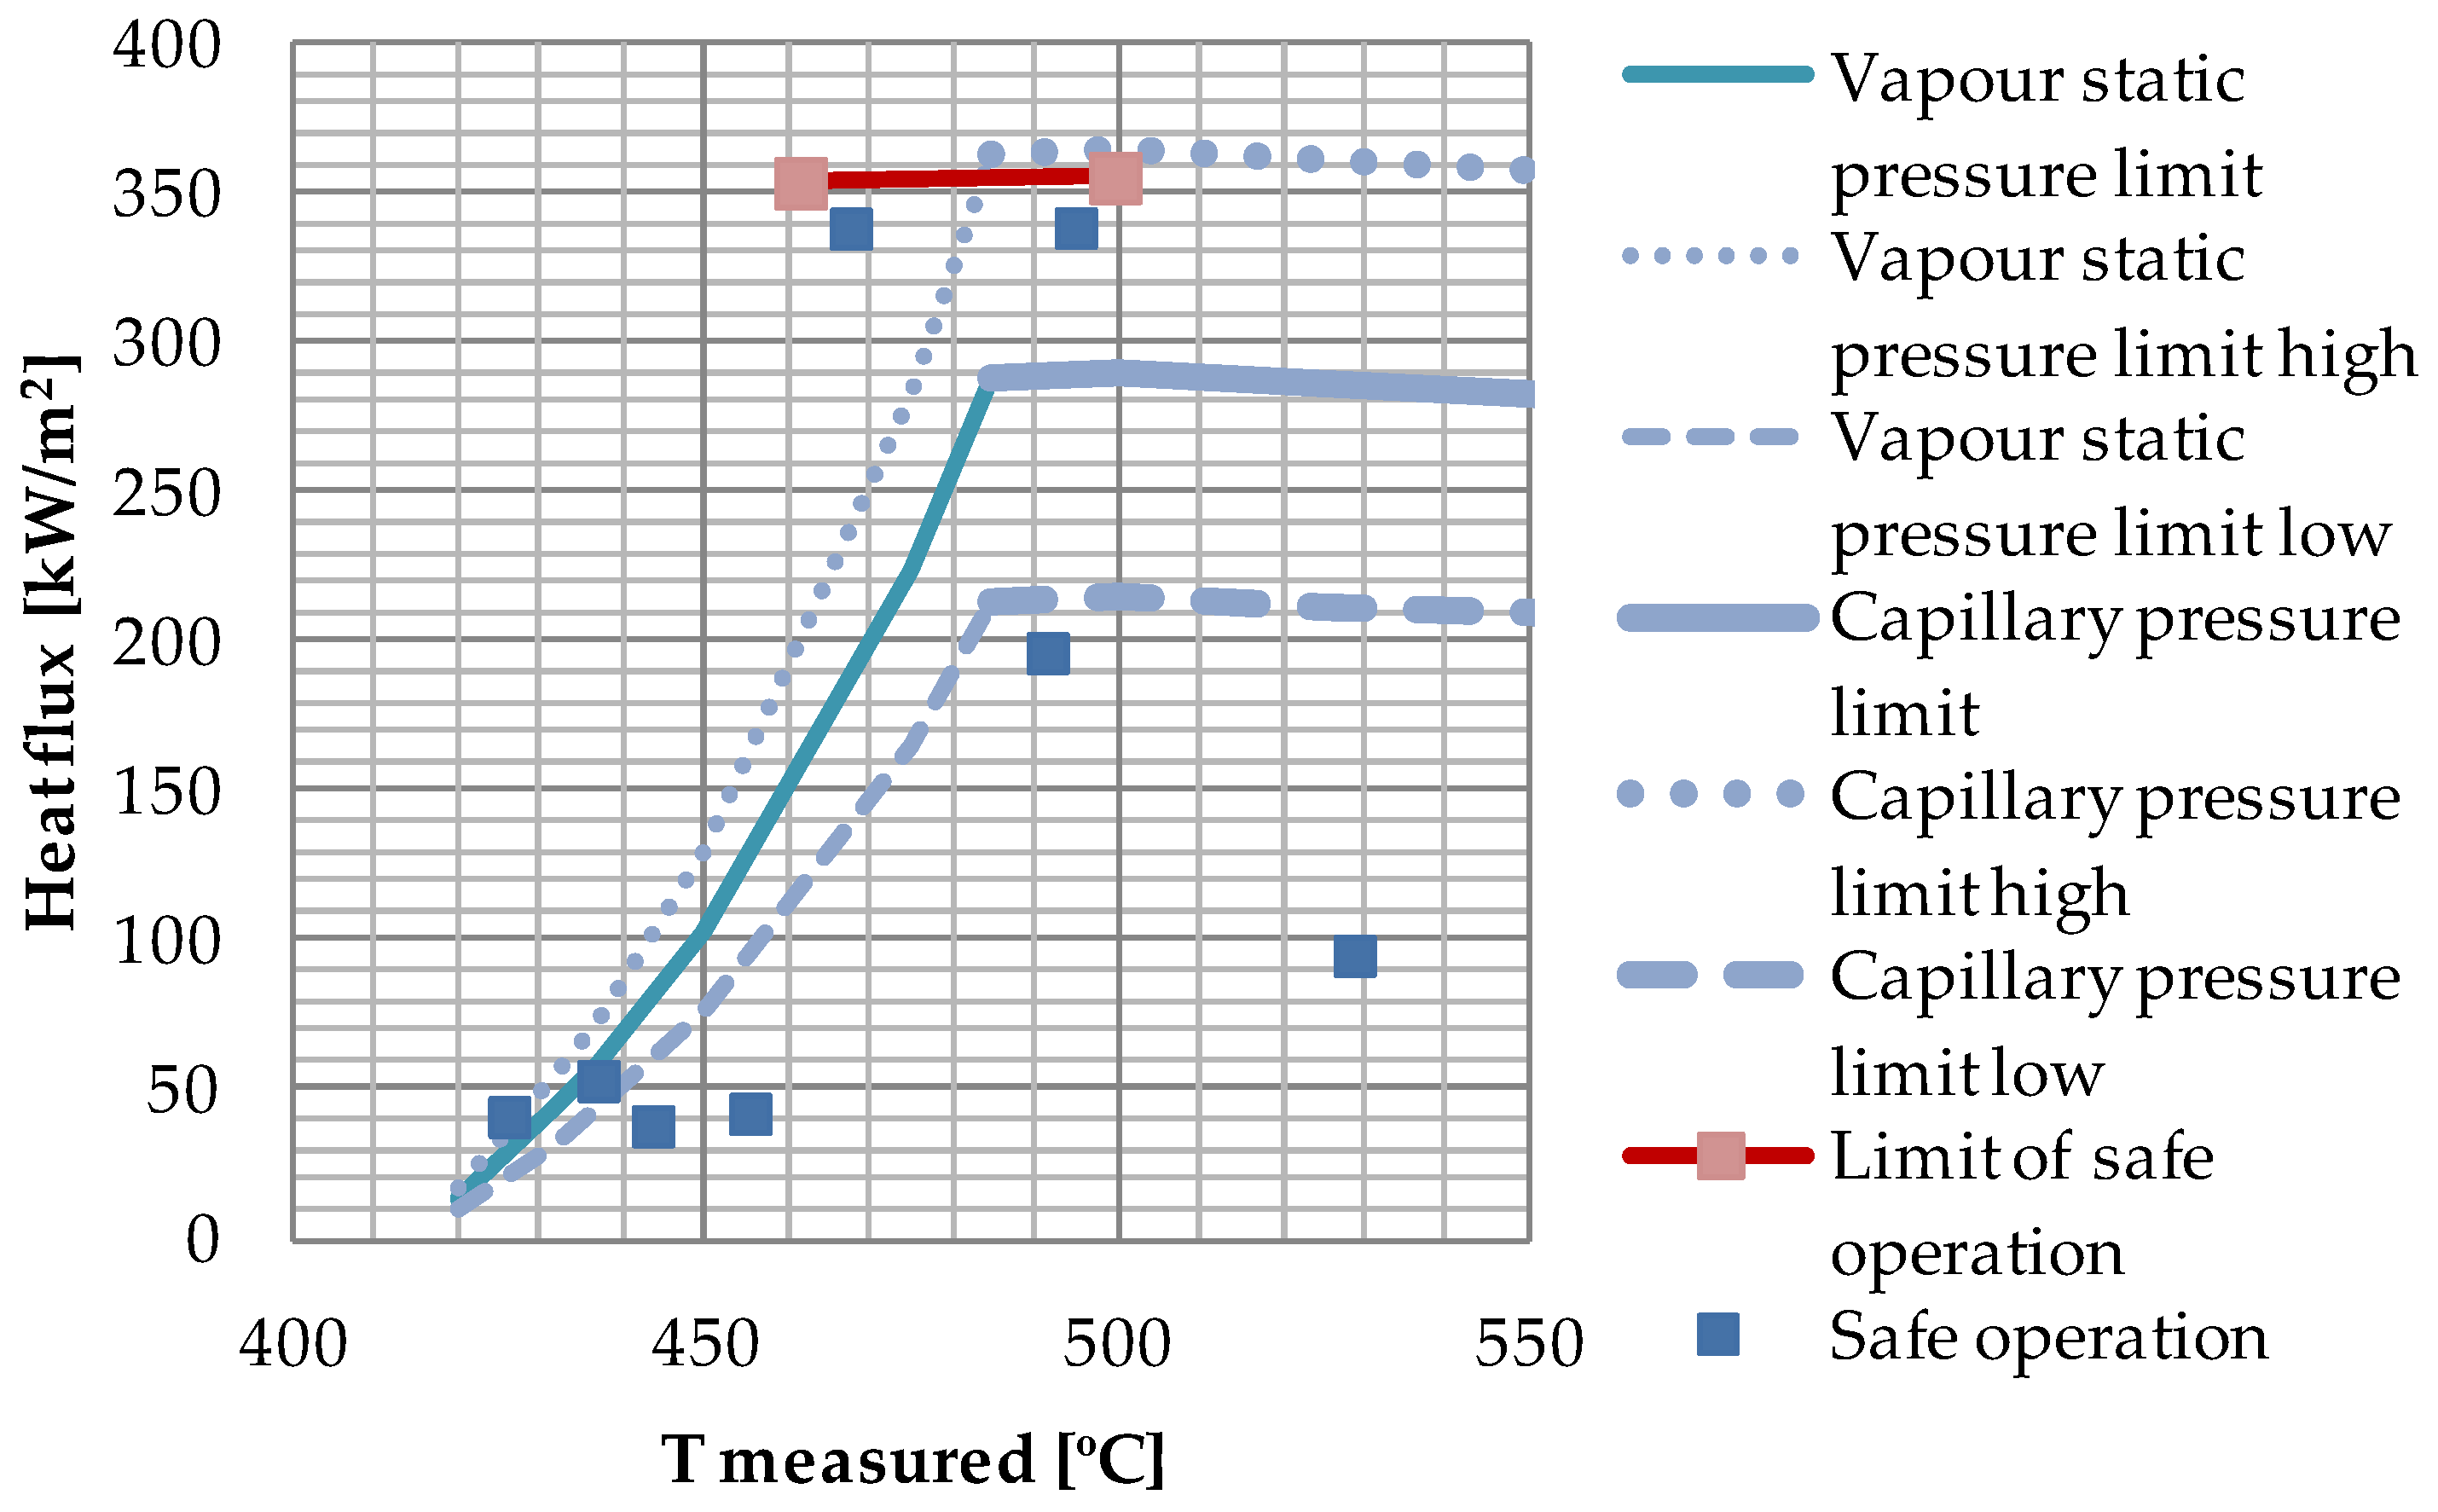
The active height of the heat pipe wick was 11.2 cm, and the wick capacity limitations are shown in
Figure 6.
For a uniform heat flux the dryout at the exceedance of the wick maximum capacity would be expected to occur at the top of the wick,
i.e., an accompanying temperature peak would be registered at the top of evaporator
Section 1 in
Figure 2. For the experiments reported in
Figure 6 the heat flux was increased in small steps, and the temperatures in the evaporator were monitored graphically on the computer screen. For heat fluxes above the reported measured limits the rapid increase in temperature did not occur at the top of the wick, but at the top of evaporator
Section 2. This could indicate that the evaporator surface dryout and the accompanying temperature peak were caused by a local contact problem between the wick and the evaporator surface at the top of evaporator
Section 2, rather than by the exceedance of the “pumping” capacity of the wick. In such case, the maximum capacity of the wick could be even higher than shown by the experimental points in
Figure 6. The most likely scenario is that such a contact problem was caused by thermal expansions, which are largest at the maximum heat flux. In the following discussion it is assumed that the measured maximum reported in
Figure 6 represents the maximum capacity of the 11.2 cm wick, even though the dryout did not occur at the top.
From
Figure 6 it is observed that the heat pipe was able to operate above the vapor static pressure limitation calculated for the whole effective wick height (11.2 cm), while in the capillary pressure limited range the performance overlapped the calculated limit when the experimental uncertainty was taken into account. The large uncertainty indicated in
Figure 6 by the high and low vapor static pressure limit curves and the high and low capillary pressure limit curves is a result of the uncertainty of the permeability of the compressed wick, which was calculated to ±26% [
12]. In general, from Equation (5), the heat transfer capacity will increase by decreased effective pore radius and/or increased permeability. Increased effective pore radius due to a heat flux, as described by Shirazy and Fréchette [
17], will only have effect in the capillary pressure limited region. The experimental point above the vapor static pressure limit line can, therefore, only be explained if the real permeability of the wick was higher than the value (73 × 10
−12 m
2) used in the calculation of the corresponding limit. However, the calculated limits are extremely sensitive to the permeability. Estimates have shown that a small channel in the wick, or between the heated wall and the wick, in the order of 34 μm, will increase the permeability sufficiently to explain the deviation between experiments and predictions. It is not unlikely that such a channel can have been created between the compressed foam layers of the wick due to the mechanical handling of the heat pipe, or due to thermal expansion, as discussed in the following.
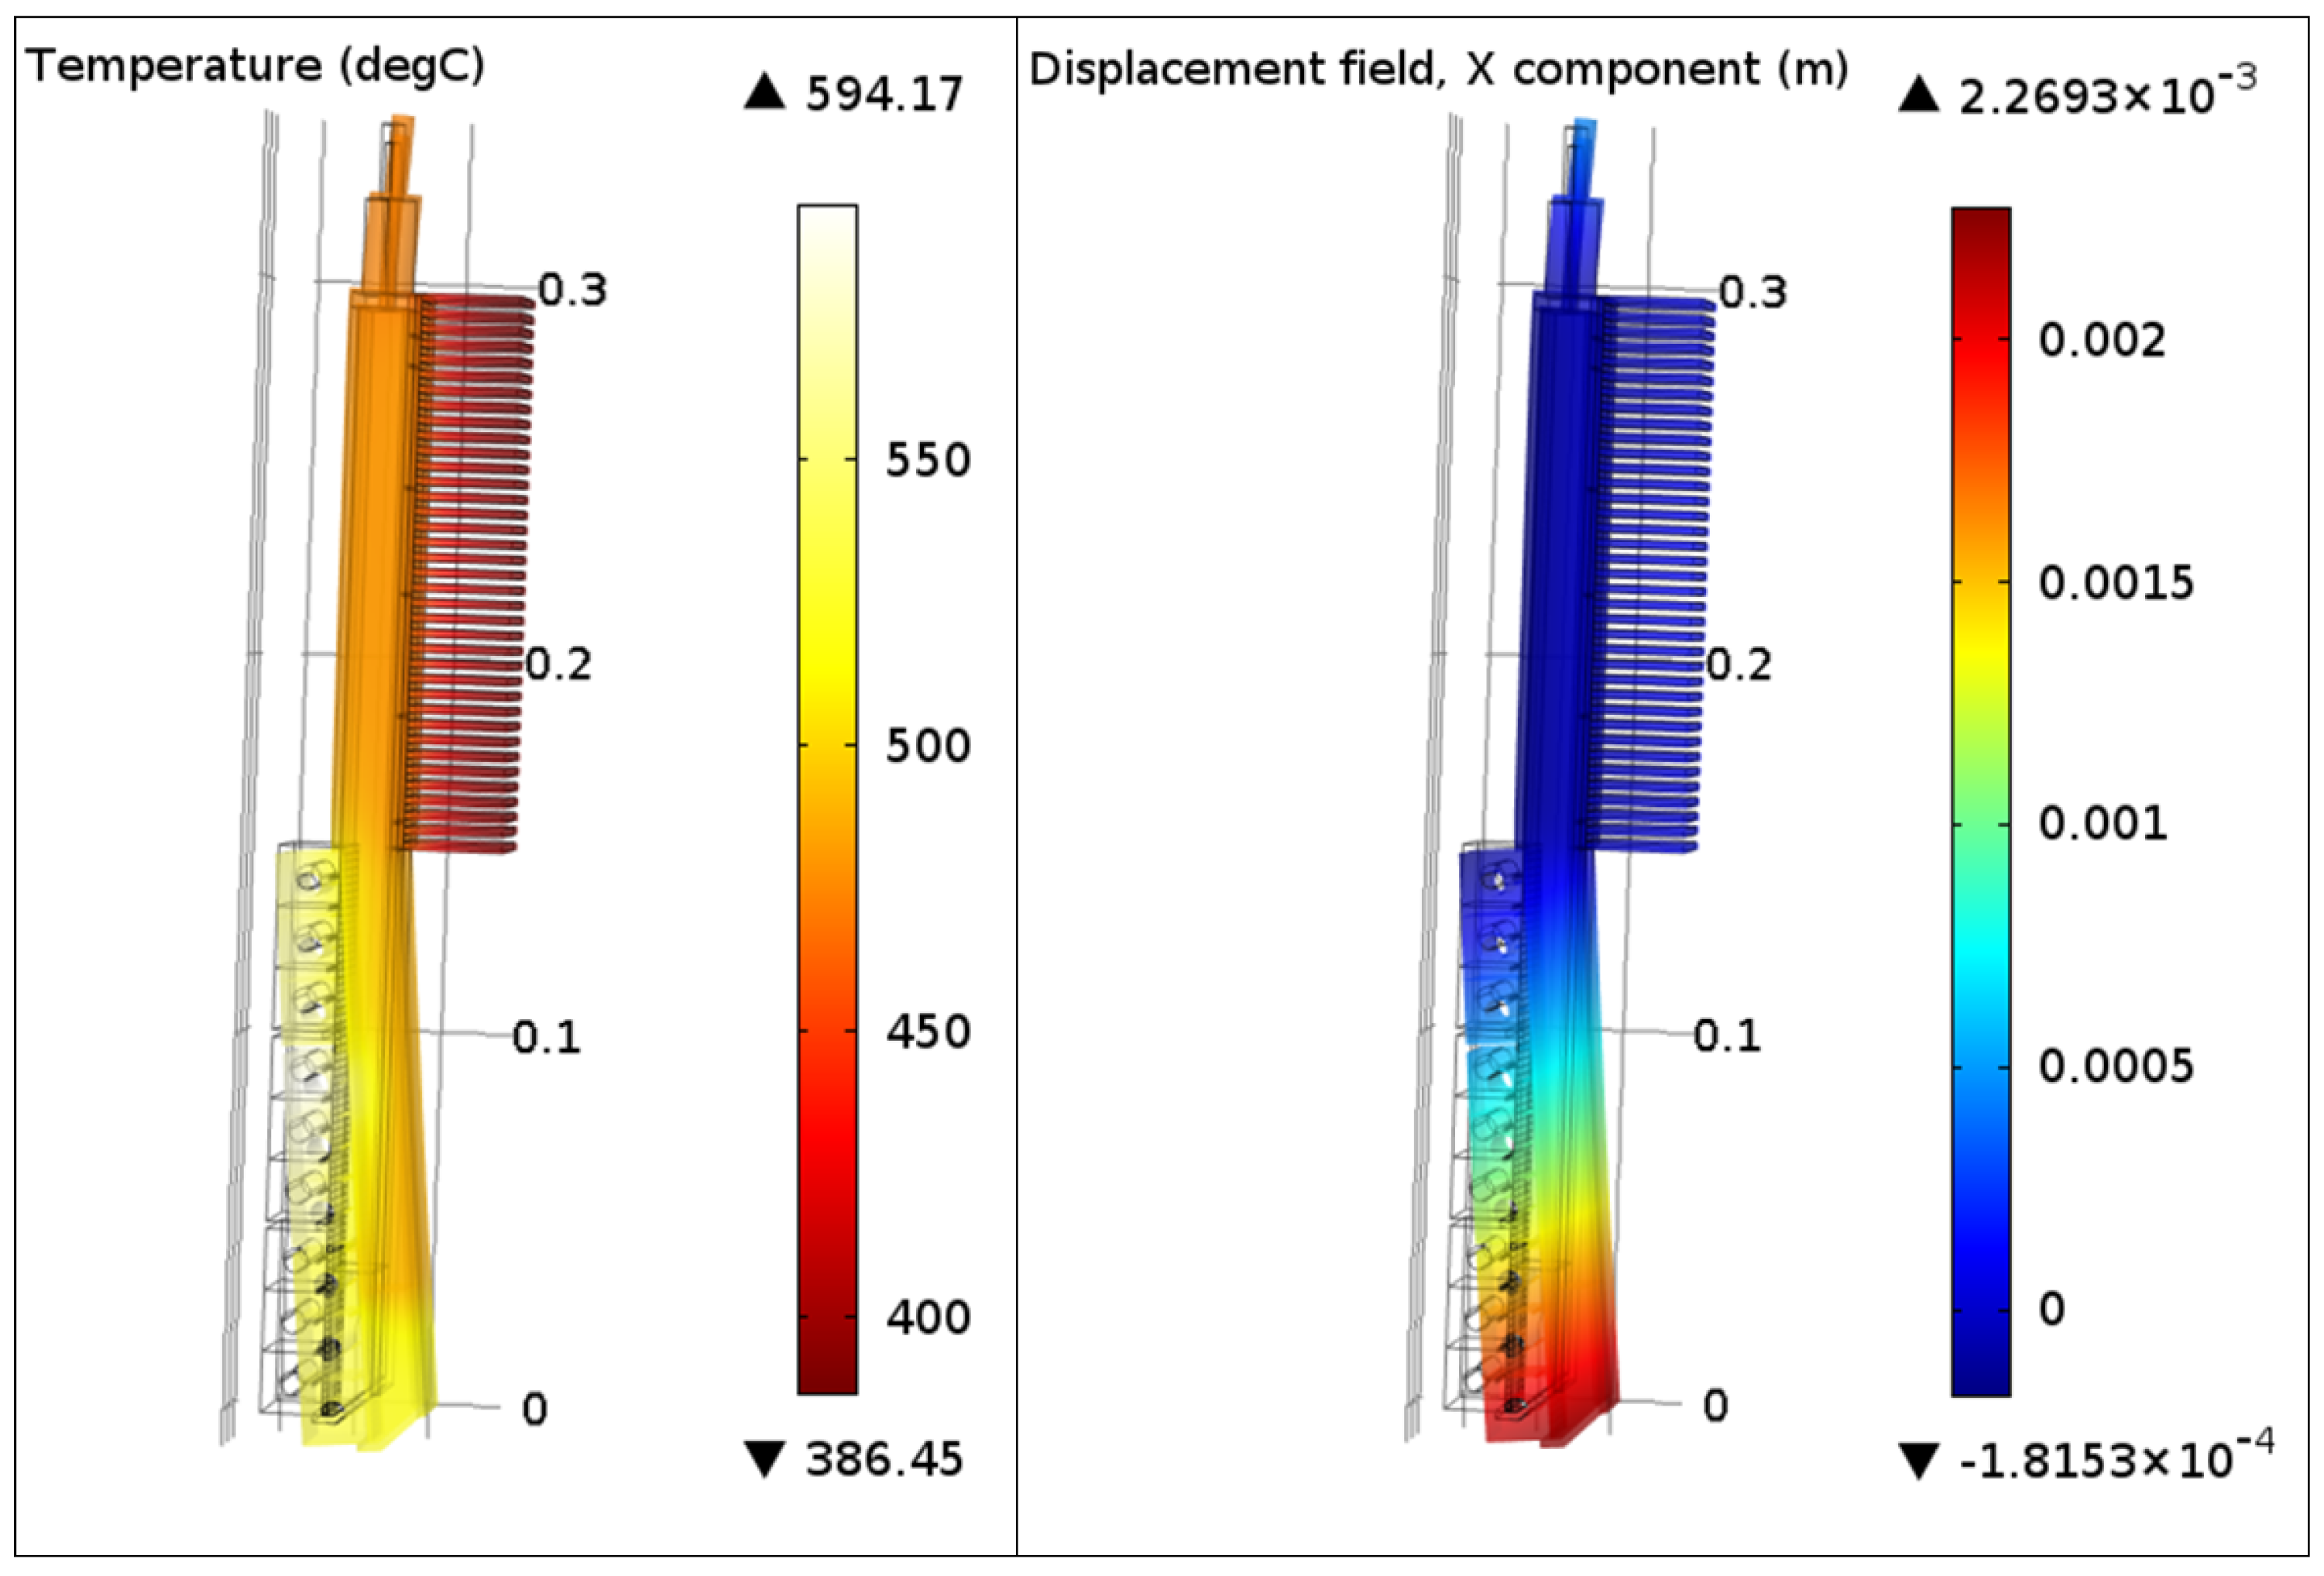
4.3. Thermal Expansion
A heat transfer panel/heat pipe located in the side lining of an aluminum electrolysis cell will be exposed to unilateral heat fluxes. The temperature gradients caused by the unilateral heat flux will cause some thermal deformation for any real structure of finite thermal conductivity, such as the heat pipe envelope. The thermal deformation of the heat pipe was analyzed by use of Comsol Multiphysics
®.
Figure 7 shows the results from one of the most extreme cases, where about 480 kW/m
2 were applied to each of the upper two evaporator sections and about 160 kW/m
2 was applied to the lower evaporator section.
The heat pipe was fixed at the fin base. The results shown in
Figure 7 indicate that the heat pipe bends more than 2 millimeters due to the unilateral heat flux, despite the relatively high thermal conductivity of the envelope material (Ni201). Under the current conditions the temperature at the cartridge heaters was about 90 K above the operating temperature of the heat pipe. Awareness about thermal deformation is important in future design processes in order to implement solutions which can prevent potential thermal contact problems on the outside of the heat pipe, as well as between the wick and the evaporator surface.
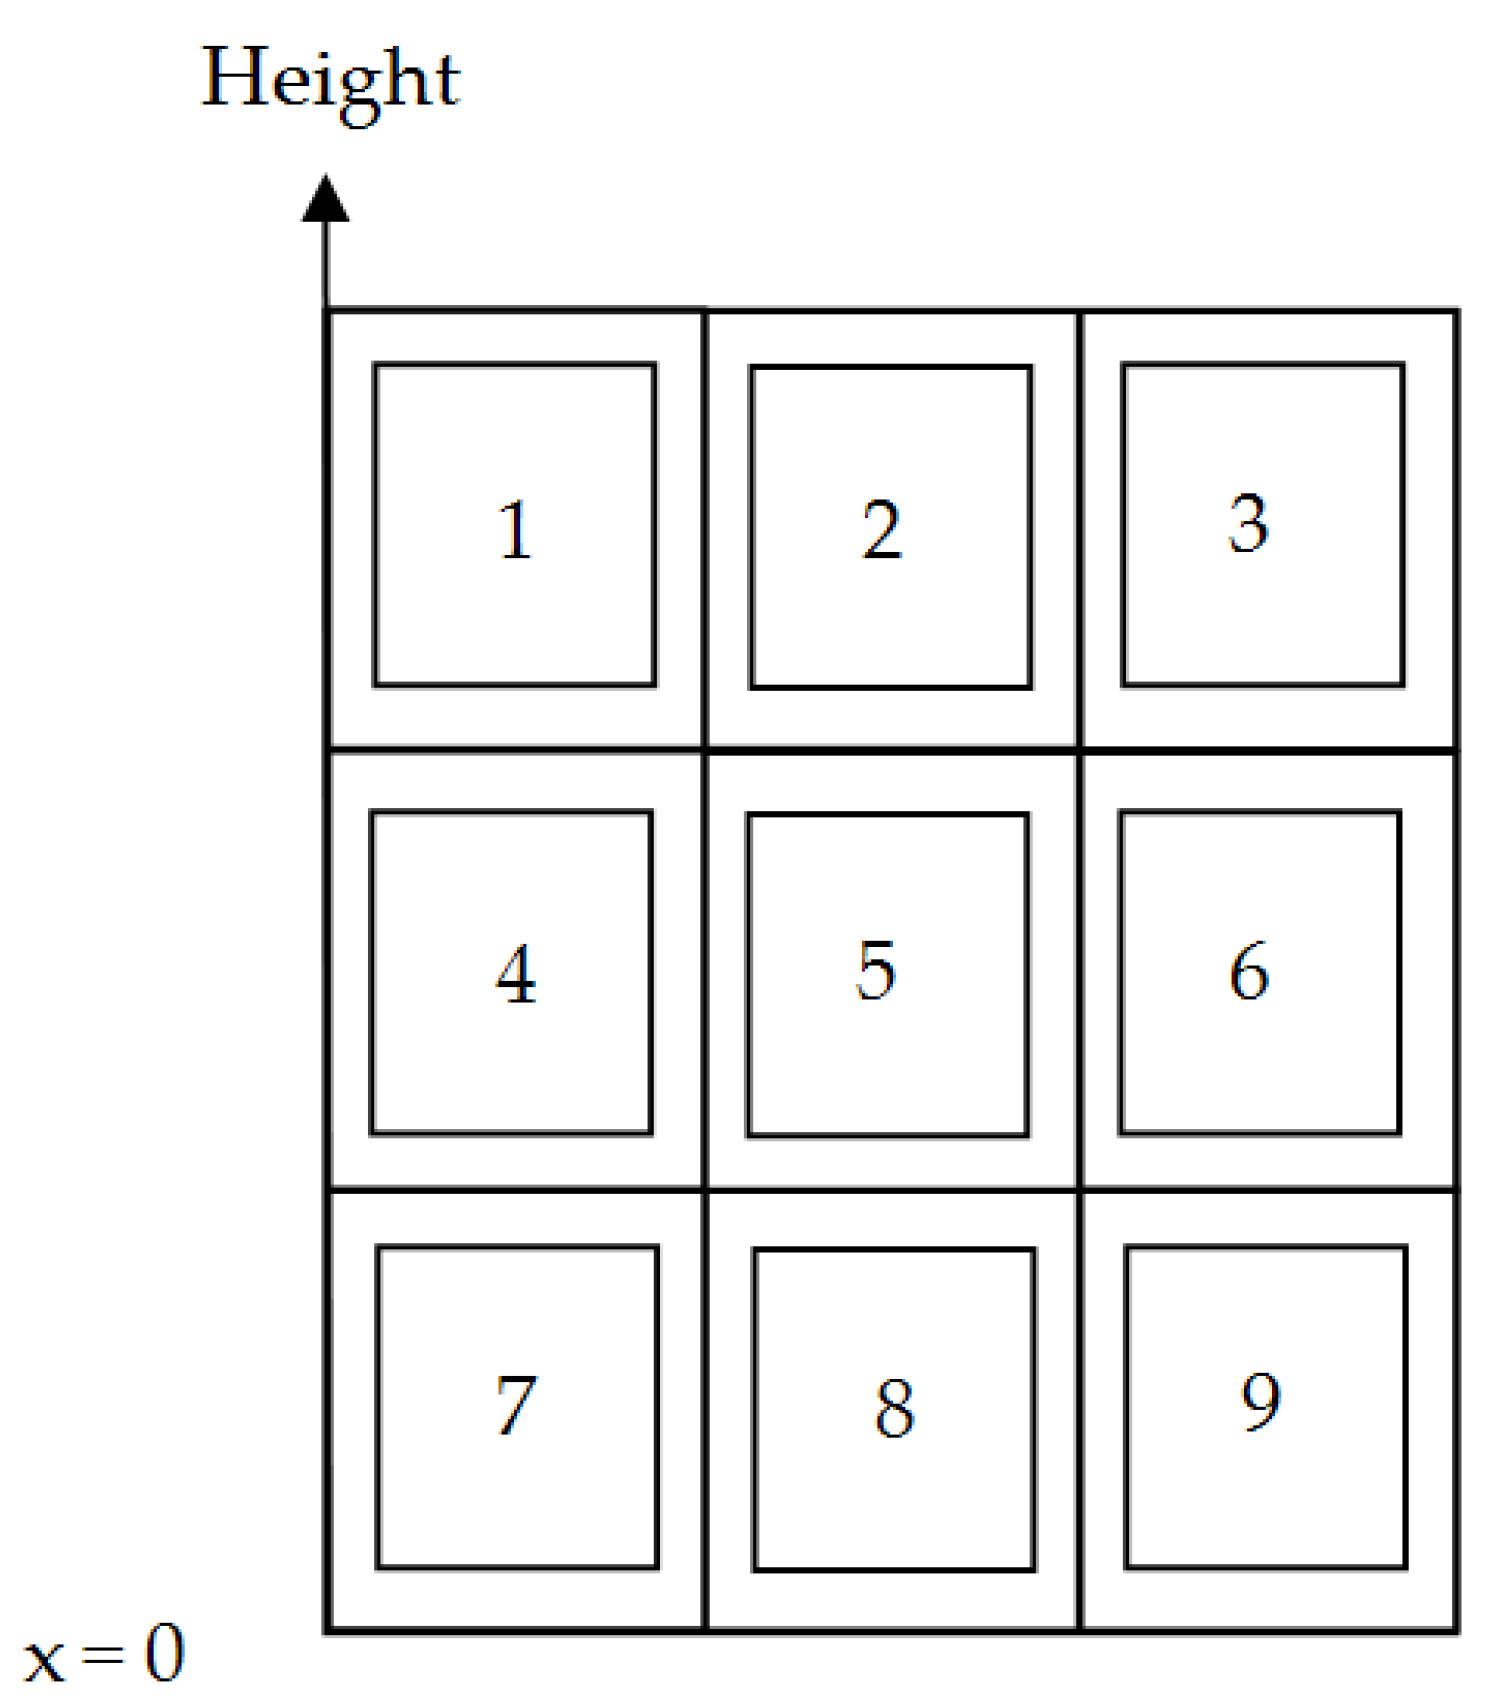
4.4. Numerical 2D Hot Spot Analysis
In this section the results of the numerical study of hot spots on vertical flat wicks are reported. Different scenarios were considered, exemplified here by analysis of the consequences of hot spots in the different positions, 1 to 9, of the wick in
Figure 8. The maximum uniform heat flux for the whole wick is used as reference in the discussion. Dryout will occur at the top of the wick if the maximum uniform heat flux is exceeded.
The experimental heat pipe wick (0.025 m wide) represented just a slice of a larger wick for a cooling panel. The width of the wick in the numerical study was set to 0.112 m, giving a quadratic wick for this analysis. The size of the hot spot was 0.0112 m × 0.0112 m, i.e., it occupied 1% of the wick area. The wick properties and thickness were the same as for the experimental wick.
In
Figure 9 the pressure field obtained from of one of the numerical calculations is shown. A hot spot of 15 times the normal heat flux has been imposed in position 2,
Figure 8, where the normal heat flux is defined as the maximum uniform heat flux outside of the hot spot. The temperature for this case was 773 K, the working fluid potassium, the wick permeability 73 × 10
−12 m
2 and the effective pore radius 50.8 × 10
−6 m. The pressure isolines in the upper part of the wick are clearly affected by the presence of the hot spot. The distance between the 2000 Pa line and the 1500 Pa line is smallest at the horizontal position of the hot spot due to the high flow friction pressure drop around the hot spot. In general the vertical distance between the pressure isolines is increasing from the bottom of the wick and up; this is because the mass flow rate in the wick is decreasing upwards due to the evaporation. The minimum pressure (P
critical = 1283 Pa, Equation (14)) is marked with a small circle on the top of the wick,
i.e., in this case the dryout occurs at the top of the wick and not in the hot spot.
Figure 10 shows the maximum average heat flux,
i.e.,
qmax,average = (0.99 + 0.01·
qhot spot/
qnormal)
qnormal, for the case
qhot spot/
qnormal = 15 as a function of the position of the hot spot. For a hot spot positioned below the vertical mid-position the average heat flux increases above the nominal value of 301.5 kW/m
2, whereas for positions above the middle the heat flux is lower than the nominal value.
Compared to the nominal case 301.5 kW/m2 (without hot spot) a high flux hot spot above the mid-position will be more detrimental than a weaker hot spot. For a hot spot below the mid-position the reduced flow distance for the supply to the hot spot will be increasingly important with increasing hot spot heat flux.
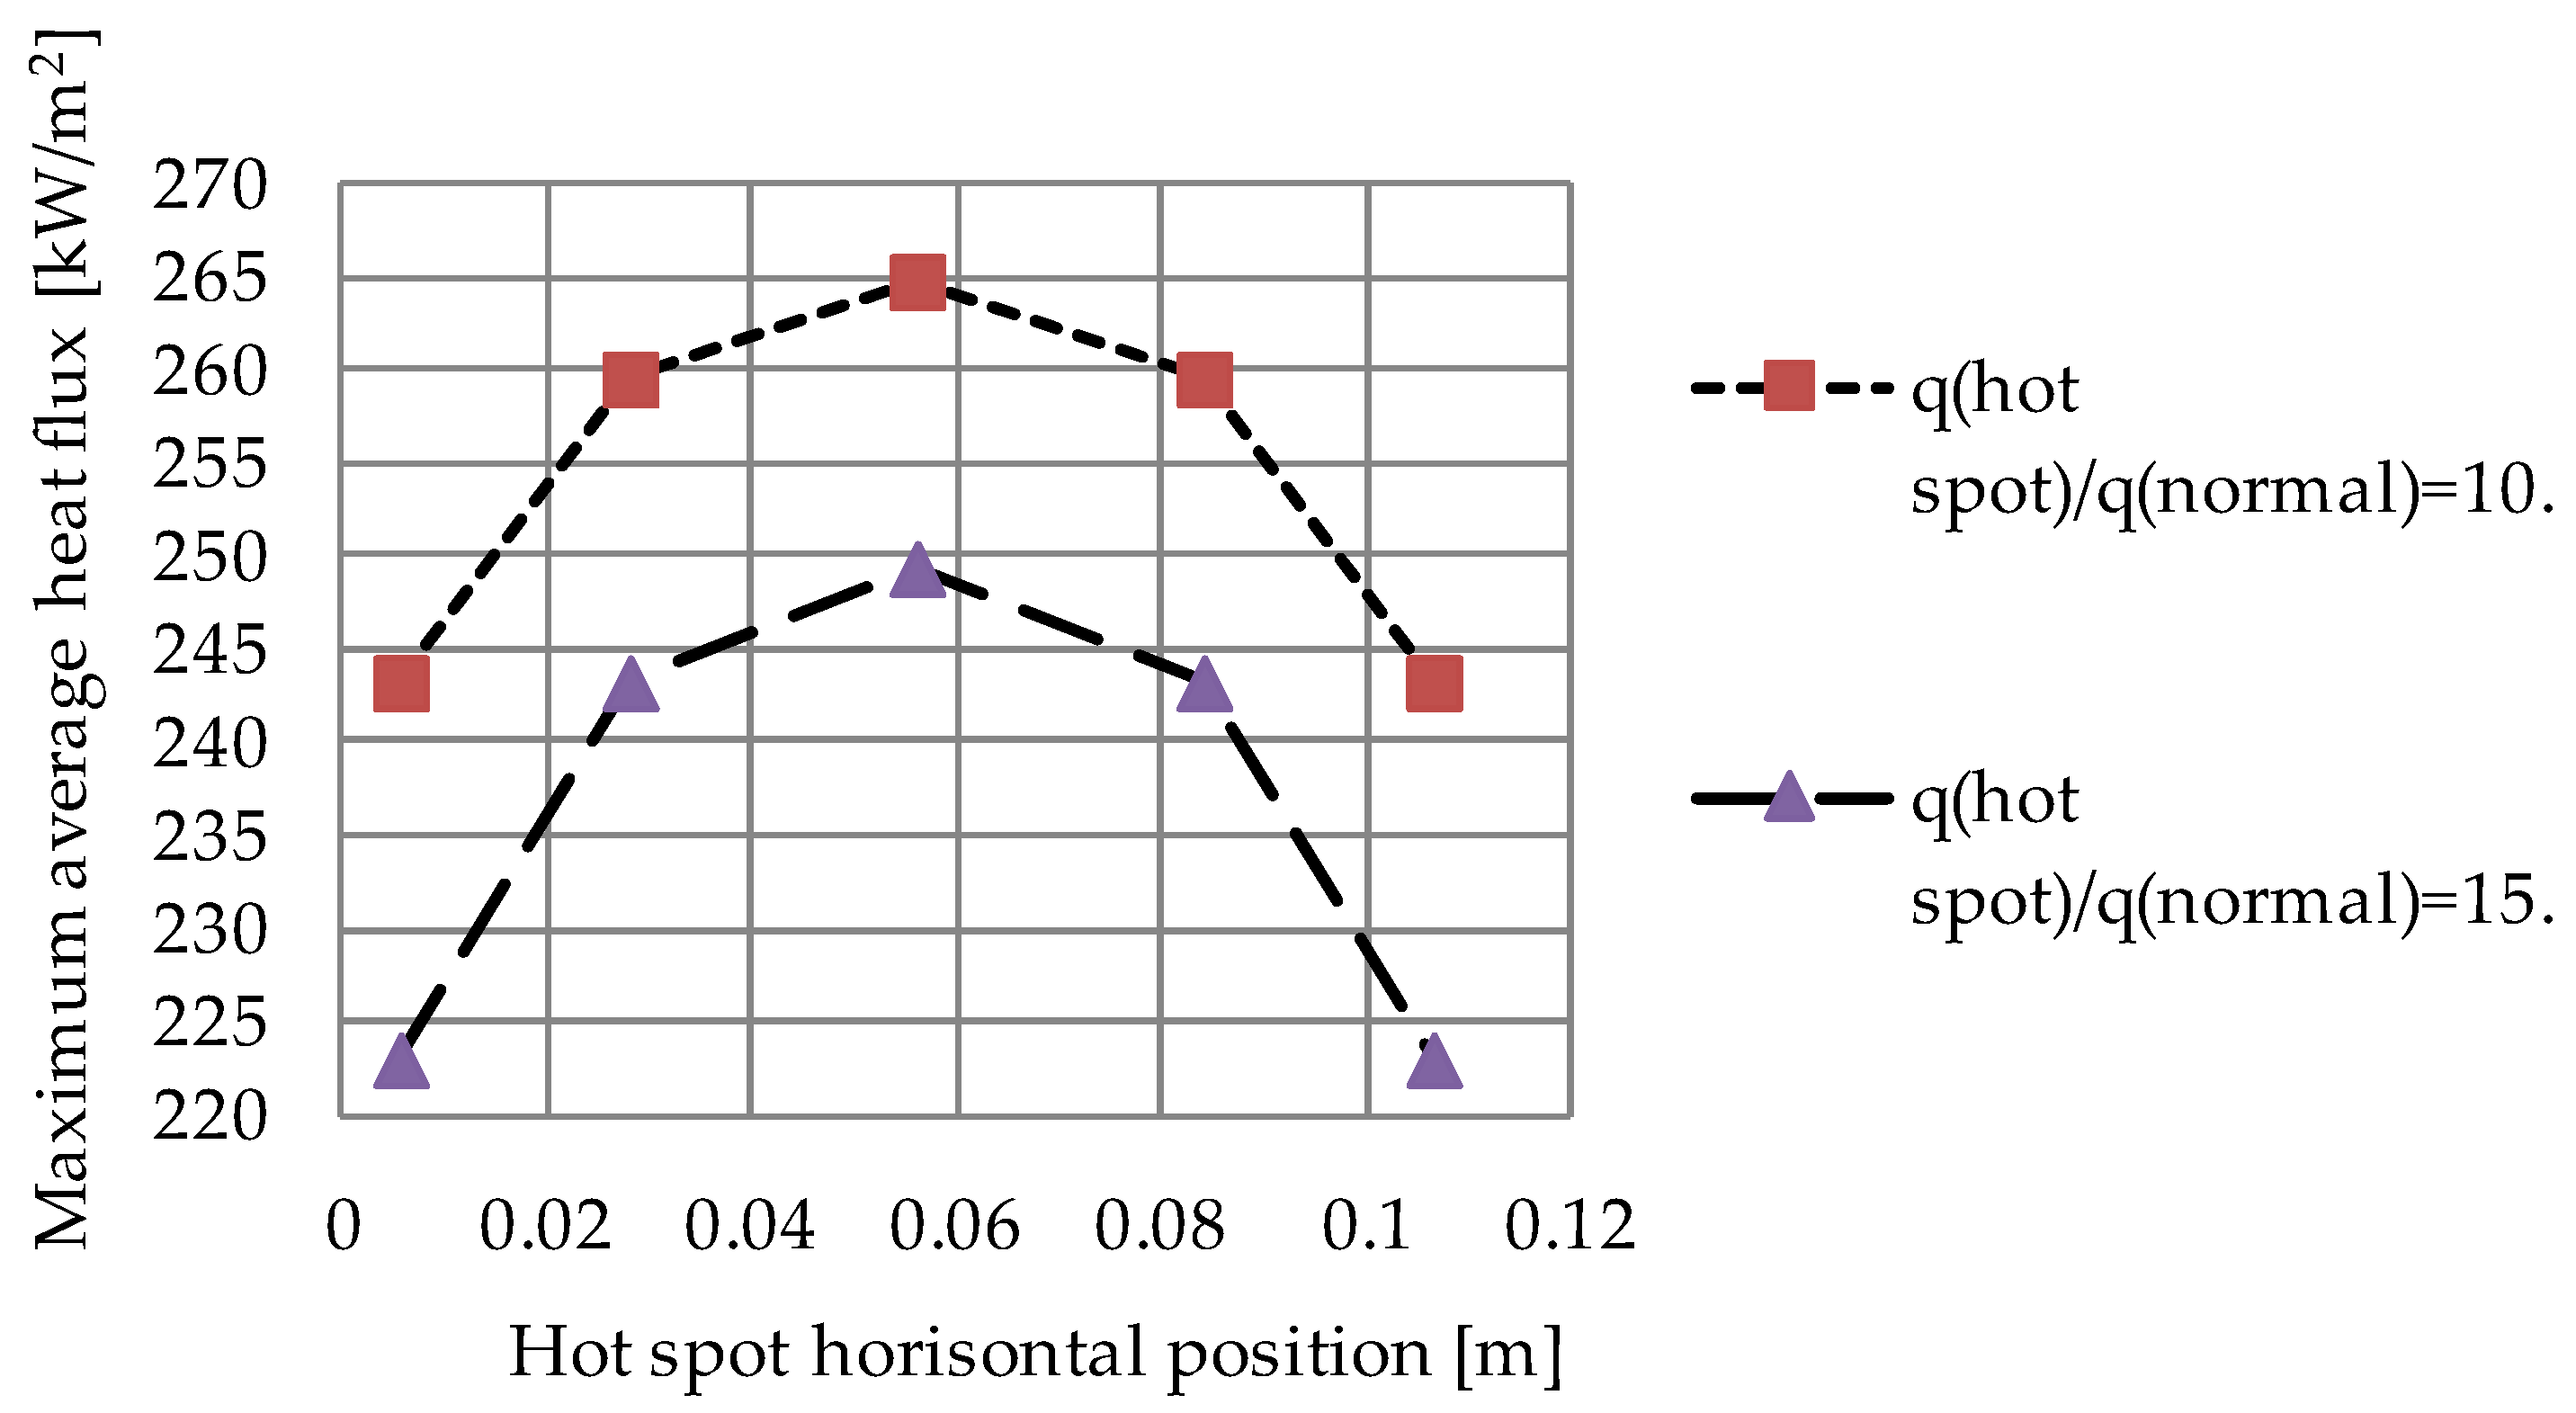
In
Figure 11 the wick maximum average heat flux,
qmax, average, has been plotted for cases with hot spots
qhot spot/
qnormal = 10 and
qhot spot/
qnormal = 15 for different horizontal positions at the hot spot center vertical position (0.112–0.0112/2) = 0.1064 m.
In
Figure 11 the least detrimental hot spot positions are at the vertical centerline (
i.e., for 0.056 m horizontal position), where the hot spots can receive liquid symmetrically from both sides. The flow resistance increases with distance from the centerline, and accordingly the maximum average heat flux decreases.
Figure 10 and
Figure 11 show that the impact of the hot spot increases with its heat flux and that the vertical position of the hot spot is more important than the horizontal position for the analyzed cases.
Important observations from the analysis are:
Positions 1 and 3 in
Figure 8 are the two most detrimental hot spot areas for a vertical wick. The upper corner hot spot positions are critical because they are associated with the longest average flow distances for the liquid from the pool at the bottom of the wick and a higher local mass flow rate at the hot spot border. The hot spot positions 1 and 3 will lead to the lowest maximum average heat flux for the whole wick.
Position 2 is less detrimental than position 1 and position 3 because a hot spot in position 2 will receive liquid from both sides, with a lower average flow resistance than the corner hot spots 1 and 3.
A hot spot in position 7, 8, or 9 will lead to the highest maximum average heat fluxes because the average flow resistance is reduced compared to the uniform heat flux case. A hot spot in position 7, 8, or 9, which may not be sufficient to cause dryout there, can still cause dryout at the top of the wick.
A dryout situation caused by a hot spot will lead to a sharp increase in the temperature at the dryout position. Mechanical damage to the wick can occur due to the thermal expansion which accompanies the dryout. An undamaged wick will normally be rewetted at the dryout position if the heat flux at the hot spot is decreased below the dryout value.
One way to reduce the risk for hot spots is to increase the thickness of the wick, because the capacity of a wick is directly proportional to its thickness. Increased thickness will, however, increase the thermal resistance of the wick.
Reduced wick height will also increase the ability of the wick to handle hot spots, and lead to increased maximum average uniform heat flux.
The conclusions of the hot spot analysis are also considered valid for wicks exposed to non-uniform heat fluxes, in general.
Special design is required when the application requires cooling over a larger height than a single wick can handle. This may be a system consisting of several heat pipes, or a single heat pipe in which condensate is supplied to the wick at several vertical positions.


