
Impacts of Climate Change and Anthropogenic Activities on the Ecological Restoration of Wetlands in the Arid Regions of China


Abstract
:1. Introduction
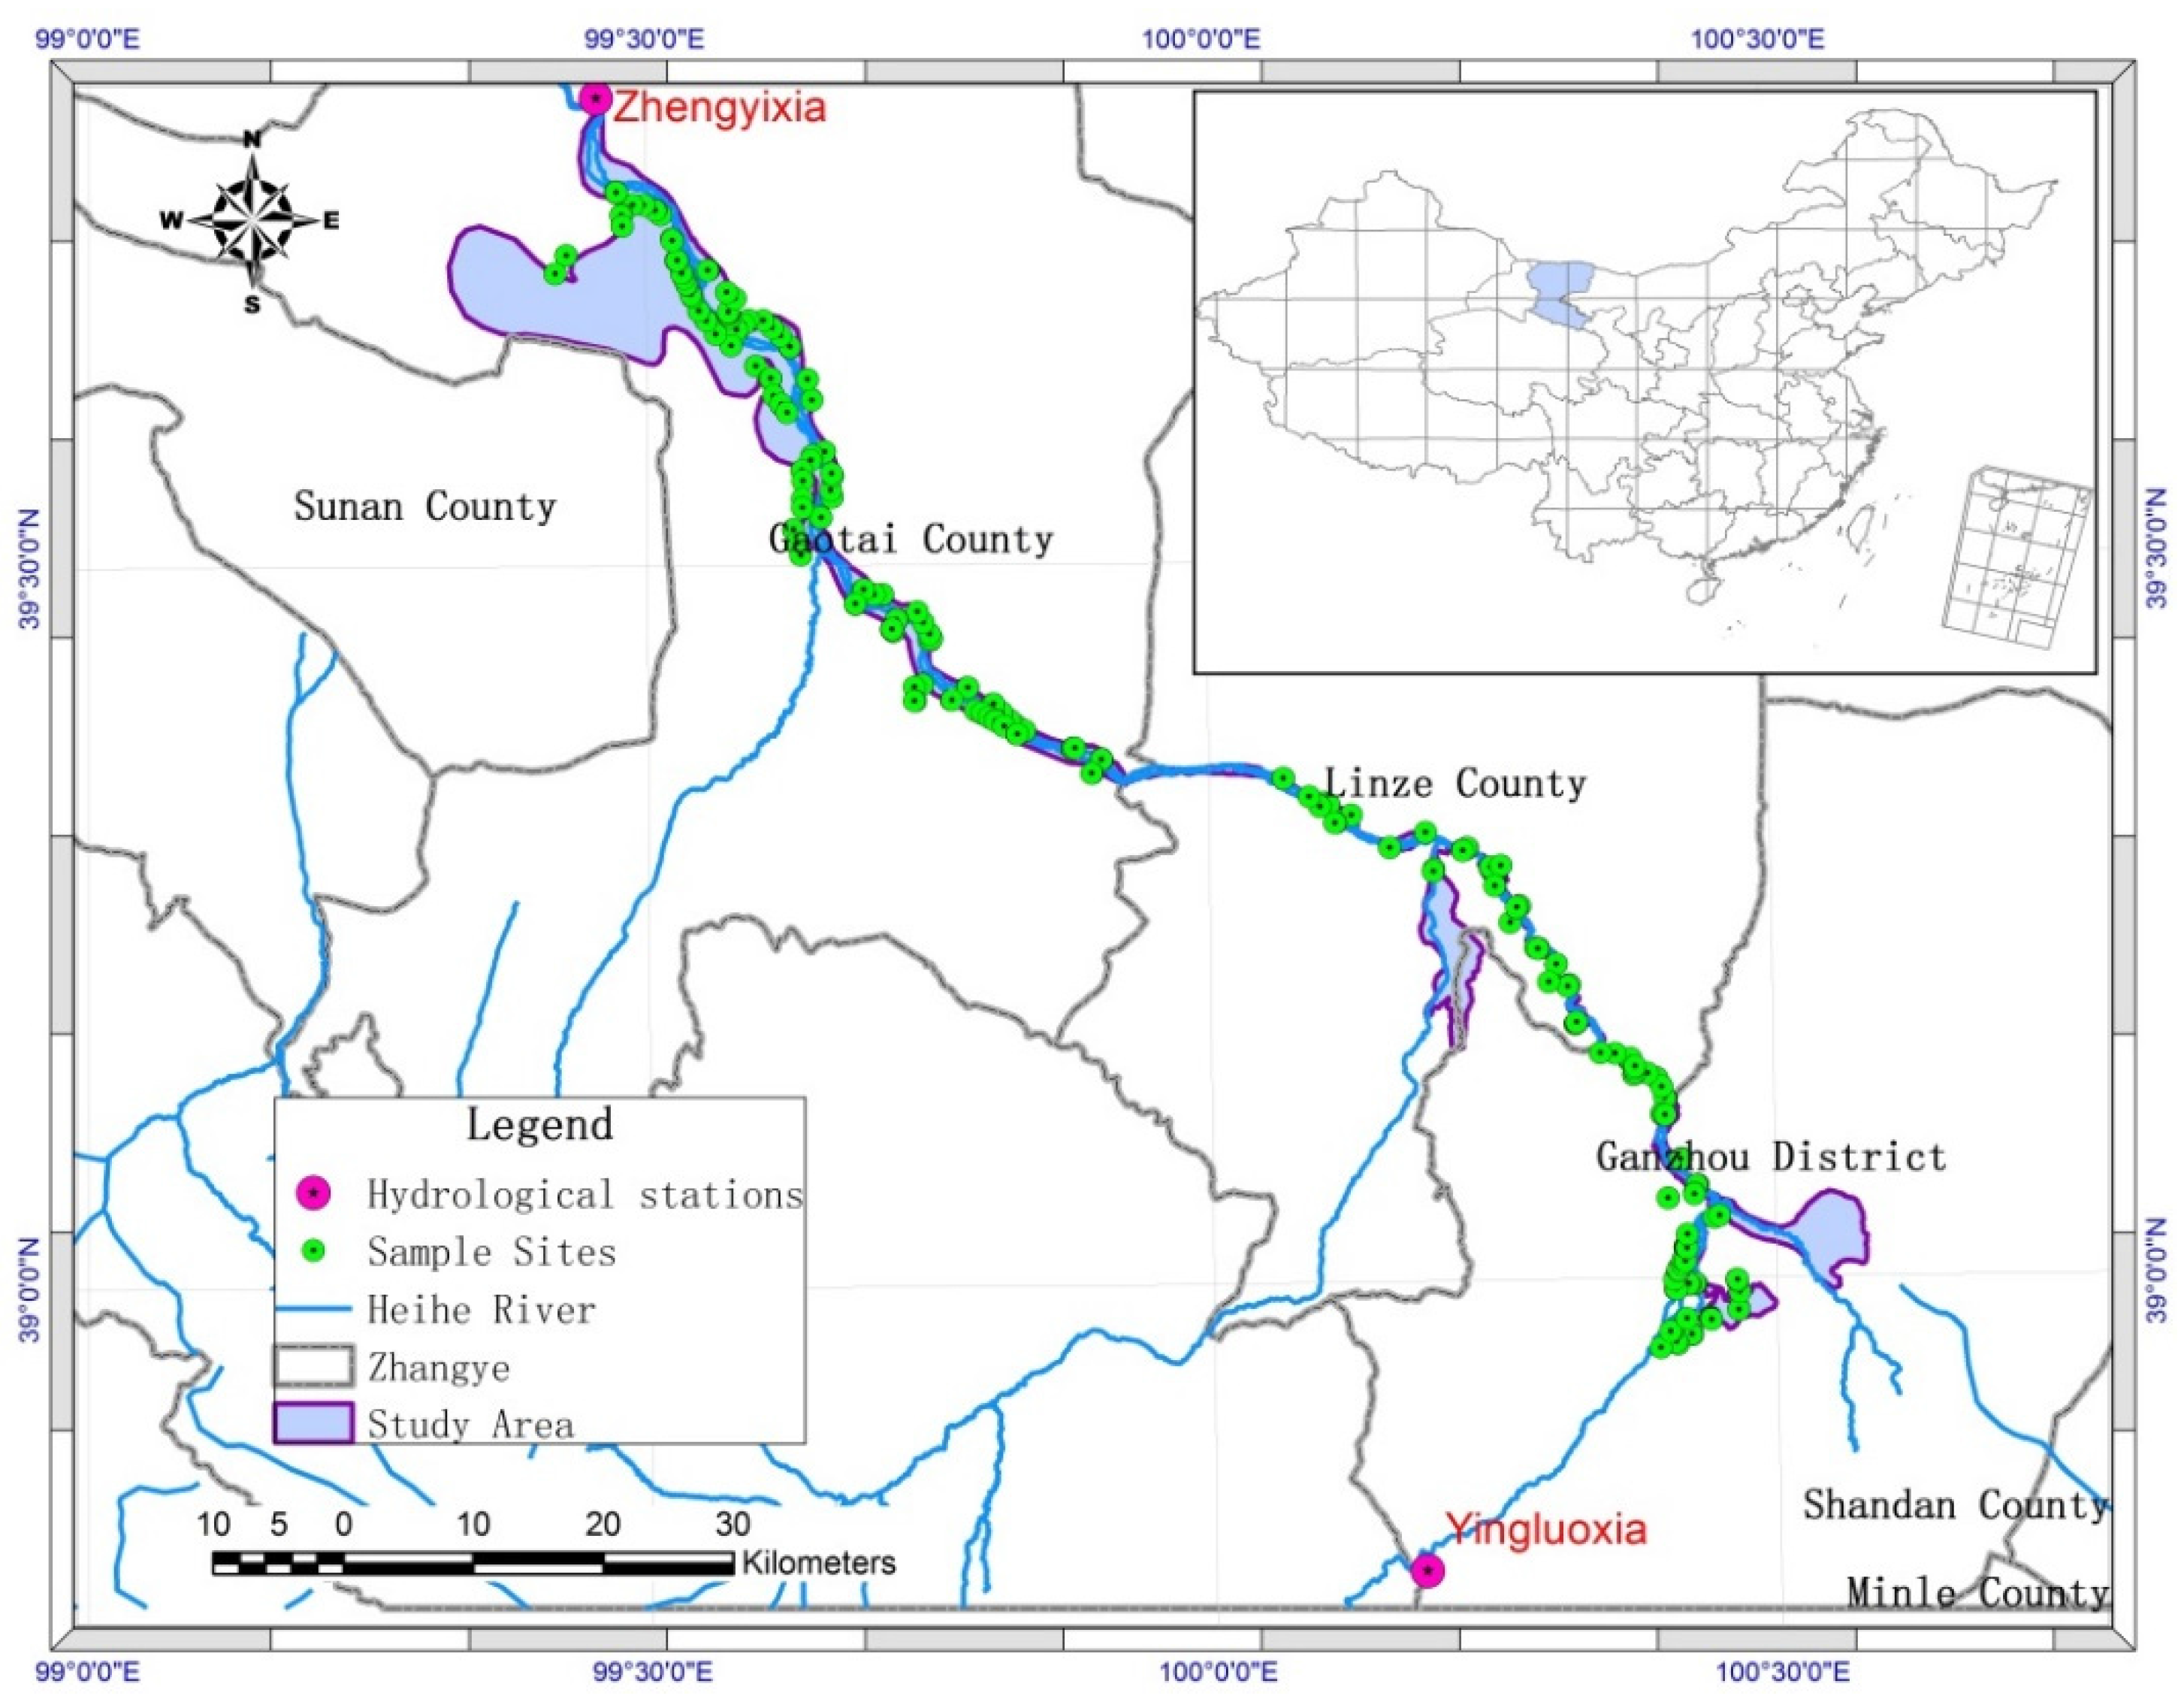
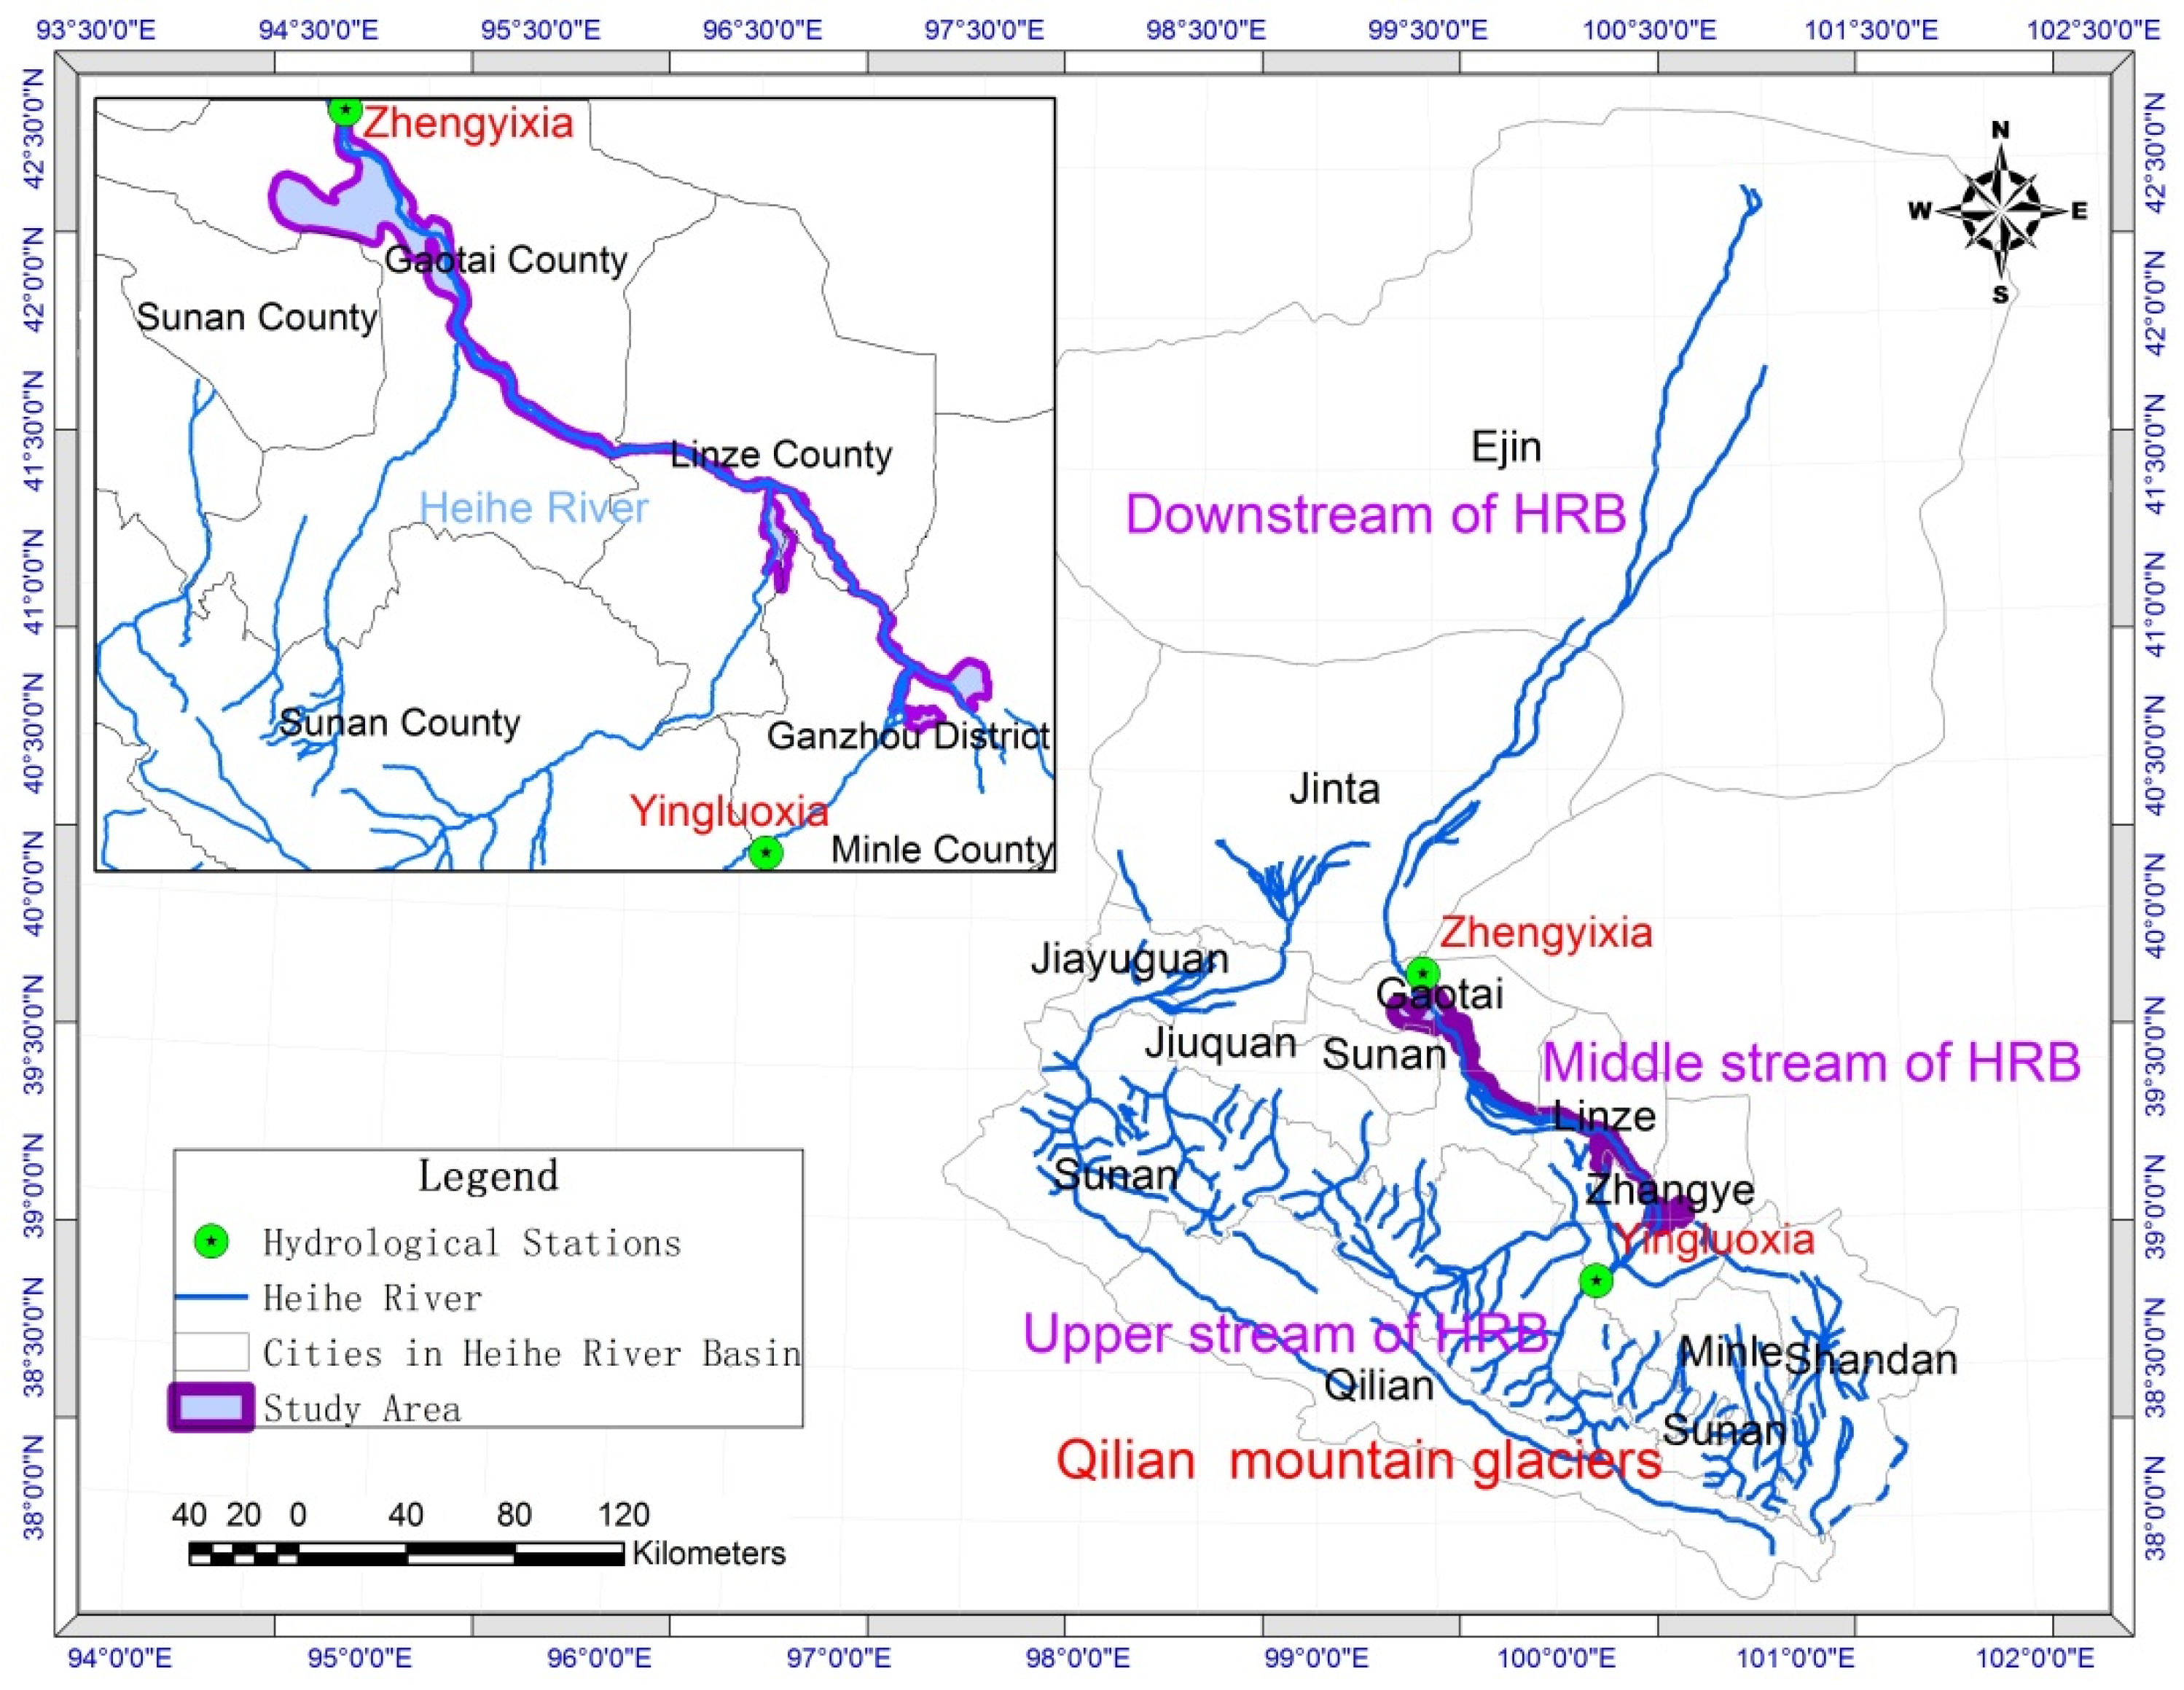
2. Study Area
3. Materials and Methods
3.1. Data Sources
3.2. Wetland Classification Indicator System
3.3. The Extraction Methods for Wetland Remote Sensing Information
3.4. Dynamic Monitoring Methods of Wetland Landscape
3.5. Landscape Pattern Fragmentation of Wetland Resources
3.6. Dynamics Monitoring Approach for Wetland Vegetation Covers
4. Results and Analysis
4.1. Dynamic Changes in Wetland Resources in HRB Since 2000
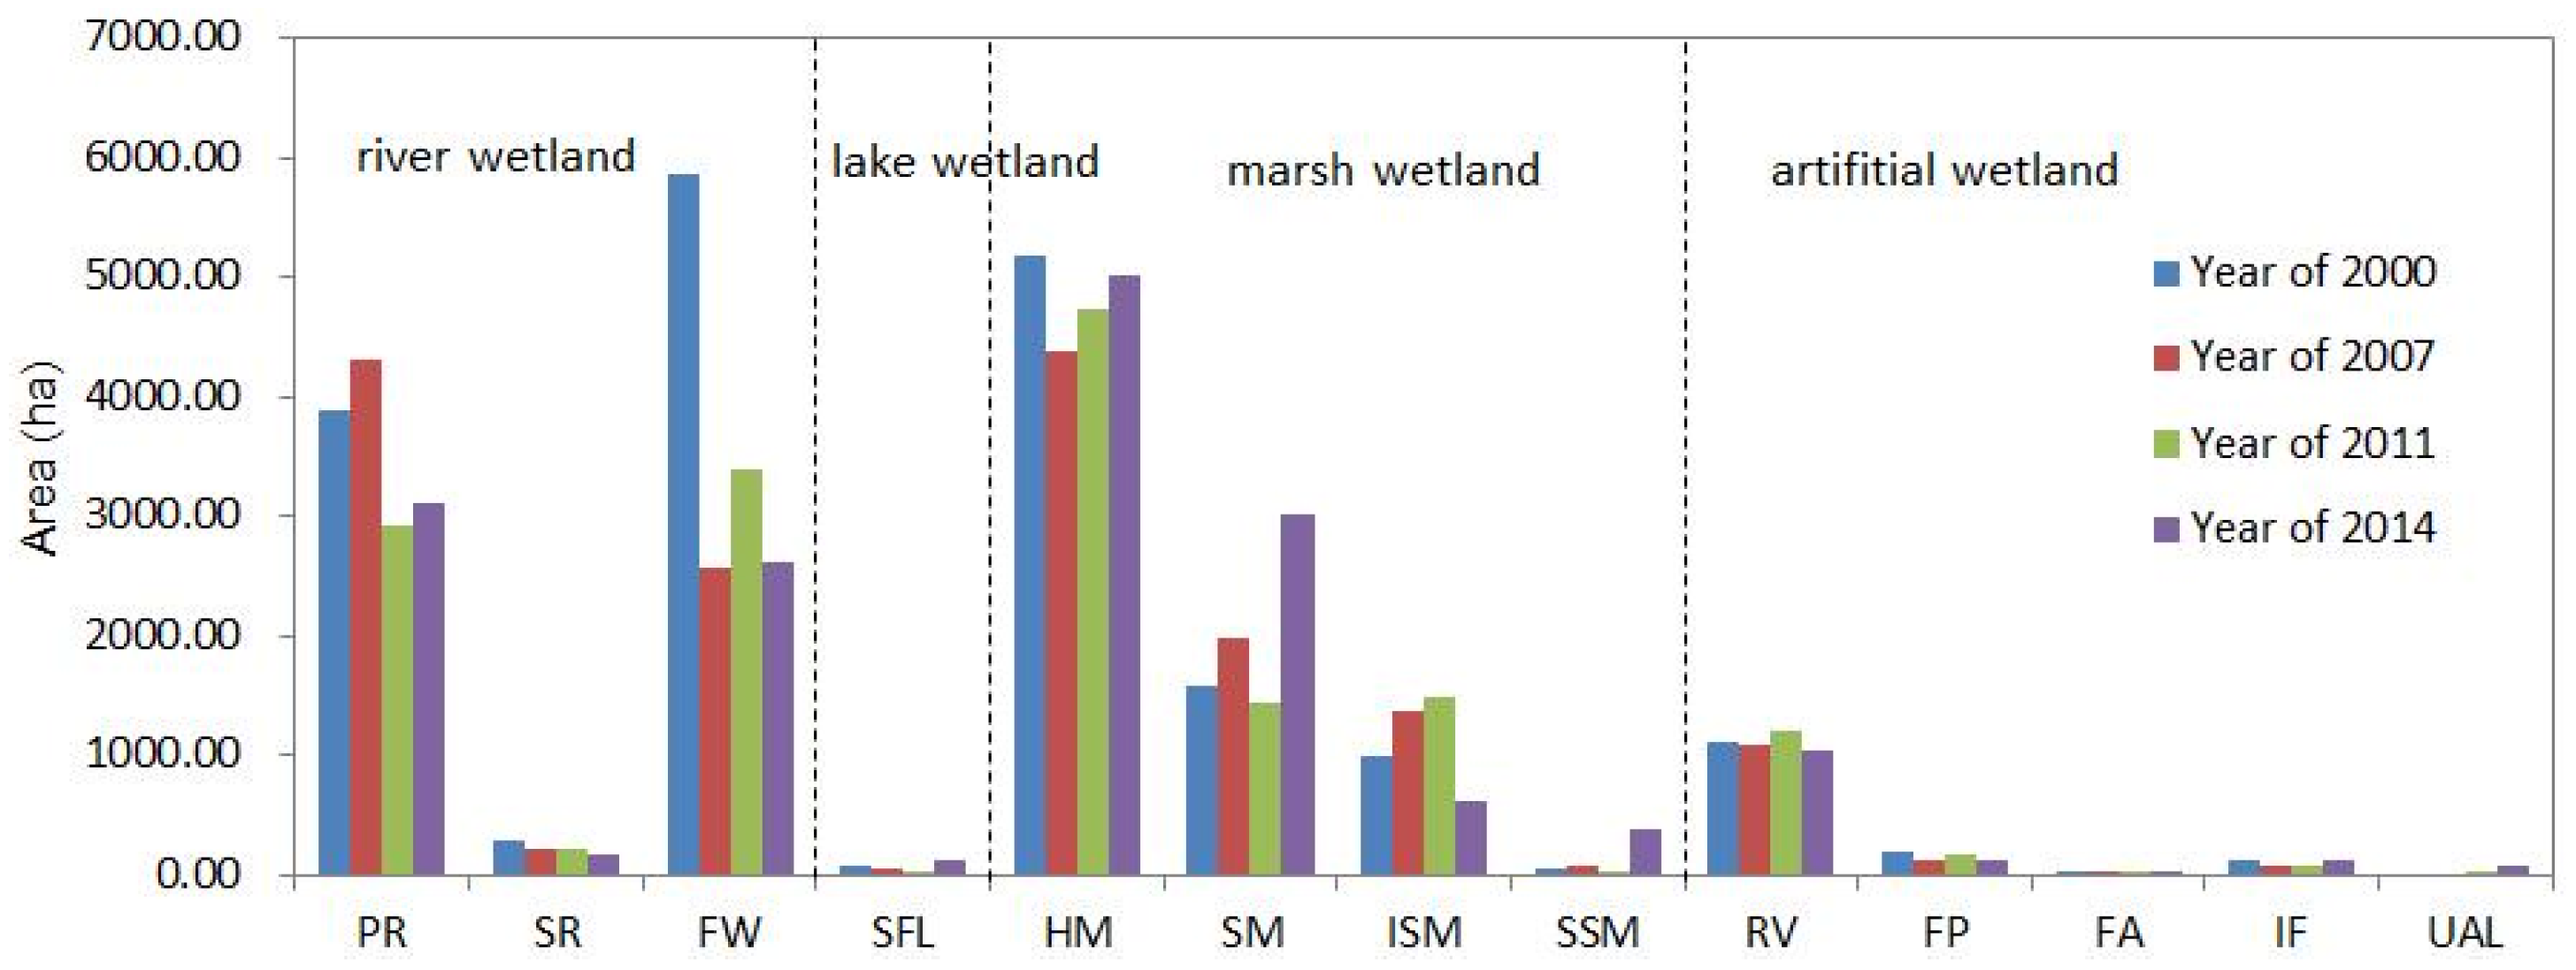
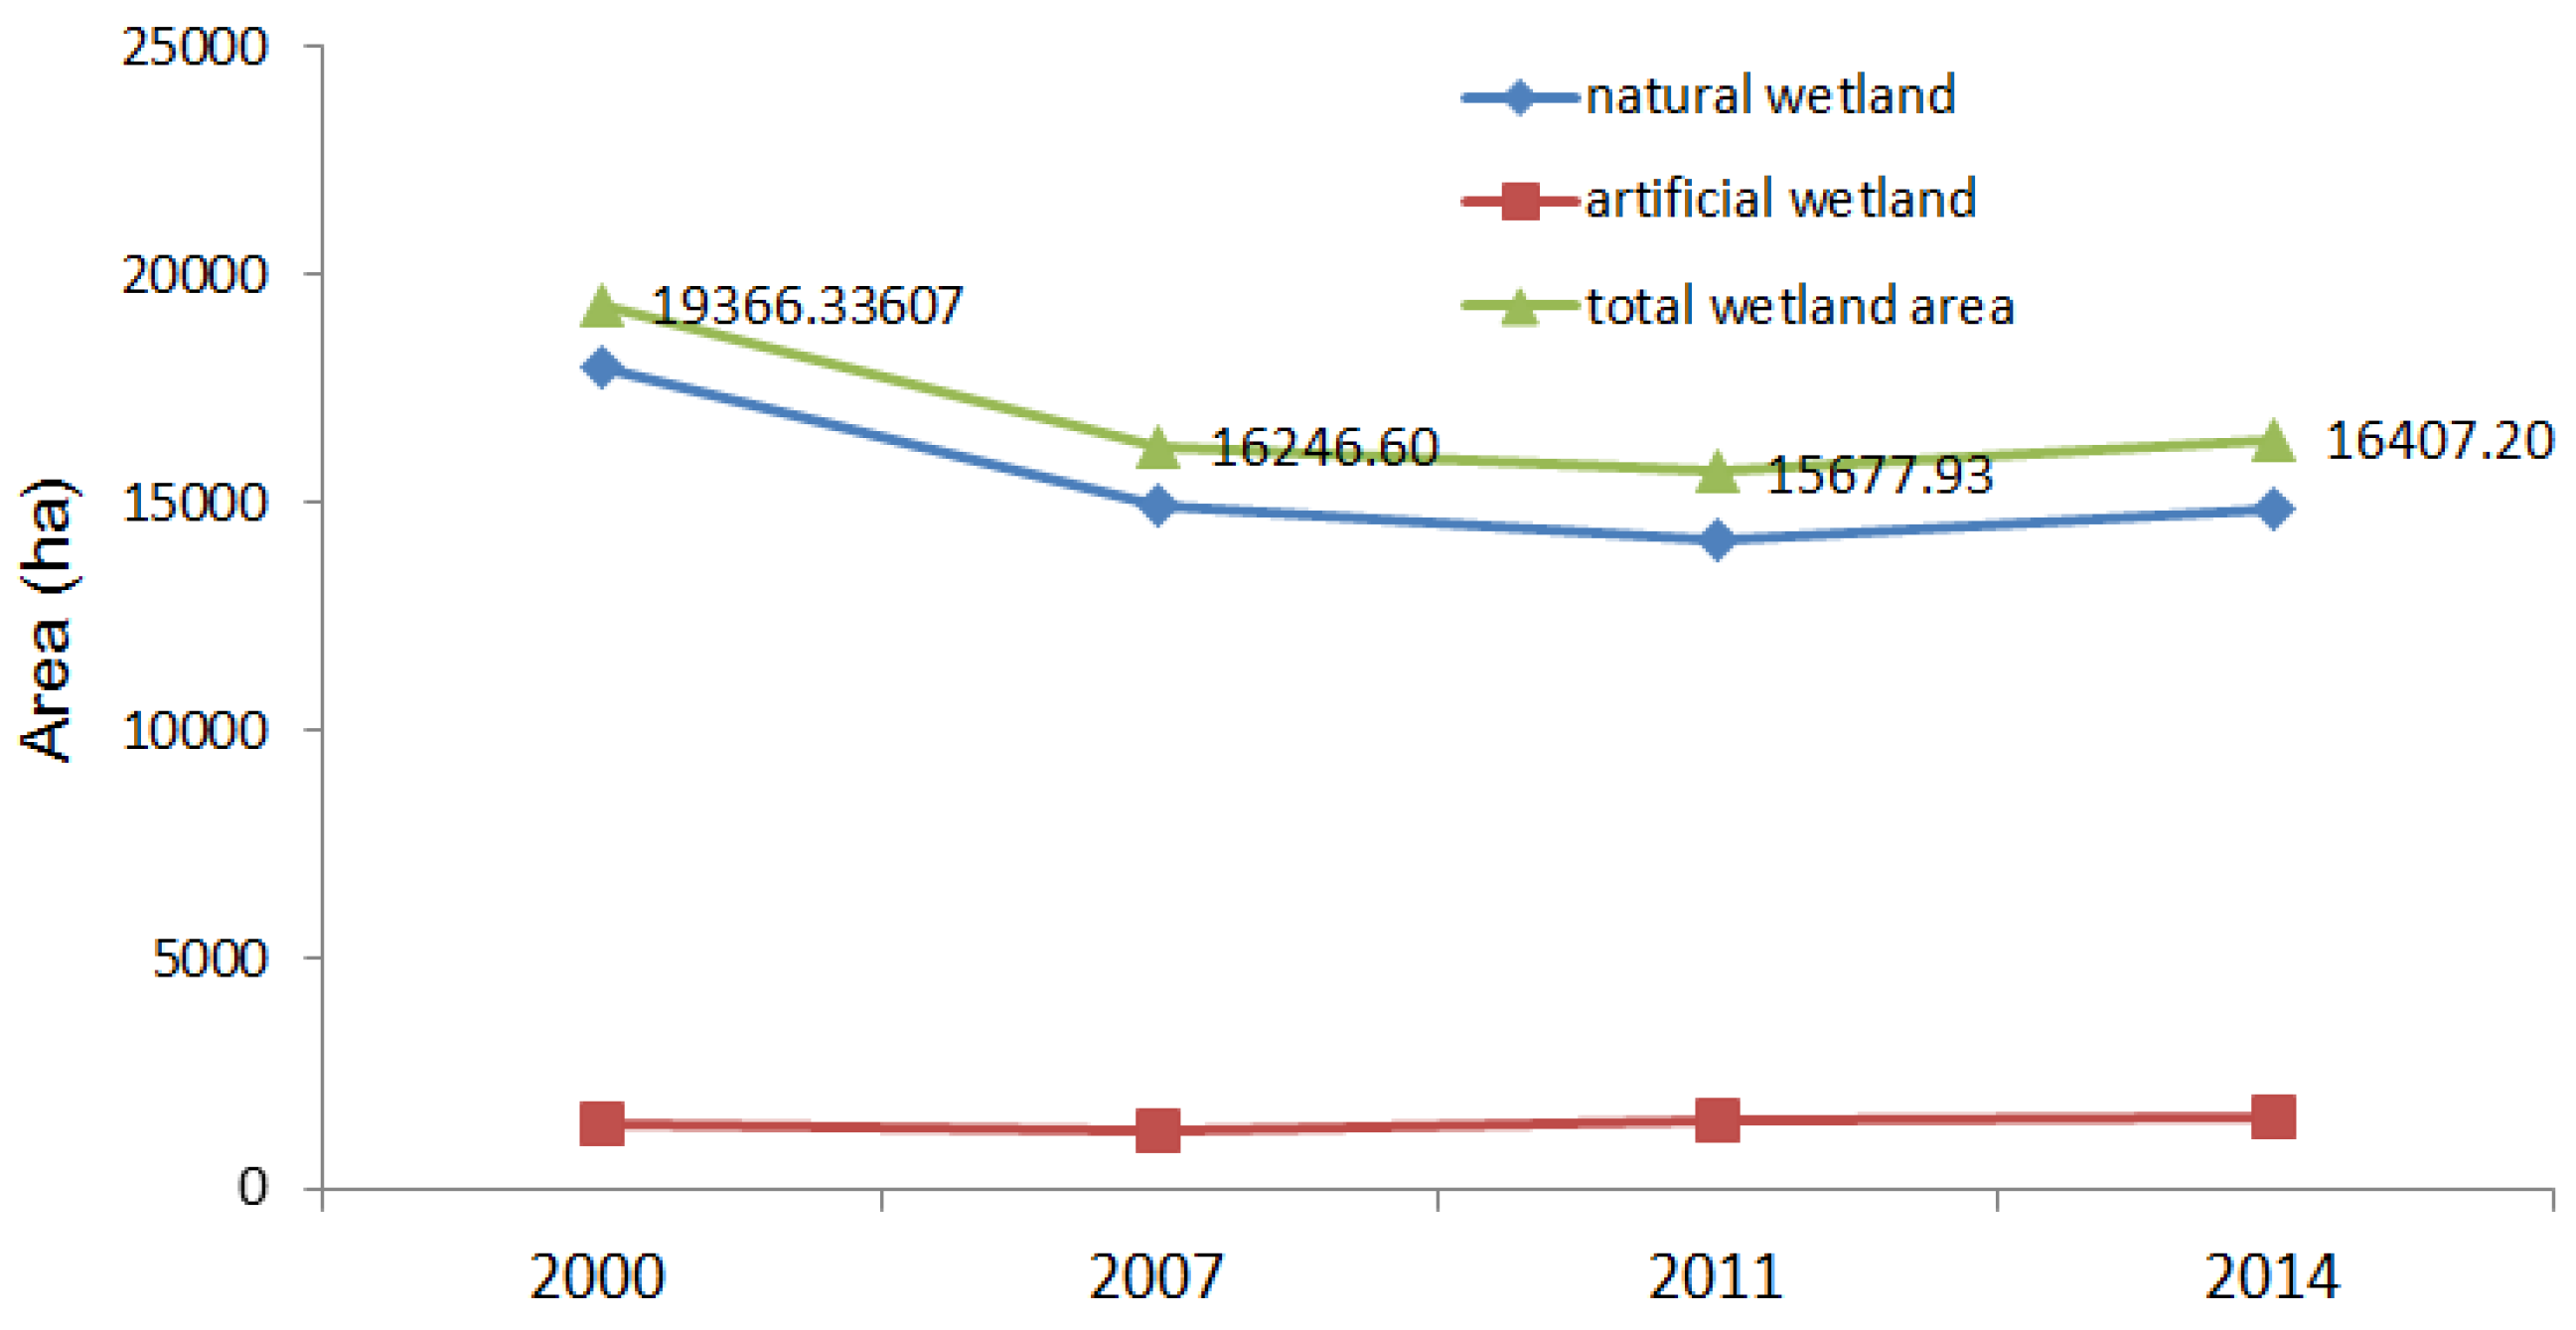
4.1.1. Dynamics of the Area of the Wetland Landscape
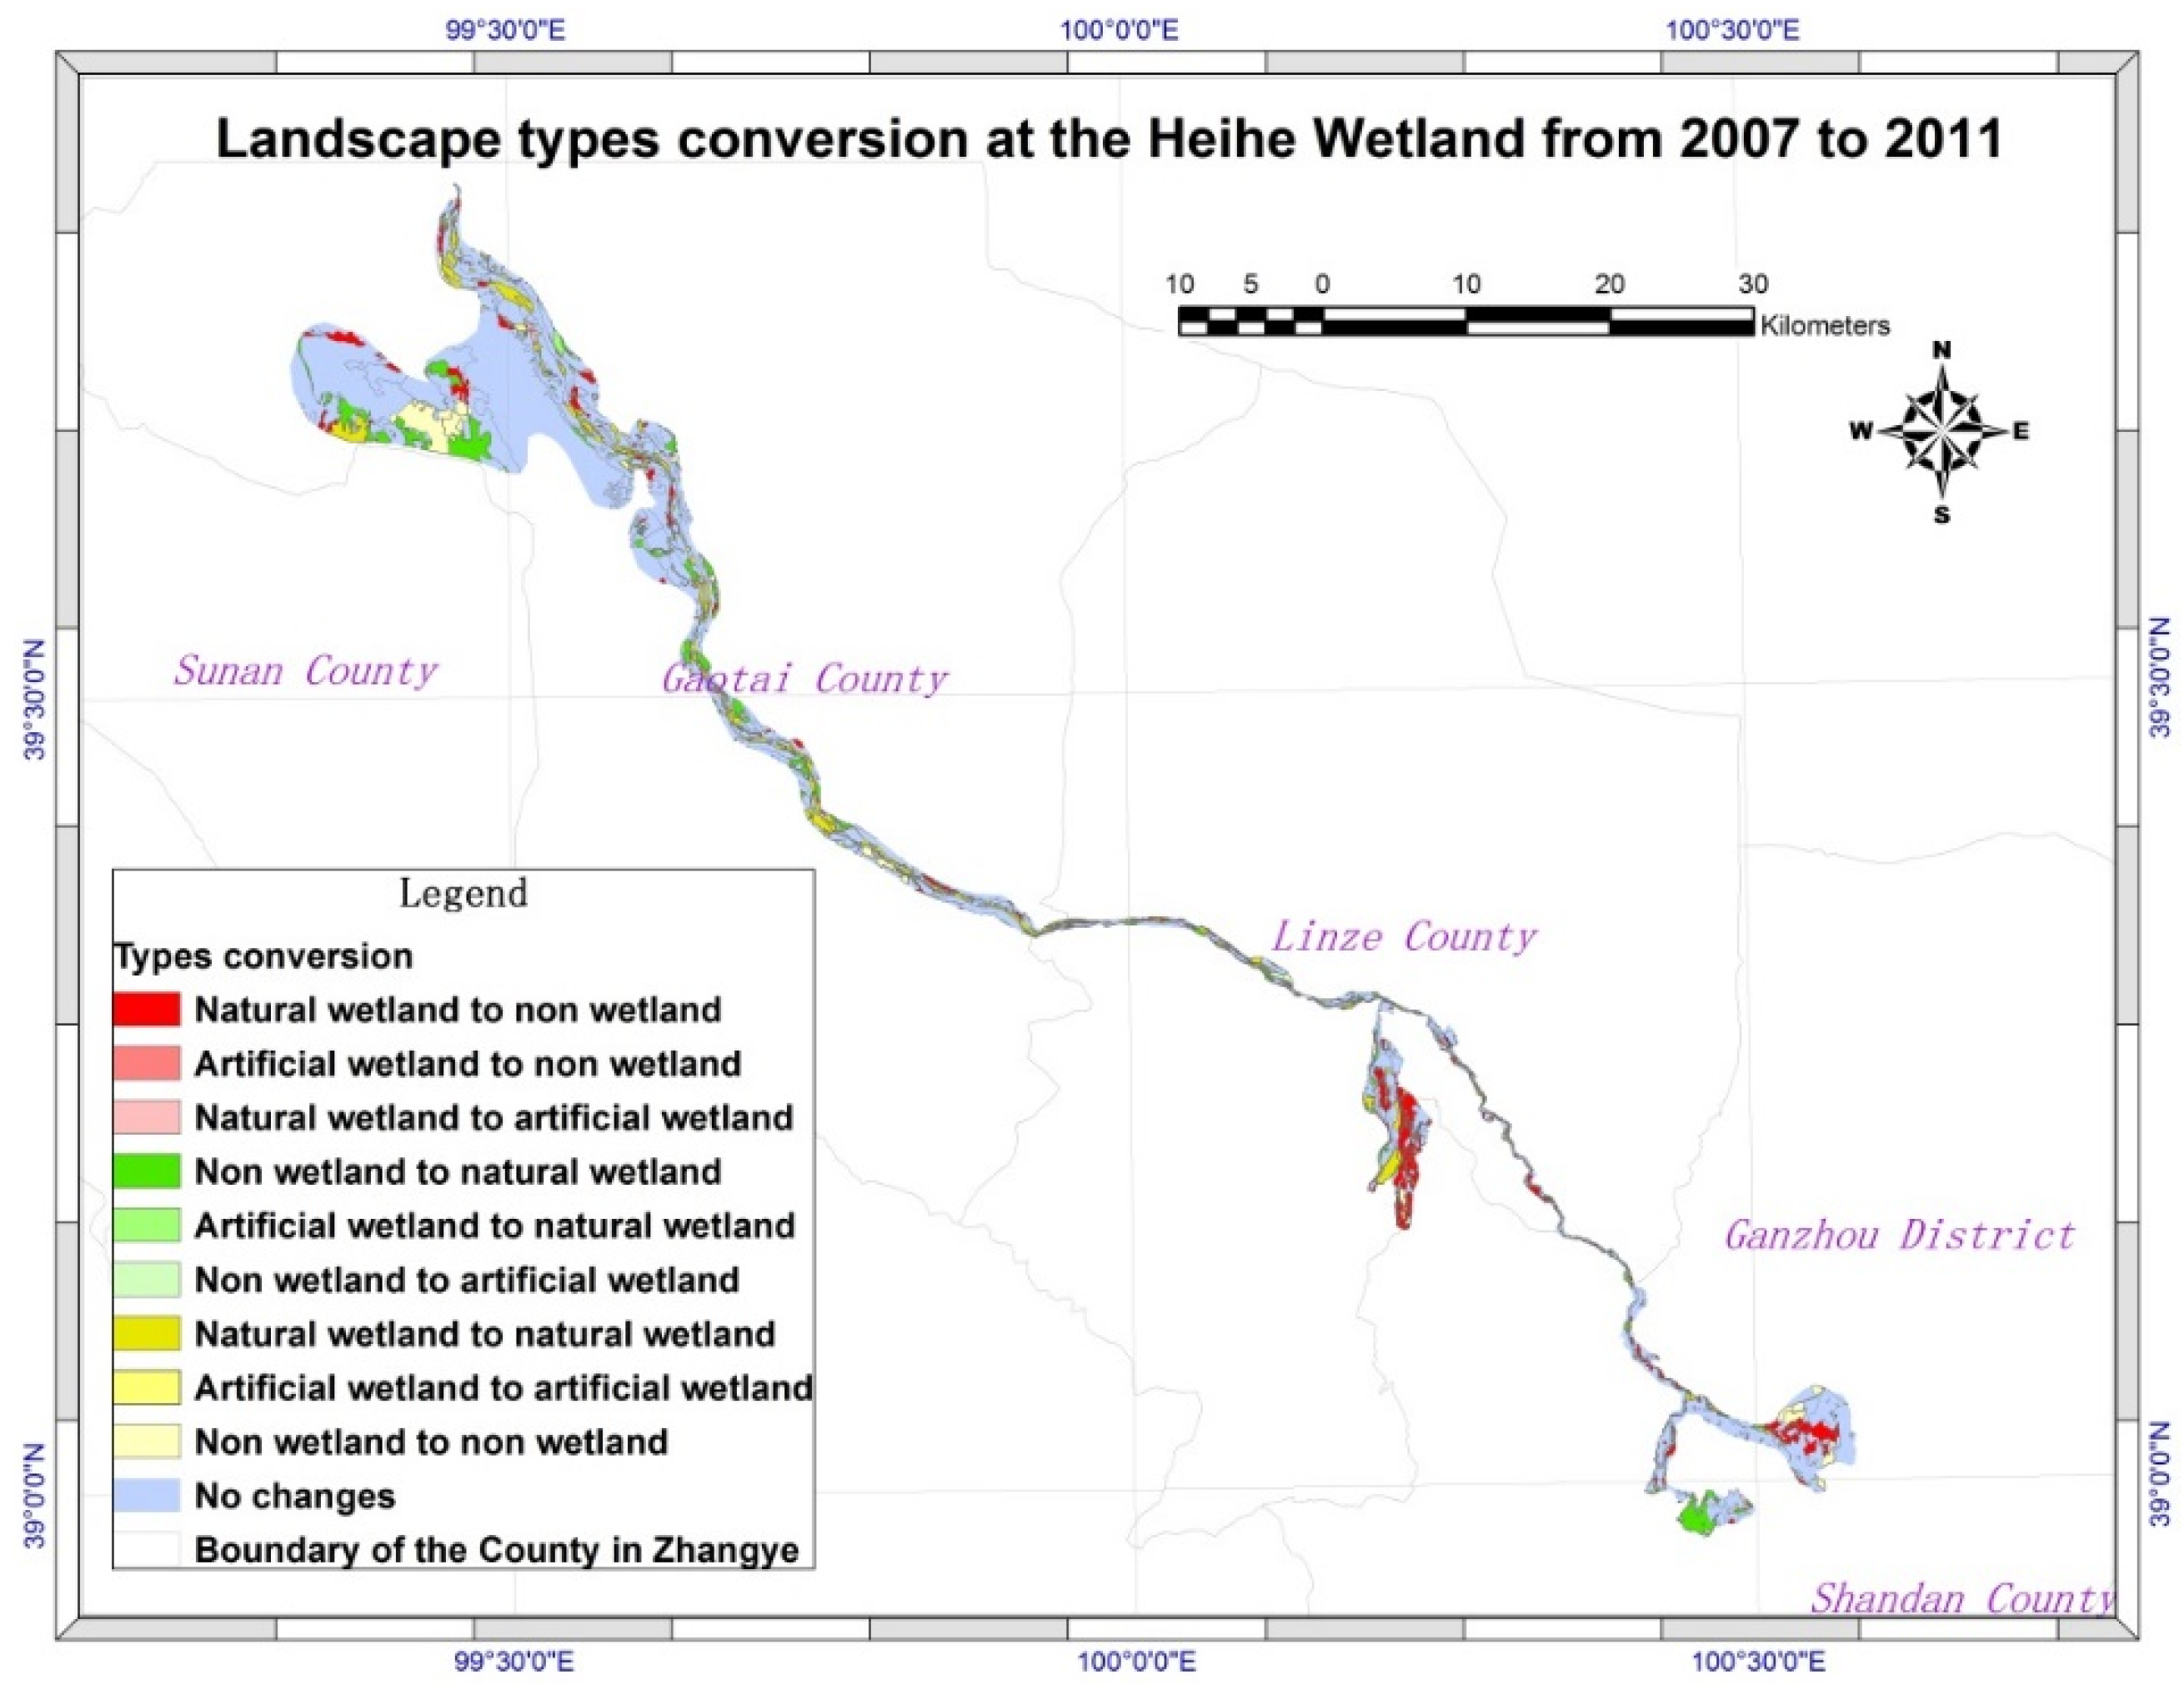
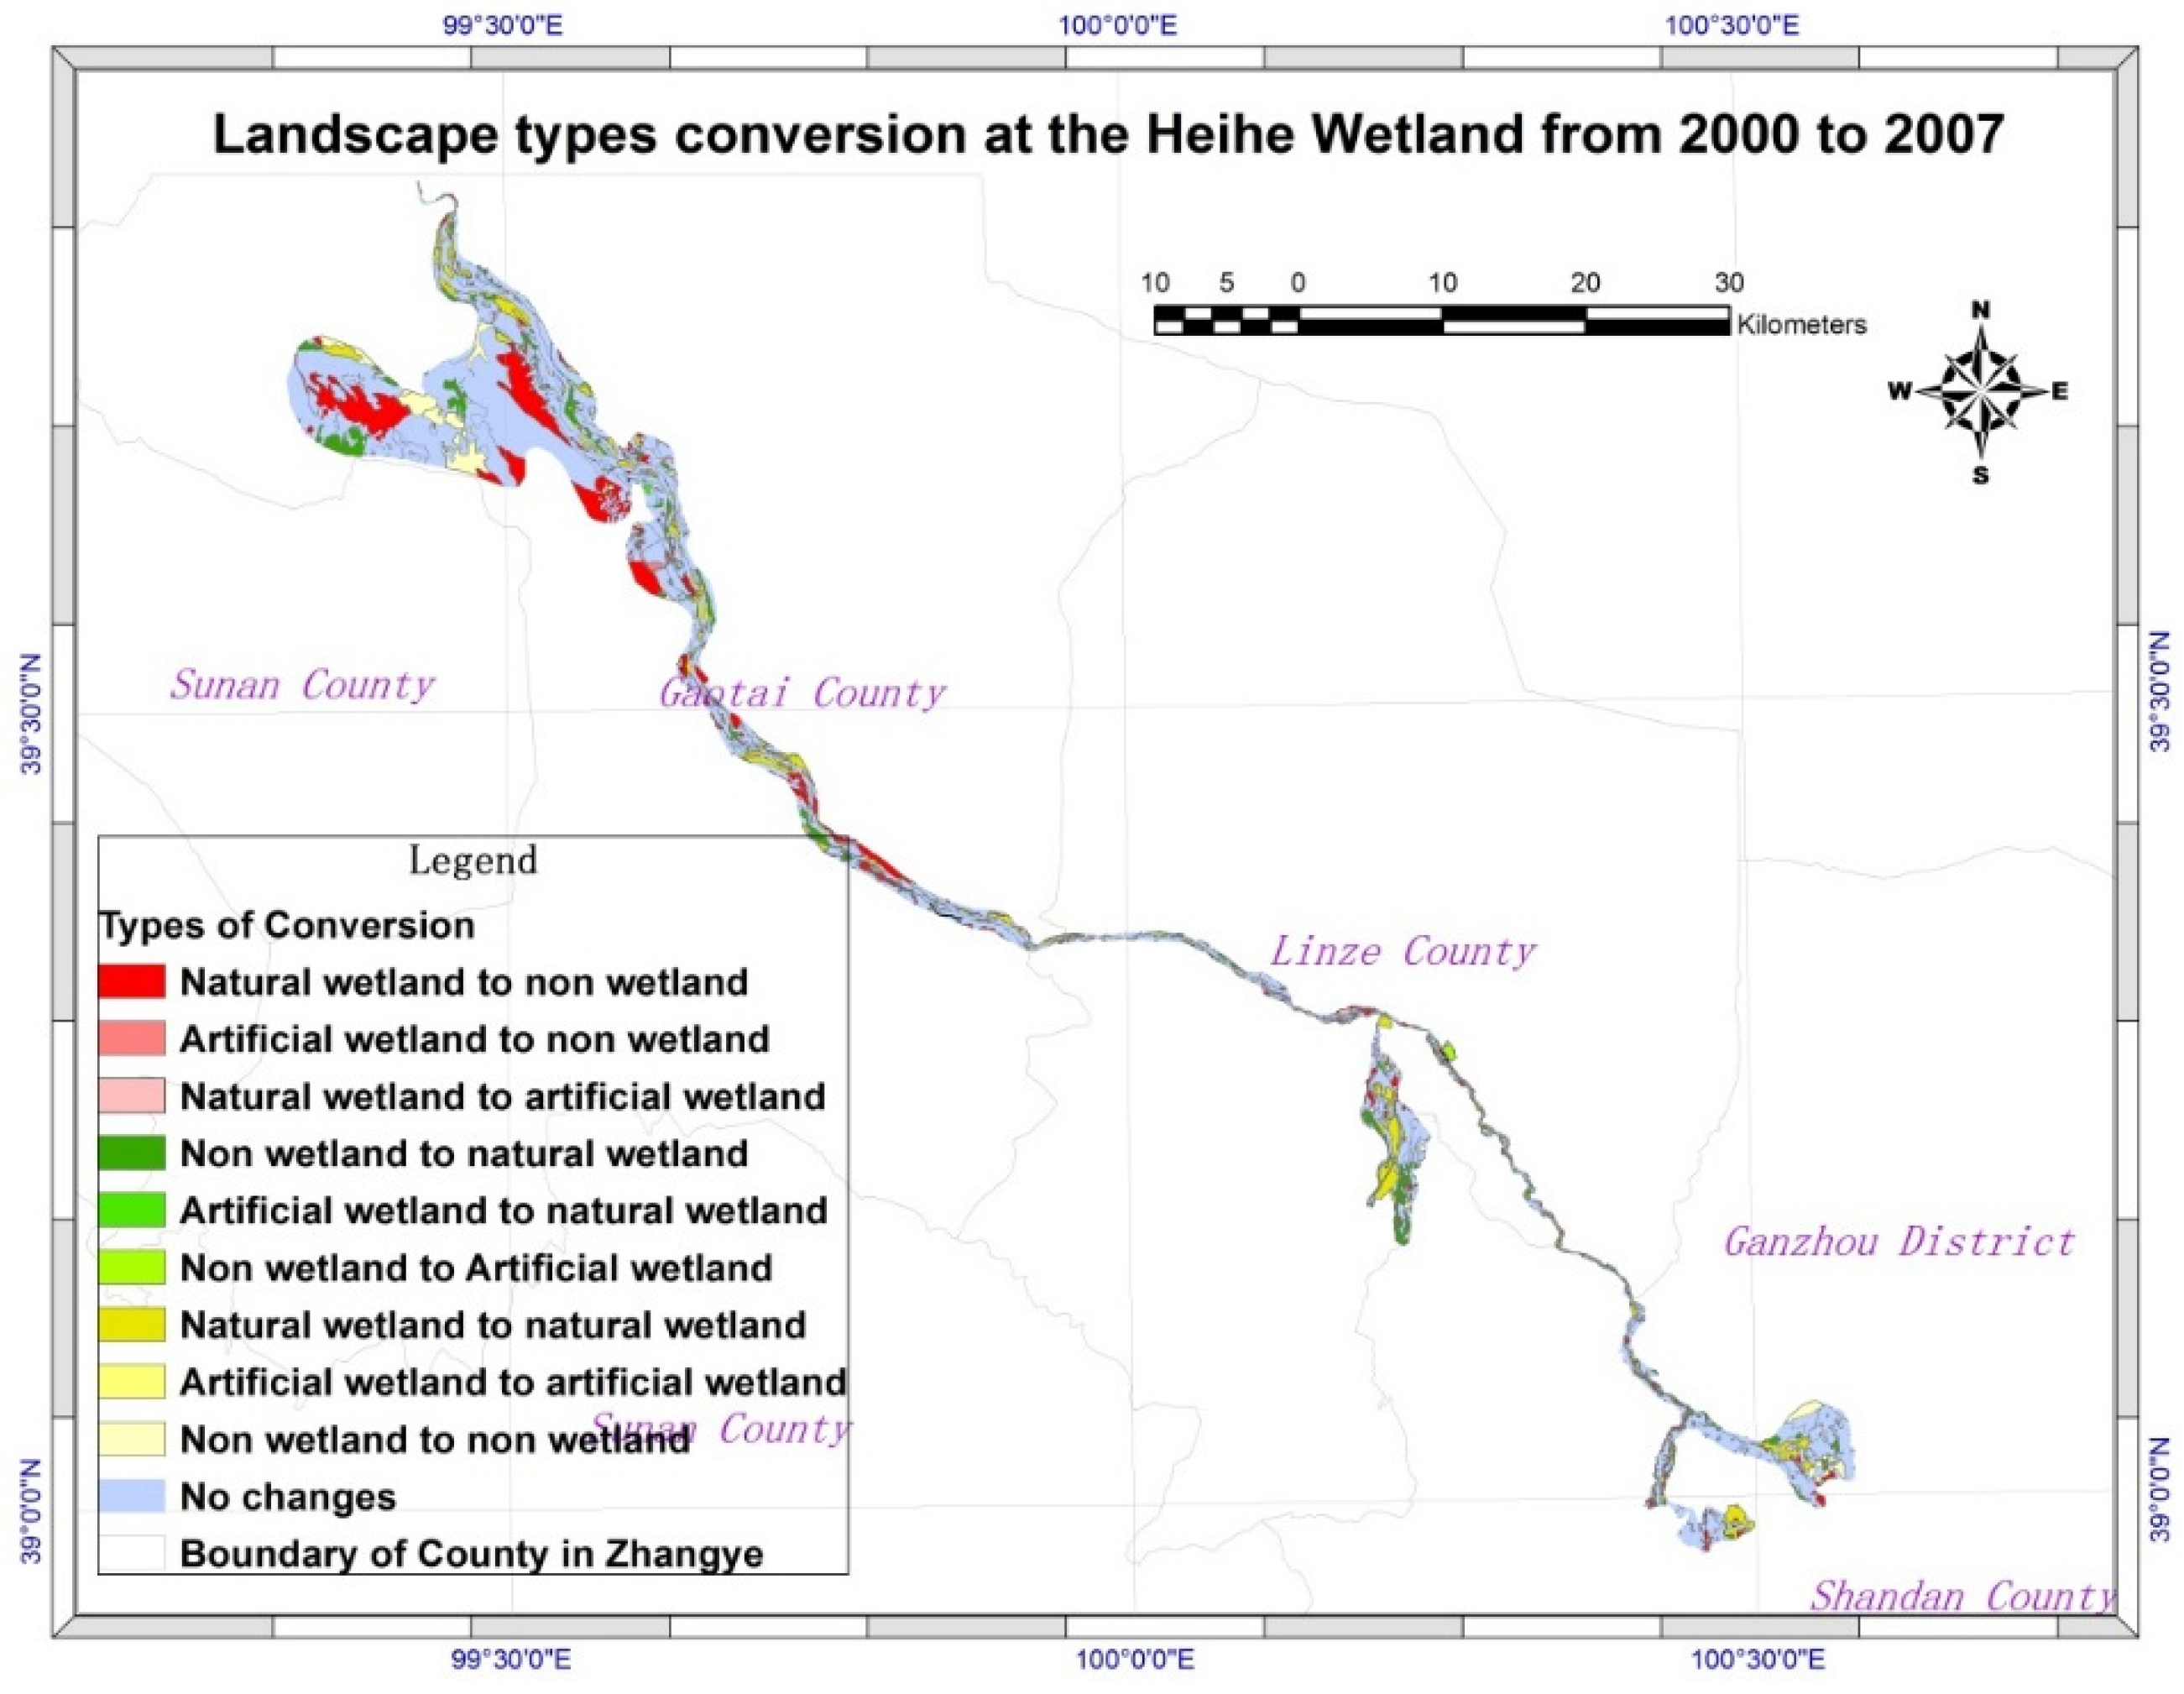
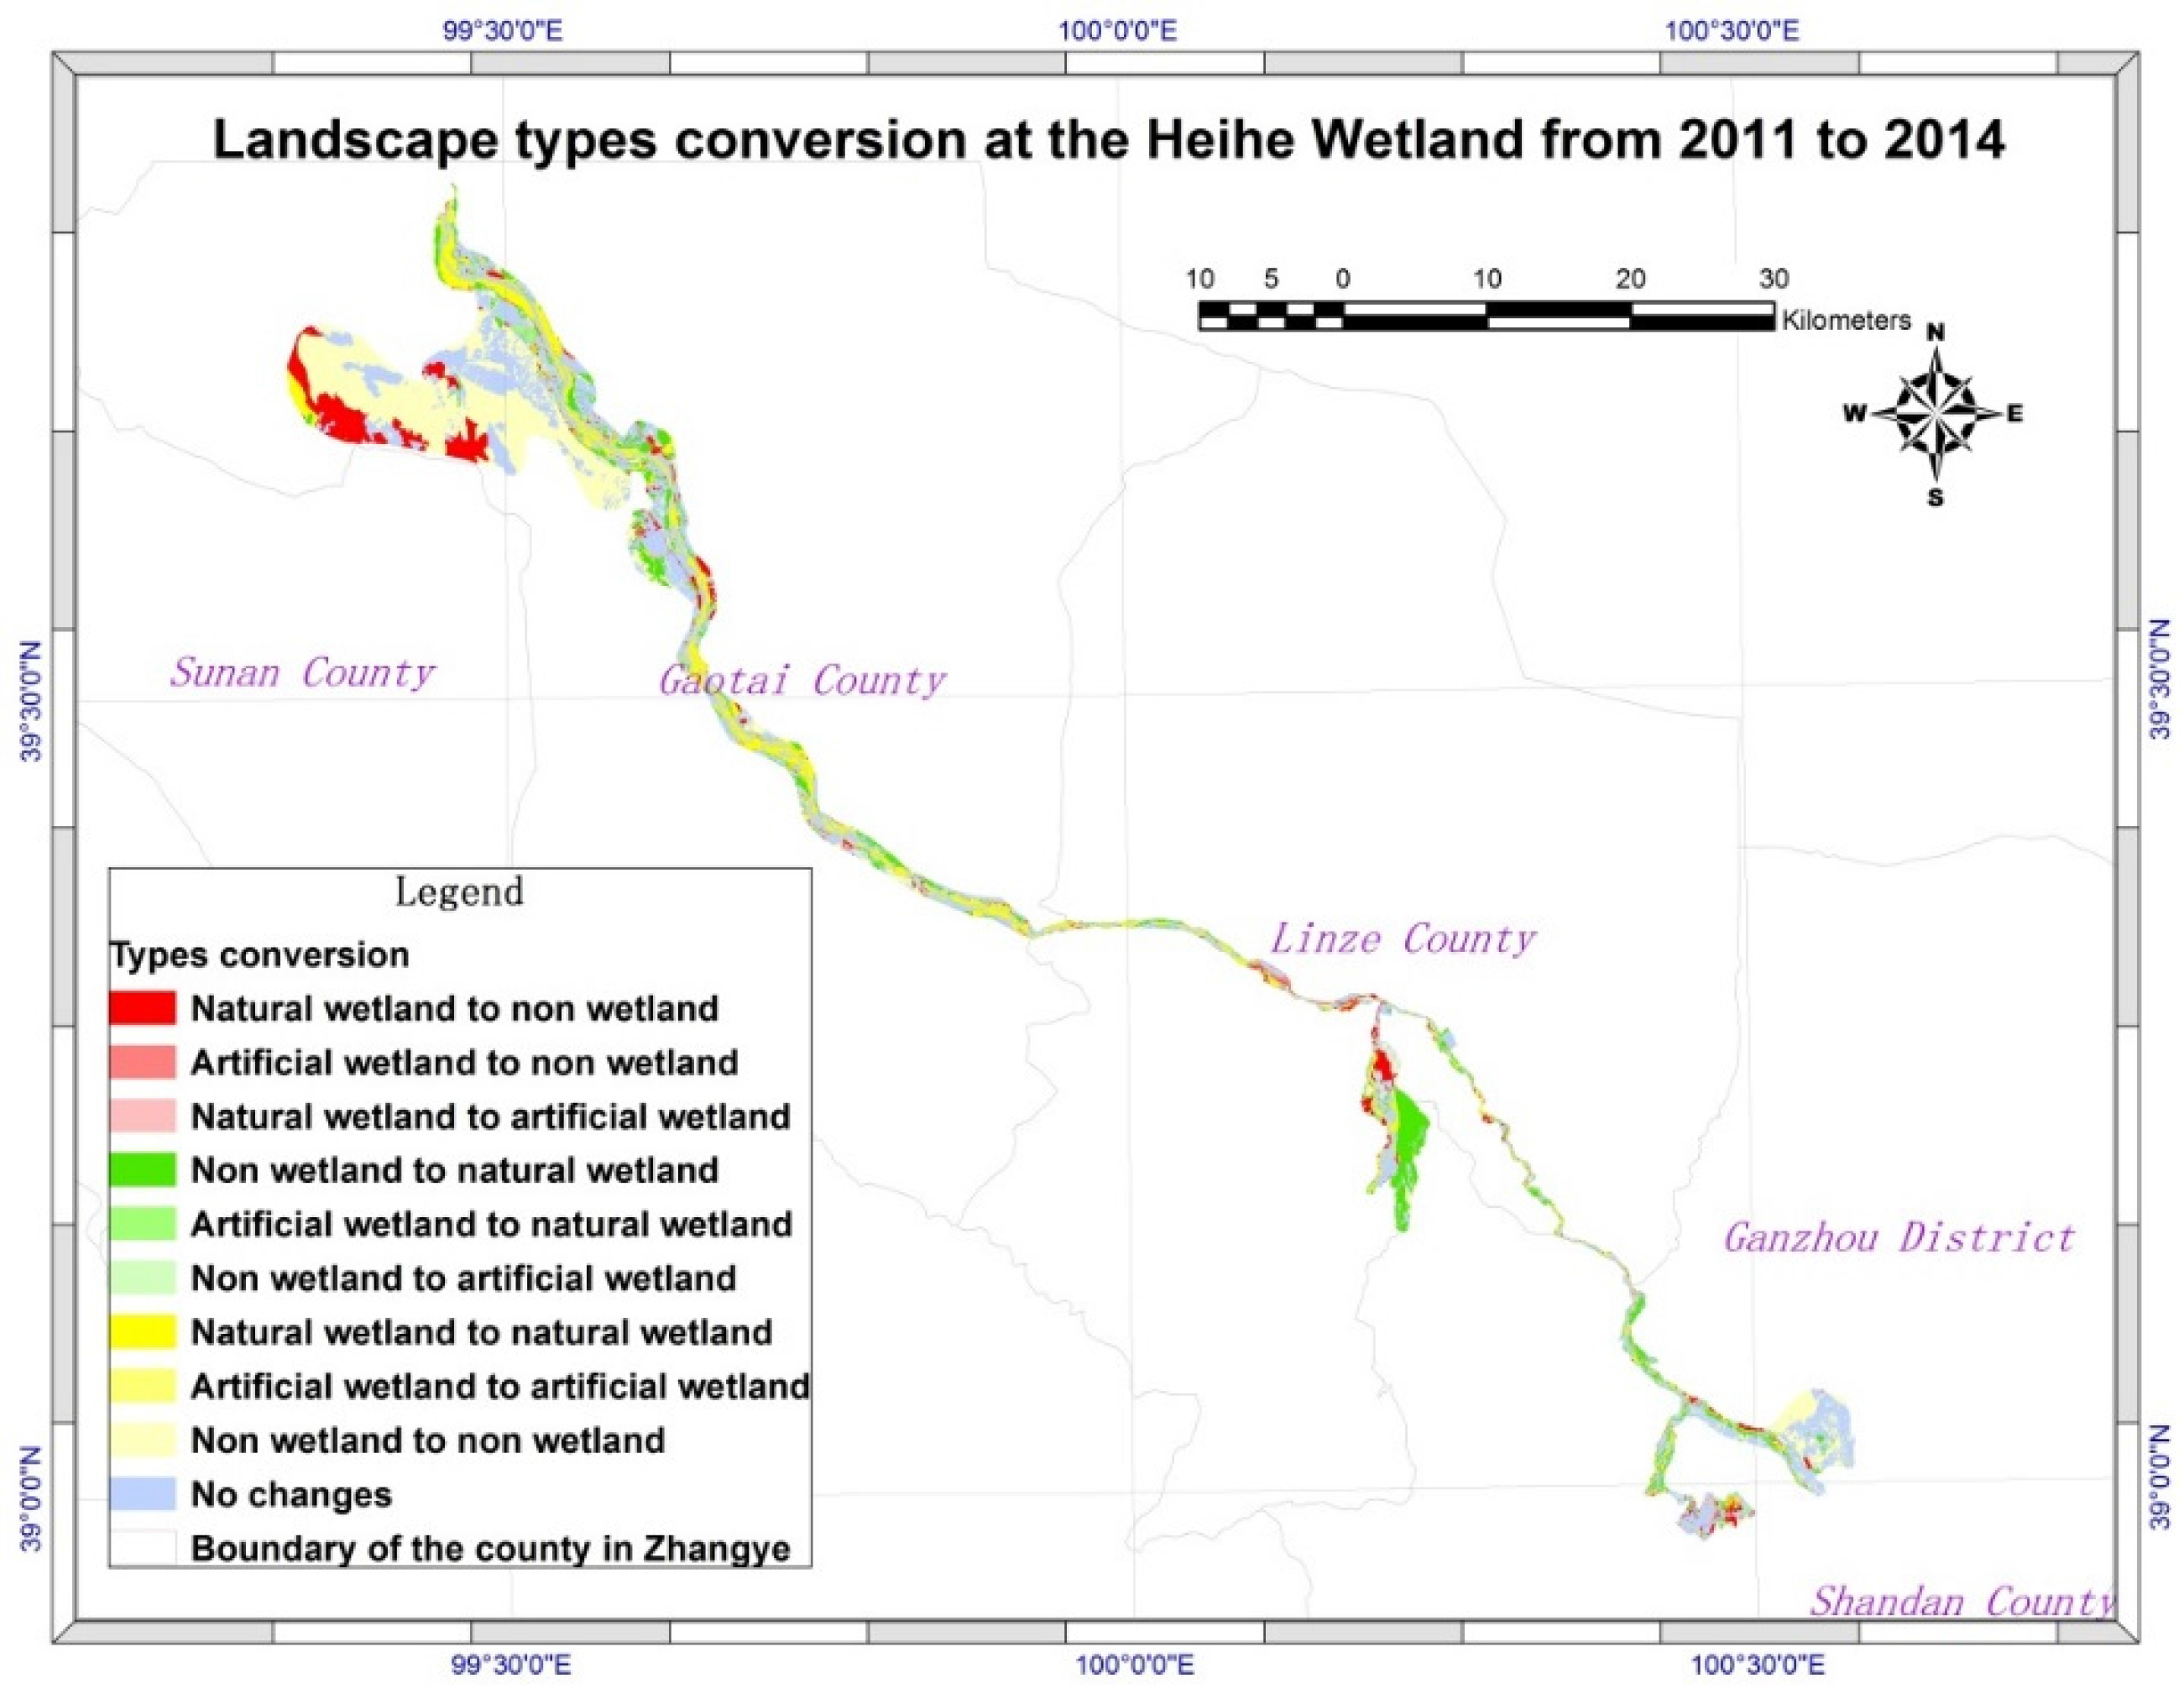
4.1.2. Dynamic Changes in the Land Cover Types in the HRB Wetland Landscape
4.1.3. Characteristics of Spatial Pattern Evolution of Wetland Landscape
4.2. Dynamic Changing Process of Landscape Patterns in the HRB Since 2000s
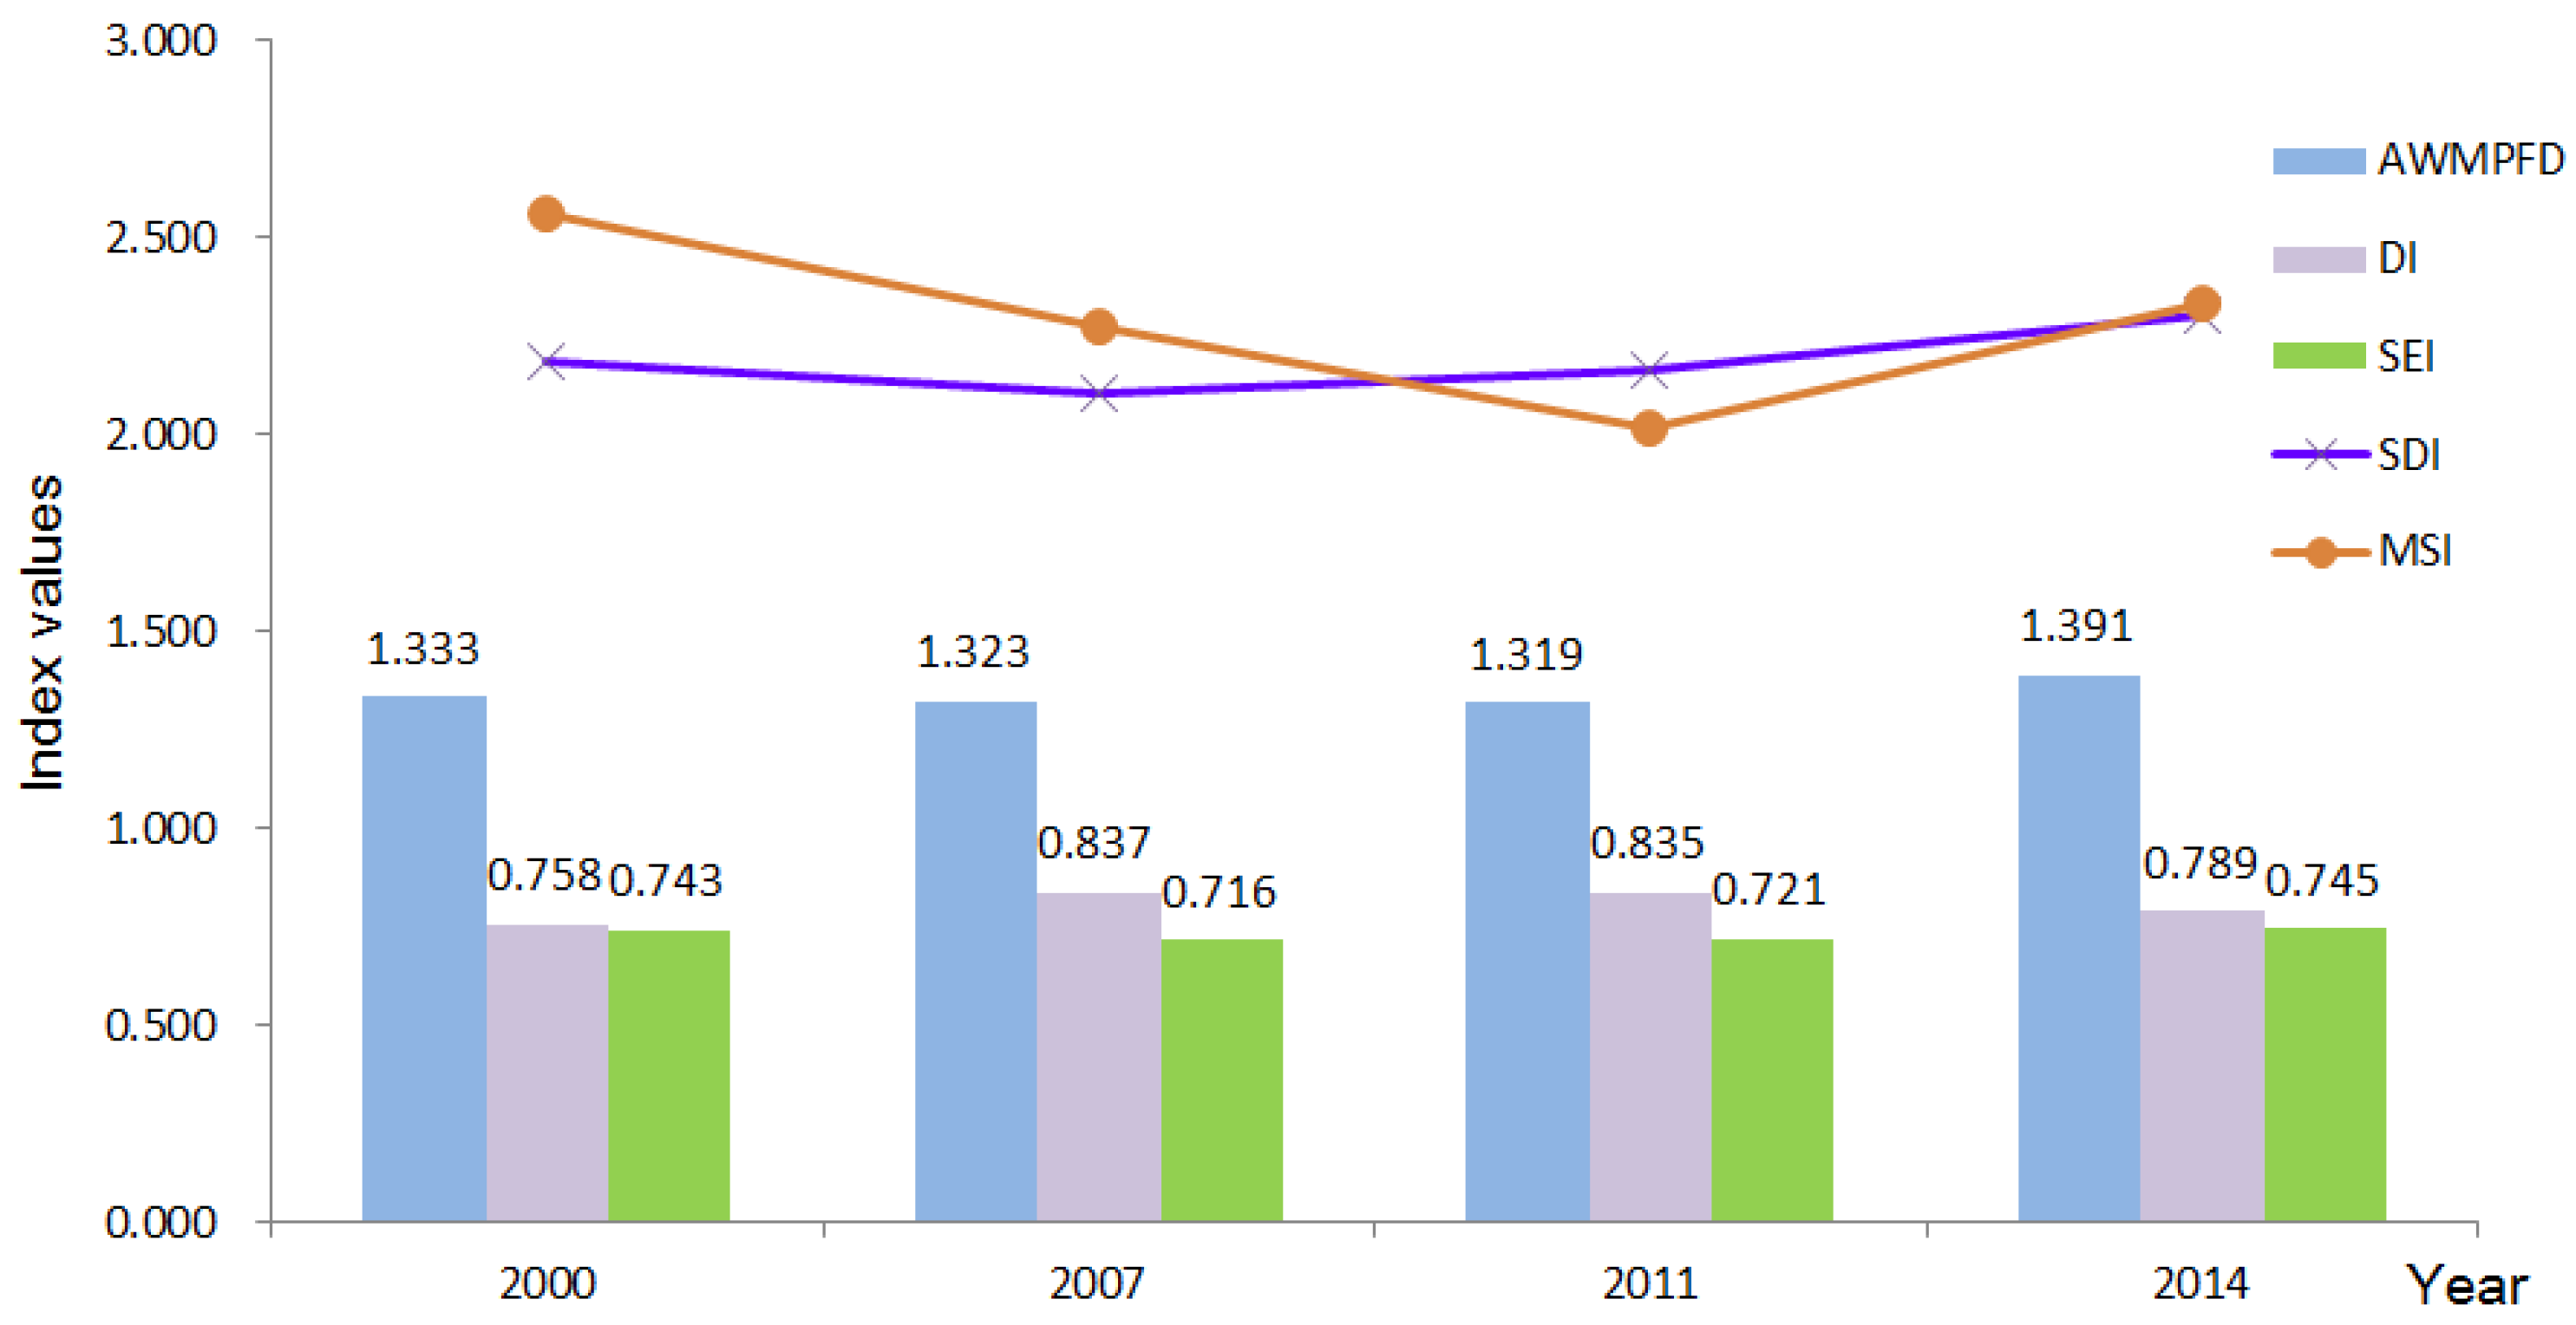
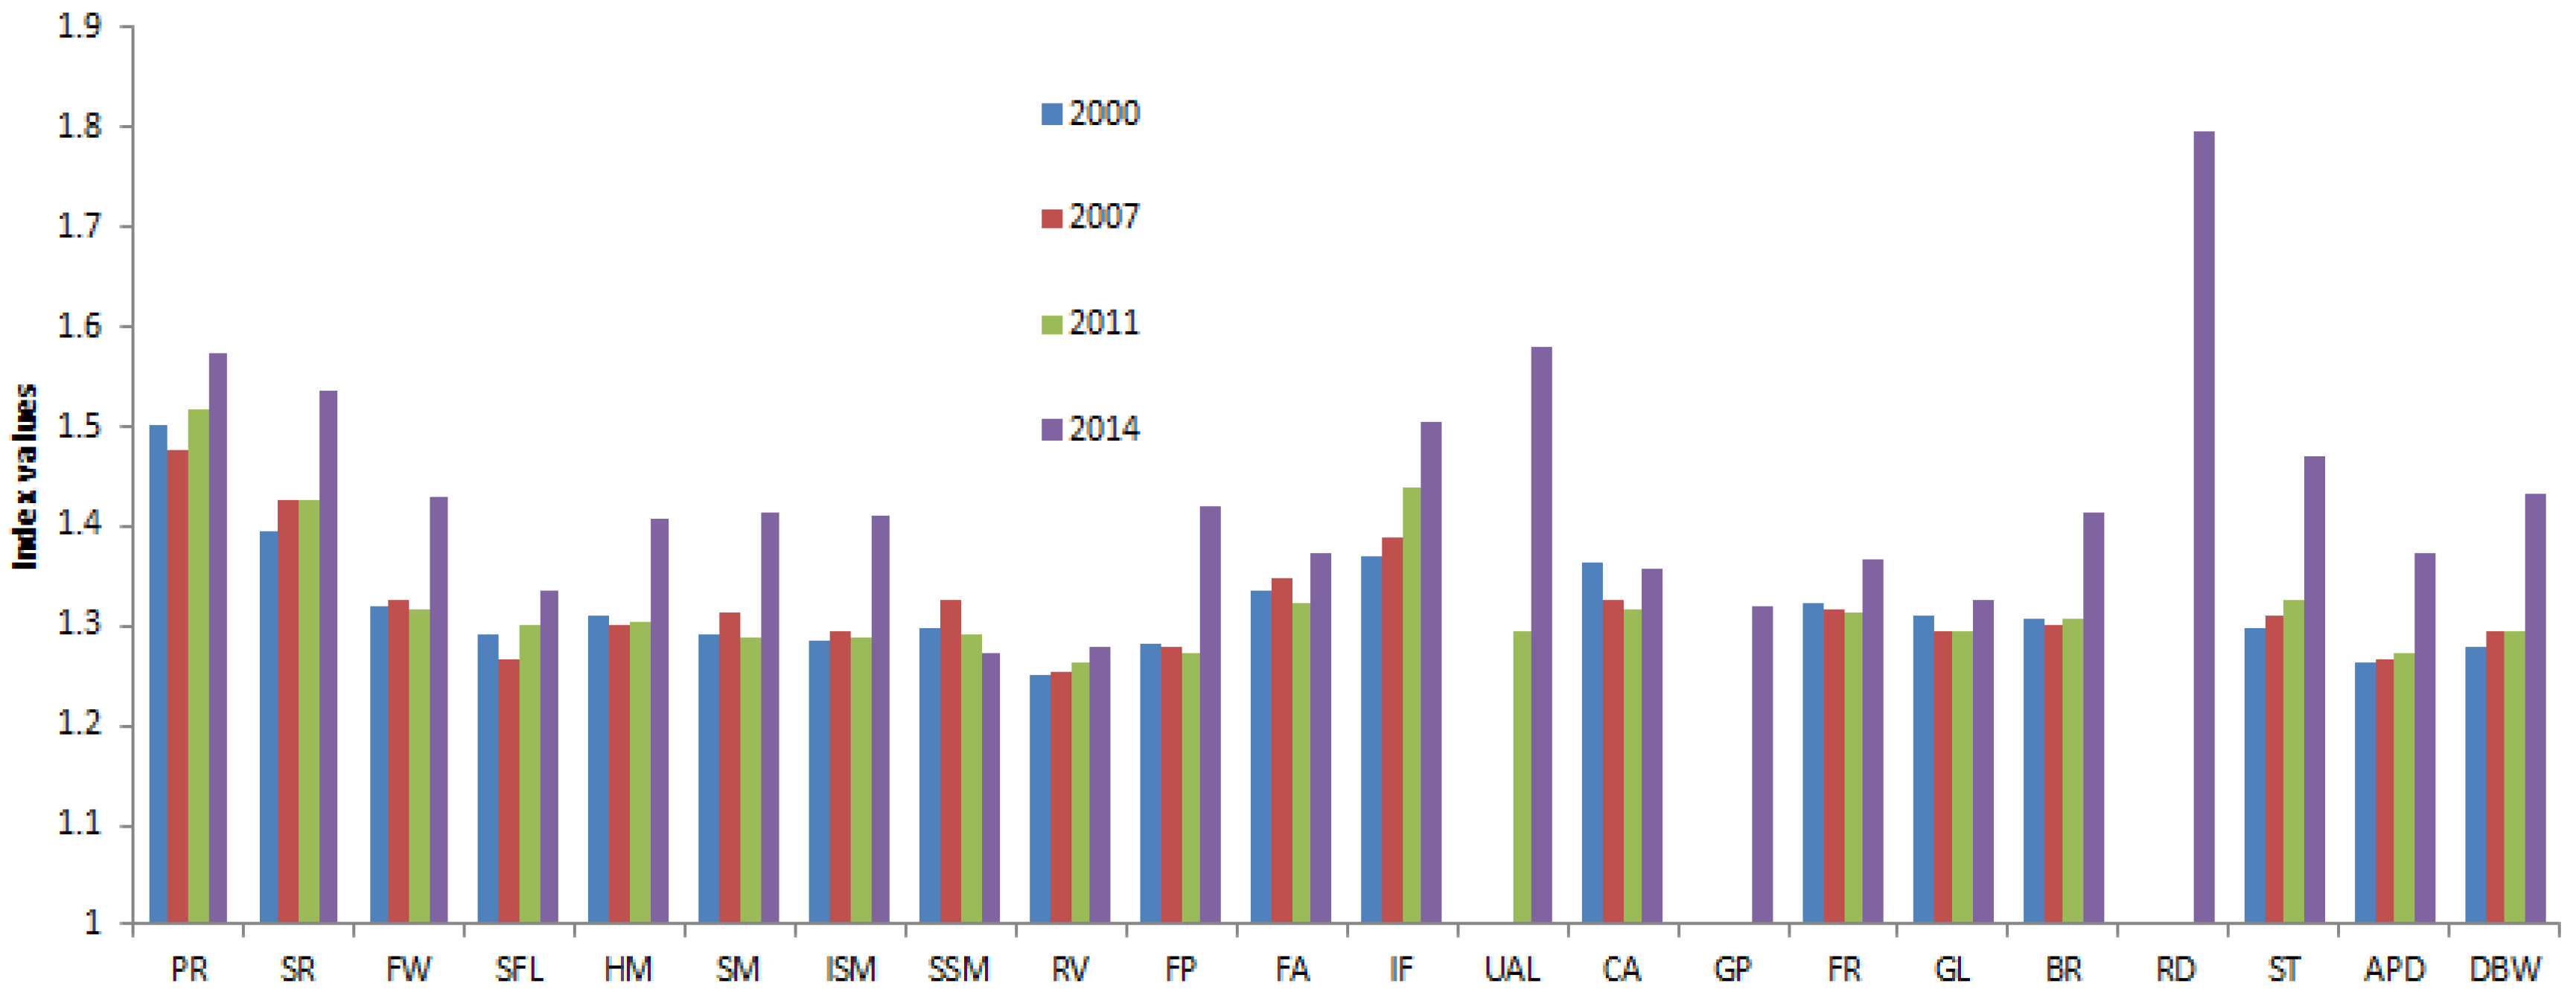
4.2.1. The Patch Type Scale Status of Landscape Patterns and Its Variation Characteristics
4.2.2. The Variation Characteristics of Landscape Pattern and Scale
4.3. The Dynamics Trend Analysis on Wetland Vegetation Cover
5. Discussion
5.1. The Impact of Natural Factors on the Dynamic Changes in Wetland Resources in the HRB
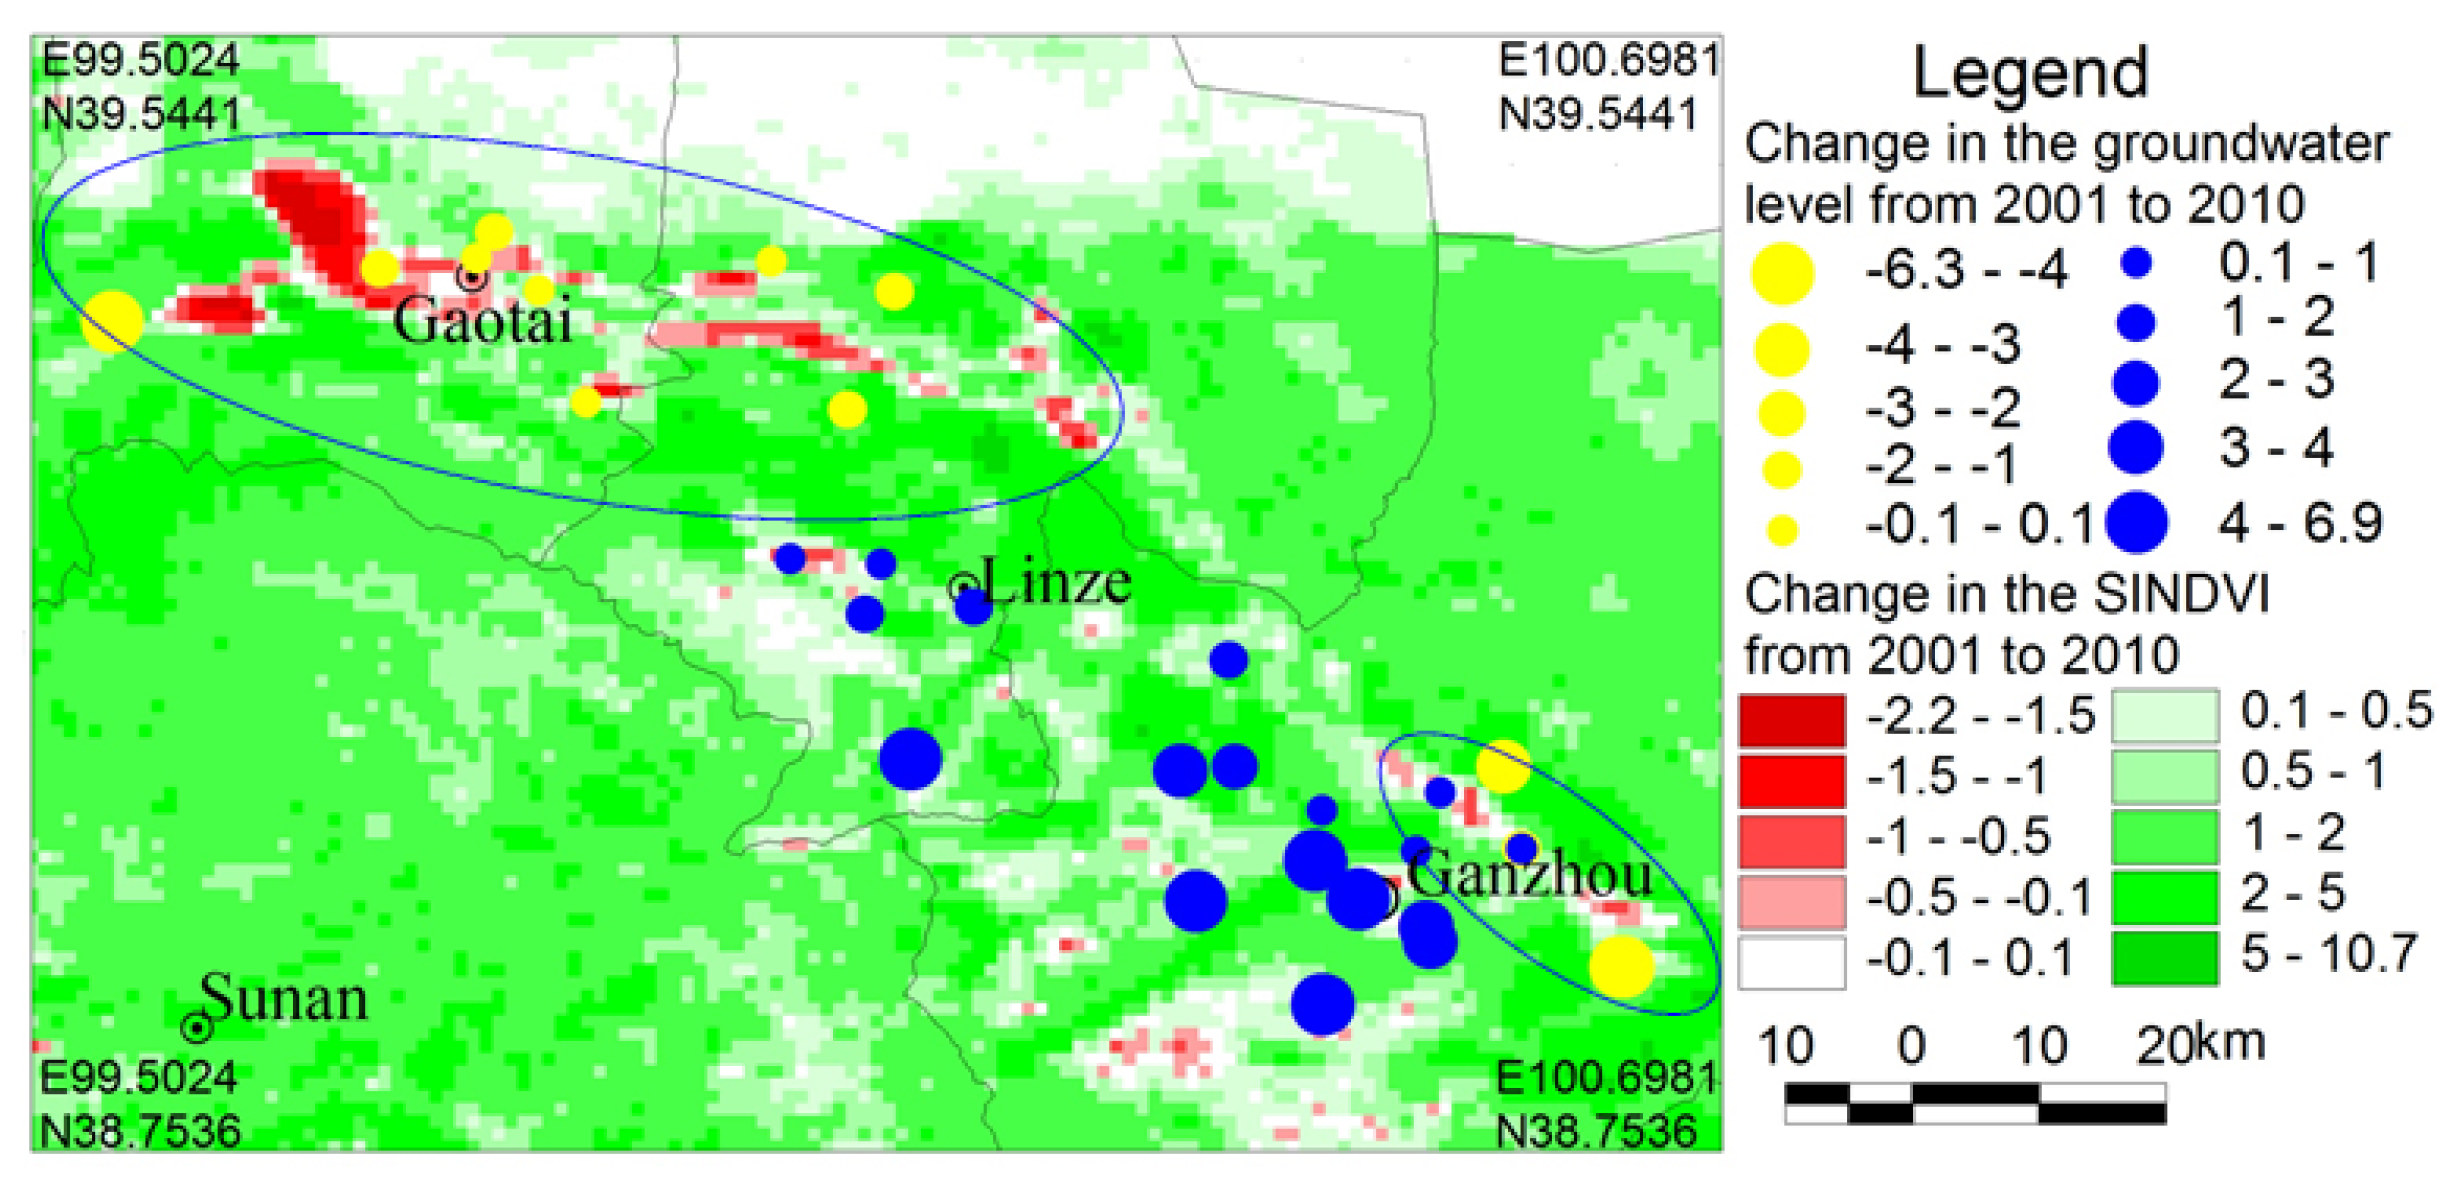
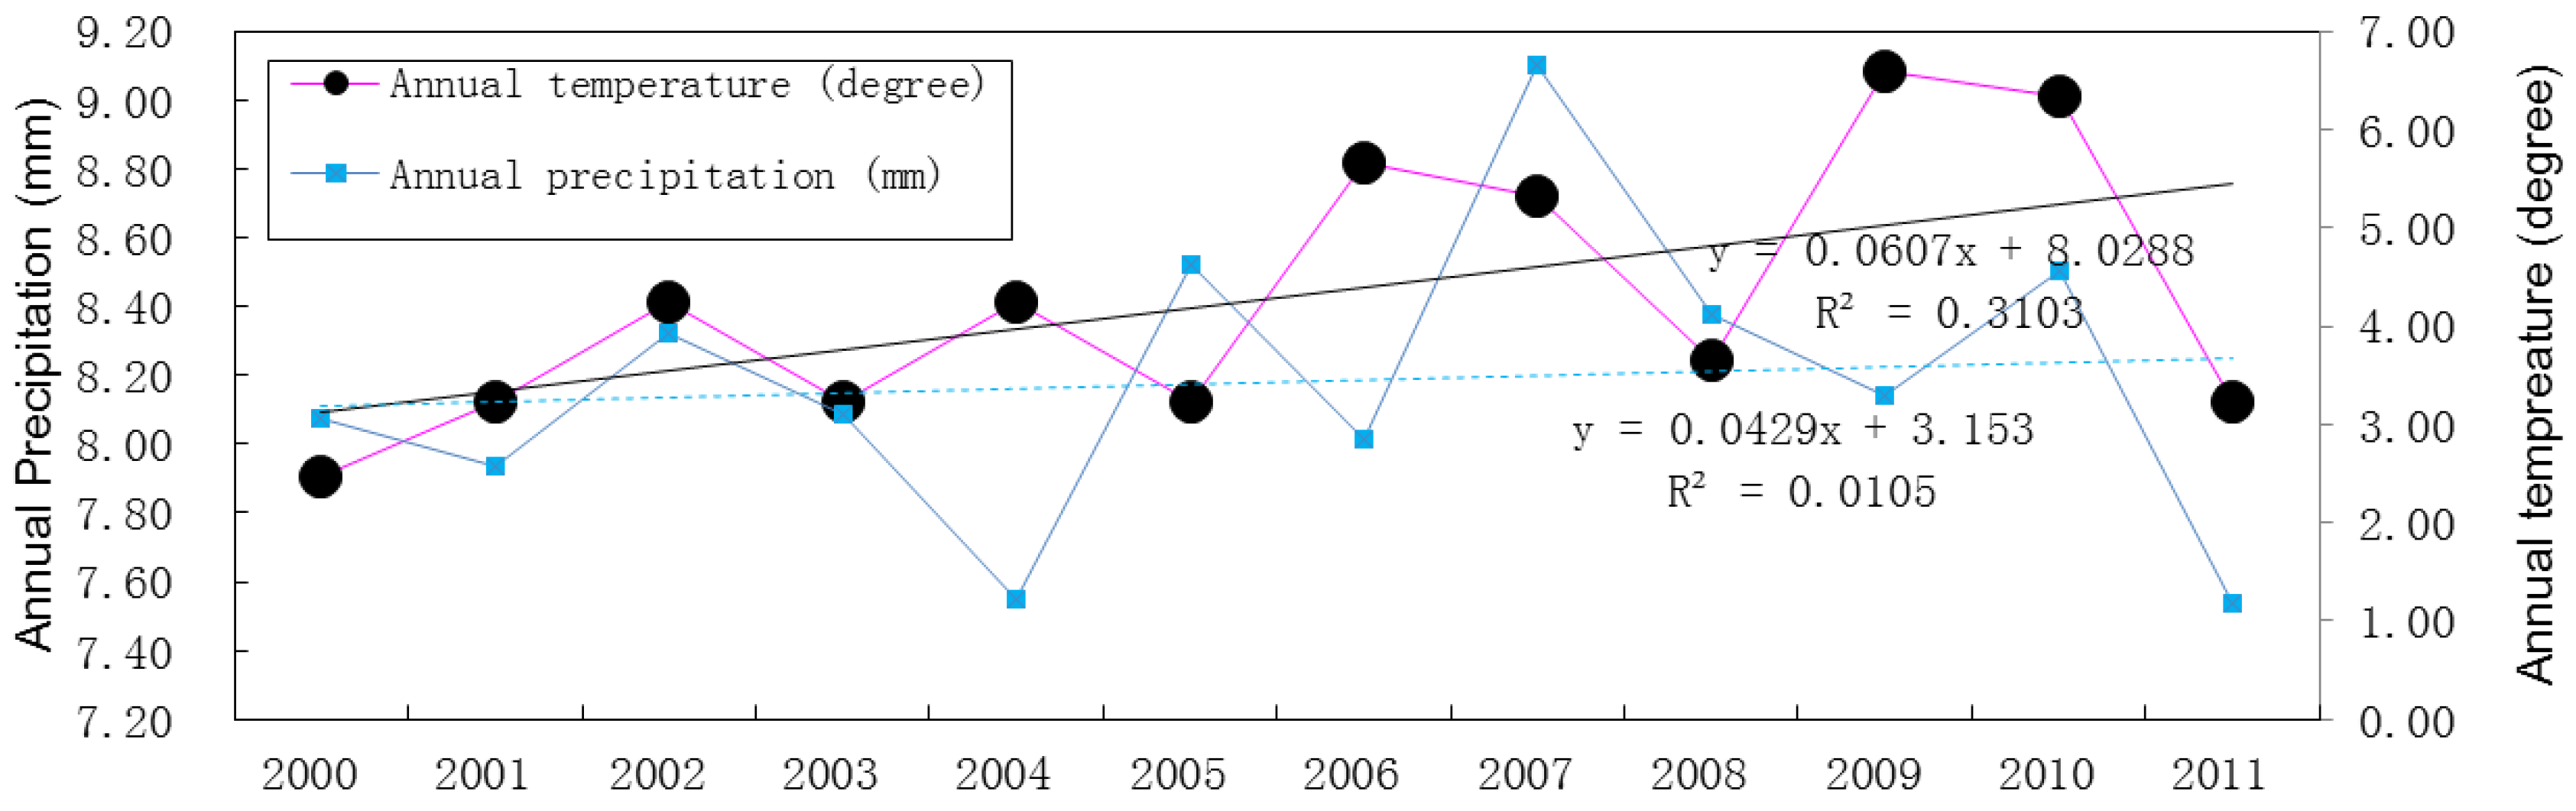
5.1.1. Climate Variation
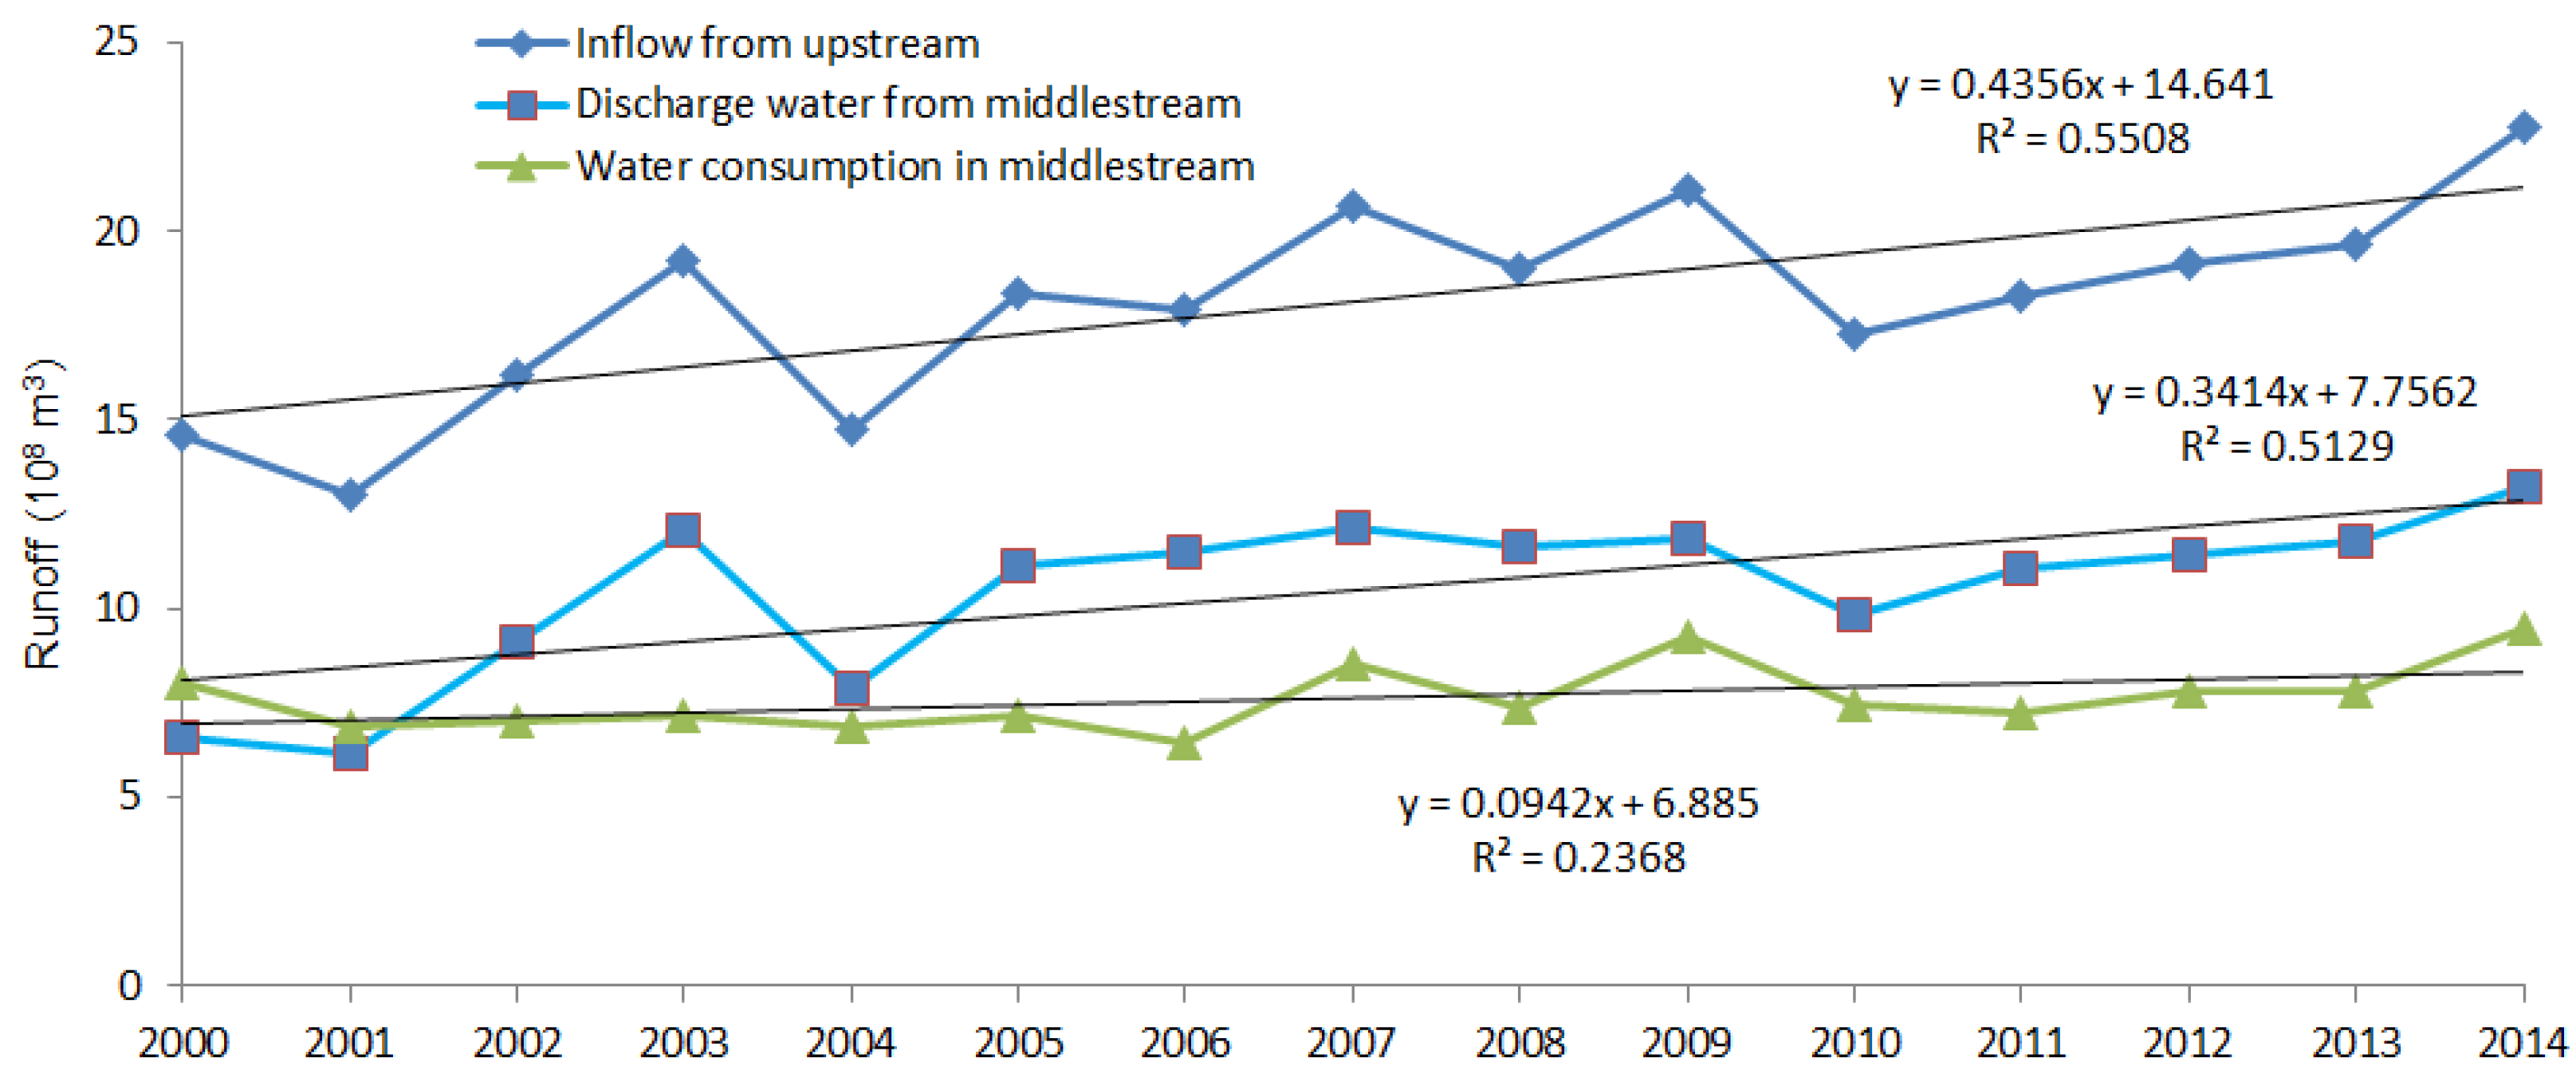
5.1.2. The Change in Upstream Inflow and Midstream Consumption in the HRB
5.2. Influence of Human Factors on the Dynamic Changes in Wetland Resources in the HRB
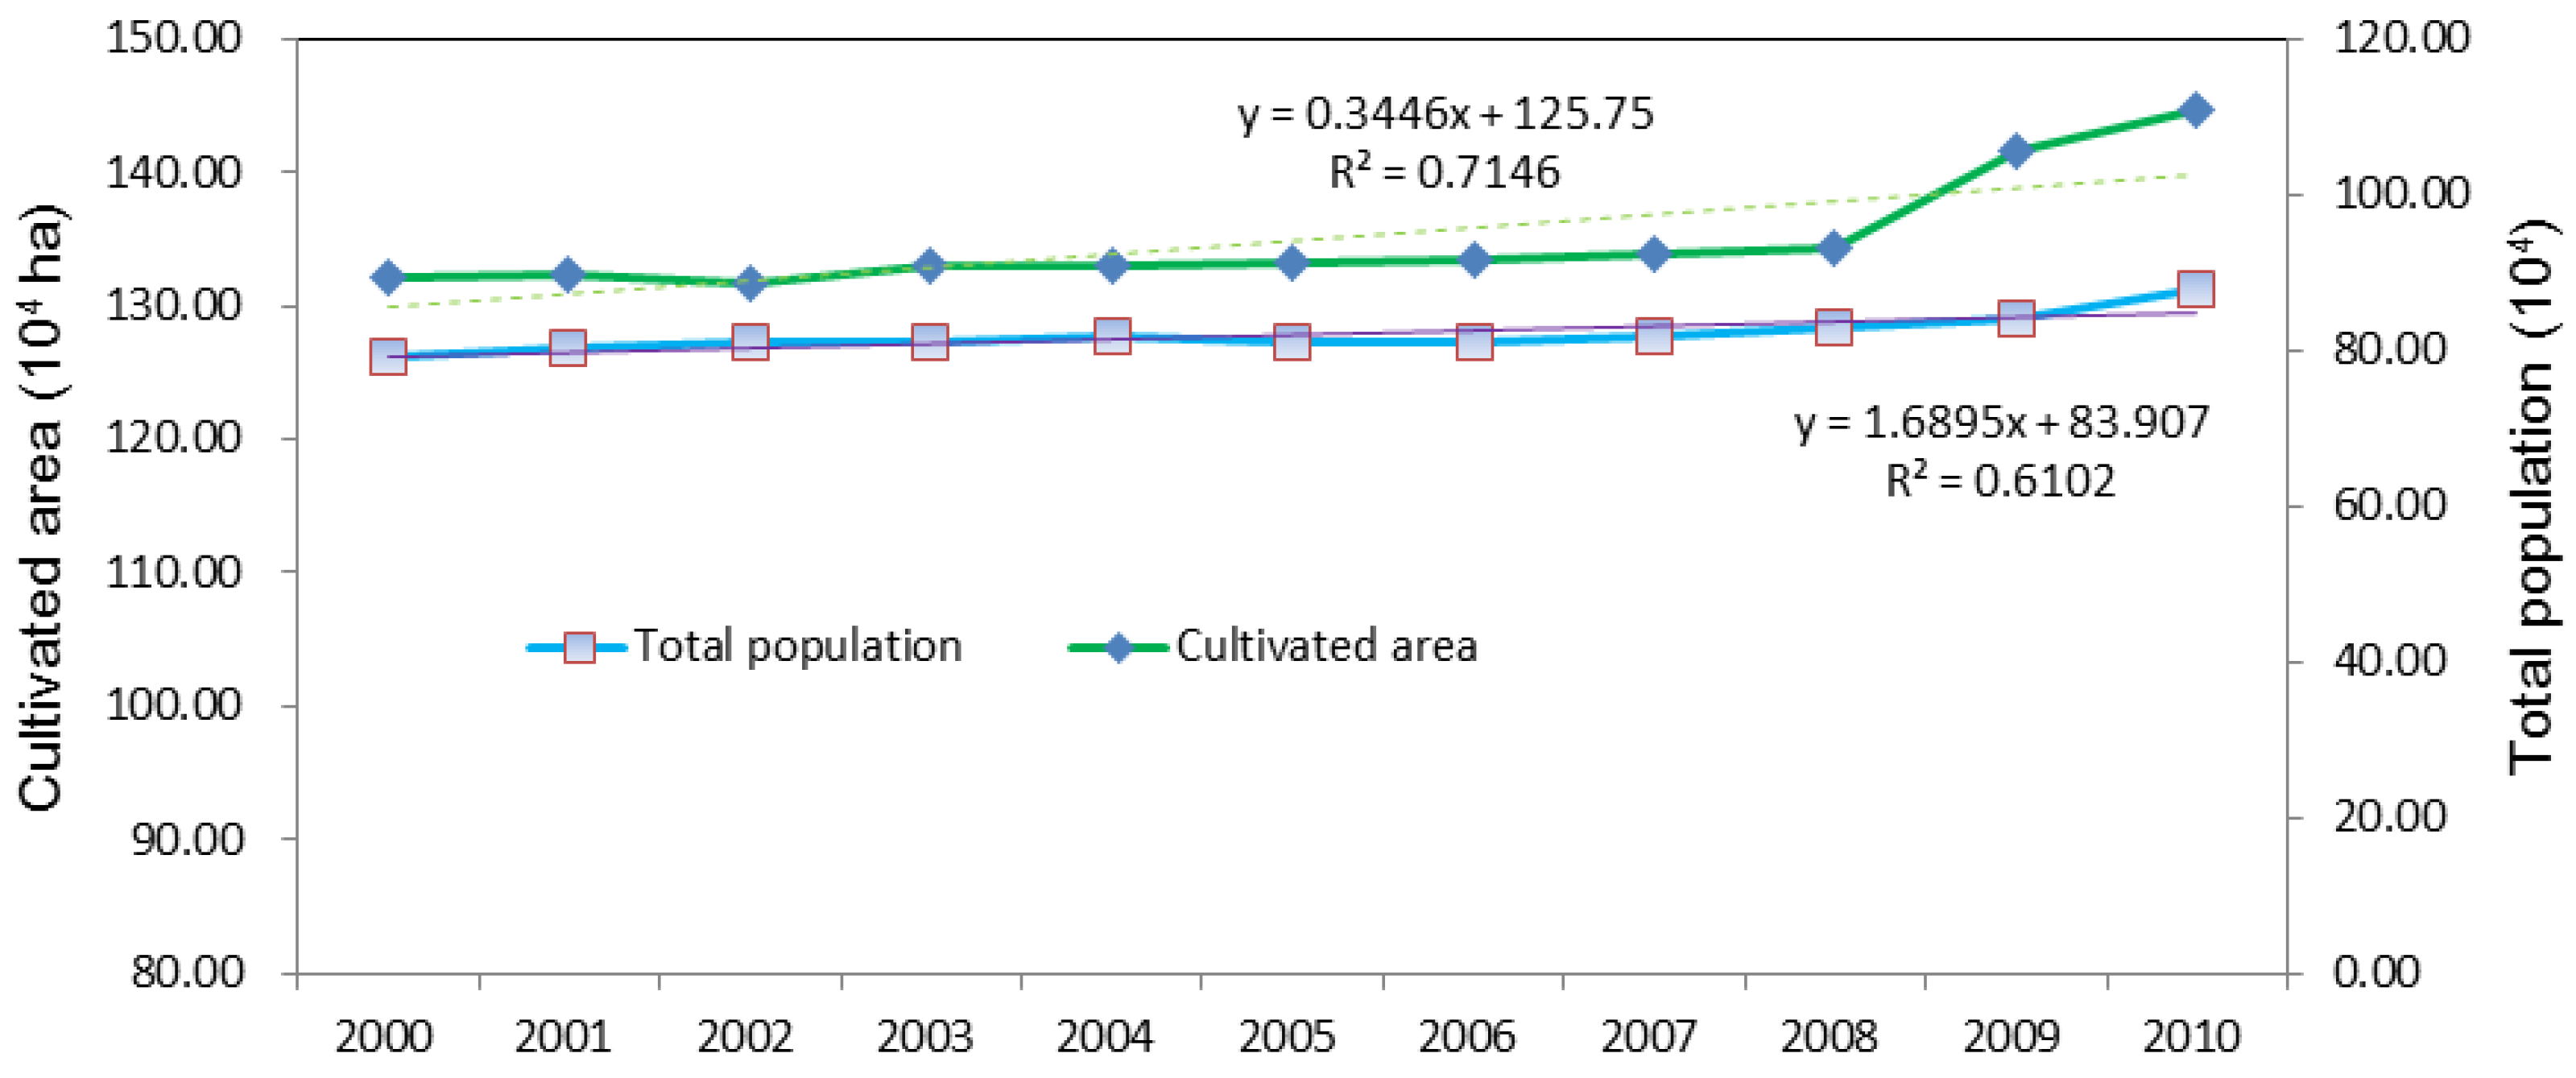
5.2.1. Population Growth, Cultivated Land Increase and Planting Structure Adjustment
5.2.2. Variation in the Utilization of Water Resources
5.2.3. Policy Influences
5.3. Implications of the Wetland Dynamics on Wetland Protection and Water Resource Managment
6. Conclusions
- We monitored the spatial-temporal dynamic changes in wetland resources for the last 15 years in the reserve by applying images of four phases (2000, 2007, 2011 and 2014) and using 2000 as the benchmark year. The results showed that the change in wetland area generally presented a trend of slow increasing after an initial decreasing, and the characteristics of the phase could be clearly observed. From 2000 to 2007, wetland areas greatly decreased, and wetland degradation was severe. From 2007 to 2011, the area was still decreasing; however, the degradation had slowed. Since 2011, wetland areas had tended to slowly increase, indicating that wetland restoration projects had achieved initial successes in Zhangye, the wetland ecological environment had been improved, and the wetland degradation had been relieved to some degree. However, compared to the benchmark year, i.e., 2000, relatively speaking, the total wetland area continued to decrease. From 2000 to 2014, the total area of the wetland decreased by 2959.13 hectares during the last 15 years, with an average annual reduction rate as high as −1.09%.
- A detailed analysis of the driving forces of the wetland dynamic variations was conducted based on two aspects: natural factors and human factors. The main impact factors, including changes in climatic conditions, upper reach water inflow, population, water resources, and cultivated land, as well as policy influences were analyzed. Thus, it was found that the dynamic changing process of wetland resources was the result of concurrent activities between nature and human activities. The growth in wetland vegetation and the natural distribution of wetland landscapes have been affected by natural factors through water resource changes. However, the natural landscape of wetlands had been significantly altered by human activities and social factors such as water source management policies, engineering measures for wetland protection and wetland park constructions, consequently influencing landscape planning and layout in both the reserve and the wetland park.
Supplementary Materials
Acknowledgments
Author Contributions
Conflicts of Interest
References
- Mitsch, W.; Gosselink, J. Wetland; John Willey & Sons: Hoboken, NJ, USA, 2007; pp. 287–288. [Google Scholar]
- Root, T.L.; Price, J.T.; Hall, K.R.; Schneider, S.H.; Rosenzweig, C.; Pounds, J.A. Fingerprints of global warming on wild animals and plants. Nature 2003, 421, 57–60. [Google Scholar] [CrossRef] [PubMed]
- Nicholls, R.J. Coastal flooding and wetland loss in the 21st century: Changes under the SRES climate and socio-economic scenarios. Glob. Environ. Chang. 2004, 14, 69–86. [Google Scholar] [CrossRef]
- Balmford, A.; Bruner, A.; Copper, P.; Costanza, R.; Farber, S.; Green, R.E.; Jenkins, M.; Jefferiss, P.; Jessamy, V.; Madden, J.; et al. Economic reasons for conserving wild nature. Science 2002, 297, 950–953. [Google Scholar] [CrossRef] [PubMed]
- Dahl, T.E. Wetlands Losses in the United States, 1780s–1980s; Fish and Wildlife Service: Washington DC, USA, 1990; pp. 1–13. [Google Scholar]
- Dahl, T.E. Status and Trends of Wetlands in the Conterminous United States 2004–2009; US Department of the Interior, US Fish and Wildlife Service: Washinton DC, USA, 2011; pp. 1–108.
- Westerberg, V.H.; Lifran, R.; Olsen, S.B. To restore or not? A valuation of social and ecological functions of the Marais des Baux wetland in Southern France. Ecol. Econ. 2010, 69, 2383–2393. [Google Scholar] [CrossRef]
- Wang, Z.; Huang, N.; Luo, L.; Li, X.; Ren, C.; Song, K.; Chen, J.M. Shrinkage and fragmentation of marshes in the West Songnen Plain, China, from 1954 to 2008 and its possible causes. Int. J. Appl. Earth Obs. Geoinf. 2011, 13, 477–486. [Google Scholar] [CrossRef]
- Song, K.; Wang, Z.; Li, L.; Tedesco, L.; Li, F.; Jin, C.; Du, J. Wetlands shrinkage, fragmentation and their links to agriculture in the Muleng–Xingkai Plain, China. J. Environ. Manag. 2012, 111, 120–132. [Google Scholar] [CrossRef] [PubMed]
- Megan, K.; Peyre, M.L.; Reams, A.; Mendelssohn, I.A. Linking actions to outcomes in wetland management: An overview of U.S. state wetland management. Wetlands 2001, 21, 66–74. [Google Scholar]
- Gong, P.; Niu, Z.G.; Cheng, X.; Zhao, K.Y.; Zhou, D.M.; Guo, J.K.; Liang, L.; Wang, X.F.; Li, D.D.; Huang, H.B.; et al. China’s wetland change (1990–2000) determined by remote sensing. Sci. China Earth Sci. 2010, 53, 1036–1042. [Google Scholar] [CrossRef]
- Rebelo, L.M.; Finlayson, C.M.; Nagabhatla, N. Remote sensing and GIS for wetland inventory, mapping and change analysis. J. Environ. Manag. 2009, 90, 2144–2153. [Google Scholar] [CrossRef] [PubMed]
- Niu, Z.; Gong, P.; Cheng, X.; Guo, J.; Wang, L.; Huang, H.; Ying, Q. Geographical characteristics of China’s wetlands derived from remotely sensed data. Sci. China Earth Sci. 2009, 52, 723–738. [Google Scholar] [CrossRef]
- Kingsford, R.T.; Thomas, R.F. Use of satellite image analysis to track wetland loss on the Murrurnbidge river flood plain in arid Australia, 1975–1998. Water Sci. Technol. 2002, 45, 45–53. [Google Scholar] [PubMed]
- Davranche, A.; Lefebvre, G.; Poulin, B. Wetland monitoring using classification trees and SPOT-5 seasonal time series. Remote Sens. Environ. 2010, 114, 552–562. [Google Scholar] [CrossRef] [Green Version]
- Baker, C.; Lawrence, R.; Montagne, C.; Patten, D. Mapping wetlands and riparian areas using Landsat ETM+ imagery and decision-tree-based models. Wetlands 2006, 26, 465–474. [Google Scholar] [CrossRef]
- Wang, Z.; Zhang, B.; Zhang, S.; Li, X.; Liu, D.; Song, K.; Li, J.; Li, F.; Duan, H. Changes of land use and of ecosystem service values in Sanjiang Plain, Northeast China. Environ. Monit. Assess. 2006, 112, 69–91. [Google Scholar] [CrossRef] [PubMed]
- Jiang, L.L.; Xiong, D.Q.; Zhang, X.Y.; Zhang, H. Change of landscape pattern and its driving mechanism of the coastal wetland in Dalian city. J. Jilin Univ. (Earth Sci. Ed.) 2008, 38, 670–675. [Google Scholar]
- Gong, Z.N.; Zhang, Y.R.; Gong, H.L.; Zhao, W.J. Evolution of wetland landscape pattern and its driving factors in Beijing. Acta Geogr. Sin. 2011, 66, 77–88. [Google Scholar]
- Tong, L.; Xu, X.; Fu, Y.; Li, S. Wetland Changes and Their Responses to Climate Change in the “Three-River Headwaters” Region of China since the 1990s. Energies 2014, 7, 2515–2534. [Google Scholar] [CrossRef]
- Zhao, R.F.; Chen, Y.N.; Zhou, H.R.; Li, Y.Q.; Qian, Y.B.; Zhang, L.H. Assessment of wetland fragmentation in the Tarim River basin, western China. Environ. Geol. 2009, 57, 455–464. [Google Scholar] [CrossRef]
- Lu, L.; Li, X.; Cheng, G.D. Landscape evolution in the middle Heihe river basin of northwest China during the last decade. J. Arid Environ. 2003, 53, 395–408. [Google Scholar] [CrossRef]
- Zhao, F.R.; Jiang, P.H.; Zhao, H.L.; Xie, Z.L.; Jin, J.L. Effect of Land Use-Cover Change on Landscape Fragmentation of Zhangye Heihe National Wetland Nature Reserve. J. Nat. Resour. 2013, 28, 583–595. [Google Scholar]
- Kong, D.S.; Zhang, H. Economic value of wetland ecosystem services in the Heihe National Nature Reserve of Zhangye. Acta Ecol. Sin. 2015, 35, 972–983. [Google Scholar]
- USGS Global Visualization Viewer. Available online: http://glovis.usgs.gov/ (accessed on 20 February 2016).
- Cold and Arid Regions Science Data Center at Lanzhou. Available online: http://westdc.westgis.ac.cn/ (accessed on 20 February 2016).
- Wang, H.B.; Ma, M.G.; Geng, L.Y. Monitoring the recent trend of aeolian desertification using Landsat TM and Landsat 8 imagery on the north-east Qinghai–Tibet Plateau in the Qinghai Lake basin. Nat. Hazards 2015, 79, 1753–1772. [Google Scholar] [CrossRef]
- Cerian, G.; Keys, J.S. Wetland conservation: Change and fragmentation in Trinidad’s prtected areas. Geoforum 2009, 40, 91–104. [Google Scholar]
- Liu, S.; Dong, Y.; Deng, L.; Liu, Q.; Zhao, H.; Dong, S. Forest fragmentation and landscape connectivity change associated with road network extension and city expansion: A case study in the Lancang River Valley. Ecol. Indic. 2014, 36, 160–168. [Google Scholar] [CrossRef]
- McGarigal, K.; Marks, B. FRAGSTATS: Spatial Analysis Program for Quantifying Landscape Structure; General Technical Report PNW-GTR-351; U.S. Department of Agriculture, Forest Service, Pacific Northwest Research Station: Portland, OR, USA, 1995.
- Baldi, G.; Guerschman, J.P.; Paruelo, J.M. Characterizing fragmentation in temperate South America grasslands. Agric. Ecosyst., Environ. 2006, 116, 197–208. [Google Scholar] [CrossRef]
- Song, Y.; Ma, M.G. A statistical analysis of relationship between climatic factors and NDVI in China. Int. J. Remote Sens. 2011, 32, 3947–3965. [Google Scholar] [CrossRef]
- Stow, D.; Daeschner, S.; Hope, A.; Douglas, D.; Petersen, A.; Myneni, R.; Zhou, L.; Oechel, W. Variability of the Seasonally Integrated Normalized Difference Vegetation Index Across the North Slope of Alaska in the 1990s. Int. J. Remote Sens. 2003, 24, 1111–1117. [Google Scholar] [CrossRef]
- Ma, M.G.; Frank, V. Interannual variability of vegetation cover in the Chinese Heihe River Basin and its relation to meteorological parameters. Int. J. Remote Sens. 2006, 27, 3473–3486. [Google Scholar] [CrossRef]
- Guo, L.Y.; Wang, D.L.; Qiu, J.J.; Wang, L.G.; Liu, Y. Spatiotemporal patterns of land use change along the Bohai Rim in China during 1985–2005. J. Geogr. Sci. 2009, 19, 568–576. [Google Scholar] [CrossRef]
- Khaznadar, M.; Vogiatzakis, I.N.; Griffiths, G.H. Land degradation and vegetation distribution in Chott El Beida wetland, Algeria. J. Arid Environ. 2009, 73, 369–377. [Google Scholar] [CrossRef]
- Li, S.B.; Zhao, W.Z. Landscape pattern changes of desert oasis wetlands in the middle reach of the Heihe River, China. Arid Land Res. Manag. 2010, 24, 253–262. [Google Scholar] [CrossRef]
- Su, J.Q.; Wang, X. Review on impacts of climate change on wetland landscape patterns. Environ. Sci. Technol. 2012, 35, 74–81. [Google Scholar]
- Wang, P.; Li, Z.; Gao, W. Rapid shrinking of glaciers in the Middle Qilian Mountain region of Northwest China during the last 50 years. J. Earth Sci. 2011, 22, 539–548. [Google Scholar] [CrossRef]
- Wang, Y.; Yang, D.; Lei, H.; Yang, H. Impact of cryosphere hydrological processes on the river runoff in the upper reaches of Heihe River. J. Hydraul. Eng. 2015, 46, 1064–1071. [Google Scholar]
- He, C.C.; Zhang, Z.C. Zhangye Almanac; Gansu Culture Press: Lanzhou, China, 2009; pp. 1–20. [Google Scholar]
- Ge, Y.C.; Li, X.; Tian, W.; Zhang, Y.; Wang, W.; Hu, X. The impacts of water delivery on artificial hydrological circulation system of the middle reaches of the Heihe River basin. Adv. Earth Sci. 2014, 29, 285–294. [Google Scholar]
- Hu, X.; Lu, L.; Li, X.; Wang, J.; Lu, X. Ejin Oasis Land Use and Vegetation Change between 2000 and 2011: The Role of the Ecological Water Diversion Project. Energies 2015, 8, 7040–7057. [Google Scholar] [CrossRef]
- Li, Q.S.; Zhao, W.Z. Effect of Water Allocation of the Heihe River on Plan Structure and Stable Development of the Ecosystem in the Linze Oasis, Gansu—A Case Study in the Pingchuan Irrigation District in Linze County at the middle reaches of the Heihe River. J. Glaciol. Geocryol. 2004, 26, 333–343. [Google Scholar]
- Shi, M.J.; Wang, L.; Wang, X.J. A Study on Changes and Driving Factors of Agricultural Water Supply and Demand in Zhangye after Water Reallocation of the Heihe River. Resour. Sci. 2011, 33, 1489–1497. [Google Scholar]
- Na, X.D. Monitoring of the Typical Wetland Natural Reserve Area by Remote Sensing in the Northeastern China; Science Press: Beijing, China, 2014; pp. 99–100. [Google Scholar]
- Wang, J.F.; Chang, X.X. Change Trend of Groundwater Depth in Linze County in Middle Reaches of the Heihe River Basin in Recent 30 Years. Arid Zone Res. 2013, 30, 594–602. [Google Scholar]
- Zhang, Y. Effects of water conservancy and irrigation works on the ecology and hydrology in Taoer River Basin. J. Arid Resour. Environ. 2006, 20, 133–137. [Google Scholar]
- Li, X.; Wang, Z.; Song, K.; Zhang, B.; Liu, D.; Guo, Z. Assessment for salinized wasteland expansion and land use change using GIS and remote sensing in the west part of Northeast China. Environ. Monit. Assess. 2007, 131, 421–437. [Google Scholar] [CrossRef] [PubMed]
- Hu, X.; Lu, L.; Li, X.; Wang, J.; Guo, M. Land Use/Cover Change in the Middle Reaches of the Heihe River Basin over 2000–2011 and Its Implications for Sustainable Water Resource Management. PLoS One 2015, 10, e0128960. [Google Scholar] [CrossRef] [PubMed]
- Wang, Z.Q.; Zhang, B.; Yu, L.; Zhang, S.; Wang, Z. Study on LUCC and the ecological security response of wetlands in western Jilin Province. Arid Zone Res. 2006, 23, 419–426. [Google Scholar]
- David, G.A.; Viedma, O.; Sánchez-Carrillo, S.; Alvarez-Cobelas, M. Conservation issues of temporary wetland Branchiopoda (Anostroca, Notostraca: Crustacea) in a semiarid agricultural landscape: What spatial scales are relevant? Biol. Conserv. 2008, 141, 1224–1234. [Google Scholar]
- Wei, Z.; Jin, H.H.; Lan, Y.C.; Hu, X.L.; Wu, J.K.; Yang, S.Z.; Ji, Y.J. Analysis of the change of groundwater reseources due to water allocation in the irrigation areas on the middle Heihe River. J. Glaciol. Geocryol. 2008, 30, 344–350. [Google Scholar]


| Wetland Types | 2000–2007 Year | 2007–2011 Year | 2011–2014 Year | ||||||
|---|---|---|---|---|---|---|---|---|---|
| 2000 Area (ha) | Variation (ha) | Rate of change (%) | 2007 Area (ha) | Variation (ha) | Rate of change (%) | 2011 Area (ha) | Variation (ha) | Rate of change (%) | |
| River wetland | 10036.73 | −2935.23 | −4.18 | 7101.51 | −593.48 | −2.09 | 6508.03 | −634.87 | −13.51 |
| Lake Wetland | 83.01 | −26.29 | −4.52 | 56.73 | −23.93 | −10.55 | 32.79 | 55.63 | 56.55 |
| Marsh Wetland | 7823.94 | −15.29 | −0.03 | 7808.65 | −132.70 | −0.42 | 7675.95 | 1226.59 | 337.97 |
| Constructed Wetlands | 1422.65 | −142.93 | −1.44 | 1279.71 | 181.44 | 3.54 | 1461.16 | 81.92 | 221.39 |
| Total area Wetland | 19366.34 | −3119.73 | −2.30 | 16246.60 | −568.67 | −0.88 | 15677.93 | 729.27 | 602.39 |
| Year | Area-Weighted Mean Patch Fractal Dimension (AWMPFD) | Patch Density (PD) | Dominance Index (DI) | Species Diversity Index (SDI) | Species Evenness Index (SEI) | Mean Shape Index (MSI) | Mean Shape Size (MPS) | Patch Number (NumP) |
|---|---|---|---|---|---|---|---|---|
| 2000 | 1.333 | 0.016 | 0.758 | 2.187 | 0.743 | 2.562 | 63.250 | 660 |
| 2007 | 1.323 | 0.017 | 0.837 | 2.107 | 0.716 | 2.271 | 58.143 | 718 |
| 2011 | 1.319 | 0.021 | 0.835 | 2.161 | 0.721 | 2.015 | 47.212 | 883 |
| 2014 | 1.391 | 0.307 | 0.789 | 2.302 | 0.745 | 2.330 | 3.259 | 12797 |
© 2016 by the authors; licensee MDPI, Basel, Switzerland. This article is an open access article distributed under the terms and conditions of the Creative Commons by Attribution (CC-BY) license (http://creativecommons.org/licenses/by/4.0/).
Share and Cite
Wang, H.; Ma, M. Impacts of Climate Change and Anthropogenic Activities on the Ecological Restoration of Wetlands in the Arid Regions of China. Energies 2016, 9, 166. https://doi.org/10.3390/en9030166
Wang H, Ma M. Impacts of Climate Change and Anthropogenic Activities on the Ecological Restoration of Wetlands in the Arid Regions of China. Energies. 2016; 9(3):166. https://doi.org/10.3390/en9030166
Chicago/Turabian StyleWang, Haibo, and Mingguo Ma. 2016. "Impacts of Climate Change and Anthropogenic Activities on the Ecological Restoration of Wetlands in the Arid Regions of China" Energies 9, no. 3: 166. https://doi.org/10.3390/en9030166