
Francis Turbine Blade Design on the Basis of Port Area and Loss Analysis


Abstract
:1. Introduction
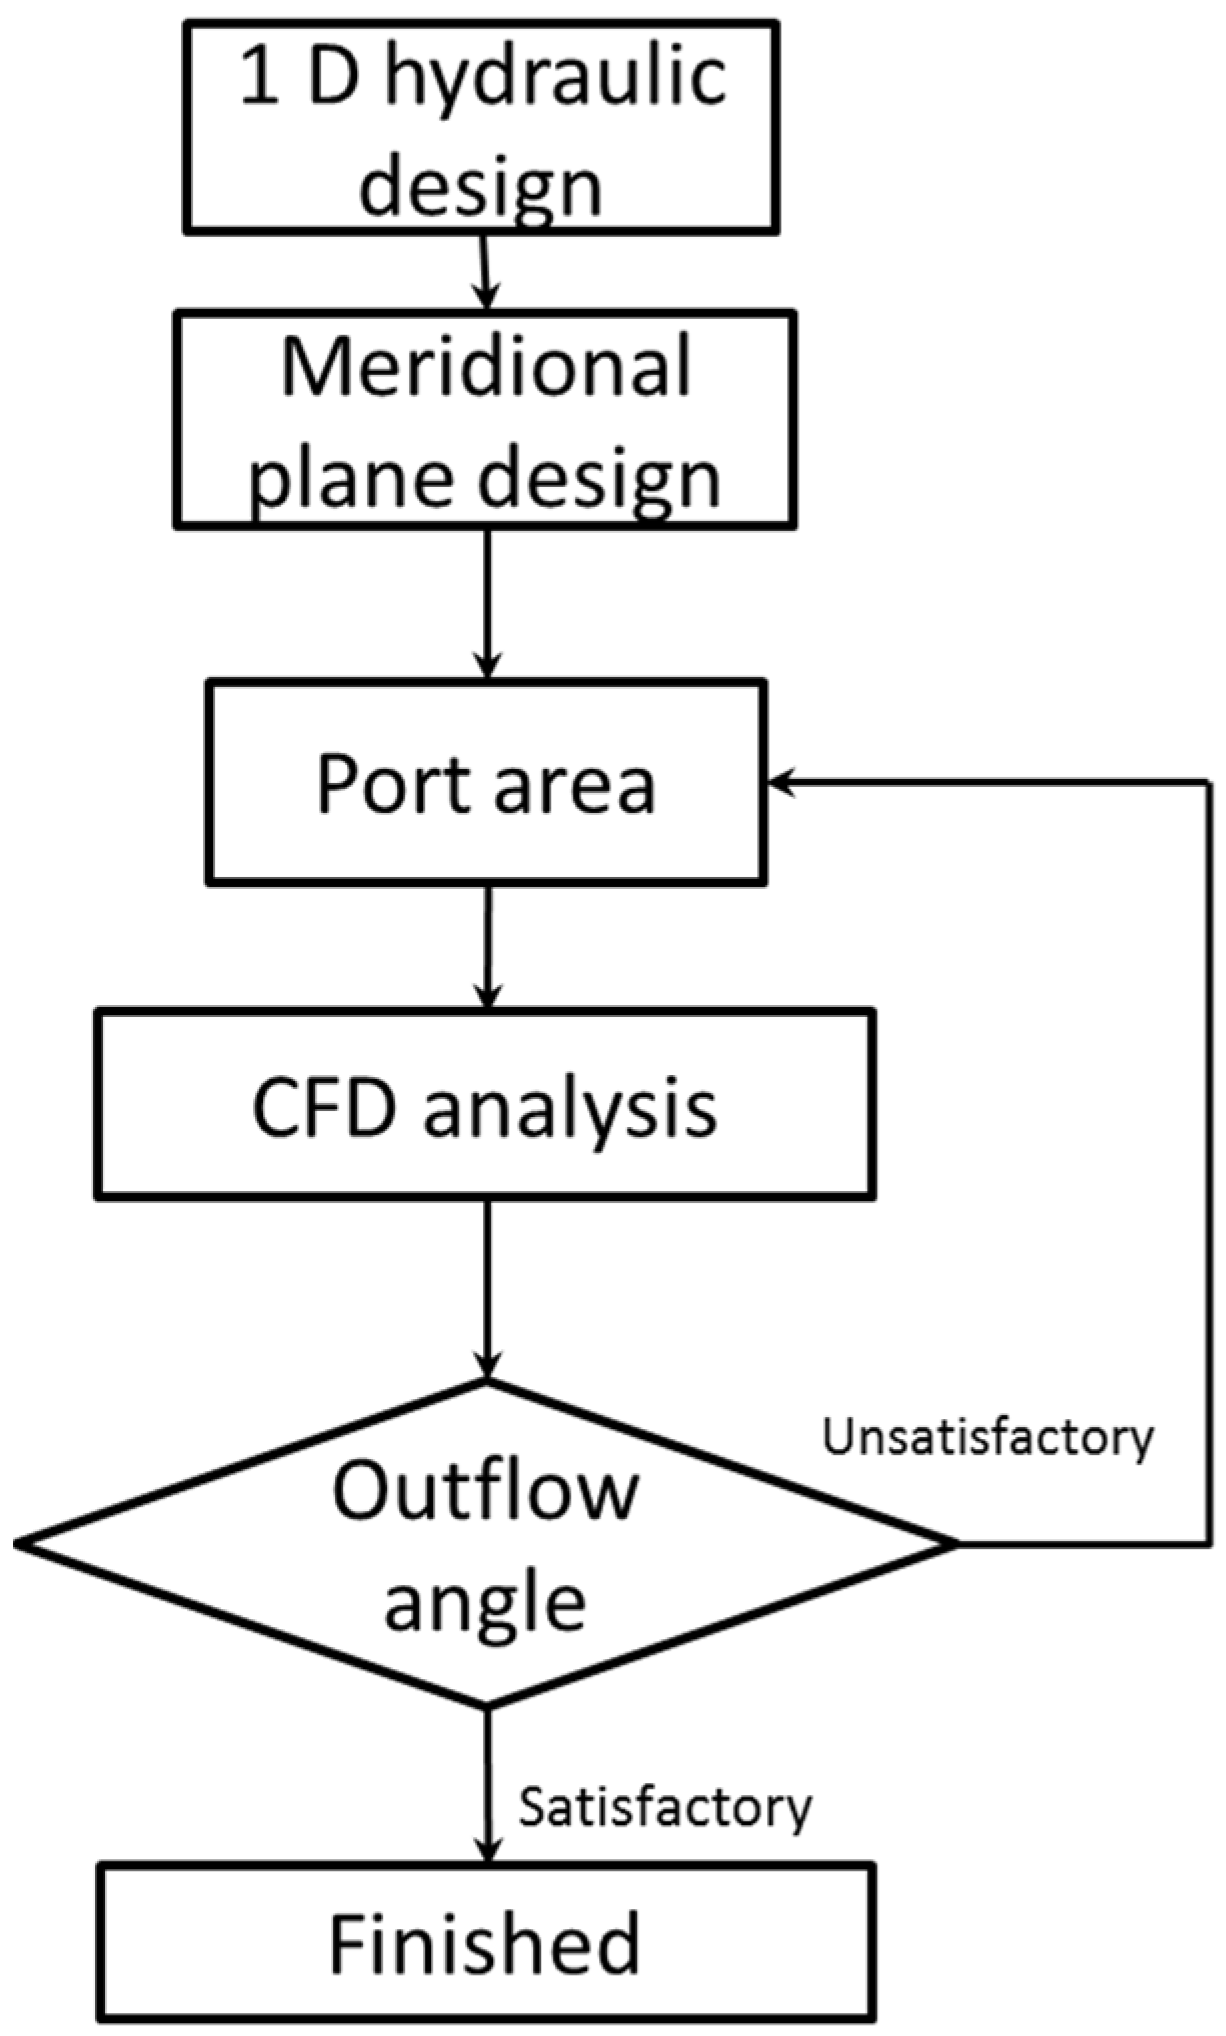
2. Turbine Runner Design and Numerical Method
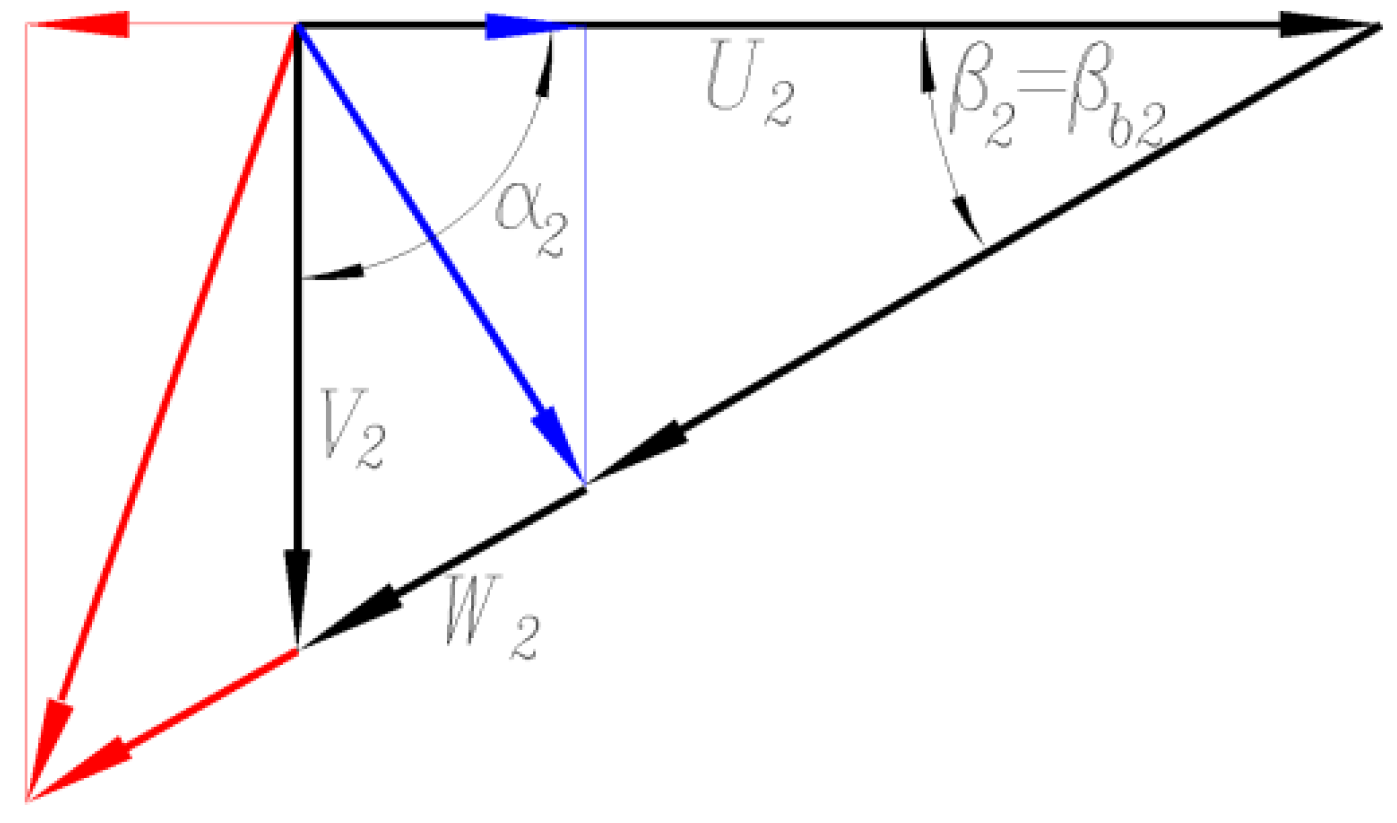
2.1. One Dimension Loss Analysis
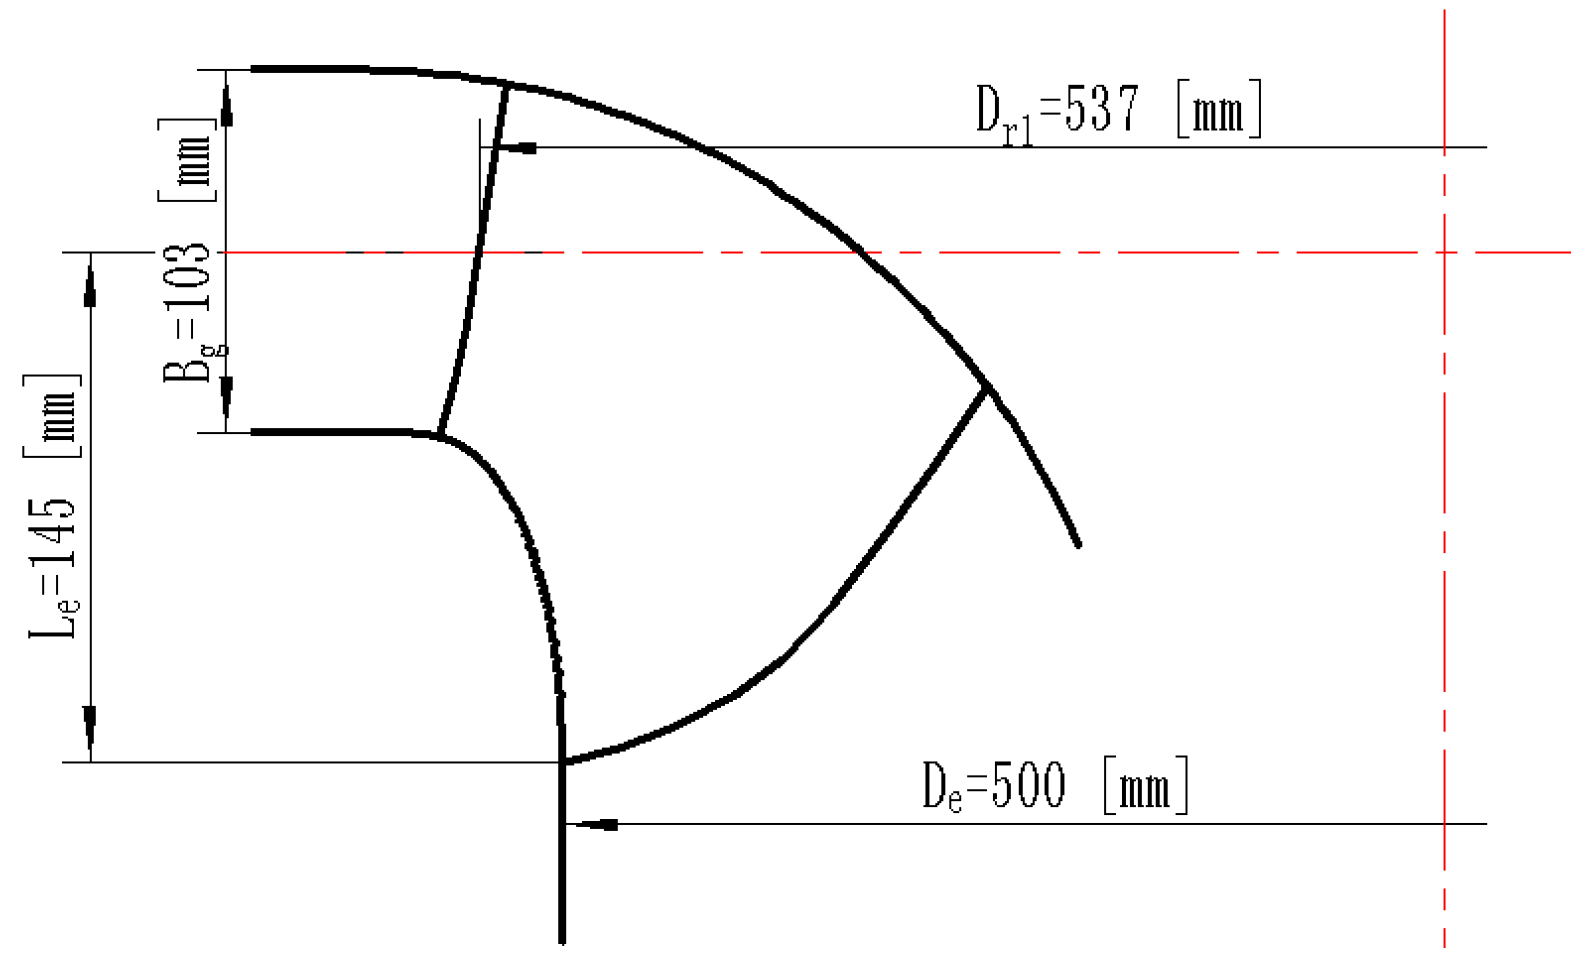
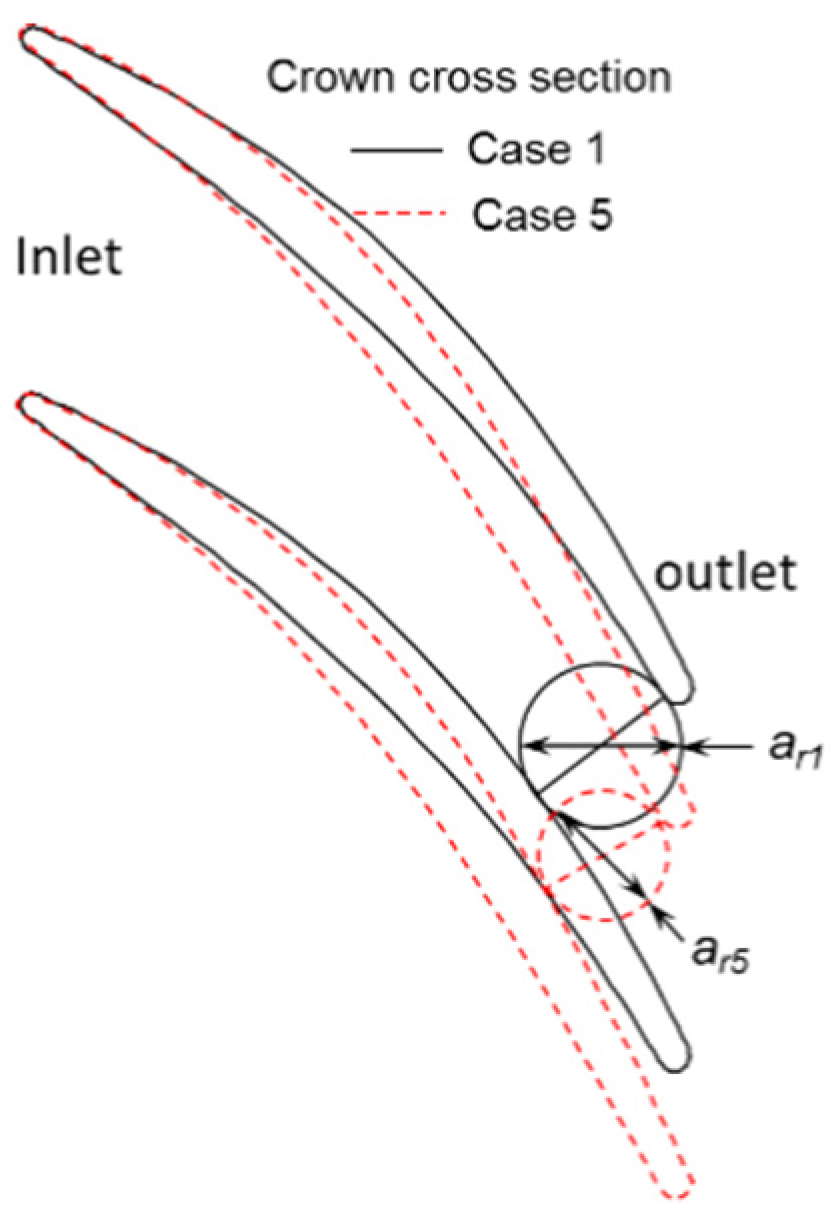
2.2. Turbine Runner Blade Model
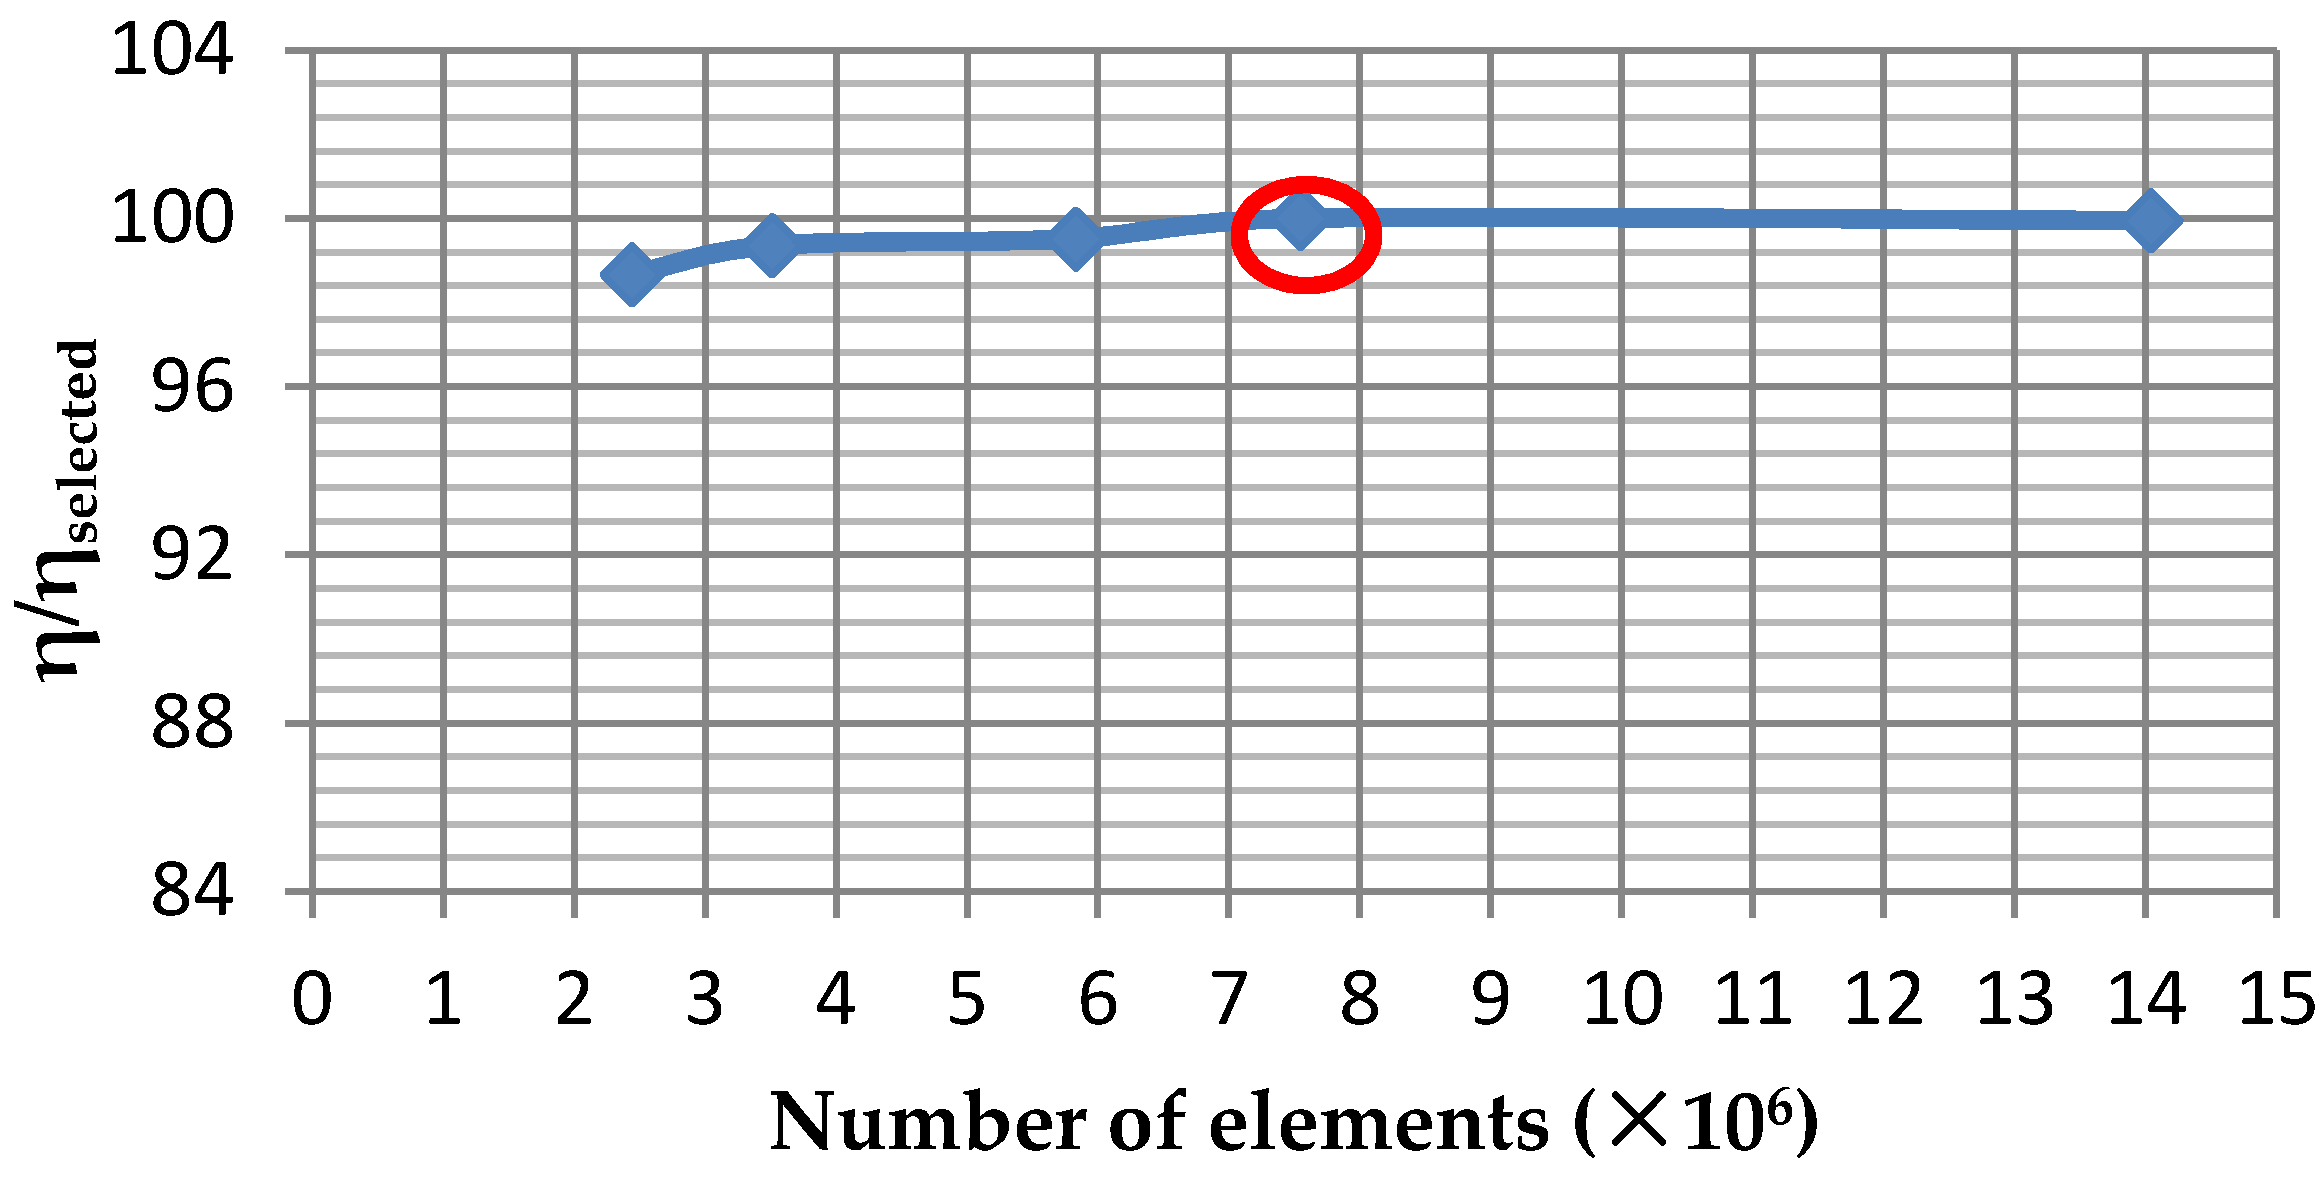
2.3. Numerical Method
3. Results and Discussion
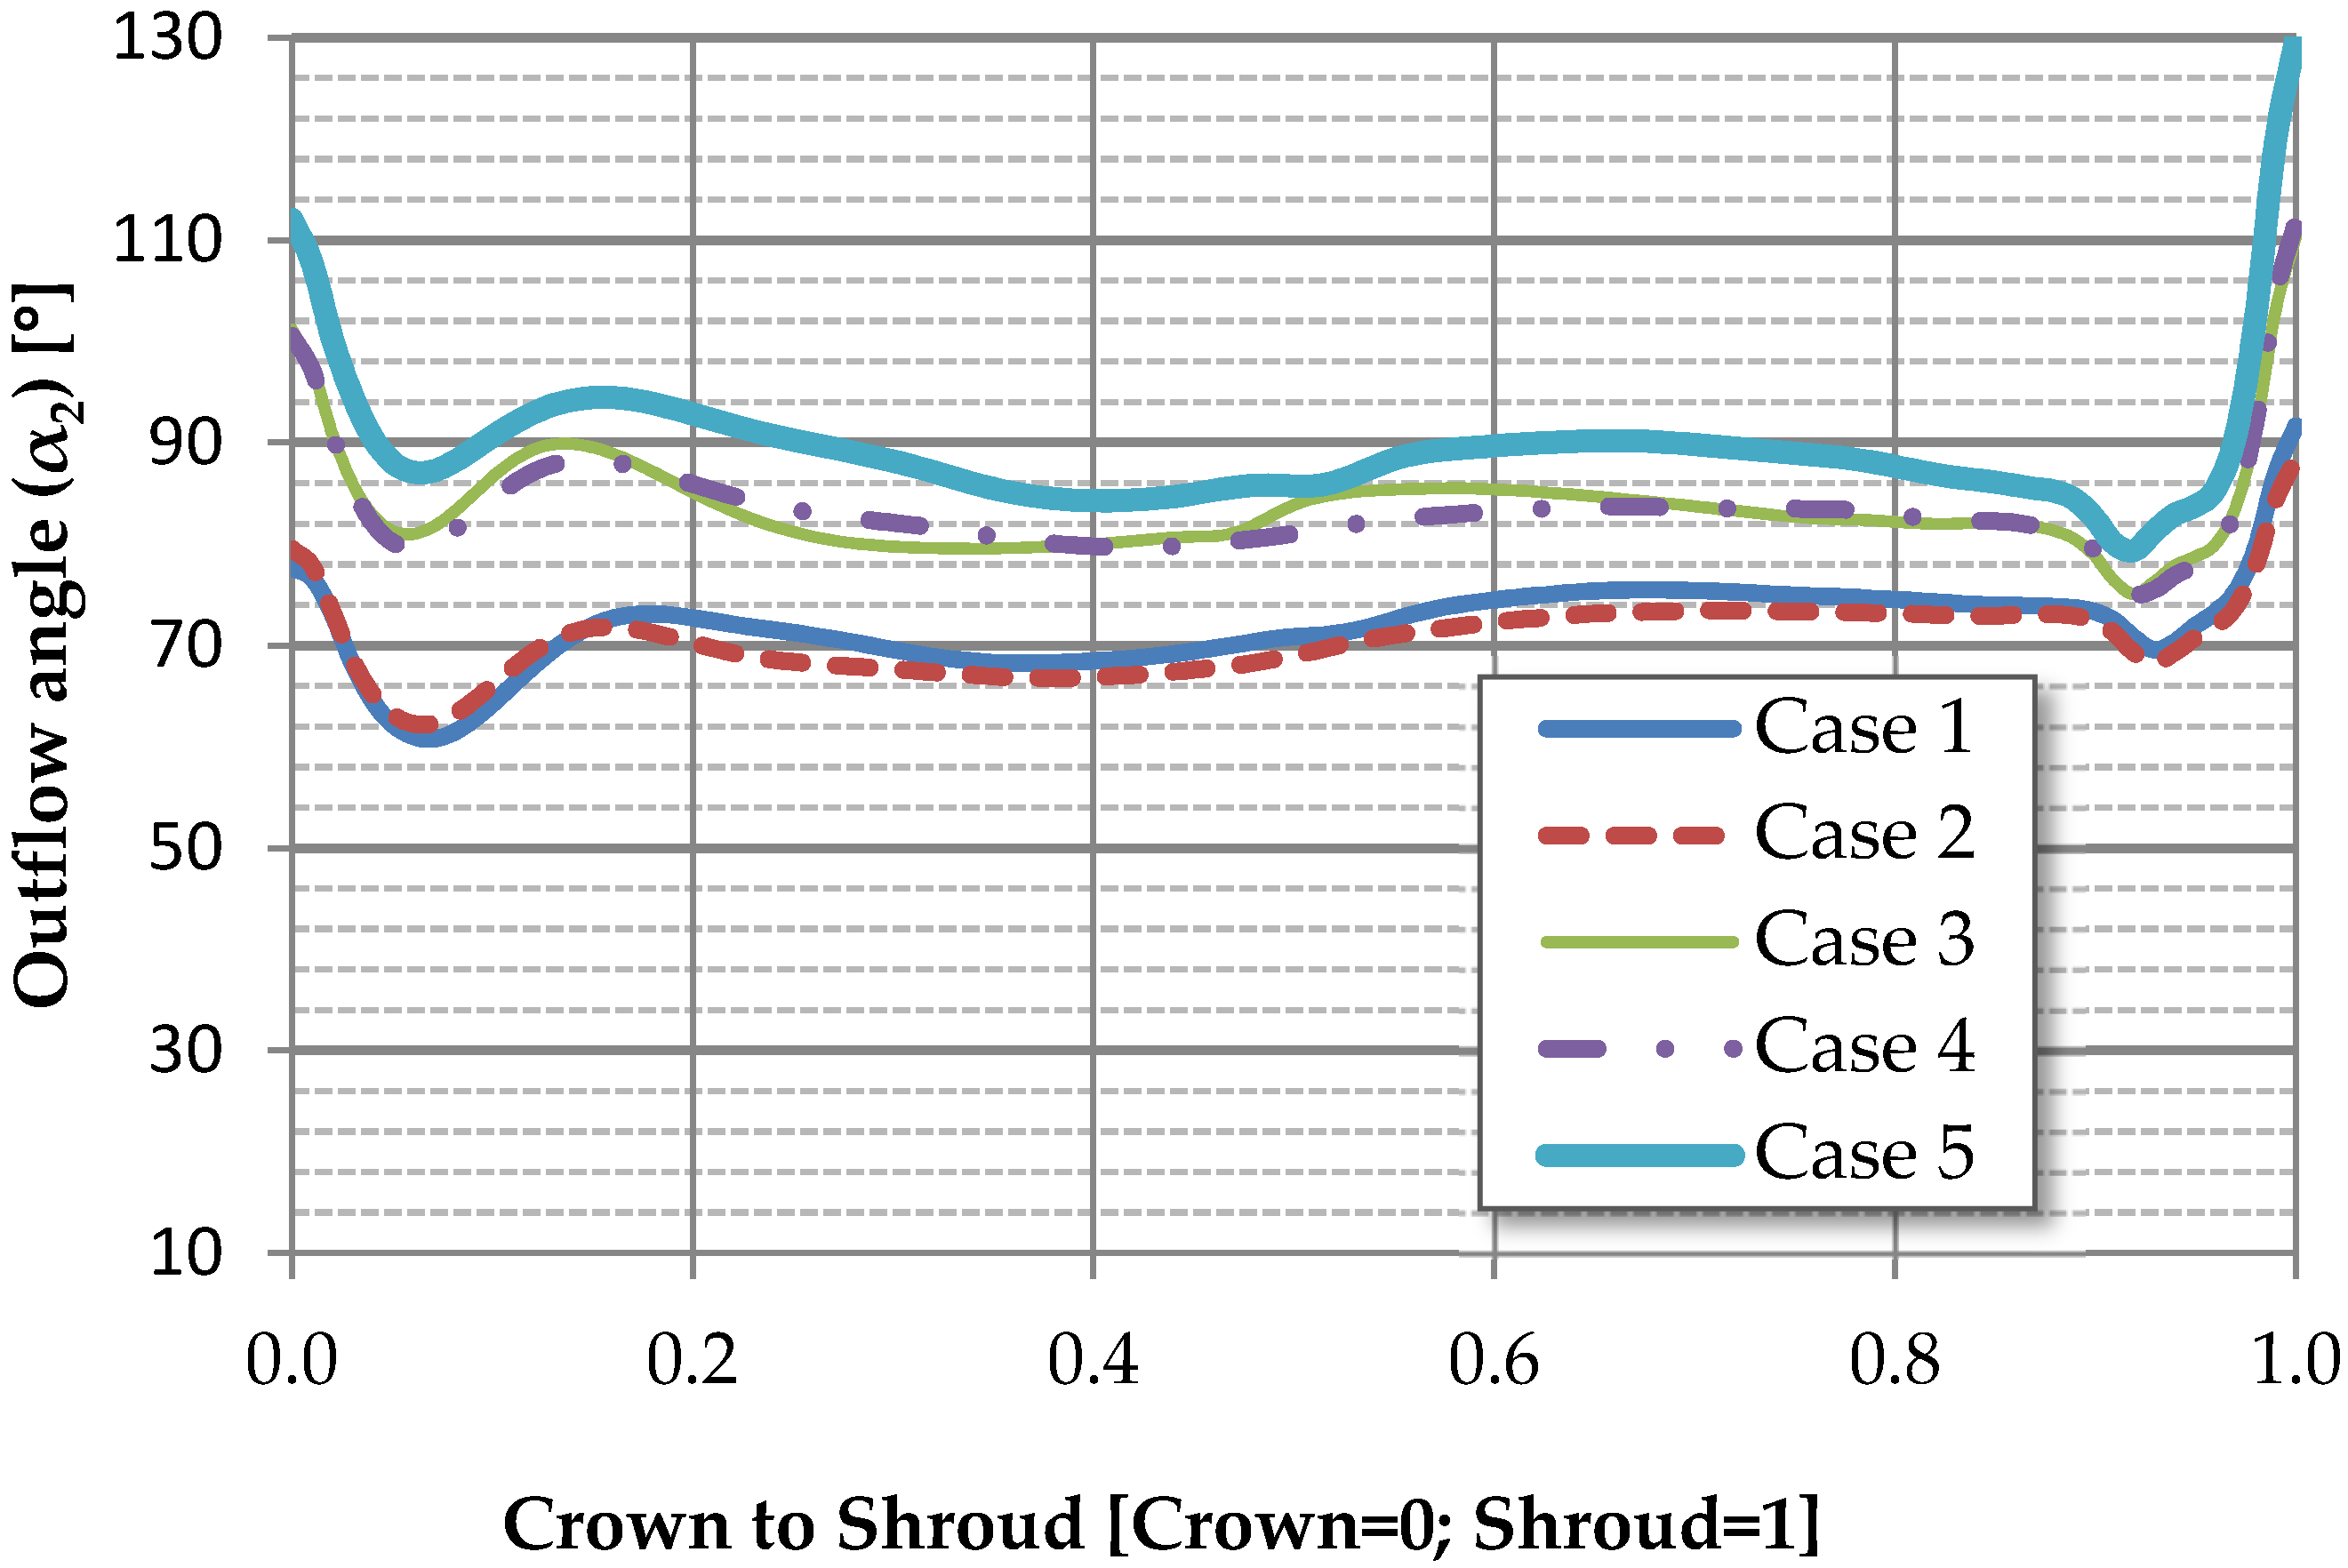
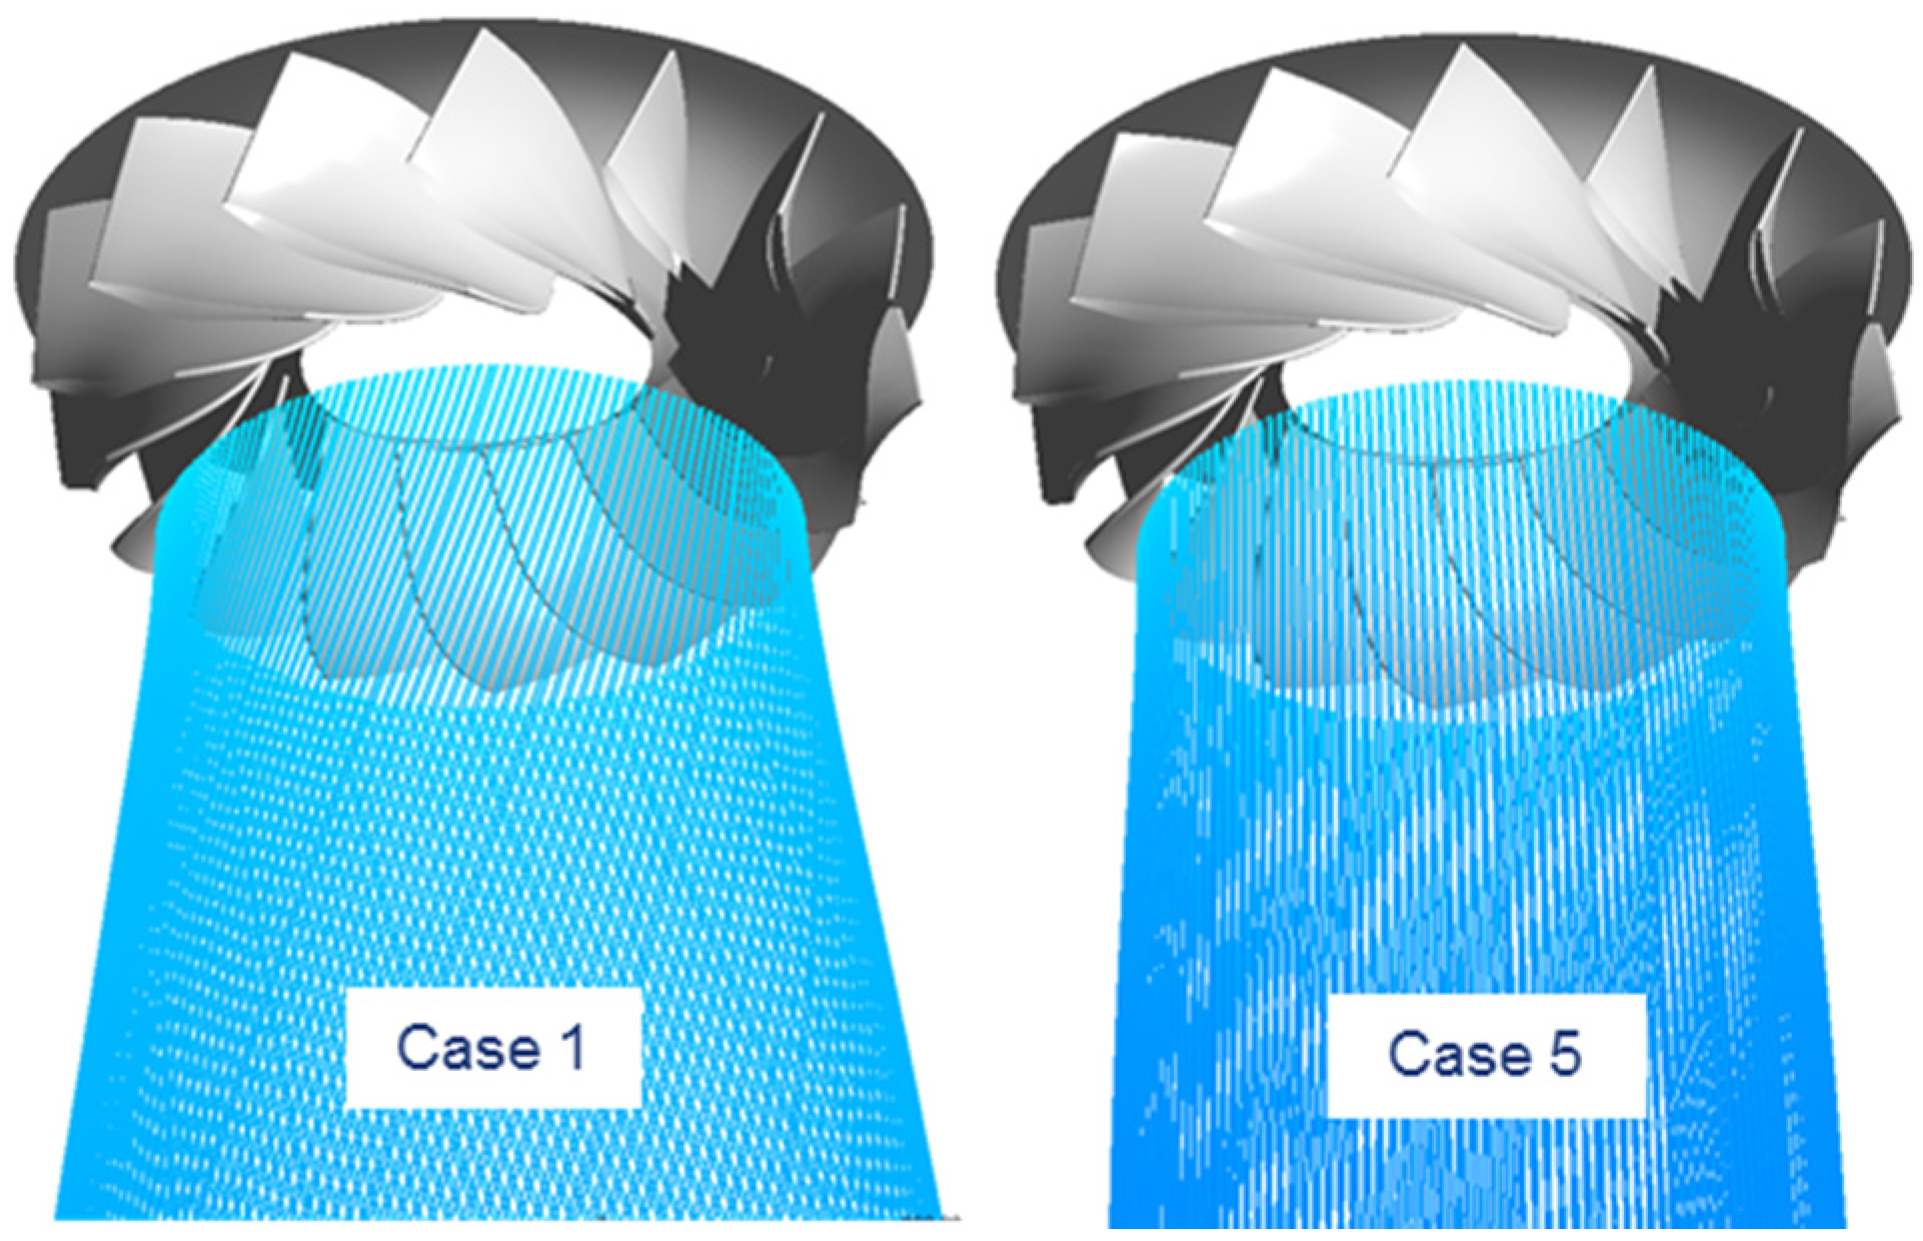
3.1. Outflow Pattern
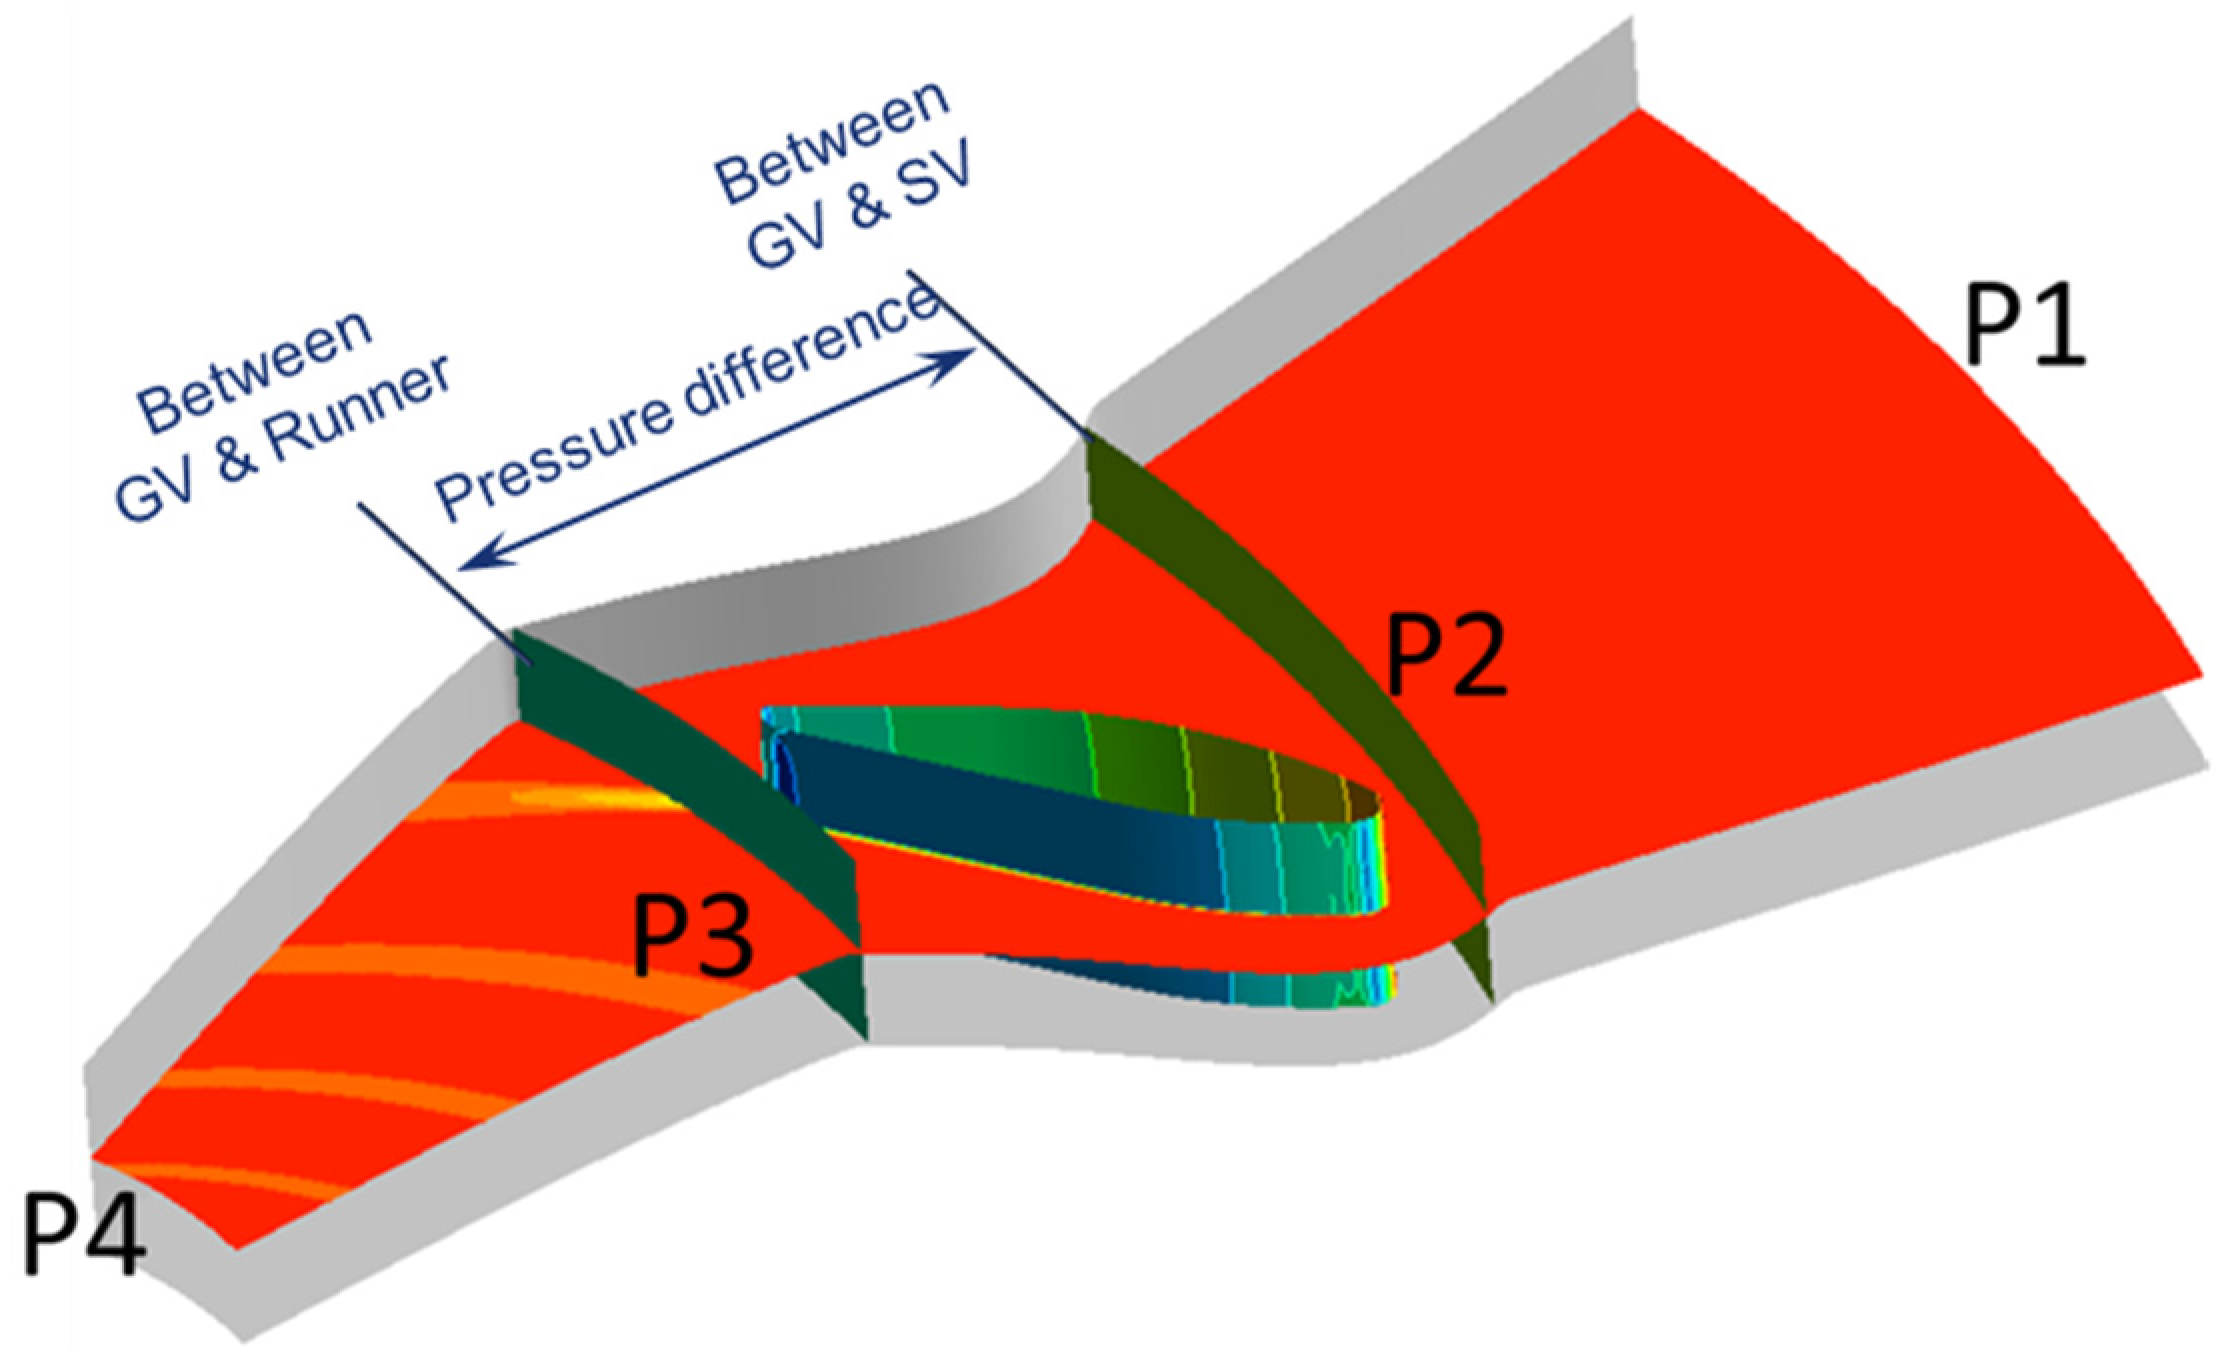
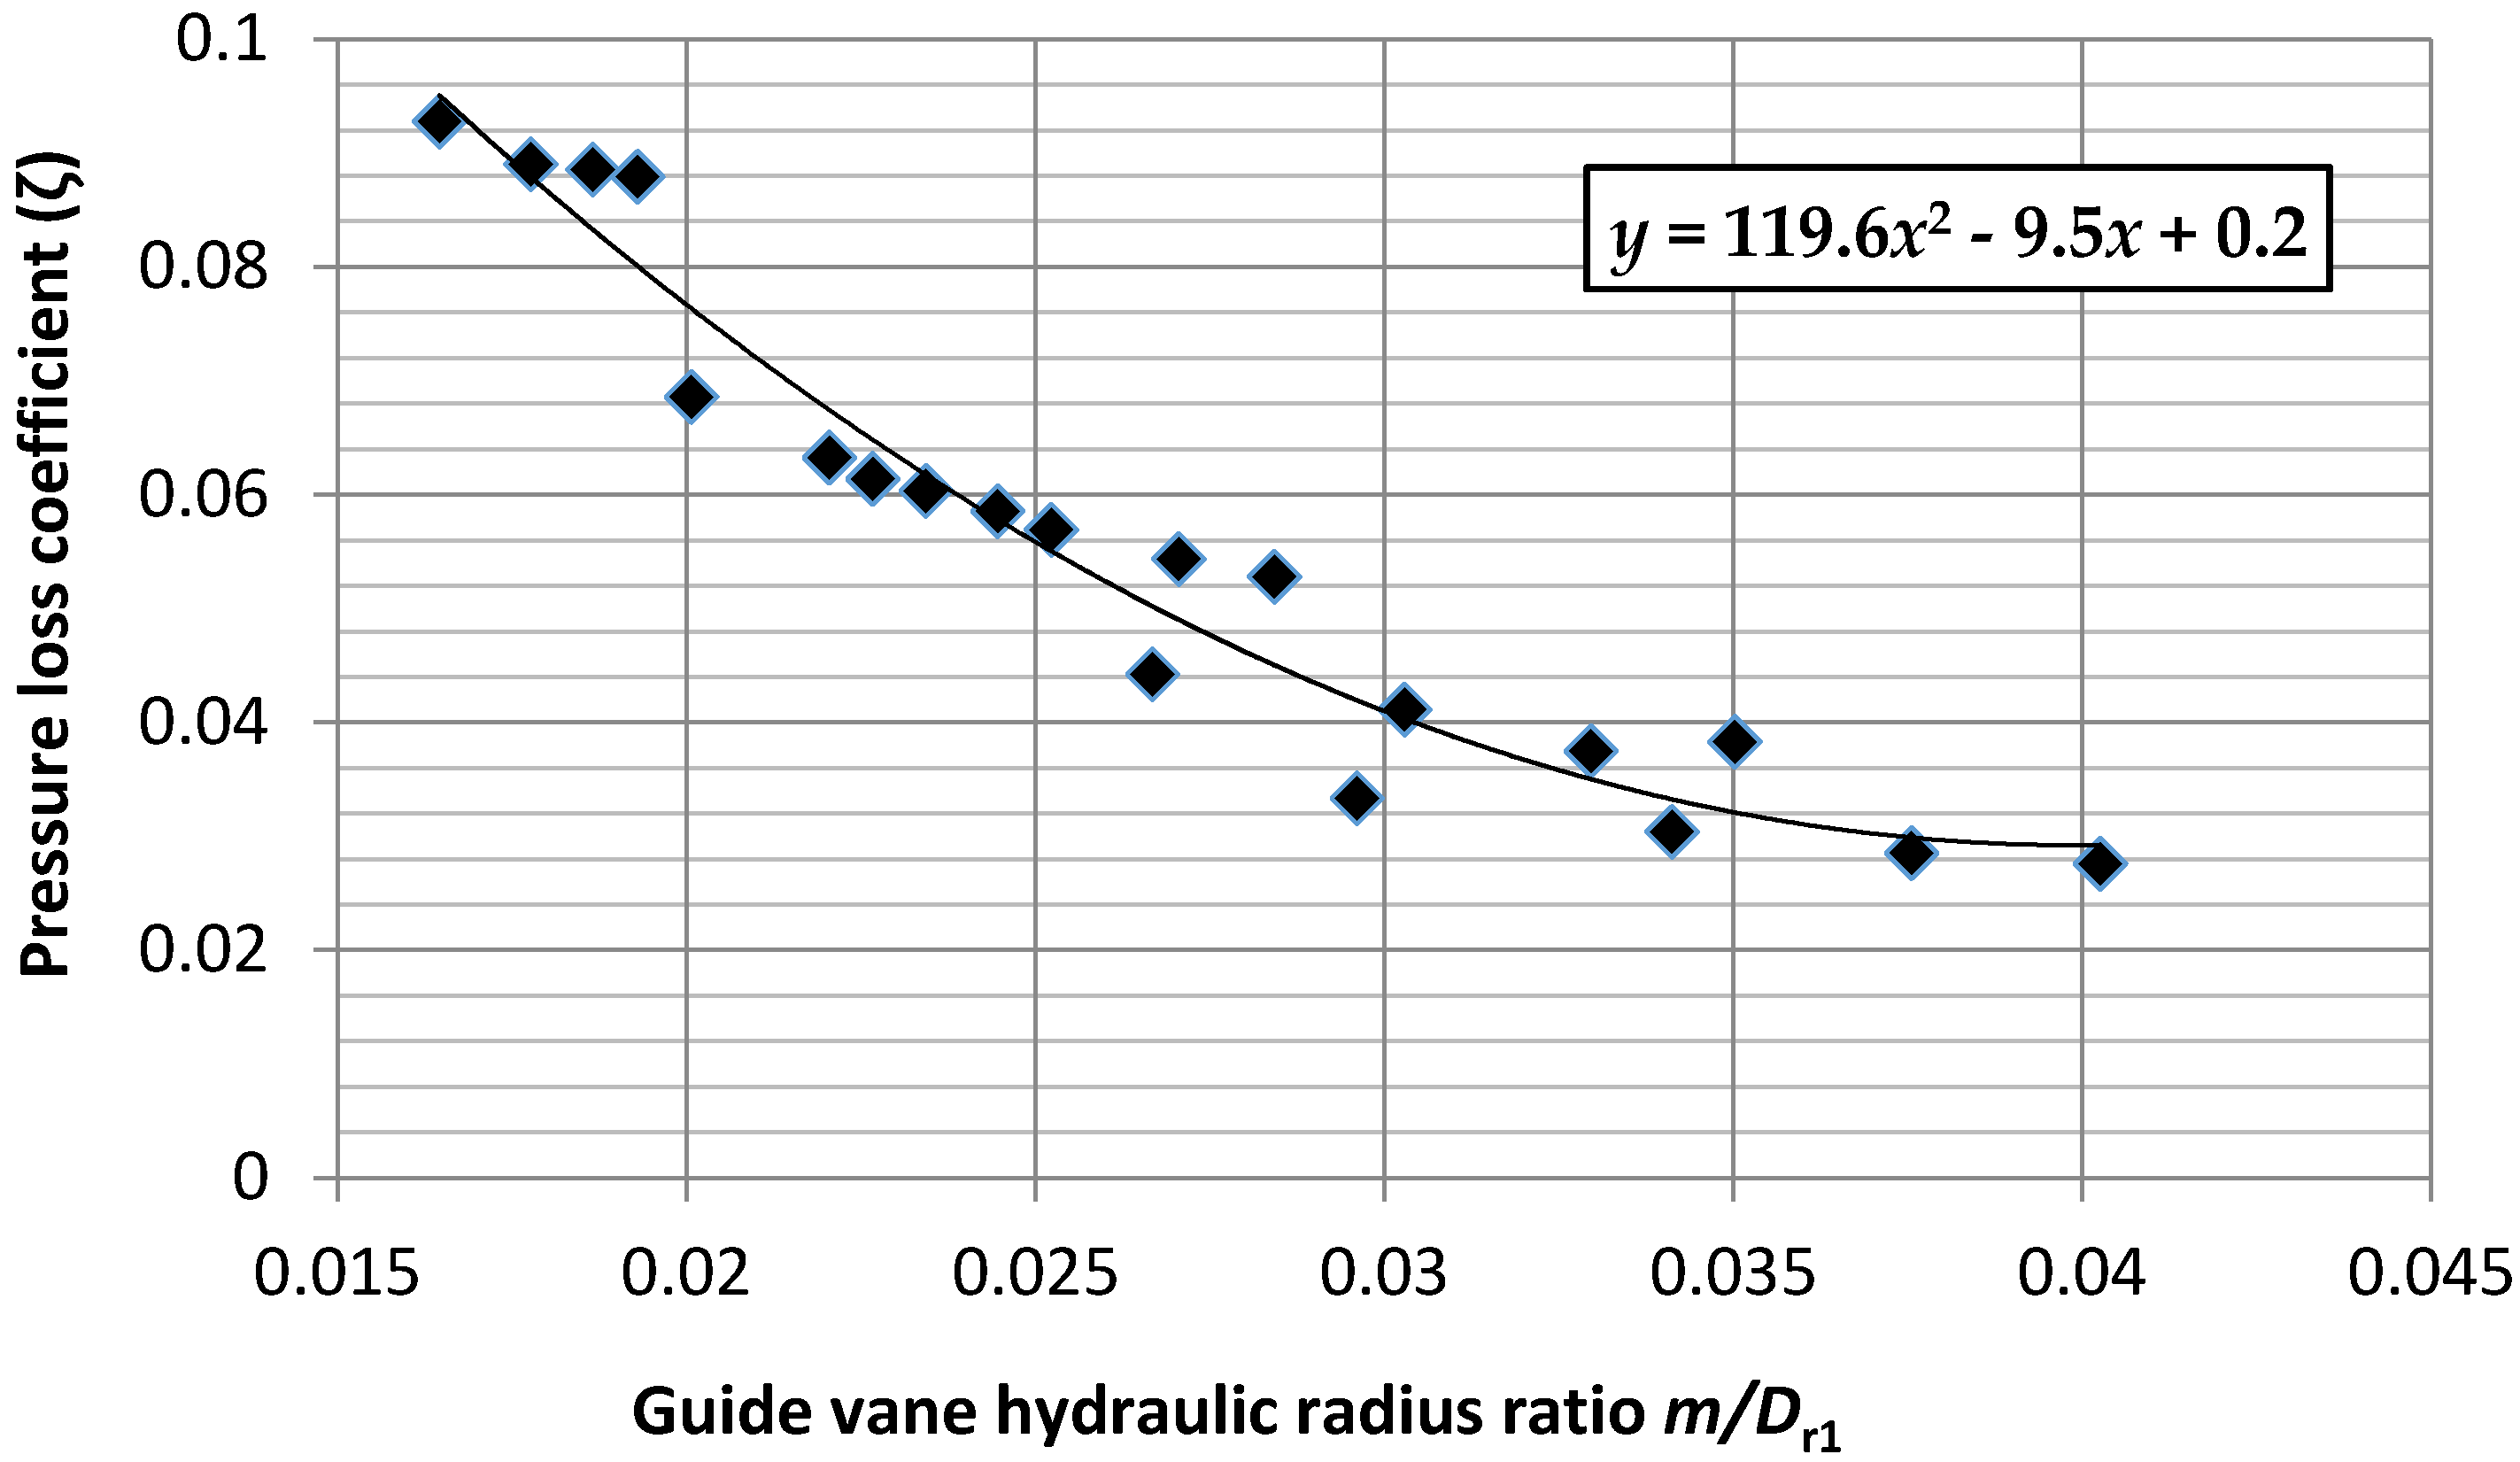
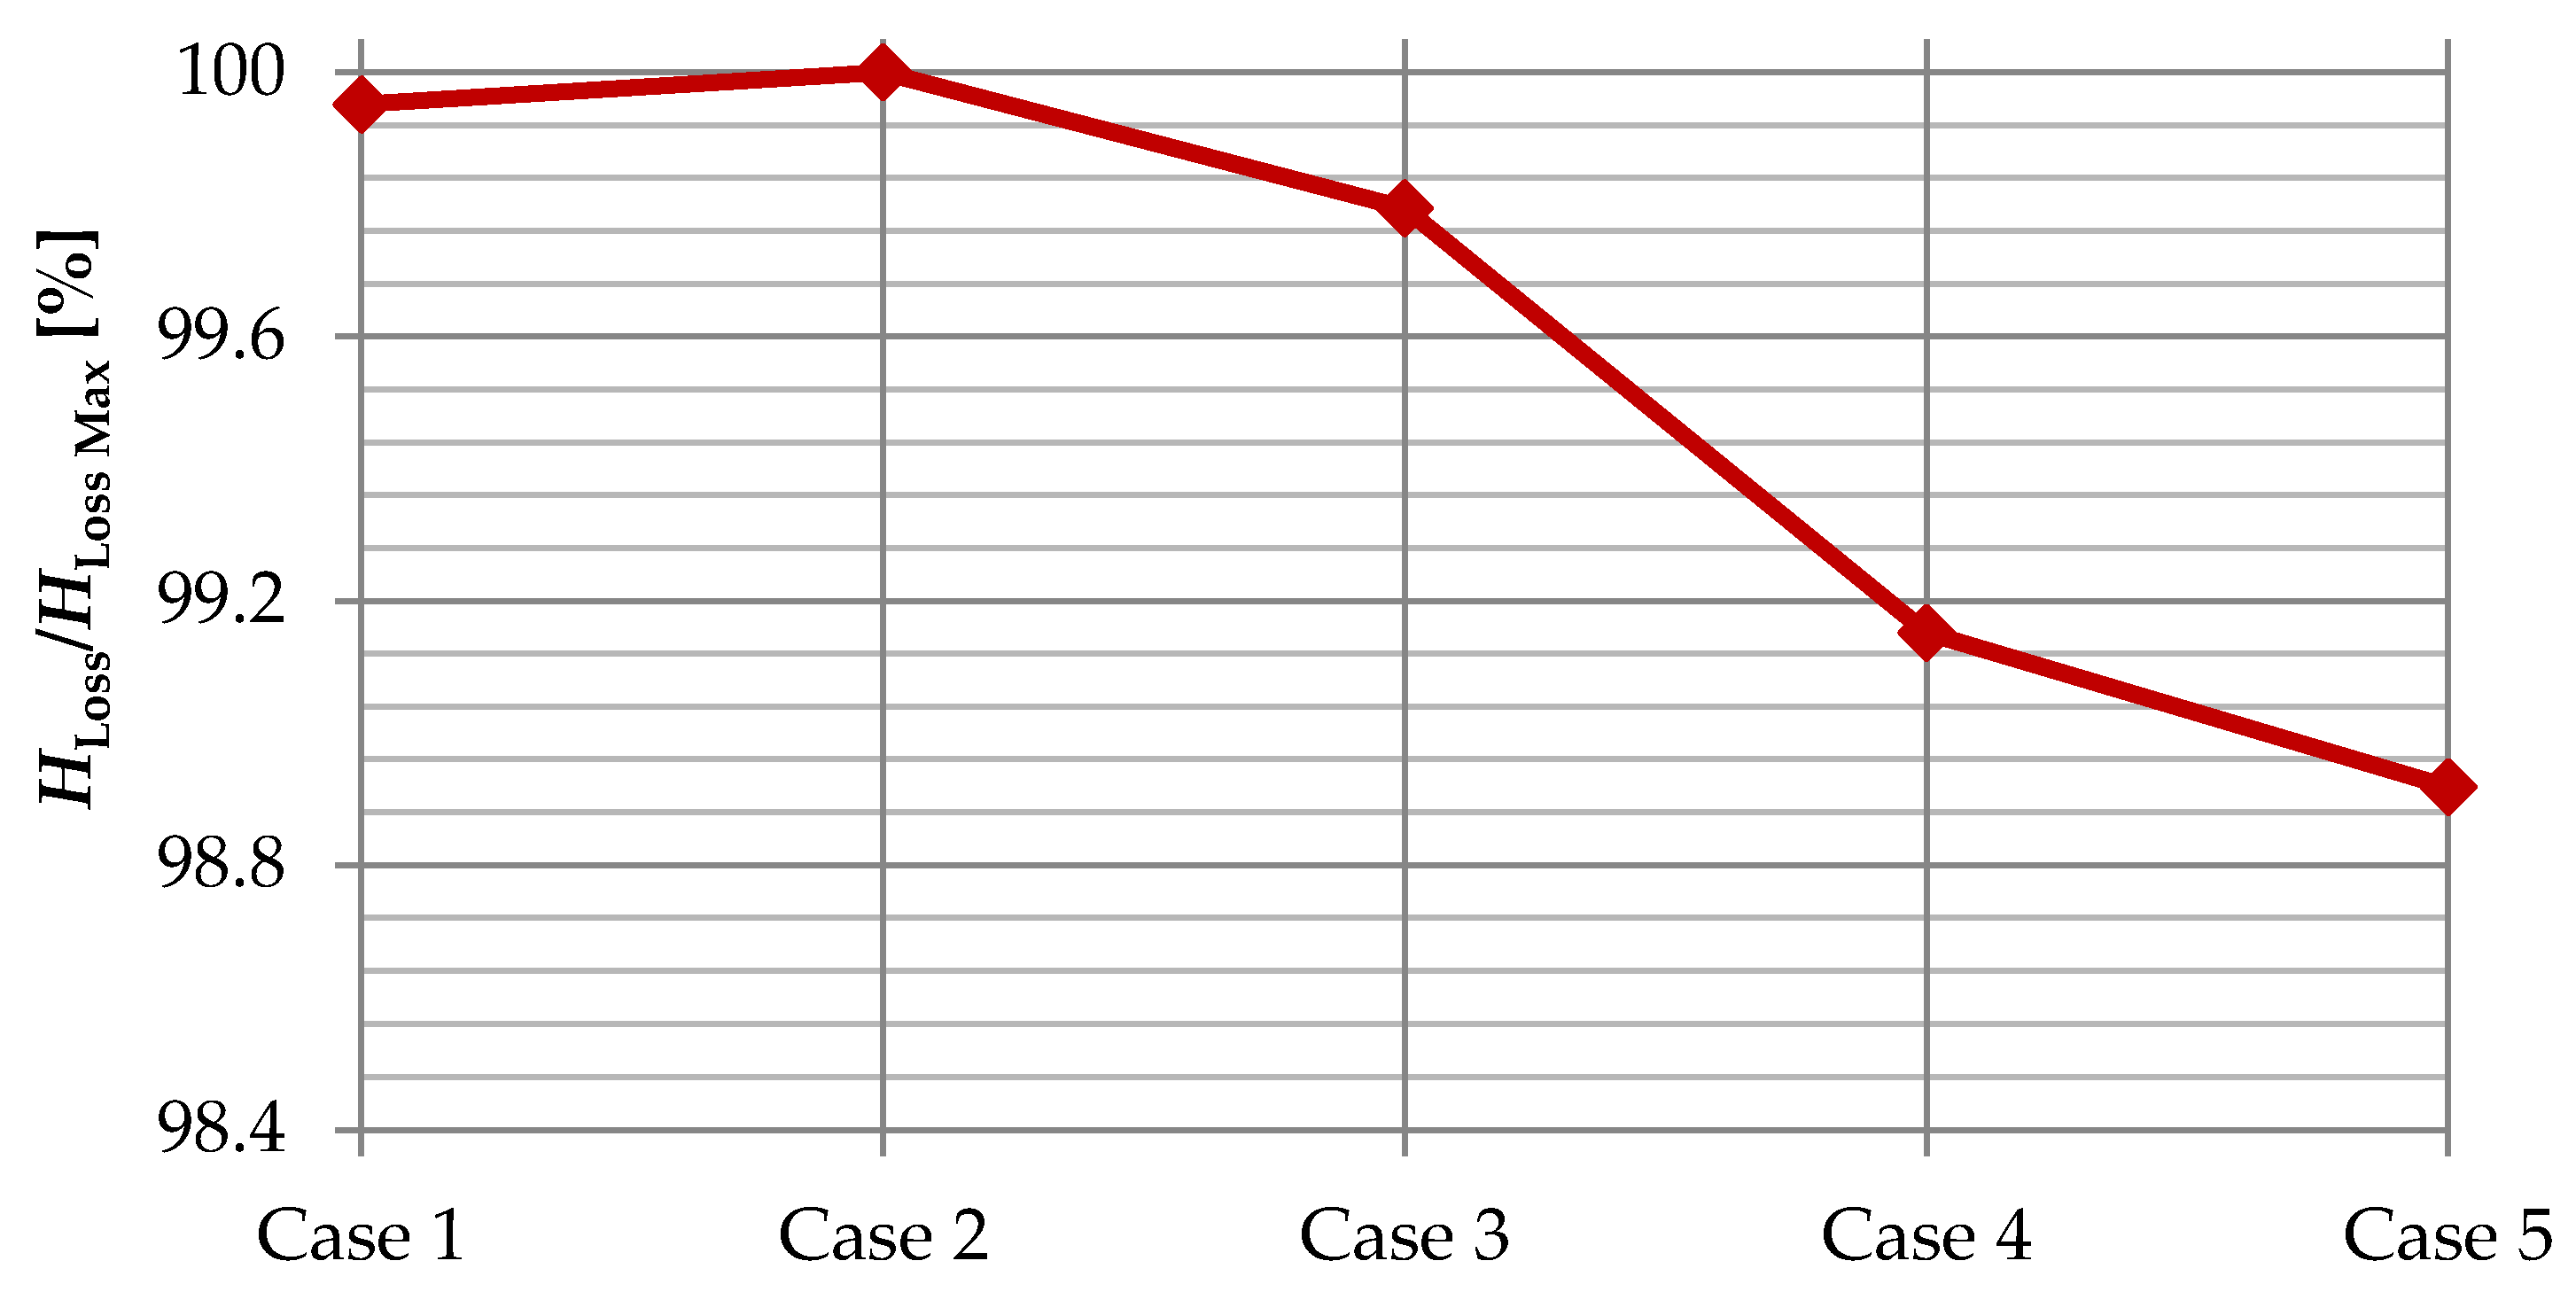
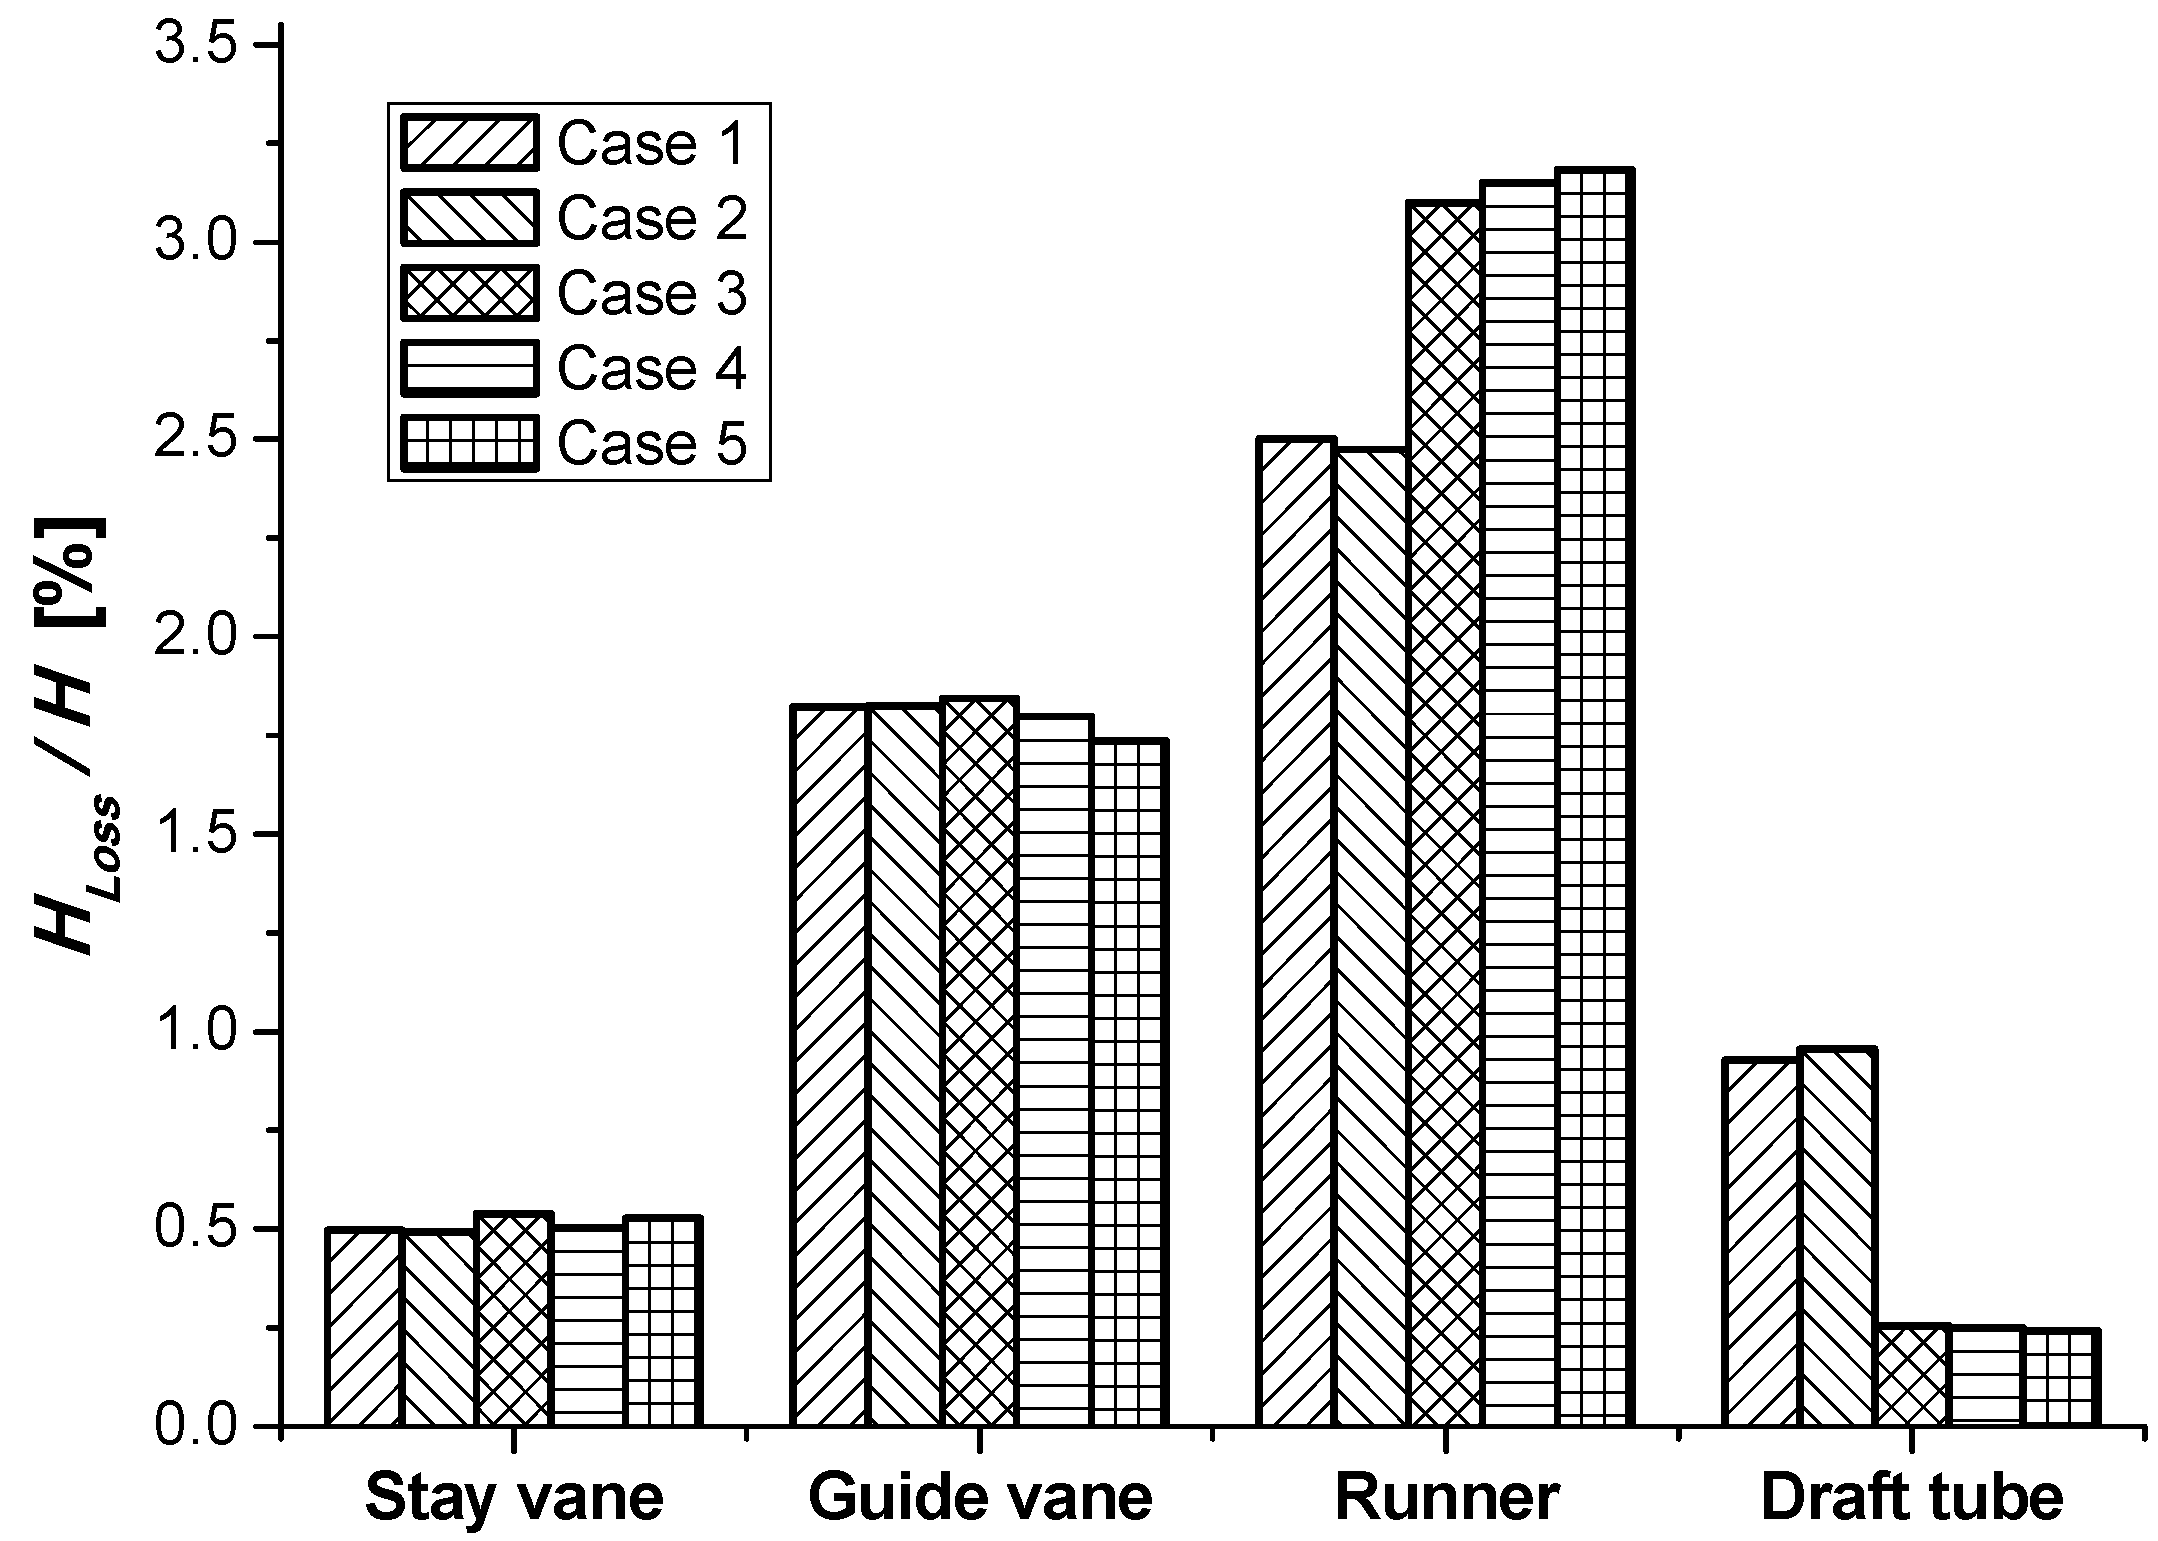
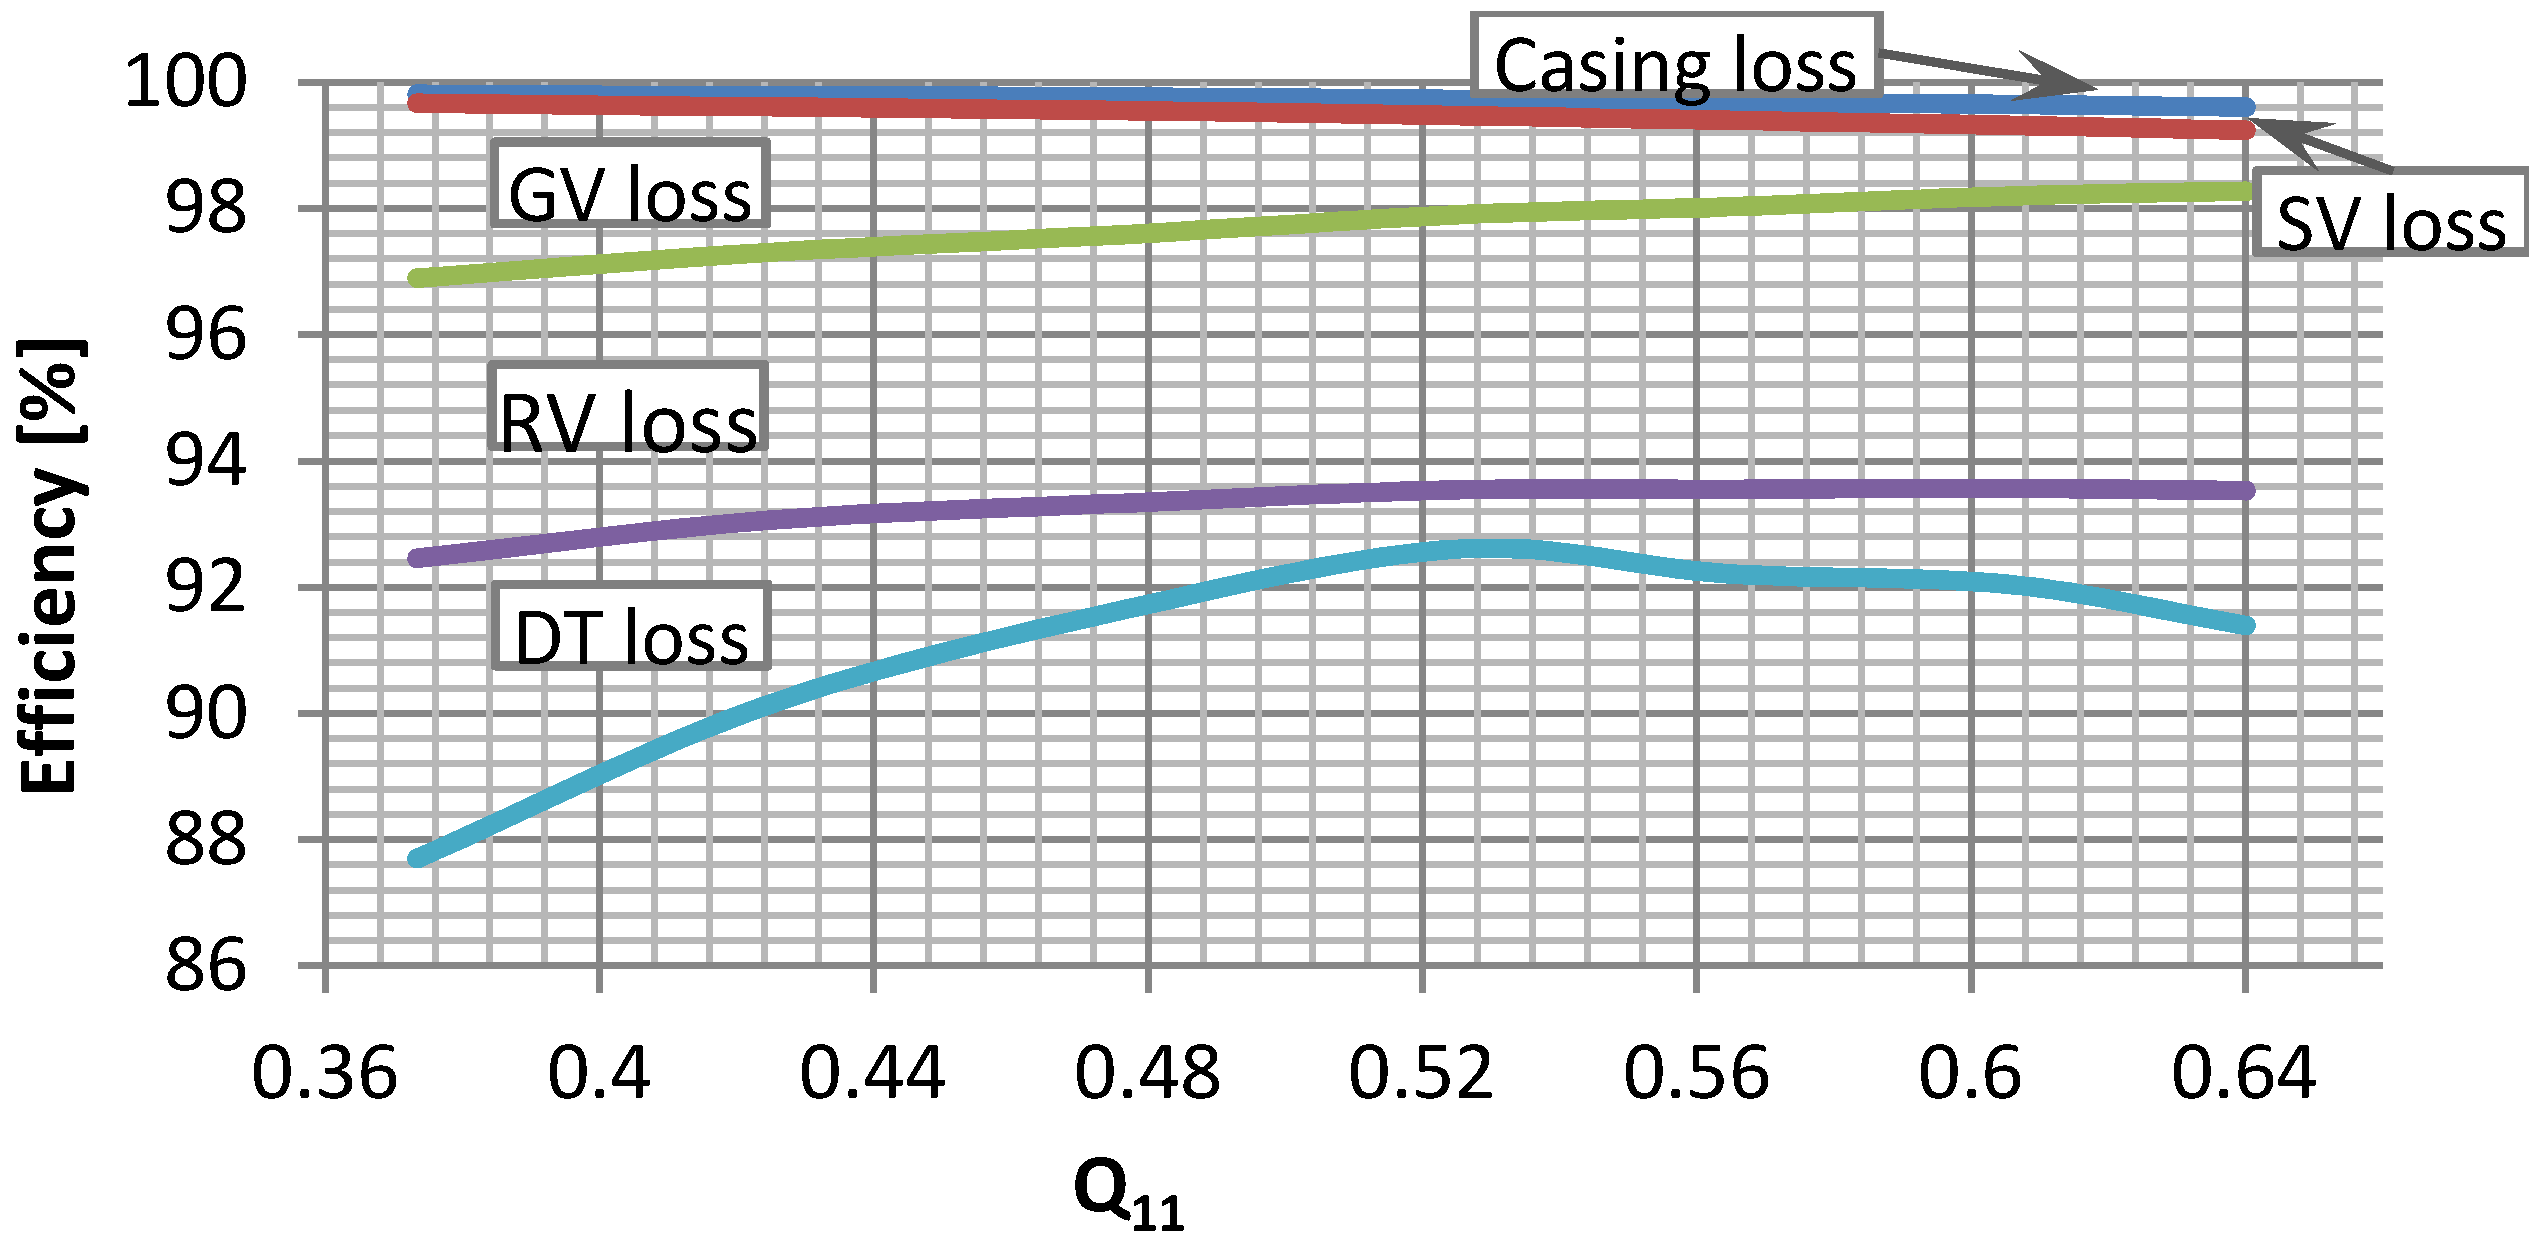
3.2. Loss Analysis
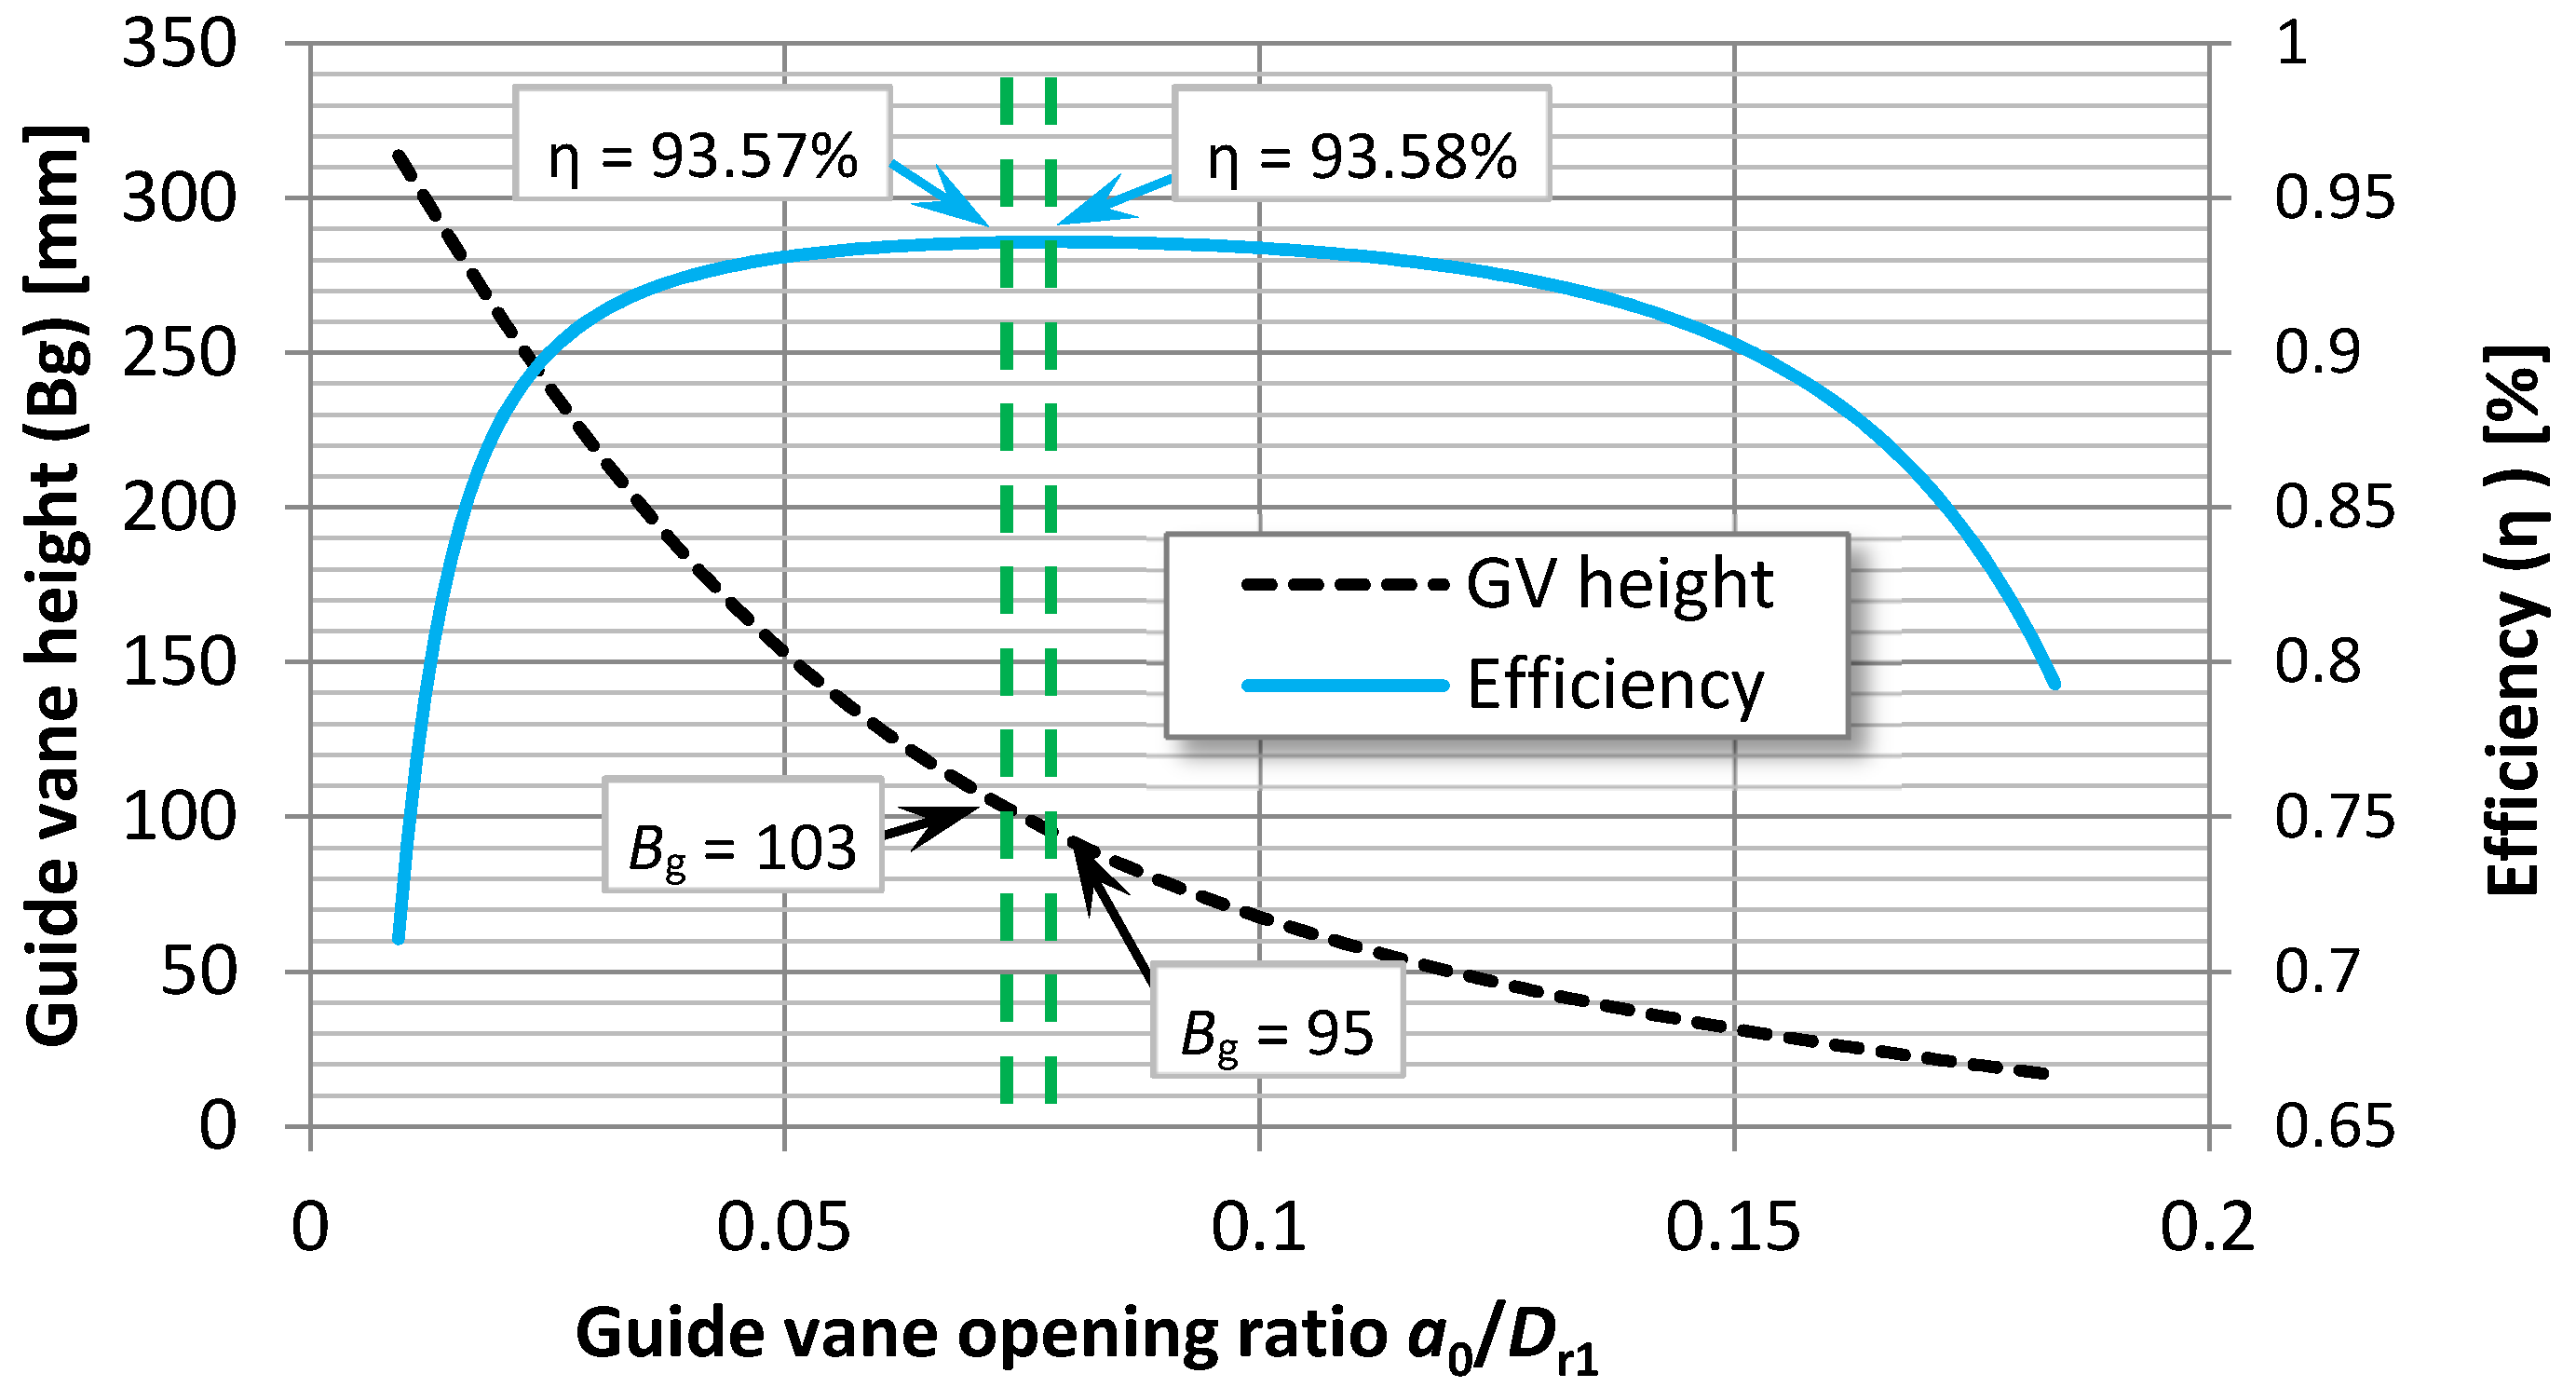
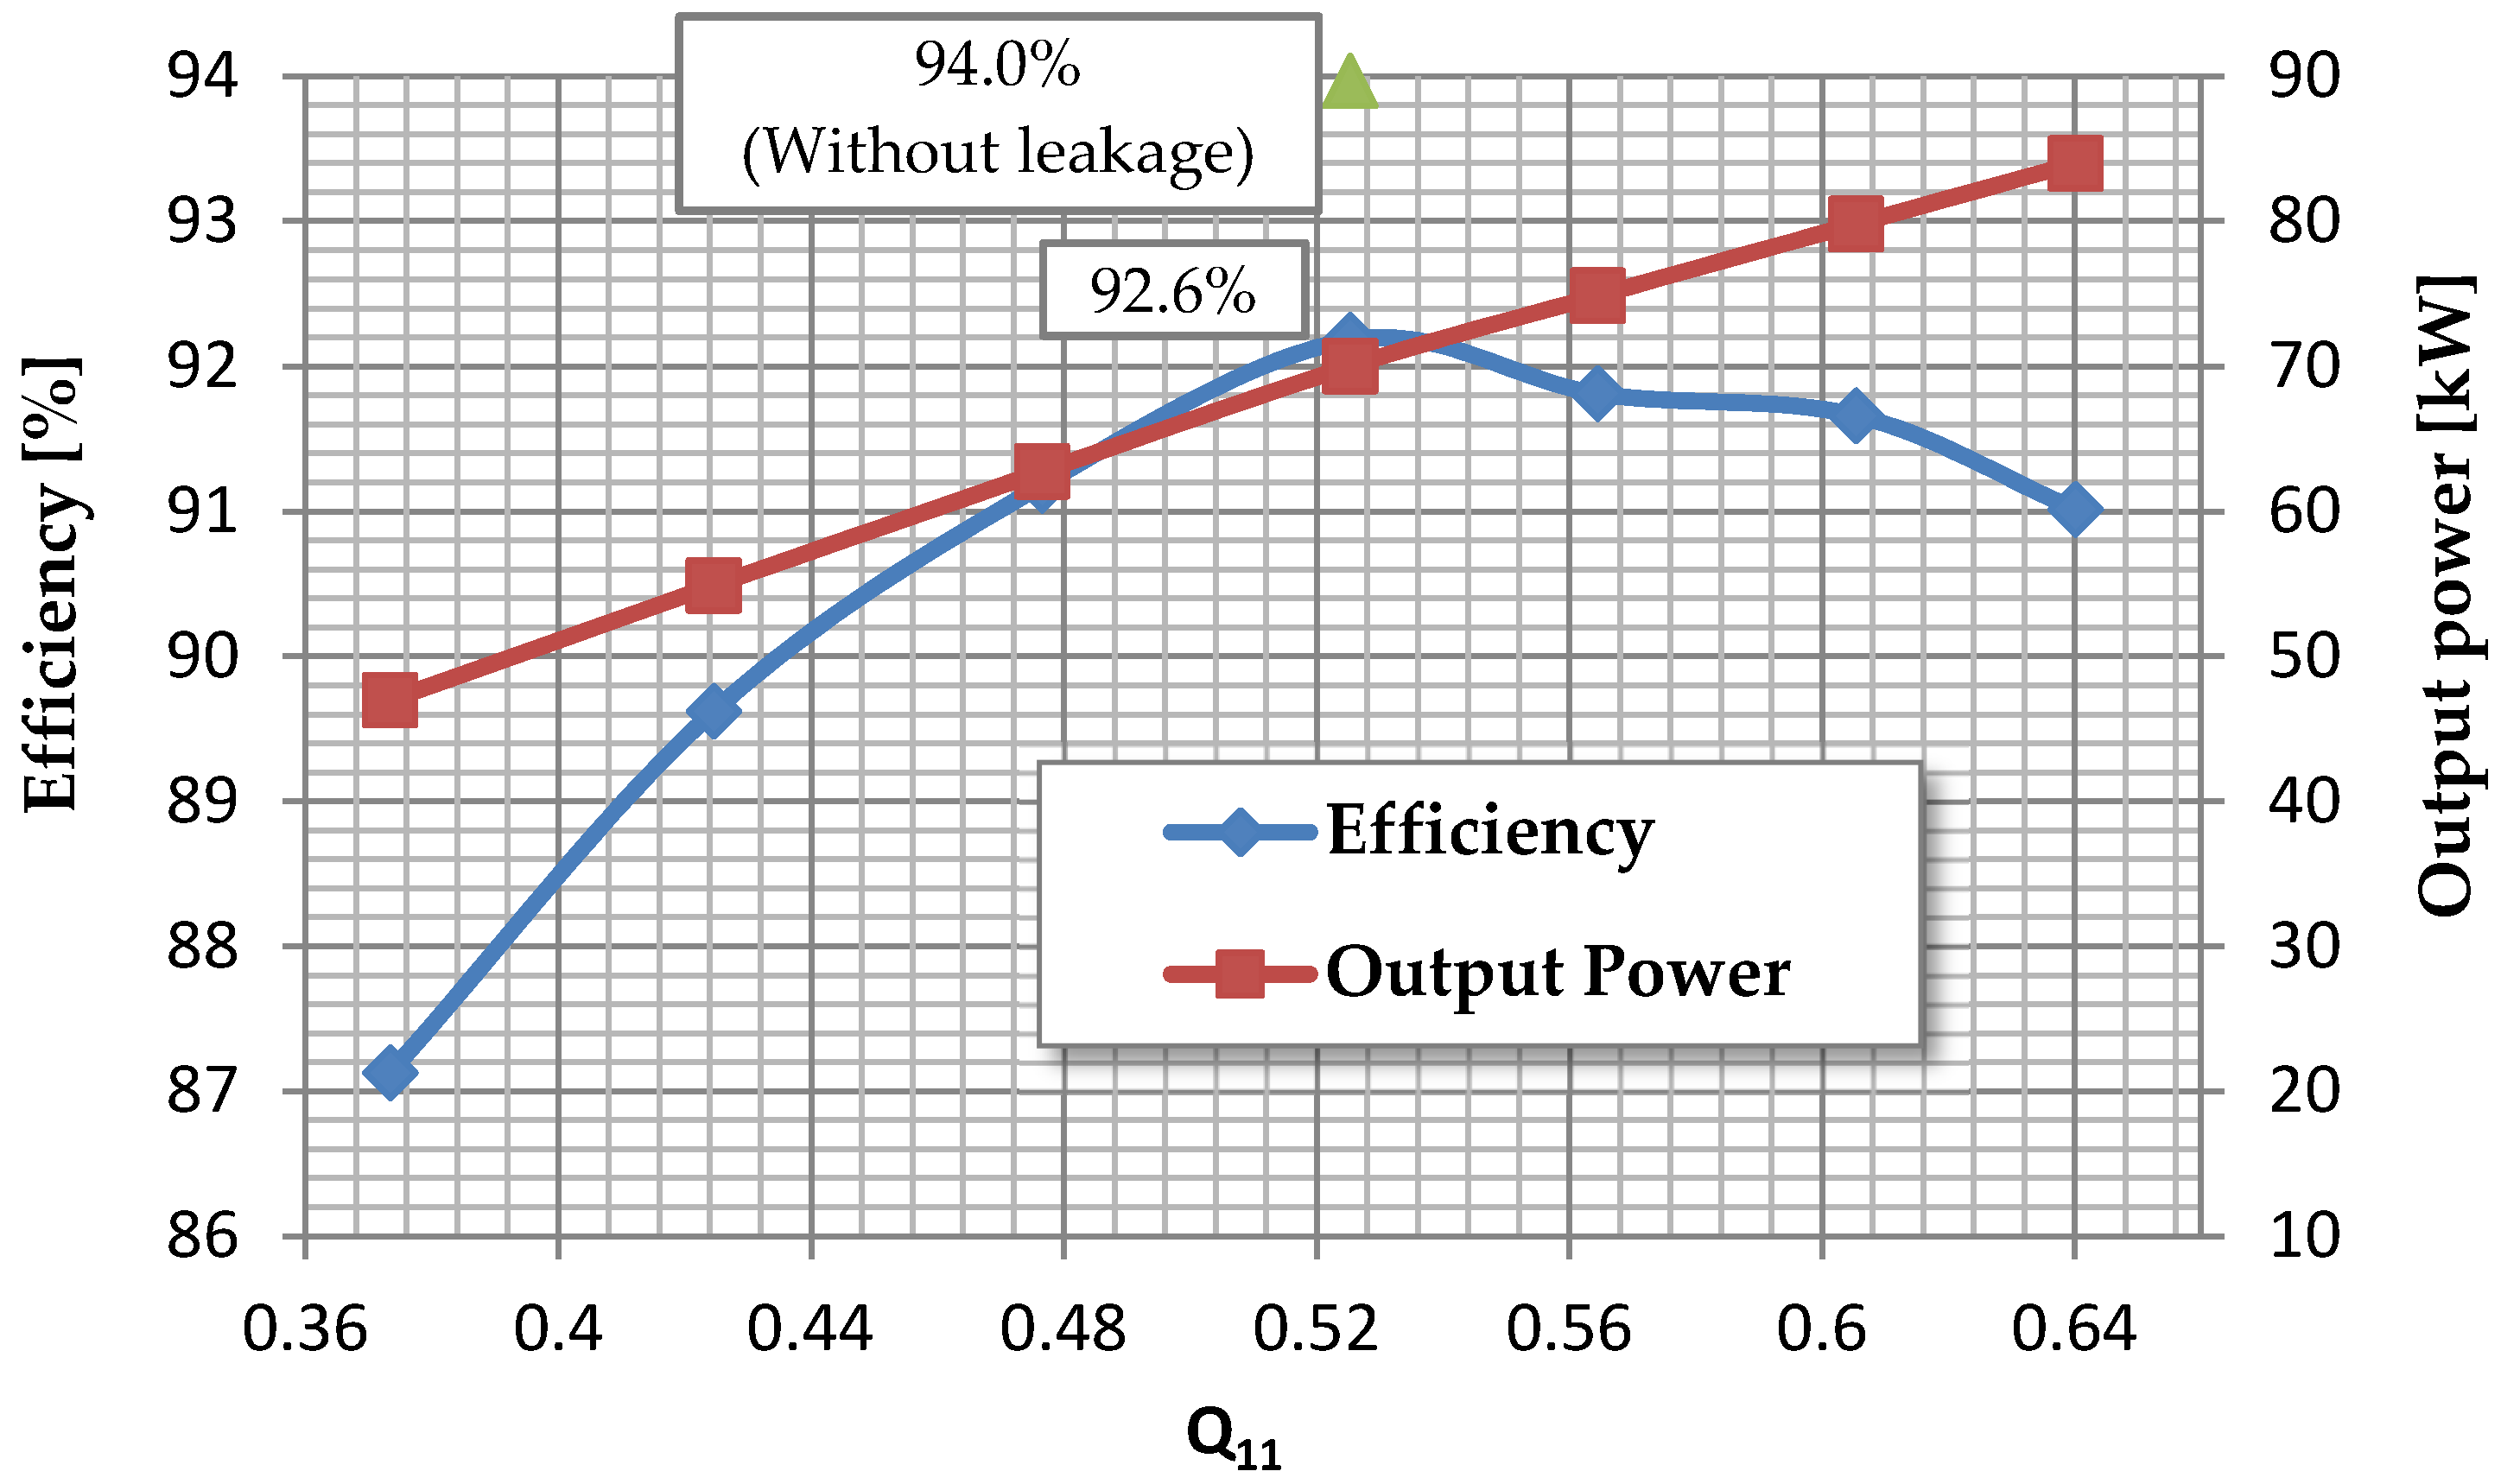
3.3. Performance Analysis
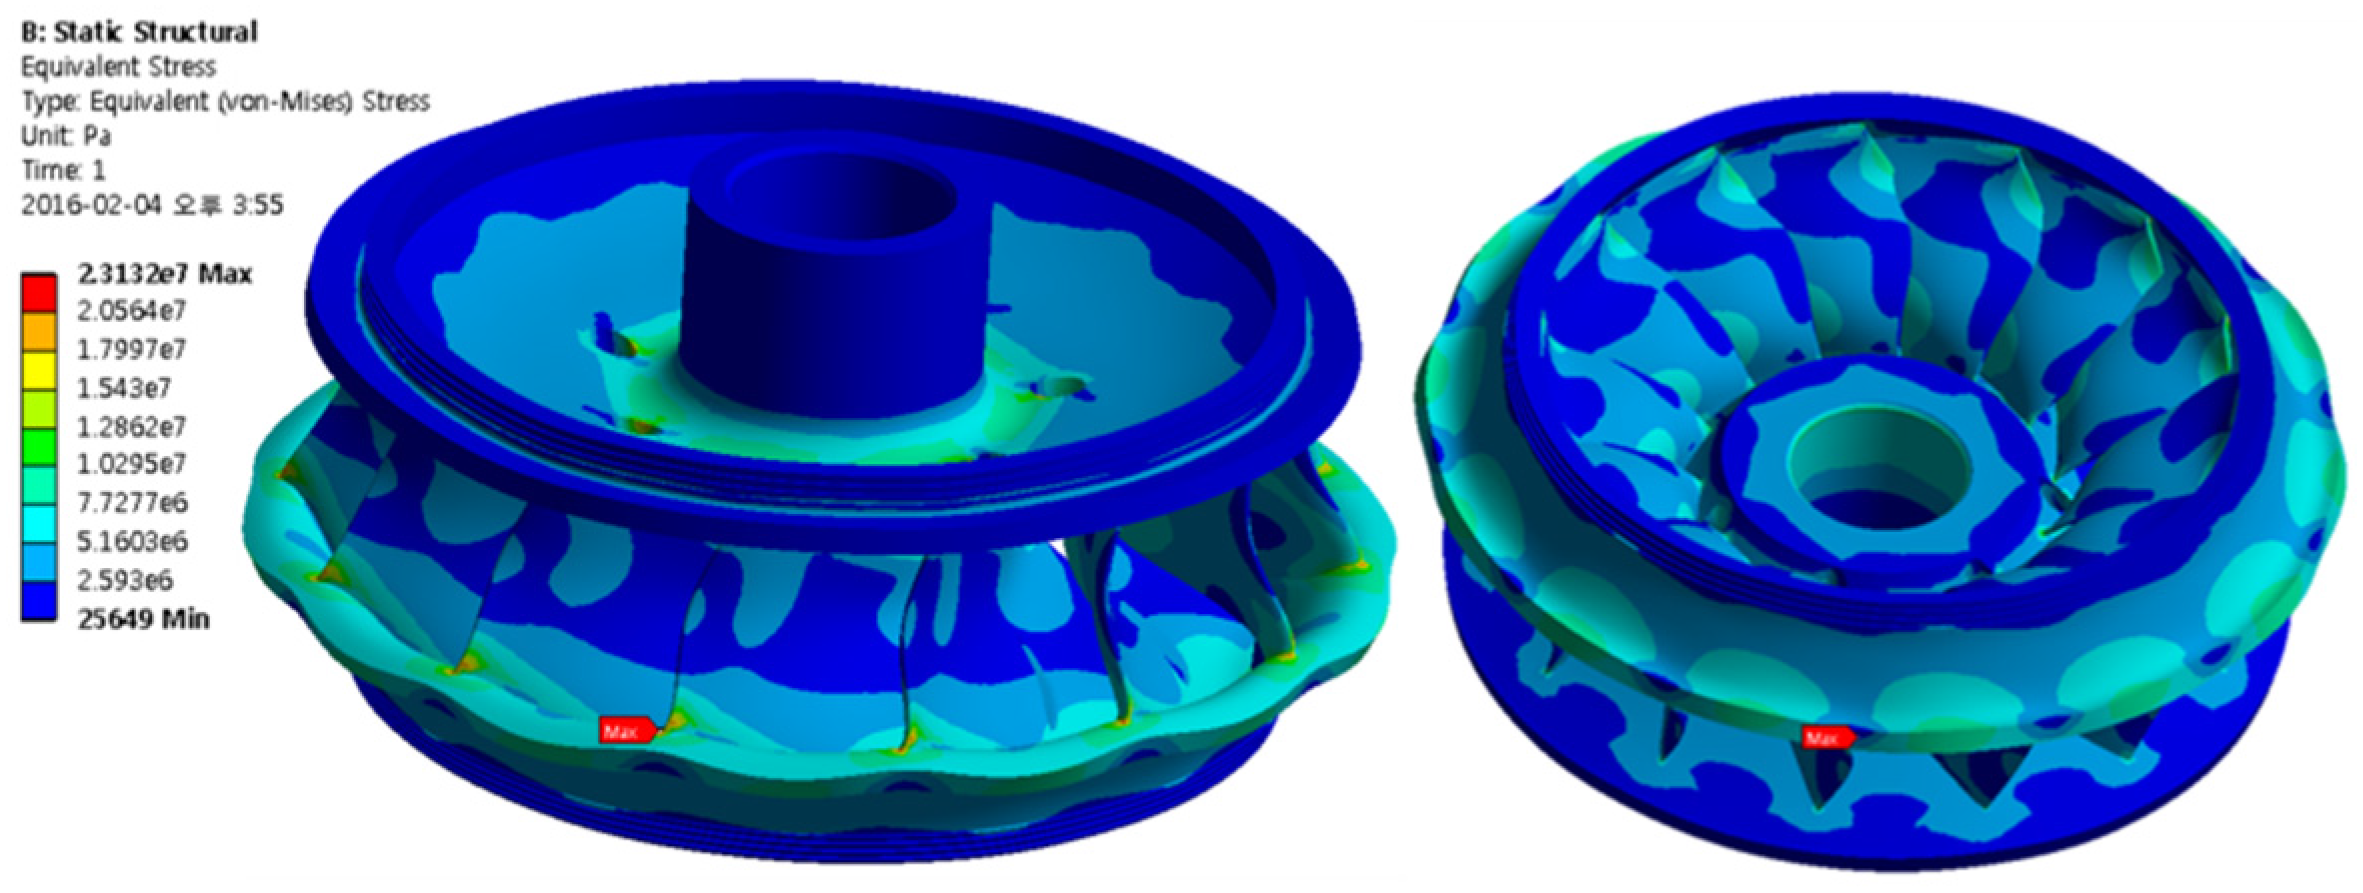
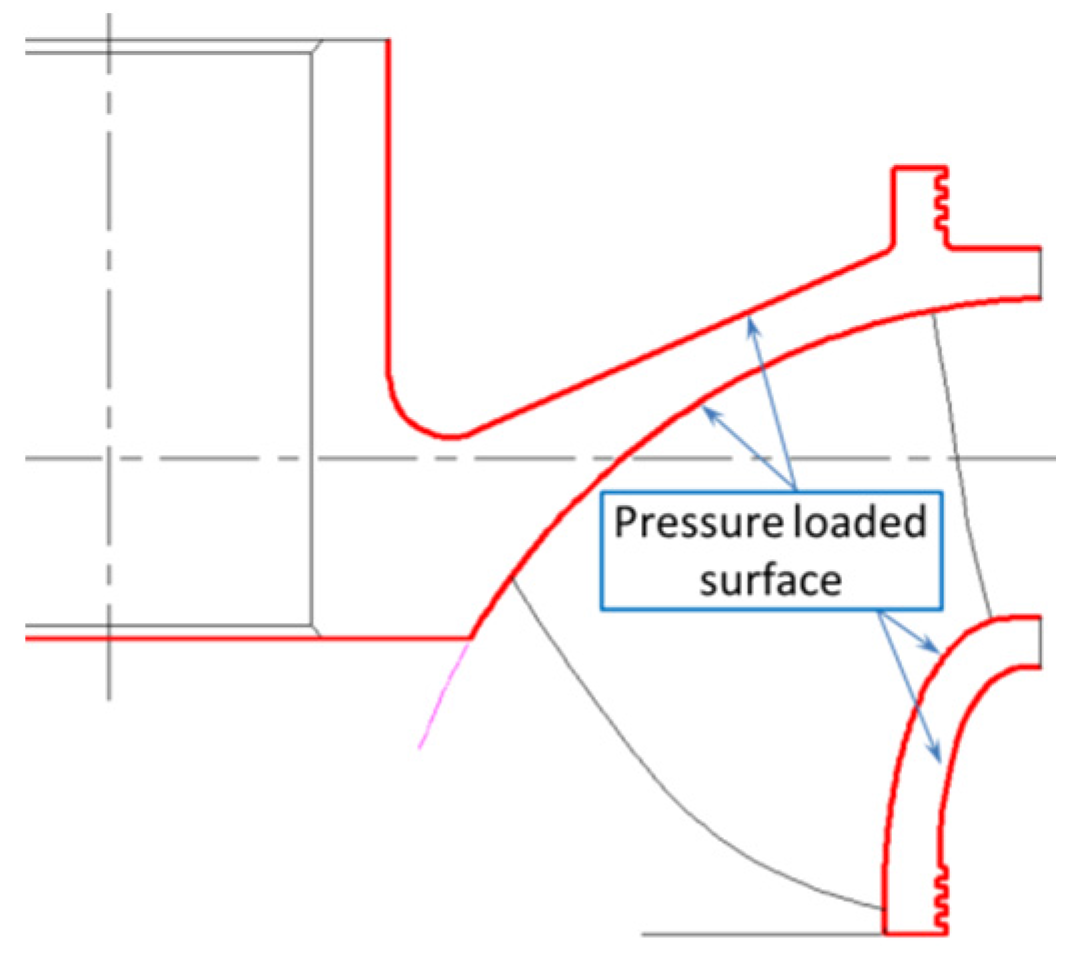
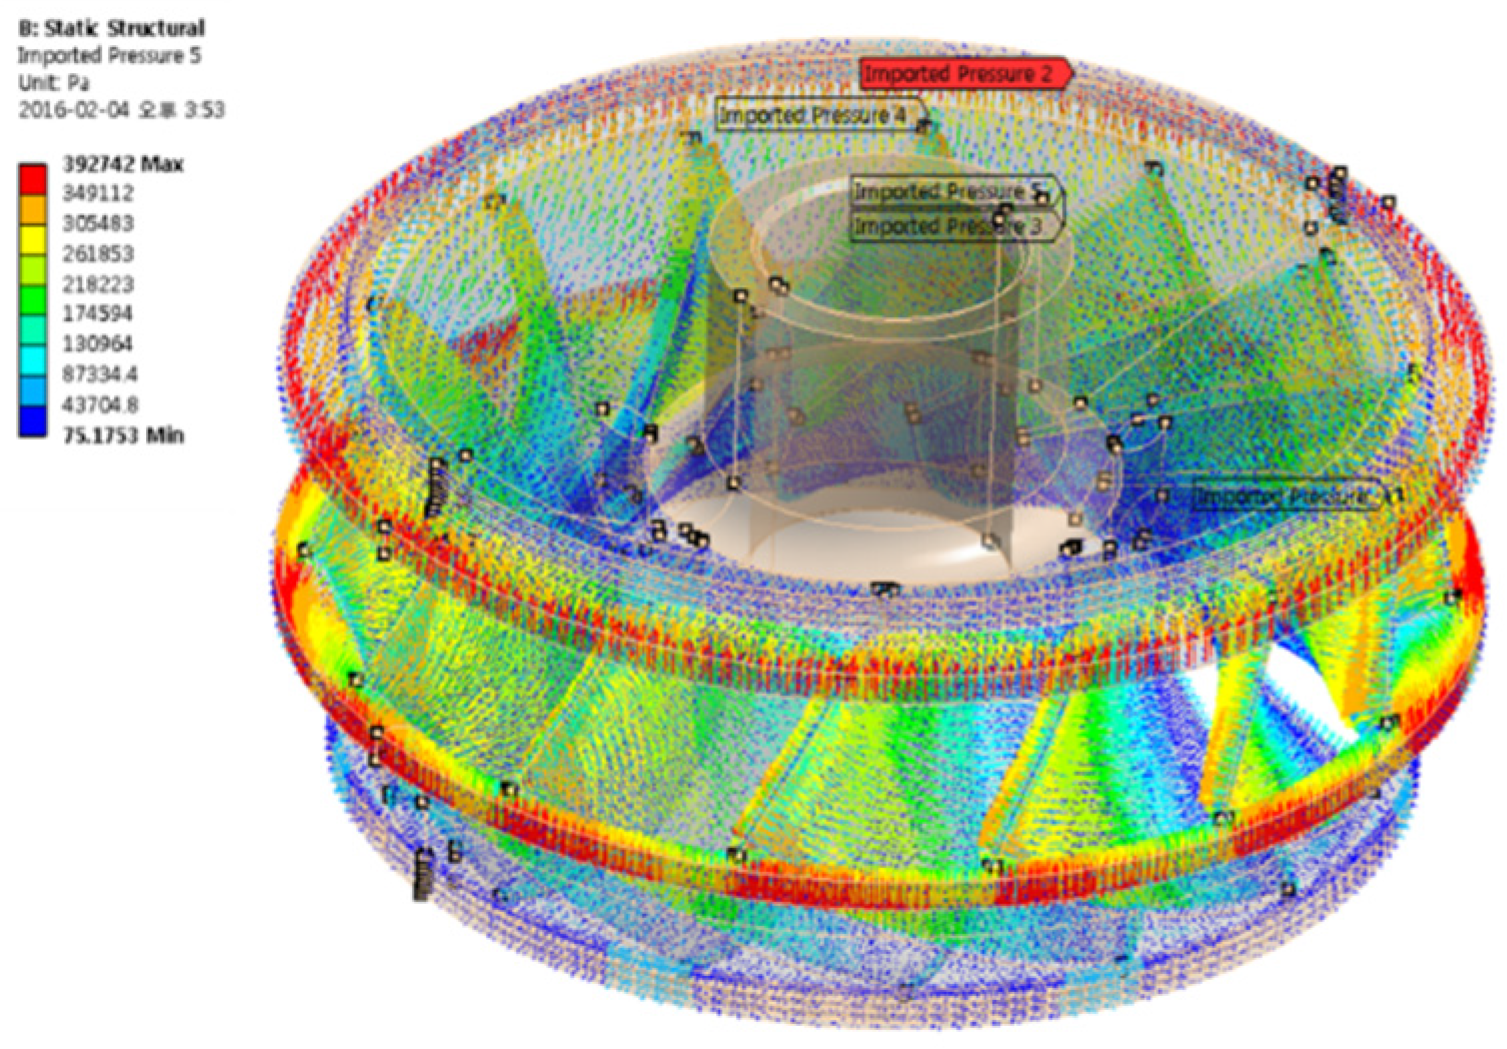
3.4. Fluid-Structure Interaction Analysis
4. Conclusions
Acknowledgments
Author Contributions
Conflicts of Interest
Nomenclature
| △ptotal | Total pressure difference |
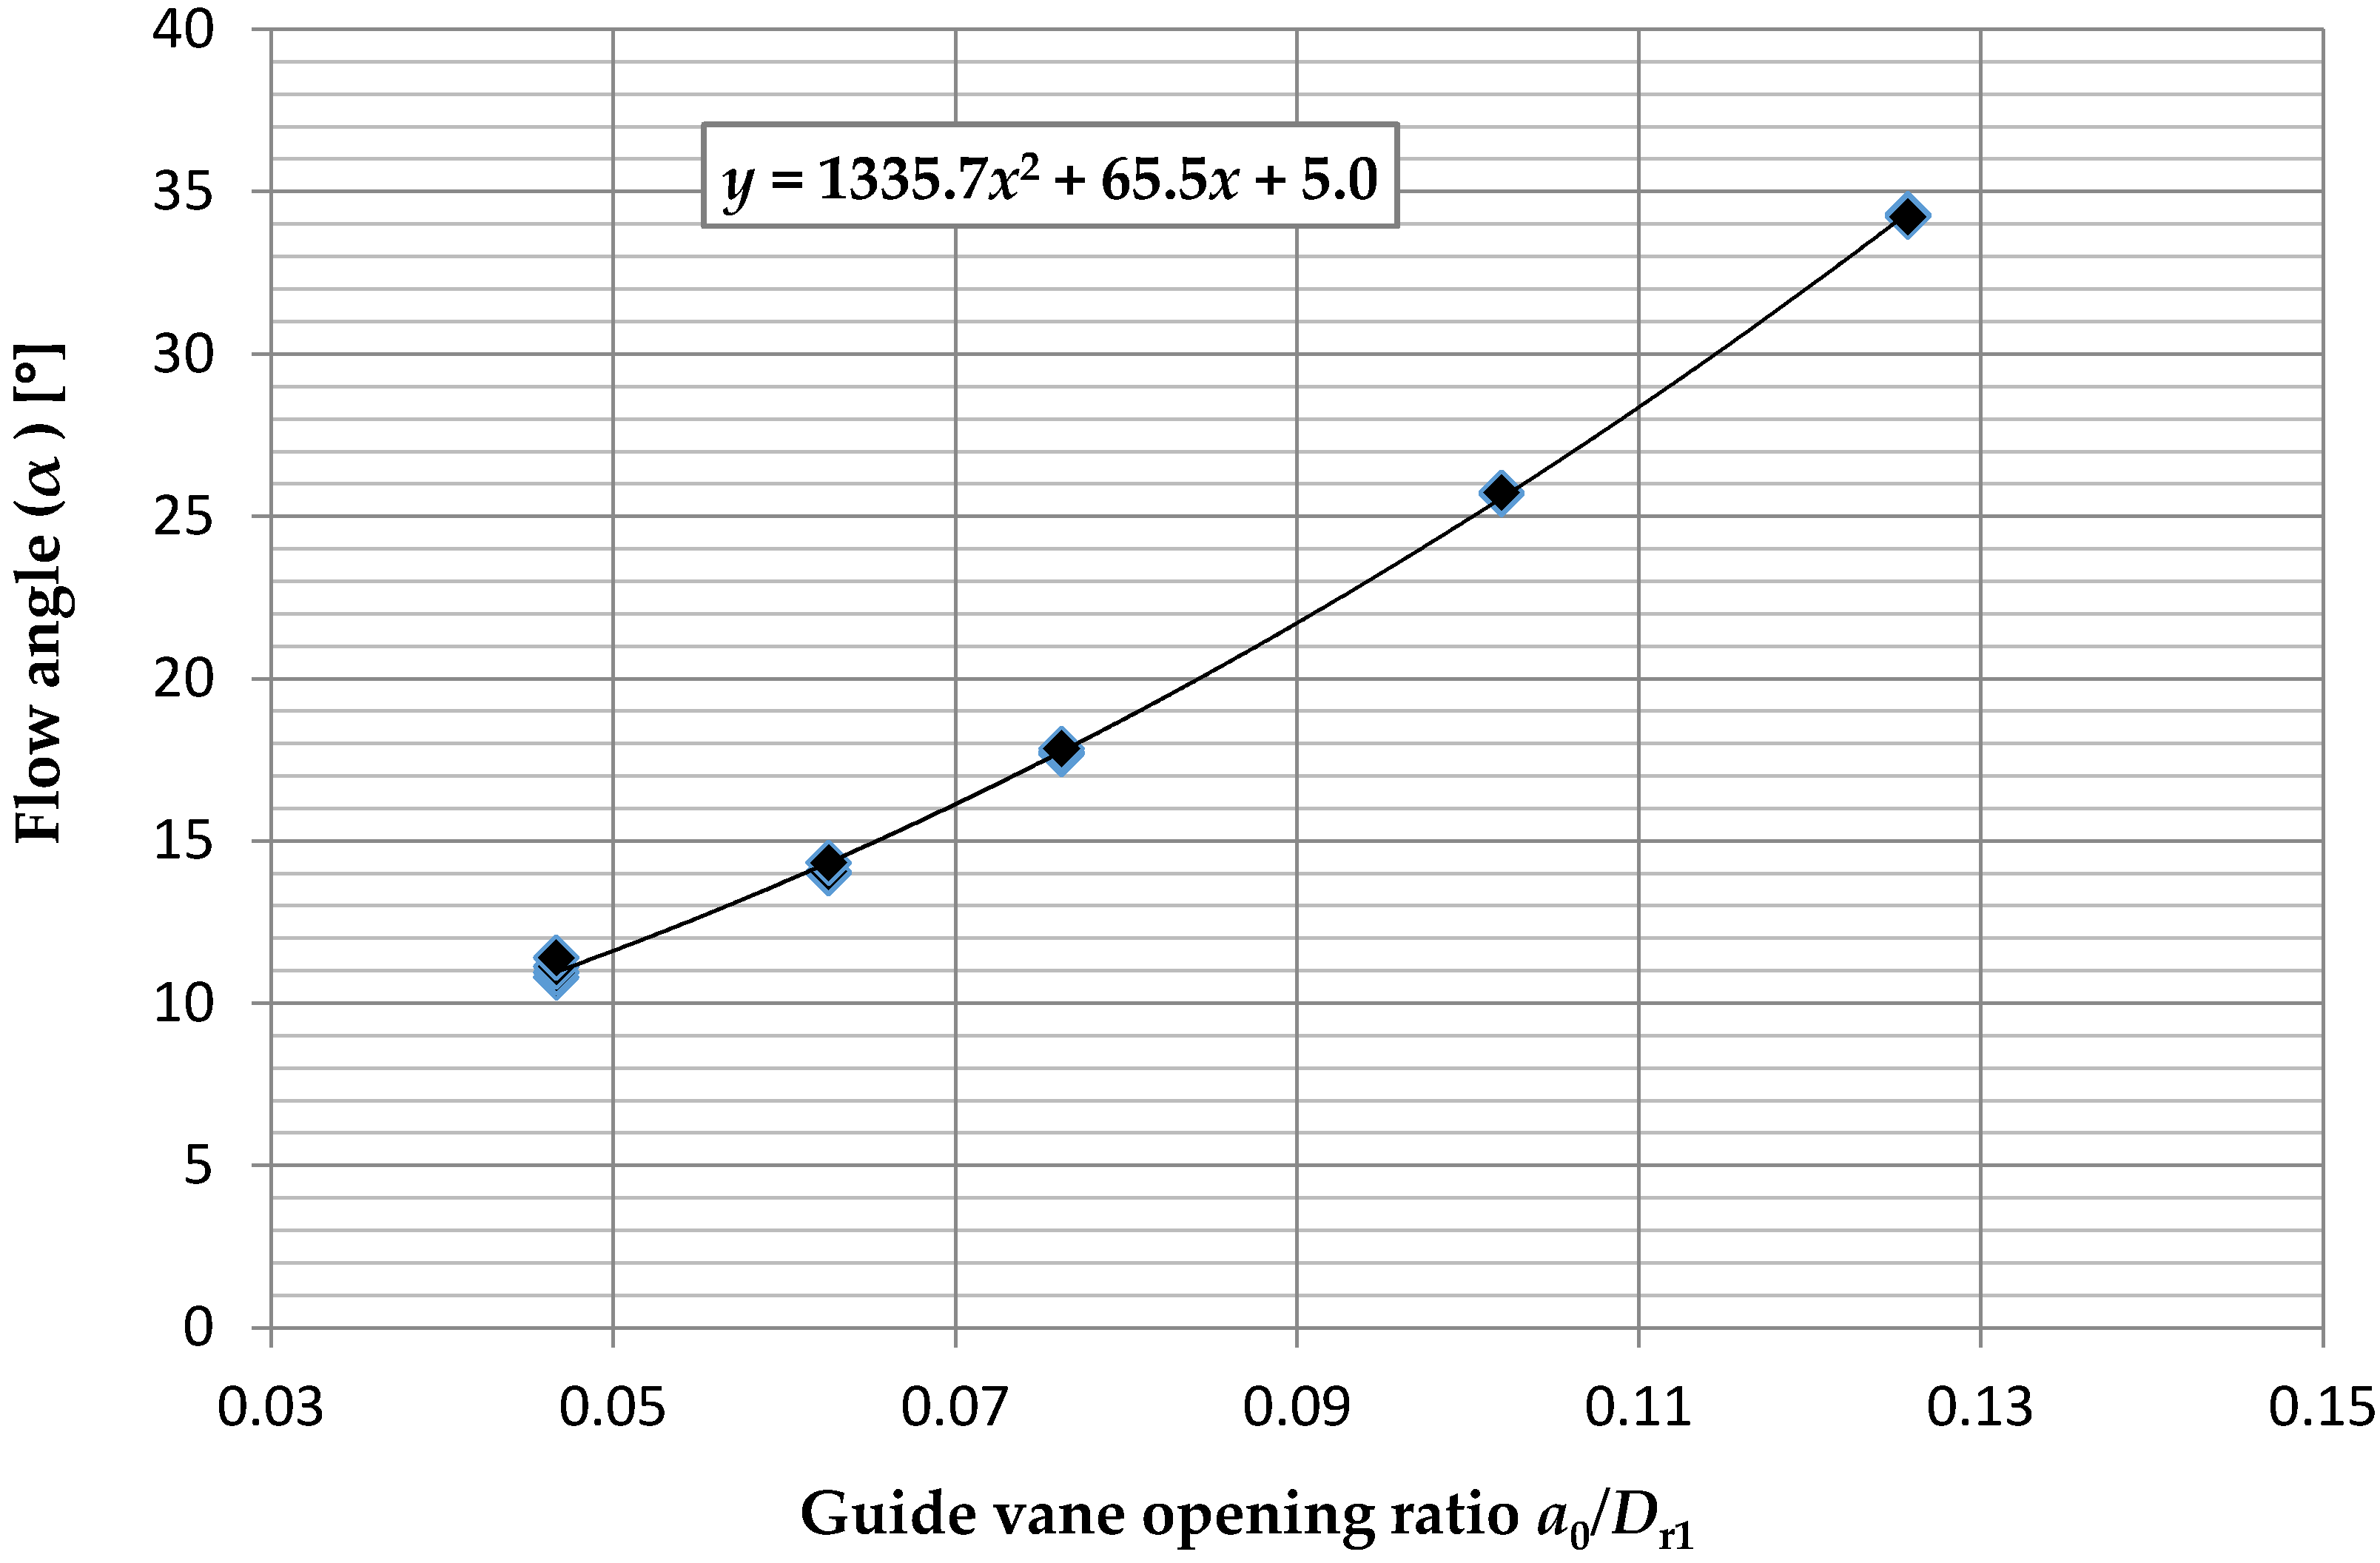
| a0 | Guide vane opening |
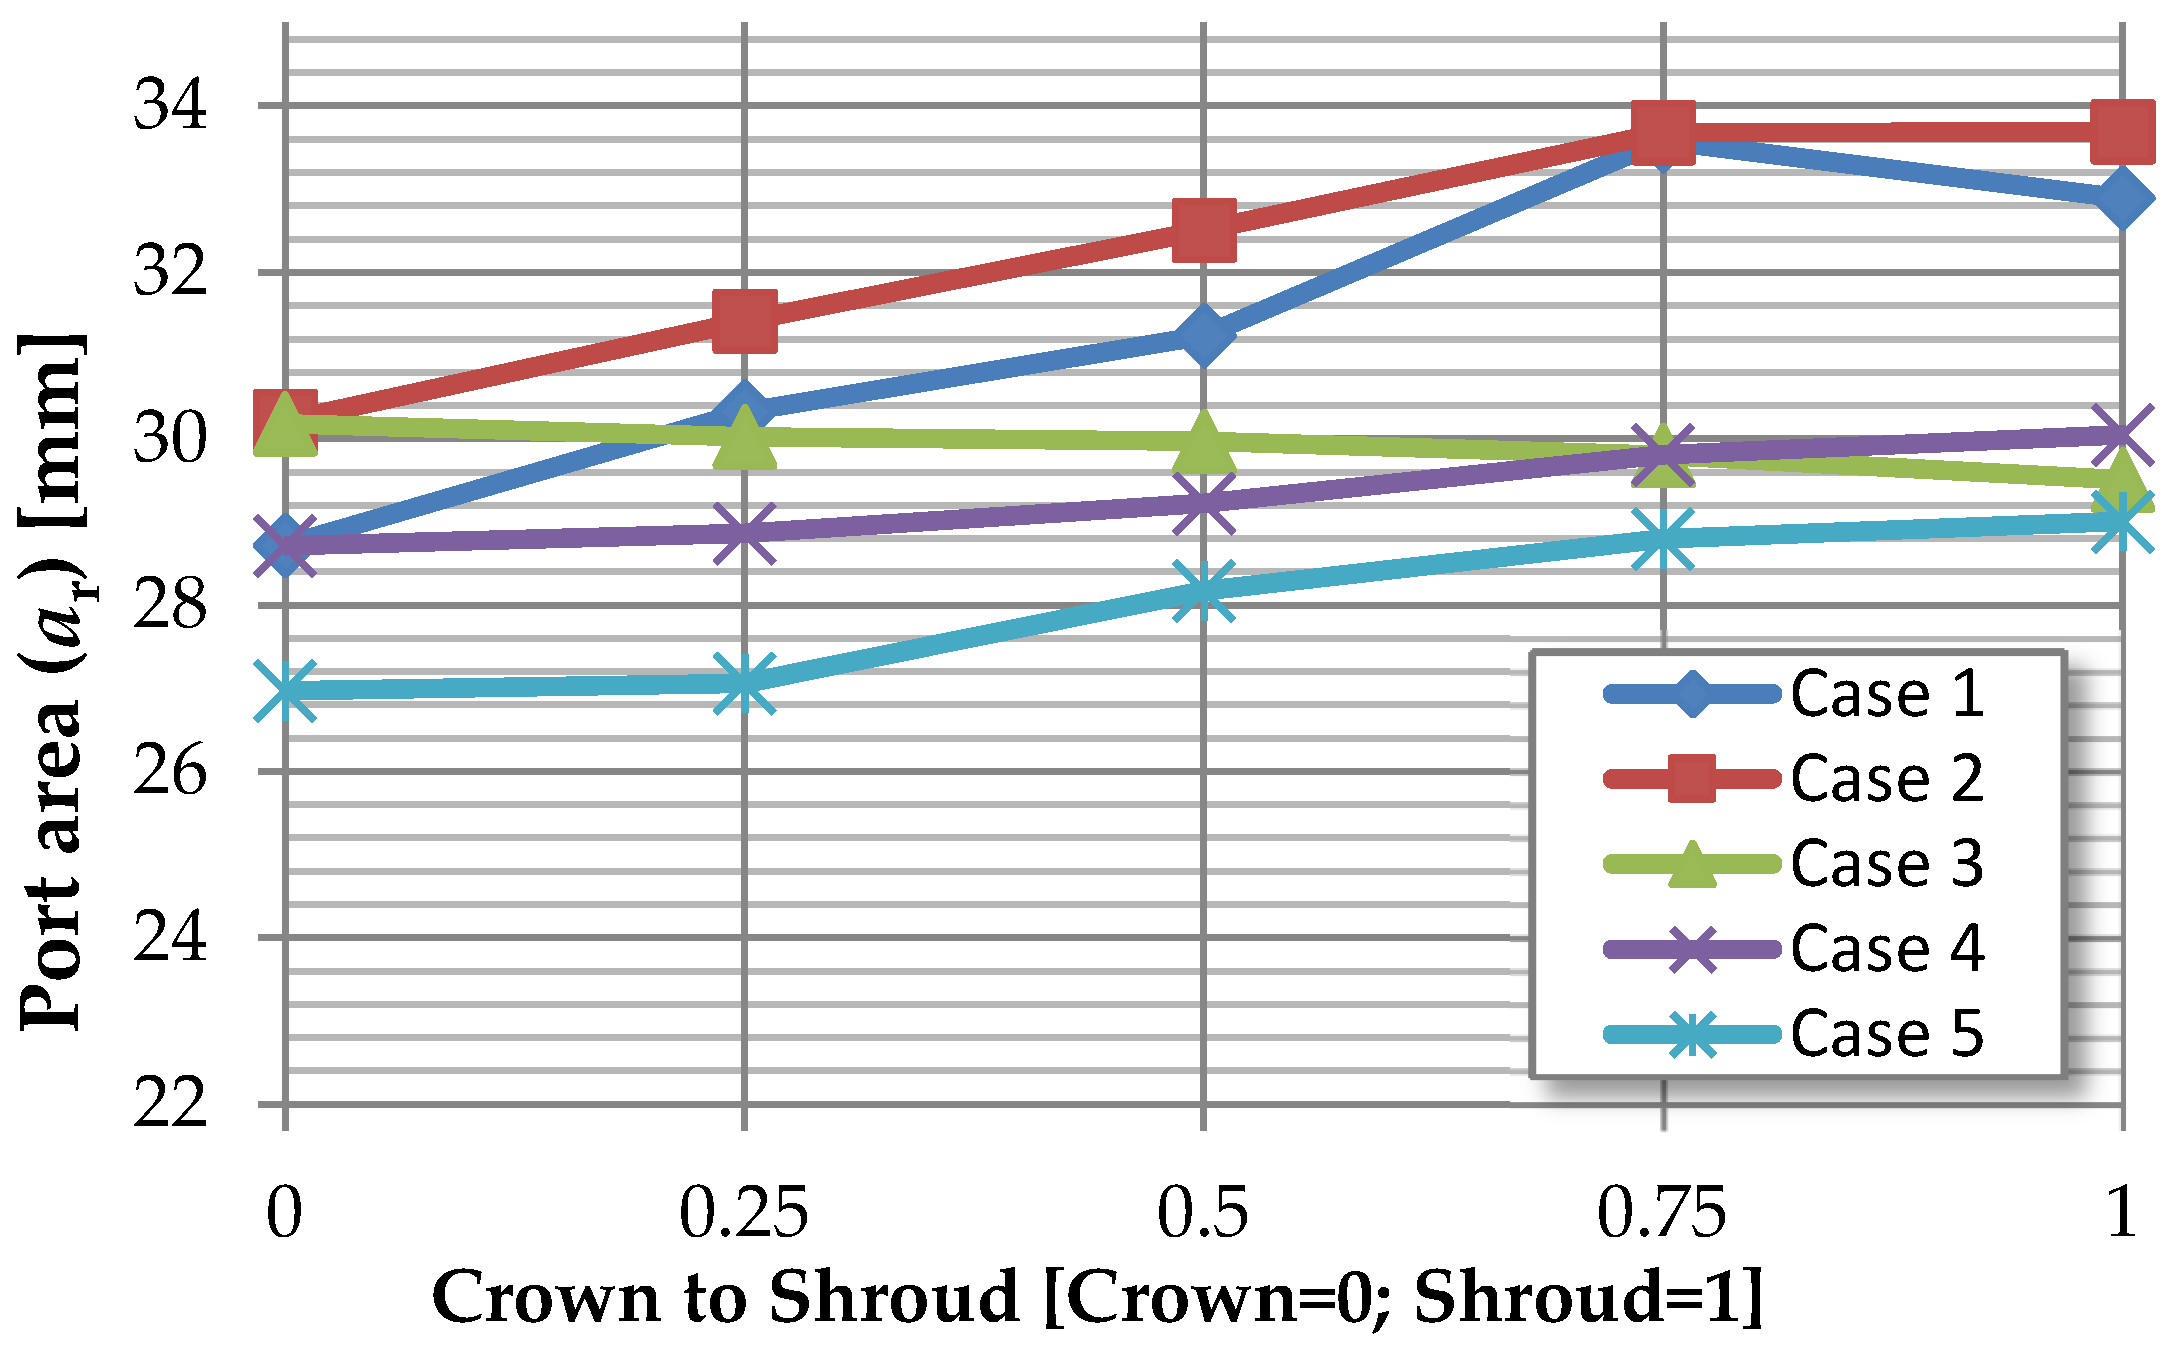
| ar | Port area |
| Bg | Guide vane height |
| Dr1 | Runner inlet diameter |
| g | Gravitational acceleration |
| He | Effective head |
| Hgv | Guide vane head loss |
| Hloss | Pressure loss |
| Hloss runner | Runner pressure loss |
| Hth | Euler head |
| m | Hydraulic radius |
| N | Rotational speed |
| Ns | Specific speed |
| p | Pressure |
| Q | Flow rate |
| Q11 | Unit flow rate |
| T | Torque |
| U | Peripheral velocity |
| Vth | Velocity |
| Vu | Rotational component of absolute velocity |
| W | Relative velocity |
| Zg | Guide vane number |
| α | Flow angle |
| β | Relative flow angle |
| βb | Blade angle |
| ζ | Pressure loss coefficient |
| ρ | Water density |
| ω | Angular speed |
Abbreviations
| DT | Draft tube |
| GV | Guide vane |
| RV | Runner vane |
| SV | Stay vane |
References
- Choi, G.W. K-Water 2014 Sustainability Report; K-Water: Deajeon, Korea, 2014. [Google Scholar]
- Krishna, H.R. Hydraulic Design of Hydraulic Machinery; Ashgate Publishing Limited: Aldershot Hants, UK, 1997. [Google Scholar]
- Laughton, M.A.; Warne, D.F. Electrical Engineer’s Reference Book; George Newnes Ltd.: Oxford, UK, 2003. [Google Scholar]
- Wei, Q.; Zhu, B.; Choi, Y.D. Internal Flow Characteristics in the Draft Tube of a Francis Turbine. J. Korean Soc. Mar. Eng. 2012, 36, 618–626. [Google Scholar] [CrossRef]
- Wei, Q.; Choi, Y.D. The Influence of Guide Vane Opening on the Internal Flow of a Francis Turbine. J. Korean Soc. Mar. Eng. 2013, 37, 274–281. [Google Scholar] [CrossRef]
- Ariff, M.; Salim, S.M.; Cheah, S.C. Wall Y+ Approach for Dealing with Turbulent Flow over a Surface Mounted Cube: Part 1—Low Reynolds Number. In Proceedings of the 7th International Conference on CFD in the Minerals and Process Industries, Melbourne, Australia, 9–11 December 2009.
- Ariff, M.; Salim, S.M.; Cheah, S.C. Wall Y+ Approach for Dealing with Turbulent Flow over a Surface Mounted Cube: Part 2—High Reynolds Number. In Proceedings of the 7th International Conference on CFD in the Minerals and Process Industries, Melbourne, Australia, 9–11 December 2009.
- Nechleba, M. Hydraulic Turbine: Their Design and Equipment; Artia: Prague, Czechoslovakia, 1957. [Google Scholar]
- Mei, Z.Y. Mechanical Design and Manufacturing of Hydraulic Machinery; Avebury Technical: Hants, UK, 1991. [Google Scholar]
- Ingram, G. Basic Concepts in Turbomachinery; Bookboon: London, UK, 2009. [Google Scholar]
- Gorla, R.S.R.; Khan, A.A. Turbomachinery: Design and Theory; Marcel Dekker: New York, NY, USA, 2003. [Google Scholar]
- Wu, J.; Shimmei, K.; Tani, K.; Niikura, K.; Sato, J. CFD-Based Design Optimization for Hydro Turbines. J. Fluids Eng. 2007, 129, 159–168. [Google Scholar] [CrossRef]
- Alnaga, A.; Kueny, J.L. Optimal Design of Hydraulic Turbine Distributor. WSEAS Trans. Fluid Mech. 2008, 2, 175–185. [Google Scholar]
- Shukla, M.K.; Jain, R. CFD Analysis of 3-D Flow for Francis Turbine. Int. J. Mech. Eng. 2011, 2, 93–100. [Google Scholar]
- Navthar, R.R.; Tejas, J.; Saurabh, D.; Nitish, D.; Anand, A. CFD Analysis of Francis Turbine. Int. J. Eng. Sci. Technol. 2012, 4, 3194–3199. [Google Scholar]
- ANSYS Inc. “ANSYS CFX Documentation” Ver. 12, 2012. Available online: http://www.ansys.com (accessed on 1 May 2013).
- Saeed, R.A.; Galybin, A.N.; Popov, V. Modeling of Flow-Induced Stresses in a Francis Turbine Runner. Adv. Eng. Softw. 2010, 41, 1245–1255. [Google Scholar] [CrossRef]
- Xiao, R.; Wang, Z.; Luo, Y. Dynamic Stresses in a Francis turbine Runner Based on Fluid-Structure Interaction Analysis. Tsinghua Sci. Technol. 2008, 13, 587–592. [Google Scholar] [CrossRef]


© 2016 by the authors; licensee MDPI, Basel, Switzerland. This article is an open access article distributed under the terms and conditions of the Creative Commons by Attribution (CC-BY) license (http://creativecommons.org/licenses/by/4.0/).
Share and Cite
Chen, Z.; Singh, P.M.; Choi, Y.-D. Francis Turbine Blade Design on the Basis of Port Area and Loss Analysis. Energies 2016, 9, 164. https://doi.org/10.3390/en9030164
Chen Z, Singh PM, Choi Y-D. Francis Turbine Blade Design on the Basis of Port Area and Loss Analysis. Energies. 2016; 9(3):164. https://doi.org/10.3390/en9030164
Chicago/Turabian StyleChen, Zhenmu, Patrick M. Singh, and Young-Do Choi. 2016. "Francis Turbine Blade Design on the Basis of Port Area and Loss Analysis" Energies 9, no. 3: 164. https://doi.org/10.3390/en9030164