
Development of a Mobile Application for Building Energy Prediction Using Performance Prediction Model

Abstract
:1. Introduction
1.1. Background
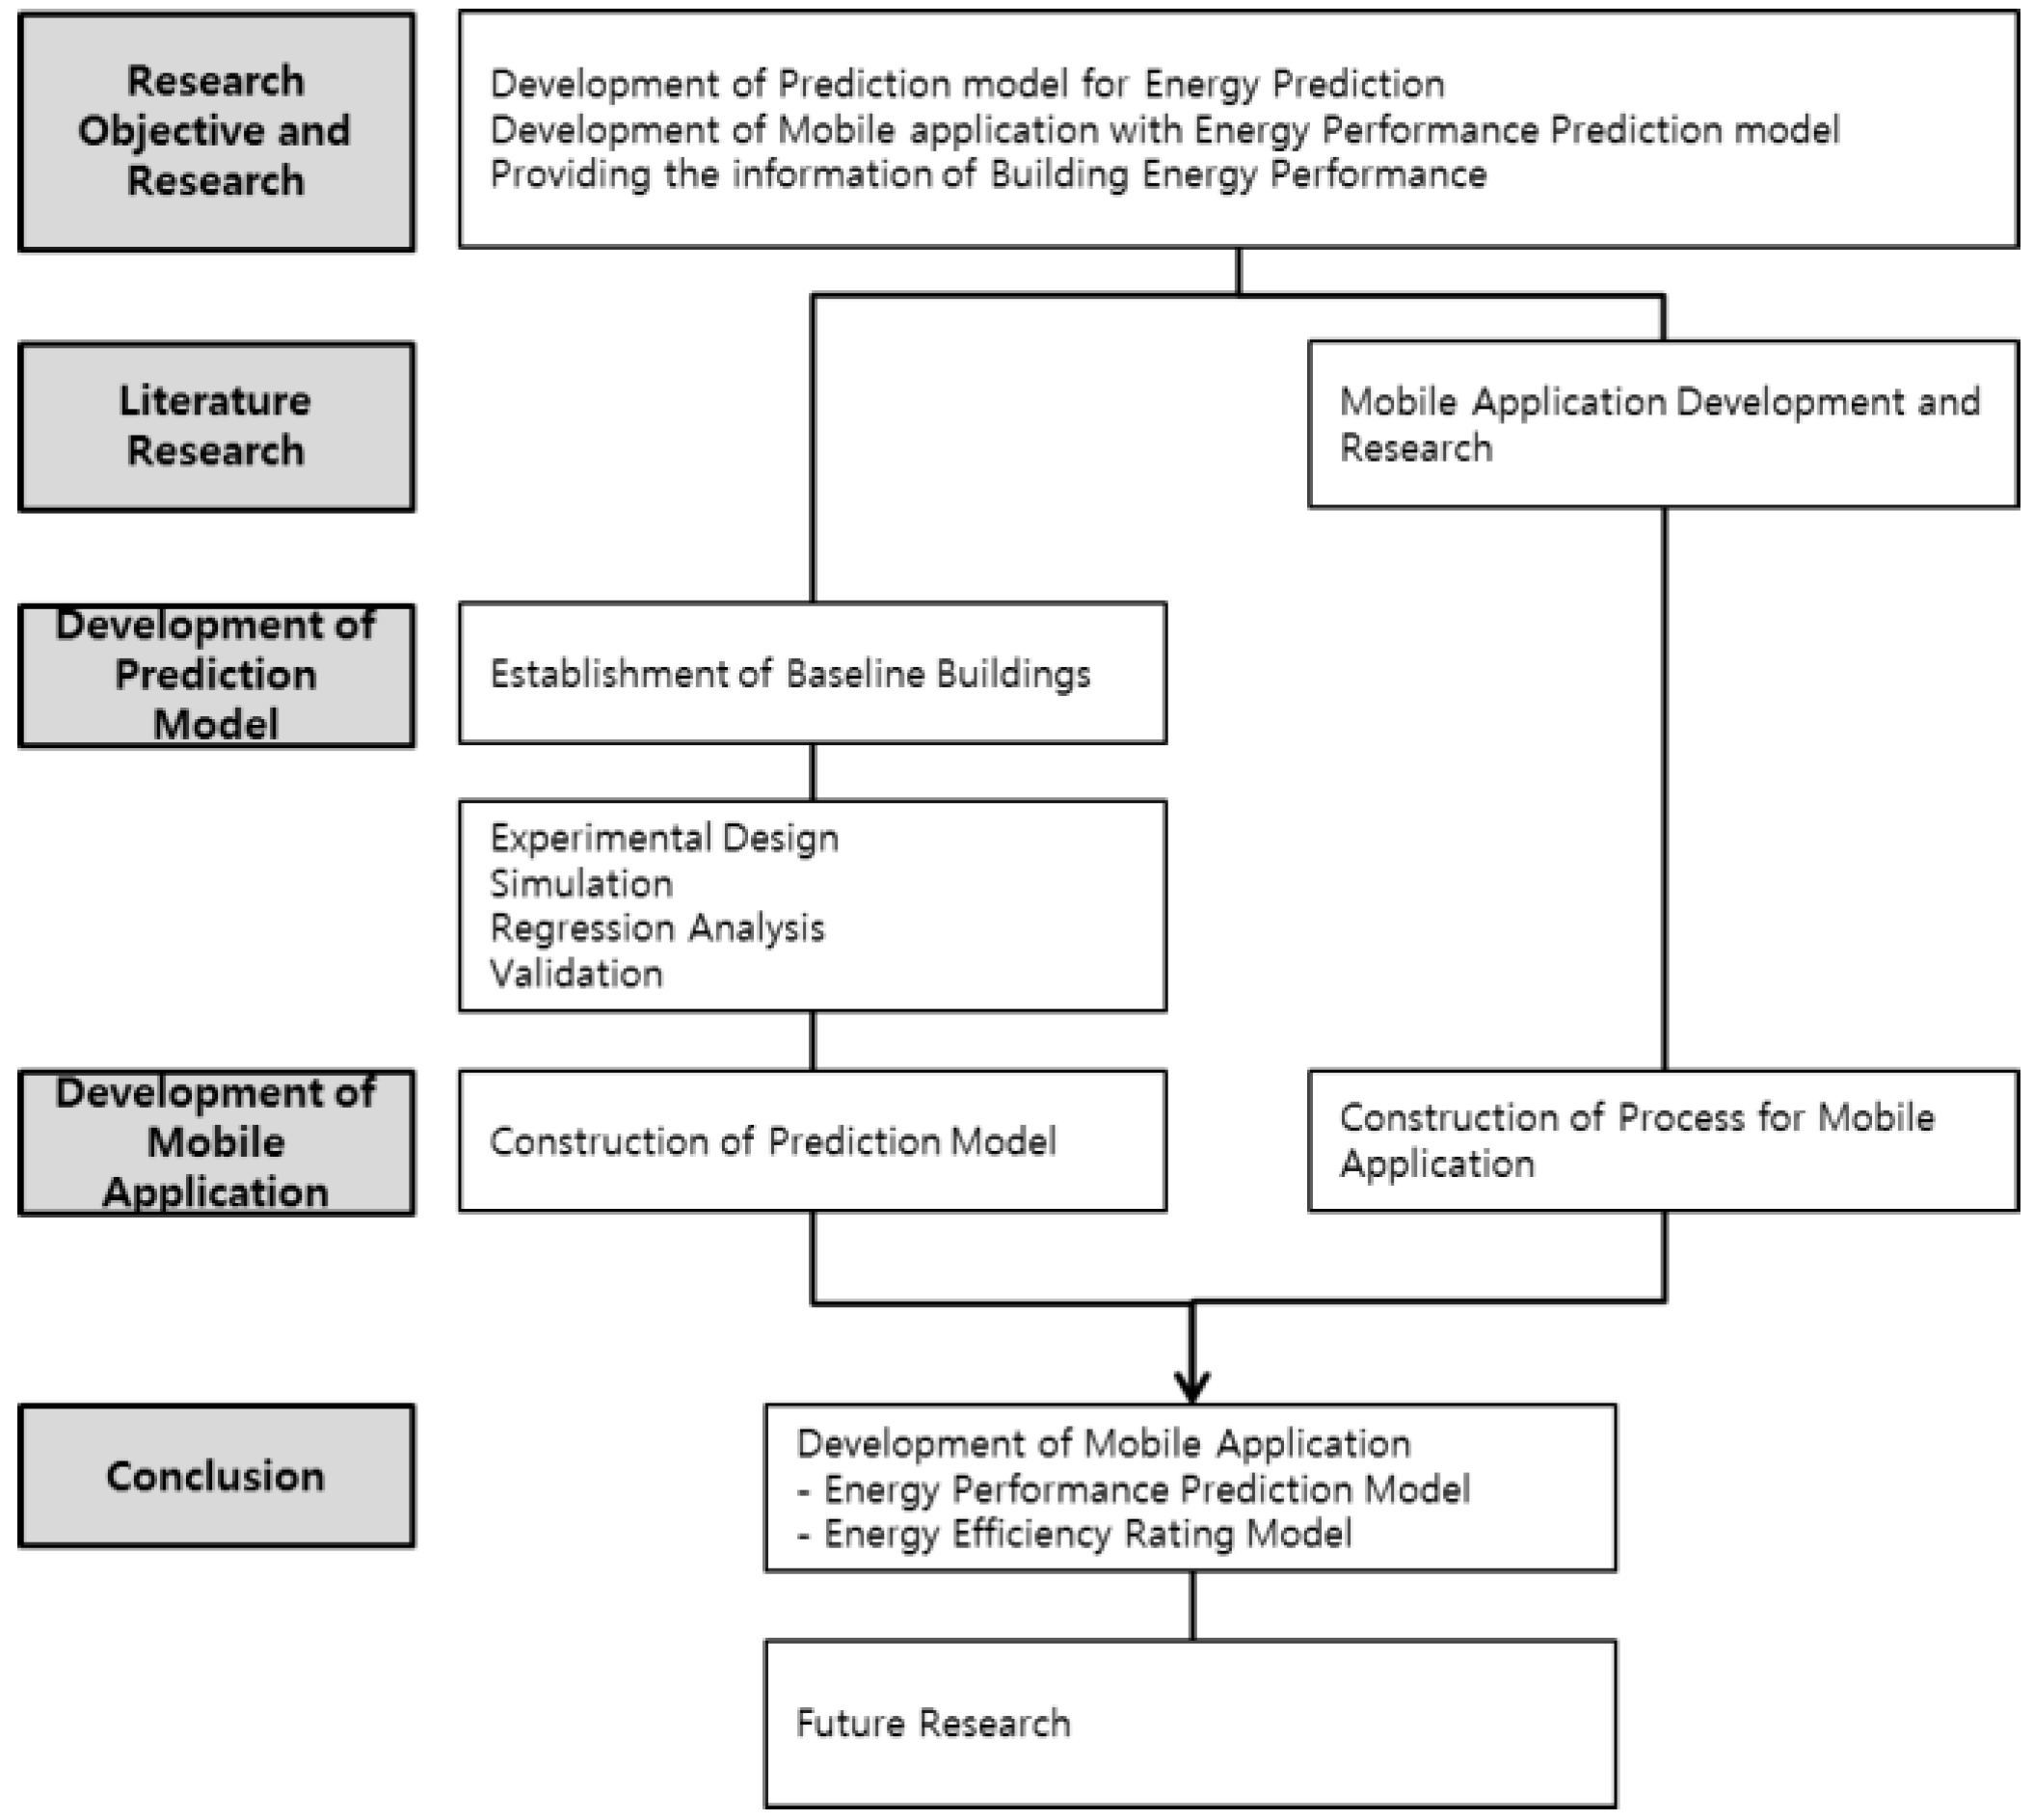
1.2. Study Method
2. Research and Development of Mobile Applications for Building Construction
3. Required Conditions of Performance Prediction Model to Easily Make Smarter Day-to-Day Energy Management Decisions
3.1. Simplifying the Input Requirements
3.2. Critical Input Parameters
3.3. Identification of the Key Variables
4. Development of the Energy Performance Prediction Model
4.1. Development of Building Load Prediction Formula
4.1.1. Baseline Model
4.1.2. Applicable Ranges of Each Parameter
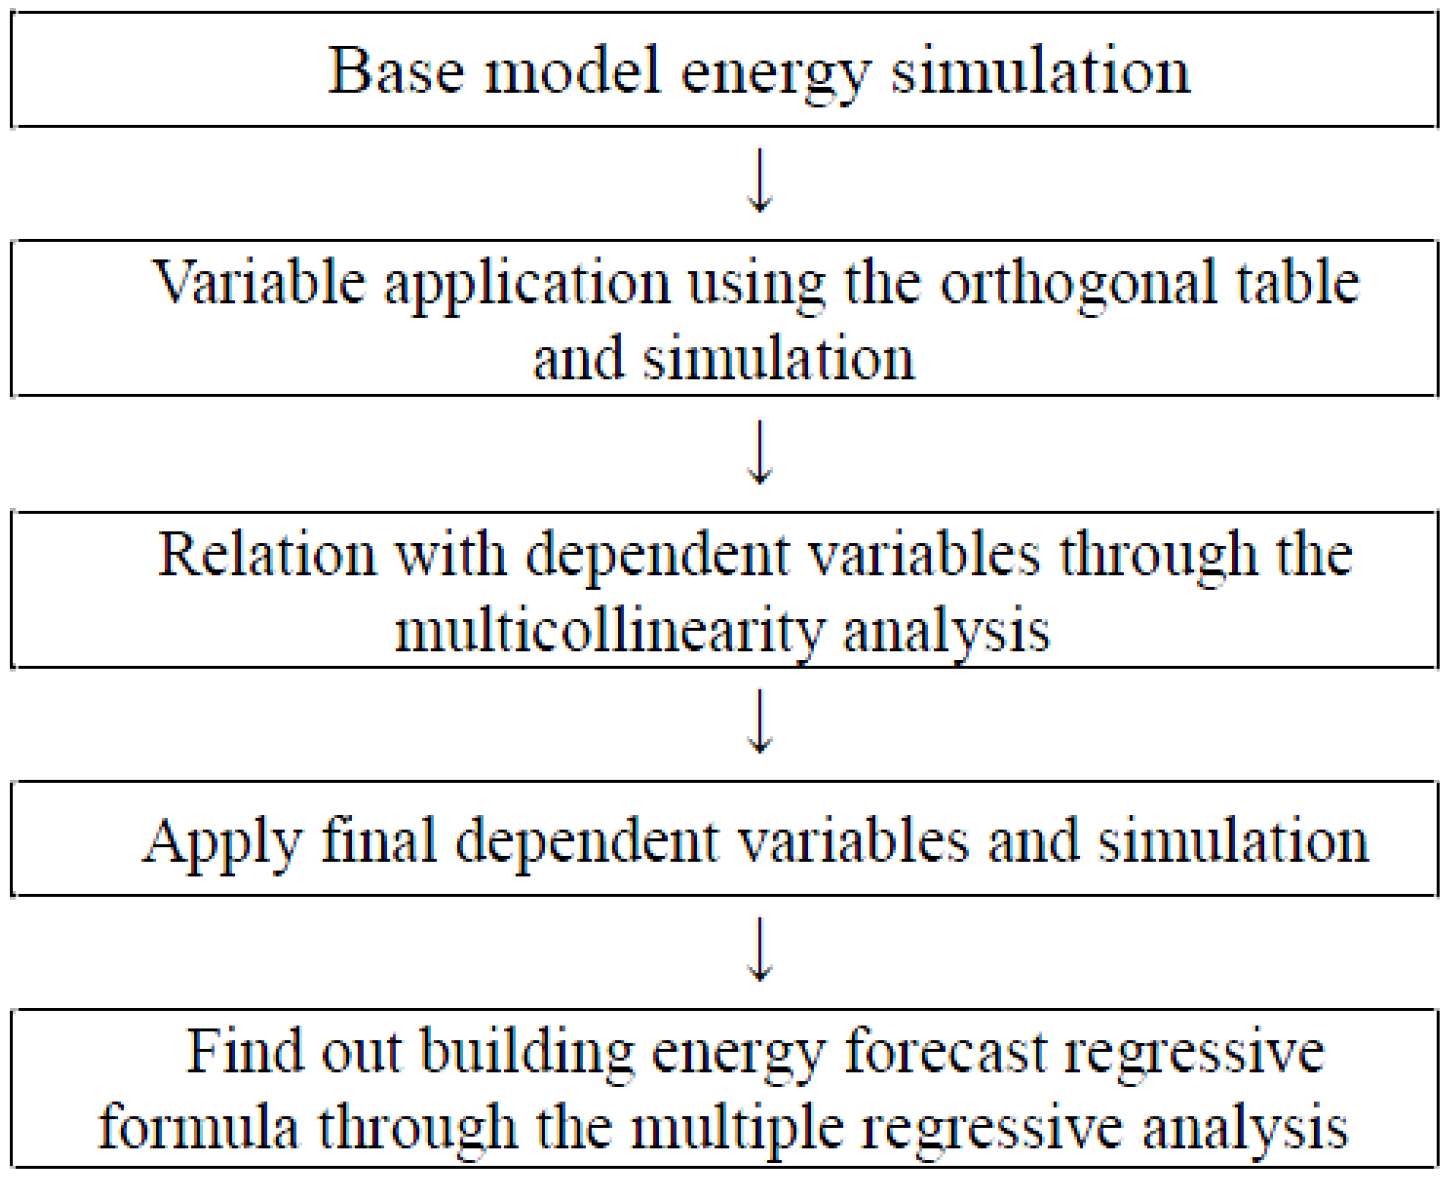
4.1.3. Statistical Approach
4.1.4. Results
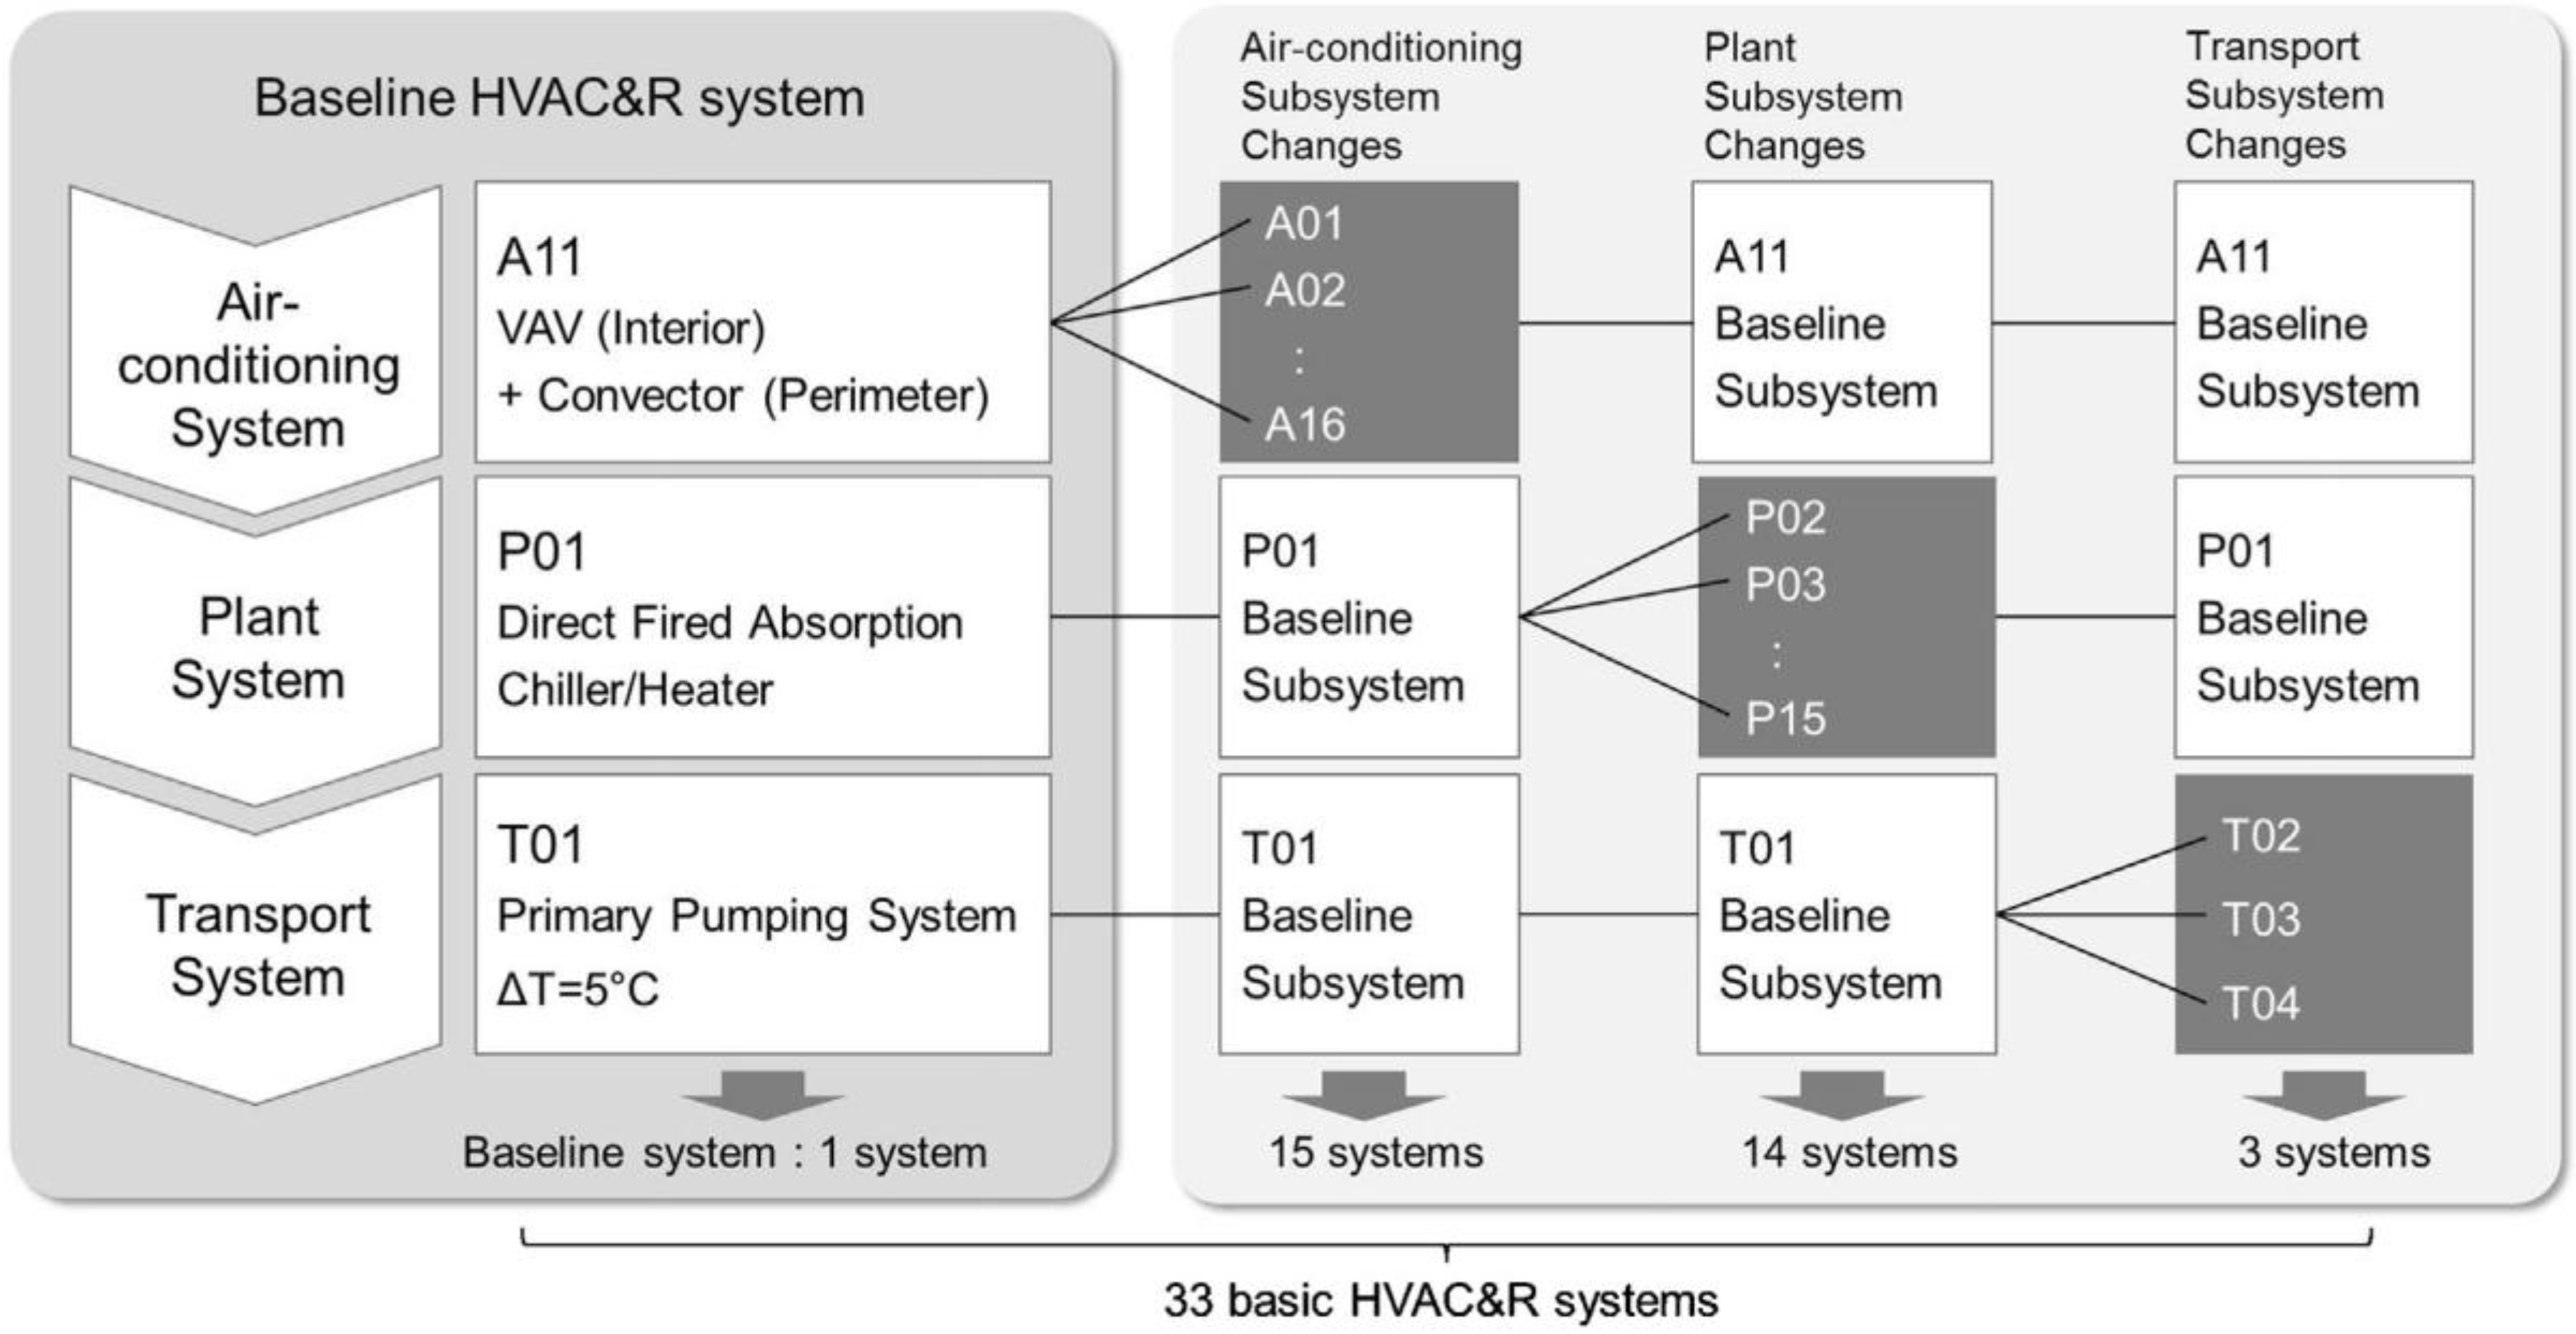
4.2. Heating, Ventilating, Air Conditioning and Refrigerating System Energy Demand
4.3. Hotwater, Lighting, and Electricity Demand
5. Development of Mobile Application
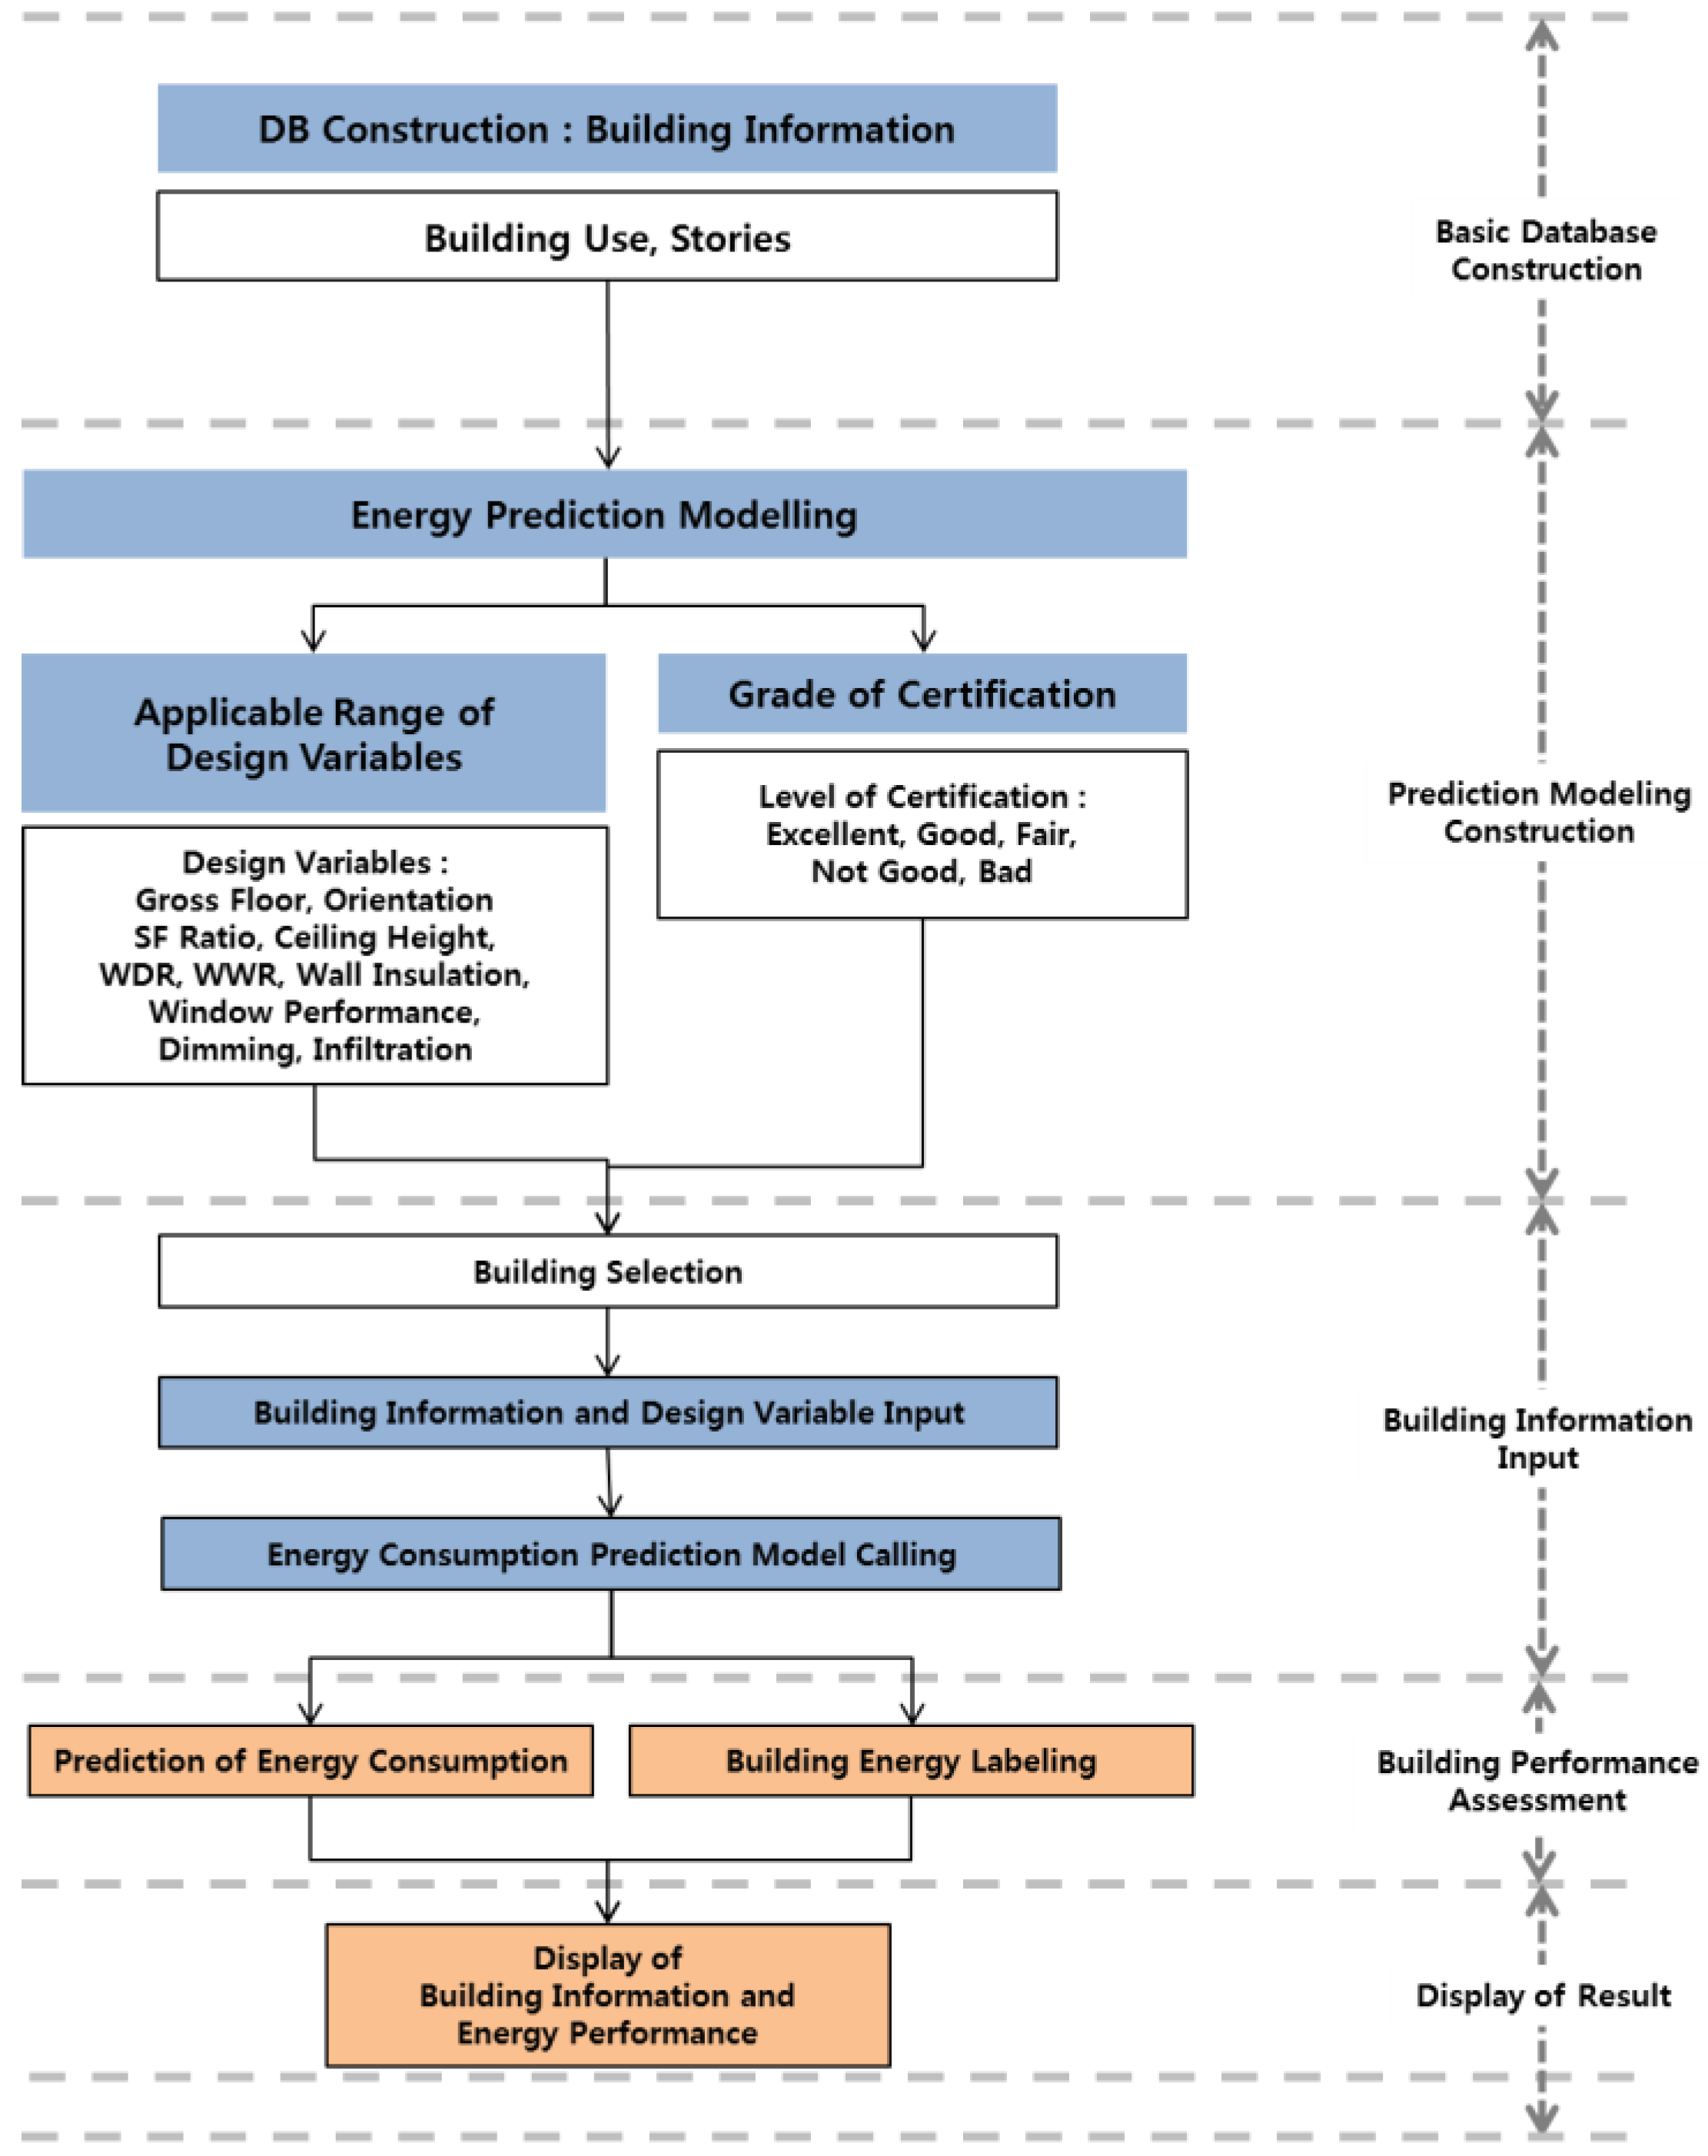
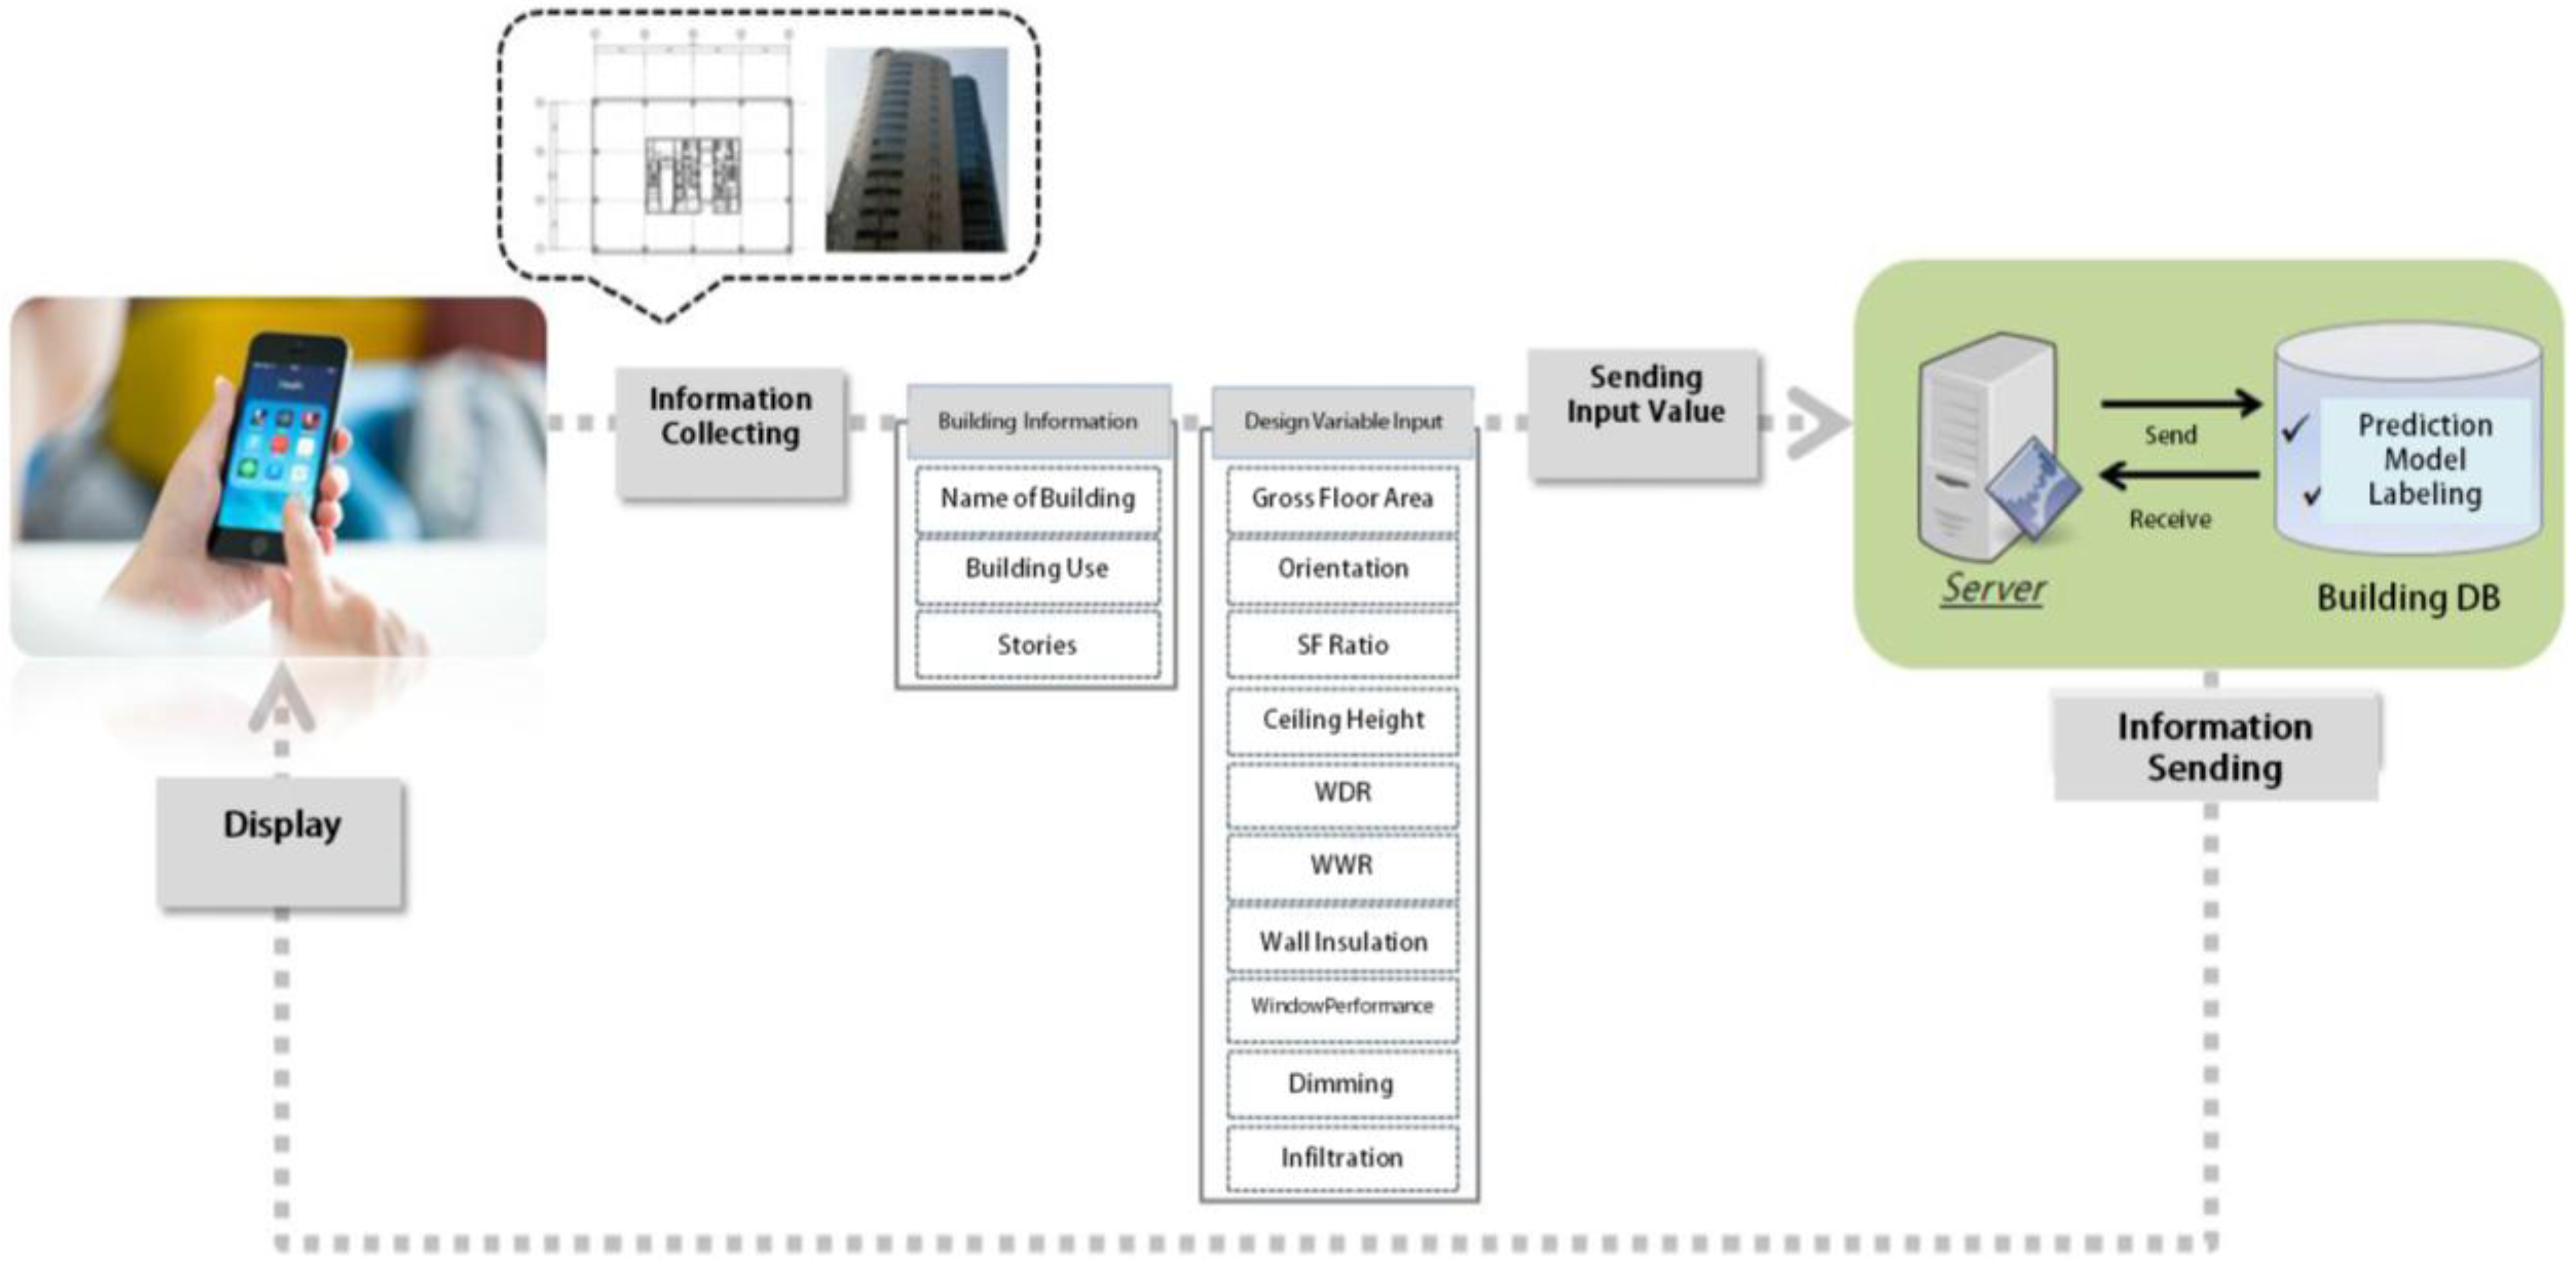
5.1. Mobile Application Process and Configuration
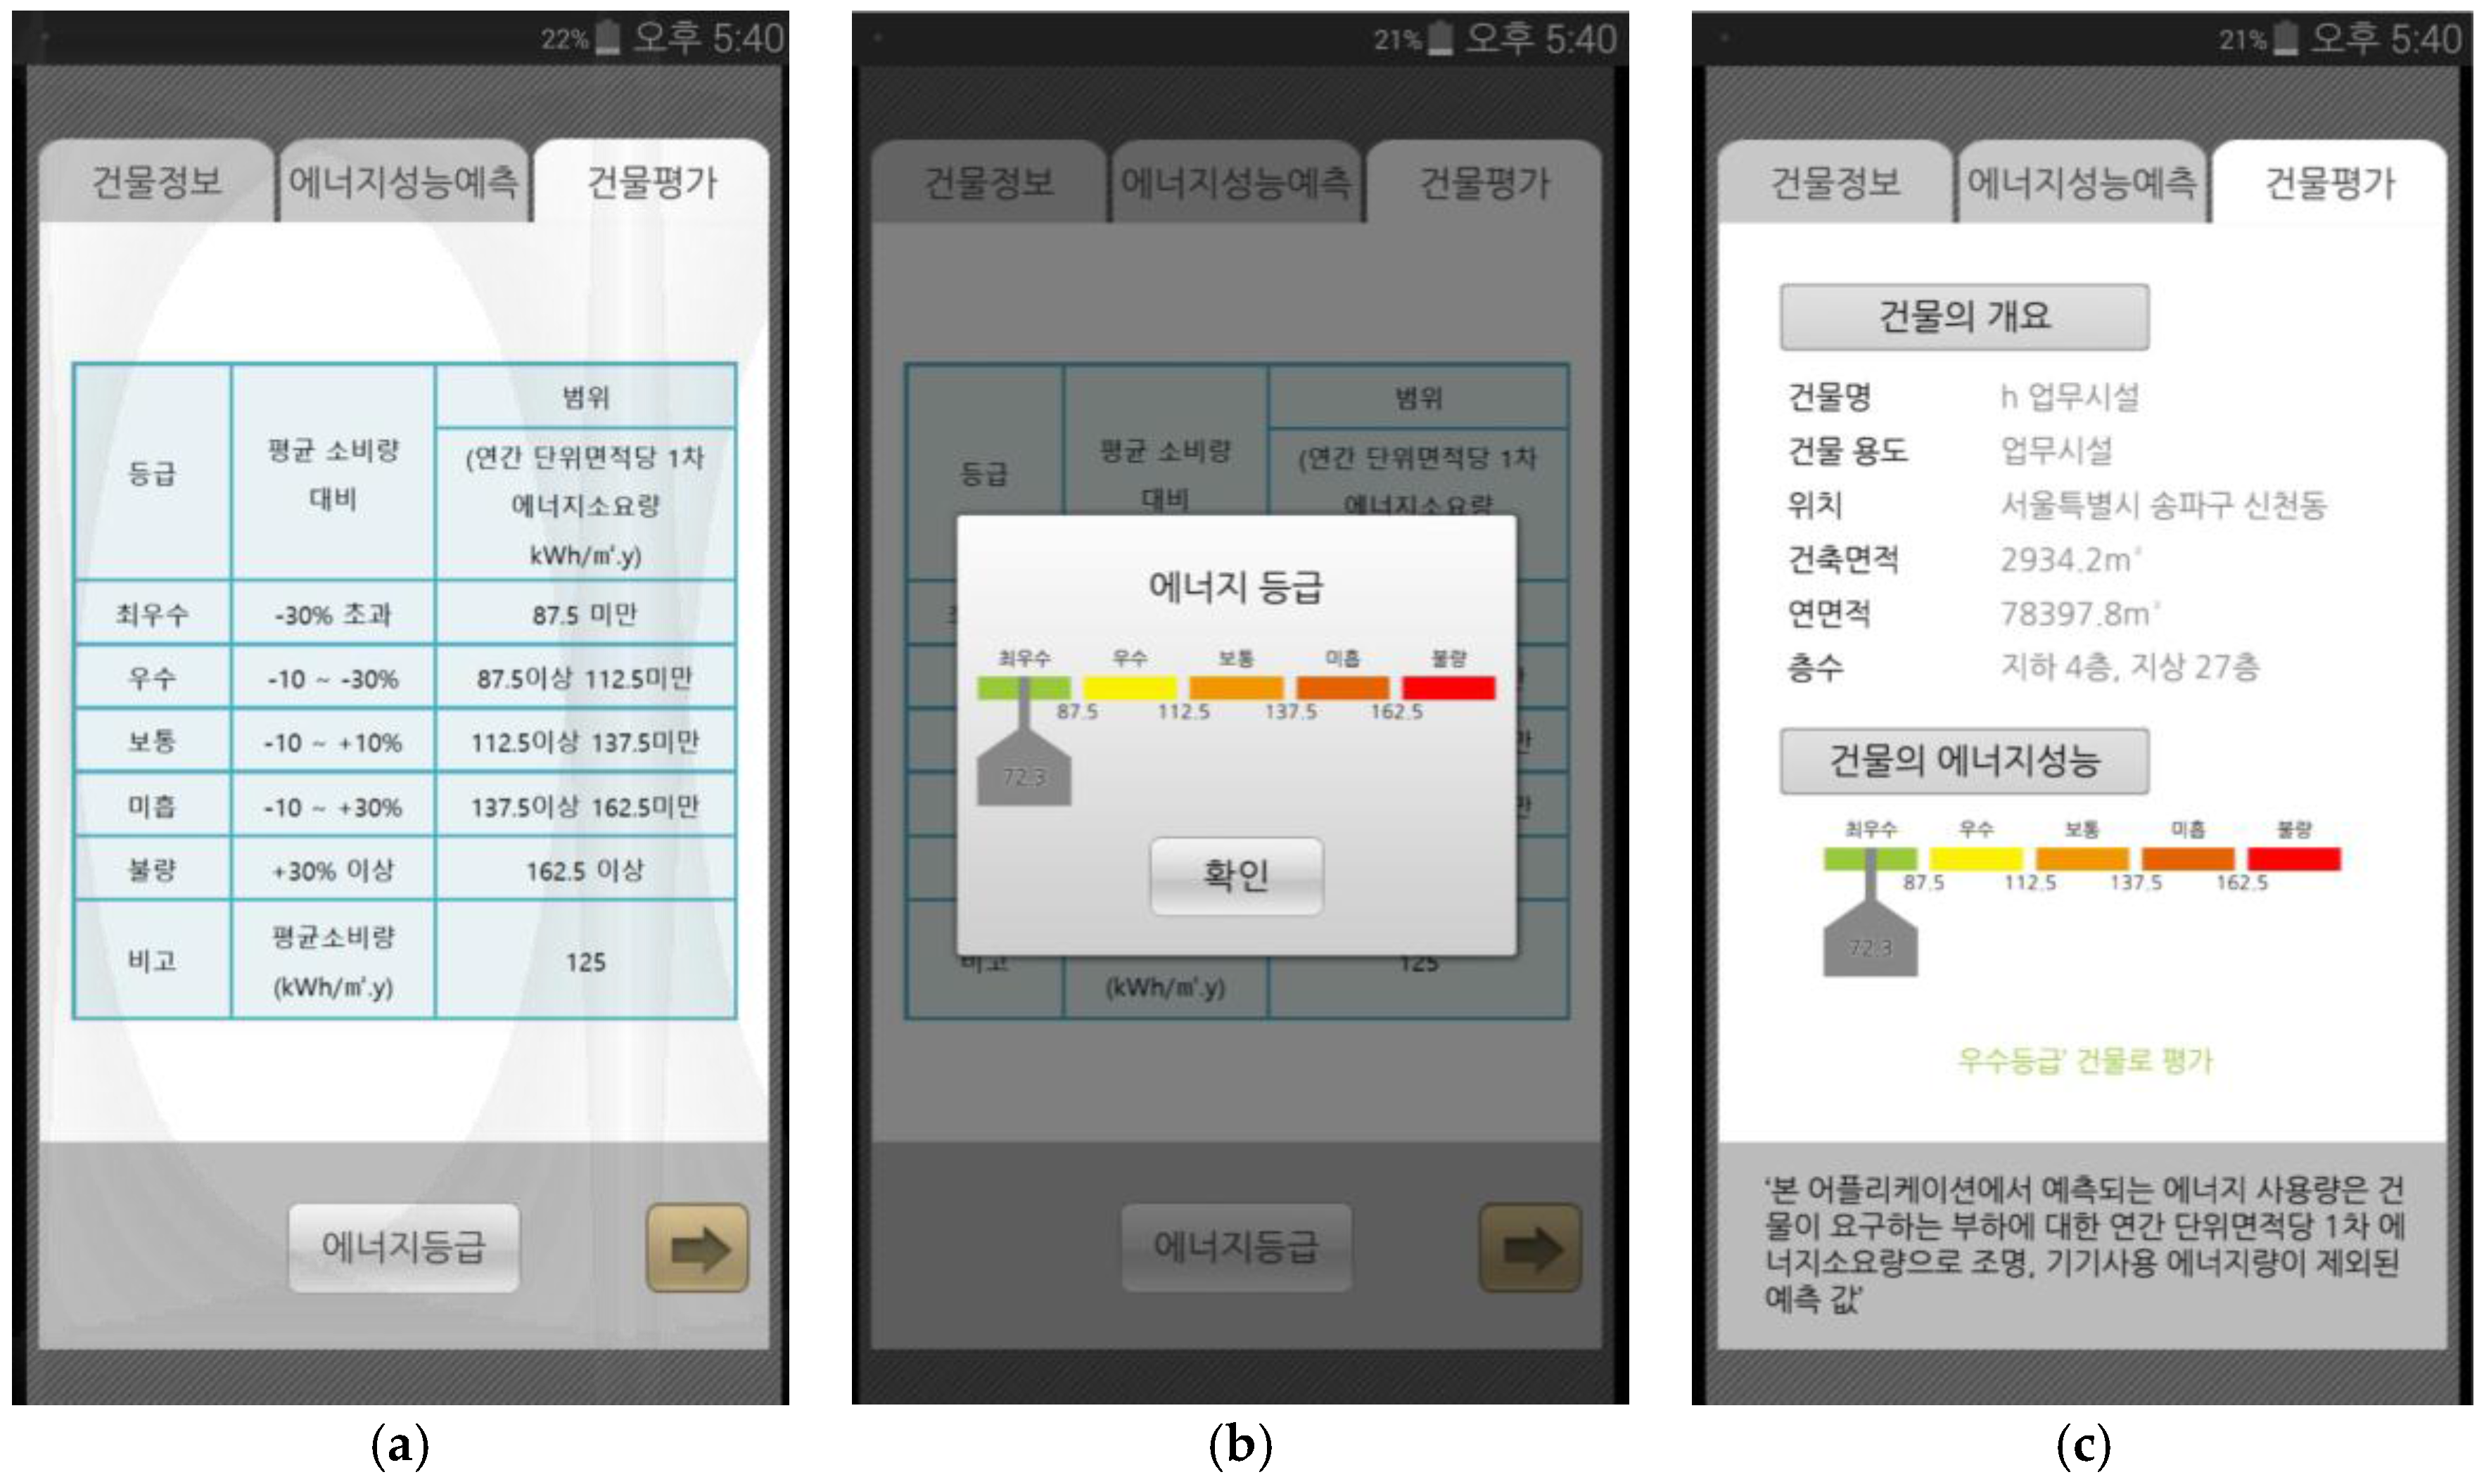
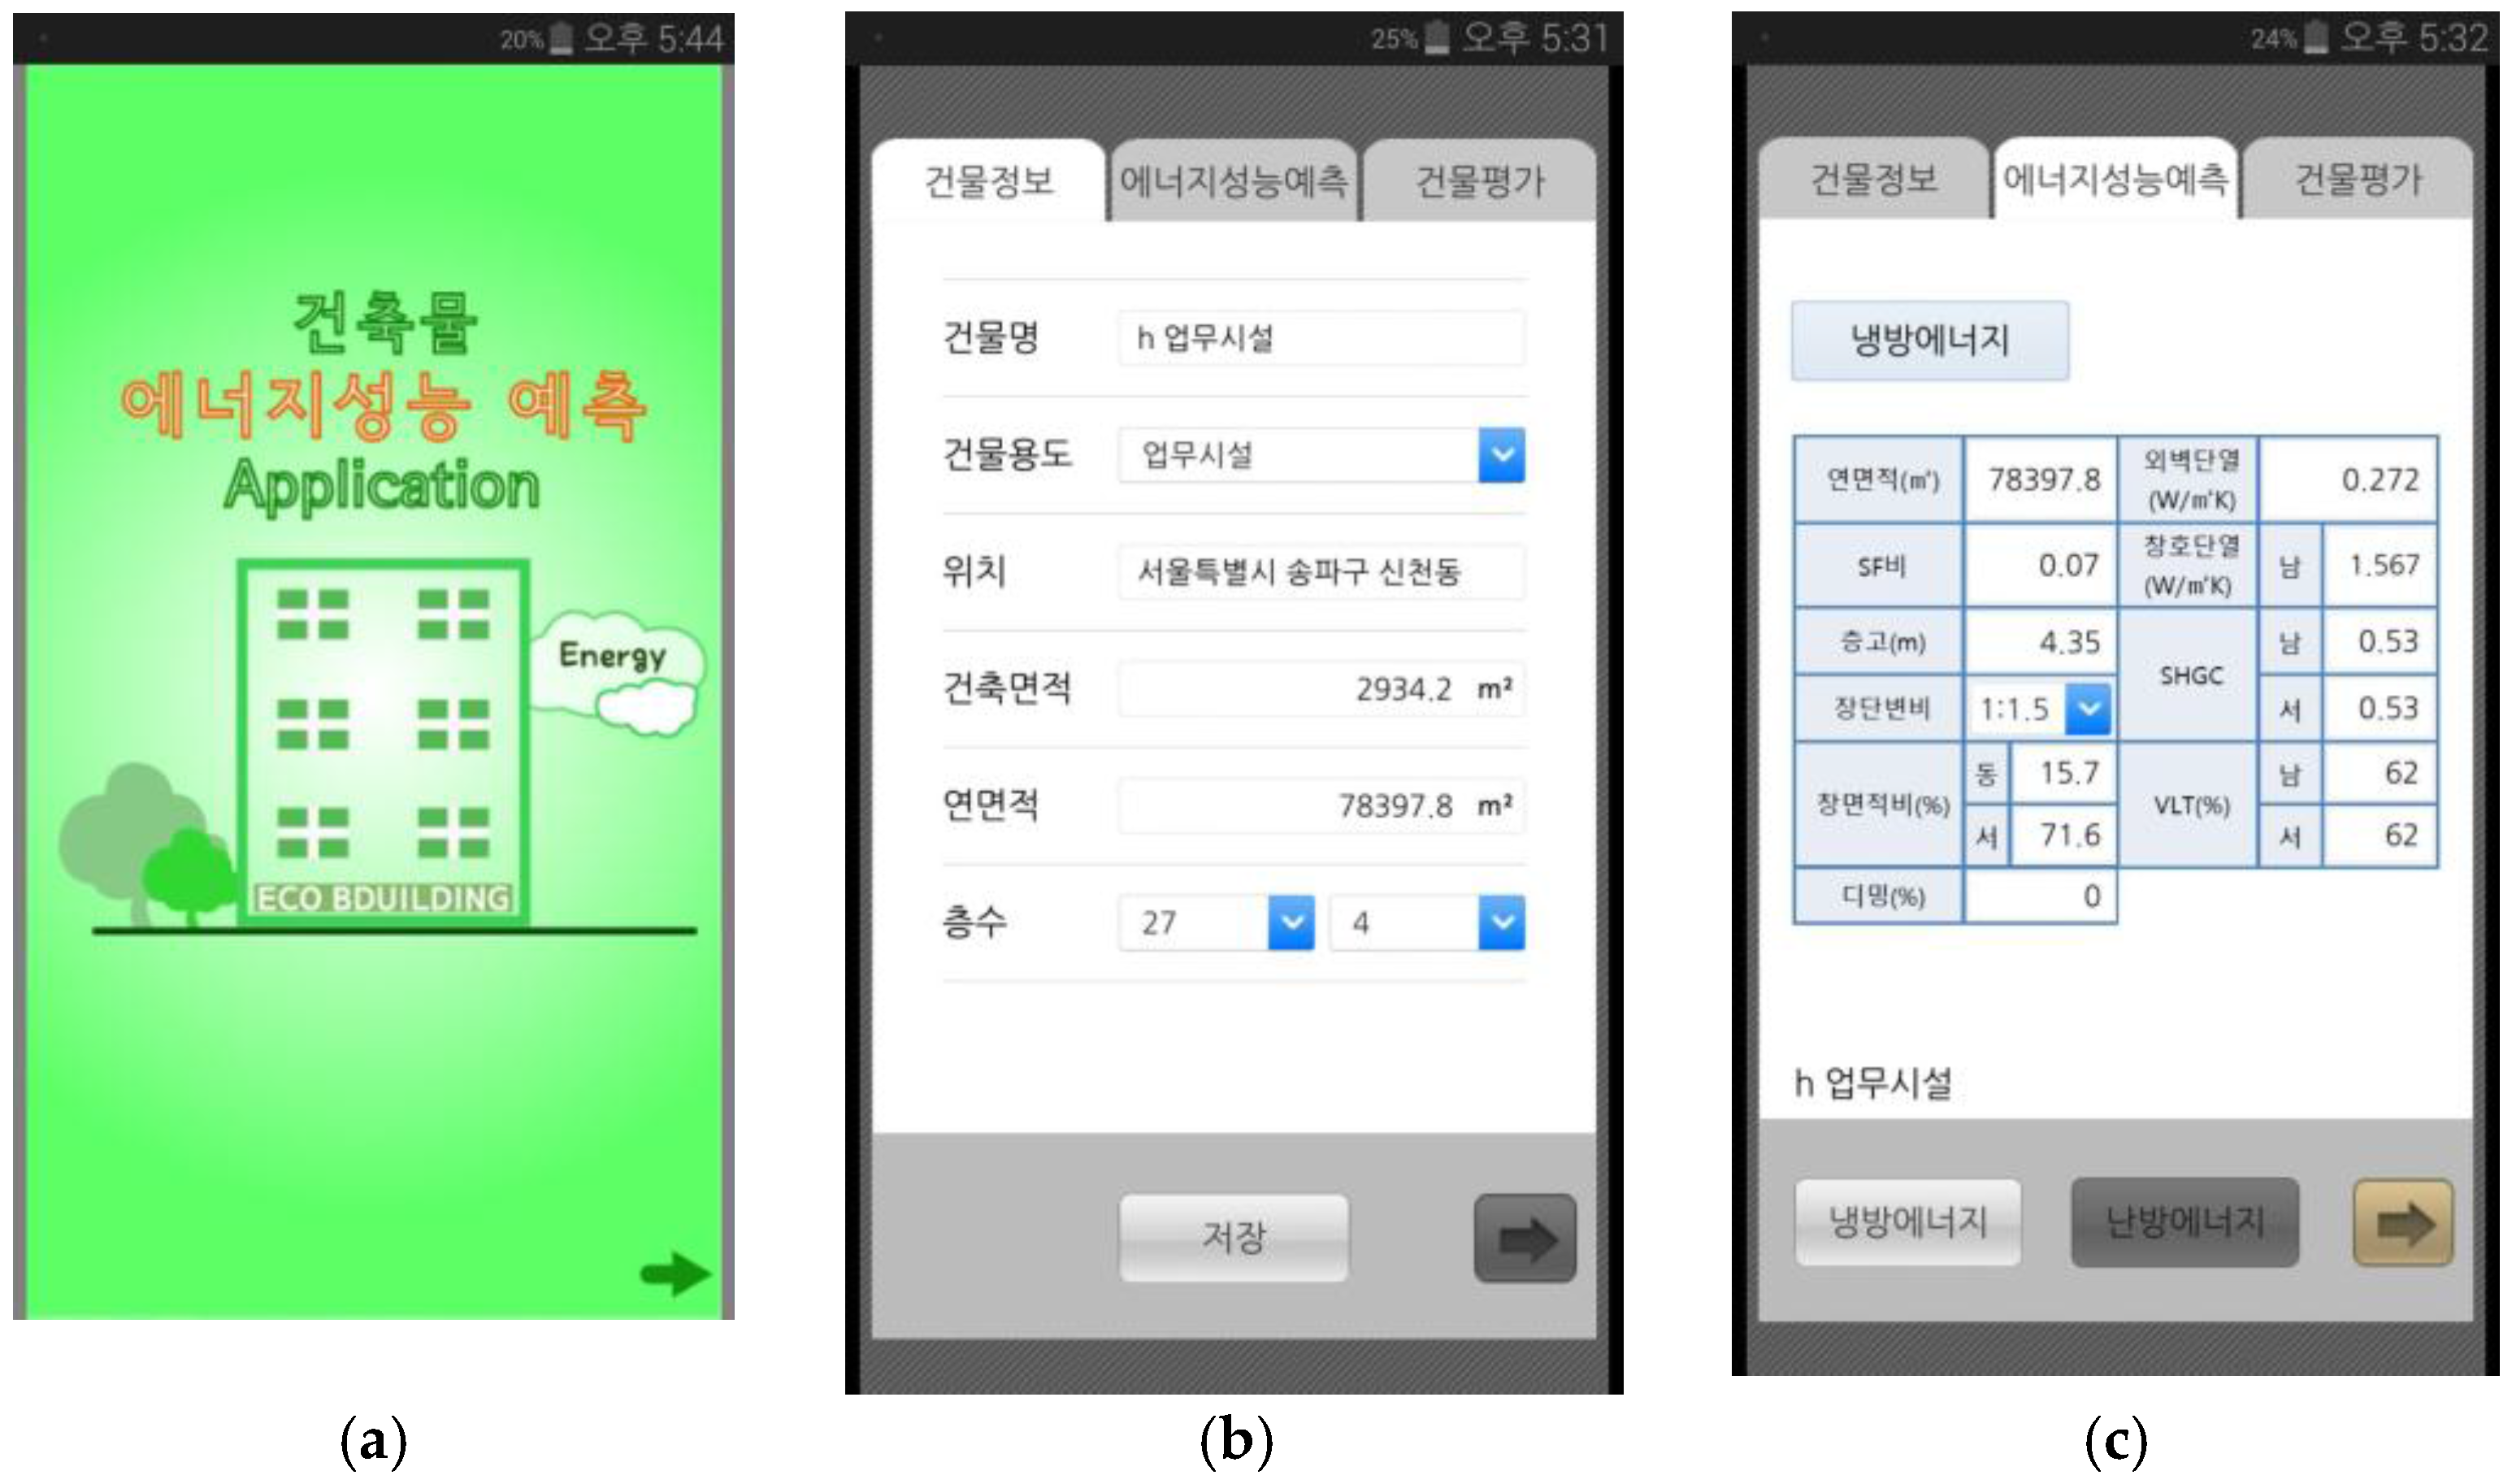
5.2. Mobile Application Process for the Sample Building
5.3. Prediction of the Building Energy Performance with the Mobile Application
5.4. Building Energy Performance Evaluation with the Mobile Application
6. Conclusions
Acknowledgments
Author Contributions
Conflicts of Interest
References
- International Energy Agency Energy Performance Certification of Buildings—A Policy Tool to Improve Energy Efficiency; OECD/IEA: Paris, France, 2010.
- Improving the Energy Efficiency of Our Buildings; Department for Communities and Local Government: London, UK, 2014.
- David, H. How much information disclosure of building energy performance is necessary? Energy Policy 2014, 1, 263–272. [Google Scholar]
- Shailendra, M.; Lorcan, L.; François, C.; Ronan, L.; Doreen, F. Energy Performance Certificates in Buildings and Their Impact on Transaction Prices and Rents in Selected EU Countries; European Commission (DG Energy 19): Brussels, Belgium, 2013. [Google Scholar]
- Nikhil, N.; Harvey, M. A New Model for Disclosing the Energy Performance of Residential Buildings; MIT Energy Efficiency Strategy Project: Cambridge, MA, USA, 2012. [Google Scholar]
- Andrew, B.; Cliff, M.; Nick, Z. The Future of Building Energy Rating and Disclosure What Europe Can Learn from the United States. Institute for Market Transformation, 2010. Available online: http://www.imt.org/uploads/resources/files/7.5IEECBPaper33.pdf (accessed on 5 July 2015).
- Asdrubali, F. Daylighting performance of sawtooth roofs of industrial buildings. Light. Res. Technol. 2003, 35, 343–359. [Google Scholar] [CrossRef]
- Pitt, L.F.; Parent, M.; Junglas, I.; Chan, A.; Spyropoulou, S. Integrating the smartphone into a sound environmental information systems strategy: Principles, practices and a research agenda. J. Strateg. Inf. Syst. 2011, 20, 27–37. [Google Scholar] [CrossRef]
- Watson, R.T.; Pitt, L.F.; Berthon, P.; Zinkhan, G.M. U-commerce: Expanding the universe of marketing. J. Acad. Mark. Sci. 2002, 30, 333–347. [Google Scholar] [CrossRef]
- Building Energy Resilience, Institute for Market Transformation, 2010. Available online: http://buildingenergy.cx-associates.com/2012/10/top-apps-for-hvac-and-energy-analysis/5IEECBPaper33.pdf (accessed on 5 July 2015).
- Patrick, L.; Joshua, M.P.; Rob, H.; Sylvie, D. The application of smartphone technology to economic and environmental analysis of building energy conservation strategies. Int. J. Sustain. Energy 2012, 31, 295–311. [Google Scholar]
- Corbett, J.; Webster, J.; Sayili, K.; Zelenika, I.; Pearce, J. Developing and Justifying Energy Conservation Measures: Green IT under Construction. In Proceedings of the 16th Americas Conference on Information Systems, Peru Atlanta, GA, USA, 12–15 August 2010; pp. 12–15.
- N J Solar, Solar PV. Available online http://greenpowerdevelopers.com (accessed on 16 June 2015).
- Solar Tools, Solar Tools for the iPhone. Available online: http://www.solartoolsapp.com/ (accessed on 16 June 2015).
- NRC, 2010. RETScreen International. Office of Energy Efficiency. Available online: http://www.retscreen.net/ang/home.php (accessed on 20 April 2015).
- Donn, M.R. A survey of users of thermal simulation programs. In Proceedings of the Fifth International IBPSA Conference, Prague, Czech Republic, 8–10 September 1997; Volume 3, pp. 65–72.
- Young, D.J. Facility Maintenance Management System Using a Mobile Application. J. Korea Inst. Electron. Commun. Sci. 2012, 7, 1145–1151. [Google Scholar]
- Park, B.R. Development of Resident-Based Energy Evaluation Model (REEM) for Implementation of Mobile Applications. J. Archit. Inst. Korea Plan. Des. 2013, 29, 251–261. [Google Scholar]
- Lee, B.Y. A Study on Building Energy Saving Strategies Using Mobile Application. Master’s Thesis, Chung Ang Univeristy, Seoul, Korea, 2014. [Google Scholar]
- Kang, D.M.; Kim, T.J.; Lee, C.K.; Park, T.K. Mobile application development of facility condition evaluation for maintenance efficiency. In Proceedings of architectural institute of Korea, Cheonan, Korea, 25 October 2013; Volume 33, pp. 717–718.
- Wittchen, K.B.; Jensen, S.I.; Thomsen, K.E. Automatic generation of complex simulation models of buildings with solar heating systems. In Proceedings of the Fourth International IBPSA Conference, Madison, WI, USA, 14–16 August 1995; pp. 403–409.
- Kosonen, R.; Shemeikka, J. The use of a simple simulation tool for energy analyses. Building Simulation 97. In Proceedings of the Fifth International IBPSA Conference, Prague, Czech Republic, 8–10 September 1997; Volume 2, pp. 369–376.
- Shaviv, E.; Peleg, U.J. An integrated KB-CAAD system for the design of solar and low energy buildings. In Proceedings of the CAAD Futures ’91, Zurich, Switzerland, 7–10 July 1991; pp. 465–484.
- Ellis, M.W.; Mathews, E.H. A new simplified thermal design tool for architects. Build. Environ. 2001, 36, 1009–1021. [Google Scholar] [CrossRef]
- Ho-Tae, S. A Study on the Development of Load Prediction Equation and Design Guidelines for the Energy Conservation of Office Buildings. Ph. D. Thesis, Seoul National University, Seoul, Korea, 1997. [Google Scholar]
- Kim, Y.R. A Development of a Mobile Application for Building Energy Prediction Using Performance Prediction Model. Master Thesis’s, Chung Ang Univeristy, Seoul, Korea, 2014. [Google Scholar]
- Yeom, B.J. Principles for constructing Taguchi Experimental Designs. Korean J. Appl. Stat. 1991, 4, 47–63. [Google Scholar]
- Hwan, J.J. A Study on the Development of Expert System for Selecting and Modifying Orthogonal Array in Taguchi Method. Korea Intell. Inf. Syst. Soc. 1997, 1, 350–361. [Google Scholar]
- Office of Energy Efficiency Natural Resource Canada. Survey of Commercial and institutional Energy Use—Building 2009; Detailed Statistical Report; Energy Publications Office of Energy Efficiency Natural Resources Canada: Ottawa, Canada, December 2012. [Google Scholar]
- Yates, F. Sir Ronald Fisher and the Design of Experiments. Biometrics 1964, 20, 307–321. [Google Scholar] [CrossRef]
- Andreas, K.; Balaji, K.; Sekhar, K.; Tham, K.W. A literature survey on measuring energy usage for miscellaneous electric loads in offices and commercial buildings. Renew. Sustain. Energy Rev. 2014, 4, 536–550. [Google Scholar]
- Cho, J.K. Development of an HVAC & R Systems Energy Evaluation Methodology and Simulation Program for Office Buildings. Korean J. Air Cond. Refrig. Eng. 2013, 25, 363–370. [Google Scholar]
- Lee, Y.Y.; Yun, G.Y.; Lee, G.H.Y.R. A Study on method of activating remodeling market of the existing building. J. Korean Soc. Living Environ. Syst. 2014, 21, 468–477. [Google Scholar]


| Plan | Multi-residential buildings | Office | Primary school | |||
 |  |  | ||||
| Category | Factors | Value | Value | Value | ||
| Climate site | Climate data | Seoul (TMY2) | Seoul (TMY2) | Seoul (TMY2) | ||
| Period | Heating | 1 January–30 March, 1 November–3 December | 1 January~30 March, 1 November~3 December | 5 February–30 March, 1 November–21 December | Summer/Winter holidays of schools (22 July–25 August/21 December–4 February) is excluded from heating and cooling periods. | |
| Cooling | 11 June~10 September | 11 June~10 September | 1 June–22 July. 26 August–31 August | |||
| Building | Area | 85 m2/one unit | 40,000 m2 | 67.5 m2/one classroom (Width of corridor 2.5 m) | ||
| Story | - | 20 | 4 | |||
| Ceiling height | 2300 mm | 2700 mm (Plenum Height: 1400) | 2700mm (Plenum height: 1100) | |||
| * WWR | Façade 80%, Rear 40% | 40% | Façade 40%, Rear 30% | |||
| ** WDR | 1:1 (one unit) | 1:1.5 | 1:1 (one classroom) | |||
| Mechanical system | Heating | Floor radiant heating | HVAC, FCU | Electric heat pump | ||
| Cooling | Package type AC | |||||
| ventilation | unit ventilation | |||||
| Operation occupancy | Temperature control | Heating | 24 °C | 24 °C | 24 °C | |
| Cooling | 26 °C | 26 °C | 26 °C | |||
| Ventilation quantity | Avg. 0.4 ACH (Non-Heating space 2.0 ACH) (Mech.Ventilation 0.7 ACH) | 1.0 ACH | 0.7 ACH | |||
| Number of occupants | 0.04 people/m2 | 0.2 people/m2 | 0.39 people/m2 | |||
| Internal heat (W) | Person | 70 W (sensible) | 70 W (sensible) | 70 W (sensible) | ||
| 45 W (latent) | 45 W (latent) | 45 W (latent) | ||||
| Equipment | 7.1 W/m2 | 10.4 W/m2 | 2 W/m2 | |||
| Lighting | 5.4 W/m2 | 15.1 W/m2 | 4 W/m2 | |||
| Variables | Multi-residential parameters | Performance level | Office parameters | Performance level | School (primary school) parameters | Performance level | ||||||||
|---|---|---|---|---|---|---|---|---|---|---|---|---|---|---|
| 0 | 1 | 2 | 0 | 1 | 2 | 0 | 1 | 2 | ||||||
| A | Unit area (m2) | 58 | 83 | 122 | Gross floor area (m2) | 30,000 | 40,000 | 50,000 | Class room (m) | Width | 7.5 | 8.1 | 8.4 | |
| B | # of Units per story | 2 | 4 | 6 | SF ratio | 0.07 | 0.11 | 0.14 | Length | 8.1 | 8.4 | 9.0 | ||
| C | Orientation | S | SE45 | E | Floor to Floor | 3.7 m | 4.1 m | 4.4 m | # of classrooms per story | 2 | 3 | 4 | ||
| D | Type of balcony | Type A | Type B | Type C | WDR (%) (width-depth) | 1:1 | 1:2 | 1:1.5 | Ceiling height | 3.6 | 3.8 | 4.0 | ||
| E | WWR (%) (façade) | 40 | 60 | 80 | Orientation | S | E | SE | Width of corridor | 1.8 | 2.5 | 3.3 | ||
| F | WWR (%) (rear) | 20 | 40 | 60 | WWR (%) | E | 20 | 40 | 60 | Orientation (degree) | S | SE | E | |
| G | Thickness of insulation (mm) | 65 | 150 | 250 | W | 20 | 40 | 60 | Location of core | Side | Rear | Center | ||
| H | Location of insulation | Interior (0.4 ACH) | Middle (0.3 ACH) | Exterior (0.2 ACH) | S | 20 | 40 | 60 | Exterior | 0.36 | 0.25 | 0.15 | ||
| I | Window U-factor (Façade) | 2.97 W/m2·K | 1.98 W/m2·K | 1.10 W/m2·K | N | 20 | 40 | 60 | Interior | 0.49 | 0.34 | 0.2 | ||
| J | Window U-factor (Rear) | 2.97 W/m2·K | 1.98 W/m2·K | 1.10 W/m2·K | Surface U-factor | Roof | 0.56 | 0.25 | 0.15 | Façade win (S) | 2.40 | 1.68 | 0.96 | |
| K | - | Wall | 2.48 | 1.36 | 0.24 | Rear win (N) | 3.20 | 1.68 | 0.96 | |||||
| L | Ground floor | 0.69 | 0.35 | 0.19 | Interior window | 30 | 2.24 | 1.28 | ||||||
| M | Window U-factor | E | 2.4 | 1.55 | 0.7 | Façade | 5 | 40 | 50 | |||||
| N | W | 2.4 | 1.55 | 0.7 | Interior | 30 | 10 | 15 | ||||||
| O | S | 2.4 | 1.55 | 0.7 | Rear | 0.35 | 40 | 50 | ||||||
| P | N | 2.4 | 1.55 | 0.7 | Façade | 0.35 | 0.6 | 0.85 | ||||||
| Q | SHGC | E | 0.6 | 0.4 | 0.2 | Rear | 30 | 0.6 | 0.85 | |||||
| R | W | 0.6 | 0.4 | 0.2 | Shading | X | O | O + I | ||||||
| S | S | 0.6 | 0.4 | 0.2 | Infiltration quantity (ACH) | Classroom | 0.3 | 0.5 | 0.7 | |||||
| T | VLT | E | 15% | 40% | 70% | etc. | 0.9 | 1.2 | 1.5 | |||||
| U | W | 15% | 40% | 70% | - | |||||||||
| V | S | 15% | 40% | 70% | ||||||||||
| W | Ventilation rate | 2.4 | 1.55 | 0.7 | ||||||||||
| X | Daylighting | 2.4 | 1.55 | 0.7 | ||||||||||
| Categories | Heating energy consumption | Cooling energy consumption | ||||||
|---|---|---|---|---|---|---|---|---|
| Multi-residential buildings | Partial R-square | R-square | Modification of R-square | Standard error | Partial R-square | R-square | Modification of R-square | Standard error |
| 0.936 | 0.876 | 0.854 | 5.567 | 0.965 | 0.930 | 0.923 | 1.268 | |
| Heating energy consumption (Y) | Cooling energy consumption (Y) | |||||||
| = 9.90 + 5.94 X1 + 0.29 X2 − 0.16 X3 + 0.08 X4 + 0.49 X5 − 0.05 X6 + 0.10 X7 + 4.51 X8 + 0.20 X9 + 2.86 X10 + 2.70 X11 + 0.10 X12 | = 20.82 − 0.43 X1 + 0.10 X2 − 0.02 X3 + 0.03 X4 − 0.05 X5 + 0.65 X6 + 2.30 X7 − 0.37 X8 | |||||||
| X1 | a1 Location of the Insulation (Interior:1, Middle:0, Exterior:−1) | X1 | Unit area | |||||
| X2 | WWR (Façade) | X2 | WWR (Façade) | |||||
| X3 | a1Balcony(A Type:1, B Type:0, C Type:−1) | X3 | a2 Balcony (A Type:0 B Type:1 C Type:−1) * WWR (Façade) | |||||
| X4 | a2 Balcony * WWR (Façade) | X4 | Orientation | |||||
| X5 | Unit area | X5 | a1 Balcony (A Type:0 B Type:1 C Type:−1) * WWR (Façade) | |||||
| X6 | Thickness of the Insulation | X6 | U-value of the Window (Façade) | |||||
| X7 | Orientation | X7 | a1 Balcony (A Type:1 B Type:0 C Type:−1) | |||||
| X8 | U-value of the Window (Façade) | X8 | Location of the insulation | |||||
| X9 | WWR (Rear) | |||||||
| X10 | a1 of the Units (Two:1, Four:0, Six:−1) | |||||||
| X11 | U-value of the Window (Rear) | |||||||
| X12 | a2 Balcony * WWR (Rear) | |||||||
| Office | Partial R-square | R-square | Modification of R-square | Standard error | Partial R-square | R-square | Modification of R-square | Standard error |
| 0.883 | 0.780 | 0.753 | 4.712 | 0.861 | 0.666 | 0.602 | 3.3329 | |
| Heating energy consumption (Y) | Cooling energy consumption (Y) | |||||||
| = 30.692 + 1.75 X1 + 1.78X2 – 1.65 X3 – 1.93 X4 + 1.47 X5 + 1.514 X6 – 8.17 X7 − 1.59 X8 + 2.86 X9 | = 46.94 – 1.62 X1 – 0.80 X2 + 1.41 X3 + 1.49 X4 – 1.10 X5 + 1.12 X6 – 1.62 X7 – 1.53X8 + 0.94 X9 – 2.60 X10 – 2.10 X11 + 0.06 X12 – 0.79 X13 | |||||||
| X1 | Floor to floor height | X1 | Gross floor area | |||||
| X2 | WWR (Façade) | X2 | Surface floor ratio | |||||
| X3 | Orientation | X3 | Floor height | |||||
| X4 | WWR (South) | X4 | WDR | |||||
| X5 | WWR (North) | X5 | WWR (East) | |||||
| X6 | Ventilation | X6 | WWR (West) | |||||
| X7 | U-value of the Wall | X7 | Daylighting | |||||
| X8 | U-Value of Window (North) | X8 | U-value of wall | |||||
| X9 | SHGC (South) | X9 | U-value of window (South) | |||||
| X10 | SHGC (West) | |||||||
| X11 | SHGC (East) | |||||||
| X12 | VLT (West) | |||||||
| X13 | VLT (East) | |||||||
| Schools | Partial R-square | R-square | Modification of R-square | Standard error | Partial R-square | R-square | Modification of R-square | Standard error |
| 0.908 | 0.825 | 0.808 | 5.567 | 0.890 | 0.792 | 0.778 | 57.992 | |
| Heating energy consumption (Y) | Cooling energy consumption (Y) | |||||||
| = 926.64 + −178.19 X1 + 149.29 X2 −81.50 X3 + −75.04 X4 − 58.65 X5 + 55.19 X6 + 45.23 X7 | = 160.21 + 99.49 X1 − 54.65 X2 +49.00 X3 + 42.61 X4 − 26.64 X5 | |||||||
| X1 | Infiltration | X1 | Visual Transmittance | |||||
| X2 | Orientation | X2 | Shading | |||||
| X3 | Insulation of exterior wall | X3 | Orientation | |||||
| X4 | Visual transmittance | X4 | WWR of class | |||||
| X5 | Insulation of glass | X5 | infiltration | |||||
| X6 | Length of width (class) | |||||||
| X7 | Length of depth (class) | |||||||
| Calculation model | Multi-residential | Office | School |
|---|---|---|---|
| Electricity energy | y = 6.85 x | y = 10.4 x | y = 4 x |
| Lighting energy | y = 6.85 x | y = 15.1 x | y = 10.4 x |
| Hot water usage | y = 551.95Ln(x/3.3) − 593.51 Winter (November~March) | - | y = 0.2868 x2 − 1.5997 x + 3.7668 (2nd Semester—September~January) |
| y = 352.79Ln(x/3.3) − 422.39 Summer (June~September) | - | y = − 0.2167 x2 + 1.7431 x − 0.7486 (1st Semester—March~July) | |
| y = 551.95Ln(x/3.3) − 593.51 April, May, October | - | Other month: Vacation |
© 2016 by the authors; licensee MDPI, Basel, Switzerland. This article is an open access article distributed under the terms and conditions of the Creative Commons by Attribution (CC-BY) license (http://creativecommons.org/licenses/by/4.0/).
Share and Cite
Kim, Y.-R.; Kang, H.J. Development of a Mobile Application for Building Energy Prediction Using Performance Prediction Model. Energies 2016, 9, 160. https://doi.org/10.3390/en9030160
Kim Y-R, Kang HJ. Development of a Mobile Application for Building Energy Prediction Using Performance Prediction Model. Energies. 2016; 9(3):160. https://doi.org/10.3390/en9030160
Chicago/Turabian StyleKim, Yu-Ri, and Hae Jin Kang. 2016. "Development of a Mobile Application for Building Energy Prediction Using Performance Prediction Model" Energies 9, no. 3: 160. https://doi.org/10.3390/en9030160