
Enhanced Single-Sided Ventilation with Overhang in Buildings

1
Department of Energy and Environment System Engineering, University of Seoul, Seoul 02504, Korea
2
Department of Computational Science and Engineering, Yonsei University, Seoul 03722, Korea
3
Department of Mechanical and Information Engineering, University of Seoul, Seoul 02504, Korea
*
Author to whom correspondence should be addressed.
Energies 2016, 9(3), 122; https://doi.org/10.3390/en9030122
Submission received: 1 January 2016
/
Revised: 3 February 2016
/
Accepted: 15 February 2016
/
Published: 23 February 2016
(This article belongs to the Special Issue Energy Efficient Building Design 2016)
Abstract
:Enhancing the ventilation performance of energy-efficient buildings with single-sided openings is important because their ventilation performance is poor and strongly depends on the wind conditions. We considered an overhang as a potential building façade for improving the single-sided ventilation performance. We performed numerical simulations of three-dimensional unsteady turbulent flows over an idealized building with an overhang in order to investigate the effect of the overhang on the ventilation performance. Parametric studies were systematically carried out where the overhang length, wind speed, and wind direction were varied. The numerical results showed that the overhang drastically enhanced the ventilation rate in the windward direction regardless of the wind speed. This is because, for windward cases, the overhang produces a vortex with strong flow separation near the tip of the overhang, which promotes a net airflow exchange at the entrance and increases the ventilation rate. However, the ventilation rates for the leeward and side cases are slightly decreased with the overhang. Using an overhang with single-sided ventilation greatly reduces the local mean age of air (LMA) in the windward direction but increases it in the leeward direction.
1. Introduction
Ventilation promotes an airflow exchange in indoor environments and is important for providing better indoor air quality and thermal comfort. Natural ventilation is an eco-friendly method for providing fresh air, but its performance heavily depends on outdoor environmental factors such as the wind conditions and building shape, including openings and windows [1]. Cross ventilation may be the most effective natural ventilation technique, in which two open surfaces are aligned with the wind direction. However, single-sided open surfaces (e.g., the entrance door), which are frequently encountered in commercial buildings may cause a poor ventilation performance. According to Jiang et al. [2], the ventilation performance of single-sided ventilation is 1/20 that of cross ventilation. The poor ventilation rate of single-sided ventilation buildings causes indoor air quality problems; hence, additional energy is needed to run the mechanical ventilation system [3,4]. Thus, enhancing the ventilation performance is important to achieve energy-efficient commercial building clusters with single-sided openings.
Many researchers have utilized the aerodynamic potential of building façades to investigate their enhancement effect on indoor and outdoor airflow exchanges for both cross and single-sided ventilation buildings [5,6,7,8,9,10,11,12,13,14,15,16,17,18,19,20,21]. Typical building façades include a venturi-shaped roof [13], wind catchers [9,14,15,16], a ventilation shaft [17], wing walls [8], a balcony [7,10,11,18], and eaves [5,6,21]. Prajosan and Sharples [17] proposed a ventilation shaft system to increase the indoor air velocity and thermal comfort in a single-sided residential unit. They demonstrated that the shaft provides wind-induced cross ventilation that results in a relatively high indoor air velocities. Mak et al. [8] numerically investigated the effect of wing walls on a single-sided building having two lateral openings comprising one-third of the total width of the wall and vertical projections (wing walls) having a depth equal to or double of the opening width. They reported that the wing walls promote natural ventilation by significantly increasing the air change per hour and the mean indoor air speed; the wing walls performed best at a wind angle of 45°.
Chand et al. [7] performed wind tunnel experiments to study the effect of balconies on the ventilative force in low-rise buildings without an opening. The balconies altered the wind pressure distribution on windward wall but did not significantly change it on the leeward side. Montazeri and Blocken [18] found that strong changes in the wind pressure distribution are associated with multiple areas of flow separation, recirculation, and reattachment near the building in the windward direction due to the balconies. Ai et al. [10] numerically investigated the effect of balconies on the ventilation performance based on the mass flow rate and average velocity in multi-storey buildings with openings. They found that, under single-sided ventilation conditions, the mass flow rate is significantly increased with the provision of balconies for all rooms on the leeward side but only for rooms on the ground, first, and top floors on the windward side. However, balconies under cross ventilation conditions do not change the mass flow rate except for rooms on the top floor. Recently, Perén et al. [21] studied the effects of windward and leeward eaves on cross ventilation flows in a generic isolated leeward sawtooth roof building. They found that windward eaves with a positive inclination angle compared to the roof inclination increase the ventilation volume flow rate compared to the case without eaves, while leeward eaves have a smaller influence on the flow rate than the windward eaves.
Shading devices (or overhang) can be considered as a potential building façade for improving the ventilation performance. The overhang is a large plate installed on the entrance and was originally intended for blocking solar radiation [22]. Based on previous studies of balconies [18] and eves [21], an overhang may change the wind pressure distributions on opening areas due to flow separation near the overhang; this can disturb the incoming air flow and increase the ventilation force. The interaction between the wind flow and the overhang-induced flow may be critical to determining the ventilation performance under single-sided ventilation conditions. Therefore, a precise assessment on the effect of the overhang on ventilation performance that considers the shape of the overhang and the wind direction is required.
The objective of this study was to investigate the effect of an overhang on the single-sided ventilation performance. We considered a generic isolated building model with an opening for the entrance and an overhang installed above the entrance. Numerical simulations were performed based on a three-dimensional unsteady Reynolds-averaged Navier-Stokes (URANS) model. We predicted the ventilation rates for the single-sided ventilation building with and without the overhang under different wind conditions. Parametric studies were systematically performed to characterize the ventilation performance in terms of the overhang length, wind speed, and wind direction. We examined changes in the flow fields near the entrance region due to the overhang in order to clarify the influence of the overhang on the ventilation. The effect of the overhang on the local mean age of air (LMA) was also investigated to evaluate the single-sided ventilation performance.
2. Numerical Methods
2.1. Computational Geometry
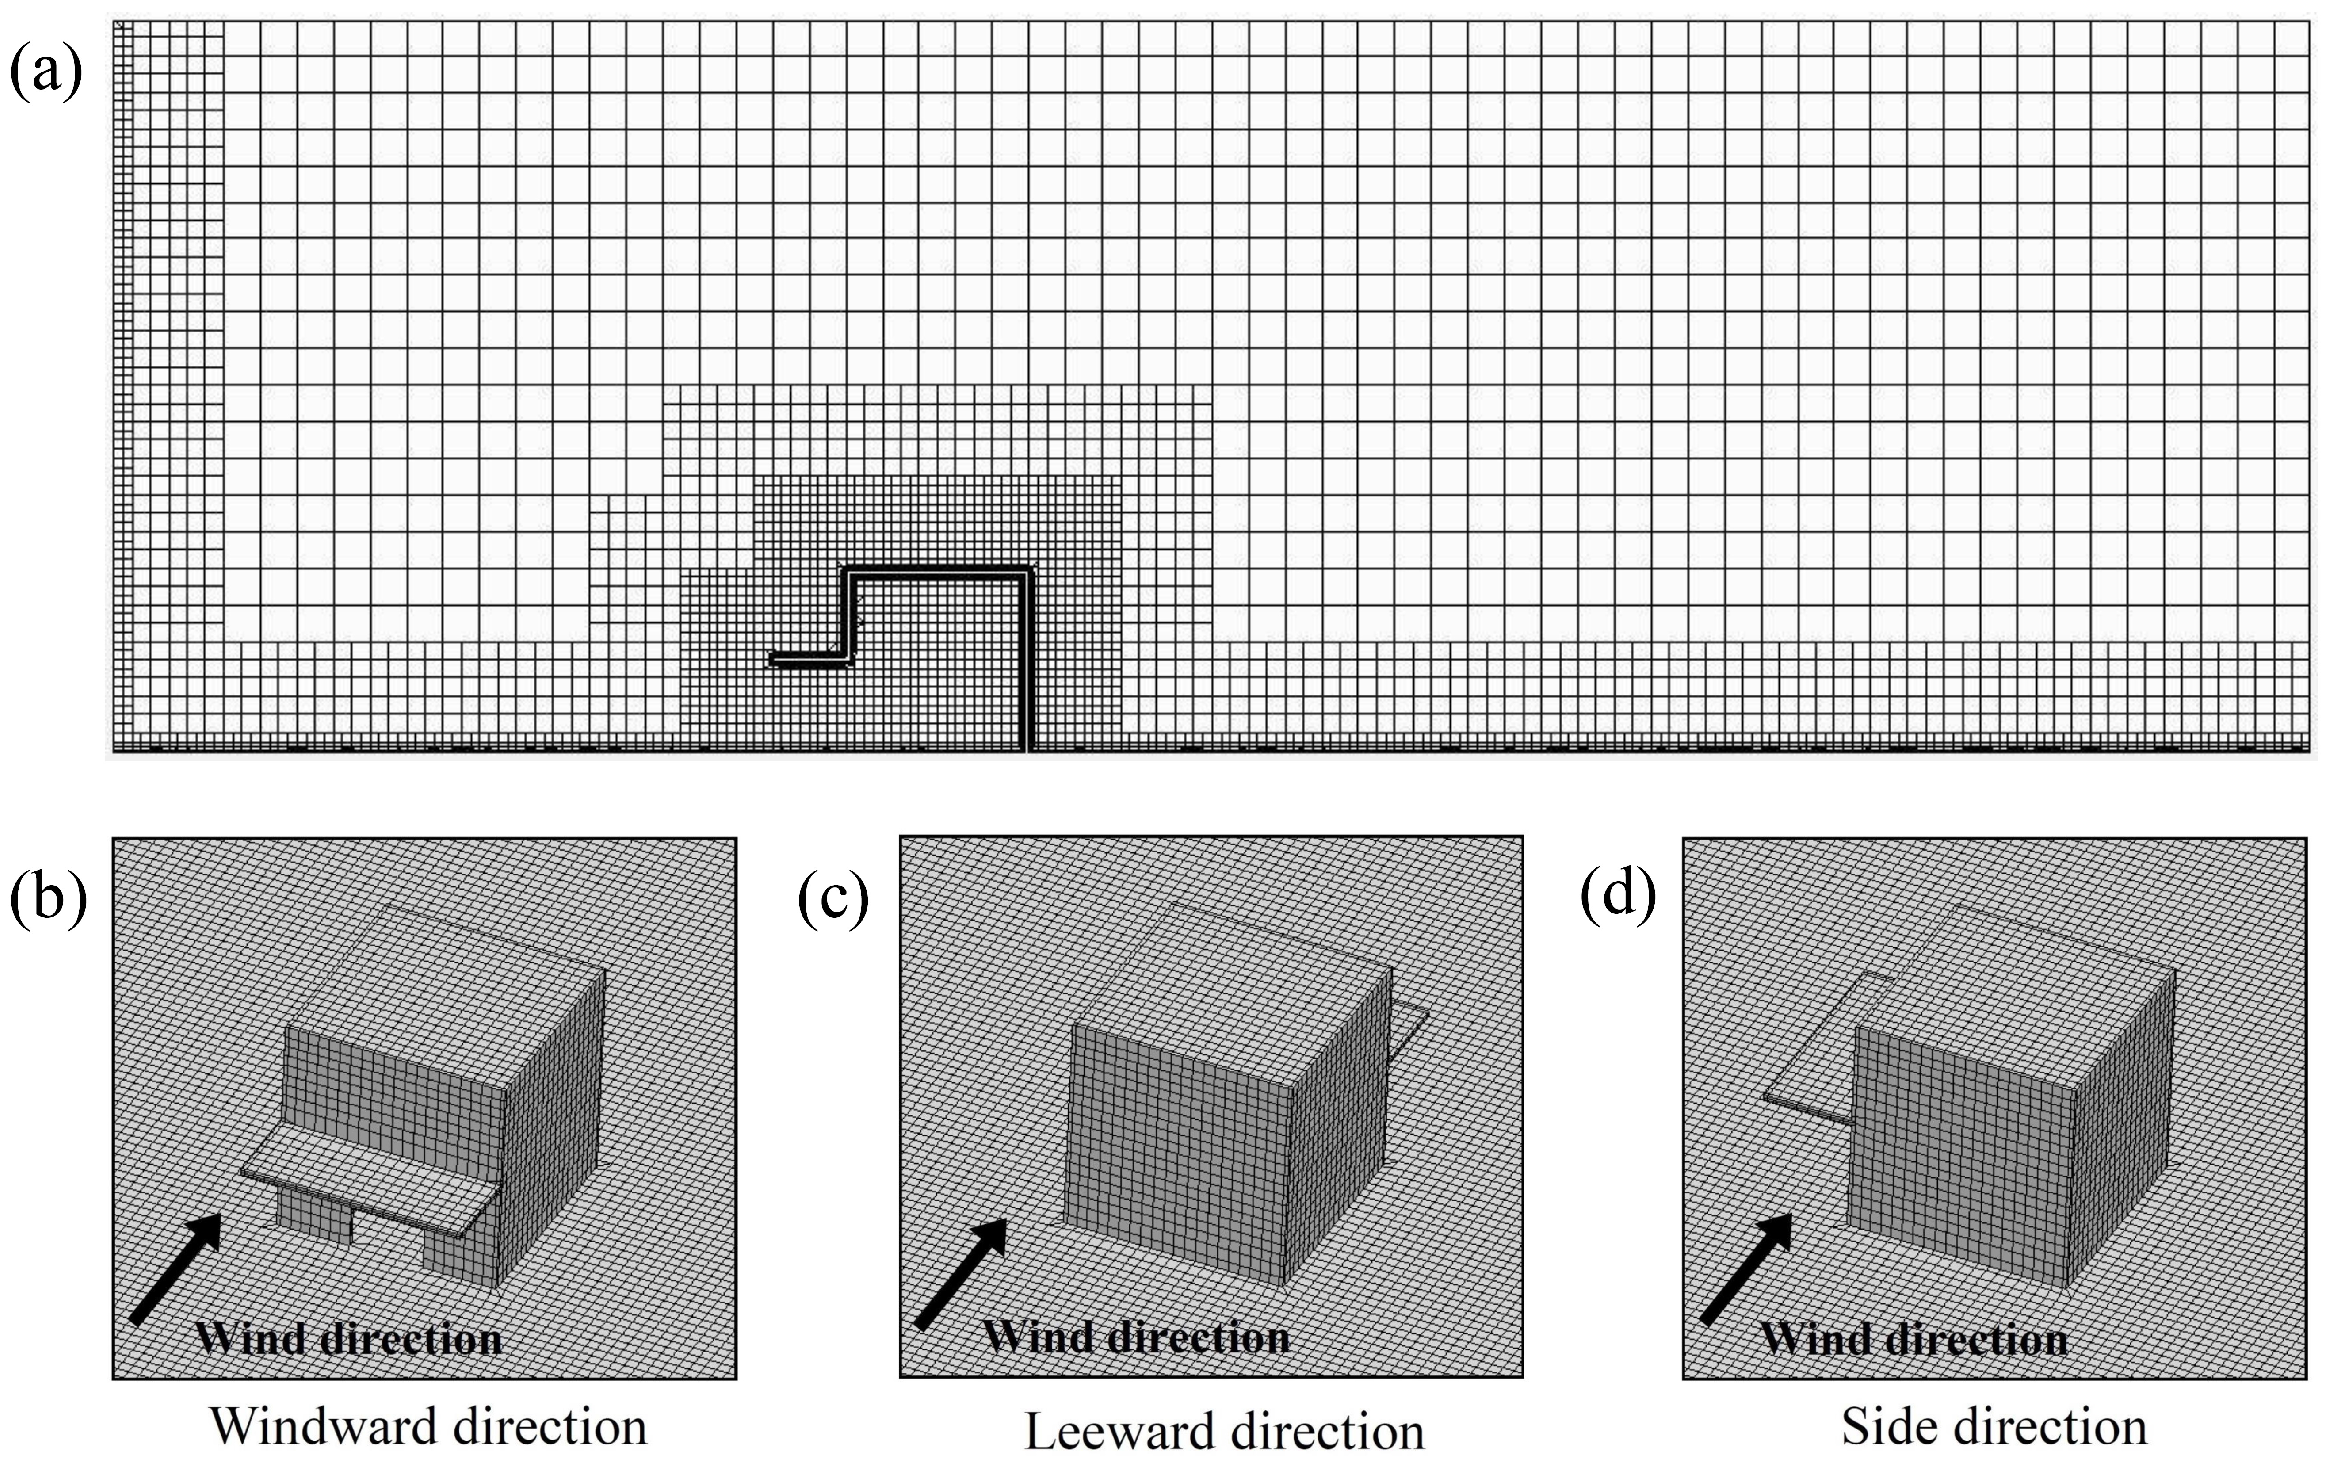
We considered a generic isolated building model with an overhang for the computational analysis of wind-induced single-sided ventilation. Figure 1 shows a schematic of the computation domain with the idealized building model, which is similar to that in [2]. The computational domain has dimensions of , where H represents the fixed height of the cube–shaped building model. For the ventilation study with the overhang, the height of the building model was set to 5 m. The corresponding computational domain is large enough that it does not affect the flow near the building. The building has an overhang with the variable length , and an open region with the dimensions of and located at the center of the building, as shown in Figure 1b. Four different overhang lengths were considered: , where D is the height of the opening region. Figure 2a shows a computational grid on the vertical plane at the center of the building in Cartesian coordinates. We also considered three different wind directions for the building: windward, side, and leeward. These are shown in Figure 2b–d. Note that the building model was rotated in the computational domain relative to a fixed wind direction.
2.2. Boundary Conditions
At the inlet of the domain, the wind-velocity profile can be defined based on the logarithmic law:
where z is the height from the bottom wall, is the friction velocity in the atmospheric boundary layer, is the roughness parameter, and is the von Karman constant. Note that, for the validation discussed in Section 2.4, we used m/s and m, which are the same as those used in [23]. In contrast, was varied from the reference wind speed in the ventilation study with the overhang discussed in Section 3. Other velocity components at the inlet were set to zero. At the inlet, the turbulent kinetic energy k and specific dissipation ω were defined as and , respectively [24]. Note that I denotes the turbulent intensity, is the turbulent viscosity and ρ is the density of air. In this study, we assumed that and , where μ is the dynamic viscosity of air. No-slip boundary conditions were used at the bottom wall and on the building walls, while the extrapolated boundary conditions [24] for all variables were used at the outlet, and symmetric boundary conditions were applied at other boundaries.
2.3. Numerical Procedure
The 3D URANS equations were solved by using STAR-CCM+ 8.02, which is a commercial software for computational fluid dynamics (CFD) [24]. Although the flow fields near a building or building façade vary with turbulent models, the ventilation flow rate may not be sensitive to the choice of turbulence model [15,25,26]. Recently, Ramponi and Blocken [26] reported that the shear-stress transport (SST) model provides the best performance for predicting the internal wind profiles in the cross ventilation. Thus, we considered the SST model for turbulence closure, which is commonly used in natural ventilation simulations [26]. It is known that the SST model can be improved with a blending function that includes wall distance functions so that the model includes the cross-diffusion term far from walls but not near the wall [27]. This approach effectively blends the model in the far-field with the model near the wall [24]. We used a two-layer model for near-wall treatment. The SST model automatically switches from the low-Reynolds model to standard wall functions near the wall depending on the mesh resolution. The semi-implicit method for pressure linked equations (SIMPLE) algorithm was used for the pressure-velocity coupling. The convection and diffusion terms in the governing equations were discretized based on a second-order upwind scheme, while the second-order backward differentiation formula (BDF2) was used for time advancement. All numerical simulations were performed with an unstructured hexahedral grid in Cartesian coordinates, as shown in Figure 2a. A steady solution from the Reynolds-averaged Navier-Stokes (RANS) simulation for each case was used for the initial condition for the URANS simulation. Based on the sensitivity analysis given in Section 2.4, we used a grid of 420,000 cells for all cases described in Section 3, where the size of the smallest control volumes close to the walls and the ground was m. For the time-step dependency check, we used three time steps in the unsteady calculations: s, s, and 1 s. Based on the results, a time step of s was chosen because the difference in the ventilation rates with s and s was lower than . All of the simulation cases were calculated until the residual fell below in each time step.
2.4. Numerical Validations
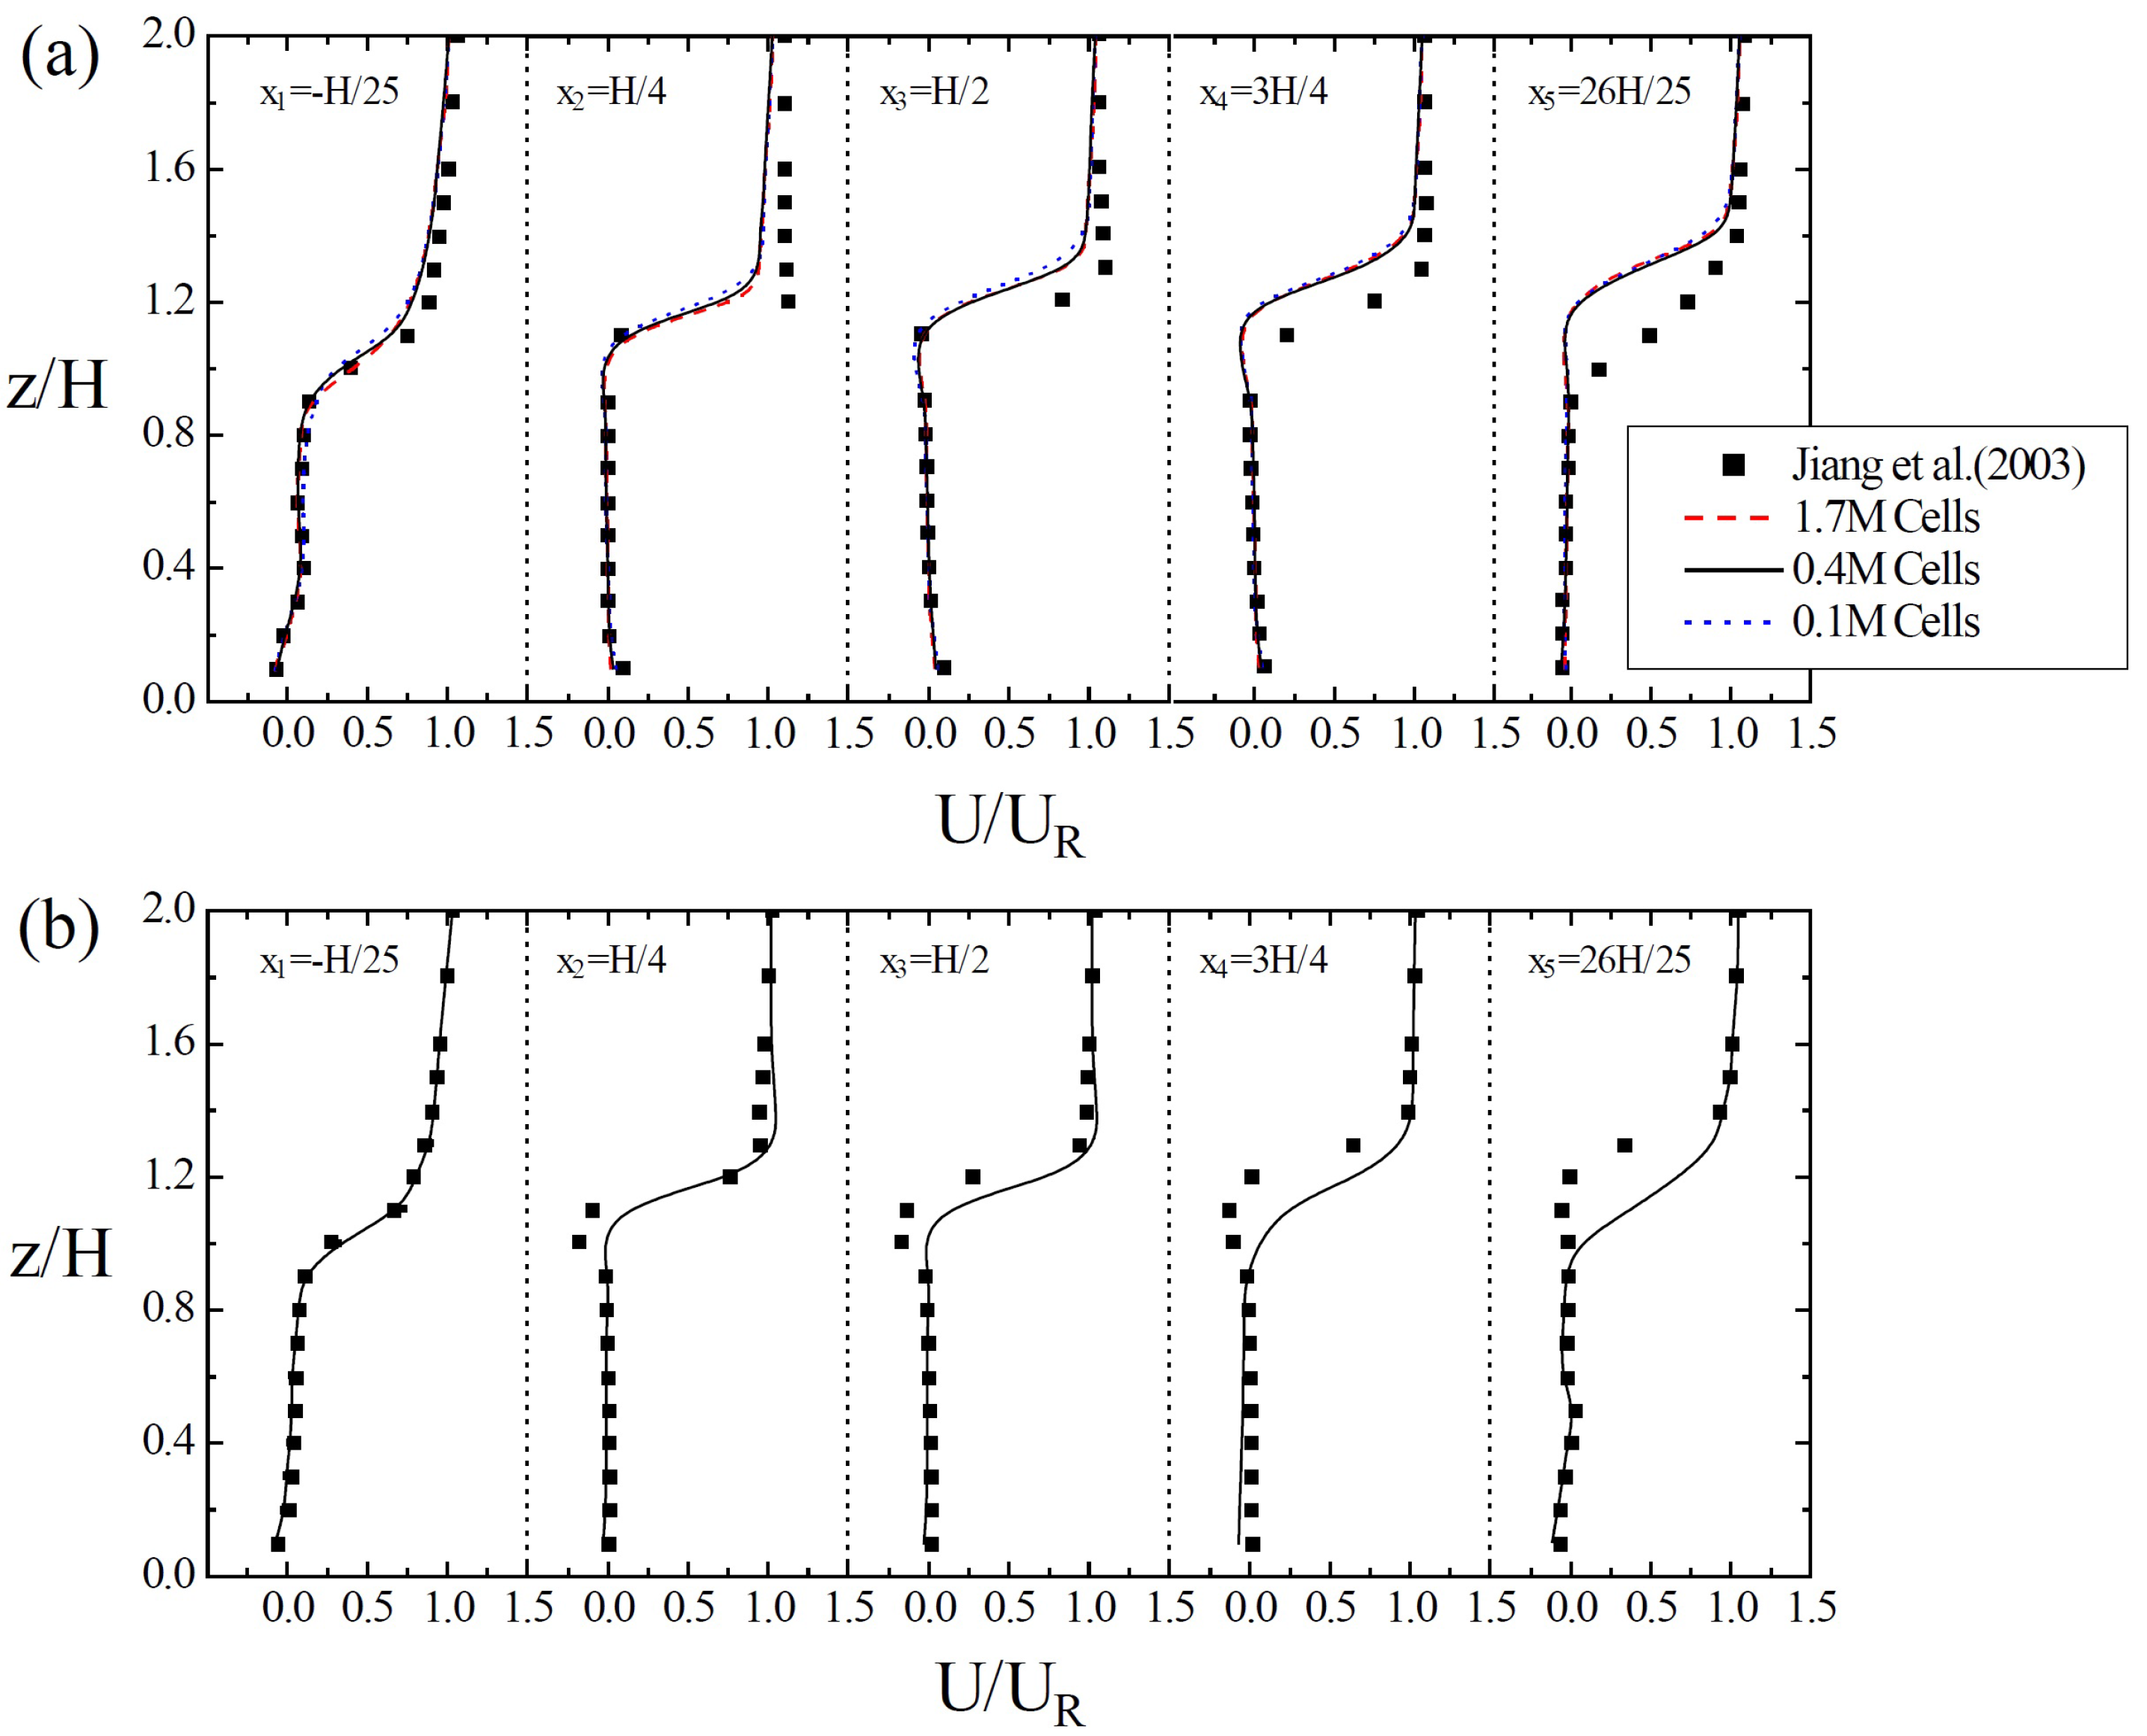
To verify the reliability of the turbulence model, the calculated velocity profiles at five different locations were compared with the measurement results of a small-scale experiment for single-sided ventilation of the idealized building [2]. Figure 1c shows the measurement positions for the comparison. We considered the same flow configuration as that in [2], where the height of the building was m and the height and width of the opening region were m and m, respectively. The reference velocity at m was 12 m/s. Two flow configurations in which the building entrance was on the windward or leeward direction were considered. Figure 3 shows that the present velocity profiles at the first three measurement positions agreed fairly well with the measured data for both the windward and leeward cases. At further downstream locations , the measured velocity above the building roof was underestimated for the windward case and overestimated for the leeward case. This discrepancy was also reported in [23] and may be related to the inaccuracy of RANS models in the separation region above and behind the building. In addition, the discrepancy may have been caused by the turbulence intensity at the inlet region: a decreased turbulent kinetic energy at the inflow region results in a longer reattachment length above the building and larger recirculation region in the wake [28]. However, the velocity profiles inside the building and near the open region showed good agreement with the measurement data [2]. We also performed a grid-sensitivity analysis based on three grids of 100,000 (coarse), 420,000 (medium), and 1,700,000 (fine) cells. Note that for the medium grid (420,000 cells), the values at the first-off cells near the wall boundaries were in between 2 and 80 in all simulations. The results indicated that the medium grid provided nearly grid-independent results. Thus, the medium grid (420,000 cells) was used for the ventilation performance analysis, which is described in Section 3.
3. Results and Discussion
We performed 45 simulations using different values for the parameters of the wind speed, wind direction, and overhang length to evaluate the effect of the overhang on the single-sided ventilation performance. Three different building configurations relative to the wind directions were considered: windward, leeward, and side directions. We also considered three different reference wind speeds of 1 m/s, 3 m/s, and 5 m/s, and different ratios of the overhang length and opening height of 0, 0.2, 0.4, 0.6, and 0.8.
3.1. Effect of Overhang on Ventilation Rates
To assess the ventilation performance due to the overhang, the time-averaged ventilation rate was defined as:
where T is the time-averaging period, denotes the transient time, and Q is the instantaneous ventilation rate at the entrance opening. The last is calculated by the integrating the normal velocity to the entrance region over the opening area as follows [1]:
where is the velocity normal to the entrance surface of the building and A is the area of the building entrance (horizontal length = and vertical length = ). In this study, the transient time was considered as 400 s, which is equivalent to more than seven flow-through time over the computational domain at the lowest wind speed ( m/s). The ventilation rate was obtained with s, which implies that is determined by integrating Q over at least ten flow-through time after the flow field reaches a quasi-steady state.
Figure 4 shows the time histories of ventilation rates for two representative cases; a single-sided windward building without an overhang and with an overhang at , where the maximum ventilation rate with the overhang is achieved at the reference velocity m/s. Although the URANS model was used for the simulation, the case without the overhang was found to have a constant ventilation rate m/s) over time. However, the ventilation rate of the building with the overhang greatly fluctuated with time. After the transient time s, the ventilation rate showed a quasi-steady fluctuating pattern. The time-averaged ventilation rate was m/s, and the dominant period was 31 s. Figure 4b is an enlarged graph of Figure 4a for s. It indicates a quasi-periodic pattern of the ventilation rate. Because the vortex that formed near the edge of the overhang induced strong velocity fluctuations at the entrance, the unsteadiness of the flow fields was increased, which led to apparent fluctuations in the ventilation rates. Details on the unsteady flow patterns are discussed in Section 3.2. For the single-sided windward building, the overhang was found to significantly increase the ventilation rate.
We investigated the effect of on the ventilation rate for different wind conditions. Figure 5a indicates that the ventilation rate significantly increased with for single-sided ventilation with an opening on the windward building, regardless of the reference wind speed. However, as shown in Figure 5b,c, the ventilation rate was not very sensitive to for a given reference wind speed. In particular, the overhang slightly decreased the ventilation rates in the leeward direction except when . The ventilation rate increased in proportion to the reference wind speed regardless of the direction of the opening relative to the wind.
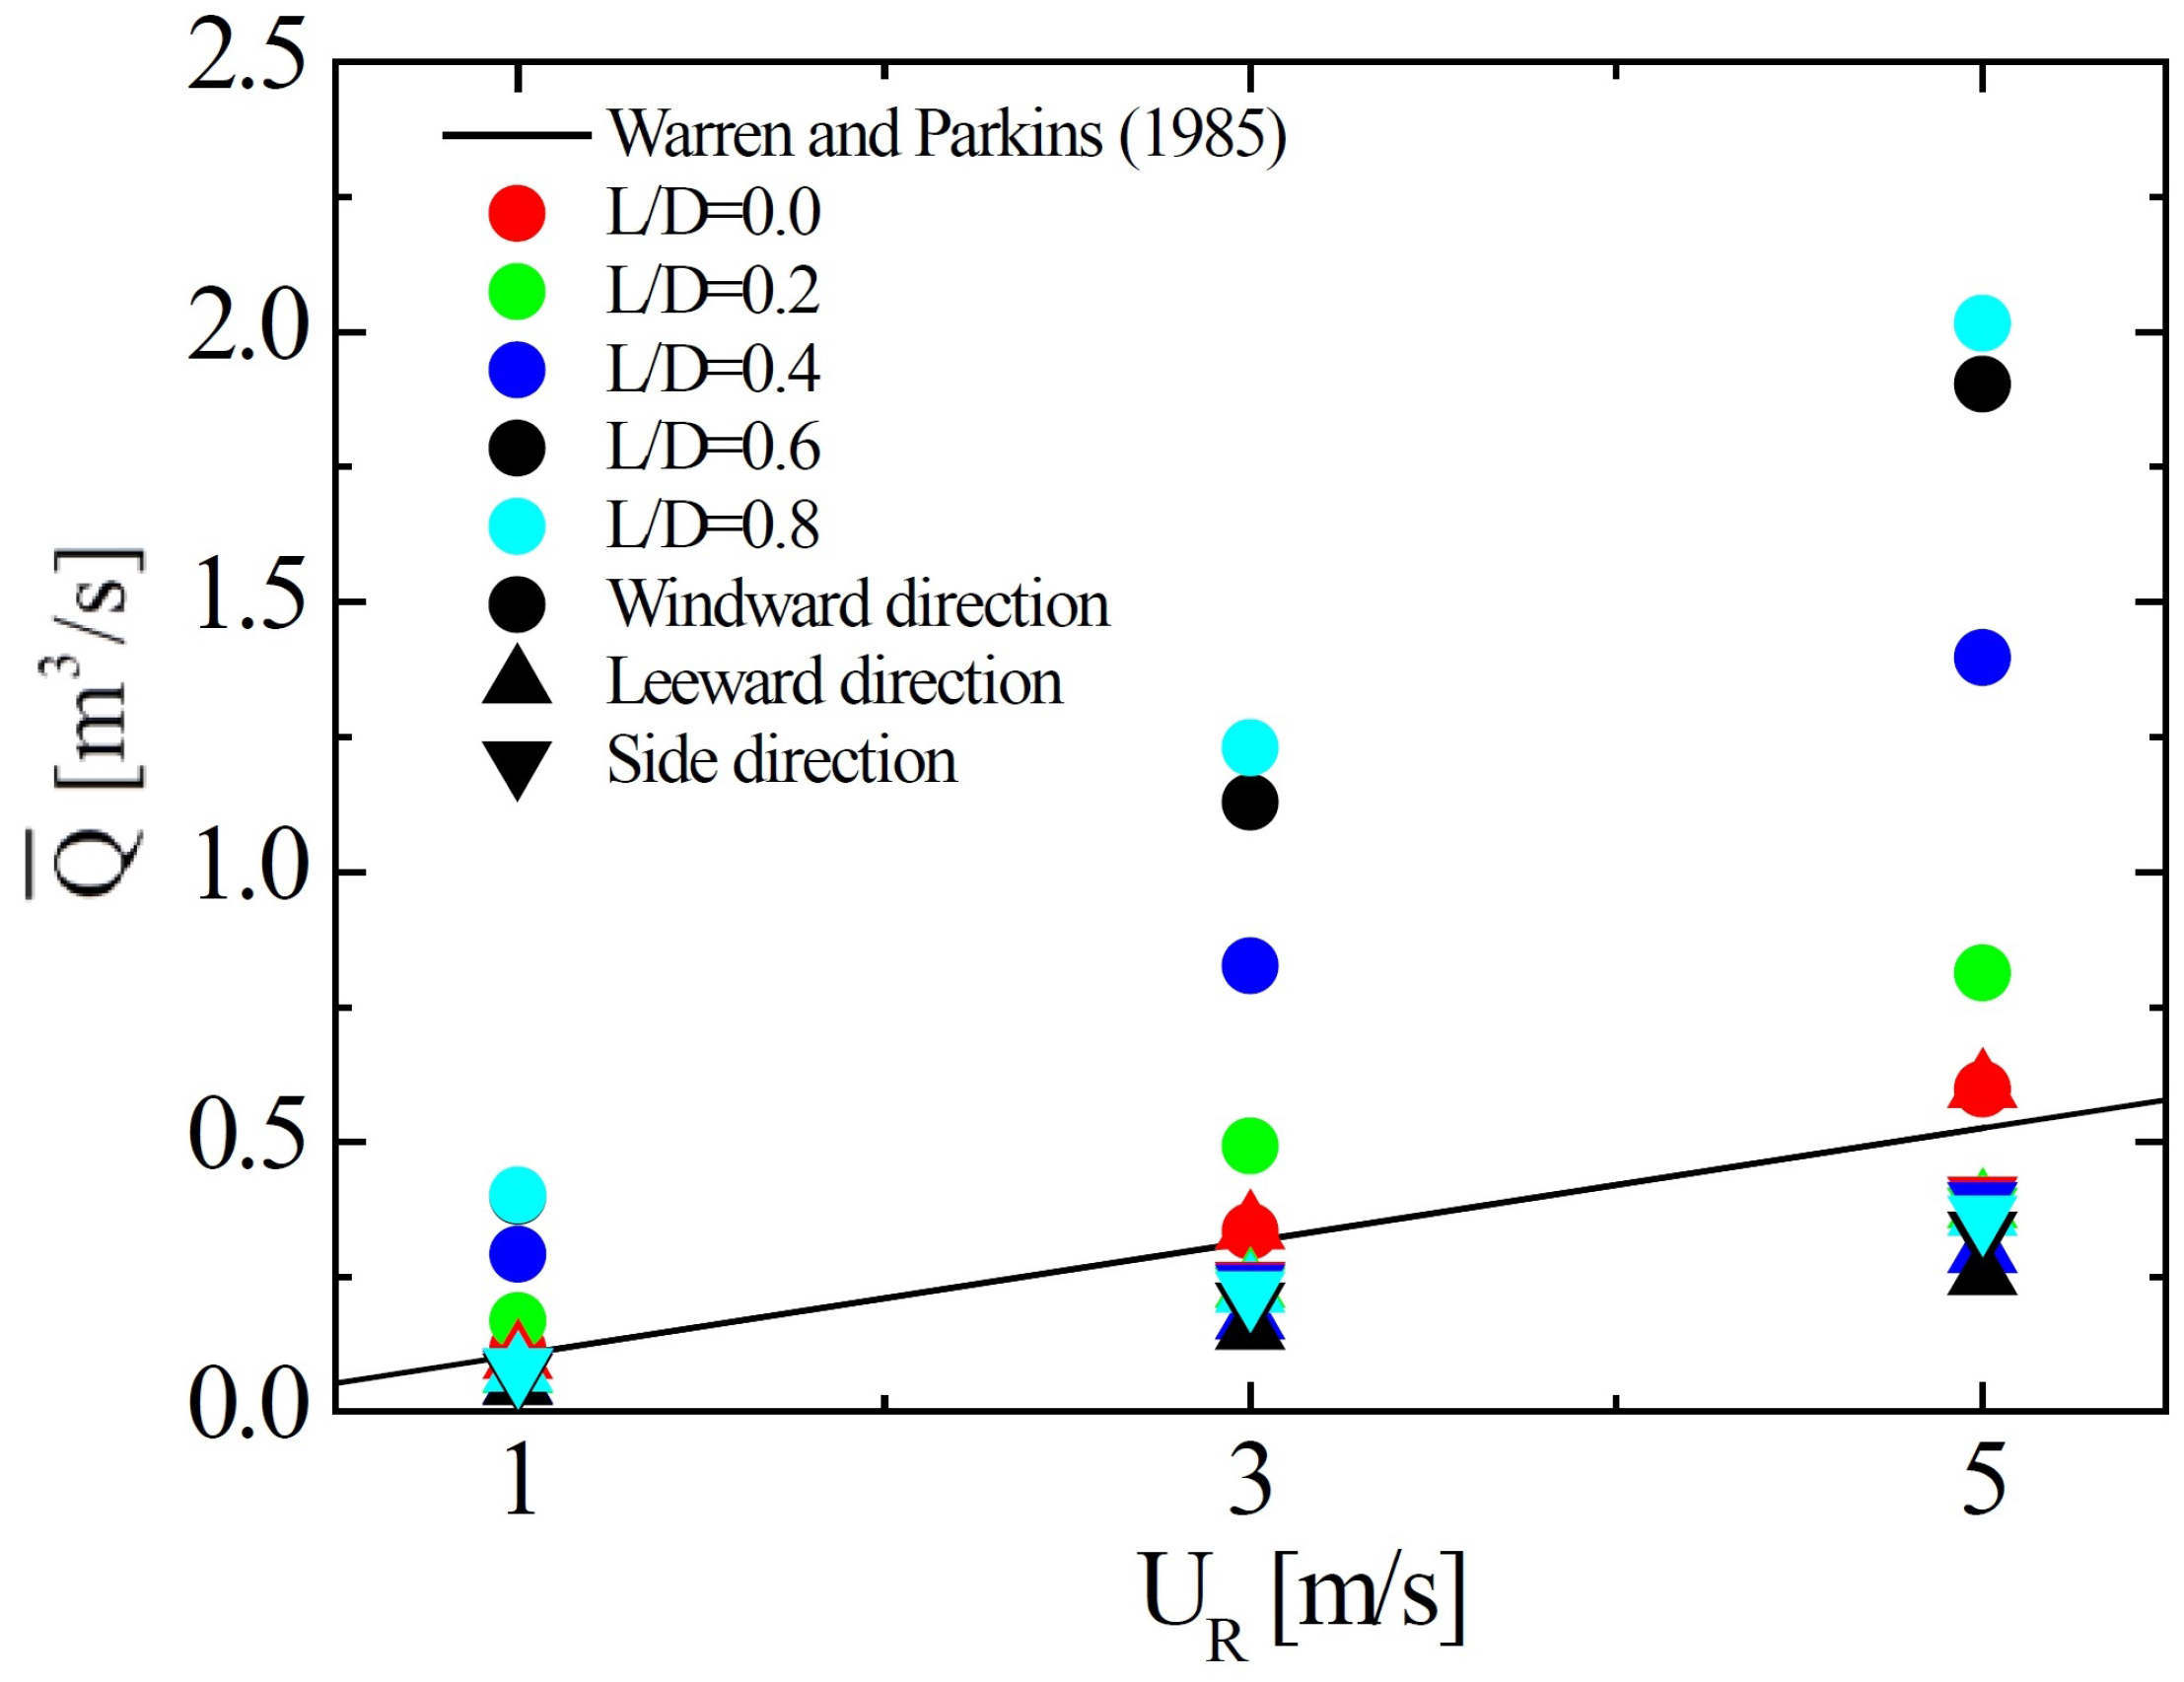
For a single-sided ventilation building, Warren and Parkins [29] proposed the following correlation between the average ventilation rate and volume flow rate based on a reference wind speed:
Figure 6 compares the ventilation rate with the correlation in Equation (4). As expected, the ventilation rates for the cases without an overhang showed good agreement with the correlation—based ventilation rates, which indicates that the ventilation rate is proportional to . However, the ventilation rates for the cases of the leeward or side buildings were generally lower than the estimated rates from the correlation, while the rates for the cases of the windward building were higher than the estimated rates. The discrepancy in ventilation rates between the CFD results and estimates from the correlation increased with or the overhang. This implies that the correlation in Equation (4) may not provide a reasonable estimation of the ventilation rate for a building with an overhang, especially when the opening is in the windward direction.
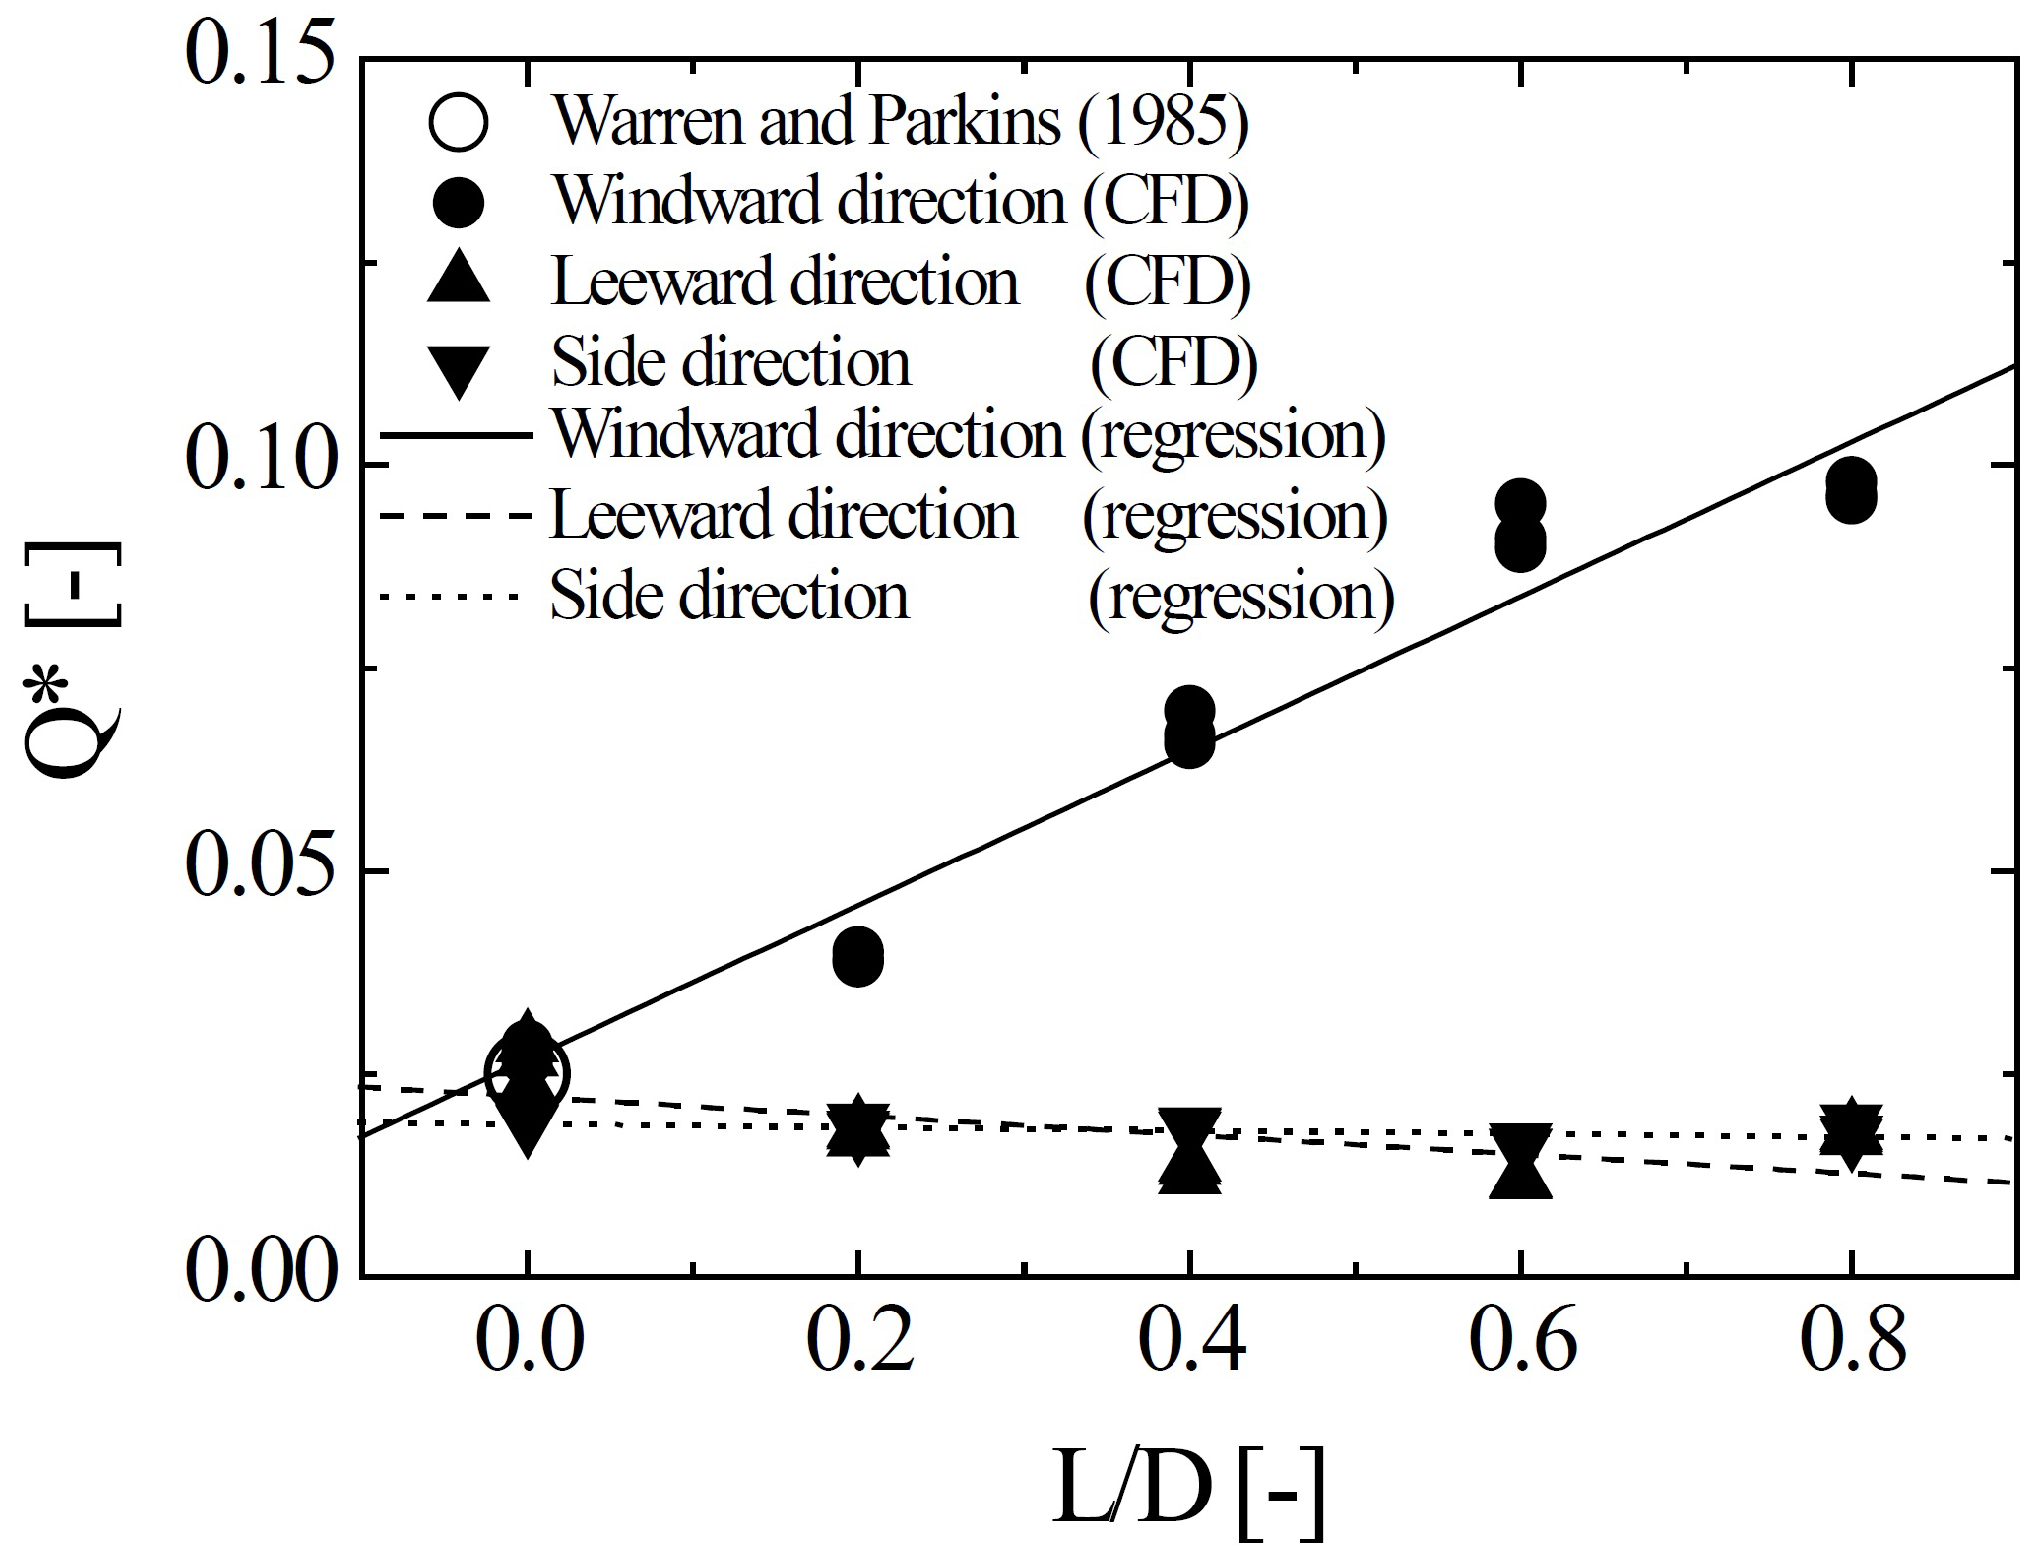
To clarify the effectiveness of the overhang on ventilation rates, we defined the dimensionless ventilation rate as . Note that is expected to be 0.025 from the correlation in Equation (4) for a building without an overhang. Figure 7 shows a scatter plot of as a function of for all simulation cases along with linear regressions of for each wind direction. The corresponding linear regressions were obtained as follows:
- for the windward direction,
- for the leeward direction,
- for the side direction.
These regressions confirmed that the effectiveness of the overhang is proportional to regardless of the wind speed. A longer overhang installation can more significantly enhance the ventilation rate in the windward direction, while having an overhang induces adverse effects on the ventilation rates in the leeward and side directions.
3.2. Changes to Flow Fields due to Overhang
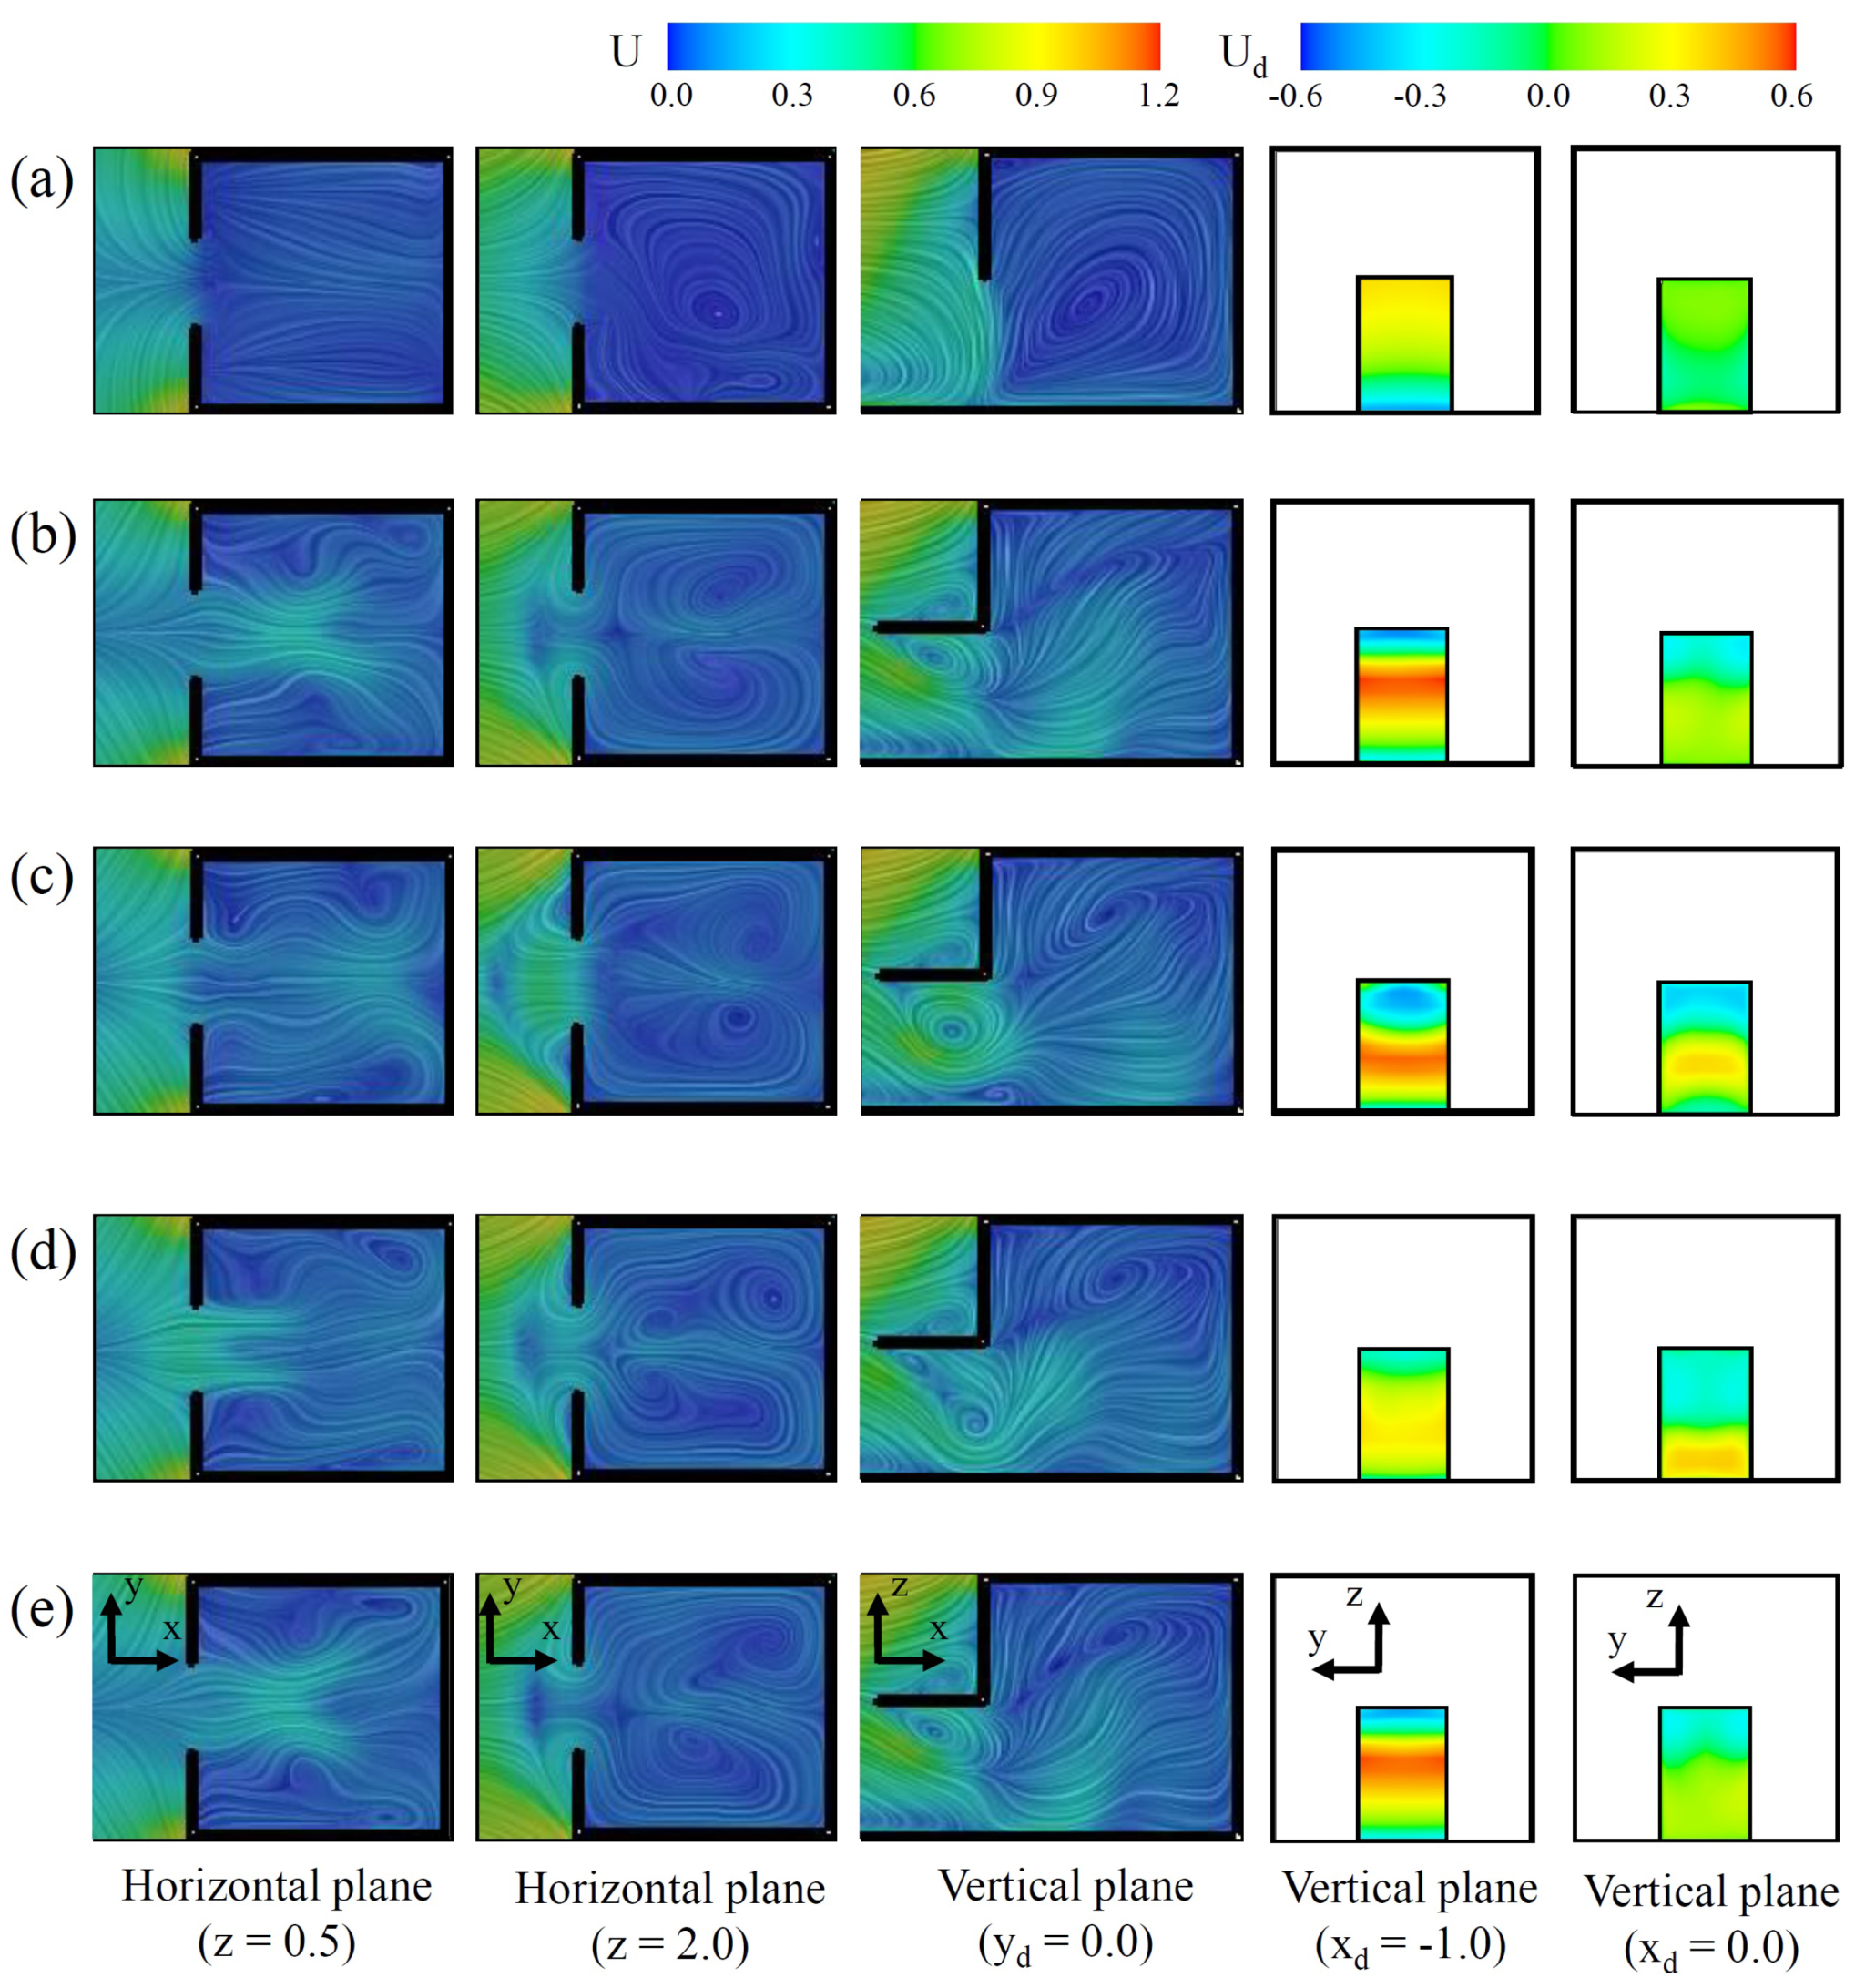
To observe the detailed effect of an overhang on the ventilation performance, we investigated flow patterns at several cross-sectional planes near the building for different flow configurations. Figure 8 shows the contours of the velocity magnitude U along with streamlines and the velocity components normal to the inside of the building for the windward building case at m/s. Streamlines were drawn by using the line integral convolution graphics processing technique [30]. Five different cross-sectional planes were considered: two horizontal planes ( and three vertical planes . Note that the subscript d indicates the direction normal to the entrance. The colored contours in the left three columns and the right two columns represent U and , respectively. Figure 8a shows that the air from outside the building is taken in through the upper region of the building entrance and expelled from inside the building through the lower region. However, the time-averaged flow fields indicate that the velocity magnitude near the entrance and inside the building was much smaller than that outside the building. Two counter-rotating vortex patterns at the entrance were observed on the vertical plane. This implies that the net airflow exchange rate was not significant. Figure 8b–e plot the contours of instantaneous flow fields in a quasi-steady state period of 920.0–951.0 s for the windward building with an overhang . Compared to the building without an overhang, the contour plots in the horizontal planes indicate that higher velocity magnitude regions formed near the building entrance. Moreover, on the vertical plane at , a counter clockwise–rotating vortex formed near the edge of the overhang and then penetrated inside the building before heading to the bottom wall. The vortex induced a strong negative velocity normal to the entrance in the upper region of the entrance but a positive velocity in the lower region, as clearly shown in the right column of Figure 8b–e. Note that local maxima of the ventilation rates were observed at and s, as shown in Figure 4. This confirms that the vortex penetrating inside the building in Figure 8c,d induced a greater airflow exchange at the entrance, which enhanced the ventilation rate.
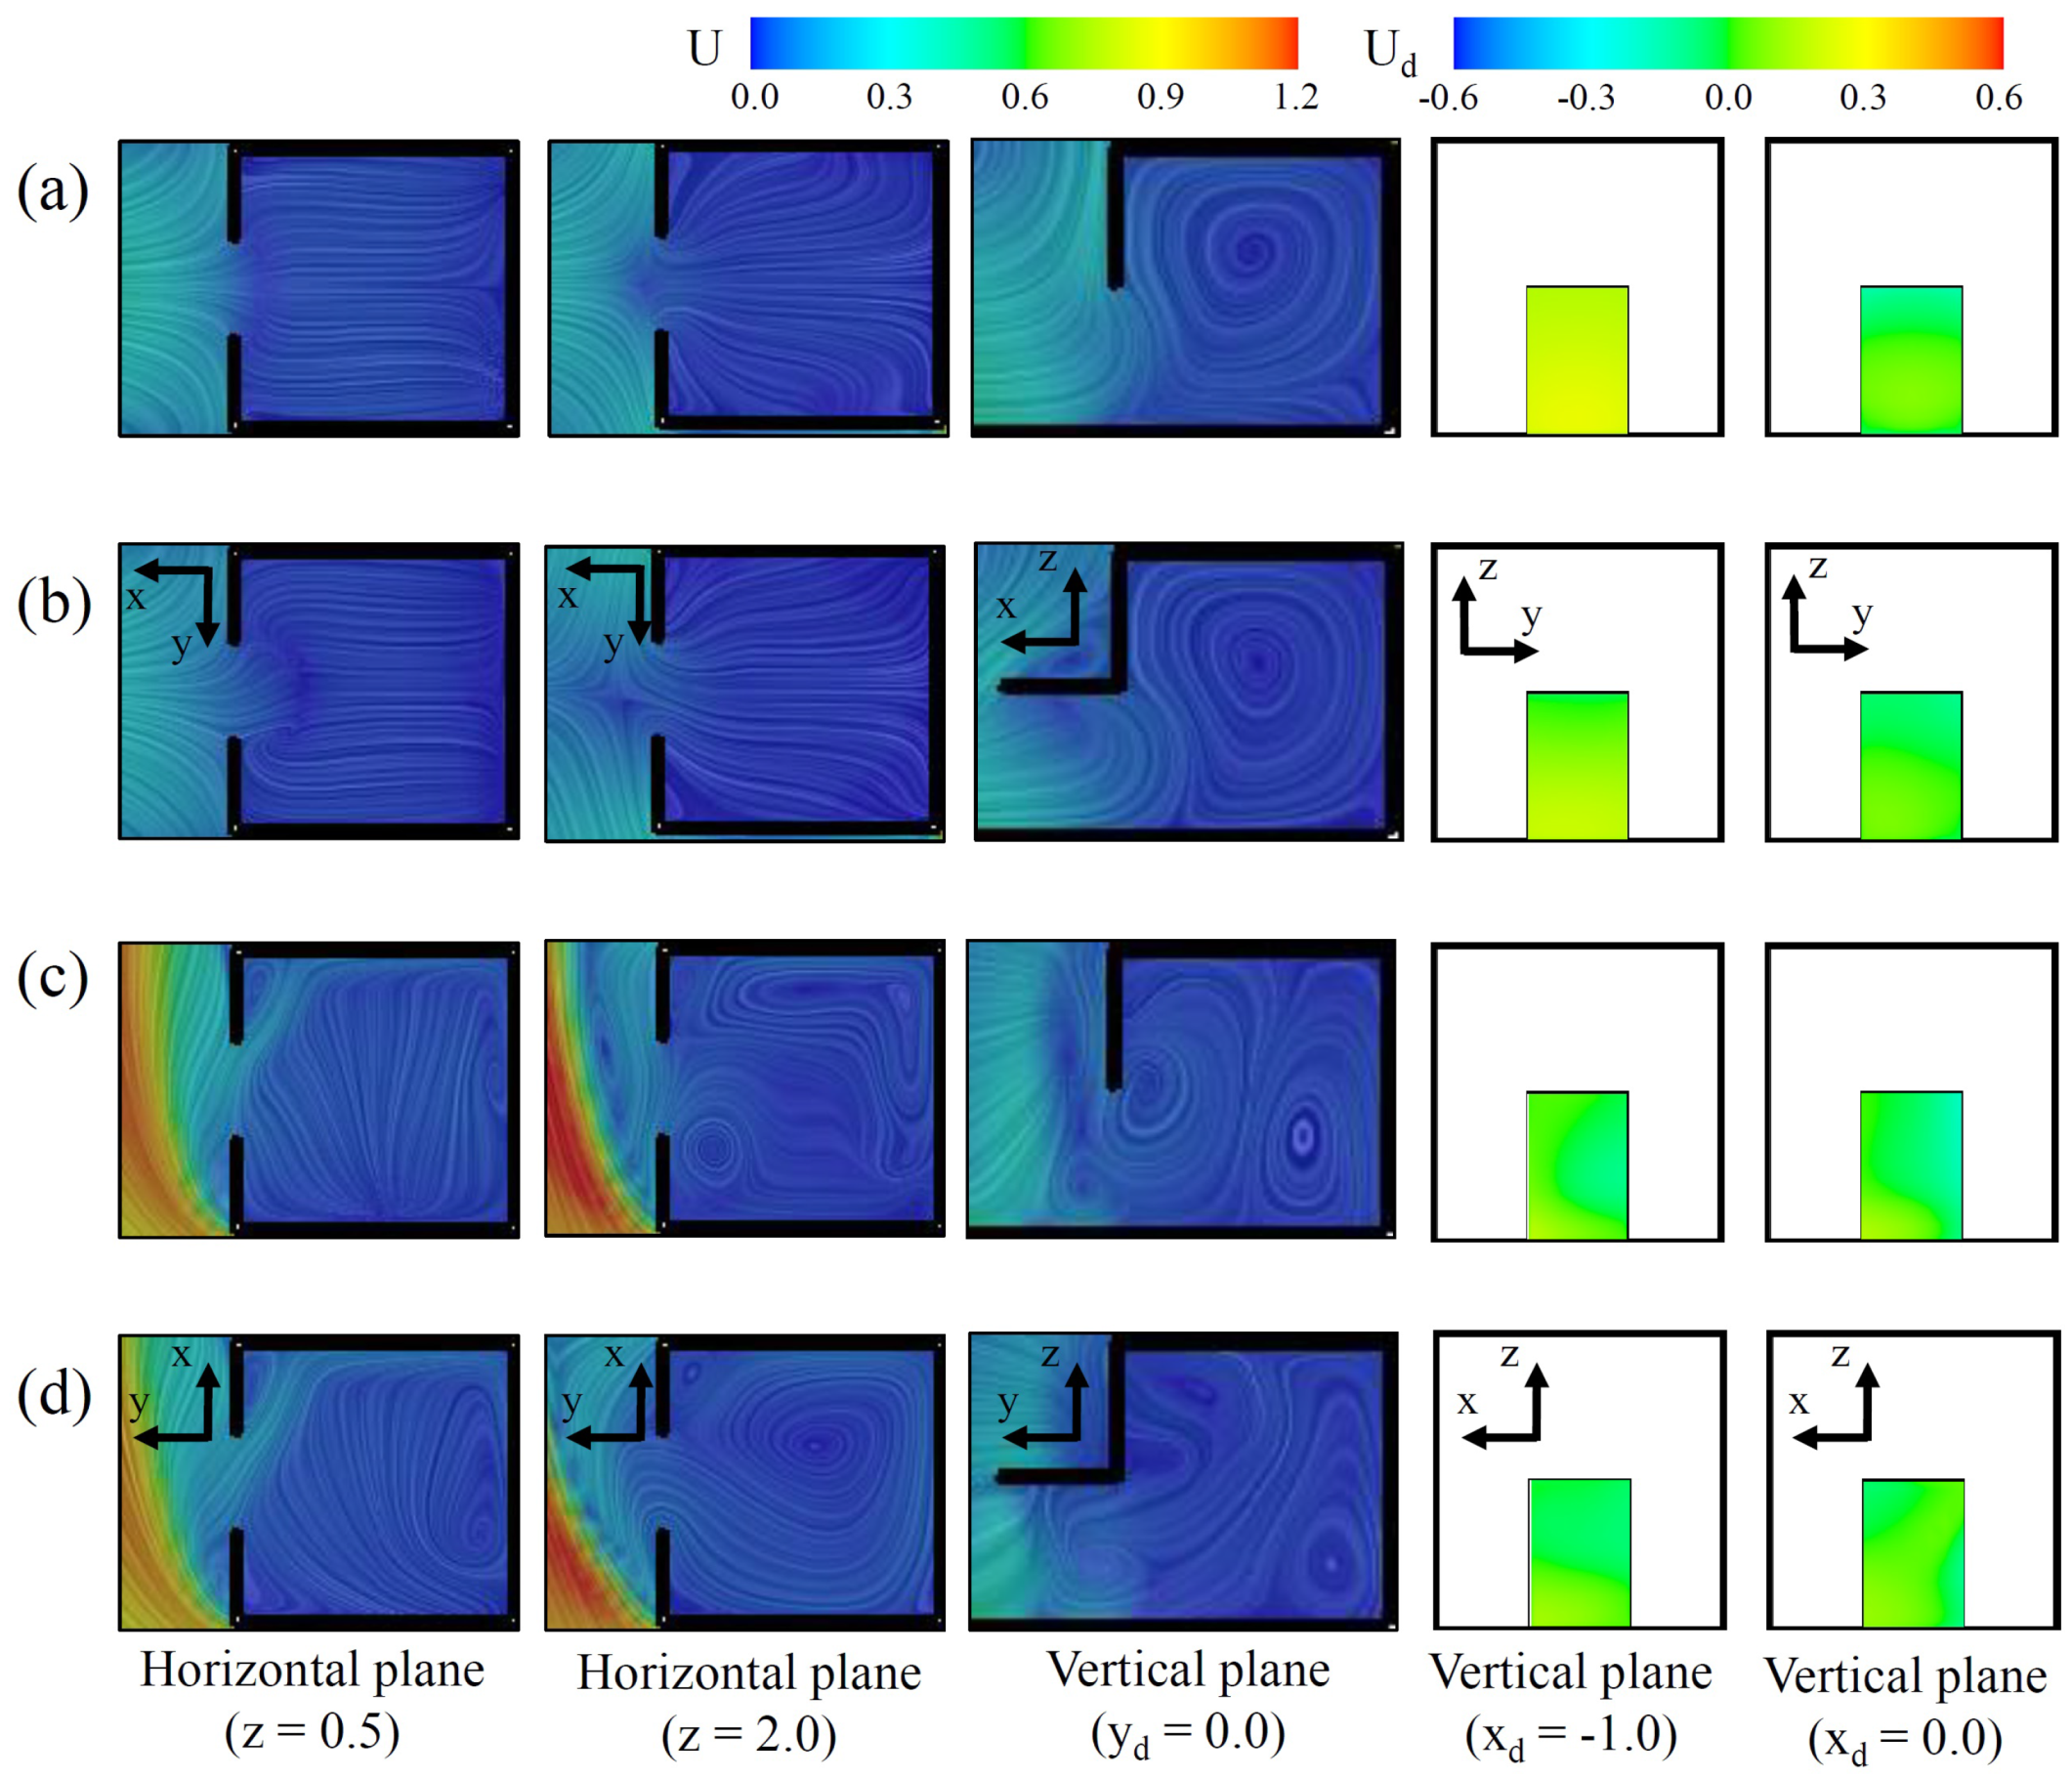
We also investigated the time-averaged flow fields for the single-sided building in the leeward and side directions at . Figure 9a,b show the contours of U along with streamlines and for buildings without and with an overhang , respectively, in the leeward direction. Because the building was against the incoming wind flow, a recirculation region formed near the entrance, as shown in the contour plots on the vertical plane (). Consequently, low momentum flows developed near the entrance for both cases, where the velocity magnitude was less than of the reference wind speed . For the building with the overhang, the recirculation region was slightly affected, and flows under the overhang lost their momentum. Thus, the overhang seemed to mitigate flow fluctuations near the entrance region, which led to slightly poor ventilation performance. Figure 9c,d show the contours for buildings without and with the overhang, respectively, in the side direction. The recirculation region in front of the entrance was clearly captured on the horizontal plane of Figure 9c. The momentum flux normal to the entrance region was greatly reduced due to the recirculation, which yielded to a barrier that reduced the net airflow exchange at the entrance. Figure 9d indicates that the overhang promoted the development of low momentum flows near the entrance. As a result, the ventilation rate for the building with the overhang was slightly reduced. Overall, the overhang for the building in the leeward and side directions widened the low-momentum flow region and reduced the ventilation performance compared to the building without an overhang.
3.3. Effect of Overhang on Local Mean Age of Air
Because the ventilation rates for the open area are estimated based on the exchange flow rates between incoming and outgoing flows through the area, predicting air freshness at arbitrary points inside the building may not be useful. We used the LMA to measure the ventilation performance for the indoor air freshness [31]. The LMA is an indicator for the average time fresh air takes to reach an arbitrary point in the room from the entrance. We calculated the LMA based on the following model equation [31]:
where θ denotes the LMA, is the position vector, represents velocity components, and and are the laminar and turbulent Schmidt numbers, respectively. The subscript j indicates directions. Here, we assumed . Time-averaged flow fields were used in the calculation of the LMA.
Figure 10 shows the contours of the LMA near the building including the interior region for nine different simulation cases. The distributions in each row indicate the LMA for different wind directions, while the distributions in each column indicate the LMA for different overhang lengths. Without the overhang, the LMA was slightly lower for the leeward building than for other buildings. For the windward building, a longer overhang apparently reduced the LMA throughout the interior, while the overhang for the side building did not change the LMA. Interestingly, the LMA greatly increased inside the leeward building with a longer overhang but was lower near the entrance region than for the case without the overhang. This implies that the overhang had an adverse influence on the actual ventilation performance of the leeward building.
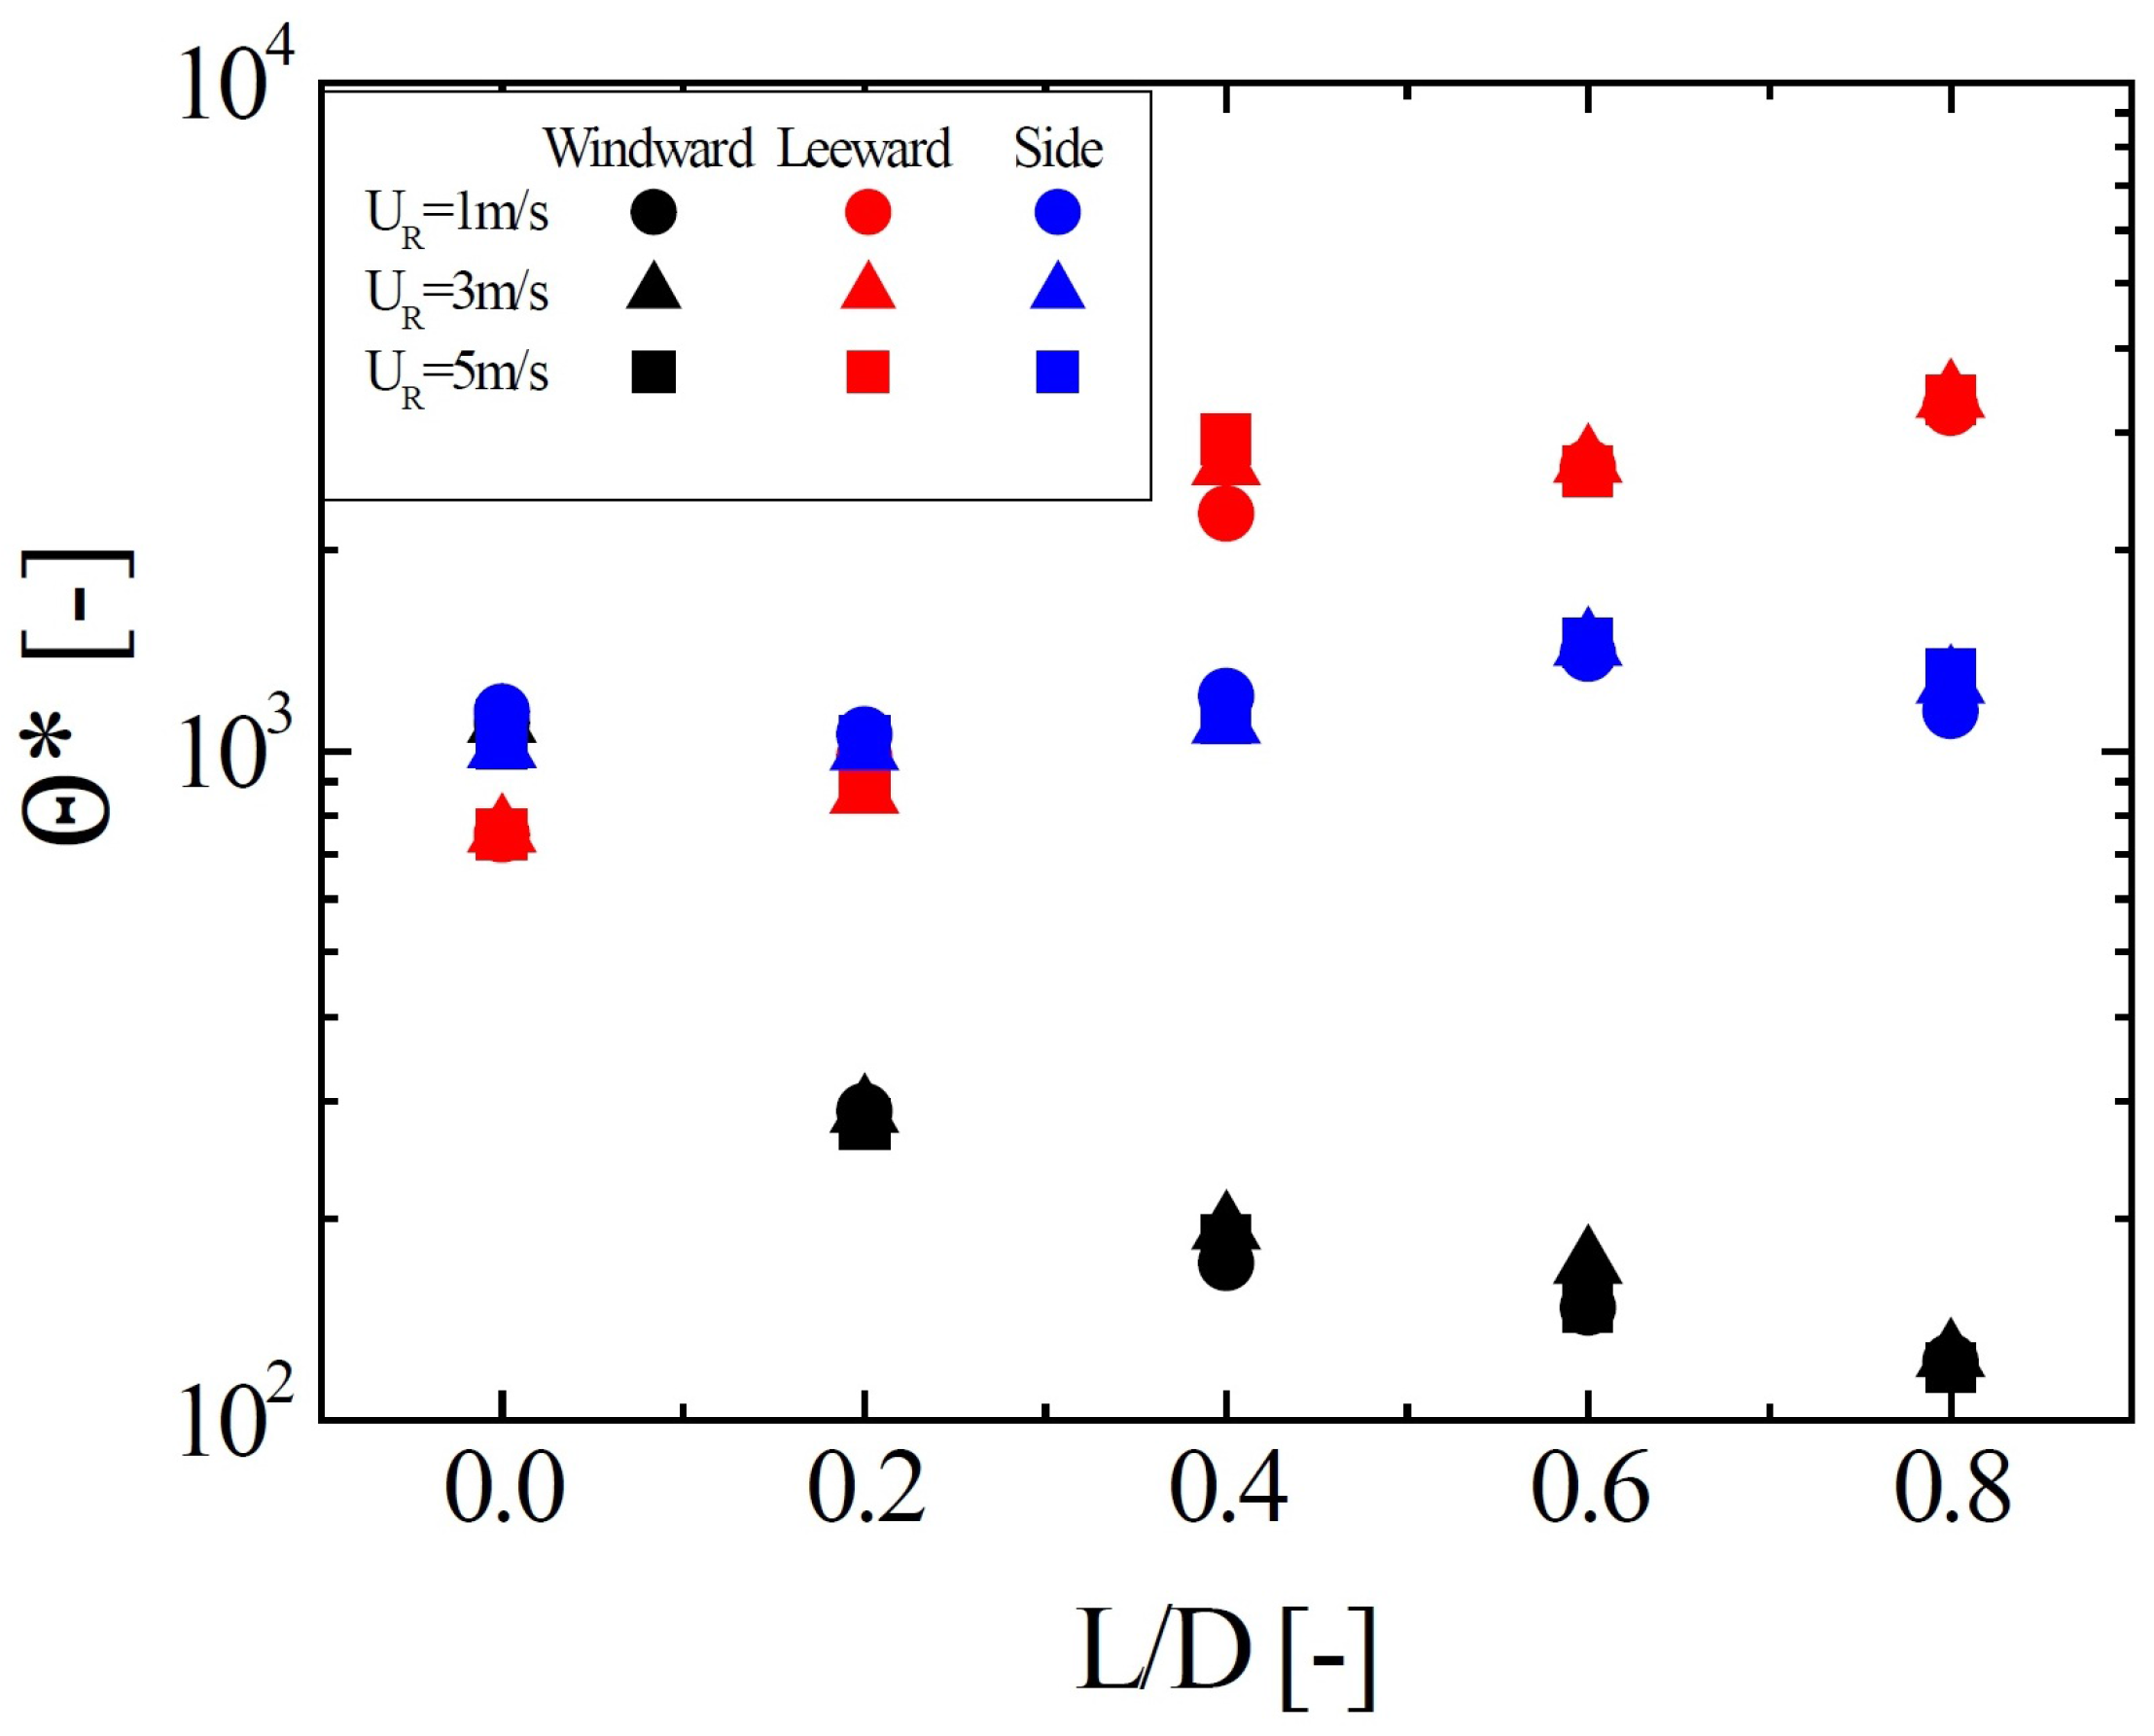
To assess the overall performance, we calculated the normalized volume–averaged LMA () by averaging of the LMA of all points inside the building space and then normalizing it by . Figure 11 shows the normalized LMA as a function of for different wind conditions. The normalized LMA showed a strong correlation with for each building direction, similar to the dimensionless ventilation rate in Figure 7. As expected, an overhang for the windward building greatly reduced the LMA compared to the case without the overhang. The longest overhang reduced the LMA by a factor of 9. However, an overhang increased the LMA for the leeward building, while the LMA for the side building did not show sensitivity to the overhang.
4. Conclusions
We performed numerical simulations of three-dimensional turbulent flows over a generic isolated building model with an overhang in order to investigate the effect of the overhang on the single-sided ventilation performance. Numerical results were obtained by solving the 3D URANS equations with the SST model. We carried out parametric studies to characterize the single-sided ventilation performance according to the overhang length, wind speed, and wind direction. The overhang was found to drastically increase the ventilation rate for the windward building, while the ventilation rates were slightly decreased for the leeward and side directions. Increasing the overhang was found to enhance single-sided ventilation for the windward building. The ventilation rates increased in proportion to the reference wind speed for all building directions, as confirmed by the strong linear correlation between the dimensionless ventilation rates and the overhang length . The enhanced ventilation rate due to the overhang can be explained by the fact that the overhang disturbs the flow in front of the entrance and changes the flow structure by producing a vortex at the tip of the overhang. The vortex penetrates the interior of the building, which increases the single-sided ventilation rates in the windward direction. However, for a building without an overhang in the leeward and side directions, a recirculation region with low momentum develops in front of the entrance because of the building itself. For both cases, adding an overhang seems to affect the recirculating flows and mitigate turbulent fluctuations near the entrance region, which results in reduces the ventilation rate. We analyzed the LMA based on time-averaged flow fields. The results indicated that an overhang significantly reduces LMA for the windward building but increases LMA for the leeward building. The LMA of the side building is not sensitive to the overhang. In this study, the influence of the overhang was examined in the terms of the ventilation rates. Therefore, the time-dependent pressure coefficients and other unsteady characteristics depending on the overhang length, wind speed, and wind directions need to be investigated to better understand the influence of the overhang.
Acknowledgments
This work was supported by National Research Foundation of Korea (NRF) grants funded by the Korean government (MSIP) (NRF-2014R1A2A1A11053140 and NRF-20151009350).
Author Contributions
Jung-Il Choi and Gwang Hoon Rhee conceived and designed the problems, Jinsoo Park performed the numerical simulations, Jinsoo Park and Jung-Il Choi analyzed the results, and all authors wrote the manuscript.
Conflicts of Interest
The authors declare no conflict of interest.
References
- Linden, P.F. The fluid mechanics of natural ventilation. Ann. Rev. Fluid Mech. 1999, 31, 201–238. [Google Scholar] [CrossRef]
- Jiang, Y.; Alexander, D.; Jenkins, H.; Arthur, R.; Chen, Q. Natural ventilation in buildings: Measurement in a wind tunnel and numerical simulation with large-eddy simulation. J. Wind Eng. Ind. Aerodyn. 2003, 91, 331–353. [Google Scholar] [CrossRef]
- Khan, N.; Su, Y.; Riffat, S.B. A review on wind driven ventilation techniques. Energy Build. 2008, 40, 1586–1604. [Google Scholar] [CrossRef]
- Nikas, K.S.; Nikolopoulos, N.; Nikolopoulos, A. Numerical study of a naturally cross-ventilated building. Energy Build. 2010, 42, 422–434. [Google Scholar] [CrossRef]
- Kindangen, J. Window and roof configurations for comfort ventilation. Build. Res. Inf. 1997, 25, 218–225. [Google Scholar] [CrossRef]
- Kindangen, J.; Krauss, G.; Depecker, P. Effects of roof shapes on wind-induced air motion inside buildings. Build. Environ. 1997, 32, 1–11. [Google Scholar] [CrossRef]
- Chand, I.; Bhargava, P.K.; Krishak, N.L.V. Effect of balconies on ventilation inducing aeromotive force on low-rise buildings. Build. Environ. 1998, 33, 385–396. [Google Scholar] [CrossRef]
- Mak, C.M.; Niu, J.L.; Lee, C.T.; Chen, K.F. A numerical simulation of wing walls using computational fluid dynamics. Energy Build. 2007, 39, 995–1002. [Google Scholar] [CrossRef]
- Montazeri, H.; Azizian, R. Experimental study on natural ventilation performance of one-sided wind catcher. Build. Environ. 2011, 43, 2193–2202. [Google Scholar] [CrossRef]
- Ai, Z.T.; Mak, C.M.; Niu, J.L.; Li, Z.R.; Zhou, Q. The effect of balconies on ventilation performance of low-rise buildings. Indoor Built. Environ. 2011, 20, 649–660. [Google Scholar] [CrossRef]
- Ai, Z.T.; Mak, C.M.; Niu, J.L.; Li, Z.R. The assessment of the performance of balconies using computational fluid dynamics. Build. Serv. Eng. Res. Technol. 2011, 32, 229–243. [Google Scholar] [CrossRef]
- Karava, P.; Stathopoulos, T.; Athienitis, A.K. Airflow assessment in cross-ventilated buildings with operable façade elements. Build. Environ. 2011, 46, 266–279. [Google Scholar] [CrossRef]
- Blocken, B.; Van Hooff, T.; Aanen, L.; Bronsema, B. Computational analysis of the performance of a venturi-shaped roof for natural ventilation: Venturi-effect versus wind-blocking effect. Comput. Fluids 2011, 48, 202–213. [Google Scholar] [CrossRef]
- Montazeri, H. Experimental and numerical study on natural ventilation performance of various multi-opening wind catchers. Build. Environ. 2011, 46, 370–378. [Google Scholar] [CrossRef]
- Montazeri, H.; Montazeri, F.; Azizian, R.; Mostafavi, S. Two-sided wind catcher performance evaluation using experimental, numerical and analytical modeling. Renew. Energy 2010, 35, 1424–1435. [Google Scholar] [CrossRef]
- Ghadiri, M.H.; Lukman, N.; Ibrahim, N.; Mohamed, M.F. Computational analysis of wind-driven natural ventilation in a two sided rectangular wind catcher. Int. J. Vent. 2013, 12, 51–62. [Google Scholar]
- Prajongsan, P.; Sharples, S. Enhancing natural ventilation, thermal comfort and energy savings in high-rise residential buildings in Bangkok through the use of ventilation shafts. Build. Environ. 2012, 10, 142–149. [Google Scholar] [CrossRef]
- Montazeri, H.; Blocken, B. CFD simulation of wind-induced pressure coefficients on buildings with and without balconies: Validation and sensitivity analysis. Build. Environ. 2013, 60, 137–149. [Google Scholar] [CrossRef]
- Perén, J.I.; Van Hooff, T.; Leite, B.C.C.; Blocken, B. CFD analysis of cross-ventilation of a generic isolated building with asymmetric opening positions: Impact of roof angle and opening location. Build. Environ. 2015, 85, 263–276. [Google Scholar] [CrossRef]
- Perén, J.I.; Van Hooff, T.; Ramponi, R.; Blocken, B.; Leite, B.C.C. Impact of roof geometry of an isolated leeward sawtooth roof building on cross-ventilation: Straight, concave, hybrid or convex? J. Wind Eng. Ind. Aerodyn. 2015, 20, 102–114. [Google Scholar] [CrossRef]
- Perén, J.I.; Van Hooff, T.; Leite, B.C.C.; Blocken, B. Impact of eaves on cross-ventilation of a generic isolated leeward sawtooth roof building: Windward eaves, leeward eaves and eaves inclination. Build. Environ. 2015, 92, 578–590. [Google Scholar] [CrossRef]
- Raeissi, S.; Taheri, M. Optimum overhang dimensions for energy saving. Build. Environ. 1998, 33, 293–302. [Google Scholar] [CrossRef]
- Evola, G.; Popov, V. Computational analysis of wind driven natural ventilation in buildings. Energy Build. 2006, 38, 491–501. [Google Scholar] [CrossRef]
- CD-Adapco. STAR-CCM++ Version 7.04 User Guide; CD-Adapco: New York, NY, USA, 2012. [Google Scholar]
- Meroney, R.N. CFD prediction of airflow in buildings for natural ventilation. In Proceedings of the 11th Americas Conference on Wind Engineering, San Juan, Puerto Rico, 22–26 June 2009; pp. 1–11.
- Ramponi, R.; Blocken, B. CFD simulation of cross-ventilation for a generic isolated building: Impact of computational parameters. Build. Environ. 2012, 53, 34–48. [Google Scholar] [CrossRef]
- Menter, F.R. Two-equation eddy-viscosity turbulence models for engineering applications. AIAA J. 1994, 32, 1598–1605. [Google Scholar] [CrossRef]
- Ai, Z.T.; Mak, C.M. CFD simulation of flow and dispersion around an isolated building: Effect of inhomogeneous ABL and near-wall treatment. Atmos. Environ. 2013, 77, 568–578. [Google Scholar] [CrossRef]
- Warren, P.; Parkins, L. Single-sided ventilation through open windows. ASHRAE J. 1985, 49, 209–228. [Google Scholar]
- Cabral, B.; Leedom, L. Imaging vector fields using line integral convolution. In Proceedings of the ACM SIGGRAPH 93 Conference on Computer Graphics and Interactive Techniques, New York, NY, USA, 2–6 August 1993.
- Bartak, M.; Beausoleil-Morrison, I.; Clarke, J.; Denev, J.; Drkal, F.; Lain, M.; Macdonald, I.A.; Melikov, A.; Popiolek, Z.; Stankov, P. Integrating CFD and building simulation. Build. Environ. 2002, 37, 865–871. [Google Scholar] [CrossRef]
Figure 1.
Schematics of (a) the computational domain; (b) an idealized building model with an overhang; and (c) the measurement positions.
Figure 1.
Schematics of (a) the computational domain; (b) an idealized building model with an overhang; and (c) the measurement positions.
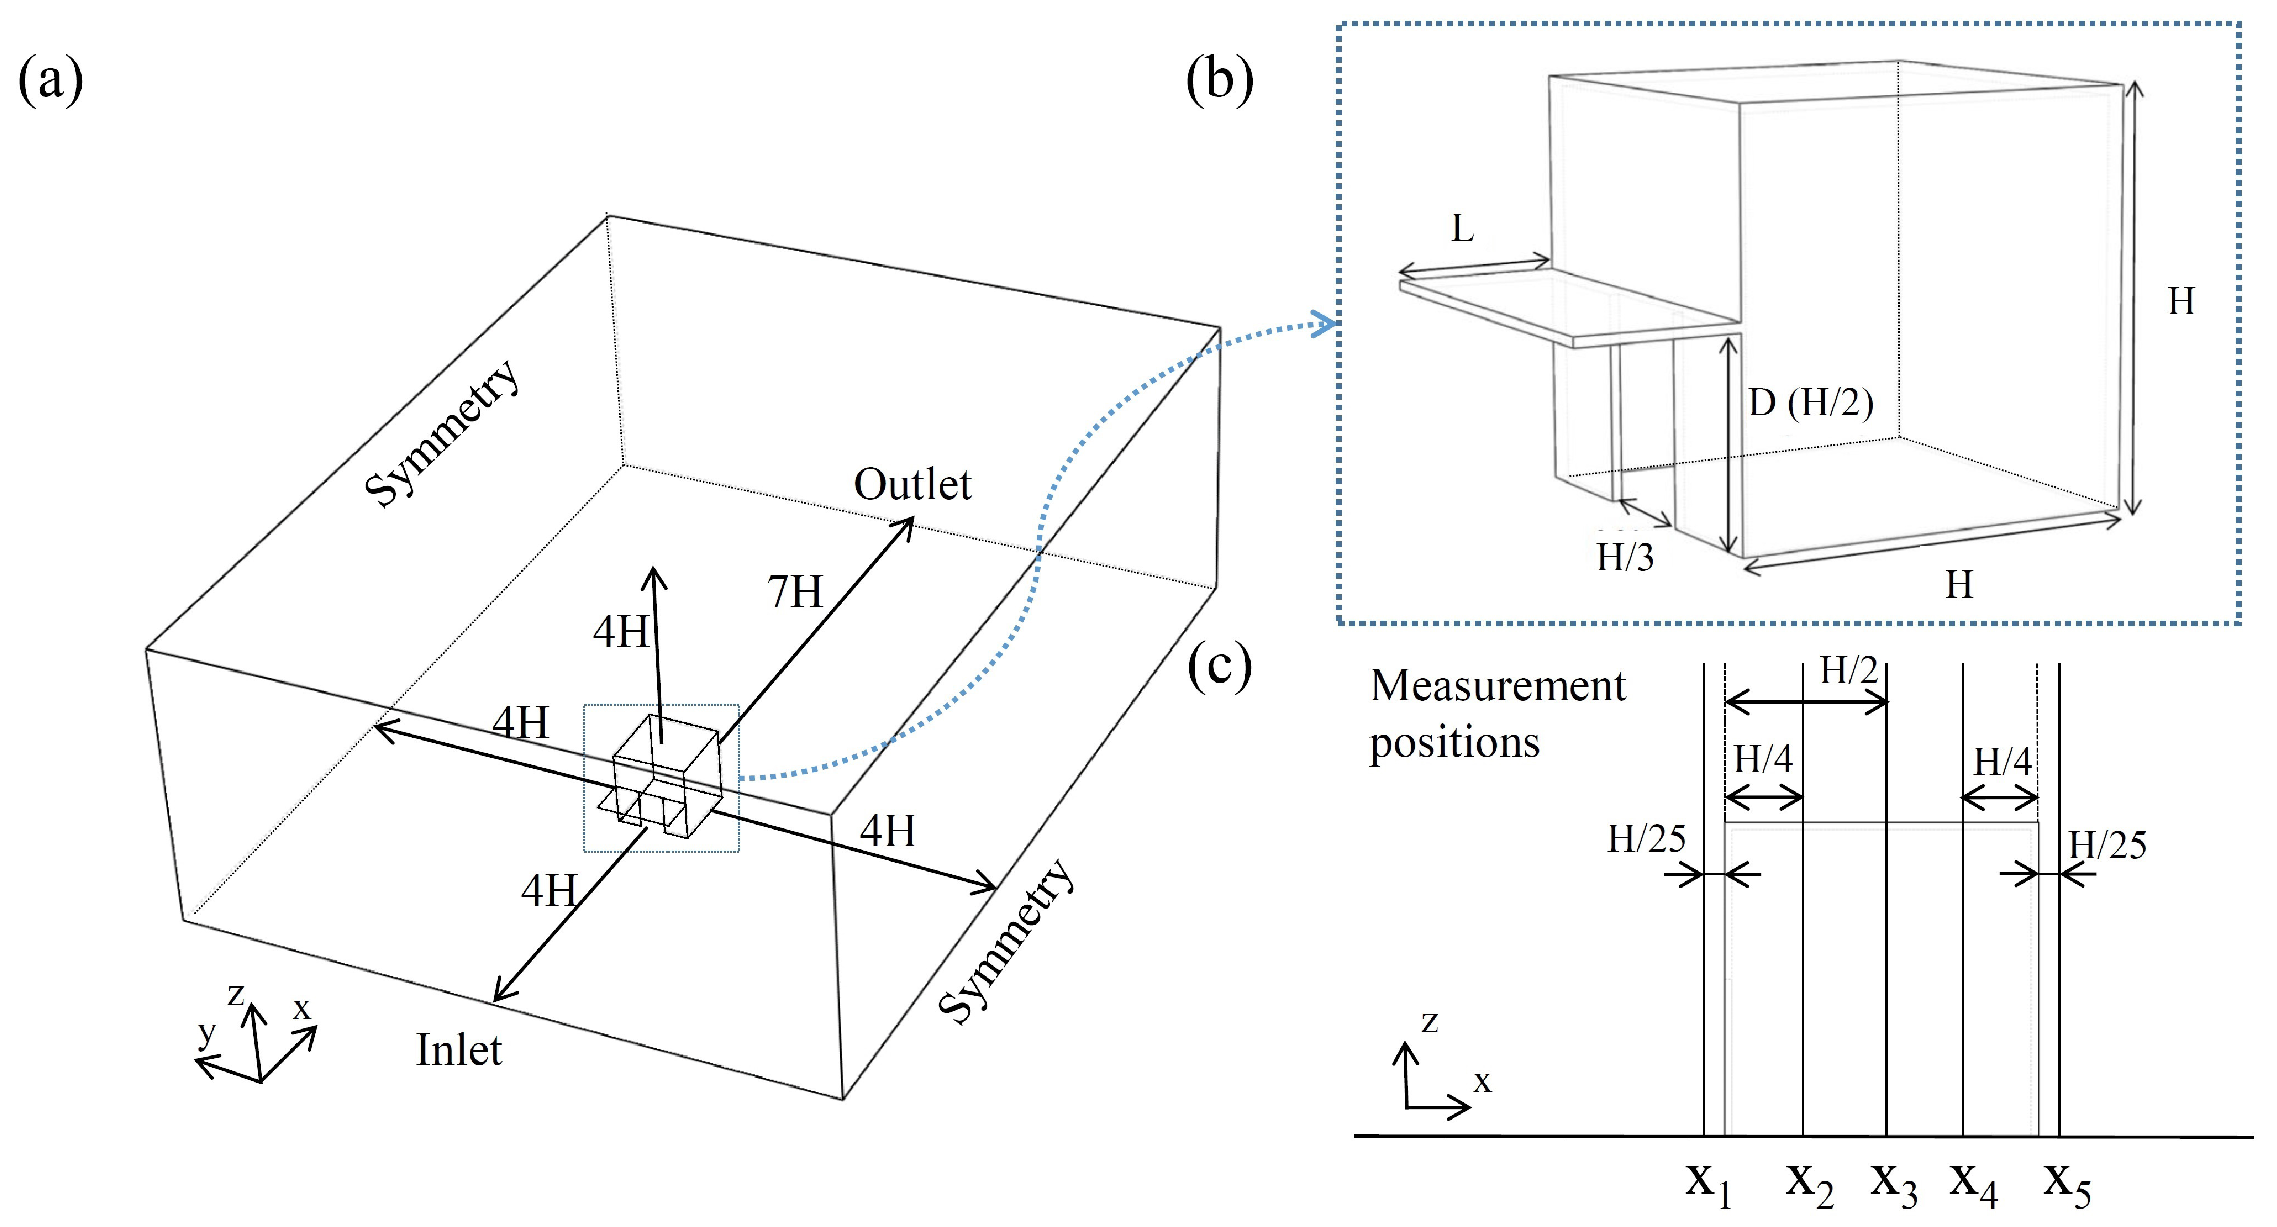
Figure 2.
(a) Unstructured hexahedral grid (420,000 cells) on the vertical plane at the center of the building and the wind directions for the building; (b) windward; (c) leeward; and (d) side.
Figure 2.
(a) Unstructured hexahedral grid (420,000 cells) on the vertical plane at the center of the building and the wind directions for the building; (b) windward; (c) leeward; and (d) side.

Figure 3.
Comparison of velocity profiles along the direction normal to the wall with measurement data [2] at the measurement positions and for a single-sided building in (a) the windward and (b) leeward directions.
Figure 3.
Comparison of velocity profiles along the direction normal to the wall with measurement data [2] at the measurement positions and for a single-sided building in (a) the windward and (b) leeward directions.

Figure 4.
Time histories of ventilation rates (a) for a single-sided building without an overhang and with an overhang at in the windward direction for the entire simulation period and (b) for the building with an overhang at for a dominant quasi-periodic interval.
Figure 4.
Time histories of ventilation rates (a) for a single-sided building without an overhang and with an overhang at in the windward direction for the entire simulation period and (b) for the building with an overhang at for a dominant quasi-periodic interval.
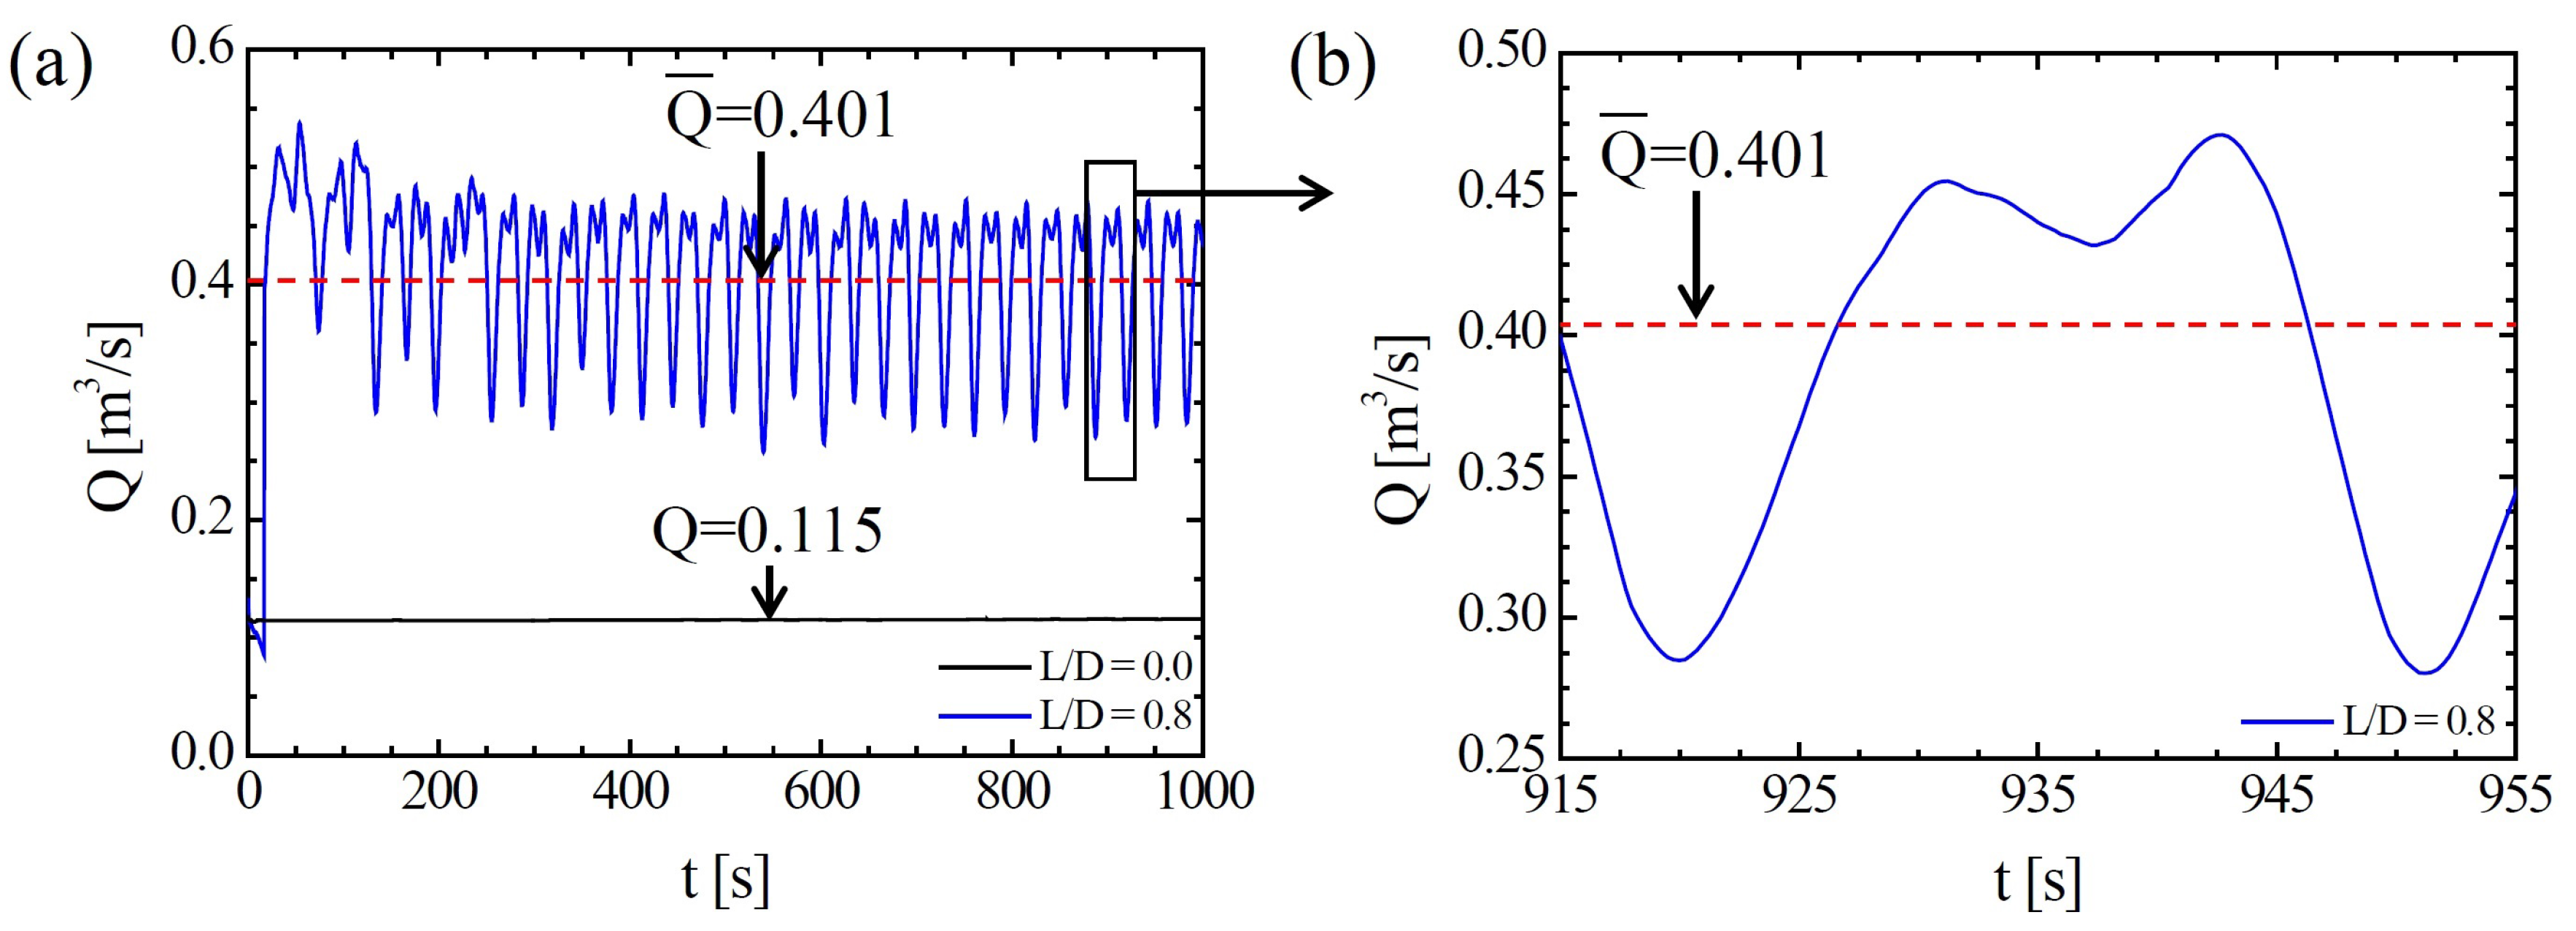
Figure 5.
Effect of the overhang length on the ventilation rate: (a) windward direction; (b) leeward direction; and (c) side direction.
Figure 5.
Effect of the overhang length on the ventilation rate: (a) windward direction; (b) leeward direction; and (c) side direction.
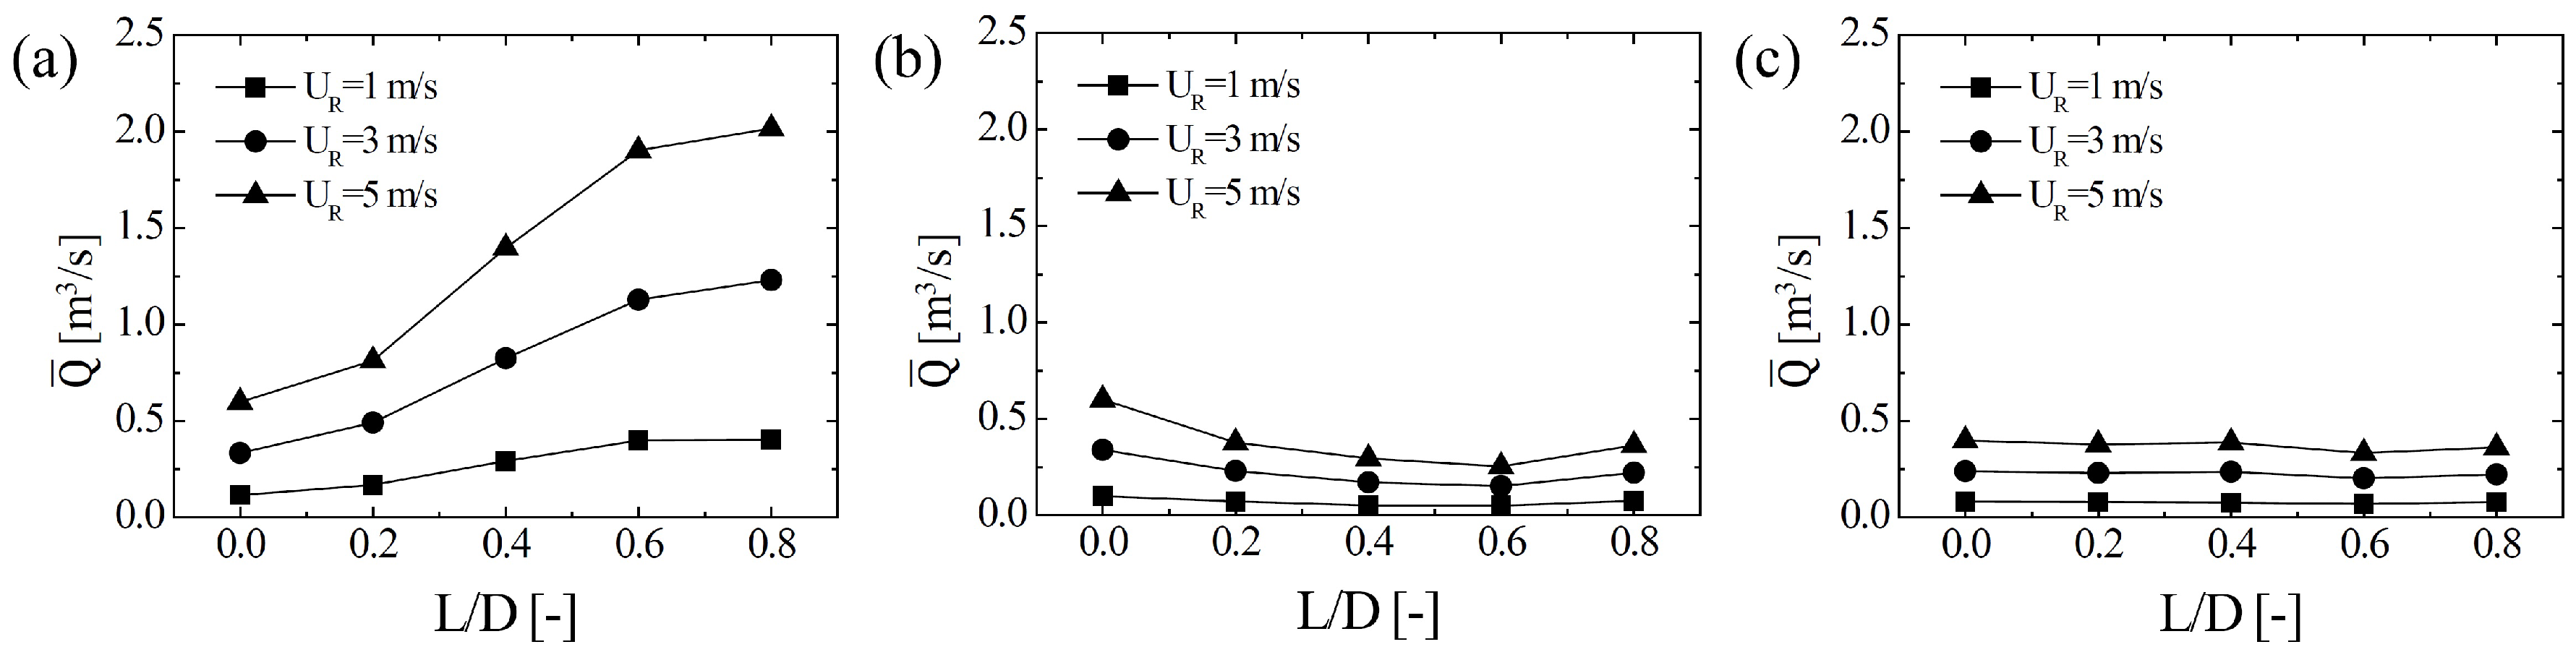
Figure 6.
Comparison of the present ventilation rates with the correlation of Warren and Parkins [29].
Figure 6.
Comparison of the present ventilation rates with the correlation of Warren and Parkins [29].

Figure 7.
Effectiveness of the overhang based on a dimensionless ventilation rate.

Figure 8.
Contour plots of the velocity magnitude along with streamlines and the velocity normal to the entrance for the single-sided windward building: (a) time-averaged flow fields for the building without an overhang and (b–e) instantaneous flow fields for the building with the overhang in a quasi-steady state period of 920.0–951.0 s; (b) ; (c) ; (d) ; and (e) s.

Figure 9.
Contour plots of the time-averaged velocity magnitude along with streamlines and the velocity normal to the entrance: for the single-sided building (a) without an overhang and (b) with the overhang in the leeward direction, and for the single-sided building (c) without an overhang and (d) with the overhang in the side direction.

Figure 10.
Contour plots of local mean age of air (LMA) for a single-sided building with different overhang lengths at m/s in the (a) windward; (b) leeward; and (c) side directions.
Figure 10.
Contour plots of local mean age of air (LMA) for a single-sided building with different overhang lengths at m/s in the (a) windward; (b) leeward; and (c) side directions.
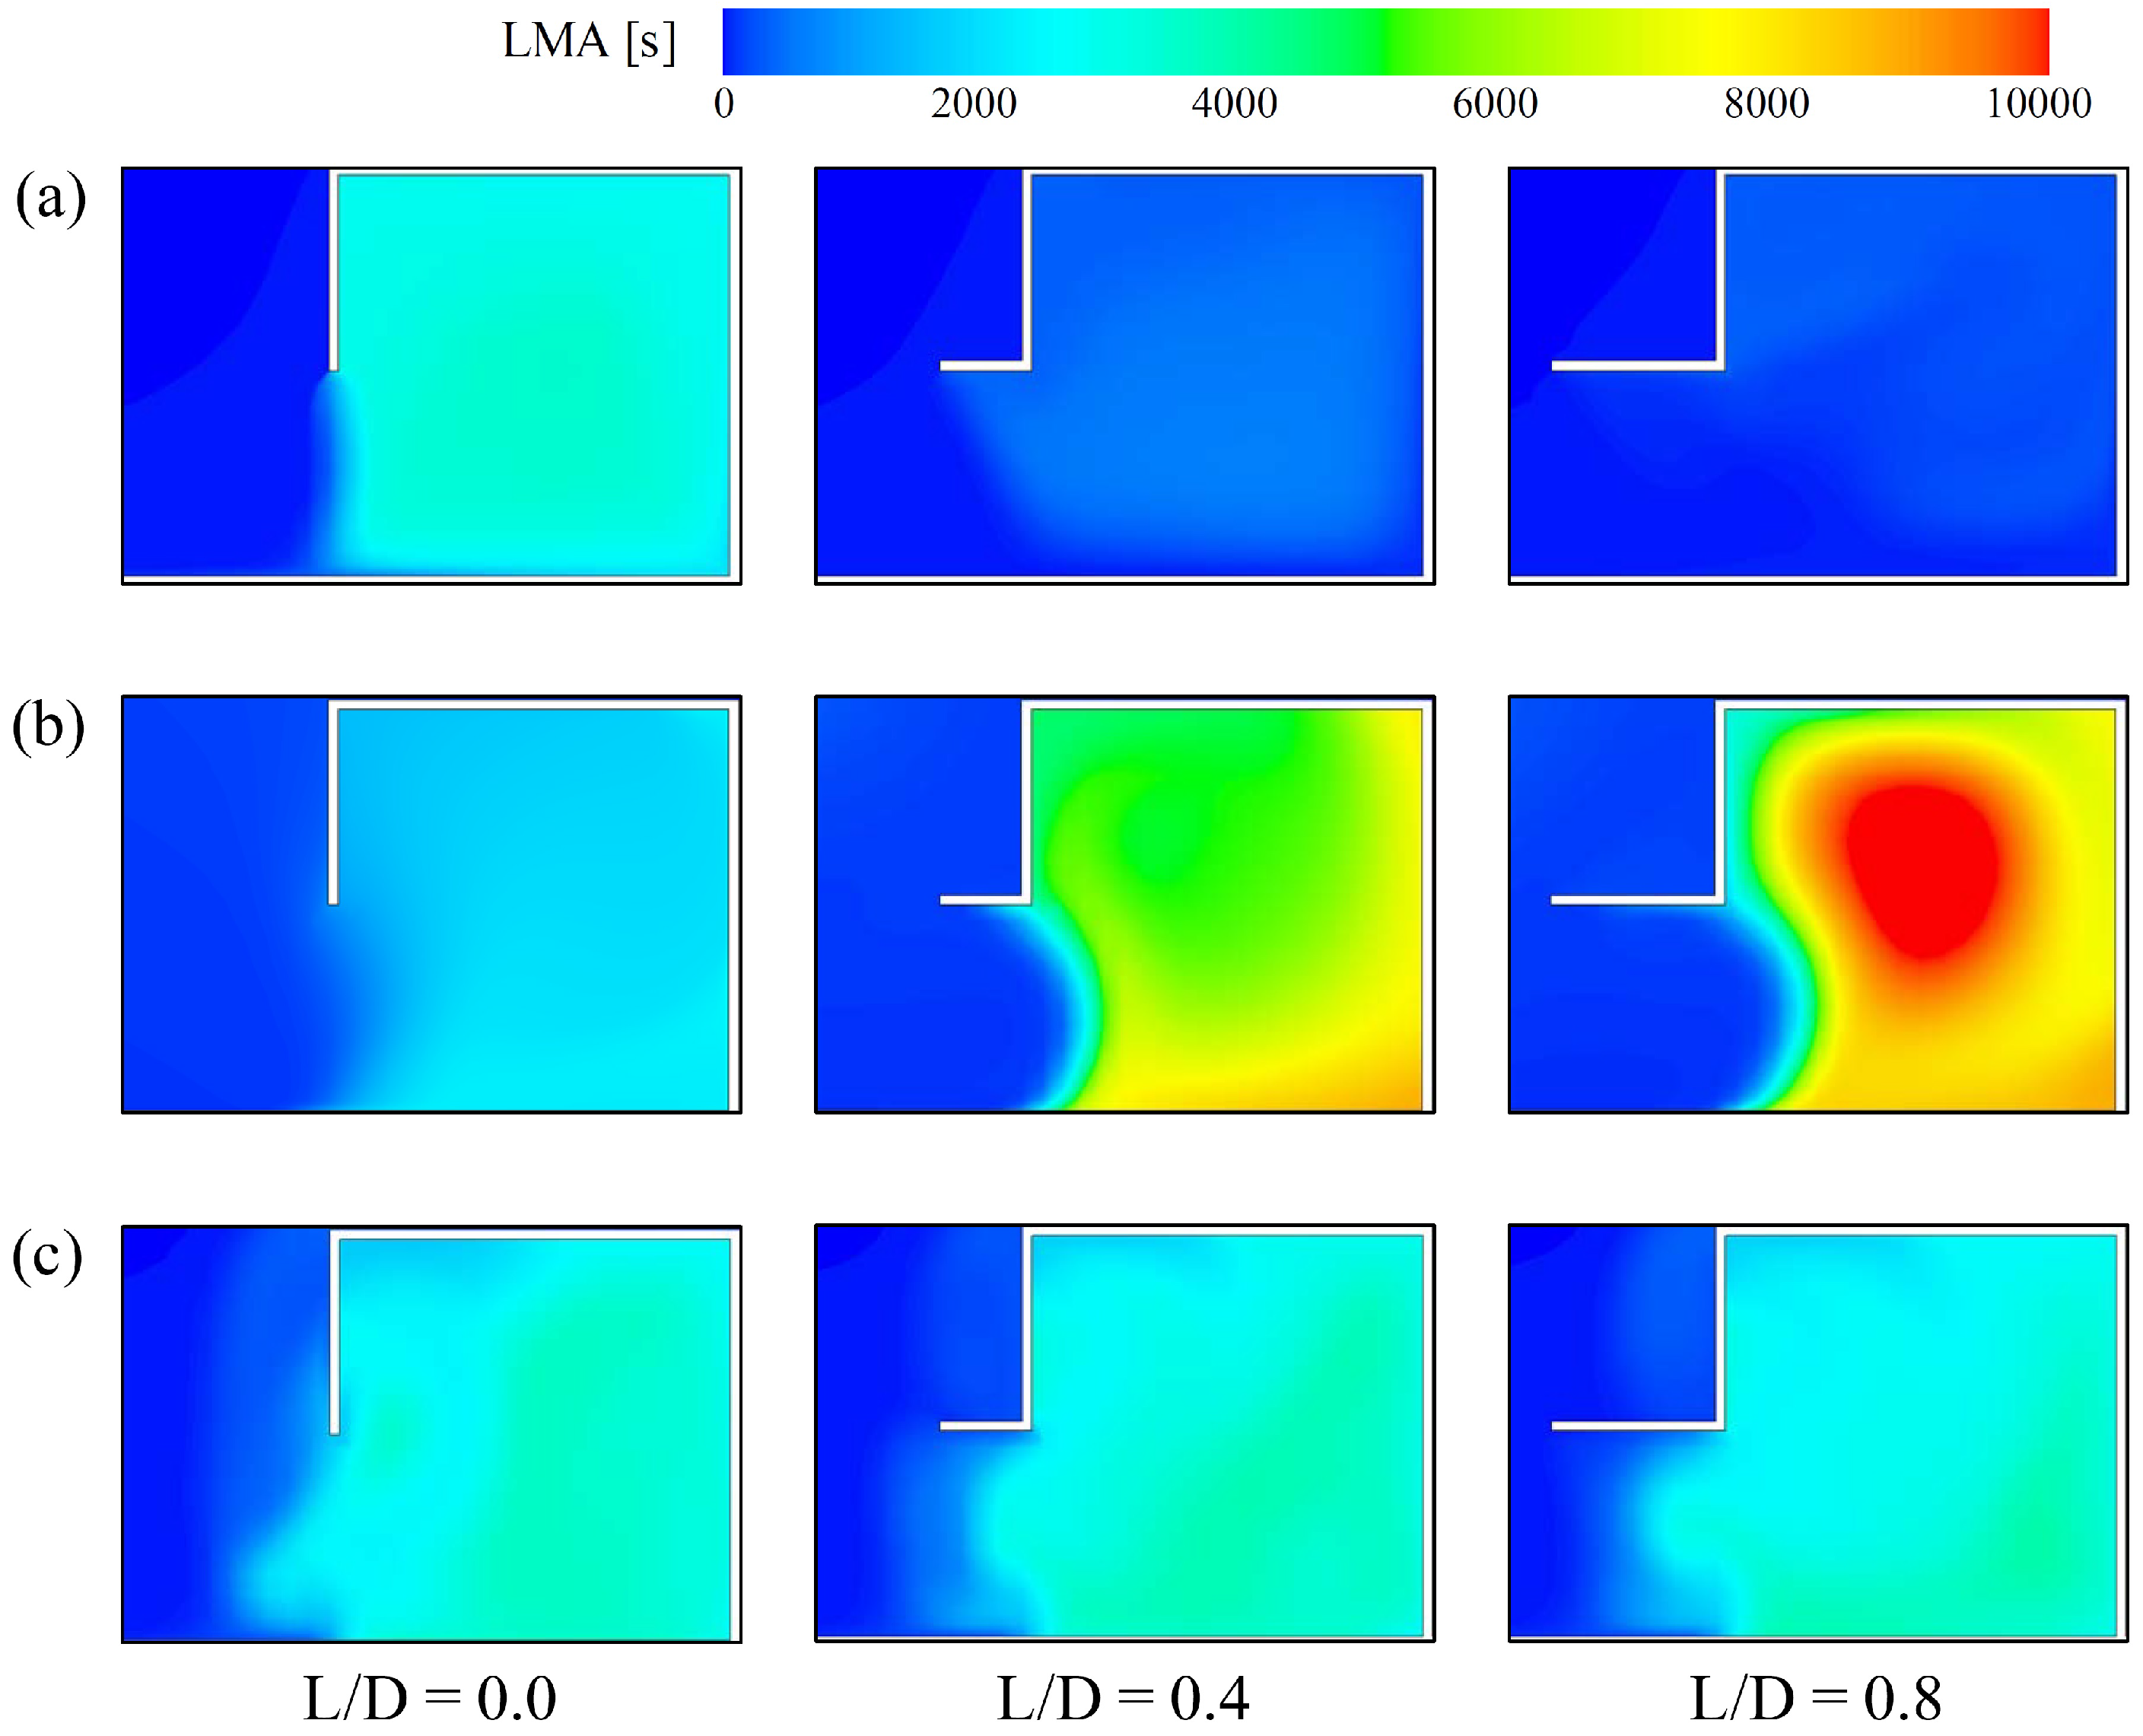
Figure 11.
Effect of the overhang length on the normalized volume–averaged LMA.
© 2016 by the authors; licensee MDPI, Basel, Switzerland. This article is an open access article distributed under the terms and conditions of the Creative Commons by Attribution (CC-BY) license (http://creativecommons.org/licenses/by/4.0/).
Share and Cite
MDPI and ACS Style
Park, J.; Choi, J.-I.; Rhee, G.H. Enhanced Single-Sided Ventilation with Overhang in Buildings. Energies 2016, 9, 122. https://doi.org/10.3390/en9030122
AMA Style
Park J, Choi J-I, Rhee GH. Enhanced Single-Sided Ventilation with Overhang in Buildings. Energies. 2016; 9(3):122. https://doi.org/10.3390/en9030122
Chicago/Turabian StylePark, Jinsoo, Jung-Il Choi, and Gwang Hoon Rhee. 2016. "Enhanced Single-Sided Ventilation with Overhang in Buildings" Energies 9, no. 3: 122. https://doi.org/10.3390/en9030122
Note that from the first issue of 2016, this journal uses article numbers instead of page numbers. See further details here.