Article

Environmental Analysis of Petrol, Diesel and Electric Passenger Cars in a Belgian Urban Setting

Electrotechnical Engineering and Energy Technology, MOBI Research Group, Vrije Universiteit Brussel, Pleinlaan 2, Brussels 1050, Belgium
*
Authors to whom correspondence should be addressed.
These authors contributed equally to this work.
Energies 2016, 9(2), 84; https://doi.org/10.3390/en9020084
Submission received: 10 November 2015 / Revised: 18 January 2016 / Accepted: 19 January 2016 / Published: 29 January 2016
(This article belongs to the Special Issue Advances in Plug-in Hybrid Vehicles and Hybrid Vehicles)

Abstract

:
The combustion of fossil fuels in the transport sector leads to an aggravation of the air quality along city roads and highways. Urban air quality is a serious problem nowadays as the number of vehicles increases on a yearly basis. With stricter Euro emission regulations, vehicle manufacturers are not meeting the imposed limits and are also disregarding the non-exhaust emissions. This paper highlights the relevance of non-exhaust emissions of passenger vehicles, both conventional (diesel and petrol) or electric vehicles (EV), on air quality levels in an urban environment in Belgium. An environmental life cycle assessment was carried out based on a real-world emission model for passenger cars and fuel refinery data. A cut-off was applied to the models to highlight what emissions, both from the refinery to the exhaust and electricity production for EV, do actually occur within Belgium’s borders. Results show that not much progress has been made from Euro 4 to 6 for conventional vehicles. Electric vehicles pose the best alternative solution as a more environmentally friendly means of transportation. The analysis results target policy makers with the intention that regulations and policies would be developed in the future and target the characterization of non-exhaust emissions from vehicles. These results indicate that EVs offer a valid solution for addressing the urban air quality issue and that non-exhaust emissions should be addressed in future regulatory steps as they dominate the impact spectrum.

1. Introduction

Practically all economic and societal activities cause air pollutant emissions. European abatement policies over time have led to improved air quality levels for several pollutants, such as carbon monoxide (CO), lead (Pb) and sulphates (SO42−) [1]. This has not been the case for all pollutants, though. The emission of primary particulate matter with an aerodynamic diameter smaller than 10 mm (PM10), for example, has actually increased since 2002 and despite the reductions of ground-level ozone (O3) precursor gases such as CO, nitrogen oxides (NOx), non-methane hydrocarbons (NMHC) and methane (CH4), several regions throughout Europe have witnessed an increase in ground-level ozone concentrations. Hotspots for PM10 and O3 are typically found in cities, where more than 96% of city dwellers are exposed to air pollutant levels deemed harmful to health by the World Health Organisation (WHO) [2]. The latest urban air quality data for Belgium show annual mean PM10 levels of 26 μg/m3 (WHO guideline 20 μg/m3) and maximum number of days exceeding ozone thresholds, above 34 (European Union (EU) guideline >120 μg/m3) [3]. Although the WHO specifications for air quality are not legally binding, they have served as guidelines for the less stringent European air quality standards as defined by [4]. As Belgium has systematically missed targets to reduce levels of harmful emissions, the European Commission (EC) refered the Member State to the European Court of Justice for non-compliance [5]. Urban air pollution is of significant importance, as in 2014 more than half of the World’s population lived in cities (WHO, 2014) and a further growth to 66% by 2050 is forecast [6]. In the case for Belgium, about 98% of the population lived in urban areas in 2013, following a constantly increasing urbanization trend since the 1960s [7]. This high percentage can be explained by the close proximity of the Belgian cities to each other.
Road transport is known to be a major source of atmospheric pollution [8,9,10]. Despite the fact that exhaust emission regulations for European passenger cars have been in force for more than 20 years, the desired improvements in air quality have not materialized yet [1,11]. Therefore, the effectiveness of the Euro emission standards for road transport can be questioned. Pollutants emitted by passenger cars dominate the road transport sector’s impact on air quality, as 83% of the total vehicle kilometres travelled in Europe were performed by passenger cars in 2012 [12]. Moreover, a tendency to travel more kilometres by car is reported, as can be seen by an increase by 40% more passenger-kilometres and 80% more tonne-kilometres for freight transport on the road for the 1990–2010 time frame [12,13]. This trend is detrimental to the air pollution mitigation objective, as absolute emissions may increase despite the use of “cleaner” vehicle technologies. Concerning the heavy-duty vehicle sector, a similar annual share of NOx emissions is reported as for the light-duty fleet [13]. Although the heavy-duty sector cannot be neglected in the assessment of urban air quality, the scope of this paper only includes passenger cars.
Looking at the European passenger car registrations according to drivetrain technology, it becomes apparent that the market remains dominated by diesel cars, as a market share of 53% was reported for the year 2013. Registrations for alternative technologies remain marginal, as the plug-in hybrid electric vehicle (PHEV) and battery electric vehicle (BEV) fleet accounted for 0.42% of the total of that year. Hybrid electric vehicles (HEV) on the other hand, represented 1.4% in 2013 [14]. Nevertheless these alternative technologies remain of key importance for the achievement of the 95 gCO2·km−1 target for passenger cars by 2021, as described in Regulation European Commission (EC) No 443/2009 [15], in addition to improvements in air quality.
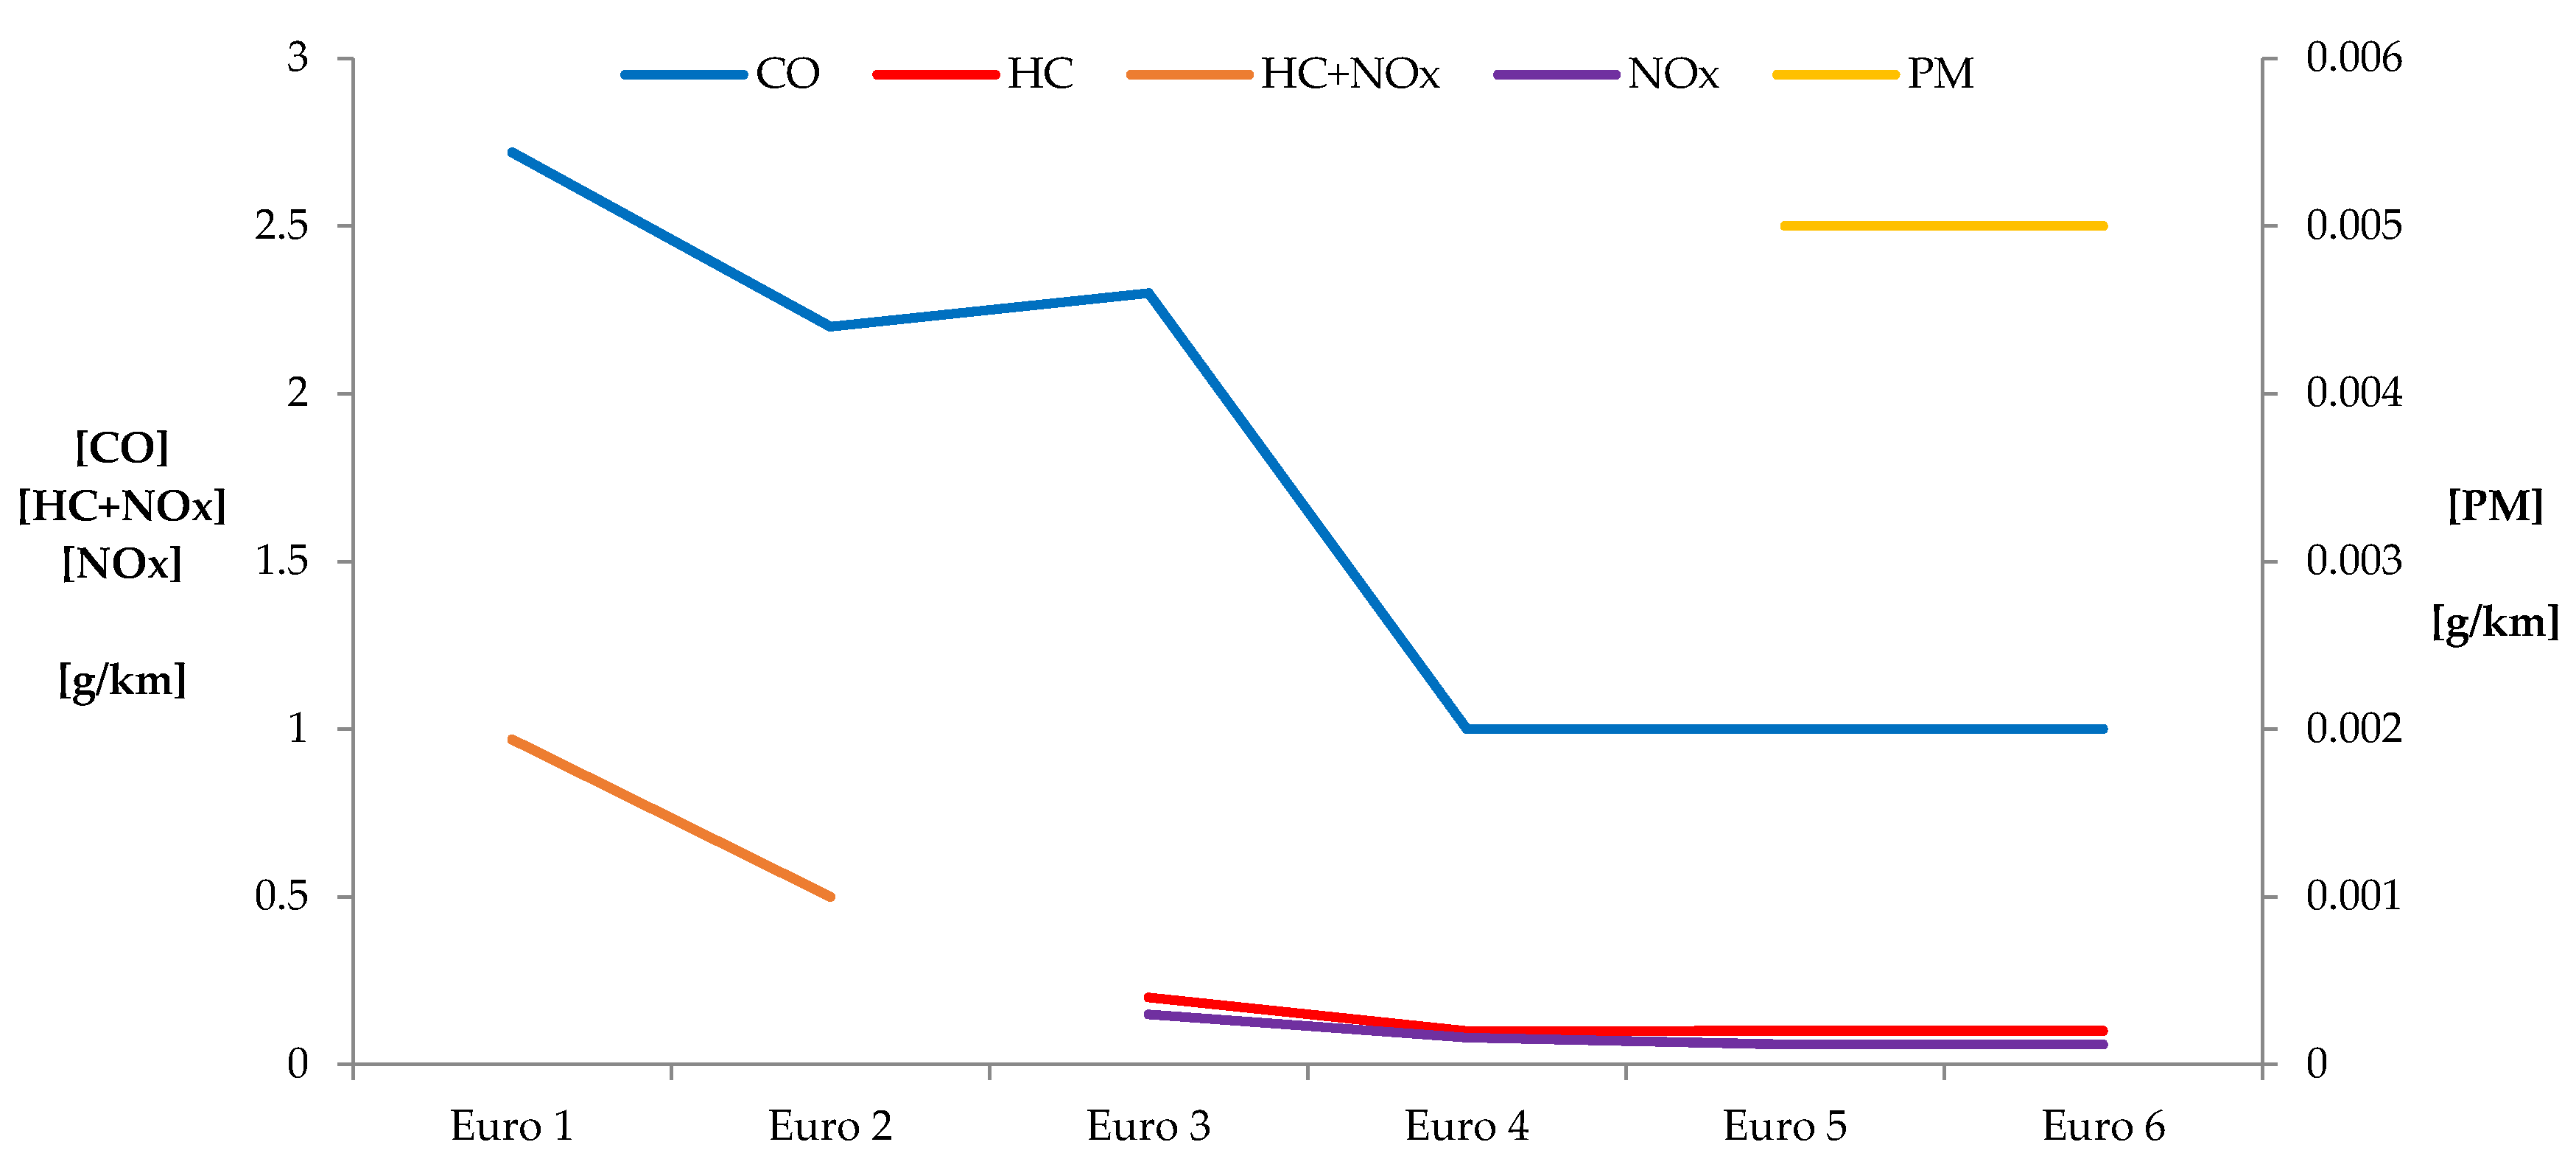
In terms of the impact on air quality, vehicle technologies are often assessed by means of their emission of regulated pollutants, i.e., for carbon monoxide (CO), non-methane hydrocarbons (NMHC), nitrogen oxides (NOx), particulate matter (PM10) and currently also the particle number (PN, momentarily only for diesel and direct injection petrol vehicles). The reductions according to the Euro emission standards are shown in 
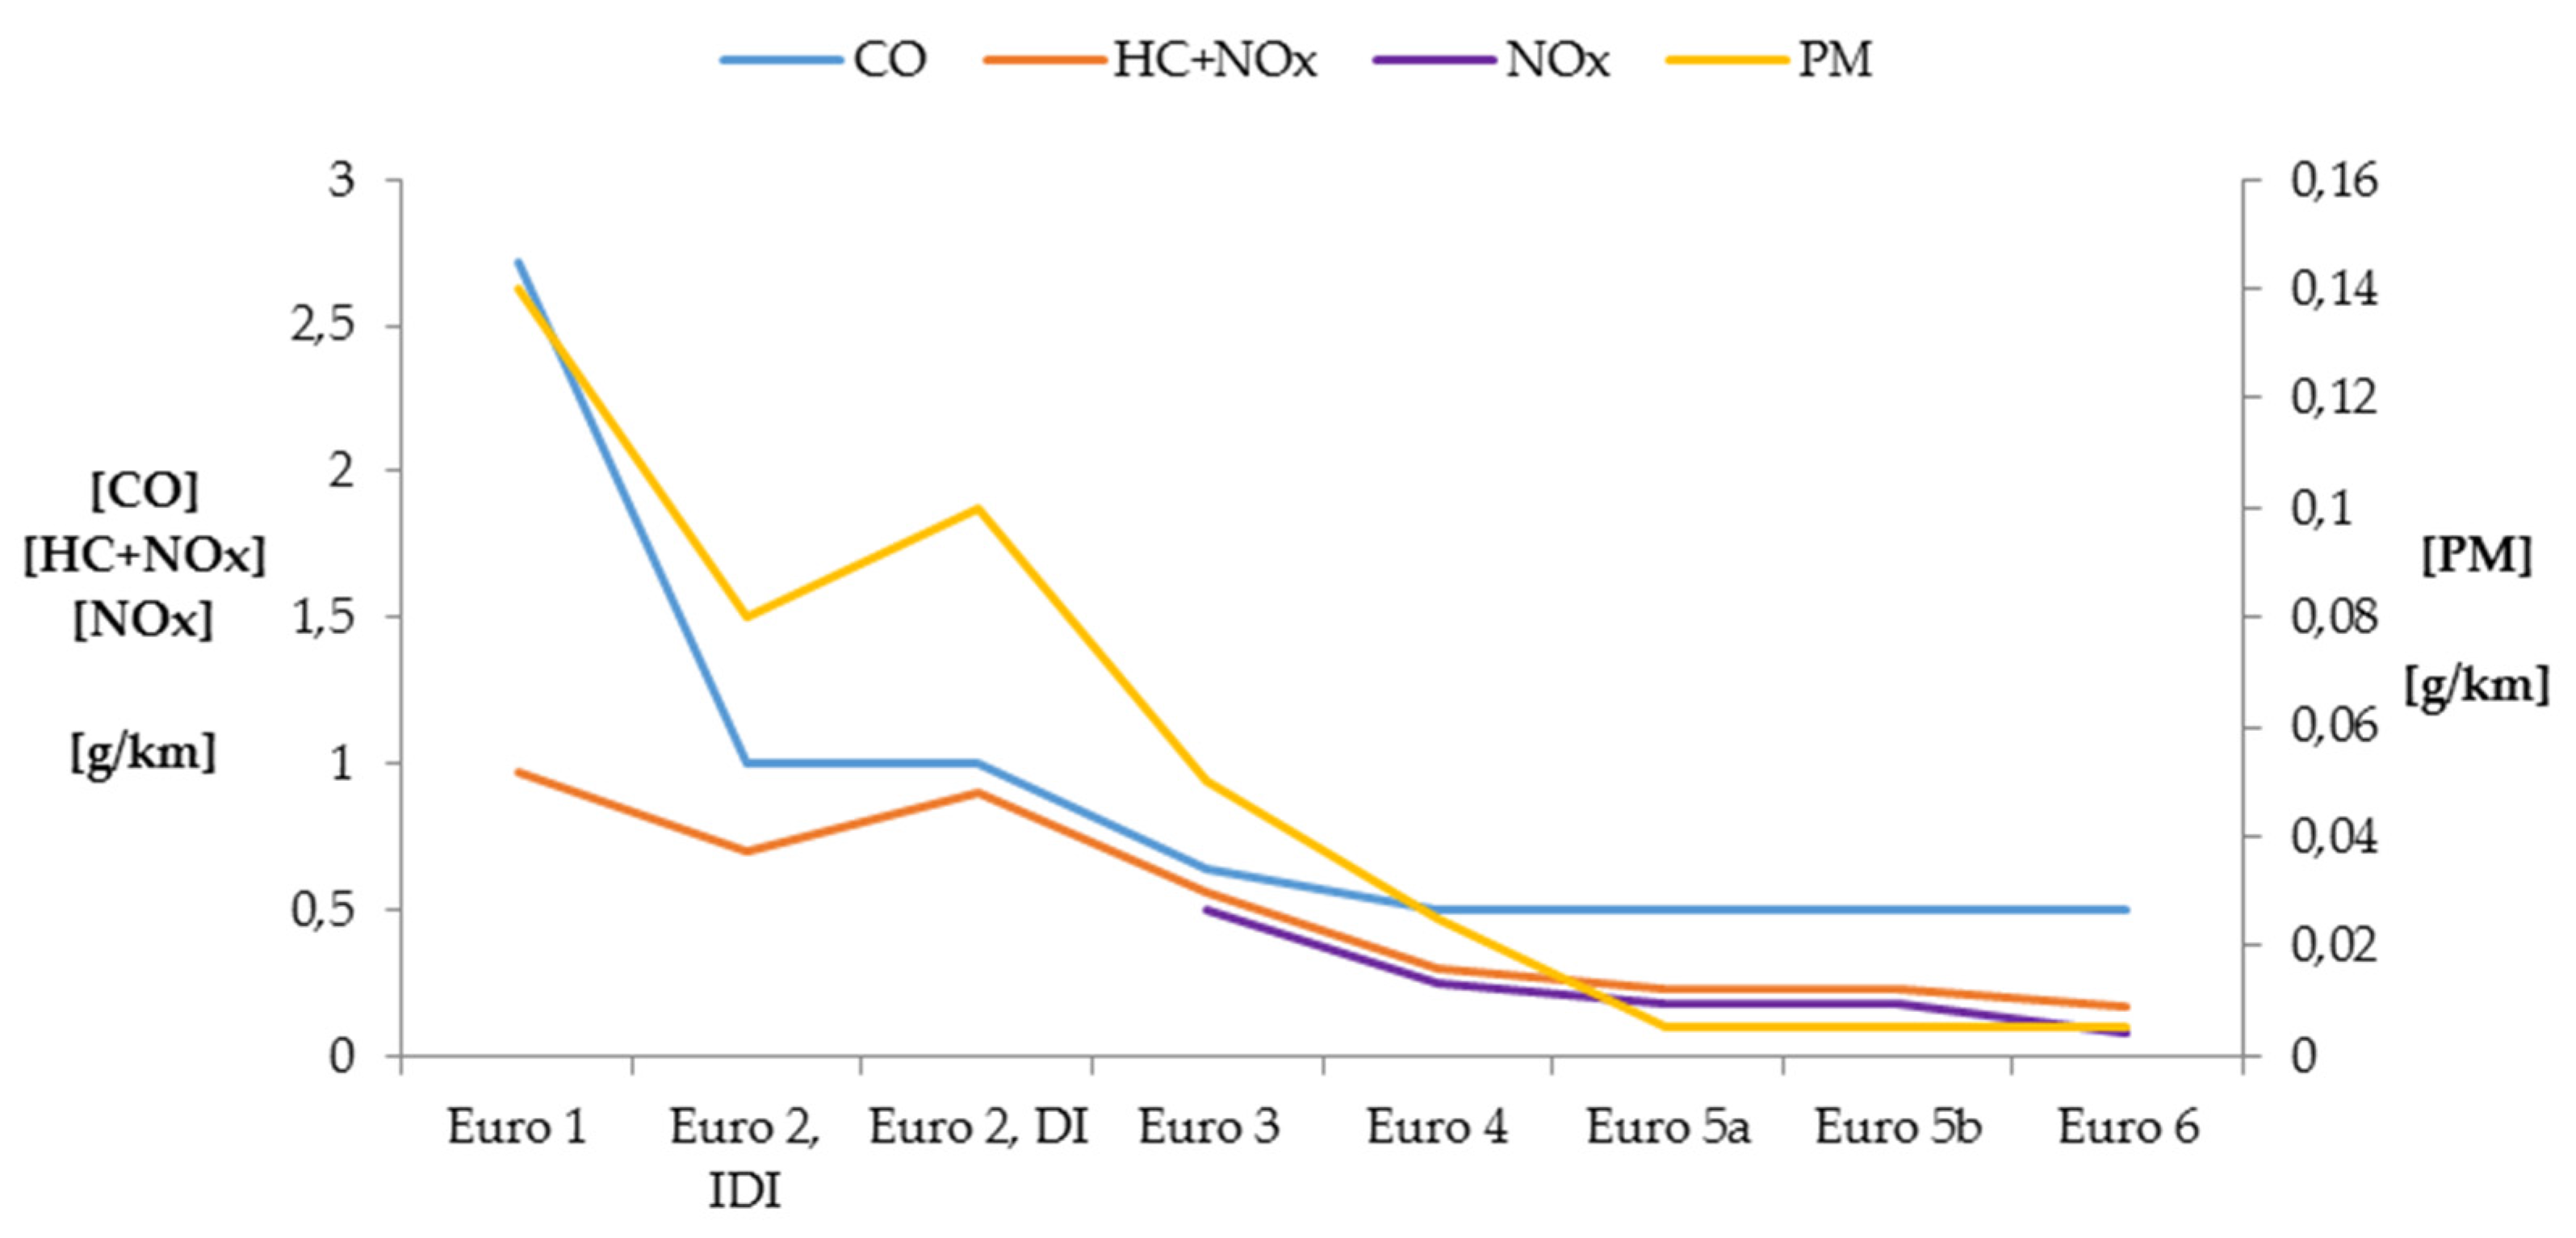
Figure 1 for diesel cars and Figure 2 for petrol cars. These emission factors (EF) were obtained over the New European Driving Cycle (NEDC) and are not always obtained in real traffic conditions.
Figure 1. The Euro emission standards for the regulated diesel car pollutants (based on [16]).
Energies 09 00084 g001
Figure 2. The Euro emission standards for the regulated pollutants for petrol passenger cars (based on [16]).
Energies 09 00084 g002
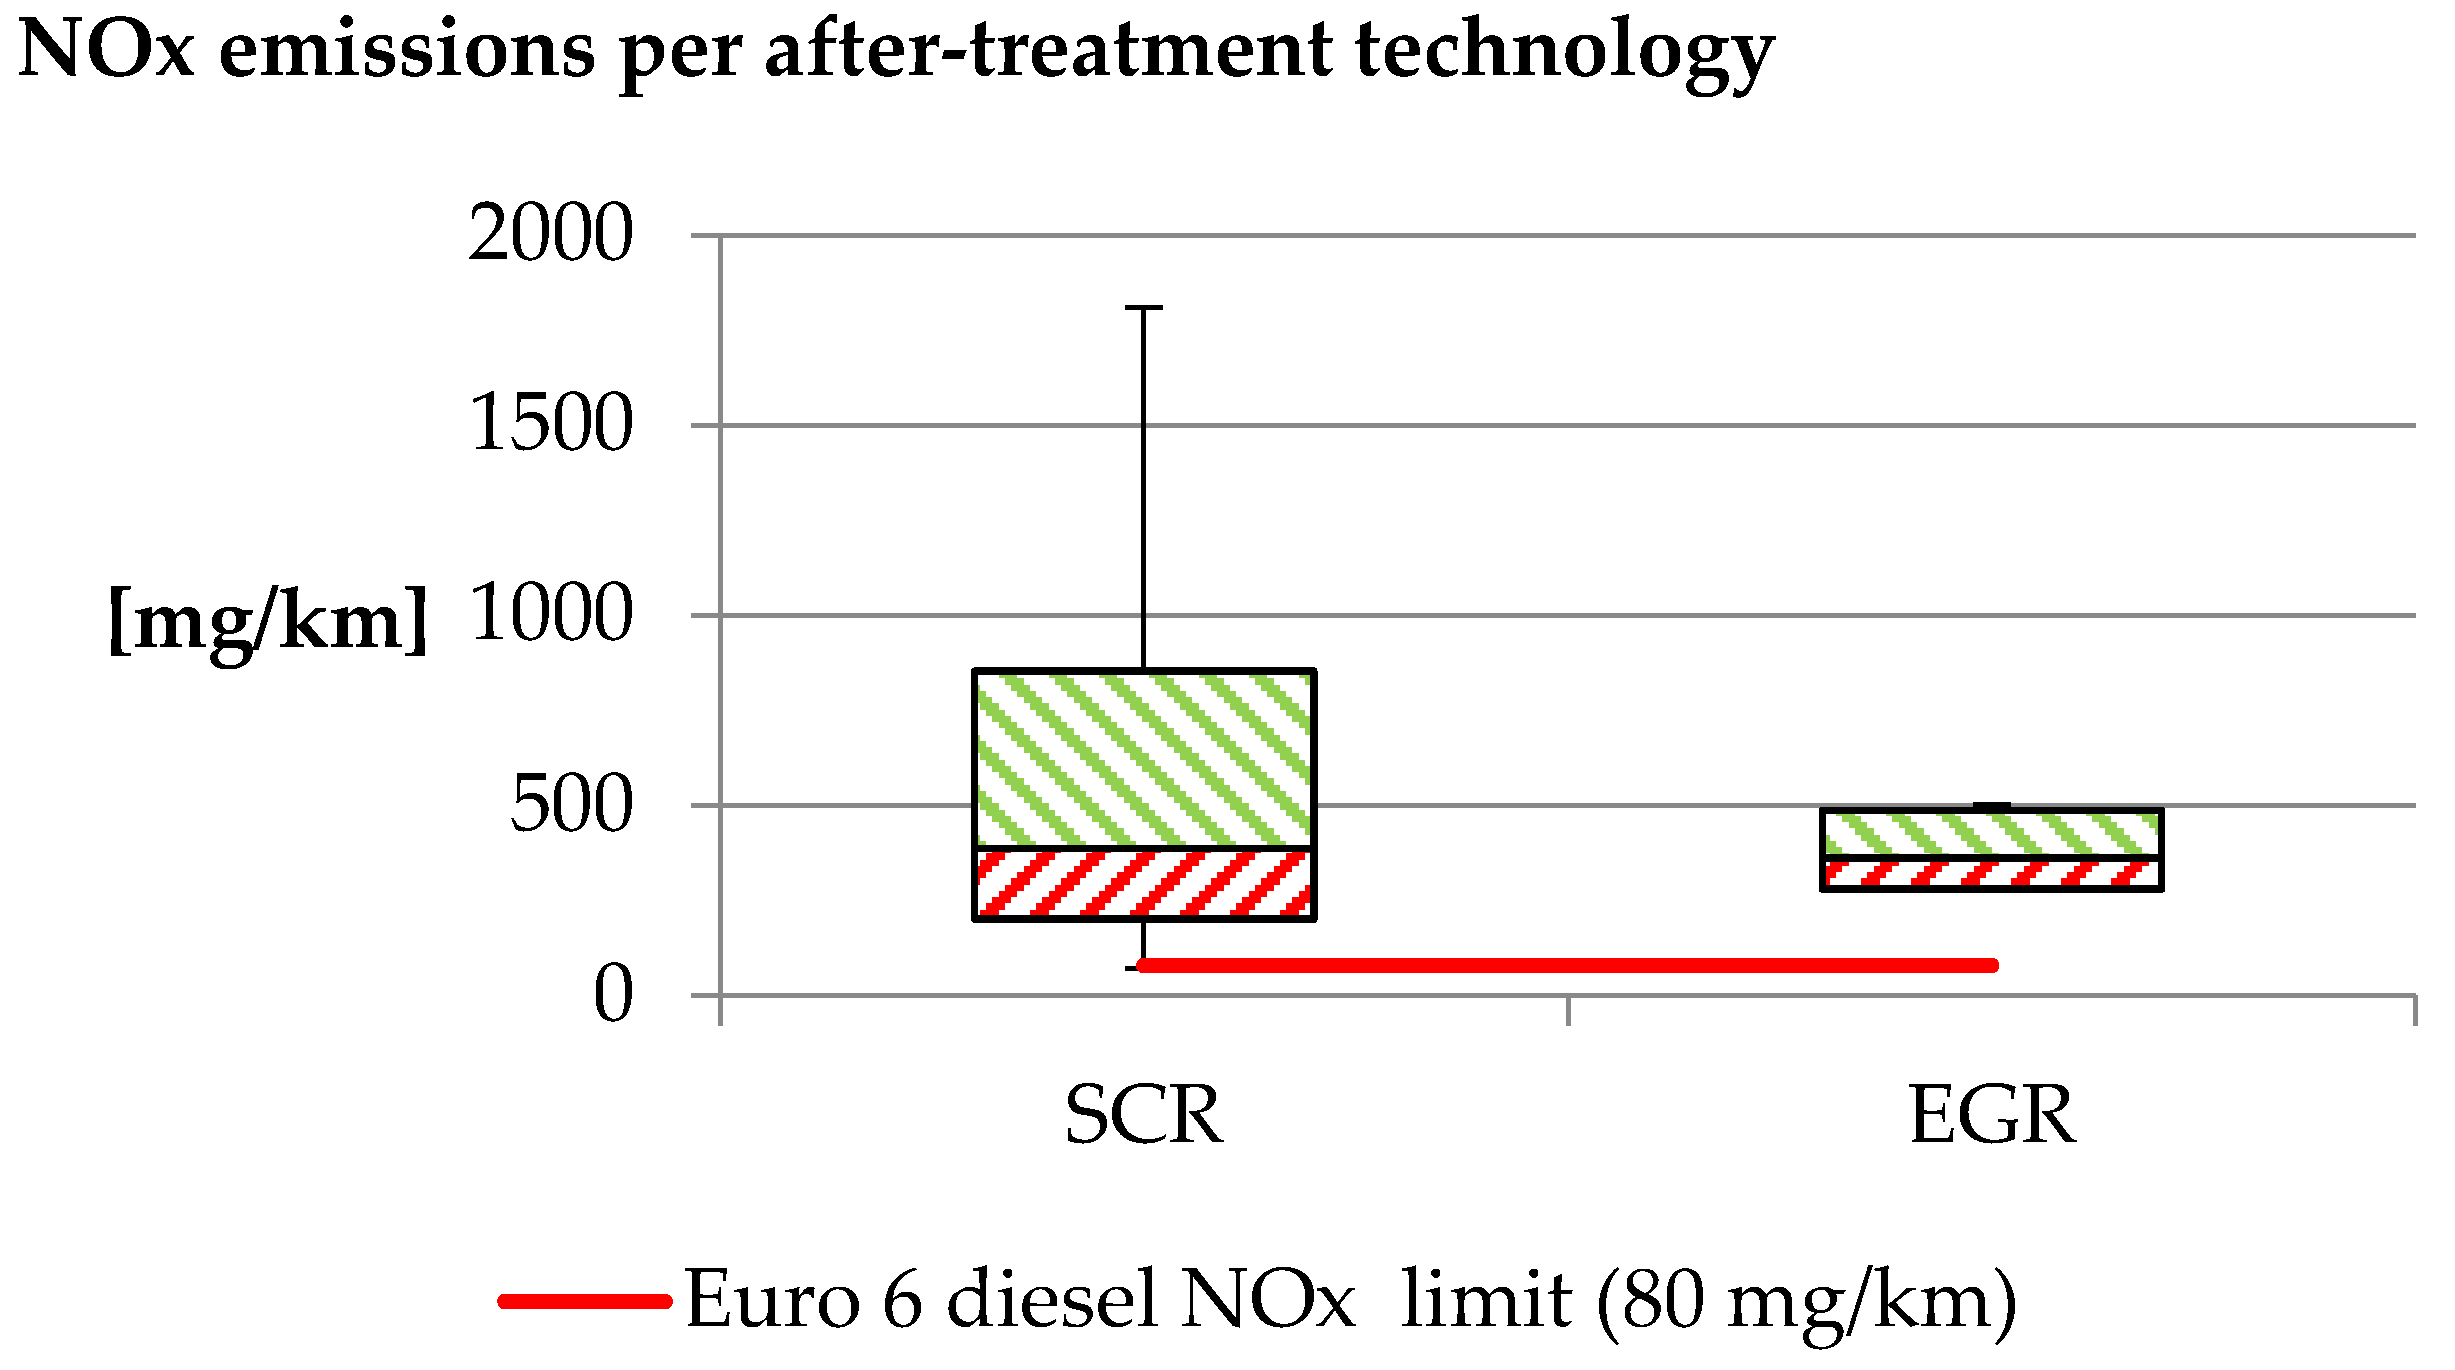
The European success story for diesel technology over the last decades can be explained by the strong influence of the automotive industry on the decision making process of the European Commission. As a result, fiscal measures strongly in favour for diesel caused a “dieselization boom” since the end 1990s, as diesel fuel prices have been systematically kept low compared to petrol fuel. Moreover, less stringent type-approval limits for pollutants such as NOx were in force for diesels, allowing them to emit up to three times more than petrol vehicles [17]. Pollutants as NOx and PM have historically been the Achilles heel for diesels. Concerning NOx, significant difficulties persist to date, as highly sophisticated and expensive technologies are required to reduce this pollutant to acceptable levels at the end of the exhaust pipe. For PM, the introduction of highly efficient diesel particulate filters (DPF) brought down exhaust PM levels to fractions of the engine-out levels. DPF efficiencies up to 99% for both PM and PN are nowadays achieved, resulting in compliance with type-approval limits.
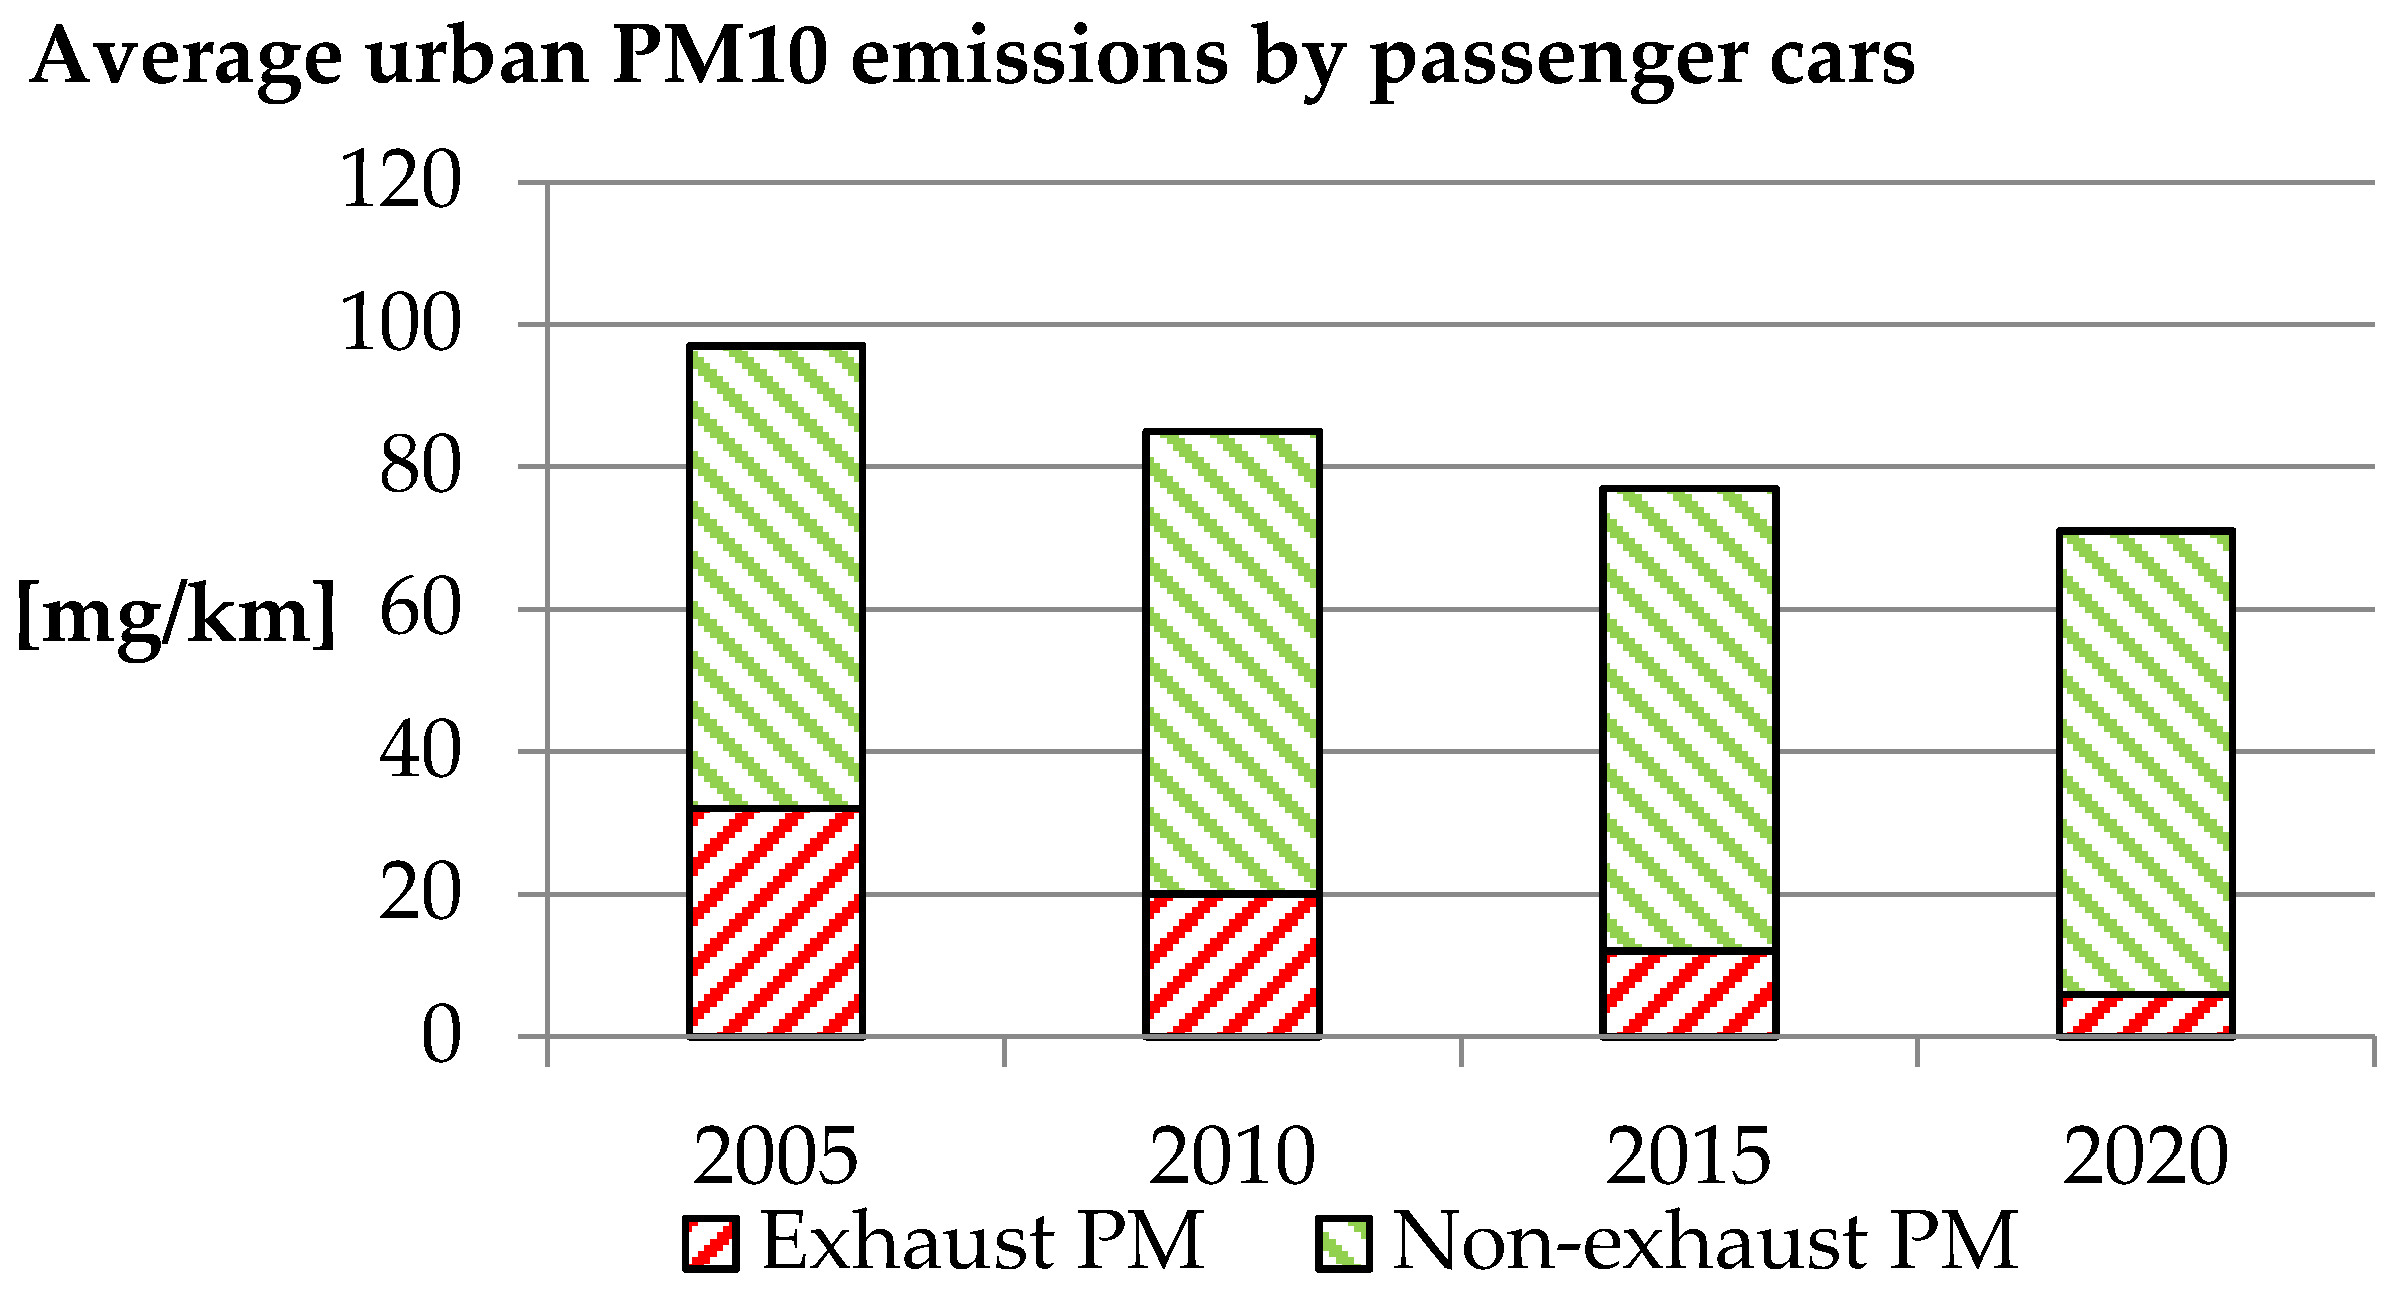
Despite all these measures, a significant source of PM remains unaddressed as no European Directives consider the contribution of passenger cars to non-exhaust PM. This typically originates from brake, tyre and road wear, as well as resuspension of road dust and can be categorised in both the PM10 and PM2.5 classes. Regardless of which drivetrain technology is used for passenger cars, it is assumed that every technology roughly contributes equally to the non-exhaust PM for a similar curb weight. As EVs tend to be heavier than conventional cars, their emissions can be higher. However, recent studies have proven that this is not the case, as they require about one third less braking, due to their use of regenerative braking. Hereby EVs’ total non-exhaust PM share, resulting from both brake, tyre and road wear, ends up being lower than for conventional cars [18,19].
A method is proposed to compare the air quality impact of different vehicle technologies on a larger scale than solely based on regulated emissions. Therefore, a shift from the Euro standards to real-world emissions of the regulated pollutants was made and the most important unregulated pollutants as well as non-exhaust related emissions are addressed. These are heavy trace metals, polycyclic aromatic hydrocarbons (PAH) and ammonia (NH3). CO2 emissions were included in the model as well. The targeted drivetrains are diesel, petrol and electricity-based. The knowledge gap that this paper aims to tackle is the multi-mode approach where an emission model is tailored to represent average urban passenger transport, alongside with an environmental impact assessment method. The combination of the two models is an enabler of accurate and up to date real world impacts.
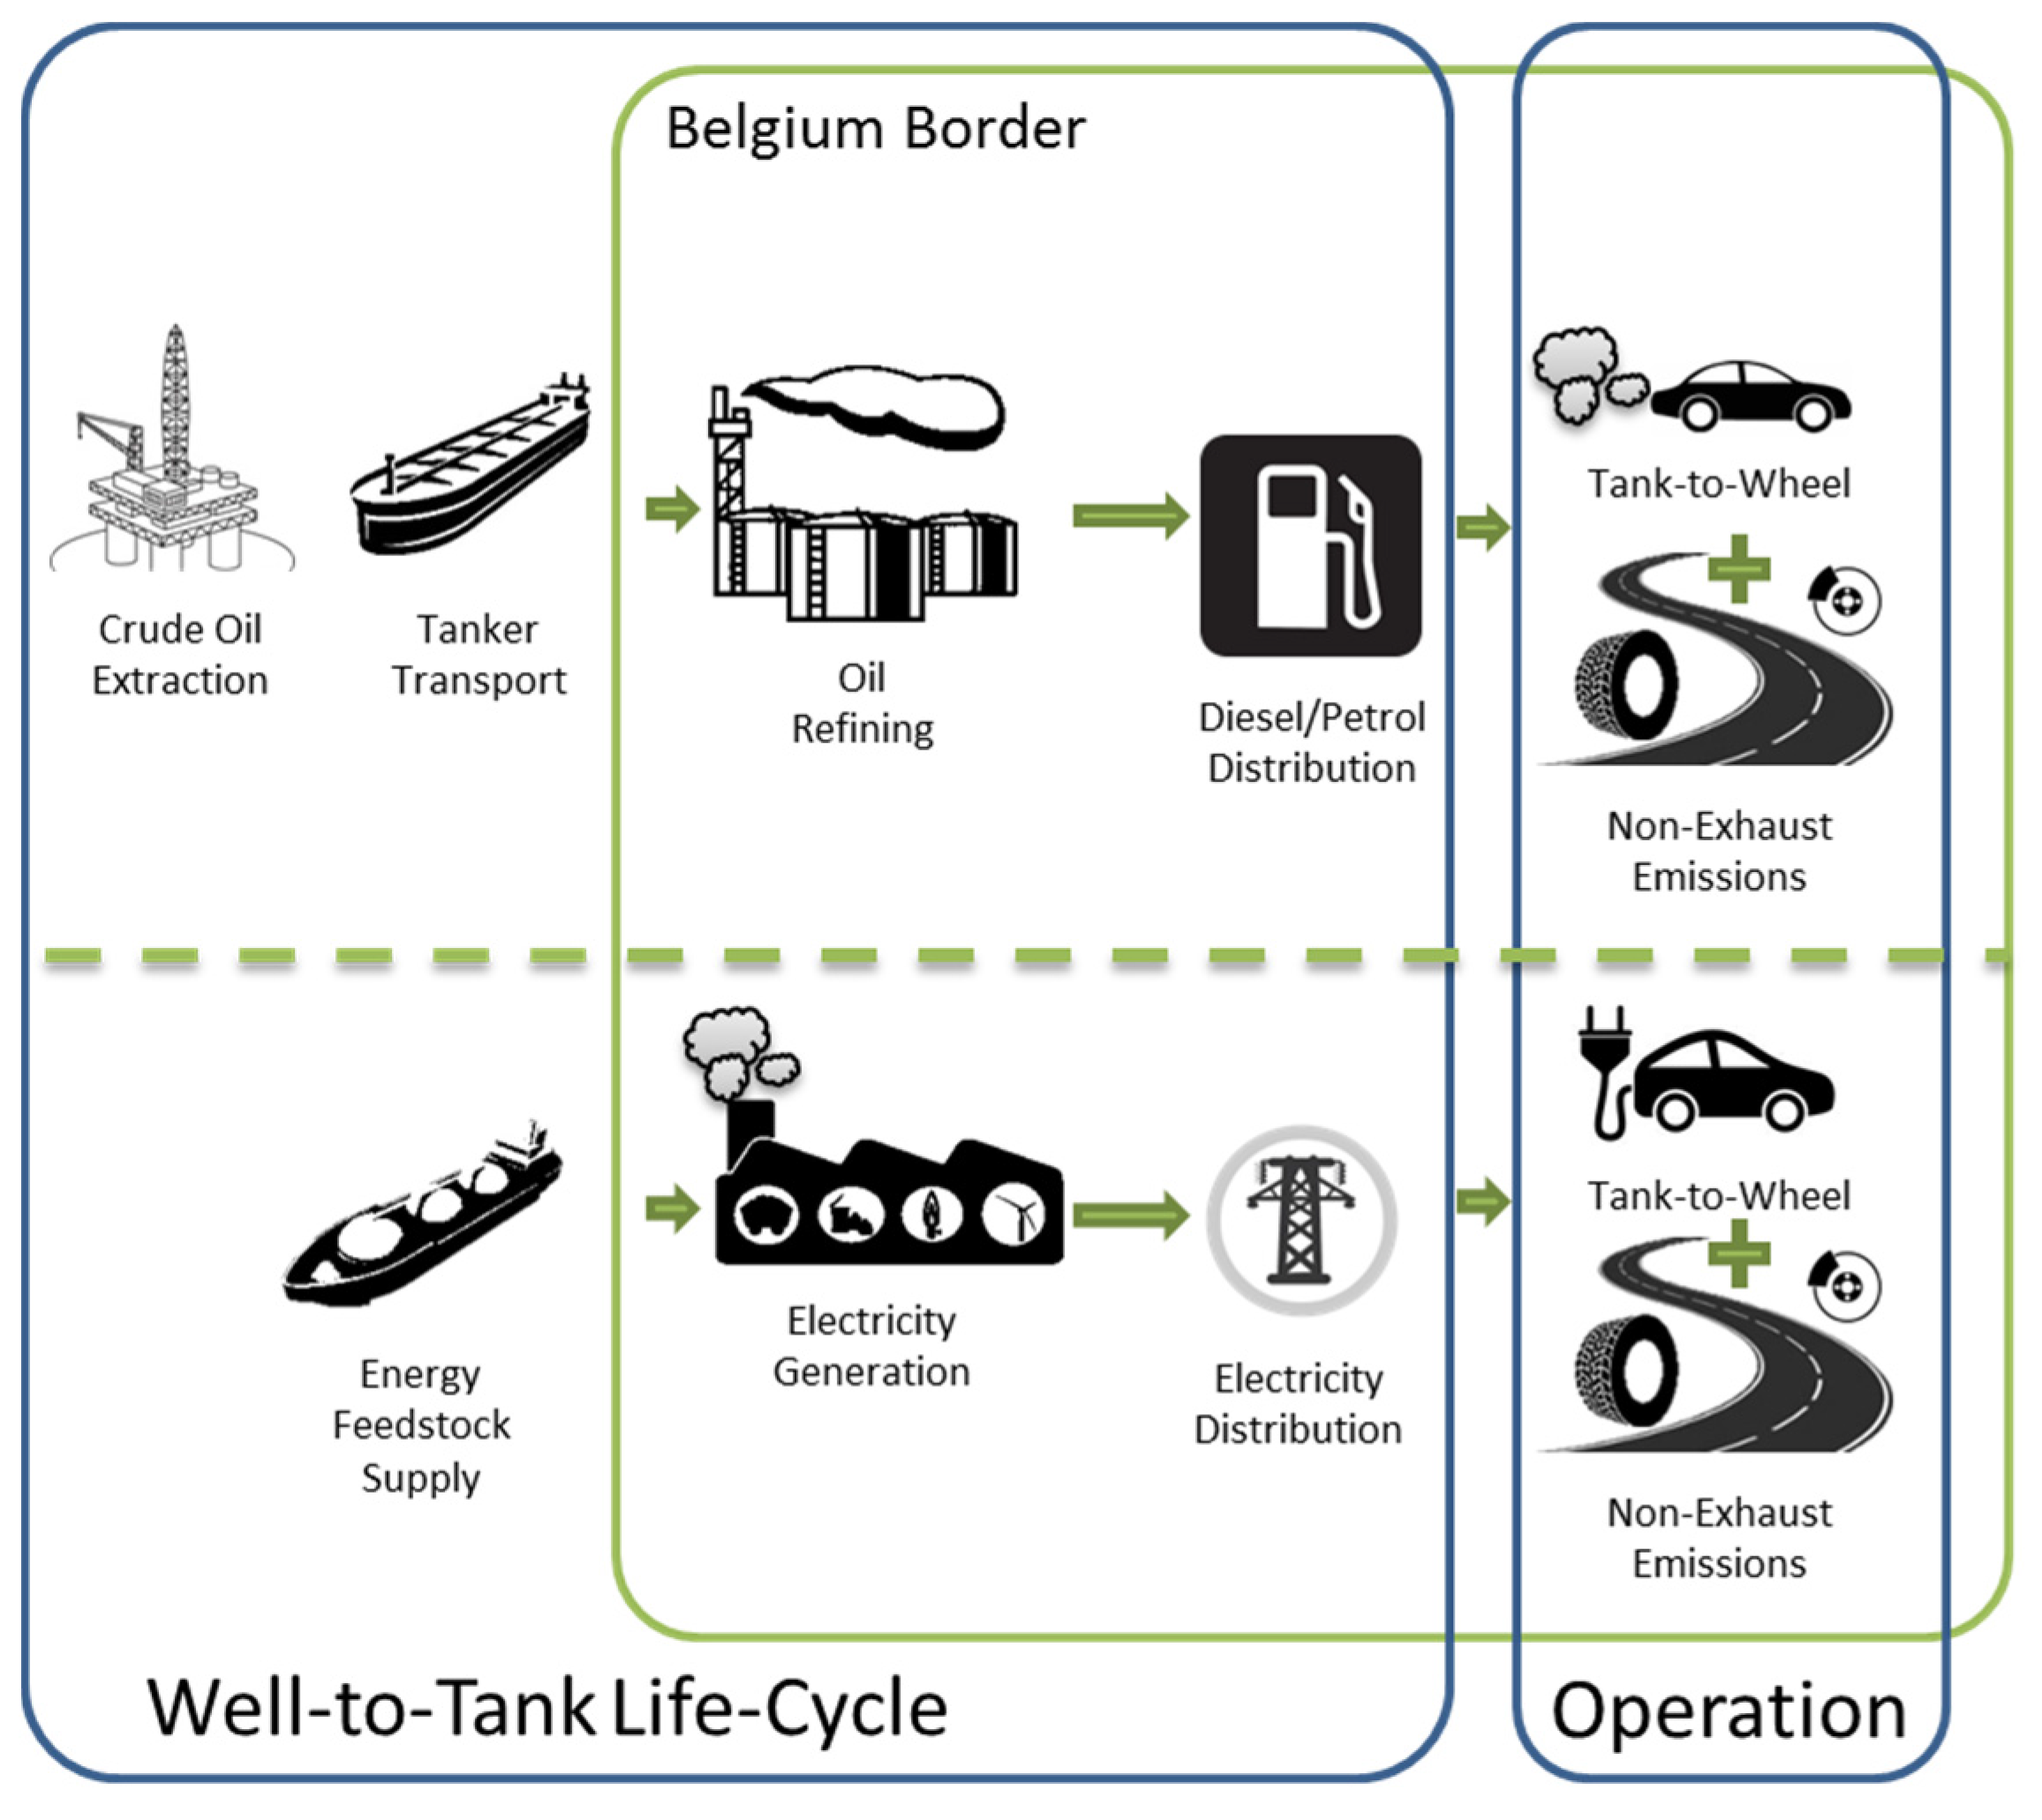
In this contribution, a method is proposed to assess the contribution of electric vehicles to urban air quality in Belgium, compared to conventional vehicles of the same weight class. Therefore, the effect on human toxicity (HT), photochemical ozone formation (POF) and particulate matter formation (PMF) was modelled. In addition, the disability adjusted life years (DALY) were simulated in order to assess the healthy years lost due to poor urban air quality. For this reason, the scope is not limited to the use phase of a vehicle, addressed in literature as the tank-to-wheel (TTW) phase. Instead, a negative well-to-wheel (WTW) as a partly life cycle analysis (LCA) was performed, within the Belgian borders. Therefore, the fuel refinery emission data from the Total refineries in Antwerp, as well as the Belgian electricity production mix from 2014 were used as input. Every other contribution in the life cycle of a vehicle except for these emissions created within the Belgian borders was excluded (e.g., mining abroad). The motivation is to have a clear view on which environmental impacts national policies can influence.

2. Regulated and Non-Regulated Emissions

2.1. Regulated Emissions

Since 1992, the tailpipe emissions of every new European vehicle model are tested according to a standardized type-approval procedure, i.e., the NEDC as described in Regulation No. 83 [20]. Due to the need for repeatability, narrow test boundaries have been determined, which also allow direct comparability between different vehicles [21]. Due to these boundaries however, the applied NEDC is criticized for its smooth speed variations and poor coverage of a modern engine’s operating range [22,23]. This has resulted in a historical mismatch between official NOx emission factors for diesel passenger cars and what is emitted during actual driving. In addition, CO2 emissions are increasingly underestimated by means of the NEDC, both for petrol and diesel cars. The International Council on Clean Transportation (ICCT) revealed that this CO2-gap between type-approval and real world fuel consumption increased from 8% in 2001 to 40% in 2014 [24]. From 2017 onwards, the Worldwide Harmonized Light Vehicle Test Procedure (WLTP) will replace the NEDC. Besides more realistic weight categorisation, ambient temperatures and road load testing, a new test cycle (the Worldwide Harmonized Light Vehicles Test Cycle or WLTC) is included which was conceived to represent realistic driving conditions and thus emissions [25,26]. Preliminary gaseous emission test results over the WLTC of 21 modern passenger cars are presented in [27], where slight average differences concerning CO2 between both cycles (almost 10%) are reported, while diesel NOx and petrol CO emissions were significantly higher during the WLTC’s high engine loads.
Diesel cars have a significant impact on the European air quality issue. In the case for Belgium, a total mileage of 83.3 billion kilometres travelled by passenger cars was registered for 2013, of which 78.5% corresponded to diesel cars [28]. European vehicle usage statistics show that for Belgium the highest average mileage per capita as well as the highest average annual mileage was registered, with 7546 and 15,284 km, respectively [28]. The persisting air quality issue in Flanders and the Brussels Region, of which the cities of Antwerp and Brussels are the most congested ones in Europe, requires measures concerning the composition of future passenger car fleets. The market share of diesel vehicles is an important factor in this air quality issue regarding regulated pollutants. Whereas the mature three-way catalyst (TWC) technology for conventional petrol vehicles and diesel oxidation catalysts (DOC) for diesel vehicles guarantee conversions ranging from 90% to 99% in real-world conditions [29], significant difficulties are reported for effectively reducing NOx from diesel combustion under all engine operations.
Concerning PM, CO and NMHC emissions from diesel technology however, successful reductions have taken place over the various Euro standards [30,31]. Nevertheless a direct injection (DI) combustion process does inherently create high levels of PM and PN. These have been successfully reduced to fractions as well, by means of the introduction of the diesel particulate filter (DPF), since Euro 5 certification onwards [32]. Also for the DI petrol vehicles, which already represented 30% of the 2013 petrol fleet and are expected to largely replace the conventional port-fuel injection (PFI) petrol fleet by 2020 [14]. Particulate filters are expected to become mandatory by 2017 with the introduction of the Euro 6c PN limit of 6 × 10¹¹ particles per kilometre [33,34].
Atmospheric reactions will also add to the formation of secondary PM. For this reason, the emissions of NOx as well as of NMHC and ammonia (NH3) are of particular importance, as these pollutants are also known as secondary PM precursors [35]. In addition, the fuel sulphur content also acts as a precursor, for which it is assumed that all present sulphur in the fuel is oxidized to sulphates (SO42−), which will partially end up as particles. The share of SO42− is small however, as nowadays the European reference fuels have a maximum sulphur content of 10 parts per million (ppm). The shares of the PM-precursors that eventually end up as secondary PM and which were applied in this study, result from the ReCiPe methodology [36,37], as will be discussed further on in this paper.
Real-world testing by means of a Portable Emissions Measurement System (PEMS) has become increasingly important as it provides complete emission profiles for the real usage of an engine. In addition, PEMS testing will become an important part of the validation stage for emission factors from Euro 6c models onwards [38]. By doing so, extra not-to-exceed limits (NTE) will be determined by means of conformity factors (CF) and will be implemented for on-road testing, next to the chassis dynamometer testing over the WLTC. The implementation of these limits is planned in addition to the introduction of the WLTP in 2017, and will be performed for determining the on-road emissions of the regulated, gaseous and particulate emissions [39].
For the comparison between drivetrain technologies performed in this paper, real driving emissions were taken into account instead of the official type-approval data given in the Euro emission standards. A rational for this approach is found in [40], as it revealed that for diesel vehicles little or no improvements were noticed for the emissions of NOx from Euro 3 to 5 technology. Preliminary testing of a Euro 6 certified diesel passenger car in 2012 [41] showed a significant reduction of NOx emissions, despite the fact that the type-approval limit of 80 mg·km−1 was still exceeded. More recent research on this topic was performed by the ICCT in 2014 [21], representing the most extensive PEMS campaign on Euro 6 diesel cars to date. This study revealed that on average the Euro 6 diesel fleet emits seven times the NOx emission limit. Moreover, the study showed that NOx emissions varied largely between manufacturers, while there were also significant differences reported depending on the applied exhaust after-treatment system. The most recently published test results from Netherlands Organisation for Applied Scientific Research (TNO) present a 2015 follow-up study [42] of tests performed in 2013 [43]. These results are also in line with [21], stating that for CO as well as THC and PM the Euro 6 diesel vehicles perform desirably (i.e., well below the limit), while NOx remains a major issue. The difference between the ICCT and TNO studies was mainly that TNO had a wider variety of Euro 6 vehicles at its disposal, while the ICCT study tested mainly high-end vehicles, equipped with a selective catalytic reduction (SCR) system for converting NOx.
Figure 3 shows the large variabilities for the different test vehicles for urban, rural and highway trips, as they are presented by TNO. Of interest to the topic of this paper are the NOx emissions under urban conditions, ranging from approx. 130 to 650 mg·km−1 [42]. Figure 4 on the other hand plots the NOx averages in mg·km−1 for the vehicles tested by the ICCT. Notice from both Figure 3 and Figure 4 that certain vehicle models do comply with the regulations under real-world situations (i.e., tested on road by means of PEMS). This implies that compliance with the NOx regulation is feasible today.
Figure 3. On-road NOx emission boxplot results for Euro 6 diesel passenger cars according to speed category (based on [42]). Important for this article are the NOx emissions at urban speeds, which range from 130 to 650 mg·km−1, despite the type-approval limit of 80 mg·km−1 for Euro 6 diesel cars.
Energies 09 00084 g003
Figure 4. PEMS test results for fifteen Euro 6 diesel passenger cars according to after-treatment technology (based on [21]). Notice the huge range for the SCR emissions, for which a maximum of 1809 mg·km−1 was reported. For Euro 6 diesel cars only equipped with exhaust gas recirculation (EGR), the NOx emissions were less spread, but still many times higher than the 80 mg·km−1 limit.
Energies 09 00084 g004

2.2. Unregulated Pollutants

Although vehicles are currently only being tested for compliance with five regulated pollutants (PN included), internal combustion engines (ICE) emit many times more hazardous and even carcinogenic substances which are not addressed in regulations, for example benzene, aldehydes, 1,3-butadiene, metals and a large number of polycyclic organic matters (under which polycyclic aromatic hydrocarbons (PAH) are categorised). The United States’ Environmental Protection Agency (US EPA) has listed sixteen out of over five hundred PAHs to be monitored in the ambient air, of which the International Agency for Research on Cancer (IARC) has targeted seven possible or probable human carcinogens. Benzo(a)pyrene (B(a)P) serves as the traditional marker for PAH exposure, as the total exposure is given as B(a)P toxic equivalency concentrations [44,45].
Table 1 shows the IARC’s estimated average contributions of transport to air pollution in developed countries [46]. The increased contribution of air toxics in urban regions is due to so-called “urban canyoning” in crowded business districts, where mobile sources contribute two to ten times as much as in general background locations.
Table 1. The estimated contribution of motor vehicle emissions to ambient levels of air pollutants in developed countries (based on [46]).
PollutantContribution
Carbon monoxide (CO)~90%
PM2.5~25%–30%
Nitrogen oxides (NOx)~40%
Volatile organic compounds (VOC)~35%
Average air toxics 1~21%
Urban air toxics~42%
1: Air toxics including aldehydes, benzene, 1,3-butadiene, polycyclic aromatic hydrocarbons (PAH) and metals.

Non-Exhaust Emissions

Besides tailpipe emissions, so-called “non-exhaust” emissions due to abrasion of brakes, tyres and road surface can be differentiated, which typically can be categorized as particulate matter species with complex compositions. When comparing internal combustion engine vehicles, either diesel or petrol, non-exhaust emissions account almost equally as exhaust PM emissions by mass amounts [47]. Compared to the uniform type-approval tests for PM as a regulated exhaust gas pollutant, there is no standardization for the measurement of the non-exhaust related counterpart. For this reason, the impact of non-exhaust PM is assumed to become dominant in the short-term, as exhaust PM has been successfully reduced to a fraction of what was to be measured before the introduction of the DPF [48,49].
Concerning the influence of both exhausted and non-exhaust related PM, a forecast up to 2020 is given in Figure 5. The ratios for urban exhaust to non-exhaust PM diminish as one moves to the right of the graph. The reason for this is that the fleet turns over and the oldest (non-DPF) diesels get replaced. The growing dominance of non-exhaust PM is highlighted in this graph, as despite ongoing restrictions for the exhaust PM, a business-as-usual approach for non-exhaust PM will not allow to obtain significant reductions of the total traffic-related PM emission. As mentioned earlier, almost all exhausted PM can be found in the PM2.5 range, while for this paper this share is assumed to be 100%. Coarse particles (PM2.5–PM10) on the other hand, originate from non-exhaust sources such as brake, tyre and road surface wear.
Figure 5. Forecasts for the emission factors of PM10, both exhaust and non-exhaust related, up to 2020 (based on [48]).
Energies 09 00084 g005
The most common chemical constituents found in PM10 from tyre and brake wear are listed in Table 2. These are mostly heavy metals which are often used as tracers for determining the amount of brake wear in PM. The reason for this is that brake wear is a major source for some metals, while tyre wear contributes the least of the non-exhaust sources [50]. An important source of non-exhaust PM, which is not addressed in this paper, is resuspended road dust. The reason for its exclusion is that it is difficult to quantify and is submissive to many external factors such as season, precipitation and road moisture content. For the same reason the resuspension part is not dealt with in emission inventory reporting in the framework of the Convention on Long-Range Transboundary Air Pollution (CLRTAP), although it dominates PM emissions in some countries [50].
Table 2. Dominant chemical, coarse and fine constituents of PM10, occurring as oxides from the trace metals presented (based on [47]).
ComponentPM2.5PM2.5–PM10
Brake AbrasionCu, Fe, Sb(III), Sb(V), Sn, Ba, Zr, Al, S, organic carbonFe, Cu, Sb(III), Sb(V), Sn, Ba, Ze, Al
Tyre AbrasionZn, organic Zn, Cu, S, Si, organic carbonZn, organic Zn, Cu, Si, Mn
Typically, brake wear particles account for 16%–55% by mass of the generated PM10 emissions by passenger cars in urban environments and normally represents a unimodal size distribution of PM10 with peaks varying from 2 to 6 μm. Typical emission factors of 2.0–8.8 mg·km−1 are reported for brake wear in literature [47].
Contributions by tyre wear, on the other hand, are reported to be approximately 5%–30% by mass and shows bimodal size distribution with peaks in both the PM2.5 and PM2.5–PM10 ranges [47]. The PM10 emission factors for tyre wear range from 3.5–9.0 mg·km−1. For both sources, the available literature reports overall non-exhaust amounts around 6–7 mg·km−1 [47]. This average is in fact very close to the 5 mg·km−1 exhaust PM limit for Euro 5 and 6 passenger cars. On motorways, the contribution by brake wear is significantly lower, i.e., about 3% by mass, as the braking frequency is much smaller.
Regarding EVs, no tank-to-wheel emissions are present. Non-exhaust emissions however, are independent from powertrain choice. In EVs equipped with brake energy regeneration systems, the wear of brake pads can be reduced up to 66% [18,19]. This factor compensates for the increased average vehicle weight due the mass of the battery pack and its auxiliary systems (e.g., management systems, bus bars and power electronics).

2.3. Health impact of PM

Diesel exhaust gasses, and thus also exhaust PM, are deemed carcinogenic by the WHO’s IARC [51]. No such conclusions have been made for the non-exhausted share of traffic-related PM, although it contributes as much and often more than tailpipe exhaust to the ambient air PM concentrations in cities [50]. Regarding the health impact of PM, the most relevant properties of the particles are (1) the size distribution; (2) the surface area; (3) the chemical composition; and (4) the agglomeration state. Only a few toxicological studies have been performed to date in the area of non-exhaust PM emissions, although their outcome correlates significant well, namely that also the non-exhausted PM part is hazardous to human health. Concerning the aerodynamic diameter of particles, it is known from medical literature [52] that the smaller particles are, the easier they can bypass the natural barriers in the human body and eventually reach into the bloodstream. The potential danger of the smallest particles lies in their composition, as by means of the bloodstream all organs become potential targets for inflammation and damages to cell structures. The most common way for the particles to enter the human body is by means of inhalation and exposure to skin contact. Although less common, in the case of contact with particles that are smaller in size than a skin cell, penetration of the cell membrane is possible and causes localized damage [53,54,55,56]. As exposure to poor air quality in urbanized regions with dense traffic is practically constant, it contributes significantly to an increased risk for premature death for the inhabitants. This is emphasized by the European Environment Agency (EEA), which states that concerning certain pollutants (PM, BaP and O3), over 95% of the city dwellers breathes air that is considered harmful to health by the WHO [53].

3. Data Collection

3.1. Exhaust Emissions

A thorough comparison between conventional technologies (i.e., petrol and diesel) and electric vehicles requires the inclusion of both real-world regulated and non-regulated pollutants. In order to obtain these data, the real-world test data available in literature were compared with the emission factors (EF) which are used for emission inventory reporting tools such as COPERT (COmputer Programme to calculate Emissions from Road Transport) and the HandBook for Emission Factors (HBEFA) [54,55]. At the time of the latest update of COPERT, little data were available for Euro 6 diesel vehicles. This is why the results of PEMS campaigns as well as dynamometer results from more realistic driving cycles such as the Common Artemis Driving Cycle (CADC) and WLTC are included for this article.
PEMS data on one hand show the real emission profile of an engine, while on the other hand, each PEMS test performed is unique and hence allows no repeatability due to uncontrollable ambient factors such as the ambient temperature, the surrounding traffic and others. For the comparison made for this article, PEMS data from publications by the ICCT, the Association for Emissions Control by Catalysts (AECC) and TNO are consulted for the input for Euro 6 diesel cars. The main finding of these different studies is that for both the more representative driving cycles as in reality (i.e., on road), NOx emissions are many times higher than what is indicated by means of the NEDC. The aforementioned studies present NOx emissions ranging from six to seven times the 80 mg·km−1 limit. The applied EFs for further modelling in this paper can be found in Table 3 and Table 4, accompanied by the type approval (TA) limits for Euro 4, 5 and 6, respectively.
Table 3. Overview of the type approval (TA) values and applied real driving emission (RDE) values for the regulated pollutants for petrol cars. Notice an increased NOx and PM emission for the Euro 6 petrol cars due to the increased implementation of direct injection technology (based upon [21,39,43,54,55,56,57]).
PetrolTA and RDE Values
NormNMHCNOxPMCO
(mg·km−1)TARDETARDETARDETARDE
Euro 410011.59075.3-1.51000500
Euro 51008.24040.752.21000500
Euro 61007.35048.252.41000400
Table 4. Overview of the type approval (TA) values and applied real driving emission (RDE) values for the regulated pollutants for diesel cars (based upon [21,39,43,54,55,56,57]).
DieselTA and RDE Values
NormNMHCNOxPMCO
(mg·km−1)TARDETARDETARDETARDE
Euro 45013.82508502550500202
Euro 55011.418082052.850072
Euro 65011.48056851.150071
Concerning the non-regulated exhaust emissions, little or no real-world data are available. For this reason both the EMEP/EEA Emission Inventory Guidebook [54] as the UK Informative Inventory Report [57] were consulted. These sources differentiate non-regulated emissions per fuel type and per Euro emission standard for passenger cars, although Euro 6 emission factors were not always available. Further gaps in literature were filled with the values found in ReCiPe [36]. It is emphasized that PM is formed secondarily as well, which explains why NH3 and SO42− are added to Table 5, next to NMHC already mentioned in Table 3 and Table 4. Carbon dioxide was added to the input as well, for which data are calculated using the reported discrepancies between type-approval [58] and real-world from literature [59].
Table 5. The emission factors (EF) used for modelling the impact of non-regulated pollutants for petrol and diesel vehicles from Euro 4 to 6 (based upon [36,54,57,58,59]). Carbon dioxide is added to the model input, although it is not considered a pollutant. n.a.: non-available.
Pollutant SpeciesPetrol (mg·km−1)Diesel (mg·km−1)
Euro 4Euro 5Euro 6Euro 4Euro 5Euro 6
NH31.724.274.271.001.907.00
SO42−1.120.980.981.431.271.27
B(a)P1.30 × 10−41.30 × 10−41.30 × 10-41.89 × 10−41.34 × 10−41.34 × 10⁻⁴
Indeno(…)pyrene3.90 × 10−448.0048.001.62 × 10−41.62 × 10−31.62 × 10−3
B(k)F2.60 × 10−448.0048.001.53 × 10−41.53 × 10−31.53 × 10−3
B(b)F3.60 × 10−448.0048.001.95 × 10−41.95 × 10−31.95 × 10−3
N2O1.33 × 10−31.09 × 10−31.02 × 10−35.61 × 10−34.88 × 10−34.60 × 10⁻³
CH45.50 × 10−34.49 × 10−34.21 × 10−32.73 × 10−32.38 × 10−32.24 × 10⁻³
Benzene8.89 × 10−37.26 × 10−36.81 × 10−31.33 × 10−31.16 × 10−31.09 × 10⁻³
Toluene7.68 × 10−36.27 × 10−45.88 × 10−33.64 × 10−43.17 × 10−42.99 × 10⁻³
Xylene7.68 × 10−36.27 × 10−45.88 × 10−39.11 × 10−47.90 × 10−47.47 × 10⁻³
PAH4.00 × 10−103.26 × 10−73.06 × 10−7n.a.n.a.n.a.
CO2 (g·km−1)185.6167.5151.2176.0168.3160.8

3.2. Non-Exhaust Emissions

After analysing several literature studies on emission factors for non-exhaust emissions, it was found that the data collection process was too widespread and did not provide overall reliable outputs [47]. Some studies used road side collection points, other in rural environments, and some other studies measured particle deposits while others measured weight loss in brake pads and tyres. The inventory is listed in Table 6. Some studies were old and not deemed reliable due to their outdated methods and technology used.
Table 6. Studies tackling abrasion-related particles in a non-exhaust context.
PM OriginAuthorsYearEmission Factor (mg·km−1/vehicle)Study TypeReference
Tyre AbrasionPanko et al.20132.4On-road[60]
Sjodin et al.20103.8Road Simulation[61]
NAEI20127Emissions Inventory[62]
Kupianen et al.20059Road Simulation[63]
Hueglin and Gehrig200013Receptor modelling[64]
Brake AbrasionUS-EPA19957.9Emissions Inventory[65]
Barlow et al.20074.0–8.0Emissions Inventory[66]
Bukowiecki et al.20098Receptor modelling[67]
NAEI20127Emissions Inventory[62]
Garg et al.20002.9–7.5Brake Dynamometer[68]
Resuspension ParticlesHueglin and Gehrig200092LDV-HDV[64]
Bukowiecki et al.200265LDV-HDV[69]
Bukowiecki et al.200933.5LDV-HDV[67]
LDV-HDV: Light Duty Vehicles-Heavy Duty Vehicles.
As a final consensus, it was decided to use the German Informative Inventory Report’s (GIIR) data for 2015 [70]. The GIIR follows European guidelines for the acquisition and reporting of emission inventories to the European Environment Agency under the annual data reporting obligation towards the CLRTAP/EMEP framework. This inventory proved to be the most complete in terms of number of elements tracked and data collection methods. The inventory can be seen in Table 7 below.
Table 7. Non-exhaust emission inventory [70].
Species CategoryMaterialTyre WearBrake WearRoad Abrasion
Particulate Matter
(mg·km−1)
PM2.54.492.934.05
PM106.47.357.5
Total Suspended Particles10.77.515
Priority Heavy Metals (HM)
(μg·km−1)
Pb1.311200.062
Hg0.00200
Cd0.180.150.003
Other HM
(μg·km−1)
As0.140.130.039
Cr0.161.821.08
Cu0.251,5880.037
Ni0.163.360.57
Se1.80.280
Zn1,0355121.29
Persistent Organic Pollutants (POPs)
(μg·km−1)
B(a)P0.03n.a.n.a.
B(b)F0.04n.a.n.a.
B(k)FIEn.a.n.a.
I[..]P0.02n.a.n.a.
∑PAHs 1–40.09n.a.n.a.
As electric vehicles have different characteristics than conventional ICE vehicles, it was decided to adjust the brake wear and tyre wear ratios. Electric vehicles are penalised by 10% in tyre wear (due to increased weight of vehicle together with EV specific tyres) and benefited by 66% (less) on brake pad wear (see Table 8) [65,71]. An analysis on the service times of brake pads on Teslas, BMW i3s and Nissan Leafs demonstrates that on average, the brake pads last roughly two thirds longer than on diesel/petrol vehicles. Although EVs generally have a higher mass, the presence of regenerative braking systems outweighs the mass penalty. Road wear is not specifically penalized as pavement quality is the more determining factor than vehicle weight and tyre characteristics.
Table 8. Abrasion Coefficients EV and ICE (ICE as reference).
Abrasion TypeEVICE
Brake wear3/51
Tyre Wear11/101
Road Wear11

3.3. Fuel Refining Emissions

The associated refinery airborne emissions for the fuel production were sourced from Ecoinvent 2.2 [72]. The same cut-off to represent pollutants emitted only within the Belgian borders was applied by removing the product feedstock from the model. The fuel amounts were calculated according to the CO2 levels using stoichiometric ratios. The waste vapours and pumping/fuelling losses are accounted. The refining emission inventory can be seen in Table 9. Airborne emissions related to electricity generation within the same boundaries are included [73]. Due to the extensive list of pollutants (more than 264) only some are displayed (most common). All the pollutant amounts are per one kilometre.
Table 9. Fuel refinery and electricity production related emissions. NMVOC: Non methane volatile organic compounds.
SubstanceUnitDiesel Euro 4Diesel Euro 5Diesel Euro 6Petrol Euro 4Petrol Euro 5Petrol Euro 6EV Electricity
Carbon Dioxidekg2.08 × 10−51.99 × 10−51.89 × 10−54.84 × 10−54.37 × 10−53.95 × 10−50.026097
Nitrogen Dioxidekg9.35 × 10−68.93 × 10−68.51 × 10−61.81 × 10−51.63 × 10−51.48 × 10−56.52 × 10−7
Particulateskg5.41 × 10−75.16 × 10−74.92 × 10−75.86 × 10−75.28 × 10−74.77 × 10−76.27 × 10−8
Hydrocarbonskg2.72 × 10−62.6 × 10−62.47 × 10−62.94 × 10−62.66 × 10−62.4 × 10−61.34 × 10−14
Sulfur Dioxidekg9.35 × 10−68.93 × 10−68.51 × 10−61.81 × 10−51.63 × 10−51.48 × 10−59.07 × 10−7
NMVOCkg9.8 × 10−99.36 × 10−98.92 × 10−92.11 × 10−81.9 × 10−81.72 × 10−81.31 × 10−8
Waste HeatMJ0.00480.0045840.0043680.0083820.0075590.0068340.293279

4. Environmental Impact Assessment of Vehicle Emissions

4.1. Goal, Scope Andimpact Assessment Methods

Environmental Life Cycle Assessment (LCA) is used to compare the impacts, damages and benefits of products and services while taking into account all the associated emissions, both direct and indirect. The process takes into account every emission and raw material that is used throughout the different product stages-manufacture, use stage and end of life. The advantage of separating the different product life stages enables the identification of the causes of specific impacts and emissions per stage in the product’s value-chain. The four main stages of a LCA method are applied in this paper and consist of a goal and scope definition, a life cycle inventory, the impact assessment and the reporting of results.
The system boundaries are defined in a way that they include only the emissions released during both use phase (vehicle operation) and the respective energy carrier pathway within Belgium’s borders. It disregards any other impacts and emissions included during manufacturing and recycling/end of life of the vehicles as the paper focuses on recommendations for national policies (see Figure 6).
The purpose of the cut-off is to provide a fair comparison between the two vehicle types (conventional ICE and electrical) while highlighting the significance of the non-exhaust emission fraction that is most of the time discarded from other studies [74,75]. Even though exhaust emissions are the subject of extensive environmental impact assessments—vehicle LCA studies include them—the same studies lack updated non-exhaust fraction inventories (and of course the impact assessment). As a starting point, the description of the primary service of the product lays the foundations to describe a functional unit. In this case, the product is a passenger vehicle and, according to its function—to provide mobility (km driven), the functional unit is one kilometre.
Figure 6. System boundaries.
Energies 09 00084 g006
The selected impact assessment methodology is ReCiPe [36]. Several other assessment methods were analysed such as Usetox [76,77] and EI99 [78] but it was found that characterization factors for some the core emissions were missing (i.e., particulate matter is not characterized in Usetox). The impact categories chosen to represent air quality in urban environments were: Photochemical Oxidant Formation (POF), Human Toxicity (HT), and Particulate Matter Formation (PMF). Air quality directly relates to human morbidity, translated by the amount of pollutant agents suspended. The main drivers of POF are benzenes, nitrogen oxide(s) and non-methane organic compounds. As for HT, dioxins, cadmium, silver, and zinc among others contribute to the impacts in this category. Particulate Matter Formation represents the impacts of particulates (PM) as well as particulates formed in atmospheric oxidation and nucleation processes, which are fuelled by non-methane hydrocarbons, nitrogen oxides in addition to sulphur oxides and ammonia. The latter particulates are referred to as secondary PM.
An endpoint category representing Disability Adjusted Life Years (DALY) is also calculated in order to aggregate the results of the different categories and provide a single score. The DALY results represent the amount of time lost by an individual in an ill-health condition. The DALY calculations were made using ReCiPe [36] and SimaPro 7.3.3 software where the midpoint categories mentioned above are taken to endpoint level. Taken into account are years of life lost and years of life disabled with no discounting and weighing attributed to age. The characterization factors (CF) that lead to DALY results from midpoint to endpoint are listed in Table 10.
Table 10. Mid-to-endpoint impact factors [79]. 1.4 DB eq: 1.4 Dichloro Benzene equivalent.
Midpoint Impact CategoryUnitCF
Human toxicitykg 1.4-DB eq7.00 × 10−7
Photochemical oxidant formationkg NMVOC3.90 × 10−8
Particulate matter formationkg PM10 eq2.60 × 10−4
The temporal displacement of the emissions modelled is not reflected in the model. Non-exhaust emissions are in this case the only emission during use stage of the electrical vehicle since the electricity generation already occurred in a specific location, geographically persistent, in the past.
The EV is assumed to have an energy consumption of 0.2 kWh·km−1 driven in an urban environment [80]. In contrast, the diesel/petrol vehicle has TTW associated emissions beside the non-exhaust fraction. Instead of having concentrated emissions like in EVs (electricity generation plants), ICEs contribute to a spread of harmful emissions throughout their usage due to fossil fuel combustion.
An uncertainty analysis was performed through the results in order to estimate ranges in the results. The analysis was performed using 1000 run Monte Carlo simulations where the outputs were later the subject of a descriptive statistical analysis suited for lognormal distributions. The uncertainty assessment addresses the quality of the data collected through a pedigree matrix method and consequent Monte Carlo analysis. However, it does not represent ranges in the data collected from the COPERT/RDE model.

4.2. Life cycle Emission Inventory

Well-to-Tank Emissions

The well-to-tank emissions within Belgian borders were calculated using Ecoinvent 2.2 (with updated electricity generation data) by applying a cut-off to the product-chain in every modelled process. Every emission originating from the oil refining processes, transportation/distribution, electricity generation and distribution is accounted for. No emissions occurring during the extraction or trans-oceanic shipping are included. The life cycle aspect of the plants (namely construction and decommissioning is not taken into account [81,82]. The tank-to-wheel emissions of electrical vehicles account only for the non-exhaust fraction. The emissions that are released occur during the electricity production in Belgium and, later, from the release of particles from brakes, tyres and road abrasion.
The electricity generation process for Belgium is accounted for; not included are the energy feedstock-associated emissions. The ones included comprehend solely the conversion emissions in Belgian production units. Electricity generation data for the year 2014 were used; the contribution for the different power plants is given in Table 11.
Table 11. Electricity generation in Belgium for 2014 per power plant type [83].
Production UnitCoalFuelGasNuclearHydroWindSolarWoodBFGImports
Production Share3%0%21%40%2%3%4%1%4%21%

5. Impact Assessment Results

The model was developed in such a way that the different stages shown in the system boundaries (see Figure 6) can be represented separately. Three different categories were modelled and are: non-exhaust emissions (NEx), tank-to-wheel (TTW) and refinery/electricity generation plant to tank (RTT, which comprehends refining/generation, transport to pumping station and refuelling). Processes related to RTT were elaborated by altering original Ecoinvent 2.2 unit processes by removing the links in the fuel product chain that reside outside Belgian borders.

5.1. Human Toxicity

The human toxicity (HT) midpoint impact category represents the environmental accumulation of substances in the food chain together with the toxicity of the chemicals in the product chain. In the ReCiPe methodology, the fate-exposure model has been used to describe this same persistence and accumulation. It also considers the degradation half-lives and geographical conditions of state of the analysed product. The human exposure to toxic substances might take place through drinking, ingestion, inhalation, among other pathways. The chemical 1.4-dichlorobenzene (1.4-DB) is used as a reference substance for this impact category where every other substance’s impact is an equivalence factor of this reference.
When analysing human toxicity results (see Figure 7), the dominance of the non-exhaust fraction for diesel, petrol and EV groups stands to attention. The main cause for the increased contribution to the HT impact from the non-exhaust emissions is due to the total amount of PM2.5 and PM10 that is released both from brake pad and tyre wear. The decreased score for NEx in electrical vehicles is mostly due to the low contribution of brake wear included in the mode. The penalty in tyre wear, due to increased weight, does not contribute significantly in this impact category. The particle fraction of the brake emissions are in the order of magnitude of milligrams while other constituents like copper, zinc, nickel and selenium (among others) contribute at the microgram and nanogram scale.
Figure 7. Human Toxicity impacts.
Energies 09 00084 g007
If an interpretation of the results is done disregarding the non-exhaust fraction, the impact of electricity generation can be observed in the case of EVs. For the Belgian case, the share of nuclear based generation is dominant. The presence of natural gas and coal based generation also contribute to the impacts, but to a lesser extent. In the case of petrol, the extra refining processes during fuel processing from crude oil as well as the fugitive emissions during the refuelling process of the pump (refinery to fuel truck, fuel truck to pump, pump to vehicle) contribute to a significant extent. In the case of diesel vehicles, due to the nature of the fuel, these fugitive emissions are not well documented. The reduced score only accounts for the refining process, RTT. Overall, conventional petrol and diesel vehicles have an impact almost two fold higher than EVs’.

5.2. Photochemical Oxidant Formation

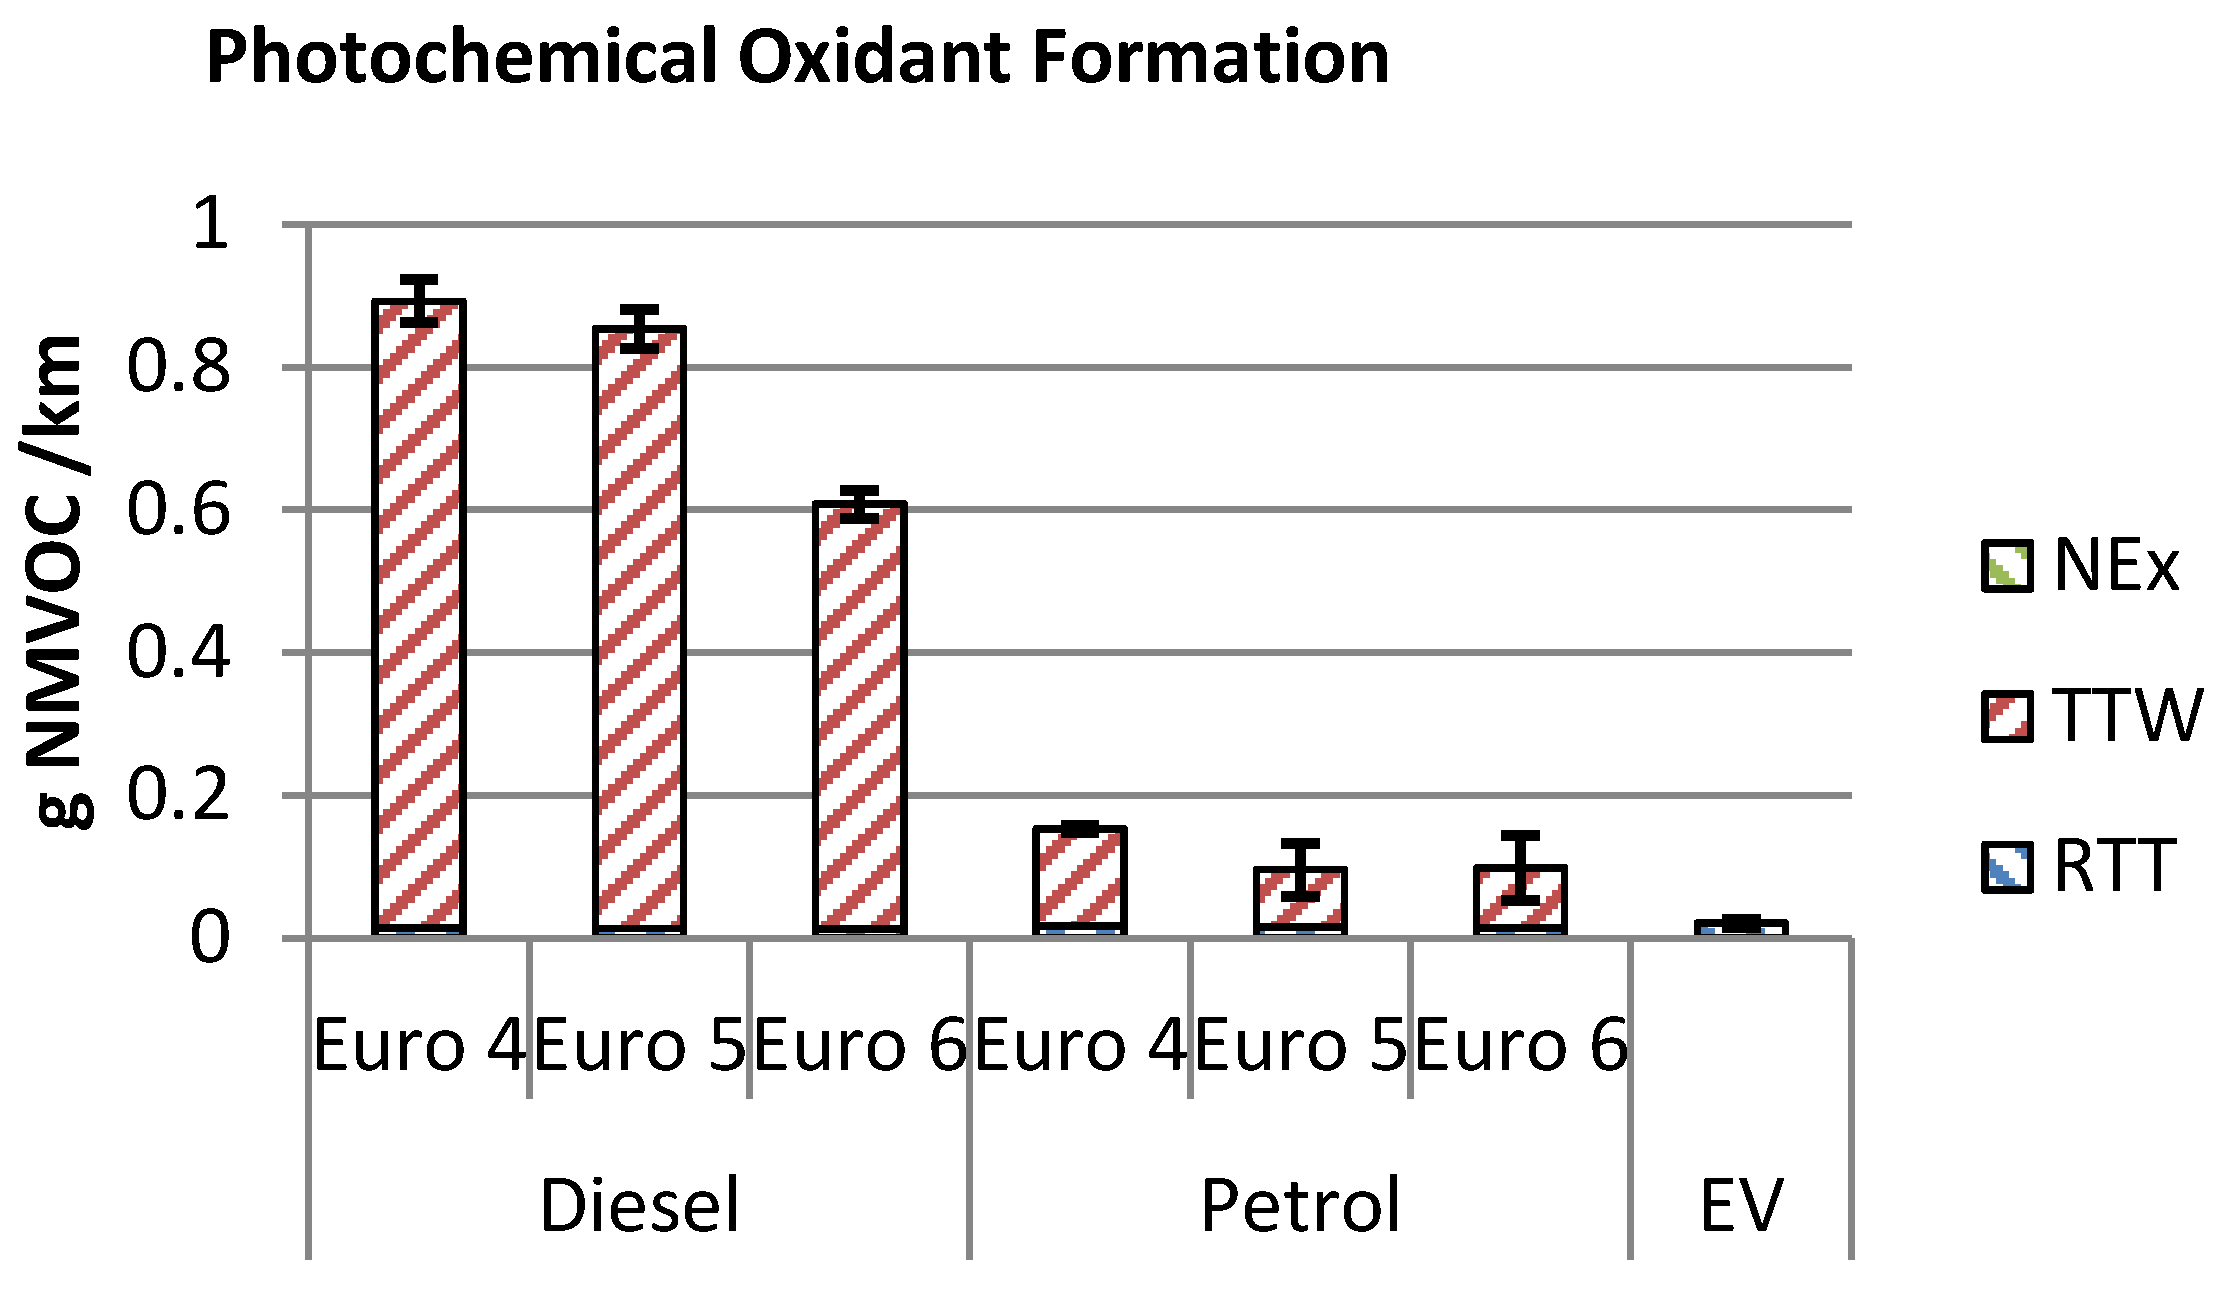
The photochemical oxidant formation (POF) category in ReCiPe highlights the marginal change in the 24 hour average concentration of ozone in Europe caused by a change in emission of a given substance. The POF impact category uses a (g·NMVOC) unit as it characterizes the formation of photochemical oxidants under the direct influence of sunlight by the means of nitrogen oxides and other non-methane hydrocarbons. These reactions create ground-level ozone which is responsible for airway inflammation and deterioration of lung function capacity.
The impacts of the refining process, although small (see Figure 8), do reflect the nature of a less refined fuel such as diesel when compared to petrol. Nevertheless, a typical allocation issue, from a multi-output process is also found here. The processing of crude oil outputs both diesel and with further refining, petrol. A slight decrease is observed over the different Euro emission standards, although not enough reduction is translated from the Euro emission standard to real world. Petrol engines, as expected, emit less nitrogen oxides and therefore contribute significantly less to the POF impact as shown in in Figure 8. The non-exhaust fraction has zero contribution in this impact category as there are no nitrogen oxide(s) emissions associated with the abrasion processes.
Electric vehicles do contribute to the impact but to a reduced extent. The impact originates from the natural gas and coal production plants used for the electricity generation process. The EV score in this category is three to four times less than the best performing Euro 5 petrol vehicle and almost twenty eight times better than the best Euro 6 diesel. Nevertheless, if only refining/generation impacts are compared, the electricity generation process associated to EVs is more penalizing than fuel refining and distribution (for this specific impact category). It is safe to say that the low scores of EVs are highlighted due to the fact that there are no tank-to-wheel emissions from the powertrain.
Figure 8. Photochemical oxidant formation impacts.
Energies 09 00084 g008

5.3. Particulate Matter Formation

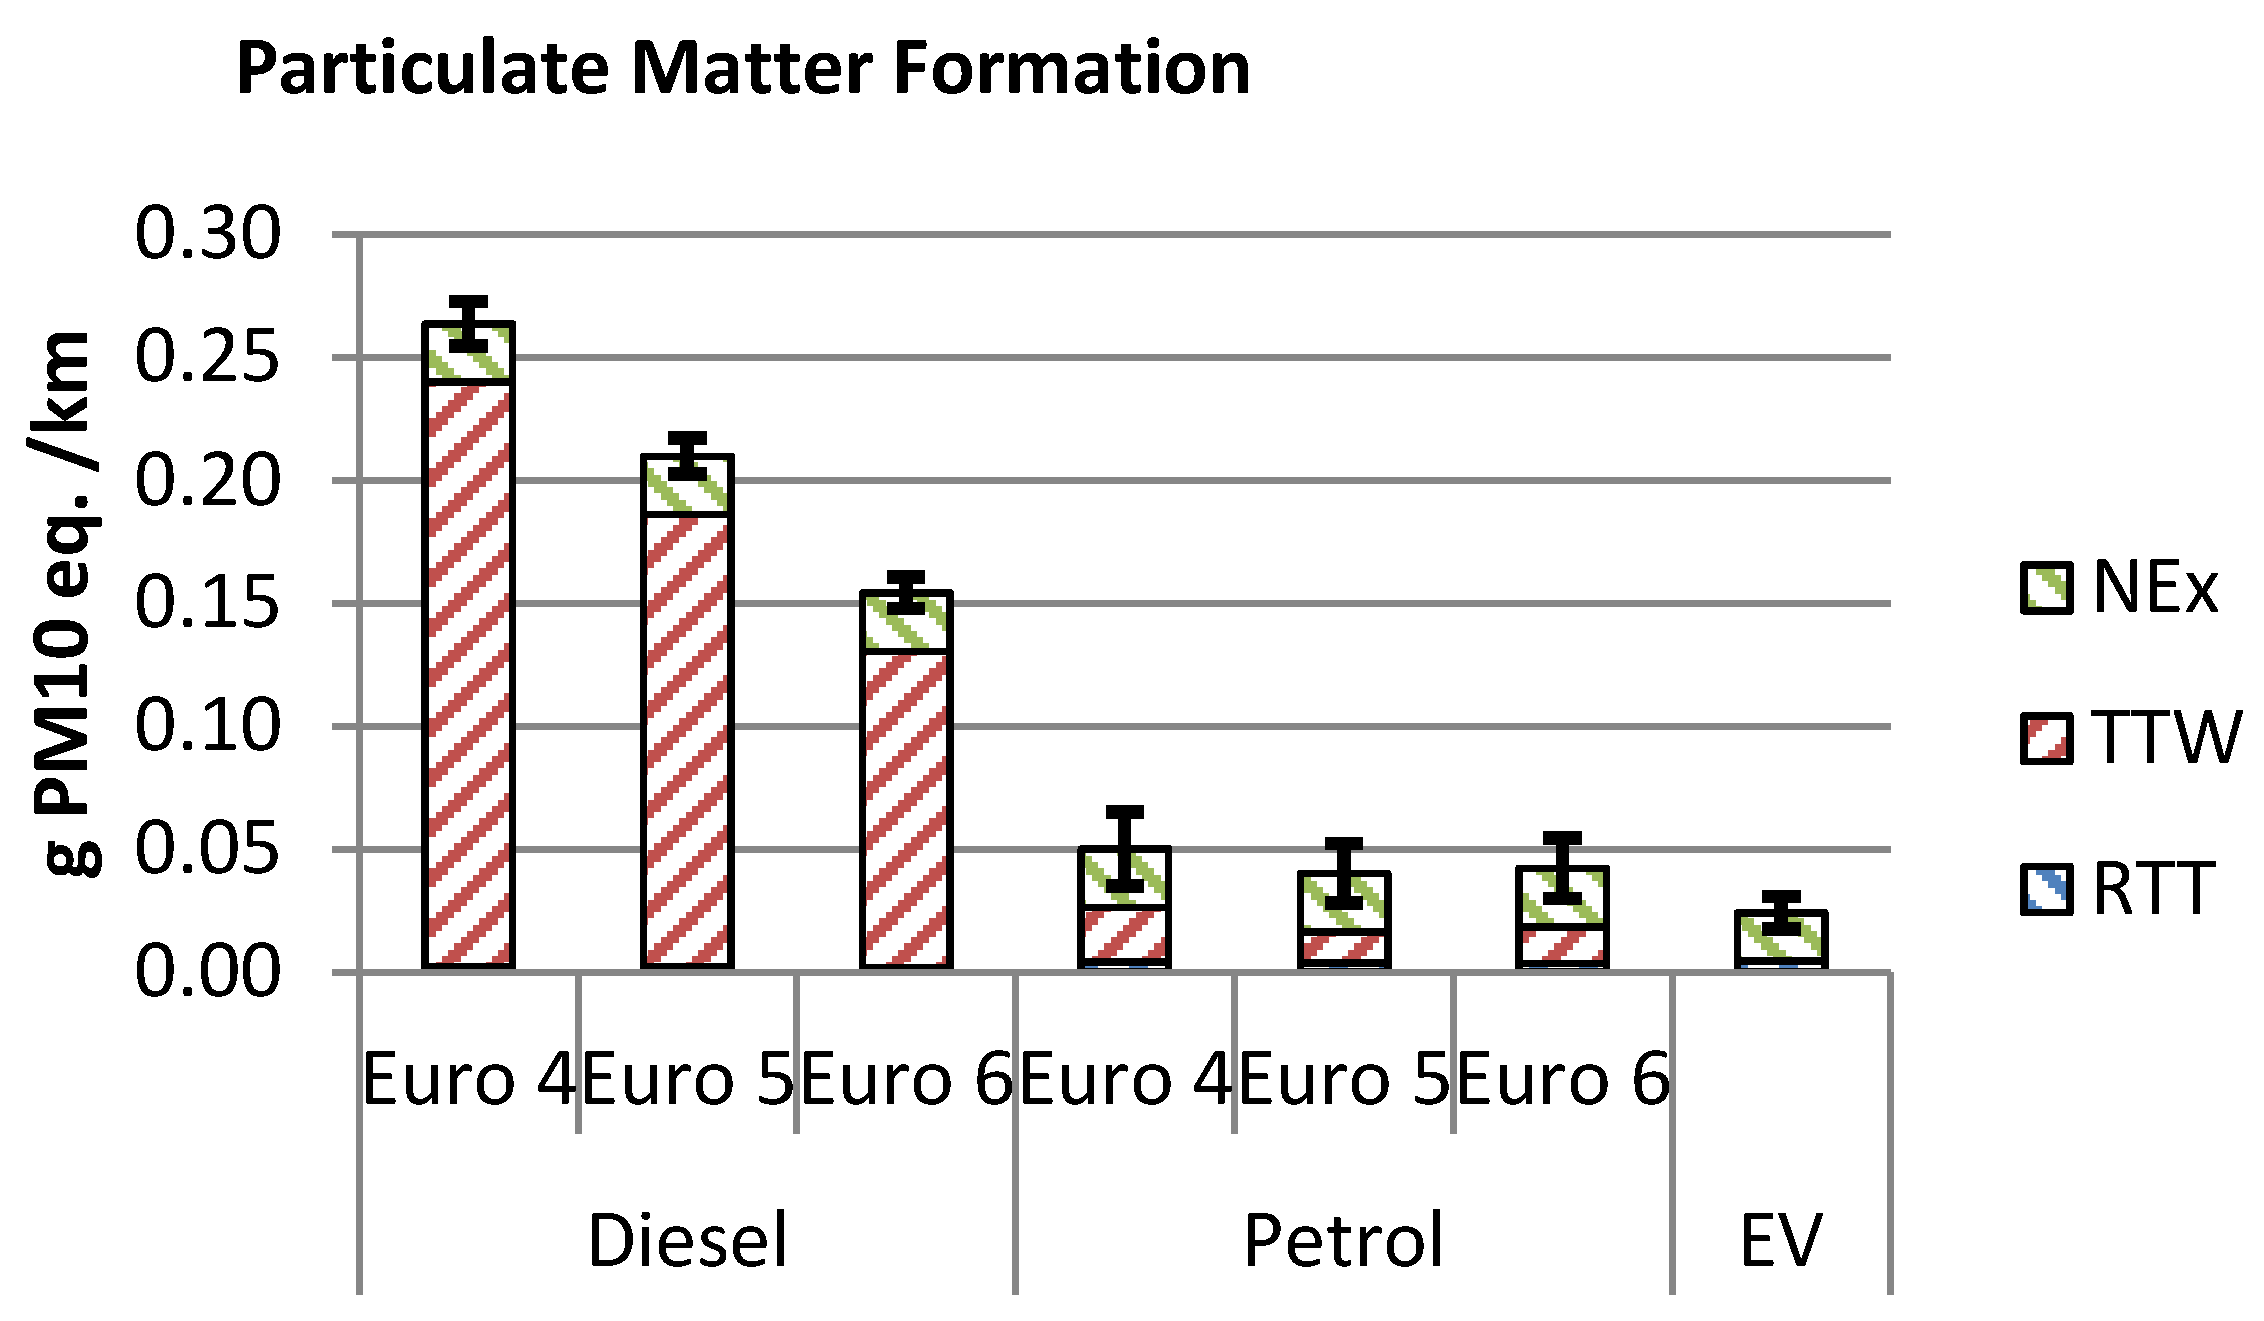
Particulate matter sources vary from fossil fuel burning, namely from electricity generation and transportation activities (among other anthropogenic sources), to natural sources such as wildfires and volcanic activity. Anthropogenic PM sources considered in this contribution are from electricity generation and transportation activities.
Diesel vehicles contribute with the biggest share concerning PM emissions. The presence of particulate filters has only become mandatory since recent years, through Euro 5. This is partly reflected in the results. Still, PM levels are much higher in diesel powertrains than in petrol ones. Remarkably, Euro 6 diesel combined PM (primary and secondary plus non-exhaust) levels exceed three times the emissions regulation Directive of 5 mg·km−1. Nevertheless, the downwards trend is still visible in Figure 9. Refining associated particulates are significantly higher in the case of petrol, opposed to diesel, due to the extra refinement stages necessary in the product chain. Coal and biomass combustion contribute in the electricity generation sector to PM emissions. The non-exhaust fraction is higher in ICEs as the brake pad abrasion contribution is significant and there is no benefit from regenerative braking. In the case of EVs, non-exhaust related PM is also less than ICEs. Worth noticing is that as the contribution of brake wear related PM is less, and the share of tyre associated contribution is higher, the majority of PM released situates itself in the coarse particle region and higher aerodynamic sizes (from PM2.5 to PM10+ diameter). Tyre wear particles tend to exhibit a higher aerodynamic size and thus have a relatively less harmful fate than brake wear related particles. Overall it is safe to say that PM release from EVs is significantly less (and also less prejudicial) than from conventional vehicles. Overall, EVs tend to emit up to eight times less PM than diesel vehicles and at least two times less than petrol powertrains.
Figure 9. Particulate Matter impact contribution.
Energies 09 00084 g009

5.4. Human Health Assessment-DALY-Disability Adjusted Life Years

The DALY calculations performed only took into account the chosen impact categories (see Table 10). Traditional categories like climate change and eutrophication were left out of the study as they fall out of scope (as they do not contribute to ambient air quality in urban areas). Analysing the results shown in Figure 10, a similar scenario is observed as in the PM results, for example. The trend represents the importance of the selected impact categories in the human health situation. The lowest impacts have EVs followed by Euro 5 petrol vehicles. The slight increase in scores towards Euro 6 petrol vehicles is derived from the nature of the available tested vehicles—most were high class sedans. A Euro 6 diesel DALY score proves to be almost two times higher than a Euro 4 diesel and three times lower than any petrol vehicle. Still, EVs are the best performing overall in terms of DALY. Although the emissions from conventional vehicles significantly affect urban air quality, electric vehicles perform up to fifteen times better than a Euro 4 diesel and eight times better than a recent Euro 6 diesel vehicle. Compared to petrol vehicles, EVs still perform two to three times better from a DALY point of view, even just accounting for with non-exhaust emissions. From a purely health assessment perspective, EVs do contribute to healthier cities, opposed to ICEs, and this from two perspectives: (1) the type of particles release during driving and (2) the geographical location of the generation units (dispersed throughout the country, not in city boundaries like power generation plants).
Figure 10. DALY per km driven in an urban environment.
Energies 09 00084 g010

6. Discussion and Conclusions

Aggregated DALY results highlight the benefits of utilizing electric vehicles in urban environments opposed to internal combustion powertrains such as diesel and petrol. Nevertheless, the latest generations of petrol vehicles still prove valid solutions albeit their significant TTW and NEx emission impacts.
The results presented are not based on type approval, i.e. NEDC-based emission factors, as is the case in most studies. Instead an analysis was made of on the one hand different dynamometer-based studies applying more realistic driving cycles such as the CADC or PEMS studies and calculated emissions factors from widely applied sources as the HBEFA and COPERT. The increased interest in real-world driving emissions (RDE) which has started a couple of years ago will doubtlessly change the insights in the applied emission factors for e.g. national emission inventories by means of HBEFA or COPERT. The output of these models does not provide error margins. Nevertheless, the life cycle model did tackle this problem at a data quality level through the use of pedigree matrixes.
The electricity generation defines every emission in the EV case, other than non-exhaust emissions. If a different electricity generation mix were necessarily be used, a different share of generation units would make part of the production portfolio [81,82,83] and therefore, have different localized impacts. Further implementation of renewable energy sources would without question further increase the advantage of EVs in these comparisons [82,84]. On the other hand hard coal and oil should be avoided as energy source to produce electricity as well as other sources of fossil fuels.
Nevertheless, electricity generation associated impacts can be almost neglected when compared to non-exhaust ones in case of EVs. These unregulated emissions have significant and dominant impacts throughout the analysed categories.

6.1. The Main Conclusions which Can be Drawn from This Study are as Following:

  • Electrical vehicles show throughout all categories that they are the best alternative to diesel and petrol vehicles. EVs have no TTW emissions and only reduced non-exhaust pollutants as well as low electricity generation associated emissions. The damages caused by diesel and petrol vehicles are superior to those of electric vehicles in the addressed categories. Their contribution to associated morbidity and health damages is from two to ten times higher than electricity based powertrains. Regarding the non-exhaust fraction of emissions, these are unregulated, uncontrolled and mostly significant. Specifically in the human toxicity category, these scores are overwhelming.
  • Scenarios where 100% renewable energy is used to charge EVs are ideal. In this case no conversion emissions would be triggered and only non-exhaust pollutants would be represented. Total renewable energy scenarios are yet not realistic for most countries but, when compared to the one used for this analysis, the impacts would be greatly reduced as suggested in [83].
  • Non-exhaust emissions require active regulation. Either this is achieved by using alternative materials during production of both tyres, brakes and pavements, or by introducing alternative technologies such as regenerative braking in ICEs. Tyres should be subject to technological pushes in order to mitigate wear and tyre composition. EVs contribute to an enhancement of urban air quality, and consequent health benefits can be associated to their use (opposed to ICEs).
  • Policy makers should enforce further stringent regulations in the transportation sector regarding emissions as well as promote the usage of alternative means of passenger transport. Such a change would highlight the benefits, both environmental, economic and social of these alternative means (such as human powered and electric two-wheelers) as suggested in [85,86].

6.2. Limitations of the Study

While the impact assessment calculation model does not provide much geographical resolution other than the regional/continental/global scales, the input emissions do reflect the required geographical concentration that the authors want to convey. Every emission quantified and modelled is only released within Belgian borders. This is the case for the ICE vehicles where the average speed for Belgium’s urban roads (17.5 km/h) was used for the model. The authors used the ReCiPe method as an impact assessment method for comparability of results and completeness. Nevertheless, this limitation was partially tackled at the inventory database level – high population areas were used in Ecoinvent as sub-compartment categories (other options would be: unspecified, Low pop., low pop. +long term, High pop., stratosphere, stratosphere + troposphere and indoor). Other methods were studied as alternatives but neither include fully characterized relevant pollutant species nor (recently) updated characterization factors.

Acknowledgments

The research was funded by the MOBI Research Group from the Vrije Universiteit Brussel. No external sourced of funding were used. The funds necessary to publish in Open Access were supported by the Vrije Universiteit Brussel.

Author Contributions

Nils Hooftman and Luis Oliveira created the models with the help of Maarten Messagie. The emission assessment was performed by Nils Hooftman, and the LCA by Luis Oliveira. Thierry Coosemans and Joeri Van Mierlo contributed by scientifically validating the different iterations of this research with consecutive reviews.

Conflicts of Interest

The authors declare no conflict of interest.

Abbreviations

The following abbreviations are used in this manuscript:
AcronymMeaning
AECCAssociation for Emissions Control by Catalyst
AlAluminium
AsArsenic
B(a)PBenzo(a)pyrene
B(b)FBenzo(b)fluoranthene
B(k)FBenzo(k)fluoranthene
BaBarium
BEVBattery electric vehicle
CADCCommon ARTEMIS driving cycle
CdCadmium
CFConformity factors
CH4Methane
CLRTAPConvention on long-range transboundary air pollution
COCarbon monoxide
CO2Carbon dioxide
COPDChronic obstructive pulmonary disease
CrChromium
CuCopper
DALYDisability adjusted life years
DIDirect injection
DPFDiesel particulate filter
DOCDiesel oxidation catalyst
ECEuropean Commission
EEAEuropean Environment Agency
EFEmission factor
EGRExhaust gas recirculation
EMEPEuropean Monitoring and Evaluation Programme
EUEuropean Union
EVElectric vehicles
FeIron
GDIGasoline direct injection technology
GIIRGerman informative inventory report
GPFGasoline particulate filter
HBEFAHandbook on Emission Factors for Road Transport
HEVHybrid electric vehicle
HgMercury
HMHeavy metals
HTHuman toxicity
I[..]PIndeno(…)pyrene
IARCInternational Agency for Research on Cancer
ICCTInternational Council on Clean Transportation
ICEInternal Combustion Engine
LCALifecycle analysis
N2ONitrous oxide
NEDCNew European driving cycle
NExNon-exhaust emissions
NH3Ammonia
NiNickel
NMHCNon-methane hydrocarbons
NMVOCNon-methane volatile organic compound
NOxNitrogen oxides
NTENot to exceed limits
O3Ozone
PAHPolycyclic aromatic hydrocarbons
PbLead
PCDDPolychlorinated dibenzodioxin
PEMSPortable emissions measurement system
PFIPort fuel injection
PHEVPlugin electric vehicle
PMParticulate matter
PMFParticulate matter formation
PNParticle number
POFPhotochemical oxidant formation
POPPersistive organic pollutant
PpmParts per million
RDEReal driving emission
RTTRefinery-to-tank
SSulphur
SbAntimony
SCRSelective catalytic reduction
SeSelenium
SnTin
SO42−Sulphate
TAType-approval
THCTotal hydrocarbons
TNONetherlands Organisation for Applied Scientific Research
TTWTank-to-wheel
TWCThree-way catalyst
US EPAUnited States Environmental Protection Agency
VOCVolatile organic compounds
WHOWorld Health Organization
WLTCWorldwide harmonized light vehicle test cycle
WLTPWorldwide harmonized light vehicle test procedure
WTWWell-to-wheel
ZnZink
ZrZirconium

References

  1. NEC Directive Status Report 2013; European Environment Agency: Copenhagen, Denmark, 2014.
  2. European Environment Agency. Air Pollution Still Harming Health Across Europe. Available online: http://www.eea.europa.eu/media/newsreleases/air-pollution-still-causing-harm (accessed on 22 January 2016).
  3. Bruyninckx, H. Luchtkwaliteit: Een Europees Perspectief. In Conferentie Luchtkwaliteit, Brussel; European Environment Agency: Copenhagen, Denmark, 2014. [Google Scholar]
  4. European Parliament and Council. Directive 2008/50/EC on ambient air quality and cleaner air for Europe. Off. J. Eur. Union 2008, L 152, 1–44. [Google Scholar]
  5. Commission Refers Belgium and Bulgaria to Court and Gives Sweden a Final Warning Over Poor Air Quality. Available online: http://europa.eu/rapid/press-release_IP-15-5197_en.htm (accessed on 12 April 2015).
  6. World Urbanization Prospects; United Nations Economic Commission for Europe: Brussels, Belgium, 2014.
  7. Index Mundi Belgium—Urban Population. Available online: http://www.indexmundi.com/facts/belgium/urban-population#SP.URB.TOTL.IN.ZS (accessed on 2 June 2015).
  8. Colvile, R.; Hutchinson, E.; Mindell, J.; Warren, R. The transport sector as a source of air pollution. Atmos. Environ. 2001, 35, 1537–1565. [Google Scholar] [CrossRef]
  9. Lenschow, P. Some ideas about the sources of PM10. Atmos. Environ. 2001, 35, 23–33. [Google Scholar] [CrossRef]
  10. Kousoulidou, M.; Ntziachristos, L.; Mellios, G.; Samaras, Z. Road-transport emission projections to 2020 in European urban environments. Atmos. Environ. 2008, 42, 7465–7475. [Google Scholar] [CrossRef]
  11. NEC Directive Status Report 2011; European Environment Agency: Copenhagen, Denmark, 2012.
  12. EU Transport in Figures—Statistical Pocketbook 2014; European Union: Brussels, Belgium, 2014.
  13. Boulter, P.G.; Borken-Kleefeld, J.; Ntziachristos, L. The Evolution and Control of NOx Emissions from Road Transport in Europe. In Urban Air Quality in Europe; Viana, M., Barcelo, D., Kostianoy, A.G., Eds.; Springer: Berlin, Germany, 2012; pp. 31–54. [Google Scholar]
  14. European Vehicle Market Statistics—Pocketbook 2014; International Council on Clean Transportation: Washington, DC, USA, 2014.
  15. Ntziachristos, L.; Mellios, G.; Tsokolis, D.; Keller, M.; Hausberger, S.; Ligterink, N.E.; Dilara, P. In-use vs. type-approval fuel consumption of current passenger cars in Europe. Energy Policy 2014, 67, 403–411. [Google Scholar] [CrossRef]
  16. Dieselnet Emission Standards—European Union: Cars and Light Trucks. Available online: https://www.dieselnet.com/standards/eu/ld.php (accessed on 3 May 2015).
  17. Cames, M.; Helmers, E. Critical evaluation of the European diesel car boom-global comparison, environmental effects and various national strategies. Environ. Sci. Eur. 2013, 25, 15. [Google Scholar] [CrossRef]
  18. Jenkins, J. Charged EVs—A Closer Look at Regenerative Braking. Available online: https://chargedevs.com/features/a-closer-look-at-regenerative-braking/ (accessed on 24 March 2015).
  19. Electric Vehicles—Chattanooga University—Center for Energy, Transportation and the Environment. Available online: http://www.utc.edu/college-engineering-computer-science/research-centers/cete/electric.php (accessed on 24 March 2015).
  20. Addendum 82: Regulation No. 83; United Nations Economic Commission for Europe: Brussels, Belgium, 2011.
  21. Franco, V.; Sánchez, F.P.; German, J.; Mock, P. Real-World Exhaust Emissions from Modern Diesel Cars: A Meta-Analysis of PEMS Emissions Data from EU (Euro 6); International Council on Clean Transportation: Washington, DC, USA, 2014. [Google Scholar]
  22. Mind the Gap! Why Official Car Fuel Economy Figures don’t Match up to Reality; Transport and Environment: Brussels, Belgium, 2013.
  23. Demuynck, J.; Bosteels, D.; de Paepe, M.; Favre, C.; May, J.; Verhelst, S. Recommendations for the new WLTP cycle based on an analysis of vehicle emission measurements on NEDC and CADC. Energy Policy 2012, 49, 234–242. [Google Scholar] [CrossRef] [Green Version]
  24. Mock, P.; Tietge, U.; Franco, V.; German, J.; Bandivadekar, A.; Ligterink, N.; Kühlwein, J.; Riemersma, I. From Laboratory to Road: A 2014 updata of Official and “Real-World” Fuel Consumption and CO2 Values for Passenger Cars; International Council on Clean Transportation: Washington, DC, USA, 2014. [Google Scholar]
  25. Mock, P.; Yang, Z. Driving Electrifiction—A Global Comparison of Fiscal Incentive Policy for Electric Vehicles; International Council on Clean Transportation: Washington, DC, USA, 2014. [Google Scholar]
  26. Mock, P.; German, J. The Future of Vehicle Emissions Testing and Compliance—How to Align Regulatory Requirements, Customer Expectations, and Environmental Performance in the European Union; International Council on Clean Transportation: Washington, DC, USA, 2015. [Google Scholar]
  27. Marotta, A.; Pavlovic, J.; Ciuffo, B.; Serra, S.; Fontaras, G. Gaseous Emissions from Light-Duty Vehicles: Moving from NEDC to the New WLTP Test Procedure. Environ. Sci. Technol. 2015, 49, 8315–8322. [Google Scholar] [CrossRef] [PubMed]
  28. Kwanten, M. Kilometers Afgelegd Door Belgische Voertuigen; Directoraat-generaal Duurzame Mobiliteit: Brussels, Belgium, 2014. [Google Scholar]
  29. Kadijk, G.; van Mensch, P. Praktijkemissies Personen—En bestelauto’s; Toegepast-Natuurwetenschappelijk Onderzoek (TNO): Delft, The Netherlands, 2014. [Google Scholar]
  30. Kousoulidou, M.; Fontaras, G.; Ntziachristos, L.; Bonnel, P.; Samaras, Z.; Dilara, P. Use of portable emissions measurement system (PEMS) for the development and validation of passenger car emission factors. Atmos. Environ. 2013, 64, 329–338. [Google Scholar] [CrossRef]
  31. Carslaw, D.C.; Rhys-Tyler, G. New insights from comprehensive on-road measurements of NOx, NO2 and NH3 from vehicle emission remote sensing in London, UK. Atmos. Environ. 2013, 81, 339–347. [Google Scholar] [CrossRef]
  32. Bergmann, M.; Kirchner, U.; Vogt, R.; Benter, T. On-road and laboratory investigation of low-level PM emissions of a modern diesel particulate filter equipped diesel passenger car. Atmos. Environ. 2009, 43, 1908–1916. [Google Scholar] [CrossRef]
  33. Archer, G. Particle Emissions from Petrol Cars; Transport and Environment: Brussels, Belgium, 2013. [Google Scholar]
  34. Mamakos, A.; Steininger, N.; Martini, G.; Dilara, P.; Drossinos, Y. Cost effectiveness of particulate filter installation on Direct Injection Gasoline vehicles. Atmos. Environ. 2013, 77, 16–23. [Google Scholar] [CrossRef]
  35. Behera, S.N.; Sharma, M. Degradation of SO2, NO2 and NH3 leading to formation of secondary inorganic aerosols: An environmental chamber study. Atmos. Environ. 2011, 4015–4024. [Google Scholar] [CrossRef]
  36. Goedkoop, M.; Heijungs, R.; Huijbregts, M.; de Schryver, A.; Struijs, J.; van Zelm, R. A Life Cycle Impact Assessment Method Which Comprises Harmonised Category Indicators at the Midpoint and the Endpoint Level; PRé Consultants: Amersfoort, The Netherlands, 2013. [Google Scholar]
  37. Goedkoop, M.J.; Heijungs, R.; Huijbregts, M.; de Schryver, A.; Struijs, J.; van Zelm, R. ReCiPe Workbook. Available online: http://www.lcia-recipe.net/file-cabinet (accessed on 3 March 2015).
  38. Franco, V.; Kousoulidou, M.; Muntean, M.; Ntziachristos, L.; Hausberger, S.; Dilara, P. Road vehicle emission factors development: A review. Atmos. Environ. 2013, 70, 84–97. [Google Scholar] [CrossRef]
  39. May, J.; Bosteels, D.; Favre, C. An Assessment of Emissions from Light-Duty Vehicles using PEMS and Chassis Dynamometer Testing; Association for Emissions Control by Catalyst (AECC): Brussels, Belgium, 2014. [Google Scholar]
  40. Weiss, M.; Bonnel, P.; Hummel, R.; Manfredi, U.; Colombo, R.; Lanappe, G.; le Lijour, P.; Sculati, M. Analyzing On-Road Emissions of Light-Duty Vehicles with Portable Emission Measurement Systems (PEMS); Joint Research Centre: Ispra, Italy, 2011. [Google Scholar]
  41. Weiss, M.; Bonnel, P.; Kühlwein, J.; Provenza, A.; Lambrecht, U.; Alessandrini, S.; Carriero, M.; Colombo, R.; Forni, F.; Lanappe, G.; et al. Will Euro 6 reduce the NOx emissions of new diesel cars?—Insights from on-road tests with Portable Emissions Measurement Systems (PEMS). Atmos. Environ. 2012, 62, 657–665. [Google Scholar] [CrossRef]
  42. Kadijk, G.; van Mensch, P.; Spreen, J. Detailed Investigations and Real-World Emission Performance of Euro 6 Diesel Passenger Cars Samenvatting; Toegepast-Natuurwetenschappelijk Onderzoek (TNO): Delft, The Netherlands, 2015. [Google Scholar]
  43. Ligterink, N.; Kadijk, G.; van Mensch, P.; Hausberger, S.; Rexeis, M. Investigations and Real World Emission Performance of Euro 6 Light-Duty Vehicles Samenvatting; Toegepast-Natuurwetenschappelijk Onderzoek (TNO): Delft, The Netherlands, 2013. [Google Scholar]
  44. Wenborn, M.; Coleman, P.; Passant, N.; Lymberidi, E.; Sully, J.; Weir, R. Speciated PAH Inventory for the UK Speciated PAH Inventory for the UK; AEA Technology Environment: Abingdon, UK, 1999. [Google Scholar]
  45. Merritt, P.M.; Ulmet, V.; Mccormick, R.L.; Mitchell, W.E.; Baumgard, K.J. Regulated and unregulated exhaust emissions comparison for three Tier II non-road diesel engines operating on ethanol-diesel blends. In Proceedings of the SAE Brasil Fuels and Lubricants Meeting, Rio de Janeiro, Brazil, 11–13 May 2005.
  46. Greenbaum, D. Air Pollution and Cancer. In Air Pollution and Cancer; Straif, K., Cohen, A., Samet, J., Eds.; International Agency for Research on Cancer: Lyon, France, 2013; pp. 49–62. [Google Scholar]
  47. Grigoratos, T.; Martini, G. Non-Exhaust Traffic Related Emissions. Brake and Tyre Wear PM Literature Review; Joint Research Centre: Ispra, Italy, 2014. [Google Scholar]
  48. Rexeis, M.; Hausberger, S. Trend of vehicle emission levels until 2020—Prognosis based on current vehicle measurements and future emission legislation. Atmos. Environ. 2009, 43, 4689–4698. [Google Scholar] [CrossRef]
  49. Oliveira, L.M.; Savvidis, D.; Pecqueur, M., Sr. Controlling particulate matter emissions in vehicles using different strategies under the heavy-duty test cycle. SAE Int. 2012. [Google Scholar] [CrossRef]
  50. Amato, F.; Flemming, R.C.; Denier van der Gon, H.; Gehrig, R.; Gustafsson, M.; Hafner, W.; Harrisson, R.M.; Jozwicka, M.; Kelly, F.J.; Moreno, T.; et al. Urban Air Quality: The Challenge of Traffic Non-Exhaust Emissions. Available online: http://www.kau.edu.sa/Files/188/Researches/65862_37290.pdf (accessed on 2 March 2015).
  51. Diesel Engine Exhaust Carcinogenic. Available online: http://www.iarc.fr/en/media-centre/pr/2012/pdfs/pr213_E.pdf (accessed on 2 March 2015).
  52. Alfaro-Moreno, E.; Nawrot, T.S.; Vanaudenaerde, B.M.; Hoylaerts, M.F.; Vanoirbeek, J.A.; Nemery, B.; Hoet, P.H.M. Co-cultures of multiple cell types mimic pulmonary cell communication in response to urban PM10. Eur. Respir. J. 2008, 32, 1184–1194. [Google Scholar] [CrossRef] [PubMed]
  53. Air Quality in Europe—2014 Report; European Environment Agency: Copenhagen, Denmark, 2014.
  54. Ntziachristos, L.; Samaras, Z. EMEP/EEA Emission Inventory Guidebook 2013 Update Sept 2014 1; European Environment Agency: Copenhagen, Denmark, 2014. [Google Scholar]
  55. Kühlwein, J.; Rexeis, M.; Luz, R.; Hausberger, S. Update of Emission Factors for EURO 5 and EURO 6 Passenger Cars for the HBEFA Version 3.2; Graz University of Technology: Graz, Austria, 2013. [Google Scholar]
  56. Honoré, C.; Vautard, R.; Beekmann, M. Low and high NOx chemical regimes in an urban environment. Environ. Model. Softw. 2000, 15, 559–564. [Google Scholar]
  57. Passant, N.; Murrells, T.; Pang, Y.; Thistlethwaite, G.; Walker, C.; Watterson, N.W.; Webb, N.; Broomfield, M.; Mitchell, R.; Webb, J.; et al. UK Informative Inventory Report (1980 to 2012); Department for Environment, Food and Rural Affairs (DEFRA): London, UK, 2014. [Google Scholar]
  58. Monitoring CO2 Emissions from Passenger Cars and Vans in 2013; European Environment Agency: Copenhagen, Denmark, 2014.
  59. Zhang, S.; Wu, Y.; Liu, H.; Huang, R.; Un, P.; Zhou, Y.; Fu, L.; Hao, J. Real-world fuel consumption and CO2 (carbon dioxide) emissions by driving conditions for light-duty passenger vehicles in China. Energy 2014, 69, 247–257. [Google Scholar] [CrossRef]
  60. Panko, J.M.; Chu, J.; Kreider, M.L.; Unice, K.M. Measurement of airborne concentrations of tire and road wear particles in urban and rural areas of France, Japan, and the United States. Atmos. Environ. 2013, 72, 192–199. [Google Scholar] [CrossRef]
  61. Sjödin, A.; Ferm, M.; Björk, A.; Rahmberg, M.; Gudmundsson, A.; Swietlicki, E.; Johansson, C.; Gustafsson, M.; Blomqvist, G. Wear Particles from Road Traffic: A Field, Laboratory and Modelling Study; Swedish Environmental Research Institute (IVL): Göteborg, Sweden, 2010. [Google Scholar]
  62. Road Transport Emission Factors from 2010. Available online: http://naei.defra.gov.uk/datawarehouse/3_9_323_136259_roadtransportefs_naei10_v2.xls (accessed on 3 May 2015).
  63. Kupiainen, K.J.; Tervahattu, H.; Räisänen, M.; Mäkelä, T.; Aurela, M.; Hillamo, R. Size and composition of airborne particles from pavement wear, tires, and traction sanding. Environ. Sci. Technol. 2005, 39, 699–706. [Google Scholar] [CrossRef] [PubMed]
  64. Gehrig, R.; Hüeglin, C. Contributions of road traffic to ambient PM10 and PM2.5 concentrations—Chemical speciation of fine particulates and source attribution with a receptor model. In Proceedings of the 1st Swiss Transport Research Conference, Monte Verità, Switserland, 1–3 March 2001.
  65. Brake and Tire Wear Emissions from On-Road Vehicles in MOVES2014; U.S. Environmental Protection Agency (EPA): Cincinnati, OH, USA, 2014.
  66. Barlow, T.J.; Boulter, P.G.; Mccrae, I.S.; Sivell, P.; Harrisson, R.M.; Carruthers, D.; Stocker, J. Non-Exhaust Particulate Matter Emissions from Road Traffic: Summary Report. TRL Report for DEFRA.; Transport Research Laboratory (TRL): Wokingham, UK, 2007. [Google Scholar]
  67. Bukowiecki, N.; Gehrig, R.; Lienemann, P.; Hill, M.; Figi, R.; Buchmann, B.; Furger, M.; Richard, A.; Mohr, C.; Weimer, S.; et al. PM10 Emission Factors of Abrasion Particles from Road Traffic (APART); Federal Department for Environment, Transport, Energy and Communication: Bern, Switserland, 2009. [Google Scholar]
  68. Garg, B.D.; Cadle, S.H.; Mulawa, P.A.; Groblicki, P.J. Brake wear particulate matter emissions. Environ. Sci. Technol. 2000, 34, 4463–4469. [Google Scholar] [CrossRef]
  69. Bukowiecki, N.; Gehrig, R.; Lienemann, P.; Hill, M.; Figi, R.; Buchmann, B.; Furger, M.; Richard, A.; Mohr, C.; Weimer, S.; et al. Verifikation von PM10—Emissionsfaktoren des Strassenverkehrs, Forschungsauftrag ASTRA/BUWAL 2000/415(52/00); Federal Department for Environment, Transport, Energy and Communication: Bern, Switserland, 2002. [Google Scholar]
  70. German Informative Inventory Report (GIIR). 1.A.3.b vi-vii- Road Transport: Automobile Tyre and Brake Wear and Road Abrasion. Available online: http://iir-de.wikidot.com/1-a-3-b-vi-vii-emissions-from-wear-and-abrasion (accessed on 10 November 2015).
  71. Tesla Motors—Premium Electric Vehicles. Available online: http://www.teslamotors.com/ (accessed on 10 November 2015).
  72. Frischknecht, R.; Jungbluth, N.; Althaus, H.-J.; Doka, G.; Dones, R.; Heck, T.; Hellweg, S.; Hischier, R.; Nemecek, T.; Rebitzer, G. The ecoinvent database: Overview and methodological framework. Int. J. Life Cycle Assess. 2004, 10, 3–9. [Google Scholar] [CrossRef]
  73. Messagie, M.; Mertens, J.; Oliveira, L.; Rangaraju, S.; Sanfelix, J.; Coosemans, T.; van Mierlo, J.; Macharis, C. The hourly life cycle carbon footprint of electricity generation in Belgium, bringing a temporal resolution in life cycle assessment. Appl. Energy 2014, 134, 469–476. [Google Scholar] [CrossRef]
  74. Foley, A.; Tyther, B.; Calnan, P.; Ó Gallachóir, B. Impacts of Electric Vehicle charging under electricity market operations. Appl. Energy 2013, 101, 93–102. [Google Scholar] [CrossRef]
  75. Pike, B.Y.E. Calculating Electric Drive Vehicle Greenhouse Gas Emissions; International Council on Clean Transportaion: Washington, DC, USA, 2012. [Google Scholar]
  76. Rosenbaum, R.K.; Bachmann, T.M.; Gold, L.S.; Huijbregts, M.A.J.; Jolliet, O.; Juraske, R.; Koehler, A.; Larsen, H.F.; MacLeod, M.; Margni, M.; et al. USEtox—The UNEP-SETAC toxicity model: Recommended characterisation factors for human toxicity and freshwater ecotoxicity in life cycle impact assessment. Int. J. Life Cycle Assess. 2008, 13, 532–546. [Google Scholar] [CrossRef]
  77. Van Caneghem, J.; Block, C.; Vandecasteele, C. Assessment of the impact on human health of industrial emissions to air: Does the result depend on the applied method? J. Hazard. Mater. 2010, 184, 788–797. [Google Scholar] [CrossRef] [PubMed]
  78. Goedkoop, M.J.; Spriensma, R. Eco-Indicator 99, A Damage Oriented Method for Lifecycle Impact Assessment, Methodology Report; PRé Consultants: Amersfoort, The Netherlands, 1999. [Google Scholar]
  79. Goedkoop, M.; Heijungs, R.; Huijbregts, M.; de Schryver, A.; Struijs, J.; van Zelm, R. ReCiPe 2008—Characterization and Normalisation Factors. Available online: http://www.lcia-recipe.net/file-cabinet/ReCiPe111.xlsx (accessed on 27 January 2016).
  80. De Cauwer, C.; van Mierlo, J.; Coosemans, T. Energy consumption prediction for electric vehicles based on real-world data. Energies 2015, 8, 8573–8593. [Google Scholar] [CrossRef]
  81. Messagie, M.; Boureima, F.; Mertens, J.; Sanfelix, J.; Macharis, C.; Mierlo, J. The influence of allocation on the carbon footprint of electricity production from waste gas, a case study for Blast Furnace gas. Energies 2013, 6, 1217–1232. [Google Scholar] [CrossRef]
  82. Oliveira, L.; Messagie, M.; Rangaraju, S.; Sanfelix, J.; Rivas, M.H.; van Mierlo, J. Key issues of lithium-ion batteries from resource depletion to environmental performance indicators. J. Clean. Prod. 2015, 108, 354–362. [Google Scholar] [CrossRef]
  83. Rangaraju, S.; de Vroey, L.; Messagie, M.; Mertens, J.; van Mierlo, J. Impacts of electricity mix, charging profile, and driving behavior on the emissions performance of battery electric vehicles: A Belgian case study. Appl. Energy 2015, 148, 496–505. [Google Scholar] [CrossRef]
  84. Nordelöf, A.; Messagie, M.; Tillman, A.-M.; Ljunggren Söderman, M.; van Mierlo, J. Environmental impacts of hybrid, plug-in hybrid, and battery electric vehicles—What can we learn from life cycle assessment? Int. J. Life Cycle Assess. 2014, 19, 1866–1890. [Google Scholar] [CrossRef]
  85. Weiss, M.; Dekker, P.; Moro, A.; Scholz, H.; Patel, M.K. On the electrification of road transportation—A review of the environmental, economic, and social performance of electric two-wheelers. Transp. Res. Part D Transp. Environ. 2015, 41, 348–366. [Google Scholar] [CrossRef]
  86. Fishman, E.; Cherry, C. E-bikes in the Mainstream: Reviewing a decade of research. Transp. Rev. 2015, 1–20. [Google Scholar] [CrossRef]

